world bank documentdocuments.worldbank.org/curated/en/112841468774941871/pdf/multi0... · of...
TRANSCRIPT

'3447v
Human Resources Development and Operations Policy
HROWorking Papers
1
Poverty, Human Developmentand Growth:
An Emerging Consensus?
Harsha AturupanePaul GlewwePaul Isenman
August 1994
HROWP 36
Pub
lic D
iscl
osur
e A
utho
rized
Pub
lic D
iscl
osur
e A
utho
rized
Pub
lic D
iscl
osur
e A
utho
rized
Pub
lic D
iscl
osur
e A
utho
rized
Pub
lic D
iscl
osur
e A
utho
rized
Pub
lic D
iscl
osur
e A
utho
rized
Pub
lic D
iscl
osur
e A
utho
rized
Pub
lic D
iscl
osur
e A
utho
rized

Papers in this series are not formal publications of the World Bank. They present preliminary and unpolished results of analysisthat are circulated to encourage discussion and comment; citation and the use of such a paper should take account of itsprovisional character. The findings, interpretations, and conclusions expressed in this paper are entirely those of the author(s)and should not be attributed in any manner to the World Bank, to its affiliated organizations, or to members of its Board ofExecutive Directors or the countries they represent.

Poverty, Human Development and Growth:An Emerging Consensus?
byHarsha Aturupane
Paul GlewwePaul Isenman

The authors of the paper are Harsha Aturupane, University of Colombo and Trinity College,Cambridge; Paul Glewwe, World Bank; and Paul Isenman, World Bank. We would like tothank, without implicating, Martin Ravallion, Sadiq Ahmed, and Paul Streeten. Views expressedhere are not necessarily those of the World Bank.

Abstract
This paper considers several issues relevant to the debate on the extent to which poverty,or development progress in general, should be measured by income or by a broader set ofobjectives. (See Robert Sugden's review (1993) of Amartya Sen's Inequality Revisited (1992)for a comparison of the two approaches.) Issues covered here are: practical implications of thetwo approaches for poverty reduction efforts; the impact of growth on basic social indicators;and how national achievement on social indicators is best measured. Sri Lanka and Pakistan,countries often cited in this debate, are used as examples.
)

I~~~~~~~~~~~~~~~~~~~~~~~~~~~~~~~~~~~~~~~~~~~~~~~~~~~~4

Contents
I. Extent of Consensus in Practice ................................. 1
II. The Debate on Living Standards and Economic Growth .................. 2
HI. Another Look at Cross-Country Data ................ 3
IV. Sri Lanka and Pakistan ....................... 6
V. The Empirical Evaluation of Improvements in Living Standards ............. 9
References ................................................ 17

g

I. Extent of Consensus in Practice
The World Bank (WB) is widely considered as an example of the welfarist perspectiveof mainstrearn economics, in which well-being depends primarily on income. Sudhir Anand andMartin Ravallion (1993) cite the heavy emphasis that the WB's World Development Reports(WDRs) on poverty give to raising incomes -as an objective rather than as a means. They citethe Human Development Reports (HDRs), to which Amartya Sen has contributed, as an at leastpartial application of the human development approach. Paul Streeten (1994), anothercontributor to the HDRs, makes essentially the samne comparison in his contrasting of "humanresource developers" and "hurnanitarians."
Turn now to a comparison of recent WDRs and HDRs as they relate to these twoapproaches. Overall, there is a broad consensus between the WDRs and HDRs that reductionin poverty, in its income and (other) human-development manifestations, is the over-archingobjective of development. There is also consensus that achieving this objective requires progresson broad-based growth, basic social services, and social safety nets. Regarding growth, thereis agreement that it is best achieved in a market economy (WDR 1991, ch. 2; HDR 1992,overview). Both see an important role for the State to ensure political stability, provide adequateinfrastructure, address externalities and inforrnational imperfections, maintain a regulatoryframework, promote competition and assist human resource development (WDR 1991, ch. 7;HDR 1993, Ch. 3).
The WDRs and HDRs both promote interventions that directly raise the living standardsof the poor. They agree, for example, on the importance of basic social services and safetynets, of rights and interests of disadvantaged groups (such as women, children and tribalgroups), and of NGOs and public participation. While they agree that these interventions areimportant both as ends and means of development, the WDRs emphasize them more as meansand the HDRs more as ends.
Consistent with their broader set of objectives, the HDRs cast their nets more widely andcover issues such as human rights. And consistent with the WB's greater stress on incomes, theWDRs emphasize more the tough choices on macro and sectoral policy issues needed to achievehigher incomes and better social indicators. Also, the two differ on whether adjustmentprograms supported by the WB pay sufficient attention to direct interventions, or to poverty-reduction in general.
Overall, the WDRs emphasize the income aspects of poverty reduction more, as meansand ends, while the HDRs emphasize non-income aspects more. Nonetheless, these aredifferences of emphasis, not of substance. The substantial agreement increases the closer onegets to field operations, where most of the resources of the WB and of UNDP are concentrated.As an indication of converging views, WB annual social sector lending rose from $0.7 billion(5 percent) to $3 billion (15 percent) of total lending over the past decade, much of it incollaboration with UN development agencies.

2
What does this general agreement suggest for the difference between the two approaches?To the extent that the WB is firmly in the incomes camp, then it seems that the two approacheslead to similar results on the ground, in terms of both questions asked and policy implications.It is easy to overestimate the extent of emphasis the WE puts on income, though. It is true thatin the vocabulary of the WB, the words "resource" and "investment" figure frequently indiscussion of the social sectors. However, the WB has a strong interest in human developmentobjectives. This is indicated, for example, in the WDR on health (1993), in the title of the firstWDR on poverty: Poverty and Human Development (1980), and in the Pakistan example citedbelow. More broadly, how many economists working on development are not, in Streeten'swords, partly "humanitarians" and partly "human resource developers?" This is not to minimizethe analytic importance of the distinction, or the differences in emphasis between individuals orinstitutions. But at a minimum it reduces the risks that questions that go beyond incomes willbe neglected, and it greatly increases the opportunities for collaboration and for furthernarrowing of differences.
H. The Debate on Living Standards and Economic Growth
The differences between the WDR and HDR approaches reflect in part the long-standingdebate on the relationship between income and social indicators. Cross-country data haveconsistently shown strong, but not perfect, correlations between them. One early view ofdevelopment was that high incomes were necessary and sufficient for poor countries to raisesocial indicators. Paul Streeten (1979) and others challenged this view. Paul Isenrnan (1980)and Sen (1981) argued that Sri Lanka, although poor, had an enviable record on socialindicators, in part due to high and effective social spending.
Surjit Bhalla and Paul Glewwe (B&G, 1986) disputed these claims, arguing that althoughSri Lanka's social indicator levels were high relative to income, we should judge performancein social indicators by changes rather than levels, just as we judge income performance)byfocusing on growth rates. They claimed that Sri Lanka's social indicator improvementsjfrom1960 to 1978, when social spending was quite high, were unexceptional, questioning the linkbetween social spending and social indicator performance. They argued that Sri Lanka's socialspending was "excessive," i.e., at levels which reduce growth to the point of retarding progresson social indicators. B&G's regression results, and conclusions, remain controversial. Isenmanand others argued that while changes in Sri Lanka's social indicators have been unexceptionalsince 1960, it maintained its lead position, itself a good performance. Sen added that SriLanka's social spending declined before 1978, weakening B&G's argunent. Overall, the debateremained inconclusive. Perhaps B&G's main contribution was focusing attention away fromlevels to changes in social indicators.
More generally, single-equation cross-country models are notoriously poor at detectingcausality. Problems include poor data quality (lack of comparability, inaccuracy, non-random

3
samples) and inadequate econometric specification (regressor endogeneity, omitted variable bias).Household survey data are essential for assessing the effects of income and social programs onsocial indicators; more data and more analysis based on it are urgently needed.
Now consider three recent studies. Using Sri Lankan time series data, Sudhir Anand andRavi Kanbur (1991) found that infant mortality rates were negatively correlated with both socialspending and income growth, and that social spending had a stronger impact. These findingsare plausible. For example, child vaccination campaigns can reduce infant mortality much morequickly than can income growth, and at a low cost. Still, the impact of health spending may beoverstated due to omitted variables, including lagged effects of prior health spending andmothers' education.
Anand and Ravallion (1993) present further evidence that both social spending andgrowth matter for social indicators, with growth mattering because it leads to reducing povertyand financing the provision of basic social services. Still, as they themselves note, the usualcaveats on causality (particularly regressor endogeneity) apply; and their sample covers only 22countries. Finally, Nanak Kakwani (1993) presents axioms that should be satisfied by measuresof improvement in social indicators. He also argues that Sri Lanka's 1970-1990 performancewas good, despite reduced spending for social programs (more specifically for food subsidies)from 1978 on. Overall, these articles add substantial evidence to the view that growth, whileimportant, is far from the only explanation for improvement in- social indicators.
III. Another Look at Cross-Country Data
Whether as "human resource developer," "humanitarian," or both, one should beinterested in finding good measures of achievement in social indicators. As implied in thediscussion of B&G (1986) above, we think that the best measure of achievement is progress --change over time. Ideally, such change should be measured over a wide range of detailed socialindicators, as is the case now for changes in economic indicators but only for levels of scialindicators. At the same time there is an understandable desire to simplify, particularly in orderto compare achievements across countries. Thus, the Human Development Indicator (HDI) iscomposed of four indicators: life expectancy, literacy, years of schooling, and relative income.
We recommend a basic set of, say, three indicators, which cover the same general groundas the HDI (and for the same reasons): change in infant mortality (or alternatively change inunder-5 mortality), change in net (or gross) primary enrollment, and change in per capitaincome. Note that to focus on changes we use measures of flows, available annually in manycountries, rather than the measures of stocks used in the HDI. In fact, annual data on lifeexpectancy and literacy are almost always interpolations, with actual data collected only aboutevery ten years.
4
We hope that the WB and UNDP will agree and will include changes in social indicatorsfor at least one or two time periods in the statistical appendices to the WDRs and HDRs, andto discuss their implications, as appropriate, in the text. For reasons noted by T. N. Srinivasan(1994) and others, we think it is analytically preferable and operationally more useful to keepthese three indicators separate. However, for those who prefer a single composite index, thesame advice applies. (Srinivasan (1994) and Sugden (1993) note the practical difficulties ofinter-personal comparisons of Sen's "capabilities" and "functionings." Yet Sen's participationin work on the HDI indicates that he finds even short-cut answers to what he sees as the rightquestions worthwhile.) We also agree with Srinivasan that great care is needed on data qualityand that it is preferable to drop countries for which the underlying data are unreliable.
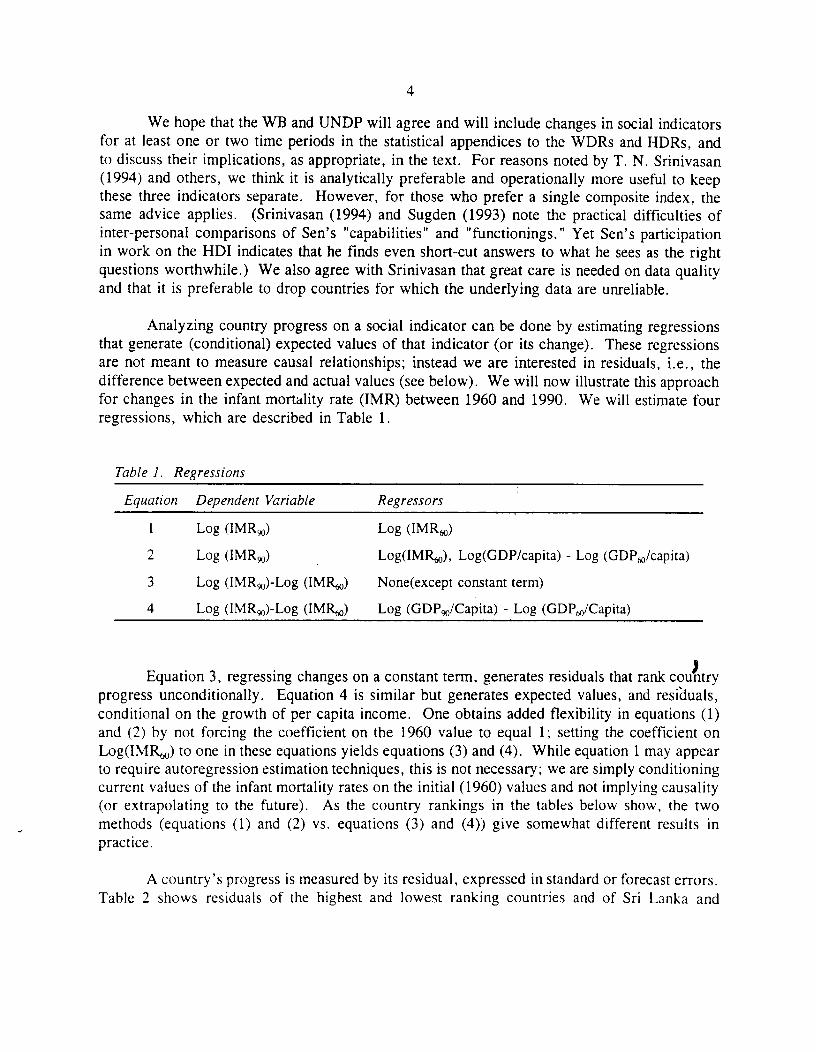
Analyzing country progress on a social indicator can be done by estimating regressionsthat generate (conditional) expected values of that indicator (or its change). These regressionsare not meant to measure causal relationships; instead we are interested in residuals, i.e., thedifference between expected and actual values (see below). We will now illustrate this approachfor changes in the infant mortality rate (IMR) between 1960 and 1990. We will estimate fourregressions, which are described in Table 1.
Table 1. Regressions
Equation Dependent Variable Regressors
I Log (IMR90) Log (IMR60)
2 Log (IMR9.) Log(IMR60), Log(GDP/capita) - Log (GDP6,/capita)
3 Log (IMR90)-Log (IMRk) None(except constant term)
4 Log (IMR90)-Log (IMR,0) Log (GDP,/Capita) - Log (GDP,,/Capita)
Equation 3, regressing changes on a constant term, generates residuals that rank countryprogress unconditionally. Equation 4 is similar but generates expected values, and residiuals,conditional on the growth of per capita income. One obtains added flexibility in equations (1)and (2) by not forcing the coefficient on the 1960 value to equal 1; setting the coefficient onLog(IMRb,,) to one in these equations yields equations (3) and (4). While equation 1 may appearto require autoregression estimation techniques, this is not necessary; we are simply conditioningcurrent values of the infant mortality rates on the initial (1960) values and not implying causality(or extrapolating to the future). As the country rankings in the tables below show, the twomethods (equations (1) and (2) vs. equations (3) and (4)) give somewhat different results inpractice.
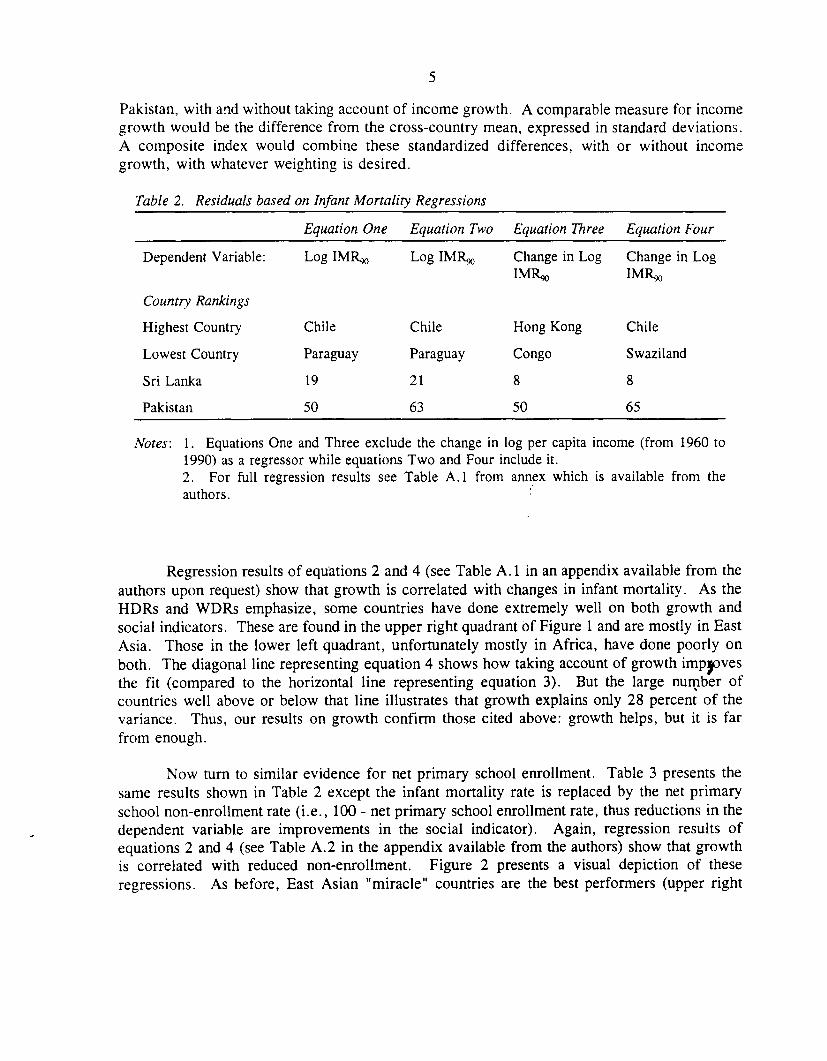
A country's progress is measured by its residual, expressed in standard or forecast errors.Table 2 shows residuals of the highest and lowest ranking countries and of Sri Lanka and
5
Pakistan, with and without taking account of income growth. A comparable measure for incomegrowth would be the difference from the cross-country mean, expressed in standard deviations.A composite index would combine these standardized differences, with or without incomegrowth, with whatever weighting is desired.
Table 2. Residuals based on Infant Mortality Regressions
Equation One Equation Two Equation Three Equation Four
Dependent Variable: Log IMRk Log IMRo Change in Log Change in LogIMR90 IMR90
Country Rankings
Highest Country Chile Chile Hong Kong Chile
Lowest Country Paraguay Paraguay Congo Swaziland
Sri Lanka 19 21 8 8
Pakistan 50 63 50 65
Notes: 1. Equations One and Three exclude the change in log per capita income (from 1960 to1990) as a regressor while equations Two and Four include it.2. For full regression results see Table A.1 from annex which is available from theauthors.
Regression results of equations 2 and 4 (see Table A. 1 in an appendix available from theauthors upon request) show that growth is correlated with changes in infant mortality. As theHDRs and WDRs emphasize, some countries have done extremely well on both growth andsocial indicators. These are found in the upper right quadrant of Figure 1 and are mostly in EastAsia. Those in the lower left quadrant, unfortunately mostly in Africa, have done poorly onboth. The diagonal line representing equation 4 shows how taking account of growth impsovesthe fit (compared to the horizontal line representing equation 3). But the large number ofcountries well above or below that line illustrates that growth explains only 28 percent of thevariance. Thus, our results on growth confirm those cited above: growth helps, but it is farfrom enough.
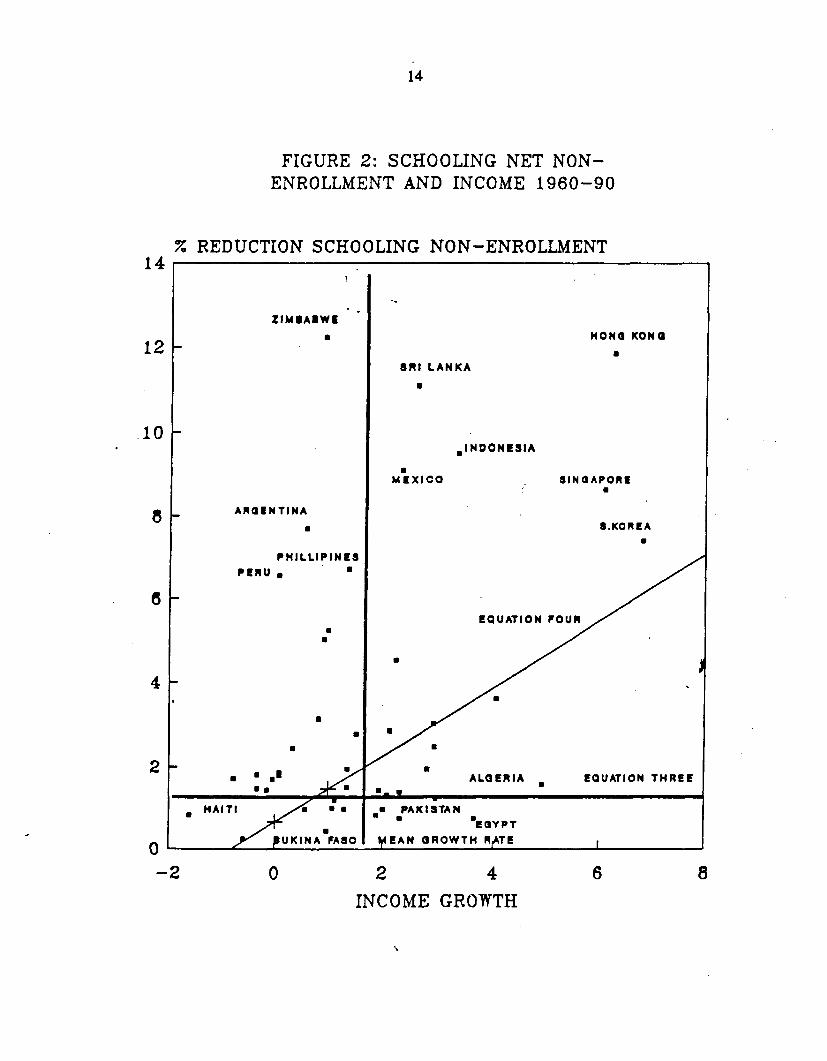
Now turn to similar evidence for net primary school enrollment. Table 3 presents thesame results shown in Table 2 except the infant mortality rate is replaced by the net primaryschool non-enrollment rate (i.e., 100 - net primary school enrollment rate, thus reductions in thedependent variable are improvements in the social indicator). Again, regression results ofequations 2 and 4 (see Table A.2 in the appendix available from the authors) show that growthis correlated with reduced non-enrollment. Figure 2 presents a visual depiction of theseregressions. As before, East Asian "miracle" countries are the best performers (upper right

6
quadrant). Also, growth explains only 14 percent of the variations in reductions in non-enrollment (equation 4 has an adjusted R2 of 0. 14).
Table 3. Regression Residuals Based on Net Primary School Non-Enrollment Rate Regressions
Equation One Equation Two Equation Three Equation Four
Dependent Log School Non Log School Change in Log Change in LogVariable: Enrollmentgy Non School Non School Non
Enrollment,o Enrollmentso 60 Enrollmentso 60
Country Rankings
Highest Country Zimbabwe Zimbabwe Zimbabwe Zimbabwe
Lowest Country El Salvador Egypt Haiti Egypt
Sri Lanka 8 6 2 3
Pakistan 35 32 32 41
Notes: 1. Equations One and Three exclude the change in log per capita income (from 1960 to1990) as a regressor while equations Two and Four include it.2. For full regression results see Table A.2 from annex which is available from theauthors.
It may also be useful to visually display the regressions in equations 1 and 3 by plottingthe value of the social indicator in 1960 against its value in 1990. This is shown in Figure 3 forinfant mortality rates and Figure 4 for net primary school non-enrollment. Mathematically,equation 1 will fit better since it is defined as the line that reduces the sum of squares when the1990 value is regressed on the 1960 value. Equation 3 is from a different regression, but it canbe "fitted" in these diagrams by adding the (log) 1960 value of the social indicator to both sAdesof the equation. It appears that the fit is not as good as equation 1, which reflects that equiation3 is not specified to fit the data points as they are displayed in these two Figures.
IV. Sri Lanka and Pakistan
Sri Lanka and Pakistan have grown fairly rapidly (2.6 percent and 2.9 percent, percapita, respectively, from 1960 to 1990). Both need to sustain and strengthen their ongoingpolicy reform programs to make future growth faster and more robust. As shown in Table 4,they are very different on levels and changes in social indicators. Note that using changes rather

7
than levels would make a bigger difference if we used a shorter time period (this is evident inTables A.5 and A.6, in the appendix available from the authors).
Table 4. Social Indicators for Sri Lanka and Pakistan
SRI LANKA PAKISTAN
Level Res. Rank' Level Res. Rank'
Countries 1960 1990 1990 1990-60 1960 1990 1990 1990-60
Int. Mort. Rate 71 69 19 1 19 161 99 49 50
Net Prim. Enr.% 43 66 99 1 8 22 46 33 35
Pop Growth% 71 2.7 1.4 -_ - 2.1 3.1 -
Res. rank is the rank of the residual from running a regression of Equation 1, or from its equivalent for primaryenrollment.Sources: Tables A. 1 and A.2 (Equation 1) and Tables A.3 and A.4 from the appendix available from the authors.
Clearly, Sri Lanka has an admirable record on changes and an extraordinary record onlevels in infant mortality, primary education and population growth. The link between well-designed public programs and social outcomes is well-established for both education and health;the same link would apply for family planning, provided mostly through the health program.(To show the link between education programs and health outcomes, primary enrollment wasentered into the level IMR regressions. Its coefficient is significant in the expected direction,and reduces Sri Lanka's and Pakistan's residuals. See Table A.7 in the appendix available fromthe authors).
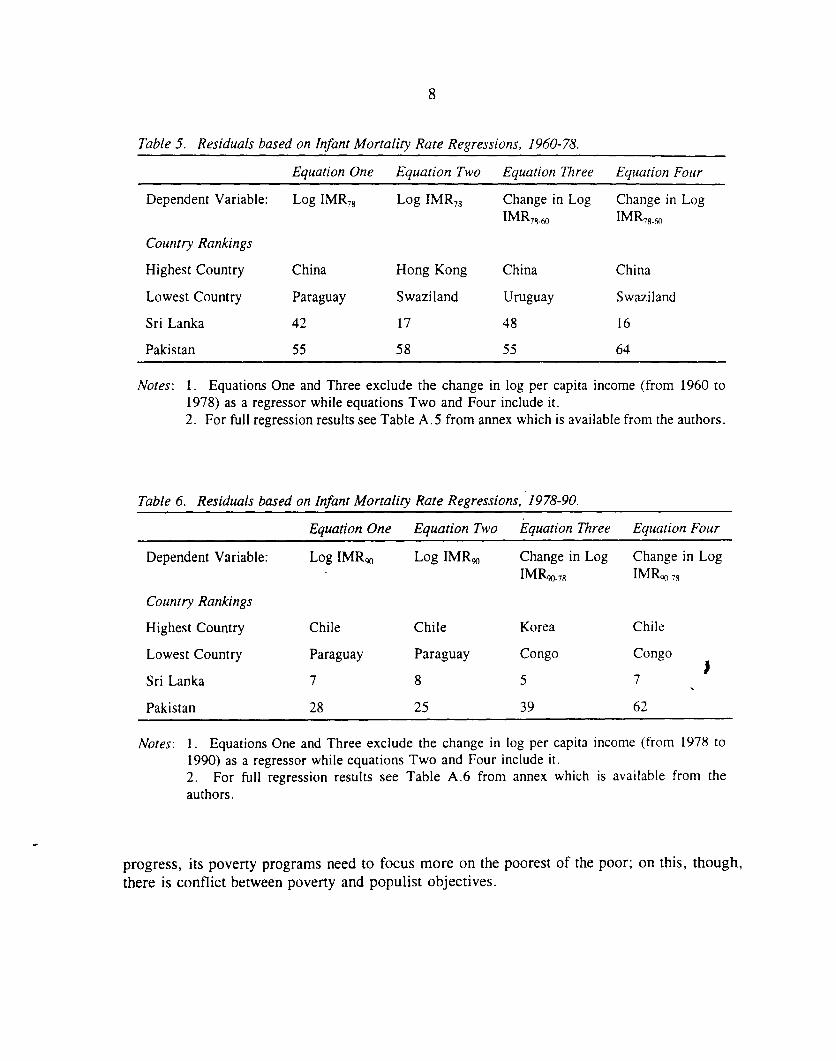
Some have claimed that Sri Lanka's adjustment program, which has been in effect on andoff since 1977, has made the poor worse off in spite of better growth. But estimates for 1960-1978 and 1978-90 show strong progress on infant mortality and primary enrollment in the latterperiod, as seen in the residuals on Sri Lanka in Tables 5 and 6. For example, Sri Lanka's rankon change in infant mortality was 42 out of 71 for 1960-78 and 7 out of 71 for 1978-90 (seeequation one in Tables 5 and 6). This is not surprising, since per-capita growth and per-capitaexpenditures on education and health increased. Also, the granting of citizenship, and thus thepower of the ballot, to the "Indian Tamil" plantation workers helped redress their past lack ofaccess to primary education: this had been identified as a major deficiency in Isenman (1980).
Still, both those interested more in faster and more robust growth and those interestedmore in human development objectives would probably agree that Sri Lanka has much to beconcerned about. The ethnic strife since 1983 has caused thousands of deaths and produced over600,000 refugees, as well as reducing income growth. There is evidence of stustantial remainingmalnutrition. There is also evidence of deteriorating educational quality. Given the good overall
8
Table 5. Residuals based on Infant Mortality Rate Regressions, 1960-78.
Equation One Equation Two Equation Three Equation Four
Dependent Variable: Log IMR78 Log IMR78 Change in Log Change in Log
IMR 7 8-60 IMR 78-60
Country Rankings
Highest Country China Hong Kong China China
Lowest Country Paraguay Swaziland Uruguay Swaziland
Sri Lanka 42 17 48 16
Pakistan 55 58 55 64
Notes: 1. Equations One and Three exclude the change in log per capita income (from 1960 to1978) as a regressor while equations Two and Four include it.2. For full regression results see Table A.5 from annex which is available from the authors.
Table 6. Residuals based on Infant Mortality Rate Regressions, 1978-90.
Equation One Equation Two Equation Three Equation Four
Dependent Variable: Log IMR90 Log IMR90 Change in Log Change in LogIMR90-78 IMR 3-78
Country Rankings
Highest Country Chile Chile Korea Chile
Lowest Country Paraguay Paraguay Congo Congo
Sri Lanka 7 8 5 7
Pakistan 28 25 39 62
Notes: 1. Equations One and Three exclude the change in log per capita income (from 1978 to1990) as a regressor while equations Two and Four include it.2. For full regression results see Table A.6 from annex which is available from theauthors.
progress, its poverty programs need to focus more on the poorest of the poor; on this, though,there is conflict between poverty and populist objectives.

9
What Sri Lanka needs most for poverty reduction, human development and growth, ispeace. We see in many other countries around the world the horrendous effect that ethnic strife- a subject still given insufficient attention by development thinkers - has on incomes and onsocial indicators. The Sri Lanka case illustrates sharply Sen's point that even good growth andgood progress in conventional social indicators are not sufficient measures of developmentprogress.
Pakistan's social indicators are by any standard poor, especially taking into account itsrelatively rapid income growth. Its primary enrollment would be substantially worse if we usedWDR/HDR numbers; instead we have used latest sample survey data. This difference in netenrollment figures illustrates the (world-wide) need for better data, particularly from householdsurveys.
Fortunately, Pakistan's weak record on social indicators is now widely recognized, againboth by those concerned primarily about growth -- especially about the need to upgrade humanresources to compete internationally in manufacturing and agriculture -- and those concernedprimarily about human development objectives. Both the government and leading oppositioncoalition strongly support the "Social Action Program, " an effort to accelerate progress on basiceducation, health, family planning and rural water supply. This is the WB's top priority inPakistan. While this program would undoubtedly have positive effects on income, its centrality,for the WB as well as for the government, comes from its effect on broader (human)development objectives. The UNDP's excellent Human Development Report for Pakistan alsogave highest priority to basic social services. There is wide agreement that this program, whileno panacea for Pakistan's poverty problems, will be vital -- as a means and an end -- to itsoverall success in development.
In conclusion, the general agreement between WDRs and HDRs indicates in part thatdifferences of emphasis on objectives still lead to similar operational conclusions and in part thatthe WDRs (and the WB) agree strongly on the importance of non-income objectives --particularly those measured by basic social indicators. Regression results reported here confirmresults of recent articles showing that income growth, while important, is not the pripiarydeterminant of improvement in social indicators. We recommend that changes rather than levelsof social indicators should be emphasized and have illustrated how these changes should bemeasured.
V. The Empirical Evaluation of Improvements in Living Standards
In this section we discuss ways in which the progress of a country in improving livingstandards can be assessed empirically, in relation to the performnance of countries world-wide.The objective is to provide a method that can be easily understood by policy makers and

10
administrative officers who have a general acquaintance with economics, rather than one whichis rigorous by the standards of the academic economics profession.
The first step in the method we propose is to examine the evidence, for the period underexamination, graphically, using the values of the social indicators of countries at the starting andend dates. For instance, in our study, the starting date is 1960, and the end date, 1990. Thevalues of the social indicator for the beginning date, 1960, are plotted on the horizontal axis,and the values of the social indicator for 1990 are plotted on the vertical axis, as in Figure 3 andFigure 4. Next, a curve is fitted, using least squares regression, relating the generalperformance of the set of countries between the two years. This is equation one in Tables 2 and3 (the full results of which are in Tables A. 1 and A.2 in the appendix available from theauthors) and the line drawn as equation one in Figure 3 and Figure 4. The double logarithmicfunctional form was chosen by us as the preferred equation because it provided the best fit. Inprinciple, the researcher should use the functional form that provides the best possible fit, so thatan alternative form, such as an inverse model as in Bhalla-Glewwe (1986), or a quadratic modelas in Isenman (1987) may provide a closer fit for another set of data. It is important that thisequation, which sees the 1990 (end date) values of the social indicator regressed on a constantand the 1960 (initial date) values of the indicator, be viewed not an a proper regression equation,but merely as a fitting device that brings out the correlation between the two sets of years moreclearly. The argument underlying this equation can be set out as follows.
The 1960 (initial) values of the social indicator represent a particular economic and socialinstitutional structure, both at the country level and world-wide. Thus, the 1960 infant mortalityrate for a country is the outcome of many institutional and economic of features of that country,like the network of hospitals and medical clinics, the incomes of households, and the educationlevels of the population, especially mothers. The 1960 infant mortality rates for the entiresample of countries represent the outcomes of the institutional and economic features of thewhole group. Countries which have better than average infant mortality rates in 1960 are thosein which at least some of these institutional and economic features are superior to the averageendowments in the sample. The converse holds for countries with worse than average i lantmortality rates.
Next, consider the 1990 values of infant mortality rates. These represent the economicand institutional structure of the later year. The curve fitted in equation one relates the meanlevel of achievement in 1990 to the mean level of achievement in 1960. Countries whose infantmortality rates reveal better than average improvements, in that their absolute values lie abovethe regression line, are countries which recorded above average improvements in theirinstitutional and economic structures with regard to infant mortality. Once again, the converseapplied to countries with less than average improvements. Thus, the countries that lie aboveequation one in Figure 3 and Figure 4 have performed better than average during 1960-90 inimproving infant mortality and schooling enrollments, while countries that lie below equationone have performed worse.

I1
The second step in our method is to control for the change in income during the studyperiod. This is achieved by including the change in income as an additional right hand sidevariable on the fitting equation, as in equation 2 in Tables 2 and 3 (again, full results are in theappendix available from the authors). This equation can be used to examine whether a givencountry has a better than average or worse than average correlation between the initial and endvalues of the social indicator, conditional on the extent to which its income expanded. Such animproved or worsened correlation would indicate whether a country has been registering betterthan average or worse than average improvements in the non-income dimensions that affect thesocial indicator. Unfortunately, the introduction of income into the equation adds a thirdvariable into the analysis, so that the relationships cannot be plotted on a graph.
The third step in the method is to take the change in the social indicator between thebeginning and end dates, say 1960 and 1990, and regress it, using least squares, upon a constant.This centers the data on its mean value and ranks it. Countries whose absolute values arehighest represent the best performers and countries whose absolute values are lowest representthe worst performers for the period. Equations one and three can be algebraically related, bysetting the constant term in equation one to the mean of the sample, which equals the constantterm in equation three, and setting the slope term in equation one to unity. This equation isplotted as equation three in Figure 3 and Figure 4. Visually, it is evident that it does -not trackthe data as well as the curve of equation 1, so that equation three provides a poorer fit. Thisis to be expected, since interpreting equation three as a restricted version of equation one imnpliesthat it will have an inferior fit. Thus, equation three provides a less sophisticated ranking ofcountry performances over time than equation one. However, it serves as a useful buildingblock to the next stage in our method.
The fourth step is to regress the change in the social indicator on a constant and thechange in income during the period. This is equation four in Tables 2 and 3 (full results ofwhich are in the appendix available from the authors), and is the only equation in our methodwvhich, strictly speaking, can be interpreted as a regression equation (though not one free ofestimation problems, as explained in Section II). The significant coefficients of income in theinfant mortality and school enrollment equations show that improvements in social indicato#s aresignificantly influenced by income growth. Positive absolute deviations from the regression linerepresent countries which have recorded improvements in social indicators which are better thantheir income performances alone would predict, and negative absolute deviations from theregression line represent countries which have recorded worse social indicator performances thancan be attributed to their income growth during the period.
In Figure 1 and Figure 2, we plot the rates of improvement of the social indicator againstthe growth rates of the countries during the period. Into the diagram are drawn the averagegrowth rate of the countries and the average rate of improvement of the social indicator orequation three. These then divide the sample into four categories of performance. Countriesin the upper right hand square are those which have performed well on both income and socialindicators. Countries in the lower left hand square are those which have done badly on both

12
income and social indicators. Countries in the lower right hand square have done well onincome growth, but badly on social indicators, while the countries on the upper left hand squarehave done poorly on income growth but performed well on social indicators. Finally, equationfour is plotted on the diagram. The direction and extent to which a country deviates from theregression line shows whether it has done well or badly on the relevant social given its incomeperformance.
9

13
FIGURE 1: CHANGES IN IMR AND GROWTH1960-90
%REDUCTION IN INFANT MORTALITY7
HONG KONGCHILE*
6S.KOREA
uCOSTA RICA WSINGAPOR
5 *M ALAYSIA
EQUATION IOUJAMAIJCA
* _ - S~~ ~ ~~RI LANKA
* S ~~~~~~~OTSY N Aa~~~~~~~~~~~~~~~~~
PERU,U
3 NICARAauxUA*a * / , < EQUATION THREE
2 a
* PAK I STAN
SOMALIN ETHIOPIA a a SUAZILANDRIVANBA ip PA RAO UAY
MALI A CONGO
MEAN GROWTH RATE
O I I
-2 0 2 4 6 8INCOME GROWTH 1960-90
14
FIGURE 2: SCHOOLING NET NON-ENROLLMENT AND INCOME 1960-90
% REDUCTION SCHOOLING NON-ENROLLMENT14
ZIMSANWE12 _ . HONG KONG
12SRI LANKA
.10IINDONESIA
MEXICO SINGAPORE
=_ AARGENTINA
g _ S.KOREA
P HILLIP IN ESPERU 6
EQUATION FO
4
2 . X ALGERIA EQUATION THREE
MHAITI aIPAXISTAN'EGYPT
O g pUKINA PAsO 4EAN GROWTH RfATE
-2 0 2 4 6 8
INCOME GROWTH

15
FIGURE 3: INFANT MORTALITY RATES1960-90
INFANT MORTALITY RATES 19905.5
5 U
4.5
4 PARAGU AY
3.5 ARGENTI NA
EQUATION THREE//
TRINIDAD,
3 _ R ANKA/ URUGUAY / * CHILE
9 g / " ~~~~CO3TA R ICA *
2.5 - / S.KOREA
/QATION ONE
_2L SINGAPORE
HONG KCNG
1.5' 1 3.5 4 4.5 5 5.5
INFANT MORTALITY RATES 1960

16
FIGURE 4: NET PRIMARY SCHOOLINGNON-ENROLLMENT 1960-90
NET NON-ENROLLMENT 19905
BUKINA FASO
4 * U
PAKISTAN a X /
* U/
3THAILAND
VENEZUELA
2EQUATION T R
MALAYSI/
/ / ~~EQUATION ONE
1INDONESIA MEXICO
a a
SRI LANKA SINGAPORE S.KOREA HONG KONG
0
2 3 4 5
NET NON-ENROLLMIENT 1960

References
Anand, Sudhir and S. M. Ravi Kanbur. 1991. "Public Policy and Basic Needs Provision:Intervention and Achievement in Sri Lanka. " In Jean Dreze and Amartya Sen, eds., ThePolitical Economy of Hunger, Vol. 3. Oxford: Clarendon.
Anand, Sudhir and Martin Ravallion. 1993. "Human Development in Poor Countries: On theRole of Private Incomes and Public Services." Journal of Economic Perspectives7(1): 113-50.
I
Bhalla, Surjit, S. and Paul Glewwe. 1986. "Growth and Equity in lIeveloping Countries: AReinterpretation of the Sri Lankan Experience." World Bank Economic Review 1(1)-35-63.
Isenman, Paul. 1980. "Basic Needs: The Case of Sri Lanka." World Development 8(3):237-58.
Kakwani, Nanak. 1993. "Performance in Living Standards: An International Comparison."Journal of Development Economics 41(2):307-36.
Sen, Amartya. 1981. "Public Action and the Quality of Life in Developing Countries."Oxford Bulletin of Economics and Statistics 43(4):287 319.
_. 1992. Inequality Reconsidered. New York: Russell Sage Foundation; Cambridge, MA:Harvard University Press.
Srinivasan, T. N. 1994. "Human Development: A New Paradigm or Reinvention of theWheel?" American Economic Review (Papers and Proceedings) 84(2):238-43.
Streeten, Paul. 1979. "From Growth to Basic Needs." Finance and Development 16(3):2p-31.
1994. "Human Development: Means and Ends." American Economic Review iPapersand Proceedings) 84(2):232-37.
Sugden, Robert. 1993. "Welfare, Resources and Capabilities: A Review of Inequality Re-examined by Amartya Sen." Journal of Economic Literature 31(4):1947-62.
United Nations Development Programme. various. Human Development Report. Oxford:Oxford University Press.
World Bank. various. World Development Report. Oxford: Oxford University Press.

I

Human Resources Development and Operations Policy Working Paper Series
Contact forTitle Author Date paper
HROWP6 Global Indicators of Rae Galloway June 1993 0. NadoraNutritional Risk (II) 35558
HROWP7 Making Nutrition Donald A.P. Bundy July 1993 0. NadoraImprovements at Low Cost Joy Miller Del Rosso 35558Through Parasite Control
HROWP8 Municipal and Private Sector Donald R. Winkler August 1993 E. De CastroResponse to Decentralization Taryn Rounds 89121and School Choice: The Caseof Chile, 1981-1990
HROWP9 Poverty and Structural Ishrat Husain September 1993 M. YoussefAdjustment: The African Case 34614
HROWP10 Protecting Poor Jamaicans Margaret E. Grosh September 1 993 M.E. Quinterofrom Currency Devaluation Judy L. Baker 37792
M. Rodriguez30407
HROWP1 1 Operational Education George Psacharopoulos September 1 993 L. MalcaIndicators 37720
HROWP1 2 The Relationship Between the John Clark October 1 993 P. PhillipState and the Voluntary 31 779Sector
HROWP1 3 Obstacles to Women's Joseph Kutzin ' October 1 993 0. ShoffnerAccess: Issues and Options 37023for More EffectiveInterventions to lmprQveWomen's Health
HROWP14 Labor Markets and Market- Arvil V. Adams October 1993 S. KhanOriented Reforms in Socialist 33651Economies
HROWP1 5 Reproductive Tract Infections, May T.H. Post October 1993 0. ShoffnerHIV/AIDS and Women's 37023Health
HROWP1 6 Job Security and Labor Ricardo D. Paredes November 1 993 S. KhanMarket Adjustment in 33651Developing Countries
HROWP1 7 The Effects of Wage Luis A. Riveros November 1 993 S. KhanIndexation on Adjustment, 33651Inflation and Equity
HROWP1 8 Popular Participation in Philip R. Gerson December 1 993 L. MalcaEconomic Theory and Practice 37720
HROWP1 9 Economic Returns from Edwin Mansfield January 1 994 I. DioneInvestments in Research and 31447Training
HROWP20 Participation, Markets and Deepak Lal January 1994 L. MalcaDemocracy 37720

Human Resources Development and Operations Policy Working Paper Series
Contact forTitle Author Date paper
HROWP21 Safe Motherhood in Patricia Daly January 1994 0. ShoffnerFrancophone Africa Michael Azefor 37023
Boniface Nasah
HROWP22 Indigenous People and George Psacharopoulos February 1 994 I. ConachyPoverty in Latin America Harry Anthony Patrinos 33669
HROWP23 Is Grameen Bank Sustainable? Shahid Khandker February 1994 S. DavidBaqui Khalily 33752Zahed Khan
HROWP24 Concepts of Educational Marlaine E. Lockheed March 1994 M. VerbeeckEfficiency and Effectiveness Eric Hanushek 34821
HROWP25 Scientific Research for Erik W. Thulstrup March 1994 L. MalcaDevelopment 37720
HROWP26 Issues in Education Finance Stephen P. Heyneman April 1994 B. Cassorlaand Management in ECA and 37172OECD Countries
HROWP27 Vocational Education and Julian Schweitzer April 1994 A. GonzalezTraining: The Role of the 37799Public Sector in a MarketEconomy
HROWP28 Social Security Issues and Nguyen X. Nguyen May 1994 M. EspinosaElements of Reform 37599
HROWP29 Health Problems and Policies Mary Eming Young May 1 994 0. Shoffnerfor Older Women: An 37023Emerging Issue in DevelopingCountries
HROWP30 Language and Education in S.M. Cummings May 1994 M. EspinosaLatin America: An Overview Stella Tamayo 37599
HROWP31 Does Participation Cost the Jesko Hentschel June 1994 D. JenkinsWorld Bank More? Emerging 37890Evidence
HROWP32 Research as an Input into Harold Alderman June 1994 P. CookNutrition Policy Formation 33902
HROWP33 The Role of the Public and Deepak Lal June 1994 M. EspinosaPrivate Sectors in Health 37599Financing
HROWP34 Social Funds: Guidelines for Soniya Carvalho July 1994 K. LabrieDesign and Implementation 31001
HROWP35 Pharmaceutical Policies: Graham Dukes July 1994 0. ShoffnerRationale and Design Denis Broun 37023
HROWP36 Poverty, Human Development Harsha Aturupane August 1994 P. Cookand Growth: An Emerging Paul Glewwe 30864Consensus? Paul Isenman