world bank documentdocuments.worldbank.org/curated/en/579061468915012649/pdf/multi0... · report...
TRANSCRIPT

Document of
The World Bank
FOR OFFICIAL USE ONLY
Report No. 3760
PROJECT PERFORMANCE AUDIT REPORT
INDIA--NANGAL FERTILIZER EXPANSION PROJECT(CREDIT 357-IN)
December 31, 1981
Operations Evaluation Department
This document has a restricted distribution and may be used by recipients only in the performance oftheir official duties. Its contents may not otherwise be disclosed without World Bank authorization.
Pub
lic D
iscl
osur
e A
utho
rized
Pub
lic D
iscl
osur
e A
utho
rized
Pub
lic D
iscl
osur
e A
utho
rized
Pub
lic D
iscl
osur
e A
utho
rized

PRINCIPAL ABBREVIATIONS AND ACRONYMS USED
BHEL Bharat Heavy Electrical Co.BHPV Bharat Heavy Plate and Vessel Co.CAN Calcium Ammonium NitrateFCI Fertilizer Corporation of IndiaFRG Federal Republic of Germany01 Government of India
HCH Hydrogen CyanideMW MegawattMWH Megawatt HourNFL National Fertilizers Ltd.N Nitrogen
P205 Phosphorus PentoxideP & D Division Planning and Development DivisionPPM Parts per MillionTPD Tons per DayTPY Tons per Year

FOR OFFICIAL USE ONLY
PROJECT PERFORMANCE AUDIT REPORT
INDIA--NANGAL FERTILIZER EXPANSION PROJECT(CREDIT 357-IN)
TABLE OF CONTENTS
Page No.
Preface ** * * * * * * * * * * * * * ** * * * * * * * * * * * * *
Basic Data Sheet ...... o... .. .. .. ....... 0 0............00....... iiBighlights ........... ooo ...... ***.......o.....o..ooo.o********* iii
PROJECT PERFORMANCE AUDIT MEMORANDUM
Project Preparation .......... ... ...... o ... o .... .... ... o... . 1Project Implementation ................ o.............. . 5Nangal's Operating and Financial Performance ........... o..... 6Conclusions o . . . ..... .0.. ... 00 . ... .0.000* . 00 . 0 0 .. 00 ... * ... ******* 9
Annexes: 1. Capacity, Production and Unit Costs of Production .. 11
2. Nangal Unit-Income Statements (1978-1980) .o...o 12
3. Nangal Unit-Balance Sheets (1978-1980) .o............ 13
4. NFL-Income Statements (1979-1980) ........... .. 14
5. NFL-Balance Sheets (1979-80) ............ .. 15
ATTACHMENT A: COMMENTS RECEIVED FROM BORROWER ........ ... 16
ATTACHMENT B: PROJECT COMPLETION REPORT
I. INDIA'S FERTILIZER INDUSTRY ..... ............... o. 19
A. Bank Group Involvement .......... ........ 19B. Industry's Development .............................. 19
C. Public Sector . ..... .. . ..... 20
II. PROJECT IDENTIFICATION, PREPARATION AND APPRAISAL ... 22
A. Project Development ..................... . ....... 22
B. Project Objectives ........................... ...... 22
C. Project Description ................. ...... 22
D. Project Cost ............ ....... .... . ... 23
E. Analysis of Cost Overrun ........................... 24
F. Financing .... .. ..... o .... .... ***************.... 25
III. PROJECT IMPLEMENTATION AND MANAGEMENT ......... o.... 26
A. Analysis of Time Overrun .................... 26
B. Procurement ...... ...... o *....*.*.**.* .. 26
C. Project Management ................. ...... 27
D. Disbursements . ................ oo . 27
This document has a restricted distribution and may be used by recipients only in the performance oftheir official duties. Its contents may not otherwise be disclosed without World Bank authorization.

TABLE OF CONTENTS (Continued)
Page No.
IV. OPERATING PERFORMANCE AND ECONOMIC ASPECTS .............. 28
A. FCI Restructuring ................................... 28
B. FCI's Operating Performance ......................... 28
C. Compliance with Covenants ........................... 29
D. Nangal's Operating and Financial Performance ........ 29
E. Financial Rate of Return ......... .o ......... 31
F. Economic Rate of Return ......... . ...... .... .... . 31
G. Environmental Aspects o ... ... oo....o. . ........ 32
H. Employment ................................... ******* 33
I. Nitrogen Consumption and Supply ..................... 33
J. Nangal's Fertilizer Market .............. ...... 34
V. IDA'S ROLE ......... ..o.* ....... ...... . . .o o......... 35
A. Dialogue with Government 35
B. Arrangements for Engineering Services ............ 36
C. Project Scope ........... ................ * 0 # ...... 36
D. Project Implementation Management ......... ... 37E. Lessons Learned ..................................... 37
Annexes
1. India - Fertilizer Projects Financed by the Bank Group... 38
2. Capacity Utilization of Fertilizer Plants in Operationin India ................ ......... *..*..... * * *........ 39
-3. Project Implementation Schedule - Appraisal Vs. Actual... 40
4. Sources of Supply; Disbursement by Currencies .......... 41
5. FCI - Income Statements (1972-77) .................... . 42
6. FCI - Balance Sheet Statements (1972-77) ..... ........... ... 43
7. Nangal Unit - Income Statements During ProjectImplementation Period (1973-78) .... .......... 44
8. Nangal - Balance Sheets During ProjectImplementation Period (1973-78) ............................ 45
9. Assumptions for Financial and Economic Analysis ......... 46
10. Recalculation of Nangal's Urea Retention Price .......... 49
11. Nangal - Income Statement Forecast ..................... 51
12. Re-evaluation of the Financial Rate of Return ........... 52
13. Re-evaluation of the Economic Rate of Return ............ 53

PROJECT PERFORMANCE AUDIT REPORT
INDIANANGAL FERTILIZER EXPANSION PROJECT(CREDIT 357-IN)
PREFACE
This report presents a performance audit of the Nangal FertilizerExpansion Project supported by Credit 357-IN. The Credit was approved inNovember 1973 following four years of discussion with the borrower; it wasfully disbursed in September 1976, six months earlier than the closing date.
The Nangal Fertilizer plant, located in the State of Punjab inNorthern India, was initially one of the plants operated by the Government-owned Fertilizer Corporation of India (FCI). Following a restructuring of thepublic sector fertilizer industry in 1978, the unit was placed under the newlycreated National Fertilizer Ltd. (NFL).
A Project Completion Report (PCR) was prepared by the IndustrialProjects Department of the Bank on the basis of information and data gatheredby NFL. This report, which provides a factual review of project implementa-tion and operations, is attached. It is preceded by an audit memorandumprepared by OED following a visit to the country in February 1981. Assistanceprovided during the mission is gratefully acknowledged. The memorandum wasprepared on the basis of a review of the PCR, the credit documents, the filesand discussions with Bank staff as well as Government and project officials.It reviews the discussions held between the Bank and FCI prior to creditapproval and evaluates the operations of the project in recent years. Com-ments received from the borrower have been taken into account in finalizingthe report and are reproduced as Attachment A to the audit memorandum.


PROJECT PERFORMANCE AUDIT REPORT
INDIA--NANGAL FERTILIZER EXPANSION PROJECT(CREDIT 357-IN)
BASIC DATA SHEETAmounts (in US$ Million)
As of 08/31/81Original Disbursed Cancelled Repaid Outstanding
Credit 357-IN 58.0 58.0 - - 58.0
Cumulative Credit Disbursement
1973 1974 1975 1976 1977
Planned (i) - 7.5 42.5 57.0 58.0Actual (ii) 3.0 11.2 48.1 58.0 58.0(ii) as % of (i) - 149 106 102 100
PROJECT DATA
Original Actual orCredit Dates Re-estimated
Board Approval 01/30/73Credit Agreement 02/09/73Effectiveness - 05/11/73Credit Closing 03/01/77 09/30/76Date of Physical Completion 08/75 07/77
Completion Time (in months) 32 55Time Overrun (%) - 72%
Total Project Cost (US$M) 100.5 140.1Cost Overrun (%) - 40%
Economic Rate of Return 15% 12%
MISSION DATA
Month, No. of No. of Man- Date ofYear Weeks Persons weeks Report
Identification )Preparation ) 1971/72 8 3 24Preappraisal )Appraisal 06/72 3 4 12 07/06/72
Subtotal 11 36
Supervision I 02/72 1 3 3 03/08/73Supervision II 06/73 1 2 2 08/07/73Supervision III 10/73 1 1 1 11/03/73Supervisiod IV 03/74 2 1 2 05/02/74Supervision V 07-08/74 2 1 2 09/13/74Supervision VI 11/74 1 1 1 12/05/74Supervision VII 08/75 2 1 2 09/29/74Supervision VIII 07/76 1 1 1 09/09/76Final Supervision 11/78 2 2 4 12/20/78
Subtotal 13 18


- iii -
PROJECT -PERFORMANCE AUDIT REPORT
INDIA--NANGAL FERTILIZER EXPANSION PROJECT(CREDIT 357-IN)
HIGHLIGHTS
The project represented an expansion of a nitrogenous fertilizerplant located in the State of Punjab in Northern India. It involved theconstruction of an ammonia/urea complex with a capacity of 900 tpd--600 tonsof ammonia to be used in the new 1,000 tpd urea plant and 300 tons to beutilized by existing units to produce calcium ammonium nitrate.
The project was physically completed in July 1977, almost two yearsbehind schedule due to a combination of factors, including (i) delays in thepreparation of detailed engineering and (ii) late delivery of equipment (PPAM,para. 13; PCR, paras. 3.01 and 3.02). Total project cost amounted to US$140million, 39% over the appraisal estimate (PPAM, para. 14; PCR, paras. 2.04 and2.05). Continuous production was not achieved until November 1978, because ofa number of technical and operational problems that developed after commis-sioning. Thereafter, repeated failures of a critical waste heat boiler and,to some extent, power outages have kept production down, with capacity utili-zation averaging about 40% in 1980 (PPAM, paras. 15 and 16). However, capa-city utilization has been improving significantly during 1981 following thealleviation of important constraints. But low capacity utilization has erodedthe project's competitiveness as well as the overall plant's profit ability(PPAM, paras. 18, 19 and 21). Due to higher output prices, however, theproject still shows a satisfactory economic rate of return of 12%.
The following points may be of particular interest:
- delays in project preparation as a result of differences of opinionbetween IDA and the borrower on the choice of production processes(PPAM, paras. 3 to 11);
- delays resulting from having procurement organized from the generalcontractor's office located in a different part of India, with whichcommunications were cumbersome (PPAM, para. 13);
- the advantage of having responsibilities for project implementationentrusted with a project manager on site and independent from themanagement of the existing plant (PPAM, Paras. 12 and 22);
- the larger than anticipated participation of Indian manufacturers insupplying locally produced equipment, in part due to the tightequipment supply on international markets (PPAM, para. 14); and
- failure to close down the plant's uneconomic electrolysis-basedammonia unit implied continued reliance on heavily subsidized use ofelectricity (PPAM, paras. 17 and 19).


- 1 -
PROJECT PERFORMANCE AUDIT MEMORANDUM
INDIA--NANGAL FERTILIZER EXPANSION PROJECT(CREDIT 357-IN)
1. The Nangal Expansion Project was one of the two fertilizer projectsidentified by the Government of India for Bank financing, following the Bank'sdecision in 1969 to consider assisting publicly-owned entities engaged in thisparticular sector. Protracted discussions on technical matters deferred Bankapproval of the credit for about three years. The project, supported byCredit 357-IN of February 1973, was the third Bank operation for fertilizermanufacturing in India. The credit was fully disbursed by September 1976, six
months earlier than the closing date.
2. The Nangal fertilizer plant, located in the State of Punjab inNorthern India, began production in 1961. At the time of appraisal, it wasone of five units operated by the Fertilizer Corporation of India (FCI), agovernment-owned entity and the largest producer of fertilizers in the coun-try. As a result of the rapid expansion of FCI during the 1970's, the Govern-ment established a more decentralized decision-making structure for thesector. As a first step, in 1974, the Government created a new company,National Fertilizers Ltd. (NFL), to implement two new projects located inBhatinda and Panipat in Northern India. Later, in 1978, it restructured FCI's
operations under four separate, geographically-oriented companies; the NangalFertilizer Unit was placed under NFL, to which public sector fertilizermanufacturing plants in the northern part of the country were attached (para.1.08 of the PCR).
Project Preparation
3. The existing Nangal plant in operation at the time of appraisal hada design capacity of 310 tons per day (tpd) of ammonia. Unlike most modernammonia plants which usually rely on natural gas or petroleum derivatives asfeeastock, it was based on water electrolysis. Heavy water, used in theatomic energy industry, was also produced from the hydrogen gas obtained fromelectrolysis. Ammonia was converted first to nitric acid and then to calciumammonium nitrate (CAN). Since the electrolysis of water is a highly powerintensive process, the company had important energy needs (149 MW); these werebeing met by the hydroelectric plant of the Bakhra Dam located a few milesfrom Nangal.
4. The original feasibility study submitted to the Bank in November1968 proposed the erection of a new plant designed to produce 600 tpd ofammonia and 1,000 tpd of urea, with all the ammonia production feeding intothe urea plant. The new plant was to be independent of existing units exceptfor its use of by-product oxygen from the electrolysis plant, which hadheretofore been discarded. Reflecting changes in Government policy in theearly 1970's regarding the choice of feedstock for the fertilizer industry,ammonia production was to be based on the gasification of heavy fuel oil.

-2-
Most of India's earlier plants were based on naphtha, which was becomingincreasingly scarce, and Nangal was in fact to be the first heavy fuel-basedammonia plant in the country.
5. The project involved the following four processes:
(i) the gasification of heavy fuel oil by means of partial oxidation toproduce the necessary gases to feed into the ammonia synthesisplant;
(ii). the purification of the gases and adjustment of hydrogen-nitrogenratio prior to ammonia production;
(iii) the ammonia synthesis process which produces ammonia from theammonia synthesis gases;
(iv) the urea synthesis process.
6. During project preparation, discussions took place between the Bankand FCI on the choice of processes FCI intended to set up at Nangal, a choicewhich the Bank felt had been made with insufficient attention to technicaloptimality or capital cost merits. Under bilateral credit, India had earlieracquired licenses covering the synthesis of ammonia and urea for use inother projecta-/; FCI intended to make use of these licenses at Nangal. TheBank pointed out that the licensor had no commercial experience in partialoxidation (which meant that its ammonia synthesis loop had to be integratedwith gas preparation processes from other licensors), and that its ureaprocess was not the best available (in terms of conversion efficiency).Process technology and commercial experience became critical and unresolvedissues between the Bank and FCI. However, discussions centered mainly aroundthe choice of the gasification process (which FCI had also already acquired),a choice the Bank criticized on grounds both of technical feasibility andeconomy.2
1/ These were located in Durgapur and Cochin, where FCI and Fertilisers andChemicals, Travancore Ltd. (FACT) were setting up naphtha-based ammonia/urea plants.
2/ Gasification technology was at the time undergoing rapid change, asthe type of feedstock generally used was changing from hydrocarbons oflower specific gravity (e.g., methane and naphtha) to others of higherspecific gravity (e.g., fuel oil and later coal) in response to changesin relative prices. The controversy was not over the partial oxidationtechnology itself (by which high-specific gravity feedstock is convertedinto gases for ammonia synthesis), but rather over the particular type ofprocess chosen by FCI within this technology. More specifically, theissues involved were whether enriched or pure oxygen had to be used andat what working pressure should the process operate. While all existingammonia facilities using heavy hydrocarbons as feedstock were based on apure oxygen oxidation process, the availability at Nangal of free oxygenfrom the electrolysis plant led FCI to give preference to an enrichedair process, which eliminated the need for an air separation plant--adecision questioned by the Bank. The Bank also believed that using ahigher pressure process than the one selected by FCI would result inlower capital and operating costs.

-3-
7. Overall project preparation was delayed as the Bank tried to induceFCI to prepare a rigorous economic analysis -of all available processes orprovide the data necessary for such an analysis which resulted in fairlyprotracted discussions and correspondence. Eventually, the Bank commissioned
two consultants to review the issue; their conclusions were that the processselected by FCI (a low-pressure process working with enriched air) would beacceptable. Although the type of process the Bank favored (a pure oxygenhigh-pressure process) would have been somewhat superior on economic grounds,it appears FCI had opted for an equally sound process from a technical stand-point, a choice to some extent justified on commercial grounds since thelicense for it had already been acquired.1/
8. By November 1970, the Bank had in principle accepted FCI's original(September 1968) project proposal, by having approved FCI's choice for thegasification, ammonia synthesis and urea synthesis processes. The only condi-tion the Bank had imposed was that project appraisal await the satisfactoryoperation for at least three months of the two other projects (Cochin andDurgapur) which were based on the same ammonia and urea processes .(excludinggasification)2/. However, a deteriorating electricity supply position atNangal made changes in the project scope necessary. To avoid tying theproject to the availability of oxygen from the power-intensive electrolysisunit which was increasingly affected by power shortages, FCI proposed toseparate the project entirely from the existing plant and, in doing so, toincrease the size of the new plant to benefit from economies of scale. Tothis end, FCI expressed the intention to set up an oxygen separation plant anduse a pure oxygen gasification process, thus partially reversing its positionto coincide with that initially supported by the Bank. Further, by the time arevised feasibility study was prepared in May 1971,* the Bank had become verymuch aware that the high economic cost of electricity was making the electrol-ysis process uneconomic. A discussion of various project alternatives ensuedbetween the Bank and FCI, with the Bank-s position being that the project belinked to the shut-down of the electrolysis plant, a proposal to which FCIformally agreed in 1972.
9. The project, as it was eventually defined, consisted of an ammoniaplant with a capacity of 900 tpd--600 tons to be used in a new single stream1,000 tpd urea plant (the first one of this size in the country) and theremaining 300 tons to be diverted to old units to produce calcium ammoniumnitrate. The existing electrolysis and ammonia units were to be shut down,and substantial economic benefits were expected from the release of a large
1/ FCI also argues that high pressure equipment would, to some extent, haveinvolved greater risks of failure, because the greater sophisticationof the equipment called for the use of special alloy steel thereby
making local repair work more difficult.
2/ In retrospect, the Bank's position to evaluate the experience of Cochinand Durgapur has proved to be correct. In 1981, fourteen years afterimplementation of these projects started and about seven years afterinitial operations, neither of these two plants has ever operated at fullcapacity.

-4-
amount of hydroelectric power as a result of the setting up of a new source ofammonia for the old nitric acid and CAN units. An important consequence ofthe scaling up of the ammonia plant (from 600 tpd in the original projectproposal to 900 tpd) was that FCI's choice of licensor (for the synthesisloop) was not considered by the Bank as fortunate. FCI concurred with thisviewpoint and selected a contr ctor for the ammonia plant following a pointsystem agreed to with the Bank.17.
10. As noted, the main reason for the delay in preparing the project wasthe protracted discussion over the choice of technical processes. The projectrepresented the Bank's second involvement in public sector industry in Indiaand was assessed against the background of FCI's poor operating record in thepast. Project preparation also suffered from sensitivities at the time on thepart of FCI to any hint of outside interference.
11. In this regard, another important subject of discussion duringproject preparation revolved around FCI's intention to maximize its involve-ment as project engineer (through its Planning and Development [P&D] Division)and prime contractor, without due consideration of the costs and risks. in-volved. As the PCR notes (paras. 5.02 and 5.05), difficulties in integratingthe various know-hows acquired under license into well-organized ammoniaplants was a major factor in the slow impleme tation and production build-upof the plants FCI built during the sixties2T. In view of this, the Bankconsidered unacceptable FCI's original proposal by which th7 company's P&DDivision was to take full responsibility for the unproven37 project engi-neering, and insisted that FCI accept some technical backup from more quali-fied engineering firms. A compromise on this was eventually reached, wherebyFCI's P&D Division agreed to receive limited assistance from two experienced
1/ As will be seen, FCI had by that time accepted the Bank's suggestion thatit contract an engineering company to prepare the basic design of theammonia plant. The ammonia contractor was to provide for gasificationfollowing the process selected by FCI (using pure oxygen), with therest of the process being his own design. As part of this compromise,the Bank agreed to the use of the urea contractor/process previouslyselected by FCI.
2/ At the time of appraisal, FCI projects were running at between one andthree years late in construction time and many were operating at between50% and 70% of capacity.
3/ The 600 tpd ammonia reactor design initially chosen by FCI had not yetbeen proven for capacities of 600 tpd or over. The contractor eventuallyselected to design the 900 tpd ammonia plant was engaged at the time inimplementing an ammonia plant with capacity of 1,215 tpd in WesternEurope, and was to base its design of the Nangal plant on a similarcombination of processes.

-5-
foreign engineering companies. These were to be responsible for the basicdesign of the ammonia plant (treated as a single unit from gasificationthrough synthesis) and the urea plant, while P&D was to retain full respon-sibility for the detailed. engineering and procurement of equipment.1/
12. The difficulties experienced by FCI in meeting timetables and costlimits prompted the Bank to ensure also that adequate implementation arrange-ments were provided for. While agreeing to FCI's P&D Division acting as primecontractor, the Bank insisted that substantial responsibilities for the
supervision of erection be subcontracted to the foreign firms responsible forpreparing the basic engineering of the plant. The Bank was also instrumentalin having FCI appoint a project manager to coordinate project implementationon site.
Project Implementation
13. The project was physically completed in July 1977, almost two yearsbehind schedule. The time overrun was due mainly to (i) delays in the prep-aration of detailed engineering; (ii) late delivery of equipment owing tothe tight situation of the market in the aftermath of the 1973/74 oil crisis;and (iii) storm damage to the urea reactor during shipment (PCR, para. 3.02).Procurement also suffered from the large distance separating Nangal from FCI'sP&D Division located in Sindri in the State of Bihar, which suggests that theproject would have benefitted from having procurement work delegated to theproject unit. Partly for its inexperience and that of the engineering con-tractor with large fuel-oil based plants, FCI experienced difficulties instabilizing production after commissioning; the plant was stabilized in Novem-ber 1978, 16 months after physical completion (PCR, para. 3.03). Overall,however, most of the difficulties experienced during implementation werebeyond FCI's control. Within its area of competence the company's performancewas satisfactory, the appointment of a project manager on site proving partic-ularly helpful to coordinate the actions of FCI's P&D Division, contractorsand foreign firms acting as consultants.
14. The project was implemented at a total cost of Rs 1,177 million(US$140.1 million equivalent), which represents a cost overrun of 61 percentin rupee terms and 39 percent in US dollar terms over appraisal estimates.Because of the tight equipment supply situation on international markets,Indian manufacturers were able to contribute to the supplying .of equipment toa far greater extent than was anticipated, winning 35 percent of equipmentcontracts allotted under international competitive bidding (against 10 percent
1/ In fact, P&D's work was under-written by the consultant engineers Uhde,Lurgi, Shell-Topsoe Consortium since they were contractually responsiblefor the supervision of the detailed engineering.

-6-
expected at appraisal)L/. As a result, foreign exchange costs were lowerthan anticipated, amounting to US$48 million, as compared to US$58 million(the amount of the loan) expected at appraisal.
Nangal's Operating and Financial Performance
15. During construction, Nangal's production performance was affectedby power shortages which limited the output of its old power-intensive ammoniaunit. Continuous production of the new facilities started in 1979. The fol-lowing table depicts the production record of Nangal's old and new facilities:
Capacity Utilization (Percent)April-
1975/76La 1976/77 1977/78 1978/79 1979/80 1980/81 Sept. 1981
Old PlantAmmonia 98 95 57 72 61 51 44CAN (25% N) 97 101 69 88 80 65 52
New PlantAmmonia - - 2 32 38 38 56Urea (46% N) - - 2 37 44 47 79
/a Fiscal years run from April 1 to March 31.
16. Repeated failures of a waste heat boiler in the ammonia synthesisloop lie, up to a point, behind the disappointing performance of Nangal's newfacilities. The defective boiler is now being bypassed, which results inenergy losses and limits the output of the new synthesis loop to 55 percentof capacity. The ammonia plant has been running on two (out of three) gasi-fiers, part of the gas mix produced being diverted to the old ammonia plant
1/ Response from overseas on some major items (e.g., the steam generationplant and heavy fabricated vessels and columns) was particularly poor;considerable orders were then placed on Indian heavy equipment manufac-turers such as Bharat Heavy Plate and Vessel Co. (BHPV) and BharatHeavy Electrical Co. (BHEL).
2/ NFL points out that the underutilization of capacity in 1980/81 wasmainly due to the irregular supply of raw materials, as a result of whichthe plant was shut down for about 120 days. With more regular suppliesduring April-September 1981, and despite the fact that the waste heatboiler was under repair, capacity utilization improved considerably (seetable in para. 15).

- 7 -
for synthesis. In turn, urea production until very recently had beenrestricted for lack of CO2 recovered from ammonia production. But late in1981, Nangal modified the C02 recovery unit and was able to ensure suffici-ently high purity carbon dioxide recovery as to load the urea plant at 100%even when two gasifiers are in line-l. Concerning the defective boiler,which is proprietary equipment of the company that engineered the ammoniaplant, po long-term solution to its repeated failings has yet been iden-tified2. The Bank could have followed up more closely on this issue.
17. An important objective of the project was to set up an entirely newammonia production facility permitting the closing down of the old electrol-ysis and ammonia units; the new ammonia plant was indeed so dimensioned thatit was to provide sufficient ammonia to feed both the old CAN plant and thenew urea plant. Despite overwhelming economic arguments, the decision toclose down the old electrolysis plant has so far been postponed. In 1978, NFLentered into a seven-year agreement with the Punjab State Electricity Board(which controls the Bakhra Dam power plant) for the supply of an average of 98
MW (i.e., 66 percent of the requirements of the electrolysis plant). Thislimits the extent to which it can divert the gas produced in the new heavyfuel oil gasifiers for synthesis in the old ammonia plant. While this in
itself does not limit overall ammonia production, it does restrict urea outputfor lack of C02 (a by-product of the new ammonia plant but not one of the oldplant).3/. Ammonia and urea production has remained, however, well within thelimits imposed by the boiler failure and the non-closing of the electrolysisunit. This has been due to a combination of mechanical breakdowns and lackof raw materials; raw material shortages were responsible for 114 days ofstoppage in 1979/80 and 113 between April and December 1980.
18. Because of low capacity utilization, production costs of urea (andCAN produced on the basis of ammonia from the new plant) were in 1979/8038 percent (13 percent for CAN) above equivalent CIF prices of imports:
1/ Comments Received from Borrower, Attachment A.
2/ NFL states that it has been in consultation with the proprietary sup-pliers and came to the conclusion that stress corrosion was the cause forthe boiler's failings. As an interim measure, Nangal's workshop recon-structed the boiler using 2-1/4 chrom and one moly tubes. This materialis reportedly not susceptible to corrosion. Steps have also been takento improve scavenging at the tube sheets. The repaired boiler wascommissioned in November 1981. To work out a long-term solution, a studywas commissioned wiih Messrs. Haldor, Topsoe and FPDIL. For details, seeAttachment A.
3/ As only two-thirds of ammonia production was to be converted into urea,it was unnecessary to optimize CO2 recovery; as a result, the ammoniaplant has to run at about 80% to generate sufficient CO2 to meet therequirements of urea production at full capacity. Below that level, atmost 83% of ammonia produced in the new plant can be converted intourea. If the ammonia plant operates at 55% of capacity (its presentceiling), urea production cannot exceed 69% of capacity.

- 8 -
Unit Production Costs in 1979/80and at 90 percent capacity (Rs MT)
Urea CANAt 90% At 90%
1979/80 Capacity 1979/80 Capacity(Actual) (Estimate) (Actual) (Estimate)
Variable cost 638 638 414 414Fixed cost 1,904 967 948 607
Total 2,542 1,605 1,021(as % of CIF equivalent) (138) (87) (113) (85)
Nangal's competitiveness should, however, considerably improve as fuller useis made of additional capacity; actual data for 1979/80 suggest that thecompany should break even with the CIF price of imported urea when productionreaches 77 percent of capacity.
19. Costs of production of ammonia and CAN produced in the old facili-ties are considerably lower (Annex 1 to this memorandum); these, however,reflect the highly subsidized price the company is paying for electricityit uses to operate its electrolysis planti! and the fact that fixed assetshave by now been fully depreciated. The substantial benefits expected to bederived from the closing down of this unit (the present value of which isestimated in the PCR [para. 4.12] at US$155 million) have so far not material-ized. There is little indication at this point that they will do so fora number of years, as NFL apparently intends, for reasons other than economic,to keep operating a plant which has been very well maintained and is also(owing to the subsidized price of electricity) the most profitable of itsunits.
20. A common sales department distributes the production of the threeplants operated by NFL. NFL's marketing effort has focussed on the states ofHaryana, Rajasthan and Punjab where fertilizer consumption per hectare is
1/ NFL is charged Rs 98/MWH for the electricity it uses in its electrolysisunit, i.e., less than half the normal industrial rate of Rs 230/MWHcharged for other industrial uses. In 1979/80, power expenses on accountof the electrolysis plant amounted to Rs 72.3 million (US8.9 millionequivalent for an average of 91 MW); these represented 76 percent ofproduction costs in the old ammonia plant. Power requirements per ton ofammonia produced through the electrolysis route amount to about 12,000KWH; estimating the opportunity cost of thermal power at Rs 250/KWH, thisrepresents a cost of Rs 3,000/ton of ammonia. On this basis, the economiccost of ammonia produced by electrolysis was Rs 3 , 3 5 5 /ton in 1979/80,about twice the CIF value of imported ammonia.

-9 -
about the highest in the country. In 1979/80, NFL's overall productionaccounted for 56 percent of the consumption of nitrogeneous fertilizers inthose three states, which in turn exceeded NFL's capacity by about 10 percent.NFL is thus confident that despite the Government's policy to encouragecompetition among fertilizer producers it will be able to keep disposing ofits production within a reasonably short radius from its plants so as tominimize sales expenses. Marketing costs have in the past averaged Rs 10/ton,considerably less than those of other producers in the country.
21. The financial performance of the Nangal unit has deterioratedsharply since the new plant came on stream. This deterioration was due to lowcapacity utilization of the new facilities as well as lower productivity inthe old ones. Total revenue includes direct income from sales complemented bytransfers from the Government based on retention prices. Since retentionprices (ex-factory prices + transfers) are calculated by the Government so asto ensure a minimum return on producers equity when plants are operated at .80%capacity, Nangal's net profit position reflects more than anything else thepoor capacity utilization of its facilities.
Nangal Unit--Summary Income Statements (Rs Million)
Year ending March 31 1976 1977 1978 1979 1980
Total income 264.4 346.7 492.0 591.2 824.3Net profit 98.9 69.6 31.3 (22.9) 12.0(As percentage of sales) (37%) (20%) (6%) (-4%) (1%)(Forecast at appraisal) (7%) (7%) (14%) (18%) (16%)
Conclusions
22. The project was appraised at the onset of the Bank's involvement inthe financing of public sector fertilizer industry. Project preparation,especially decisions concerning the selection of technical processes, role oflocal .(public sector) engineering firms and level of local supply of equip-ment, was marked by prolonged discussions between the Bank and the borrower.To a large extent, these reflected the fact that the Bank's thinking regardingprocedures for the selection of technical processes was still evolving at thetime. The difference of viewpoints between the Bank and FCI that prevailedover the first years of project preparation were slowly resolved and evolvedinto a closer understanding. Because of FCI's past operating record theBank had misgivings about the project (in particular about the fact that itinvolved an unproven integration of sub-processes) and insisted that adequateimplementation arrangements be adopted. The setup that was eventually agreedupon between the Bank and FCI proved highly successful: it allowed FCI tokeep responsibility for project implementation as well as for its P&D Divisionto undertake a major share of the engineering work; at the same time, itensured that critical assistance from foreign engineering companies be madeavailable. Within this general framework, which allowed for a substantialstrengthening of the P&D Division's capability, the role of the projeccmanager as overall coordinator on site was highly critical.

- 10 -
23. The key step in bringing to an end the protracted discussions
between FCI and the Bank during project preparation was the decision to closedown the electrolysis plant. It is somewhat ironic to note that this decisionnow appears to have been postponed for at least a number of years notwith-standing the highly uneconomic use of power which is allowed to continue,although there is no ;echnical or economic reasons why the electrolysis unitshould not be closedi. The expectation that the project was to permit therelease of a large amount of hydroelectric power for more economic uses wasthus not fulfilled although this should not be interpreted as a shortcoming ofthe project. To utilize its excess ammonia capacity (55 percent of thecapacity of the old plant or 170 tpd) NFL is contemplating setting up amethanol plant at Nangal; the Punjab State Industrial Development Corporationis also considering setting up a soda ash plant. These projects, which theBank declined to finance on economic grounds, are not expected to be ready forat least three years. In the meantime, a 5,000-ton ammonia storage unit isbeing set up to allow for sales and transfer to other fertilizer units.
24. The project was efficiently implemented, albeit two years behindschedule due to a combination of factors largely outside the control of theproject management team. Since start-up, production has been inhibited by anumber of technical difficulties. This should not be construed as a reflec-tion of improper management: the company has been active in dealing withproduction bottlenecks and the main production constraint that remains largelyfalls outside its control.
1/ NFL asserts that, according to their records, it made no commitment toclose down the electrolysis plant. Rather, the decision was left to FCI"and the Bank had agreed not to insist upon this as a precondition." FCIfelt that some power might still be available and the electrolysis plantcould be phased out gradually depending on power availability. NFL alsomaintains that there is financial justification to draw a part of theammonia production from the old electrolysis plant on the basis ofprevailing current costs. For details, see Attachment A.

- 11 -
ANNEX 1
PROJECT PERFORMANCE AUDIT MEMORANDUM
INDIA--NANGAL FERTILIZER EXPANSION PROJECT(CREDIT 357-IN)
CAPACITY, PRODUCTION AND UNIT COSTS OF PRODUCTION
Ammonia I Ammonia II Urea CAN(Old Plant) (New Plant)
Capacity('000 tons) 101 297 330 318
Production('000 tons)
1975/76- 99.0 - - 308.71976/77 96.1 - - 328.01977/78 57.8 6.4 7.2 221.11978/79 72.4 95.4 123.3 282.51979/80 62.0 112.1 146.1 254.8April-Dec. 1980 40.1 68.0 93.7 150.8
Unit Costs of Production(Rs/MT in 1979/80) /b lb
Variable cost 1,154 890 638 516 414Fixed cost/a 366 2,451 1,904 231 948
Total 1,519 3,340 2,542 747 1,362
/a Includes wages, depreciation, other production costs, interest andoverheads.
/b A: On the basis of ammonia produced in the old plant.B: On the basis of ammonia produced in the new plant.

- 12 -
ANNEX 2
PROJECT PERFORMANCE AUDIT MEMORANDUM
INDIA--NANGAL FERTILIZER EXPANSION PROJECT(CREDIT 357-IN)
NANGAL UNIT-INCOME STATEMENTS (1978-1980)(Rs Million)
Year Ending March 31
1978 1979 1980
SALES REVENUESales 467.5 467.4 544.3
Retention price subsidy 15.5 90.0 263.3Other income 9.1 33.8 16.1
Total income 492.0 591.2 824.3
COST OF OPERATIONSPurchased finished goods 206.2 97.5 76.7Raw materials 82.8 121.3 184.7Wages and salaries 32.7 36.7 35.6Power and fuel 49.0 147.7 179.4Freight and handling 6.9 11.1 13.3Excise duty and pool equalization
charges 49.5 73.1 69.3Repairs and maintenance 18.6 27.0 38.5Depreciation 4.7 55.6 127.1Central office expenses 7.4 8.6 11.6Interest - 32.3 62.9Other expenses (net) 2.9 3.0 13.3
Total costs 460.7 614.0 812.4
Net profit (loss) 31.3 (22.9) 12.0

- 13 -
ANNEX 3
PROJECT PERFORMANCE AUDIT MEMORANDUM
INDIA--NANGAL FERTILIZER EXPANSION PROJECT(CREDIT 357-IN)
NANGAL UNIT--BALANCE SHEETS (1978-1980)(Rs Million)
Year Ending March 31
1978 1979 1980
ASSETSGross fixed assets 1,663.5 1,324.3 1,339.1Less accumulated depreclation 285.1 57.8 185.0Net fixed assets 1,378.4 1,266.5 1,154.2Current assets 185.3 267.2 367.0
Total assets 1,563.7 1,533.6 1,521.2
LIABILITIESCurrent liabilities 118.6 101.3 120.7Long-term debts 576.1 - -Equity 869.0 1,432.3 1,400.5
Total liabilities 1,563.7 1,533.6 1,521.2

-14 -
ANNEX 4
PROJECT PERFORMANCE AUDIT MEMORANDUM
INDIA--NANGAL FERTILIZER EXPANSION PROJECT(CREDIT 357-IN)
NFL-INCOME STATEMENTS (1979-1980)(Rs Million)
Year Ending March 31
1979 1980
REVENUESales 467.4 821.1Retention price subsidy 90.1 523.8Other income 34.4 88.0
Total income 591.8 1,432.9
COST OF OPERATIONSPurchased finished goods 97.5 76.7Raw materials 121.3 390.1Wages and salaries 40.7 54.8Power and fuel 147.7 297.4Freight and handling 11.1 17.5Excise duty and pool equalization
charges 73.1 102.2Repairs and maintenance 27.1 56.3Depreciation 58.3 340.0Interest 32.3 192.6Other expenses (net) 5.6 47.8
Total cost 614.7 1,575.5
Net profit (loss) (22.9) (142.6)
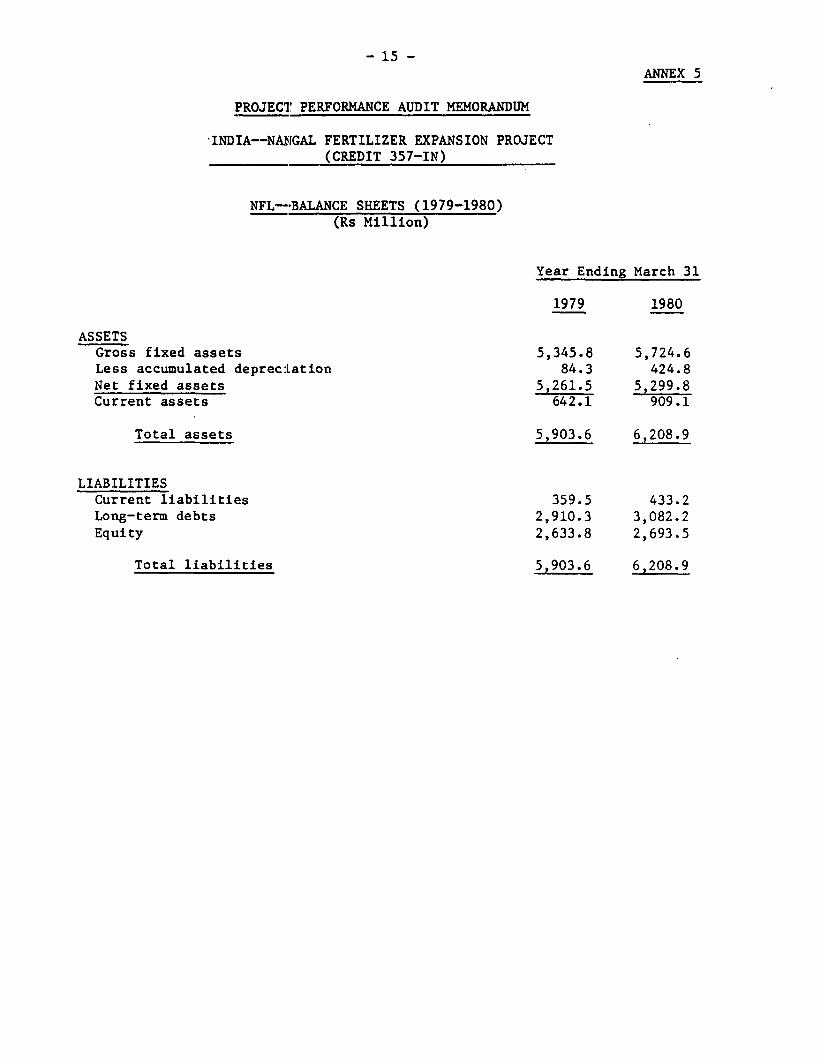
- 15 -ANNEX 5
PROJECT PERFORMANCE AUDIT MEMORANDUM
INDIA--NANGAL FERTILIZER EXPANSION PROJECT(CREDIT 357-IN)
NFL--BALANCE SHEETS (1979-1980)(Rs Million)
Year Ending March 31
1979 1980
ASSETSGross fixed assets 5,345.8 5,724.6Less accumulated depreciation 84.3 424.8Net fixed assets 5,261.5 5,299.8Current assets 642.1 909.1
Total assets 5,903.6 6,208.9
LIABILITIESCurrent liabilities 359.5 433.2Long-term debts 2,910.3 3,082.2Equity 2,633.8 2,693.5
Total liabilities 5,903.6 6,208.9

- 16 -
ATTACHMENT A
COMENTS RECEIVED FROM BORROWER
COMMENTS ON PROJECT PE KDERANCE AUDIT REPORTON NANGAL EXPANSION PROJECT (CMIT 357-1N)
Para 2 (Line 7) s
The Wational Tertilizers Ltd was formed in 1974 and not in 1975as stated in the text.
Para 11 (last sentenoe)
Incorporated it has been stated thqt P&3) was to retain full responsibility forin PPAM, para.11, footnote detailed engineering and procurement of equipment. nasua fact,1. however, the work done by P&B was under-written by the consultant
engineers, namelys Uhde, Lurgi, Shell-Topaoe Consotlium-tn as anah
A oontraotually they were responsible for supervision of the detailed
enginerrang to ensure its -adequaoy from their point of v3ew.
Para 15.
NFL has supplemented the figures for capacity utilipation given
in the Taes.e iorming part ox Aia par. The'tolloig figures form
the suppLemenTmay materials
Capacity Utilasation (percent)
1980-81 Apr-Sept. 1981
Old Plant
Ammonia 51 44CAN (25% N) 65 52
New Plqnt
Immonia 38 56
Urea ( 46A4) 47 79
Incorporated MFL points out that the underutiUtsation of cRpacity in 1980-81 isin PPAM, para. (a.npally due to irregular dupply of raw materials, because of wbioh16, footnote2. the plant was shut down for about 120 days. This external constraint
hs however, not been a feature In April-September 1981 and the figuresshow that, in spite of the waste heat boiler being under repairs, the
capaoc.ty utilidation has improved considerably.
Para 16s (Last but one sentenoe)
in regard to the defective waste heat boiler, the company has
been in consultation with the proprietary suppliers and has come to the
followang conclusions

- 17 -
The failare of the Sandik Sanioro-30 tubes, foming the boiler
elementeg.bas been identified as due to stress corrosion in the orevices
hetween the tube and the tube plate caused by presence of sodium and
abloride* it has also been noted that the design features are such that
water oiroulatior in the boiler at the entry zone of the gas is poor and
aunoe the heat flux at this point ia high, compounded by the fact that
tnere are acevices at the hot end of the tube, there is an acceleration in
Incorporated the deposit formtion and attack in this zone. As an intezim measure, thein substancein PPA,para. Nangal workshop has reconstructed the boiler using 2* chrome and 1 moly
to atAs corro Steps have also btel16, footnote tubes, This material, it is claimed, is nc sucept bIl to improve properkten2.
scavenging at the tube sheets, ensuring better quality of the feed water
and additional monitozing of the qaAity with newly installed instruments.
The repaired boiler is already in commission sjtpe November 1981. To
suggest a long-term solution, a separate study has been entrusted to M/a.
Haldor Topsoe and PPDIL. This study will also incidentally include
suggestions for either change of internels or specific equipment to
achieve higher cpacity utilisation. it has also been mentioned in the
paragraph that the urea production is being restricted for lack of CO2when only two of the three gasitiers are in commission. This as no longer
Incorporated true. in consultation with M/s Lurgi, Nangal plant has introduced certainin text,para. 16 of modifications in the CO2 recovery section of the Rectosol unit whichPPAM. ensures sufficient high purity oarbon dioxide recovery to load the urea
plant at 100,4 even when only two gasifiers are jn Line.
Paras 19 and 231
A reference has been made to some understanding which the World
Dank had on discontinuance of operations on the old Ningal eleotrolysers
once the expansion plant was put into operation. NFL has po.Lnted out that
according to theLr reoords,there was no commitment on the part of NFL to
do this. kooording to their records, it wou.ld appear that the decision toIncorporated close down the electrolysis plant wee left to the P0% and the Bank hadin substancein PPAM, igreed not to insist upon this as a precondition. This was done beoause,para. 23, at the time of negotiations, the PCL felt that some power may still befootnote 1.
vailc6le for the electrolysis plant and its phasing out could be done
gradually dependLng upon a review of the availability position. NFL
has Lndicated that the electrolysis plant, even though 20 years old is infaarly good health and with normal tuintenance cn be expected to operate
for another 8 to 10 years. Even when operiting thas plant, there would
be no effect on the urea production because of resultant reduced
gasifier loads, since the rectisol CO2 recovery . stem has been 3u.itably
modified as already commented inLgrevious section. NFL feels that there

- 18 -
is a Justifioation on the ground of curent costs (purely on financialterms) to draw a part of the amonia production from the old electrolysisunit as the following problction coat figures for the two plants for1980-81 would shows
(in repees/tonne)
Aga&a Varible cost Fzed cost TbA&
Nangal old plant 1216.29 552.70 176S.99Nangal new Plant 934.96 2753.97 3688.93
As it is, around 98 MW of powet -ig male avail4le to Nn off and on and
this enables them to produce about 170 tonnes per day of ammonia from thisunit. The extra ammonia is intended to be stored in a 5000.te ammoniastorage tank which has been sanctioned to them under the Operations.mprovement Programme funded by the World Bank. The ammonLa pool fromthis storage would be utilised to improve performanoe not only In Nangal
but also in bhazinda and Panipat by moving ammonia from surplus todeficit plants as and whan contingenoes arise. The soda ash projectof Punjab industtial Development Corporation, though delqVed to someextent for tying up finanoes, is now already taken under execution and.is expected to be ready with in qnother 30months.

- 19 -
ATTACHMENT B
PROJECT COMPLETION REPORT
INDIA--NANGAL FERTILIZER EXPANSION PROJECT
I. INDIA'S FERTILIZER INDUSTRY
A. Bank Group Involvement
1.01 The Indian fertilizer industry was still in its early stages ofgrowth when in 1967 the Bank Group first became involved to assist in itsfurther development. During the last 10 years, there have been significantdevelopments within the industry and the Government's approach to it and theBank Group has been associated with many of them. The first two Bank Groupoperations in the industry were in the private sector with an IFC investmentof US$11.5 million in 1967 to the Indian Explosives Company Limited (a sub-sidiary of Imperial Chemical Industries, of the U.K.) to finance a ureaproject and another IFC investment of US$18.9 million in 1969 in the Zuari-Agro Company.Limited (an affiliate of U.S. Steel Agrochemicals) to produceurea and complex fertilizers. Since then there have been eight other oper-ations - six by IDA and two by IBRD. Of them, six financed additions tocapacity of existing plants and one assisted the removal of productionbottlenecks by increasing capacity utilization of eight public, joint andprivate sector fertilizer companies (para. 1.07). IBRD's first operation,approved in 1974, financed a new urea plant of IFFCO, a company jointly ownedby the farmers' cooperatives and the Government. Bank Group financialsupport to the Indian fertilizer industry to date totals about US$473 mil-lion. Annex 1 lists the fertilizer projects financed to date by the BankGroup in India and their current status.
B. Industry's Development
1.02 Chemical fertilizer production in India, as a modern industry, beganshortly after independence in 1947 as part of the Government's program to makethe country self-sufficient in food supply. Government policies vigorouslypromoted expansion of the industry. Initially this was done via the public,private, joint state and private, and cooperative sectors, but subsequently,emphasis shifted to the public sector primarily through related policies suchas pricing, allocations of foreign exchange, restrictions on profits andforeign participations. Although the Government sanctioned many new projects,actual capacity expansion through the late 1960's was slow and capacity sizesof plants were relatively small (below 200 tpd on the average). A philosophyof maximum indigenous input in all phases of the expansion, including engi-neering and fabrication, often resulted in considerable completion delays,excessive cost overruns and commissioning difficulties, largely because of theinexperience of the local entities with projects that were large and complexrelative to then available capabilities. Poor performance, underutilizationof capacity and low nutrient content of product mix were also major featuresof the industry.

- 20 -
1.03 In 1967, when the Bank Group became involved with the industry,total installed capacity of nitrogen (N) and phosphates (P205) was about785,000 tpy. A decade later (1977) it was about 3.7 million, or four timesas much and is expected to double again to about 7.7 million tpy by 1983,when all the projects, now under construction or planning are scheduled to becompleted. While low-nutrient products such as ammonium sulphate (20.5% N),calcium ammonium nitrate (20.5% N) and single superphosphate (16% P2 05) formedabout three-fourths of the nutrient capacity in 1967, most of the newercapacity has been for the production of urea (46% N) and complex fertilizers.At the same time, Indian plant designs have followed closely developmentselsewhere. Ammonia plant sizes have increased from below 200 tpd in 1967 to900 tpd for plants now being commissioned. A 1,100 tpd naphtha-based ammoniaplant is already in operation and four gas-based plants with capacities of1,350 tpd each are planned. The feedstock pattern for ammonia production,which emphasized the use of naphtha in the late 1960s, has been diversified toinclude fuel oil, natural gas and coal, with the objective of reducing thecountry's petroleum import bill and of more fully reflecting its resourcebase. Present expansion plans are based on natural gas from Assam and therecently-discovered Bombay High Bassein offshore field. In terms of operatingefficiency, average capacity utilization, a major problem in the past, hasincreased to about 73% by 1977 including plants that had recently come onstream and others--mostly of an early vintage--with low utilization. Localcapabilities developed in the fields of design, engineering, construction,equipment fabrication and project implementation have helped to reduce theforeign exchange share of project costs, even though there have been delaysand cost overruns in some earlier projects. With a total employment of over60,000 persons in Indian fertilizer plants, the industry has developed a largepool of trained and experienced manpower especially in the middle managerialand supervisory levels. Pricing policy for nitrogenous fertilizers wasrevised in 1977 to improve ex-factory prices, especially for the more recenthigher cost plants, though these prices are still not adequate to attract muchlocal private sector investment or foreign equity participation.
C. Public Sector
1.04. The public sector has taken an increasing role in fertilizer pro-duction. In 1978/79, about 49% of the total installed nitrogen capacity of3.3 million tons per year (tpy) was in the public sector and about 0.2 milliontpy in the cooperative sector. Including the cooperative and joint sectorcapacity of 1.03 million tpy, the public sector directly or indirectly accountsfor about 81% of the domestic nitrogen capacity and the share is expected toincrease further to about 90% by 1984/85. The large public sector expansionprogram had mainly been implemented through the Fertilizer Corporation ofIndia (FCI) and the National Fertilizers Ltd. (NFL).
1.05 Four of the 11 public sector plants (Nangal, Trombay, Gorakhpur andNamrup) have generally shown satisfactory capacity utilization rates equal toor better than plants in the private sector, though production at even theseplants has at times suffered due to periodic power supply and transport

- 21 -
problems (Annex 2). The original plant at Sindri also showed satisfactoryperformance until the mid--1970's when the age of the facilities and diffi-culties in obtaining continued supplies of quality raw materials combined tolimit production. The overall unsatisfactory capacity utilization in thepublic sector plants, occurring during a period of substantial expansion, canin part be attributed to the managerial limitation of FCI, which has led toits restructuring (para. 1.08). Perhaps, more importantly, there were severetechnical problems during the commissioning of the new plants (e.g., NangalExpansion, Sindri Rationalization, etc.) and continuing operating problems atthe five older plants (Cochin I, Durgapur, Udyogamandal, Rourkela and Neyveli).Design defects have affected certain of these plants and the foreign firms,where involved, have moved in to rectify these deficiencies. Other problems,however, have resulted from a specific policy of using indigenous resourcesleading to maximum employment of local engineering and locally-suppliedequipment in a technologically-difficult industry. Experience has modifiedthis policy but resolving the resulting technical problems through redesign,replacement and "debottlenecking" programs, has taken time, while problemsrelated to raw materials supply, power, etc. have also, in some cases, con-strained operations.
1.06 Problems affecting the performance of the public sector fertilizerplants were studied by a Government committee in 1978 and several remedialmeasures recommended. Its recommendations, including those for plant modi-fications and better planning of preventive maintenance, have been adopted.The full impact of these efforts should be reflected in higher capacityutilization gradually durLng the next two years.
1.07 The Bank has also assisted the Government efforts to improve fer-tilizer production. As part of the Trombay IV Project (Credit 481-IN) acredit of US$17 million was made available to revamp the Durgapur and Cochin Iplants. Further, the Fertilizer Industry Credit of US$105 million, approvedin 1975, was specifically designed to improve capacity utilization of theIndian fertilizer industry. The Credit covered a large number of sub-projectsinvolving 11 plants. Since none of these IDA-financed facilities wereoperational before 1977/73, their beneficial effect on capacity utilizationhas not yet been fully felt.
1.08 - In 1977/78, FCI, the largest public sector fertilizer company, hadan installed capacity of 0.92 million tpy of nitrogen (30% of the total inthe country) and another 1.25 million tpy of capacity was under construction.As a result of the rapid expansion of FCI during the 1970's, managementcapabilities of FCI were overstretched. During the past few years, theGovernment and the Bank have been discussing the need for decentralizeddecision-making in FCI. As a first step, to improve the organization of thepublic sector industry and thereby its performance, in 1975 the Governmentformed a new public sector company -- National Fertilizers Ltd. (NFL) toimplement the Bhatinda and Panipat Projects. This approach was successfuland a scheme for further restructuring the public sector fertilizer units was

- 22 -
evolved during 1976-77 and formally announced in January 1978. This schemeregroups the units earlier managed by FCI and NFL into four separategeographically-oriented companies. The Nangal Project along with the Bhatindaand Panipat Projects are now under the NFL. The remaining plants and relatedmarketing activities have been assigned to the other three regional companies-- the Rashtriya Chemicals and Fertilizers Ltd. (West), Hindustan Chemicalsand Fertilizers Ltd. (East), and FCI (Central). The erstwhile Planning andDevelopment Division of FCI has become an independent company - Fertilizer(Planning and Development) India Ltd. (FPDIL). The new companies were legallyformed in April 1978. The above restructuring is expected to improve delega-tion of responsibility and authority to the'unit/project level and thus ensurebetter performance.
II. PROJECT IDENTIFICATION, PREPARATION AND APPRAISAL
A. Project Development
2.01 The Nangal expansion project was initiated by the Fertilizer Corpo-ration of India in 1968, and was prepared by its Planning and DevelopmentDivision. The project was appraised between June and August 1972 and nego-tiated in Washington in DecembVer 1972. It was approved for IDA financing bythe Executive Directors on January 30, 1973. The preparation of the project,which lasted 50 months and involved IDA substantially, impacting also on thepreparation and execution of latter projects in the sector, is discussed inChapter V.
B. Project Objectives
2.02 The project was to add a 900 tons per day (tpd) ammonia plant basedon the use of heavy petroleum feedstock and use 300 tpd of ammonia to replaceammonia from an old uneconomic hydro-power-based ammonia unit and use the restof the ammonia for the production of 1,000 tpd of urea.
C. Project Description
2.03 The project included the following production facilities: anammonia unit having a design capacity of 297,000 tpy; a urea unit with adesign capacity of 330,000 tpy and supporting facilities (including storageand utilities) for the new ammonia and urea units. Ammonia production isbased on the partial oxidation of fuel oil. Overall process design was theresponsibility of Friedrich Uhde GmbH of the Federal Republic of Germany(FRG), which was selected from among several proposals. The process includedthe following steps: air separation; high pressure, Shell non-catalyticpartial oxidation; Rectisol sulphur removal and recovery; shift conversion;Rectisol carbon dioxide removal and recovery; synthesis gas purification bynitrogen wash; Montedison ammonia synthesis; and ammonia separation andstorage. The urea production is based on the designs of Montedison for which

- 23 -
FCI already had a license. The plant is a conventional total recycle, single-train unit and includes the following steps: ammoni and carbon dioxidecompression; urea synthesis; separation and recycling.,of unreacted materials;urea solution concentration and prilling; and storage, bagging, and despatch.The project was expected to be mechanically completed in 32 months, which wasa rather optimistic estimate. For fertilizer projects subsequently financedby the Bank Group, a longer period (38-40 months) for mechanical completion isassumed.
D. Project Cost
2.04 Total financing for the project (including Rs 37 million of interestduring construction) was estimated at Rs 769 million (US$ 105.6 million).The appraisal estimates were based on FCI estimates prepared in cooperationwith the contractors who had previous experience with similar projects; andincluded reserves for physical contingencies equivalent to 10% of equipment,civil works and working capital costs and another 10% for price escalation.Below is a comparison of the appraisal cost estimates with the actual costs:
Comparison of Appraisal Estimates and Actual Project Cost(in Rs Million)
App raisal Estimates Actual % Change
Local Foreign Total Local Foreign Total
Equipment, material, 31 293 324 319 341 660 +104%spares
Freight & handling 9 17 26 36 - 36 + 38%Duties & taxes 95 - 95 140 - 140 + 47%Engineering designs &
license fees plus
project management 43 28 71 74 39 113 + 53%Erection & commis-
sioning 33 14 47 62 20 82 + 74%Civil works .37 - 37 64 - 64 + 73%
Sub-Total 248 352 600 695 400 1,095 + 83%
Physical contingencies 26 32 58 - - -
Price contingencies 26 32 58 - - -
Modifications duringcommissioning - - - 66 1 67 +100%
Working capital 16 - 16 15 - 15 - 6%
Total Project Cost 316 416 732 776 401 1,177 + 61%
Interest during constr. 37 - 37 121 - 121 +227%
Total Financing 353 416 769 897 401 19 8 + 69%

- 24 -
E. Analysis of Cost Overrun
2.05 Total actual cost of the project was Rs 1,298 million, 69% higherthan the appraisal estimate of Rs 769 million. The increase was mainly dueto higher equipment prices and changes in foreign exchange rates, increasedduties and taxes, higher outlays for engineering, project management, equip-ment erection and civil works, equipment modifications during commission-ing and increased interest during construction as a result of delays inproject implementation. The table below analyzes the cost overrun in variousmajor categories of the project:
Analysis of Cost Overrun
Rs millions % Share ofLocal Foreign Total Overrun
Equipment, material &spares +288 +48 +336 +63%
Freight & handling +27 -17 +10 +1%Duties & taxes +45 - +45 +9%Engineering designs& license fees plusproject management +31 +11 +42 +8%
Erection +29 +6 +35 +6%Civil works +27 - +27 +5%
+447 +48 +495 +92%Less: Provisions for
price & physicalcontingencies -52 -64 -116 -21%
+395 -16 +379 +71%Add:Modifications during
commissioning +66 +1 +67 +13%Less:Additional w. c. -1 - -1 -
Total project costoverrun +460 -15 +445 +84%
Add:Interest during constr. +84 - +84 +16%
Total financing overrun +544 -15 +529 +100%
2.06 The total cost increase amounted to Rs 529 million (or about USS63 million
based on the weighted exchange rate of Rs 8.4 to US$1 during the projectimplementation period). Nearly 70% of the cost overrun was accounted for by

- 25 -
increases in the costs of civil works, equipment and services, while modifi-cations during project commissioning and increased interest during construc-tion accounted for the rest. The bulk of the increase was in the local costcomponent. There was less than anticipated procurement from foreign sourcesdue to unacceptably long delivery dates and in some cases cancellations byforeign suppliers following the aftermath of the 1973/74 oil price increases(i.e., the very time the project implementation began) which affected projectsworldwide.
F. Financing
2.07 Under provisions of the Credit Agreement (Section 3.01), GOI was toonlend to FCI the entire US$58.0 million IDA credit at 8.5% for 15 yearsincluding five years of grace, and was to provide Rs.353 million in the formof equity to finance the execution of the project. The provisions also calledfor any additional funds, as required, to be provided by GOI with at least 50%in the form of equity and the remainder in the form of debt on terms andconditions normally applicable to GOI's loans to FCI. Due to the increasedcost of the project, GOI's total contribution actually amounted to Rs 808million, Rs 455 million more than the appraisal estimate. Seventy-eightpercent of GOI's contribution (Rs 634 million) was in the form of equity toFCI, the remainder (Rs 174 Rillion) was in loans at 10.5% annual interest for10 years including one-year grace, effective February 1978. The terms aresimilar to other GOI loans to other public sector projects. The debt/equityratio of 51:49 at project completion was slightly below the 54:46 envisaged atappraisal.
Financing Plan(Rs million)
Appraisal Actual
A. Equity from GOI 353 634
B. Long-Term Debt:
-GOI onlending /aof IDA Credit 416 490
-GOI Direct Loan - 174
Sub-Total 416 664
C. Total of A + B 769 1,298
/a Increase was due to changes in the exchange rate of the Rupee.

- 26 -
iii. PROJECT IMPLEMENTATION AND MANAGEMENT
A. Analysis of Time Overrun
3.01 Work on the Nangal project started April 1973 (about three monthslater than expected at the time of appraisal), and the project was mechani-cally completed in July 1977, some 23 months behind schedule, and subsequentlycommissioned after start-up tests early January 1978, a total of 25 monthslater than the appraisal forecast. The actual implementation schedule iscompared with the appraisal estimate in Annex 3.
3.02 The time overrun was mainly due to the longer than anticipateddelivery dates for equipment delivery because of the tight internationalequipment market following the 1973-74 oil crisis. Further, the timeoriginally estimated for process and detailed engineering and to some extentfor local equipment and materials procurement was somewhat underestimated,given the local engineering .firm's (FCI's Planning and Development Division)lack of adequate previous experience in those areas. Another reason for thedelay was the storm damage to the urea reactor during shipment near Lisbon;the reactor had to be returned to the supplier in the Federal Republic ofGermany for repairs which delayed the delivery by nearly a year. A majoroccurrence during the plant commissioning was the explosion in the carbonslurry separator tank due to instrument failure. As a result, the ammoniaplant had to be shut down for about three months for repairing the tank.Taking into account the above factors, which were largely outside the controlof FCI, the 23-month delay in mechanical completion and a further two-monthdelay in commissioning the project were not unreasonable.
3.03 Following commissioning, a number of technical and operationalproblems were experienced and the production could not be stabilized at highlevels without intermittent equipment failures until November 1978, partic-ularly because of: (a) a fire breakout in the nitrogen section of the project;(b) carbon dioxide (CO2 ) limitation for urea production even when the ammoniaplant was operating at high capacity; and (c) the lack of familiarity of theIndian technicians with the operation and maintenance of large fuel-oil-basedplants resulting in a longer than normal in-plant familiarizing period. Thetechnical problems were overcome by carrying out certain plant modificationsduring January-November 1978 with the help of the engineering firms, Uhde andLurgi. Considering that the Project was the first fuel-oil based fertilizercomplex in India and that it was designed by Uhde during the period when thefirst large-scale fuel-oil-based plant built by Uhde was still under commis-sioning in the Federal Republic of Germany, those difficulties in stabilizingproduction at Nangal were not unusual.
B. Procurement
3.04 As noted above, equipment procurement fell right into the periodof the 1973-74 oil crisis. Due to the impact of the crisis in the form ofincreased international demand of oil companies on equipment suppliers,responses to bid invitations were limited in general. Typically, against 20or so invitations per item or package, only between three to five technicallyacceptable responses (or even less) resulted. In a few cases, only one offerwas received. To avoid additional project delays that would have arisen had

- 27 -
rebidding been undertaken and in the face of then dramatically rising equip-ment prices, some single offers were accepted by the FCI, after consultationwith IDA, whenever the prices and delivery times were relatively reasonable.As a result of the poor bid responses and unacceptably long delivery datesfrom overseas, a considerable number of orders had to be placed with Indianheavy-equipment manufacturers such as Bharat Heavy Plate and Vessel Company(BHPV) and Bharat Heavy Electrical Company (BHEL) who were already themselveslaboring under heavy workloads from other customers. Indian equipment sup-pliers had been expected at appraisal to win about 10% of the equipmentcontracts under international competitive bidding; as a result of the procure-ment difficulties, Indian suppliers fulfilled 35% of the contracts financed byIDA. A list of countries of suppliers and contractors and the values ofcontracts won is shown in Annex 4.
C. Project Management
3.05 Project construction management showed considerable ingenuity inminimizing delays. Critical items and men were 'borrowed' from other FCIprojects under construction; and donkeys and additional manual labor wereused when the foreign supplier of a heavy earthmoving equipment cancelled theorder at the last minute, thus minimizing the resulting delays. The primecontractor for the project was FCI's Planning and Development Division. Majorresponsibilities relating to basic process design, supervision of detailedengineering and erection and procurement of critical items were subcontractedto various Indian and process consultants. Process design, supervision ofdetailed engineering and erection of the ammonia plant were assigned to aconsortium of firms (Uhde, Lurgi and Mineraltechnick, of the Federal Republicof Germany, and TOPSOE, of Denmark) headed by Uhde after competitive bidding.Similar work relating to the urea plant was subcontracted to Tecnimont ofItaly, a subsidiary of Montedison with whom FCI had process licensing agree-ments. Work on the offsite facilities were subcontracted mostly to Indiancompanies. In accordance with Section 2.03 (b) of the Project Agreement, FCIappointed a suitably qualified, experienced project manager with adequateauthority, staff and facilities. FCI was generally satisfied with theperformance of most of the contractors.
D. Disbursements
3.06 Disbursements of the IDA credit of US$58.0 million were closedSeptember 1976. There were no cancellations. Other than in 1973 when thetight equipment supply situation required substantial advance deposits toensure supply, the appraisal disbursement estimates have been fairly closeto the actual, as shown below:
Disbursements(in US$ millions)
Calendar Years 1973 1974 1975 1976 1977 Total
Appraisal Estimates - 7.5 35.0 14.5 1.0 58.0Actual 3.04 3.24 33.85 12.87 - 58.0

- 28 -
The largest sources of supply under,the Credit were the Federal Republic of
Germany (42.4%), India (34.6%), Italy (8.4%), the U.K. (4.8%) and Japan(3.7%), accounting for about 94% of the disbursements. Annex 4 shows thecurrencies in which the Credit was disbursed.
IV. OPERATING PERFORMANCE AND ECONOMIC ASPECTS
A. FCI Restructuring
4.01 As indicated (para. 1.05), FCI has been restructured as of April 1,1978. The restructuring essentially divested the old FCI of some of itsoperating units regrouping them into four separate geographically orientedcompanies. Its Planning and Development Division has also been spinned offinto an independent company -- the Fertilizer (Planning and Development) IndiaLimited. As a result of this restructuring, the Nangal Unit now belongs tothe National Fertilizers Limited (NFL). NFL also has two other plants, eachof 511,000 tpy of urea, at Bhatinda and Panipat in northern India. Both
plants, which are similar in size to Nangal's expansion unit, were mechanically
completed by NFL in 40 months, slightly (two months) behind schedule.
B. FCI's Operating Performance
4.02 Prior to its restructuring in 1977/78, FCI had eight fertilizeroperating units (Annex 2). The capacity utilization in these public sectorplants has been comparable in recent years to the units in the private and
joint sectors, if the performance of one of FCI units--Durgapur-- is not takeninto account. The poor performance at Durgapur (which started production in1974) has been mainly due to design defects and equipment failures whichdelayed commissioning of this plant and its stabilized operation. The DurgapurPlant has also been affected by inadequte power supply from the West BengalState grid. Even with certain modifications carried out, Durgapur operated at
only 25% in 1978/79. Further plant modifications are now being made based ona Tecnimont (Italy) survey. Besides, an in-plant power generation unit beinginstalled with IDA financing at Durgapur will help improve the power supply
situation. The average capacity utilization in the FCI plants was 79% in1976/77 but it decreased in 1977/78 to 63% mainly because of the decliningperformance of the Sindri unit due to the age of the plant (it was establishedin the early 1950's) and power shortages which affected the Nangal and Namrupplant operations.
4.03 In spite of fairly impressive performance by most of FCI units,(para. 1.05), FCI's overall financial position continued to be unsatisfactoryuntil its restructuring because of the Government pricing policy. Fertilizerprices had been kept pegged at unremunerative levels--often at below inter-national prices, to ensure that the basic agricultural input was available tothe farmer at an attractive price. A more realistic pricing policy was adoptedonly in November 1977. Also, to maximize the domestic availability of fertil-izers and to avoid unemployment of the operating labor, the Government con-
tinued to operate the Sindri Unit whose operation had become uneconomic

- 29 -
because of the age of the plant and the inadequacy of the fertilizer pricefixed by the Government prior,to 1977 even to meet the variable costs.Further, as already noted, ifhAs not yet been possible to stabilize produc-tion in the Durgapur plant.
C. Compliance with Covenants
4.04 The current ratio of FCI was less than the agreed level of 1.2:1during 1972-75 (Nangal's current ratio was, however, above the agreed limitduring this period as shown in para. 4.05) but subsequently the ratio improvedto the agreed level with Government assistance. But for the current ratiocovenant violation during 1972-75, FCI has complied with all the IDA covenants.
D. Nangal's Operating and Financial Performance
4.05 Nangal's operations which until now have been entirely dependenton power supply from the nearby Bhakra Dam, were adversely affected by powershortages during the project period. The unit's capacity utilization averaged77% during the 1972/73-1977/78 period. Annual production ranged from a lowof 51% in 1974-75 when there were severe power shortages, to 101% in 1976-77when there was adequate power supply. The unit's operating management issatisfactory. Operating results during the six-year period showed net annualincome averaging Rs 54 million per year. Measured against sales, the averagenet annual income has been about 21% - approximately what had been estimatedat appraisal. Following is a summary of the unit's performance during theperiod based on its income and balance sheet statements for the period shown inAnnexes 5 and 6:
Nangal Fertilizer Unit - Performance Indicators
1972-73 1973-74 1974-75 1975-76 1976-77 1977-78
Capacity Utilization 67% 77% 51% 97% 101% 70%Profits as % of Sales 20% 27% 30% 37% 20% 7%Current Ratio 9:1 7.5:1 4.3:1 4.2:1 2.2:1 1.6:1
4.06 As stated in paragraph 4.05 and evidenced by the results of itsoperations shown in Annex 5, Nangal's operating management was satisfactorythroughout the project period. With ammonia for the CAN plant now beingsupplied from the ammonia unit of the project, and thus free from the severepower shortages of the past, the CAN plant can be expected to operate at closeto capacity. The management and operators working on the expansion facilitynow appear familiar with its technology. In 1978/79 (the first fiscal year ofstabilized production), 95,365 tons of ammonia and 123,343 tons of urea wereproduced, accounting for 32% and 37% capacity utilization in the ammonia andurea plants respectively., The capacity utilization in both plants is expectedto reach 70% in 1979/80, and 90% in 1980/81 and onwards.
4.07 Projections for future operations (1979/80-1989/90) are shown inAnnexes 7 and 8. The projections assume that the electrolysis ammonia plantwould be closed down after 1979/80, and that the CAN plant would be supplied
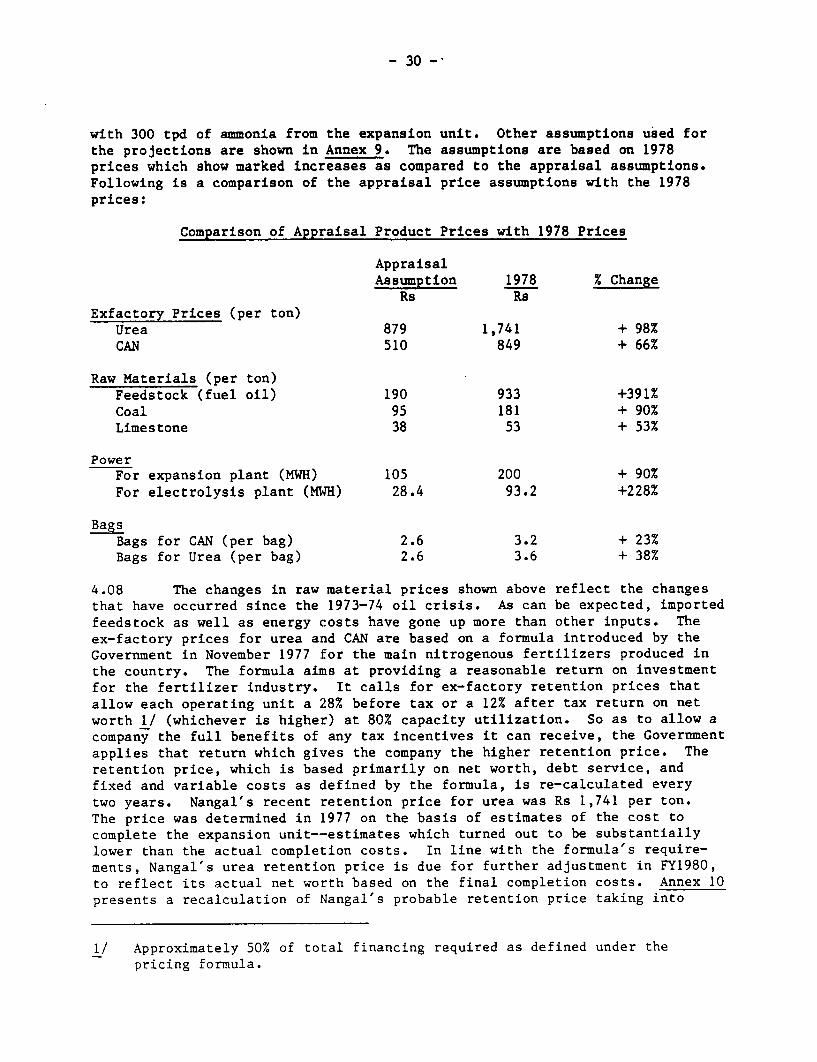
- 30 -
with 300 tpd of ammonia from the expansion unit. Other assumptions used for
the projections are shown in Annex 9. The assumptions are based on 1978prices which show marked increases as compared to the appraisal assumptions.Following is a comparison of the appraisal price assumptions with the 1978prices:
Comparison of Appraisal Product Prices with 1978 Prices
AppraisalAssumption 1978 % Change
Rs RsExfactory Prices (per ton)
Urea 879 1,741 + 98%CAN 510 849 + 66%
Raw Materials (per ton)Feedstock (fuel oil) 190 933 +391%Coal 95 181 + 90%Limestone 38 53 + 53%
PowerFor expansion plant (MWH) 105 200 + 90%For electrolysis plant (MWH) 28.4 93.2 +228%
BagsBags for CAN (per bag) 2.6 3.2 + 23%Bags for Urea (per bag) 2.6 3.6 + 38%
4.08 The changes in raw material prices shown above reflect the changesthat have occurred since the 1973-74 oil crisis. As can be expected, imported
feedstock as well as energy costs have gone up more than other inputs. Theex-factory prices for urea and CAN are based on a formula introduced by the
Government in November 1977 for the main nitrogenous fertilizers produced in
the country. The formula aims at providing a reasonable return on investment
for the fertilizer industry. It calls for ex-factory retention prices that
allow each operating unit a 28% before tax or a 12% after tax return on net
worth 1/ (whichever is higher) at 80% capacity utilization. So as to allow a
company the full benefits of any tax incentives it can receive, the Government
applies that return which gives the company the higher retention price. The
retention price, which is based primarily on net worth, debt service, and
fixed and variable costs as defined by the formula, is re-calculated every
two years. Nangal's recent retention price for urea was Rs 1,741 per ton.
The price was determined in 1977 on the basis of estimates of the cost to
complete the expansion unit--estimates which turned out to be substantially
lower than the actual completion costs. In line with the formula's require-
ments, Nangal's urea retention price is due for further adjustment in FY1980,to reflect its actual net worth based on the final completion costs. Annex 10
presents a recalculation of Nangal's probable retention price taking into
1/ Approximately 50% of total financing required as defined under thepricing formula.

- 31 -
account its net worth, debt service, variable and fixed costs and otherfactors prescribed by the GOI formula. The recalculation shows that Nangal'surea retention price for the next two years would be about Rs 2,250 per ton,an increase of Rs 509 per ton. This compares with Rs 2,130 per ton for NFL'sBhatinda plant and Rs 2,112 per ton for the Panipat plant.
E. Financial Rate of Return
4.09 The re-evaluation of the project's financial rate of return isbased on the fixed investment cost of the project at completion, the forecastoperating cost in 1978 prices and the value of the urea produced by theproject's facilities based on the GOI retention price formula. The re-evaluated financial rate of return is about 18.4% compared to the appraisalestimate of 18.1%. The 1inancial rate of return re-evaluation assumes thatNangal does not pay any taxes as taxes are levied on the parent company'soverall income and NFL is expected to exercise its tax incentives. It alsoassumes that in line with the objective of the retention price formula, Nangalwould reinvest the large cash flow during the initial years of operation ofthe project, since if no reinvestment occurs, the unit's decreasing net worth(as defined by the retention price formula) with decreasing net fixed assetswould reduce the return and thereby also the retention price (and consequentlyrevenues). Details of the financial rate of return re-evaluation are shownin Annexes 11 and 12.
F. Economic Rate of Return
4.10 The economic rate of return was re-evaluated 1/ for both the basecase (i.e., the project without benefits from closing down the electrolyticplant), and the project with benefits from energy savings resulting fromclosing down of the electrolytic plant. The delivered prices of imported ureaand CAN at the plant were used to estimate the benefits from the project'soutput. Capital and maintenance costs were adjusted to remove transfercharges. Tradable raw material inputs were valued at their internationalequivalent or market cost, while the high-sulphur, heavy-ash content coal usedby the plant for generating steam (which is not internationally tradable) wasvalued at 50% the nominal ex-colliery price plus freight and handling toreflect its economic value. The details of the assumptions are shown in Annex9. Details of the rate of return calculations are presented in Annex 13 andsummarized below.
4.11 The base case for the project's economic analysis at appraisalwas the project without closing down the existing power-intensive ammoniaplant. The appraisal economic rate of return for the base case was 14.6%.On the basis of the re-evaluation calculations, the economic rate of returnfor the base case is 11.8%. The decrease in the return is largely due to(a) the increased international prices for fertilizers since appraisal having
1/ On the basis of the Bank commodity price forecasts of August 1978 whichwere prepared before the most recent petroleum price increases.

- 32 -
been offset substantially by the increased capital costs resulting from thedelays in implementation; (b) increased prices for fuel feedstock and otherraw materials; and (c) the foregone added value of the 100,000 tpy of ammoniathat would have to be sold to other fertilizer plants for processing if theexisting electrolytic plant is not closed down. The foregone added value isestimated to be about 40% its CAN equivalent.
4.12 Project with Benefits from Energy Savings: An important objectiveof the project was to enable the closing down of the existing power-intensiveammonia plant. The project, which is based on heavy fuel oil, was designedto enable the closing down of the ammonia section of the existing plant, byfeeding about 100,000 tpy of ammonia to the CAN plant. The replacement ofthe ammonia from the electrolysis plant by equivalent amount from the projectreleases about 149 MW of energy to other users in the area. The opportunitycost for power, based on thermal plants 1/ currently under construction, isestimated to be about Rs 230/MWH. Based on updated costs, the re-evaluatedeconomic rate of return for the project, including the values for the powersavings and the maintenance avoided from closing down the electrolysis plant,is estimated to be about 30.9%. This compares with the appraisal estimateof 22% evaluated on the same basis. The substantial increase in the returnis due to the sharp increase in the opportunity cost of power and the mainte-nance of the electrolytic plant (now 18 years old) avoided by closing itdown. Based on the opportunity cost of power discounted at 10% oppor-tunity cost of capital over the 12 years of the project's economic life, thevalue of the 149 MW released by the existing electrolytic ammonia plant as aresult of the project would amount to about Rs 1.3 billion or about US$155.0million. The associated maintenance cost of the plant, estimated at aneconomic cost of some Rs 18 million per annum, will save the equivalent inpresent value of Rs 72 million (or US$8.6 million) over the same period.
G. Environmental Aspects
4.13 The environmental aspects of the operation are well under controland meet the standards established by the Indian Standards Institution. Noammonia is discharged into the atmosphere. Liquid effluents containing smallamounts of absorbed ammonia are well treated before discharging into theSutlej River. The effluents which require treatment before discharge areammoniacal effluents, occasional hydrogen cyanide (HCN), contaminated carbonslurry, ash in the form of ash slurry and oil spillage. The ammoniacaleffluents from the urea plant and waste water stream from the CO-shift con-version containing 500-1,000 ppm of ammonia are treated with lime slurry toadjust the hydrogen-iron concentration (pH) and are then sent for air strip-ping in a forced draft stripping tower. After stripping, the ammonia contentis reduced to 50-100 ppm and then discharged into the factory sewer andfurther diluted with returned circulation water from both the old and expansionplants before ultimately being discharged into the river. To take care of any
1/ Because of rapidly increasing power demand in Northern India and withno hydro facilities available to satisfy this demand, marginal increases
are being satisfied by more expensive thermal plants.

- 33 -
occasional discharge of ca-rbon slurry containing 50 ppm of H5N from theammonia plant, a carbon slurry pond with a capacity of 22,000 m is available.The carbon slurry effluent is first treated with ferrous sulphate solution toremove the HCN and then is drained to the carbon slurry pond. It is furthertreated by diluting it with returned circulating water before discharging tothe river. Ash disposal in the form of ash slurry from the steam generationplant is pumped to the ash slurry pond near the river where the water, aftersettlement of the ash, is discharged to the river. Oil contaminated drainwater is treated by decantation and subsequent absorption in oil separatorsprovided at different placas in the plants.
H. Employment
4.14 As in many projects in developing countries, the old Nangal facilitywas overstaffed for social reasons. At the time of appraisal, it employedover 3,800 persons, including 1,200 for township and general services. TheNangal Expansion Project has helped reduce the overstaffing problem in the oldplant. Further, partly due to the restructuring of the old FCI, and partlydue to retraining of some existing staff and job realignments, Nangal'scurrent labor force (3,560) is actually less than at the time of appraisal.About a third of the present labor force is employed by the expansion project,a level comparable with similar operations in Asia.
I. Nitrogen Consumption and Supply
4.15 As shown in the table below, while nitrogen consumption and supplyin India have grown since project appraisal, they have not matched theappraisal expectations:
India -- Comparison of Appraisal Estimates of NitrogenConsumption and Supply with Actuals
(in' 000 tons of N)
Appraisal Estimates ActualDomestic Domestic
Consumption Production Imports Consumption Production Imports
1972-73 2,300 1,370 930 1,839 1,054 6651973-74 2,650 1,740 910 1,829 1,050 6591074-75 2,960 2,090 870 1,766 1,186 8841975-76 3,320 2,465 855 1,990 1,535 9961976-77 3,720 3,230 490 2,457 1,857 7501977-78 4,160 3,670 490 2,913 2,000 758
A basic reason for actual consumption not matching projections is believed tobe the impact of the oil crisis on the prices of nitrogenous fertilizers. Thedecline in nitrogen consumption during 1972-73 and 1974-75 was also partially

- 34 -
the result of poor monsoons during those years. Consumption growth in thepast three years has, however, been very strong, averaging 18% per annumcompared to an average 11.7% annual growth forecast at appraisal. With regardto domestic production, while there have been substantial growth from nearly1.1 million tons of nitrogen in 1972-73 to 2.0 million tons in 1977-78, dueto delays in project completion and lower utilization capacity, growth fellshort of appraisal expectations. Annual growth in domestic production overthe last three years has shown substantial improvement as performance ofinstalled capacity has improved and new and larger plants have come on stream.The annual growth in the last three years has averaged 19.3% compared toappraisal estimates of 20.9% over the same period.
J. Nangal's Fertilizer Market
4.16 Nangal's fertilizer market region comprises the northern Indianstates of Punjab, Himachal Pradesh, Haryana, Rajasthan, Jammu and Kashmir,and the Delhi area. Nitrogen consumption has increased in that region by44% during 1972/73 and 1977/78 as shown in the table below:
Consumption of Nitrogen (in '000 tons)
1972-73 1977-78
Appraisal Actual Appraisal Actual
Punjab 253 237 422 320Haryana 94 /a 94 176 /a 150Rajasthan 63 57 132 90Jammu and Kashmir 6 10 17 10Himachal Pradesh 4 4 13 7Delhi area /b. 4 /b 6
420 406 760 583
/a Including Delhi./b Included under Haryana.
Source: NFL
The unit's production has not been enough to meet demand in the area, andhas been supplemented with supplies from other plants and imports. Due tothe continuing deficit in production, Nangal is expected to be able to sellwhatever it can produce even with two new plants (Bhatinda and Panipat)supplying the market area plus the State of Uttar Pradesh.

- 35 -
V. IDA's ROLE
A. Dialogue with Government
5.01 The preparation and appraisal of the Nangal project covered aboutfour years and involved seven IDA missions. The FCI proposal of November 1968for the Nangal fertilizer capacity expansion was one of the first publicsector fertilizer projects to be presented to the Bank. Earlier Bank Groupinvolvement in fertilizer projects through IFC had been limited to privatesector projects. Between 1960 and 1967, the Bank had turned down three GOIrequests for financing public fertilizer projects on grounds of public control,lack of foreign technical participation and unacceptable bidding procedures.It would appear that the inordinate delays during the preparation and appraisalof the Nangal Expansion Project were mainly due to unfamiliarity of the Indianproject authorities with the IDA appraisal requirements, and the insistence ofGOI/FCI to use maximum indigenous inputs without due consideration of experienceand efficiency, on the one: hand, and IDA staff's unfamiliarity, in the prepara-tion stage, with the Indian fertilizer public sector. The unfamiliarity ofboth sides with each other's modus operandi, coupled with the forceful personal-ities, particularly on the: Indian side, resulted unnecessarily in time-consumingdiscussions of issues some of which were not critical to the project design.The issues, positions and time taken to resolve/discuss them have been ade-quately documented in an evaluation of the project's preparation carried outunder OED's supervision in 1974. In some respects, however, the delay inpreparation with its attendant discussions, enabled IDA to assist GOI/FCI indeveloping projects in a more critical way, including rigorous economicanalysis, and to develop a better understanding between IDA and the Indianpublic sector fertilizer units resulting so far in Bank/IDA participation infinancing of eight large operations. IDA involvement in the Nangal projectwas also significant in the following areas: (a) arrangement for engineeringservices, (b) project scope, and (c) project implementation management.
5.02 In the early 1960s, possibly influenced by foreign exchange con-straints which stood in the way of rapid fertilizer capacity build-up, theGOI decided to rely heavily on local engineering services and equipmentsupplies. Beginning in 1964, the Planning and Development (P&D) Division ofFCI, was strengthened to build two fertilizer plants per year based on minimumforeign engineering assistance. The P&D Division acquired process licensesfor various technological areas. The reluctance of several foreign engineeringfirms to part with technology precluded process selection based entirely onmerits. The ammonia plants were engineered with process licenses from differ-ent process licensors for the gasification, purification and ammonia synthesissections. The integration of the various know-hows acquired under licenseinto well-organized ammonia plants appeared to have been beyond the localcapabilities at that time and has been a principal cause in the slow build-upof production and low capacity utilization in the past decade. Initialattempts with two naphtha based units--Cochin I and Durgapur resulted inammonia plants which are yet to operate at desirable levels.

- 36 -
B. Arrangements for Engineering Services
5.03 FCI's proposals of 1968 for the Nangal Expansion project had envis-aged engineering arrangements similar to those used at Cochin and Durgapur.FCI entered into process license arrangements with Shell (the Netherlands) forfuel oil gasification, Lurgi (FRG) for Rectisol gas purification, and Tecnimont(Italy) for ammonia synthesis. P&D Division was to integrate the aboveknow-how and engineer the full ammonia plant. In the background of theexperience at Cochin and Durgapur and the even more complicated nature of theammonia plant when fuel oil instead of naphtha is used, this arrangementwould, in the view of IDA, have resulted in an inadequately engineeredplant. IDA involvement ensured that the overall engineering responsibilityfor the ammonia plant was entrusted to a consortium (Uhde/Lurgi/Topsoe)selected after evaluation of several proposals, which had behind it expe-rience gained in designing and building VEBA Chemie's large fuel oil basedammonia plant in the Federal Republic of Germany, a plant similar to theone proposed for Nangal, while still utilizing P&D Division's engineeringcapabilities for detailed engineering.
C. Project Scope
5.04 Due in part to the long period of project preparation and appraisal,the project scope underwent considerable change. In formulating the originalproject scope, FCI was strongly influenced by two factors: (a) their concernthat in the long run naphtha prices would become substantially higher thanfuel oil prices and, (b) the availability of large surpluses of oxygen fromthe existing facilities at Nangal. The combination of the two factorsfavored a fuel oil based ammonia plant based on enriched air partial oxidation.The existing plant facilities had been well maintained and been operatingat rated capacities. The ammonia plant in FCI's first proposal was, therefore,sized to match the available surplus oxygen--600 tons per day. During 1971and 1972, when the project was under appraisal, the existing Nangal plantsuffered heavy losses in production due to power cuts caused by regionalshortage in power. Both IDA and FCI staff realized that it would not beprudent to link the expansion plant to the surplus oxygen from the existingplant whose operating levels will be affected by power availability. Theeconomics of basing the ammonia plant on enriched air partial oxidation ascompared to a self-contained ammonia plant were also doubtful. FCI, therefore,made a revised proposal which included an independent 600 tpd ammonia plantwhich would have its own captive oxygen plant. At the suggestion of IDAstaff, the ammonia plant capacity was further changed to 900 tpd to obtain thebenefits of the economies of a larger capacity plant. The continued shortageof power and projected estimates of power supply and demand indicated that theexisting facilities may continue to operate only at 60% or below of theircapacities and even then their power would have to be supplied to the plant atwell below its economic cost. The existing downstream facilities would alsooperate at well below their capabilities. IDA staff, therefore, consideredthat the project economics would improve if the electrolytic hydrogen-basedammonia is fully replaced with ammonia from the new partial oxidation plantenabling closing down of the uneconomic electrolytic ammonia plant, whilepermitting the existing downstream CAN plant to continue to operate at ratedcapacity. A final revision of the project scope to include 900 tpd of ammoniaand 1,000 tpd of urea was suggested by IDA and accepted by FCI and GOI.

- 37 -
D. Project Implementation Management
5.05 Another area in which IDA made a substantial contribution was inproject implementation management. The implementation arrangements in the1960's and early '70s in the Indian public sector projects were inadequateto ensure timely and efficient completion of the projects. While the P&DDivision performed the engineering and procurement services for the project,it did not report to nor was accountable to either the Project Manager orFCI's Project Director. As a result of the divided responsibility, co-ordinated project implementation was lacking. In discussions with FCI andGOI, IDA ensured that a competent FCI senior engineer was appointed ProjectManager and was delegated adequate decision-making and coordinating authority(Section 2.03(b) of Project Agreement). The selection of a senior engineerfrom P&D further made project management more effective. In discussions withthe engineering firms for ammonia and urea, P&D Division and the projectgroup, an adequate project reporting system was developed which enabled earlyidentification of problems and resulted in timely action.
E. Lessons Learned
5.06 One occurrence that had a major impact on the project was the oilcrisis of 1973-74 which caused considerable delays in equipment procurement.By its nature, however, no applicable lessons can be derived from the experi-ence. Outside of this, most of the applicable lessons learned in the projecthave been incorporated into subsequent fertilizer projects. The most impor-tant of these related to the transfer of appropriate technology. The problemsencountered in the preparation of this project were largely due to the borrower'sand FCI's desire for a rapid technology transfer without the necessary prepara-tion to effect the transfer. While it is important to recognize the increasingexpertise of local engineering facilities, perhaps of even greater importance,as was recognized in the preparation of this and other subsequent publicsector fertilizer projects, is an adequately engineered plant based on designsand construction of proven expertise. FCI's experience with its Cochin andDurgapur plants relying on integration of various know-hows by local engineer-ing facilities suggests that such an approach, which was originally recommendedby FCI for the Nangal plant, was well avoided.
Industrial Projects DepartmentAugust, 1979

INDIA - NANGAL FERTILIZER EXPANSION PROJECT
INDIA - FERTILIZER PROJECTS FINANCED BY THE BANK GROUP
Amount of MechanicalDate of Bank Group Project Completion Dates Completion
Loan/Credit Financing Capacity Original Current Delay Remarks(US$ Million) ('000 nutrient tons (months)
A. International Finance Corporation
1. 1EL - Kanpur Project 4/67 11.5 200 N 3/70 3/70 Operating at over90% of capacity.
2. Zuari - Coa Project 3/69 18.9 171 N 4/72 6/73 14 Operating at about42 P20 5 85% of capacity.
B. International Development Association
1. FACT - Cochin II Project 7/71 20.0 40 N 3/74 10/76 31 Acid plants opera-114 P20 5 ting satisfactorily.
Complex plant beingstabilized for theremaining one grade(17-17-17).
2. FCI - Gorakhpur Expansion Project 1/72 10.0 51 N 8/74 12/75 16 Commissioned and
operating satis-factorily.
3. FCI - Nangal Expansion Project 2/73 58.0 152 N 8/75 7/77 23 Commissioning tests
began July 77 and waecommissioned Jan. 78.
4. FCI - Trombay IV Project 5/74 50.0'L 75 N 6/77 12/78 13 Mechanically con-75 P205 plated and
cominiaaoned.
5. FCI - Sindri Expansion Project 11/74 91.0 129 N 11/77 2/78 8 Mechanically com-pleted and beingcomesioned.
6. Various Companies - Fertilizer Affected by delaysIndustry Credit 12/75 105.0 222 N 12/78 3/80 16 in project prepar-
31 P205 ation and approvals.
C. International Bank for Reconstruction and Development
1. IFFCO - Phulpur Project 1/75 109.0 228 N 10/78 8/79 10 Progressing setts-factorily afterinitial delay ofone year caused bychange in feedstock.
/a Includes US$17.0 million for Plant Operation Improvement Project (POIP).
Industrial Projects DepartmentJuly 1979

- 39 -
AM=E 2
nuDIA - fAWAL FERTLIZE E[PANSION PRDJECT
Capacity Utilization of Nitrogenous Fertilizer Plants in Operation Prior to 1978'1
- (Percent)
Fiscal Tear Ending March 31
Unit 71 72 73 74 75 76 77 78 79 83 -
A. Private Sector Est. Proj.
SCI Kota 102 98 116 100 66 72 79 79 76 90IEL Kanpur 54 64 78 58 96 89 94 98 93 95Zuari Goa - - - 37 79 66 72 85 88 95CFLVizag 76 81 74 68 59 60 80 73 81 90
Total Private Sector 71 76 86 61 76 74 80 86 77 93
B. Joint Sector
HFL Madras - 51 64 76 51 88 78 77 92 90GSFC Baroda 69 86 94 76 74 73 80 81 77 85SPIC Tuticorin - - - - - 50 66 71 56 90MCFL Mangalore - - - - - - 64 60 76 90
Total Joint Sector 69 76 81 76 64 71 69 73 73 89
C. Cooperative Sector
IFFCO Kalol - - - - 17 54 74 95 108 90
D. Public Sector
FCI Plants (Ave.) 71 79 78 68 67 77 79 63 65 90FCI Sindri 73 81 73 79 77 67 47 10 53 - /3
Nangal 68 70 67 77 51 97 101 69 88 - /3Trombay 64 82 86 80 84 98 126 106 106 95Gorakhpur 85 95 86 80 91 72 85 64 67 90Namrup 64 69 80 82 91 102 104 100 88 100Durgapur - - - 10 10 24 30 34 25 75Barauni - - - - - - 66 50 35 90Narup Exp. - - - - - - 70 72 49 90
FACT - Udyogamandal 47 49 38 48 46 55 52 61 62 50Cochin I & II - - - 9 26 44 53 49 - 80
SAIL - Rourekela 20 39 41 38 51 64 67 60 57 80NLC - Neyveli 46 29 30 21 24 39 61 59 54 80
Total Public Sector 58 64 62 49 49 61 69 64 52 83
TOTAL INDUSTRY 63 70 74 58 60 70 73 74 72 87
/1 Capacity utilization has been calculated based on available capacity in each yearallowing for commissioning date, capacity levels of 50% and 75% in the first andsecond year after commissioning, and adjusting for industrial nitrogen products.
/2 Expected capacity utilization level taking into account schemes under implementation.
/3 Plants will be shut down with the commissioning of the Sindri Modernization and NangalExpansion Projects.
Industrial Projects DepartmentJuly 1979

INDIA - NAGAL FERTILIZER EXPANSION PROJECTPROJECT IMPLEMENTATION SCHEDULE - APPRAISAL VS ACTUAL
1973 1974 1975 .11976 1977 SC 8
J FMAAlIJ JIA SON DiF M A MAJAi SONDJ FMNlA MAJAiSODN DJ fIM AMAlIJ AISIO ND JF MAM JJ ASO ND JFM AM J JASO ND
PROCESS DESIGN ANDDEATAILED ENGINEERING
EQUIPMENT ANDMATERIALS
PROCUREMENT as go alst s a ss ass
EQUIPMENT AND
aammma mmmm amamamMAPPRIALin
CIVILWORKS
EQUIPMENT mam..mmmm.aERECTION
m 114 1 s .. fs fo sIIa splo I
TESTING AND a
APPRAISALsu m mm
ACTUAL agiss elf s
World Bmk - 19i56I.dustrial Pro1 ect DepartmentJanuary 1979

- 41 -
ANNEX 4
INDIA - NANGAL FERTILIZER EXPANSION PROJECT'
SOURCES OF SUPPLY
Country US$ Equivalent (in 000s) % of Credit Amount
Germany (FRG) 24,615 42.4%India 20,074 34.6%Italy 4,904 8.4%United Kingdom 2,767 4.8%Japan 2,145 3.7%Austria 868 1.5%United States 743 1.3%France 607 1.0%Switzerland 523 0.9%Sweden 381 0.7%Netherlands 267 0.5%Belgium 106 0.2%
Total 58.000 100.00% /1
/1 Rounded
DISBURSEMENTS BY CURRENCIES (in 000s)
Rate of US$Amount Exchange As Equivalent
Currency Disbursed of 12/31/78 As of 12/31/78(US$ Equivalent)
U.S. Dollars 25,408 1.00 25,408Canadian Dollars 7,580 1.186 6,391Australian Dollar 41 1.1505 36Belgian Francs 10 28.80 -Danish Kroner 1,664 5.09 327French Francs 1,410 4.18 337
Netherland Guilders 2,638 1.969 1,340Pound Sterling 8,487 0.49 17,320Finnish Markkaa 736 3.926 187Australian Schillings 2,209 13.3675 165Swedish Kroner 3,019 4.2955 703Swiss Francs 114 1.6175 70Norwegian Kroner 1,233 5.0225 245Yugoslav Dinars 19 18.6112 -Italian Lira 1,572 829.75 2Japanese Yen 2,162 194.60 11Kuwaiti Dinars 219 3.68 60
52,601
Industrial Projects DepartmentJuly 1979

42ANNEX 5
INDIA - NANGAL FERTILIZER EXPANSION PROJECT
FCI - INCOME STATEMENTS (1972r-77)(in Rs millions)
(Year ending March 31)
1972-73 1973-74 1974-75 1975-76 1976-77
Sales Revenue (Net) 959.3 1,203.4 1,690.5 1,826.1 2,480.6
Cost of Operations
Purchased Finished Goods 74.6 244.3 275.9 225.7 440.1Materials Consumed 295.3 338.6 587.0 754.5 832.2Repairs and Maintenance 73.0 74.0 109.8 148.7 198.1Salaries, Wages & Bonus 125.6 159.8 210.6 252.5 273.5Power and Fuel 116.5 134.7 155.1 272.1 399.8Freight and Handling 26.8 22.1 32.5 51.3 80.0Excise Duty 69.6 73.1 92.3 150.4 191.1Royalties 0.6 0.6 0.9 0.8 0.5Other Expenses (nettedagainst other income) (21.9) (32.5) 33.5 143.1 43.2
Depreciation 111.6 118.7 153.4 164.1 236.0
Total Cost of Operations 871.7 1,133.4 1,651.0 2,163.2 2,694.5
Profits (Loss) on Operations 87.6 70.0 39.5 (337.1) (213.9)
Interest (Net) (33.5) (24.4) (26.7) (50.1) (118.6)
Net Profits (Loss) 54.1 45.6 12.8 (387.2) (332.5)
Profits on Operations as% of Sales 9% 5.8% 2.3% (18.4%) (5%)
Net Profits (Loss) as% of Sales 5.6% 3.8% 1% (21.2%) (13.4%)
Source: FCI
Industrial Projects DepartmentJuly 1979

-43 - ANNEX 6
INDIA - NANGAL FERTUIlZER EXPANSION PROJECT
PCI - BALANCE SHEET STATEHENTS (1972-77)(in Rs millions)
(Year ending March 31) 1972-73 1973-74 1974-75 1975-76 1976-77
ASSETS
Current Assets
Raw Materials and Supplies 281.2 365.8 526.1 731.6 942.3Accounts Receivable 70.1 97,0 133.7 154.7 248.3Loans and Advances 58.4 70.9 116.7 151.6 152.4Cash and Bank Balance 34.4 64.3 22.6 27.4 142.3
Sub-Total: Current Assets 444.1 598.0 - 799.1 1,065.3 1,485.3
Gross Fixed Assets atBeginning of Year 2,194.0 2,361.2 3,599.8 3,958.8 4,951.9
Less Accumulated Depr. 1,190.0 1,356.9 1,520.8 1,704.9 1,951.6
Net Fixed Assets 1,004.0 1,004.3 2,079.0 2,253.9 3,000.3Work in Progress 1,943.8 2,722.1 3,096.7 4,239.9 5,390.0
Gross Fixed Assets atYear End 2,947.8 3,726.4 5,175.7 6,493.8 8,391.2
Advances to Contractorsand Suppliers 623.3 738.5 789.3 1,374.8 1,483.2
TOTAL ASSETS 45 5.62.9 6 L 2 11alULZ
LIABILITIES
Current Liabilities
Accounts Payable 200.1 31.8 95.3 69.3 67.5Trade Deposits and Depo-
sits from Contractors 74.7 64.6 83.1 126.7 187.2Current Portion of Long-
Term Debt 166.9 217.6 254.0 269.9 435.1Other Current Liabilities 62.3 403.8 552.5 429.9 539.5
Sub-Total: Current Liabil. 504.0 717.8 984.9 895.8 1,229.3
Long-Term Debt
GOI 839.0 804.8 1,234.7 2,355.7 4,215.0State Bank of India 128.0 126.4 5.9 269.2 -USAID 77.4 59.2 36.2 14.3 -Others 503.0 517.7 468.9 372.1 285.6
Total Long-Term Debt 1,547.4 1,488.1 1,745.7 3,011.3 4,500.6Less: Current Portion 166.9 217.6 254.0 269.9 435.1
Long-Term Debt (Net) 1,380.5 1,270.5 1,491.7 2,741.4 4,065.5
Share Capital & Reserves
Share Capital 1,984.1 2,906.2 4,126.4 5,287.5 6,055.8Reserves 182.6 168.4 161.1 9.2 9.1
Sub-Total: Share Capital &Reserves 2,166.7 3,074.6 64287.5 5.296.7 6,064.9
TOTAL LIABILITIES 41251.2 5062.9 6,764.1 8933.9 11359.7
Industrial Projects DepartmentJuly 1979

-44-
ANNEX 7
INDIA - NANGAL FERTILIZER E[PANSION PROJECT
NANGAL UNIT - INCOME STATEMENTS DURING PROJECT IMPLEMENTATION PERIOD (1973-78)(Ra millions)
(Year ending March 31) .-------- -- ACTUAL - - -------- ------
NANGAL I - Old Plant 1972-73 1973-74 1974-75 1975-76 1976-77 1977-78
CAN. PLANT (tpy)
Installed Capacity - - - - - - - - - - 318,160 - - - - - - - - - - - - - - -Actual Production 213,502 246,350 160,986 308,656 320,077 221,088Production as percentage
of Rated Capacity 67% 77% 51% 97% 101% 69%
(Rs millions)
Sales Revenue 133.74 159.74 168.17 264.35 346.66 466.21
Cost of Operations
Purchased Finished Goods - 3.20 19.25 - 23.85 206.23Raw Materials Consumed 19.21 18.32 15.20 36.32 74.03 82.84Salaries and Wages 15.30 18.28 21.96 25.16 25.01 32.68Electricity 25.82 30.06 18.88 37.10 78.62 49.03Freight and Handling 3.81 4.94 3.85 8.43 10.06 6.91Excise Duty & TransferPayments 15.11 18.12 15.41 30.25 34.61 23.67Repairs and Maintenance 12.47 14.40 13.42 18.21 20.43 18.61Depreciation 4.87 4.47 4.46 4.74 4.63 4.67Central Office Expense 1.91 2.71 1.94 3.07 4.08 7.38Interest on Short-TermLoans - - - - - -
Other Expenses (nettedagainst other income) 0.24 1.62 2.70 2.09 1.70 2.87
Total Cost of Goods Sold 98.74 116.10 117.07 165.37 277.02 434.89
Profits on Operations 35.00 43.63 51.10 98.94 69.64 31.32
Interest Payable on L-T Debt - - - - - -
Net Profits 35.00 43.63 51.10 98.94 69.64 31.32L!
/1 Because of the transfer of Nangal from FCI to NFL, Nangal is expected to make adjust-ment for accrued leave and gratuity earned by its staff while part of FCI, on a cashbasis, to the 1977-78 income. This adjustment is expected to result in a loss on thatyear's operations.
Source: Nangal Unit
Industrial Projects DepartmentJuly 1979

- 45 -
ANNEX 8
INDIA - NANGAL FERTILIZER EXPANSION PROJECT
NANGAL - BALANCE SHEETS DURING PROJECT IMPLEMENTATION PERIOD (1973-78)
(Ra/million)
Year Ending March 31 1972-73 1973-74 1974-75 1975-76 1976-77 1977-78
ASSETS7-
- Fixed Assets 336.97 346.29 412.60 735.33 1,271.17 1,434.44- Additions during the year 9.32 66.31 322.73 535.84 163.28 229.04- Gross Fixed Assets 346.29 412.60 735.33 1,271.17 1,434.45 1,663.48- Less Accumulated Depreciation 260.85 264.29 268.81 274.14 279.58 285.07- Net Fixed Assets 85.44 148.31 466.52 997.03 1,154.87 1,378.41
CURRENT ASSETS LOANS & ADVANCES
- Current Assets:- Finished Goods Inventory 0.36 0.27 0.44 6.31 3.92 5.14- Raw Material Inventory 0.31 0.38 0.57 0.34 0.25 1.70- Spares & Loose Tools. 23.24 23.16 25.04 27.60 25.03 26.01- Accounts Receivable 5.69 4.16 6.41 21.76 24.32 25.84- Operating Cash 0.07 0.08 1.72 13.45 1.32 0.04- Remittances 394.32 453.43 489.26 198.82 219.15 116.47
423.99 481.48 523.44 268.28 273.99 175.00- Loans & Advances:
- Advances recoverable in cashor in kind or for value tobe received. 2.61 3.30 5.11 4.57 4.77 10.12
Sub-total 426.60 484.78 528.55 272.85 278.76 185.32
TOTAL ASSETS 512.04 633.09 995.07 1,269.88 1,433.63 1,563.73
SHARE CAPITAL & LIABILITIES
- Share Capital 220.64 284.64 533.45 771.86 811.86 868.30- Reserve Fund 238.33 280.66 331.56 430.38 487.9!' 0.71
Long-Term Debts
- Secured Loan 0.34 3.24 0.01 - 6.52 -- Unsecured Loan/Deferred Credits 5.42 - 5.86 3.66 - 576.10
Qurrent Liabilities
- Current Liabilities 47.31 64.55 124.19 64.84 127.26 118.62
.TOTAL LIABILITIES 512.04- 633.09 995.07 1,269.88 1,433.63 1,563.73
Source: Nangal Unit
Industrial Projects Department
July 1979
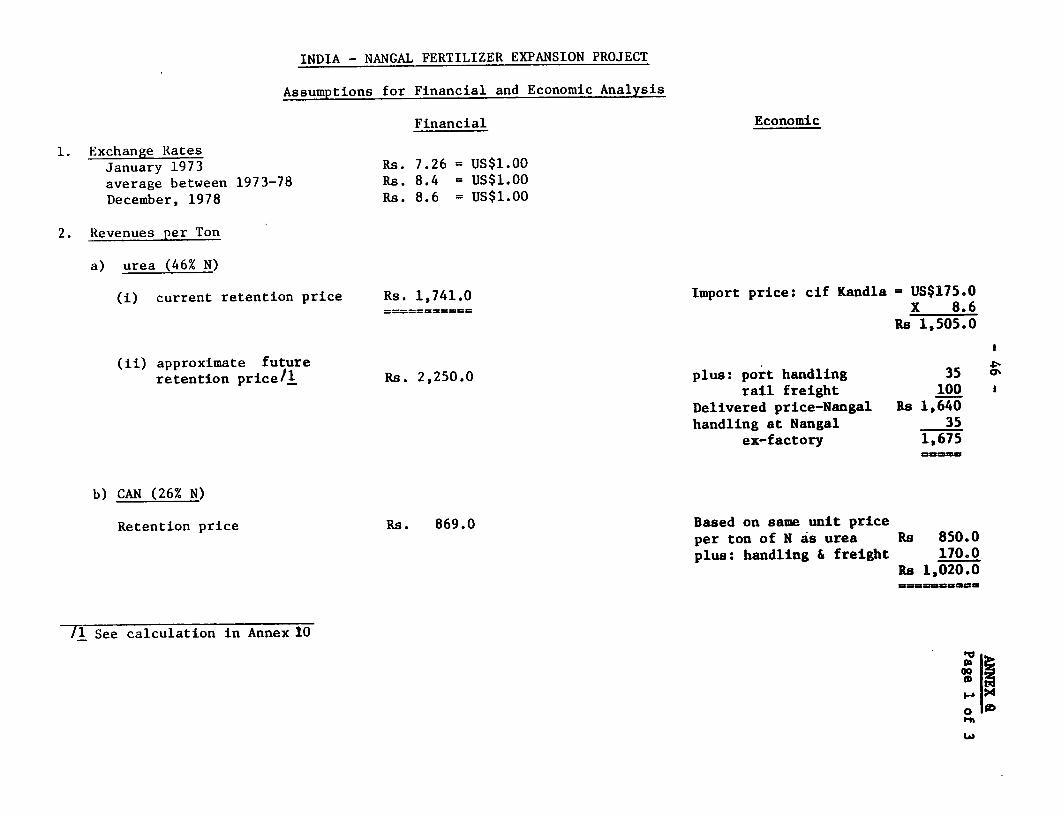
INDIA - NANGAL FERTILIZER EXPANSION PROJECT
Assumptions for Financial and Economic Analysis
Financial Economic
1. Exchange RatesJanuary 1973 Rs. 7.26 = US$1.00
average between 1973-78 Rs. 8.4 = US$1.00December, 1978 Rs. 8.6 = US$1.00
2. Revenues per Ton
a) urea (46% N)
(i) current retention price Rs. 1,741.0 Import price: cif Kandla US$175.0X 8.6
Rs 1,505.0
retention price/1 Rs. 2,250.0 plus: port handling 35rail freight 100
Delivered price-Nangal Rs 1,640
handling at Nangal 35ex-factory 1,675
b) CAN (26% N)
Retention price Rs. 869.0 Based on same unit price
per ton of N as urea Rs 850.0
plus: handling & freight 170.0Rs 1,020.0
/1 See calculation in Annex 10
00

3. Costs Opportunity Cost Ra 230.0/MWH
c) Power
i) Electrolysis Plant Annual plant requirementRate up to 98 MW Rs 58.59/MHW at full capacity 149 Mplus: generation duty 20.00 X 360 days
78.59 X 24 bra.plus: 25% electr. duty 14.65 1,287,360X Re 230
Rs 93.24/MWH Annual opportunity cost Rs 296 million
Rate > 98 NW 68.59/MWHplus: generation duty 20.00
88.59plus: 25% 'electr. duty 22.15
110.74
ii) Expansion Plant Contracted annual powerRate Rs 140.80/MWH requirements 20 MWplus: gener. duty 20.00 1 360 days
160.80 X 24 bra.plus: 25% electr. duty 40.20 172,800
201.00 X Re230Rs 39.7 million
d) Maintenance
i) Old PlantElectrolysis Plant only Rs 20.0 million Financial costs less 5% sales tax, less
30% duty on assumed 20% foreign contentof maintenance materialsFin. Cost Ra 20.0 millionless: 5% 1.0 million
19.0 millionless: 30% duty on20% foreign content 1.14
Ri 17.86 millioemmmman

e) Raw Materials
Feedstock - heavy fuel oilex-refinery Rs. 722.83/ton ex-refinery 722.83
Sale and other taxes 45.22 freight & handling 164.00
Freight 161.00 886.83
Handling 3.00Rs. 932.05
Coal - ex-colliery Rs. 64.80 ex-colliery 49.0/1
freight 92.00 freight 92.0welfare 2.00 handling charges 4.25handling charges 4.25 145.25
Rs 163.05
f) Other Expenses Market Costs Market Costsless: sales tax (5%)
/1 The coal used for generating steam at Nangal is of a high sulphur and ash content and is not inter-nationally tradeable. As in the original appraisal report, the economic price is based on evaluationof inputs required to produce the additional amounts of coal at the social costs. For this purpose,50% of the ex-colliery price is estimated to be the unskilled labor content, and therefore is pricedat 50% of the nominal wage.
Industrial Projects DepartmentJuly 1979
P3

-49-
ANX 1
Page 1 of 2
INDIA - NANGAL FERTILIZER EXPANSION PROJECT
Recalculation of Nangal's Urea Retention Price
Rs million
i) Estimated net fixed assets at March 31, 1979 1,341.0 /1less: estimated non-urea producing assets 350.0 /2
991.0ii) add 4 months working capital employed in
urea production 60.0 /1iii) total capital employed in urea productioniv) less: outstanding long-term debt associated
with urea production 533.0 /3v) total net worth used in urea production 518.0
vi) 28% (before tax) return on net worth usedin urea production X .28
145.0vii) add: interest on long-term debt associated
with urea production 56.0 /4viii) add: estimated worker's bonus 10.0
ix) (a) variable cost associated withurea production at 80% capacity 208.0 /5
(b) fixed cost associated with ureaproduction at 80% capacity 185.0 /6
x) Sum of vi) thru ix) = fair ex-factoryrealization to Nangal of urea Rs. 594.0 million
xi) divided by production volumeof urea at 80% capacity (330,000 X .8) 264,000 tons
xii) Nangal's probable retention pricefor urea beginning April 1, 1979 Rs. 2,250 ton
less price until March 31, 1979 1,741.0additional benefits per ton 509.0
additional annual3 benefits (Rs 509.0 X 297,000 tpy) Rs. 151.2 million
/1 Estimates from Nangal unit.
/2 Township, CAN plant, and one-third of project ammonia unit based onproportion of ammontia supplied to CAN plant.
/3 In consideration for the transfer of Nangal unit from FCI to NFL, GOTrequired NFL to issue equity shares amounting to Rs 715 million and toaccept a long-term obligation of Rs 576 million payable over 10 yearsat 10.5% with one year's grace. NFL has transferred this debt toNangal. The estimate above is that portion of the debt estimated tobe associated with urea production.
/A Interest on item iv) on terms indicated in Footnote 3.

- 50 -
ANNEX 10Page 2
/5 Based on cost of goods sold estimates for 1980 shown in Annex 9and adjusted for 80% urea production and only two-thirds of ammoniaproduction transferred to urea unit:
Rs millions
Fuel Oil 24.0Heavy Stock Fuel 121.0Coal 36.0Consumable Stores 5.0Bags 22.0
Total Estimated Variable Costs 208.0
/6 Based on .operating expenses estimates (fixed costs) for 1980 shown inAnnex 9, but excluding interest on short-term borrowing, taxes andduties. Proportion of depreciation unrelated to urea production(26% as per ratio in net fixed assets) has also been excluded; onlytwo-thirds of maintenace materials and salaries, respectively, wereincluded in fixed costs (based on the ratio of ammonia productiontransferred into urea production).
Industrial Projects DepartmentJuly 1979

INDIA - MANGAL FERTILIZER EXPANSION PROJECT
NANGAL - INCOME STATEMENT FORECAST(Rs Millions)
PRODUCTION
Urea (tons) 123,343 229,500 297,000 297,000 297,000 2S7,000 297,000 297,000 297,000 297,000 297,000 -297,000As % of rated capacity 61 70 90 90 90 90 90 90 90 90 90 90CAN (tons) 151,720 286,000 286,000 286,000 286,000 286,000 286,000 286,000 286,000 286,000 286,000 286,000As % of rated capacity 95 90 90 90 90 90 90 90 90 90 90 90Sales 344 643 760 760 760 760 760 760 760 760 760 760
COST OF GOODS SOLD
Limestone and soap stone 2 4 4 4 4 4 4 4 4 4 4 4Fuel Oil 13 27 27 27 27 27 27 27 27 27 27 27Heavy Stoca 11 157 203 203 203 203 203 203 203 203 203 203Coal 23 36 41 41 41 41 41 41 41 41 41 41 1Consumable Stores 7 11 11 11 11 11 11 11 11 11 11 11Bags 13 37 40 40 40 40 40 40 40 40 40 40
Sub-total: Cost of Goods Sold 171 272 326 326 326 326 326 326 326 326 326 326
Gross Profit 173 371 434 434 434 434 434 434 434 434 434 434
OPERATING EXPENSES
?ower / 57 39 39 39 39 39 39 39 39 39 39 39Salaries, Wages & Benefits 18 39 41 43 45 47 50 52 55 57 59 62Maintenance Materials 16 33 34 36 38 40 42 44 46 48 51 53Selling & Admn. Expenses 2 5 5 5 5 5 5 6 6 6 7 7Taxes and Duties 5 9 9 9 9 9 9 9 9 9 9 9Interest on short-term Borrowings 9 17 17 17 17 17 17 17 17 17 17 17Depreciation 63 126 126 126 126 126 126 126 126 126 126 126
Sub-tucal Operating Expenses 170 268 271 275 279 283 288 293 298 302 308 313
Operating Profit (-) 3 103 163 159 155 151 146 141 136 132 126 121Interect on long-term Debts 29 52 46 41 35 29 23 17 12 6 1 -
Net Income - (-) (26) 51 17 118 120 lt 123 124 124 126 125 121
-- PdowerRs. 38 million for the electrolysis plant.
Industril Projects DepartmentJuly 1979

INDIA - NANGAL FERTILIZER EXPANSION PROJECT
Re-Evaluaton of the Financial Rate of Return
(in Ra millions in 1978 terms)
1974 1975 1976 1977 1978 1979 1980 1981 1982 1983 1984 1985 1986 1987 1988 1989 1990Benefits
Current Retention Price - - - - - 344 643 760 760 760 760 760 760 760 760 760 760Rs. 1741/ton for Urea& Rs. 849/ton for CanAdditional benefits withadjustment of Urea reten-
tion price to Rs. 22 50/ton - - - - - - 117 151 151 151 151 151 151 151 151 151 151
Total Benefits withadjusted retentionprice for urea 344 760 911 911 911 911 911 911 911 911 911 911
Costs
Fixed Investment Cost 67 246 564 115 159 11 - - - - - - - - - -
Working Capital - - - - - 15 - - - - - - - - - - (15PCosts of Goods Sold - - - - - 171 272 326 326 326 326 326 326 326 326 326 326 1Other Operating Costs - - - - - 107 142 145 149 153 157 162 167 172 176 182 187
67 246 564 115 159 304 414 471 475 479 483 488 493 498 502 508 498Net Benefitwith CurrentRetention Price for Urea (67) (246) (564) (115) (159) 40 229 289 285 281 277 272 267 262 258 252 262Net Benefits with adjusted
urea retention price (67) (246) (564) (115) (159) 40 346 440 436 432 428 423 418 413 409 403 413
Internal Rate of Return 4 Appraisal: 18.1%Internal Rate of Return with Current retention price: 12.1%Internal rate of Return with adjusted retention price: 18.4%
Industrial Projects DepartmentJuly 1979

INDIA - NANCAL FERTILIZER EXPANSION PROJECT
RE-EVALUATION OF ECONOMIC RATE OF RETURN(in Rs millionO)
1974 1975 1976 1977 1978 1979 1980 1981 1982 1983 1984 1985 1986 1987 1988 1989 1990
Production (in '000s)
- Urea - - - - - 123 230 297 297 297 297 297 297 297 297 297 297- Can - - - - - 152 286 286 286 286 286 286 286 286 286 286 286
Benefits (in Rs. Millions)- Urea - - - - - 207 384 498 498 498 498 498 498 498 498 498 498- Can - - - - - 155 292 292 292 292 292 292 292 292 292 292 292
Savings from Closing DownElectrulysis Piant
Savings from release of
149 MW of energy - - - - - 157 296 296 296 296 296 296 296 296 296 296 296Savings from Avoidance ofMaintenance of ElectrolysisPlant - - - - - - 18 18 18 18 18 18 18 18 18 18 18
Total Benefits 519 990 1,104 1,104 1,104 1,104 1,104 1,104 1,104 1,104 1,104 1,104
Costs
Fixed Cost Investment 56 220 448 115 159 11 (15.0)Working Capital - - - - - 15Operating Costs:
- Feedstock - heavy fuel - - - - - 80 149 193 193 193 193 193 193 193 193 193 193- Coal - - - - - 18 37 37 37 37 37 37 37 37 37 37 37- Other Raw Material Imports - - - - - 31 78 78 78 78 78 78 78 78 78 78 78- Power - - - - - 40 40 40 40 40 40 40 40 40 40 40 40- Other Operating Expenses - - - - - 39 82 85 88 92 96 101 105 110 114 120 124
Total Costs 56 220 448 115 159 234 386 433 436 440 -444 449 454 459 463 469 457
Net Benefits (56) (220) (448) (115) (159) 285 604 671 668 664 660 644 650 645 641 635 647
Economic Rate of Return excluding benefits from closing electrolysis plant * 11.5%Economic Rate of Return including benefits from closing electrolysis plant = 30.8%Appraisal estimate of economic rate of return excluding benefits from electrolysis plant = 14.6%Appraisal estimate of economic rate of return including benefits from electrolysis plant 22%
industiial Projects DepartmentJuly 1979