world agriculture vol.3 no.2 (winter 2012)
DESCRIPTION
Independent, unbiased assessments of the impact of new technology, population and climate change on agriculture.TRANSCRIPT

Front 18/12/12 15:42 Page 1

WORLD AGRICULTURE
editors
PatronSir Crispin TickellGCMG, KCVO ChairmanProfessor Sir Colin SpeddingCBE, MSc, PhD, DSc, CBiol, Hon FSB, FRASE, FIHort, FRAgS, FRSA,Hon Assoc RCVS, Hon DSc (Reading). AgriculturalistDeputy Chairman & EditorDr David FrapeBSc, PhD, PG Dip Agric, CBiol, FSB, FRCPath, RNutr Mammalian physiologistEmail: [email protected] EditorsRobert Cook (UK), BSc, CBiol, FSB. Plant pathologist and agronomistDr Ben Aldiss (UK) BSc, PhD, CBiol, MSB, FRES, QTS. Ecologist, entomologist and educationalistMembers of the Editorial BoardProfessor Pramod Kumar Aggarwal (India)BSc, MSc, PhD (India), PhD (Netherlands), FNAAS (India), FNASc.Crop ecologistProfessor Phil Brookes (UK)BSc, PhD, DSc.Soil microbial ecologistProfessor Andrew Challinor (UK)BSc, PhD.Agricultural meteorologist Professor Peter Gregory (UK)BSc, PhD, CBiol, FSB, FRASE.Soil ScientistProfessor J. Perry Gustafson (USA)BSc, MS, PhD.Plant geneticistProfessor Sir Brian Heap (UK)CBE, BSc, MA, PhD, ScD, FSB, FRSC, FRAgS, FRS.Animal physiologistProfessor Paul Jarvis (UK)FRS, FRSE, FRSwedish Soc. Agric. & Forestry.SilviculturalistProfessor Glen M. MacDonald (USA)BA, MSc, PhD.GeographerProfessor Sir John Marsh (UK)CBE, MA, PG Dip Ag Econ, CBiol, FSB, FRASE, FRAgS (UK).Agricultural economistProfessor Ian McConnell (UK)BVMS, MRVS, MA, PhD, FRCPath, FRSE.Animal immunologist Professor Denis J Murphy (UK)BA, DPhil.Crop biotechnologistDr Christie Peacock (UK) BSc, PhD, FRSA, FRAgS, Hon. DSc, FSB.Tropical agriculturalistProfessor RH Richards (UK)CBE, MA, Vet MB, PhD, CBiol, FSB., FRSM, MRCVS, FRAgS (UK).AquaculturalistProfessor Neil C. Turner (Australia)FTSE, FAIAST, FNAAS (India), BSc, PhD, DSc.Crop physiologistDr Roger Turner (UK)BSc, PhD.Plant physiologist and Agronomist Professor John Snape (UK)BSc, PhD.Crop geneticist
Advisor to the boardDr John Bingham (UK)CBE, FRS, FRASE, ScD.Crop geneticist
World Agriculture Editorial Board
Published by Script Media,47 Church Street,
Barnsley, South Yorkshire S70 2AS, UK
Editorial AssistantsDr Philip Taylor BSc, MSc, PhD.Ms Sofie Aldiss BSc.Michael J.C. Crouch BSc MSc (Res).Rob Coleman BSc, MSc.
Inside front 24/12/12 10:25 Page 1

WORLD AGRICULTURE 1
looking ahead
World Agriculture: potential future articles
Published by Script Media,
47 Church Street, Barnsley, South Yorkshire S70 2AS
� Jonathan Shepherd Aquaculture, 2. – Are the criticisms justified?
� Professor Wallace Cowling Revitalising plant breeding through
genetics and genomics.
� Dr Matthew Gilliham, Richard James, Mark Tester,Michael Gilbert, Stuart Roy
The economic and social benefits of introducing and breeding for salt
tolerant traits in crops.
� Dr A. BationoAfrican soils, their productivity and
profitability of fertilizer use.
� Penelope Bebeli Genetic pollution of landraces.
� Dr Michael Turner Seed policies in guiding
seed sector development in the ‘post project era’.
� Dr Helen Wallace What role for GM crops in world agriculture?
An area of dry saline soil in Kazakhstan.
43 18/12/12 15:22 Page 1
SubscriptionsI wish to receive 4 issues of World Agriculture and any supplementary productsfrom the date of this order (unless back issues are specified)
UK Subscription £20 for 2 issuesAbroad Subscription £25 for 2 issuesI wish to receive World Agriculture products.Date ........................................................................................................Name ........................................................................................................Job title ....................................................................................................Do you have purchasing authority? Yes �� No ��
If not, which individual within your organisation is responsible forpurchasing?................................................................................................................
Company/Organisation Name ..................................................................Delivery address (Business address preferred) ........................................................................................................................................................................
.................................................................................................................
.Postcode ..................................................................................................Tel ............................................................................................................Fax ............................................................................................................Email Address ..........................................................................................Web Address ..........................................................................................Number of Employees ………………..….… Annual turnover ………………………………Business activity ......................................................................................Products/Services: ..................................................................................
From time to time Script Media Group and its affiliated companies may use this data. Approved third partiesmay also be given access to this information for marketing purposes. If you prefer not to receive furthermailings from third parties please tick this box. ��
Please make cheques payable to Script Media Group Ltd
INVOICE ADDRESS (if different from delivery address)Name ......................................................................................Company/Organisation Name ................................................................................................................................................
Delivery address (Business address preferred) ........................................................................................................................................................................................................................................................................................................................................
Postcode..................................................................................
Telephone ................................................................................Fax ..........................................................................................
Card number _ _ _ _ / _ _ _ _ / _ _ _ _ / _ _ _ _ Start Date _ _/_ _ Expires _ _ / _ _
Issue No. _ _ (switch only) ..............................................................
Authorised signature.................................................................
CARDHOLDER’S ADDRESS (if different from above)
................................................................................................
................................................................................................
................................................................................................
Please send your completed form to:Circulation Department Script Media Group Ltd 47 Church Street, Barnsley South Yorkshire, S70 2AS
Please see the web site – www.world-agriculture.net for details of web access to the journalPlease see the web site – www.world-agriculture.net for details of web access to the journal
02 24/12/12 10:32 Page 1

WORLD AGRICULTURE 3
contents
Editorials:� Whither Technology. 5
Robert Cook
� Economics of GM crops in developing and developed economies. 6-7 Professor Sir John Marsh
� Targeting good agricultural advice to where it is really needed. 8Professor Denis Murphy
� Why is it still impossible to hold a worthwhile debate over the criticisms ofbiotechnology in agriculture? 9-10
David Frape
Scientific:� Aquaculture: are the criticisms justified? Feeding fish to fish. 11-18
Dr Jonathan Shepherd
Economic & Social:� GM crops, developing countries and food security. 19-22
Dr Francisco José Areal, Dr Paura Riesgo and Dr Emilio Rodriguez-Cerezo
� Land degradation and the rural poor. 23-28Professor Edward B. Barbier
� Uganda Agrochemical dealers’ practises and interactions with farmers. 29-33
Julien Lamontagne-Godwin, P. Taylor
Comment & Opinion:� The global environmental and economic impact of biotech crops 1996-2010. 34-39
Graham Brookes and Peter Barfoot
Instructions to contributors 40-41
Potential future articles 1
Publisher’s Disclaimer No responsibility is assumed by the Publisherfor any injury and/or damage to persons orproperty as a matter of products liability,negligence or otherwise or from any use oroperation of any methods, products,instructions or ideas contained in thematerial herein. Although all advertisingmaterial is expected to conform to ethicalstandards, inclusion in this publication doesnot constitute a guarantee, or endorsementof the quality or value of such product bythe Publisher, or of the claims made by themanufacturer.
In this Issue ...
World Agriculture Editor givenprestigious Chinese AwardWINTHROP ProfessorNeil Turner, from TheUniversity of WesternAustralia's Institute ofAgriculture was awardedthe People's Republic ofChina's highest awardfor "foreign experts whohave made outstandingcontributions to thecountry's economic andsocial progress".Professor Turner wasgiven this Friendship
Award by the Chinesecentral government forhis contribution to theeconomic and socialdevelopment of China.Professor Turner and hiswife were flown toBeijing to be thankedpersonally by PremierWen Jiaboa, to attendthe National Banquet inthe Great Hall of thePeople (along with 1800others) and to be
presented with theaward, also in the GreatHall of the People. Thereare 50 Friendship Awardsgiven annually – thisyear the awardees werefrom 22 countries and infields from medicine tospace science to carpetmanufacture. 529,000foreign experts workedin China in 2011, so tobe selected was a greathonour.
03 18/12/12 15:49 Page 1
4 WORLD AGRICULTURE
Near drought conditions challenge spring soybeancrops. (Glycine max)
World Agriculture:A peer-reviewed, scientific review journal directed towards opinion formers, decision makers, policy makers and farmers
objectives and functions of the Journal
The Journal will publish articles giving clear, unbiased and factual accounts of development in, oraffecting, world agriculture. Articles will interpret the influence of related subjects (including climate,forestry, fisheries and human population, economics, transmissible disease, ecology) on thesedevelopments. Fully referenced, and reviewed, articles by scientists, economists and technologists will beincluded with editorial comment. Furthermore, a section for “Opinion & Comment” allows skilledindividuals with considerable experience to express views with a rational basis that are argued logically.References to papers that have been subject to peer-review will not be mandatory for this section. Fromtime to time the Editor will invite individuals to prepare articles on important subjects of topical andinternational concern for publication in the Journal.
Articles will be independently refereed. Each article must create interest in the reader, pose a challenge toconventional thought and create discussion. Each will:
1) Explain likely consequences of the directions that policy, or development, is taking. This will includeinteractive effects of climate change, population growth and distribution, economic and social factors,food supplies, transmissible disease evolution, oceanic changes and forest cover. Opinion, in the “Opinion& Comment” Section must be based on sound deductions and indicated as such. Thus, an importantobjective is to assist decision-makers and to influence policies and methods that ensure development isevidence-based and proceeds in a more “sustainable” way. Without a clear understanding of theeconomic causes of the different rates of agricultural development in developing and developed countriesand of migration rates between continents rational policies may not be developed. Hence, the role ofeconomics must be understood and contribute an important part in the discussion of all subjects.
2) Provide independent and objective guidance to encourage the adoption of technical innovations andnew knowledge.
3) Discourage false short-sighted policies and loose terminology, e.g. “organic”, “genetically modified”,“basic”, “sustainable”, “progress” and encourage informed comment on policies of governments andNGOs.
4) Indicate the essential role of wild-life and climate, not only in the context of agricultural and forestrydevelopment, but by maintaining environmental balance, to ensure the sustenance and enjoyment of all.
5) Summarise specific issues and draw objective conclusions concerning the way agriculture shoulddevelop and respond in the location/region of each enterprise, to evolving factors that inevitably affectdevelopment.
6) Promote expertise, for advising on world agricultural development and related subjects.
7) Allow interested readers to comment by “Letters to the Editor” and by “Opinion & Comment”columns.
8) Provide book and report reviews of selected works of major significance.
9) To include a wide range of commercial advertisements and personal advertisements from advisors andconsultant groups.
04 18/12/12 14:46 Page 1

WORLD AGRICULTURE 5
editorials
The debate about the potentialbenefits and public acceptanceof biotechnology in agriculture
continues unabated.
The debate seems to have clearpolarisations, irrespective of evidence,no matter how robust. There areabout 1 500 Mha of land worldwidedevoted to crop production and about10% is now allocated to crops withtraits derived by various genetictechniques.
As a paper in this issue identifies,most of these are the primary foodand commodity crops, soybeans,maize, cotton and canola (or oilseedrape as Europeans know it) and mostare grown in the Americas.
The technology, however, is nowwidely adopted in all continentsexcept Europe, where production isrestricted to insect resistant maizemainly in Spain and Portugal.
Scientific knowledge advances bydebate based on evidence and opinioncan swing widely as information onany particular topic accumulates.
This is a difficult concept tocommunicate to the general public,who find conflicting reports confusing.Indeed, they often have theunintended effect of destroying publicconfidence in science as well asresearchers.
This effect is frequently exacerbatedby the media, much of which has aprimary focus of raising revenue,usually most effectively achieved bysensationalising results, whether valid,or not, to achieve impact.
There is a further complicationwhich is difficult to overcome. Thehuman decision making processfrequently develops an unconscious
bias which can make the assessmentof evidence less rational than isdesirable.
Such unintentional processes canaffect the way we all presentinformation and discuss thesignificance of evidence.
As scientists we like to believe thatwe are not influenced by such factorsor their unintended consequences.Society and the politics of decisionmaking may be less resistant to theseinfluences, particularly as those whoserole is to communicate information aremore skilled in presenting facts.
The role of journalists, therefore,becomes paramount; they need to beskilled not only in presenting facts fordecision making, but also in assessingthe evidence on which they base theirarticles.
These interactions are highlyimportant when applied to agricultureand advances in relevant technologies.This is especially important in the caseof the so-called GM crops.
Although these are widely acceptedin most parts of the world, except inEurope, where there is significantopposition.
This seems to have three primaryconcerns - risks to human health, risksto wildlife and belief that companieswhich develop the technology are notonly large and global, but that theyalso make a profit, as though that initself is immoral and renders thetechnology undesirable.
This often ignores other elements ofthe debate on crop traits. Why forexample is golden rice and vitamin Astill so widely condemned, when adeficiency, associated with blindnessand other abnormalities occurs in the
developing world?
This may be an example of the factthat advanced cultures do not sufferfrom a scarcity of food, and are lesslikely to do so for some time, whereasfor many developing countries thetechnologies are critical to theirwelfare and will be increasingly so infuture.
Recent publicity applied to a studyof rats fed with GM maize andclaiming to show serious health risks,provides an interesting example of theproblem.
Not only was this just one study,when there is a multitude ofreferences showing no adverse effects,but serious questions of methodologyand analysis have caused severalnational and international scientific,health and food institutes to identifyclearly that the work is suspect andunreliable. Despite this, the work iswidely promoted as a reason thetechnology should be repudiated;evidence to the contrary is ignored bythe media.
Likewise, the evidence that herbicideand insect tolerance reduce pesticideuse and carbon dioxide emissions isalso ignored. Herein lies the problem.In order to improve the quality ofdecision making, as the world faces animpending food production crisis overthe next few years, we need to ensurethat policy makers can understand andact on good quality well presentedevidence.
However, they also need to leadpublic opinion. It follows, therefore,that those whose job is tocommunicate germane informationneed to be especially vigilant aboutunderstanding the facts and providingclear unambiguous interpretations.
Whither technologyRobert Cook
05 18/12/12 14:50 Page 1
6 WORLD AGRICULTURE
editorials
This journal exists because theworld community faces agrowing challenge to increase
food supply at a rate that matches thedemands of a growing and richerpopulation. Three articles in thisedition of World Agriculture addressimportant aspects of this problem.Two deal with the role ofbiotechnology in increasingproductivity whilst protecting theenvironment; the third demonstrateshow increased population pressureleads to the degradation of fragilefarming areas.
Areal and colleagues use thetechniques of Bayesian analysis toexplore the evidence from publishedstudies comparing the performance ofGM and conventional crops. A varietyof GM induced characteristics areinvolved. These include resistance topests and diseases and resistance tosome herbicides. They can bring bothagronomic and economic benefits,including higher yields and reduceduse of crop production chemicals.They conclude that, overall, GM cropshave outperformed conventionalcrops.
Critics have sometimes complainedthat biotechnology benefits farmers inrich countries but does not helpfarmers in low income countries wherethe need for more production is mostcritical. The authors conclude that theevidence suggests that developingcountries that have adopted GMtechnology have significantlyenhanced their food security. Benefitsarise not only for the innovatingfarmers but, as businesses that supportfarmers up and downstream expand,rural economies are stimulated.
They recognise that poor farmerswho are unable to use the newtechnology may be disadvantaged.The solution proposed is incomeredistribution. This may be too facile.The cost and complexity ofredistributing incomes is formidableeven in rich countries withsophisticated public services. It risesdisproportionately when the amountsto be transferred are small and wherecorruption is endemic.
Brooks and Barfoot explore theenvironmental and economic impactsof GM crops, basing their work on thepublished scientific literature. They
note the substantial area of GMcanola, corn, cotton and soyabeannow planted. They show that benefitsarise in terms of both the environmentand the economy.
The study focuses on two types ofenvironmental impact, agronomiceffects and greenhouse gas emissions.Their approach makes use of theenvironmental impact quotientdeveloped by Kovach and colleaguesin 1992 to measure environmentaleffects. This uses some of the key datarelating to toxicity and environmentalexposure of individual products, asthey impact on farm workers,consumers and ecology. This is amuch richer approach than simplycomparing changes in volume ofactive ingredient applied.
The paper reports a decline in theuse of both herbicides andinsecticides. It also notes that, insome places, the development ofherbicide resistant weeds has becomea problem. The authors point out thatthis is also a problem withconventional crops where weedsevolve to resist existing cropprotection treatments.
Economics of GM cropsin developing and
developed economiesProfessor Sir John Marsh
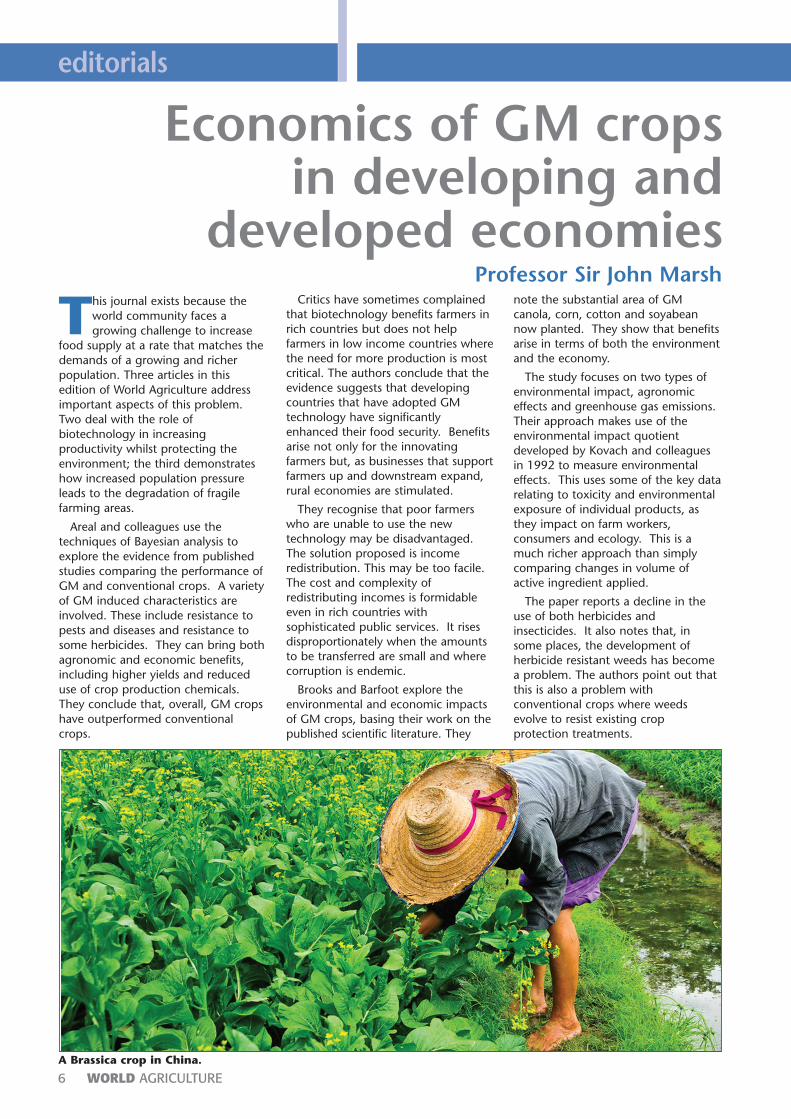
A Brassica crop in China.
06 18/12/12 14:51 Page 1

WORLD AGRICULTURE 7
editorialsTo combat growing resistance a moresophisticated managementprogramme is needed that usesherbicides with different modes ofaction as well as varying cultivationsystems.
Greenhouse gas emissions arereduced as a result of using less fueland leaving more carbon sequesteredin the soil, as a result of low till and notill methods of cultivation. Theyillustrate these gains in terms of thenumber of cars it would be necessaryto take off the road to achieve anequal reduction in the release of CO2.Their conclusions are impressive, eventhough the gain in sequestered soilcarbon is small.
GM crops increase farmers’ incomesboth by raising revenue and reducingcosts. Yields generally rise and the cropis of better quality. Costs fall becauseof reduced cultivation, despite higherprices for GM seed. The authorscompare, for each of the main GMtraits, the performance of conventionaland GM crops. They calculatesubstantial benefits from using GMtechnology claiming an overallincrease of 6.5% in the value of thefour major GM crops in 2010.
These calculations are essentially ofchanges in gross margin. They do nottake into account any impact onoverhead costs. In large scale suchcosts play an important part indetermining overall profitability andthe incentive to invest.
From a public policy perspective it isnot only the impact on farmers’incomes that matters but the net value
of the technology to society. For suchpurpose we need to know more aboutissues such as the impacts on the ruralinfrastructure, the externalconsequences for other business andtax receipts and the effect on a widerrange of environmental services, suchas amenity and the management ofcatchment areas. This is not a criticismof the authors but an invitation formore work on the wider aspects of GMtechnology.
The paper by Barbier (pp. 23-28)draws attention to land degradationthat occurs as the pressure of lowincome and growing numbers forcepoor farmers to use land that is muchmore fragile. Where such land isfarmed by traditional techniques thereis evidence of reduced land quality anderosion.
The problem is serious and urgentbecause of the scale of agriculture inthe economies of poor countries. Inbroad terms 80% of the labour force isengaged in farming, 40% of GDP andmost exports arise from agriculture.Since 1950 the population living inthese fragile areas has doubled. Theyare characterised by remoteness, pooraccess to markets and low incomes.The attempt to provide sufficient foodfor families to eat leads to thedegradation not only of land but alsoof water resources.
The author argues that the only wayto reduce this pressure is to enablefarmers and their families to earn moreincome off the farm. Increasedincome from farming is not enough.What is needed is assured income fromsources that do not increase the
pressure on land. There is, however,some evidence that, when non-farmincome rises some farmers may neglecttheir farms and fail to ensure soilconservation.
He proposes a radical shift in policyin order to generate a moresustainable system of farming in fragileareas. The policy agenda includesdirect payments to farmers forecosystem services, investment toimprove farm earnings, improvedaccess to markets and investments intransport that will enlarge the areawithin which farming families can findwork off their holdings.
Barbier’s critical message is that thethings poor farmers are forced to dotoday in order to survive are likely tomake their long term survivalimpossible. His study forces us torealise that solutions to foodproduction problems require responsesthat stimulate the economies of ruralcommunities as a whole. Theopportunities for agriculturalimprovement and environmentalprotection depend critically on thepolitical and economic context withinwhich farmers work. His policyproposals are in line with currentthinking about ‘agricultural policy’ indeveloped countries. We should notunderestimate the difficulty and costinvolved in making such policies work.This emphasises the urgent need torefocus much existing policy,employing instruments that bothrelieve poverty in fragile rural areasand maintain a sustainable use ofenvironmental resources.
The Lewa Wildlife Conservancy, North Kenya, Africa.
07 18/12/12 14:52 Page 1

8 WORLD AGRICULTURE
editorials
One of the most seriousproblems facing agriculturetoday is to ensure that
adequate nutrition is provided topeople around the world. In manydeveloping countries, this difficulty iscompounded by factors such as risingpopulations, environmentaldegradation, resource depletion,climatic variability, and by increasingvolatility in the prices of food andmany essential agricultural inputs.
After a brief respite in the late 20thcentury, the number of peopleexperiencing the kind of seriouspoverty that is often associated withfood shortages, is now on the riseagain. In 2012, the FAO estimatedthat 870 million people could beclassified as food-insecure with thisfigure projected to rise in the future.How can we respond to this challengeconfronting some of the mostvulnerable people on the planet? Twopapers in this issue of WorldAgriculture make useful contributionsto this debate in two different butinterconnected areas, namelytargeting the rural poor in fragile andremote areas and the role of theprivate sector in providing advice onseed and inputs to African farmers.
Those regions that are most at riskfrom food insecurity tend also berelatively poor and often havemarginal or degraded farmingsystems. Typically farmers in suchregions missed out from many, or all,of the benefits of the Green Revolutionthat brought such immense yieldgains in the 1970s and 1980s tomainstream cereal growers in manyparts of Asia and the Americas.
The review article by Barbier (pp.23-28) details the spiral of decline thatconfronts many of the rural poor asthey are forced into increasinglyunsustainable and unproductive
farming practices that can result inland degradation and poverty traps. Akey challenge facing policymakers is toaddress the various ways in whichsuch rural communities becomeisolated from mainstream commerceand communication. One example ofsuch isolation is a lack of access togood quality advice and training infarming practices of the sort that wastraditionally provided by nationalextension services.
Lamontagne-Godwin et al. (pp. 29-34) address the topic of advice forfarmers by examining the role ofsmall-scale private sector seed andagrochemical retailers in advisingfarmers in Uganda. Why are theserelatively unqualified middlemeninvolved in giving technical advice tofarmers and thereby influencing cropyields and food security? Surely suchadvice is normally provided by theState in the form of extension servicesstaffed by well-trained professionalofficers? Sadly, this is no longer thecase in much of the world
In many parts of East Africa, andindeed in much of the rest of theworld (including developed countries),public sector extension services havebeen dramatically reduced in recentdecades. As with many other aspectsof agricultural R&D spending,extension services have sufferedbudget cuts and staff reductions.
In some cases in Africa, even thoughstaff levels have sometimes beenmaintained, shortsighted economydrives have seen radical cuts in vehicleand fuel allowances that make itimpossible for officers to travel tofarms, especially in remote areaswhere the need for advice is often themost acute. In many developingcountries, a highly effective Trainingand Visit system was introduced bythe World Bank in the 1970s and 80s
to underpin the Green Revolution bymerging national extension bodiesinto a single service in each country.However, many of these singleagencies collapsed when funding waswithdrawn in the 1990s.
While in a few cases there has beena commendable increase in bottom-upapproaches, these are often linked toshort-term projects funded by externaldonors such as NGOs. They, therefore,tend not to have strong linkages tocentral governments and can belacking in strategic long-termobjectives.
As a result, in countries such asUganda, we have the kind ofunsatisfactory scenario outlined byLamontagne-Godwin et al. where formany farmers the national publicsector extension services have all butdisappeared. In their place a largely adhoc group of relatively unskilled anduntrained seed and agrochemicalretailers appear to be the primarysource of advice for many farmers.
In such cases, it is probably too lateto turn the clock back and reinventthe 1970s model of comprehensivenational extension services, especiallygiven the economic constraints beingexperienced by many developingcountries. However, it should bepossible to use any remainingextension personnel in targetedprogrammes to improve the trainingof these retailers, and perhaps toestablish other meaningful public-private partnerships to ensure that thepoorest farmers get useful, unbiasedadvice within their communities on aregular basis.
This is only one small linkage in thelong and complex chain from lab tofarm to fork but if it is broken, therural poor are even less likely to betterthemselves and the environment inwhich they live.
Targeting good agriculturaladvice to where
it is really neededProfessor Denis Murphy
08 24/12/12 11:53 Page 1

WORLD AGRICULTURE 9
editorials
There are many assertions made,and scientific conclusions drawn,about how agriculture, including
fish farming, horticulture and forestry,should develop over the next halfcentury. The purpose of thisdevelopment must be to provideadequate food for an increasingpopulation without increasing, and ifpossible, decreasing, greenhouse gas(GHG) emissions and withoutdecreasing biodiversity. A majorfunction of this Journal is to make anindependent assessment of reliablescientific and economic evidencepresented in a rational and objectiveway concerning these issues, whereasassertions are of little value withoutthe backing of reliable evidence fortheir suppot.
Reliable scientific research has led tothe production of many novelchemicals and genetically relevantcrop varieties that have allowed theadoption of cultivation methods whichsave fuel and time and decrease costsof production, so that GHGproduction is also reduced. Thesesystems, as stated elsewhere here(Areal et al pp.19-22); Brookes &Barfoot (pp. 35-40), have beenadopted by millions of farmers onmillions of ha of land throughout theworld without apparent interferencewith health and well-being.Nevertheless, their safety must beassured in comparison with the risksattached to continuing with traditionalmethods as populations increase andclimates change.
Many technological developmentshave led to adverse criticism inwestern cultures by individuals andorganisations, viewed at a distance“sitting in cosy arm chairs” of the well-nourished west. This is not to say therecould be long term, chronic, adverseconsequences of some of these
developments that will be worse thanthe consequences for the systems theyreplace. Such adverse effects, if anyexist, must be detected and thesystems modified so that they are nottransferred to general practice.
Has there been conclusive evidence,or even preliminary but soundevidence, for major adverseconsequences over periods of up to 15years to justify the criticisms ofglyphosate, or of the recent geneticmodification of maize? Our problemin assessing major adverse evidence isthat, to our knowledge, none of anyconsequence has been published inpeer-reviewed journals, except for arecent publication by French scientists(Séralini, G.-E. et al., 2012). Yet thispaper has received damning criticismfrom the official EU watchdog (BfR-Opinion 037/2012, 1st October,2012). The French scientists state thatthe adverse effects they observedcould have been caused by hormonaleffects of Roundup and by specificconstituents of the geneticallymodified maize. The Federal Institutefor Risk Assessment (BfR) has evaluatedthe study in terms of its relevance forthe evaluation of the health risk ofgenetically modified glyphosate-tolerant maize NK603 and for theevaluation of the health risk of theglyphosate-containing formulation. Onthe basis of the French publication, theBfR has concluded that the authors’main statements are not sufficientlycorroborated by experimentalevidence, owing to deficiencies in thestudy design and in the presentationand interpretation of the study results.
Therefore, the main conclusions ofthe authors are not supported by thepresented incomplete data. The studydoes not comply with internationallyrecognised standards for long-termcarcinogenicity studies. The rat strain
used shows a relatively highspontaneous tumour rate, especiallyfor mammary and pituitary tumours,and the number of animals used wastoo small and insufficient for assessingthe claimed differences between thetest groups and the control group.
The authors’ hypothesis that theobserved effects could result fromadverse effects on the endocrinesystem is not sufficiently supported bythe data presented. Furthermore, theBfR criticises that the glyphosate doseadministered was not determined inthe studies with the glyphosate-containing plant protection productRoundup.
In summary the German FederalInstitute for Risk Assessment is of theopinion that the experimental data donot support the main statements inthe publication. Further, due toshortcomings in the study design aswell as in the presentation andinterpretation of the data, relevantconclusions drawn by the authors arenot comprehensible.
Our additional criticisms of the studyare based on the evidence available tous:
1) There were only10 rats pertreatment group; but for themeasurement of non-monotonicresponses of tumours there should bea minimum of 50 per treatmentgroup. We understand that half thecontrols also presented with tumours.
2) The statistical analysis wasinappropriate and inadequate. Also ifthe rats were not caged individually,but in groups the experimental unitwould be the cage and not the rat andif any of the statistical analyses werecarried out with the animal as theexperimental unit that analysis wouldbe invalid.
Why is it still impossible to holda worthwhile debate over the
criticisms of biotechnologyin agriculture?
David Frape
09 18/12/12 14:54 Page 1

3) Feed intake was ad libitum andapparently not measured and so thedose was apparently unknown.Whereas, the rats should have beenfed individually a defined amountdaily. It is well established in both rats(1) and in women after menopause (2)that breast cancer (especially that ofoestrogen receptor negative type) iscorrelated with obesity and withglycaemic load in French studies (3)and with glycaemic index in Danishstudies (4). These effects in rats wouldbe related to feed intake and if morewas consumed by the experimentalgroups than by the control groups,this fact alone could account for theearlier deaths of the rats givenglyphosate-tolerant NK603 maize. Sothe effects attributed to theexperimental maize would beaccounted for, entirely, by differencesbetween groups in feed consumptionand not by any direct relation betweengenetic manipulation on tumourgrowth.
4)The maize used was not tested forthe presence of mycotoxins frequentlyfound in maize: e.g. zearalenone andaflatoxin, that is a cause (author’sevidence) of hepatic cancer in bothrats and in humans world-wide, andfumonisins, produced by the mould,Fusarium moniliforme (fumonisin B1 hasa world-wide distribution and ispresent in a majority of maize samplesfrom 0.4-3.5 mg/kg) (5). At higherconcentrations it causesleukoencephalomalacia in horses andcancer (mainly of the throat) inhumans (author’s evidence). A 30 daystudy in female rats showed itproduced severe renal damage (6) andover 2 years it is a hepatocarcinogenin male rats (7). Contrary to theinference indicated in the Frenchpaper the evidence is that GM Btcrops, in particular, have decreased theincidence of moulds and mycotoxinpresence, especially in products ofthose crops derived from developing
countries. It is unfortunate that theFrench scientists presented theirpreliminary data from this inadequateexperiment, as if those data providedreliable evidence. The data are atvariance with all other reports, andalthough that is no reason of itself notto publish, it is a reason to questionone’s evidence to determine whetherthere are alternative explanations forit. In its present state the French reportwill provide no enlightenment on thistopical and important subject. Yet itmay stimulate other groups ofscientists to carry out further two yearstudies with the same and different ratstrains together with methods ofmeasuring other potential long termeffects, including those on biodiversityand GHG production. In the
meantime those individuals andorganisations highly critical of scientificdevelopments in agriculture, but withaccess to the popular media, will usethese French data to further giveconcern and confusion of thought tothe general public. World Agriculturelooks forward to the receipt of reliableevidence on this important subject. Weappreciate that many noble andlegitimate groups opposed to theinnovations discussed do, in fact, havethe same objectives as manysupporting the developments stated inthe first paragraph above. It is a greatpity that there are also “bigots in thepot” so that the general publicreceives mixed messages on thisimportant subject.
10 WORLD AGRICULTURE
editorials
References� 1) Fuchs,G.J., Chan Hee Jo, Kieber-Emmons, T. & Korourian S.(2005) Mammarytumor development in female zucker rats,Breast Cancer Research, 7, No 5, :pp. R627-R633.� 2)Lorincz, A.M. & Sukumar, S.(2006)Molecular links between obesity and breastcancer Endocrine-Related Cancer, 13, 279-292.� 3) Lajous, M., Boutron-Ruault,M.C.,Fabre, A., Clavel-Chapelon, F., Romieu,I., (2008) Carbohydrate intake,glycemic index, glycemic load and risk ofpost-menopausal breast cancer in a prospec-
tive study of French women. AmericanJournal of Clinical Nutrition, 87, 1384-91.� 4) Nielson, T.G., Olsen,A., Christensen, J.,Overad, K., Tjonneland, A. Dietary carbohy-drate intake is not associated with the breastcancer incidence rate ratio in postmeopausalDanish women. Journal of Nutrition, 135,124-8. � 5) Bryden, W.L., Shanks, G.L., Ravindran,G., Summerell, B.A. & Burgess, L.W. (1998)Mycotoxin contamination of Australian pas-tures and feedstuffs; and occurrence ofFusarium moniliforme and fumonisins inAustralian maize in relation to animal disease.In: Toxic plants and other natural toxicants
(eds, T. Garland & A.C. Barr), CABI,Wallingford, U.K., pp. 464-8 and 474-8.� 6) Morsy FA, Badawy MA, Farrag AR.(2006) The protective effect of melatoninagainst fumonisin-induced renal damage inrats. International Journal of Toxicology, 25,6,:523-9.� 7) Gelderblom, W.C., Abel,S., Smuts, C.M.,Marnewick,J., Marasas, W.F., Lemmer, E.R.,and Ramljak,. D. (2001) Fumonisin-inducedhepatocarcinogenesis: mechanisms related tocancer initiation and promotion.Environmental Health Perspectives, 109(Suppl 2), 291–300.
GM Maize
10 18/12/12 14:56 Page 1

WORLD AGRICULTURE 11
scientific
Aquaculture: are the criticismsjustified? Feeding fish to fish
Jonathan Shepherd,18 Clarence Road, Richmond, Surrey, TW9 3NL
SummaryAquaculture is a fast-growing sector of livestock production, but has attracted criticism owing to the practice of usingmarine ingredients as feed, usually in the form of fishmeal and fish oil. After placing so-called production of ‘fed’ aqua-culture within the global supply context of capture fisheries and aquaculture, the author lists the objections madeagainst feeding fish to fish. This is followed by a survey of the current trends in the production of fishmeal and fish oilfrom raw materials of marine origin and of the changing pattern of inclusion in aquaculture feeds, as well as their use inland animal feeds and human nutritional products. The management of so-called ‘reduction’ fisheries (for fish not usedfor direct human consumption) is discussed, as is the use of process trimmings and fishery by-products to make fish-meal, together with the increasing effort to utilise, for human consumption, fish that would previously have been usedfor reduction. Particular attention is paid to the substitution of marine feed ingredients by vegetable proteins and oilsand by recycled land animal products in aquaculture diets. A global input and output analysis indicates that there is a substantial net production of fish owing to use of marineingredients for aquaculture feed and that continuing future growth of aquaculture is unlikely to threaten stocks of wildfish currently used for reduction. This counters a principal criticism of using marine ingredients. However, areas ofpotential concern are recognised, especially the use of low value ‘trash fish’ in South East Asia as direct wet feed foraquaculture; also the availability of long chain omega-3 marine oils for aquaculture owing to the growth in humannutritional supplements. It is concluded that future growth of fed aquaculture will be associated with proportionatelygreater use of land animal and plant proteins, oils and carbohydrate sources, and with a continuing decline in depend-ence on marine ingredients.
Keywords: Aquaculture, substitution, by-products, sustainability, pelagic, reduction, forage, fishmeal,fish oil.
GlossaryDioxins and dioxin-like compoundsare by-products of various industrialprocesses and regarded as highly toxiccompounds that are persistent organicenvironmental pollutants El Niño is a warming of the surfacewater of the eastern or central PacificOcean which usually occurs every 4 to12 years causing unusual weatherpatterns and affecting marine fishstocksThe fishmeal trap is a term denotingthe concern that increased demandfor feed by aquaculture will increasefishing pressure on wild stocks and,therefore, threaten the sustainability of
the associated capture fisheries.Fed aquaculture and Non-fedaquaculture are those branches ofaquaculture which depend respectivelyeither on supplemental feeding, whichmay include formulated diets, or areliance on naturally supplied feed,which may be encouraged by addingfertilizers to the water.Frames are filleted fish skeletons withthe heads and guts intact.A nutraceutical is a food ornutritional product that provideshuman health and medical benefits.Pelagic fish are those which live nearthe surface or in the water column ofseas or lakes, but not on the bottom.
A prion is an infectious agentcomposed of protein in a mis-foldedform, including the causative agent ofMad Cow Disease (Bovine spongiformencephalopathy, BSE).A reduction fishery is a fishery that‘reduces’ its catch to fishmeal and fishoil (i.e. not for direct humanconsumption); also known as a ‘Feed’fishery or a ‘Forage’ fishery.Trash fish are low value fish havinglittle or no market value as humanfood but sometimes used as a minced-up raw wet feed for aquaculture.The trophic level of an organism isthe position it occupies in a foodchain.
Abbreviations FAO Food and Agriculture Organisation of the United Nations; OECD Organisation for EconomicCo-operation and Development; FIFO when used about aquaculture is the ratio of (wild-caught) Fish in, to (farmed)Fish out and refers to the input of fish materials as feed ingredients compared to the resulting output of farmed fish;IFFO-RS Global Standard and Certification Programme for the Responsible Supply of Fishmeal and Fish Oil (developedby the International Fishmeal and Fish Oil Organisation); NGO non-governmental organisation; PCBs polychlorinatedbiphenyls, - a family of synthetic organic chemicals also known as chlorinated hydrocarbons.
Introduction
Aquaculture is the farming ofaquatic plants and animals; ithas grown at an annual average
rate of 5.8% by tonnage volume in thelast decade, but the OECD anticipates
a slowing down to 2.4% annuallyduring the period 2012 – 20211. Incontrast to this growth in aquaculture,global fisheries production has nowlevelled off. As illustrated in Fig. 1, FAOreports that in 2010 capture fisheriesand aquaculture supplied the world
with about 148 million tonnes of fish(with a total value of USD 217.5billion), of which about 128 milliontonnes was utilised directly as humanfood; preliminary data for 2011indicate increased production of 154million tonnes, of which 131 million
11 18/12/12 14:57 Page 1

12 WORLD AGRICULTURE
scientific
tonnes was destined as food. In 2010global production of farmed food fishwas 59.9 million tonnes, of which anestimated 67% were fed, instead ofrelying on natural productivity oftenboosted by fertilization of the rearingpond2. Fig. 2 shows how theproduction of this so-called ‘fed’aquaculture has developed, and iseclipsing non-fed aquaculture, and themain species groups involved in each.
To a varying extent, depending onspecies, fed aquaculture receivesmarine ingredients as a dietarycomponent usually by means offishmeal and fish oil incorporatedduring feed manufacture. These marineingredients are manufactured by thefishmeal industry using either renderedwhole fish – mainly small pelagicspecies, such as Peruvian anchovy,caught by means of targeted‘reduction’ fisheries (also known as‘forage’ or ‘feed’ fisheries), or
alternatively rendered from by-products of processing captured orfarmed fish for human consumption(i.e. offals, off-cuts, frames, andtrimmings). The fresh raw materials arethen subjected to cooking, pressing,drying and milling to produce thebrown flour known as fishmeal. Duringthis process the liquid fraction isseparated into oil and water followedby an evaporation step leading to fishoil production.
The use of marine ingredients otherthan for direct human food productionhas caused controversy. Most fishmealand fish oil is used today foraquaculture, which has itself attractedcriticism mainly on environmentalgrounds. The main global concern isthat increased demand for feed from agrowing aquaculture production willincrease fishing pressure on wild stocksto supply fishmeal and fish oil andconsequently threaten the
sustainability of the capture fisheriesinvolved. After initially listing these andother criticisms, the relevant aspects offeeding fish to fish will be described inorder to enable a more detailedassessment of their validity both nowand for the future.
The criticisms of feedingfish to fishThe so-called ‘Fishmeal trap’ expressesthe concern that overfishing of wildfish for use as aquaculture feed threat-ens the sustainability of reduction fish-eries; a linked concern is that aquacul-ture is so reliant on the supply ofmarine ingredients that limited supplywill inevitably constrain its furtherdevelopment3. For this to be true vari-ous factors need to be understood,including whether increased fishmealdemand results in an increased fishingcatch and the extent to which fishmealcan be substituted in fish feeds (e.g. sothat increasing fishmeal prices encour-age use of alternative raw materials4).
A common criticism by fisheryecologists is that reduction fisheriescompromise marine bird, mammal,and predatory fish populations5,6. Theobjections are on both ecologicalgrounds, linked to biodiversity, andeconomic grounds, as it is supposedthat a valuable catch of fish for humanconsumption is being denied orreduced due to the operation of areduction fishery catching (‘lowertrophic level’) fish further down thefood chain7,8.
Some critics believe that all fishshould be processed for human foodrather than for livestock feed. When itis argued that there is little or noconsumer demand for certain fishspecies, the reply has been that suchfish should then be given to the poorfree of charge (e.g. in the case ofPeruvian anchovy and poor ruralcommunities of Andean people).
A particular source of criticism is thefarming of so-called ‘carnivorous‘ fish,such as Atlantic salmon (Salmo salar),which have a relatively higher dietaryinclusion of fishmeal and fish oil,implying an inefficient utilisation ofscarce marine biomass9,10, comparedwith those species which can be rearedon vegetarian diets.
Also there are claims that reductionfisheries are overfished and thatexploitation rates should be drasticallyreduced6. Furthermore it is suggestedthat use of fishmeal and fish oil iswrong on public health grounds as itresults in the concentration of marinecontaminants, which then enter the
Figure 1. World capture fisheries and aquaculture production, 1950-2010 (FAO 2012a) (2).
Figure 2. World aquaculture production of non-fed and fed species,1980-2010 (FAO 2012a) (2).
12 18/12/12 14:58 Page 1

WORLD AGRICULTURE 13
scientificfood chain via aquaculture products11.Finally one may ask if there is a risk offish to fish disease transmission byfeeding marine ingredients to farmedfish.
The supply base of marineraw materialsIt is estimated that ca 25% of currentfishmeal and fish oil supplies arederived from the fishery by-products ofprocessing for human consumptionand hence recycle waste which wouldotherwise incur financial and environ-mental costs for disposal. This resourceis under-exploited today and is expect-ed to provide 43% of the raw materialinput within the next 10 years2.However, most concerns centre on thecapture fishery element of the rawmaterial base, as follows:
(i)Why are whole fish captured forreduction not used instead for humanconsumption?
The main species and volumes ofwhole fish used in manufacture of fish-meal and fish oil during 2006 – 2010are classified into three categories(industrial grade, food grade, andprime food) and listed in Table 1. Thiscategorisation12,13 is based on the viewthat industrial grade fish, such as
Atlantic menhaden (Brevoortiatyrannus) or Gulf menhaden (Brevoortiapatronus), are unsuitable for humanfood and have no current market otherthan fishmeal or fish oil. For foodgrade fish, such as Peruvian anchovy(Engraulis ringens), those willing to pur-chase them as food are far away andcannot normally pay for the costs asso-ciated with preservation and trans-portation; there has been limited suc-cess in promoting Peruvian anchovyfor direct human consumption (only1.5% of the anchovy catch by volumewent for human consumption in201114) despite strenuous efforts. Astheir name implies, prime food fish arevery suitable for food markets, butowing to the seasonality and unpre-dictability of pelagic harvests, there willbe occasions when landings are toolarge for all to be preserved orprocessed as human food. At suchtimes the smaller and poorer qualityfish are diverted for reduction.However, in recent years there hasbeen a marked reduction in use ofprime food fish, such as herring(Clupea harengus) or Jack mackerel(Trachurus murphyi) for reduction,other than as offals or downgradedfish. This is part of an overall increasingtrend in the proportion of the worldfish catch going for human consump-
tion, – rising from about 68% in the1980s to 86% in 2010 according toFAO15.
(ii)How robust are the fish stocksused for reduction?
Fish stocks for reduction are subject toincreasing regulation and control bygovernments, while the quality of stockmanagement is being increasinglymonitored by independent NGOs, aswell as by government and industrysources. The FAO16 has published tech-nical guidelines on the use of wild fishas feed for aquaculture in support ofthe FAO Code of Conduct forResponsible Fisheries17. The SustainableFisheries Partnership18 analysed howthe main reduction fisheries, aroundSouth America and across the Atlantic,score using ‘FishSource’ methodology.They concluded that ‘most operatewithin limits that would be consideredconsistent with current good industrypractice in the context of single-speciesmanagement regimes’, adding that ‘allwould be enhanced by the incorpora-tion of ecosystem principles into theoverall management regime’. Theaquaculture value chain is now puttingpressure on the fishmeal industry forcertification to demonstrate sustainableuse of raw materials and on feed
Table 1. Annual global pelagic fishery landings for reduction (average 2006–2010). FM = Fishmeal, FO =Fish Oil, ByP = By-products. (Units of production volume in tonnes). (Modified from Wijkström 2012 usingdata from FAO 2012b and IFFO estimates) (13,15).
13 18/12/12 14:58 Page 1

14 WORLD AGRICULTURE
scientificbuyers to purchase from certifiedsources. In this connection it is claimedthat over a third of the world’s fish-meal and fish oil production is nowcertified to the IFFO-RS global standardfor responsible supply19.
By far the world’s largest reductionfishery is that of Peruvian anchovy,with an annual catch, subject to peri-odic El Niño events, during the period2000 to 2006, varying from 6 to 10million tonnes and representing 25%to 30% or more of global fishmeal pro-duction depending on the year. It is,therefore, significant that in 2008Mondoux et al.20 ranked Peru the high-est out of 53 maritime countries forthe sustainability of its fisheries. Sincethen Peru has reduced its fishing over-capacity and further improved its man-agement by the introduction of maxi-mum catch limits for each vessel.Today, the main problems associatedwith overfishing and poor fishery con-trols appear to be in China and SouthEast Asia, especially related to use oflow value ‘trash’ fish21. Apart from Asia,increasingly stringent controls are nowbeing applied to those fisheries usedprimarily for reduction purposes, suchas Peruvian anchovy and menhaden.Their stocks appear reasonably robustand are classed by FAO as fully exploit-ed22. However, continuing vigilance isneeded since there is a growing recog-nition that climate-driven changes areaffecting some pelagic fish popula-tions. The reduced seasonal availabilityof sandeels (Ammodytes spp.) in theNorth Sea is linked to seawater tem-perature changes, which in turn haveresulted in the decline of certainspecies of seabird23 and of marinemammals24, as well as in lower quotasbeing issued by the European Union(EU) for the associated reduction fish-ery.
(iii)Should whole fish targeted forreduction be left in the sea?
The Lenfest Ocean program hasrecently concluded25 that conventionalmanagement can be risky for foragefish because it does not adequatelyaccount for their wide populationswings and high catchability. Theyclaim it also fails to include the criticalrole of forage fish as food for marinemammals, seabirds, and commerciallyimportant fish, such as tuna, cod, andsalmon. Lenfest, therefore, recom-mended cutting catch rates in half inmany ecosystems and doubling theminimum biomass that should be leftin the water compared with conven-tional management targets.
In assessing the validity of these argu-ments, the following points are made:� Small pelagic fish populations cer-tainly fluctuate widely and are easilyreduced, and so should be well man-aged. However, recoverability is equallyimportant. The largest fishery (Peruviananchovy) suffered a severe El Niño in2010, but stocks rebounded strongly in2011 suggesting that in practice thepresent management regime may besuitable. Until recently there have beenjustified concerns about the status ofsome North Sea reduction stocks withan inability to agree quotas linked topolitical differences in the EU and theCommon Fisheries Policy. Whereasthere is continuing room for improve-ment, the overall North Sea picture isnow of recovery or of stability,notwithstanding the effects of climatechange on sandeel stocks, which indi-cates that an inherent problem withconventional management is not themain issue. At the same time continu-ing problems with managing the Jackmackerel resource were closely linkedto its migration beyond the Chileanjurisdiction and the difficulty in estab-lishing an international fishing agree-ment. It is therefore encouraging thatratification by Chile during 2012 of theSouth Pacific Regional FisheriesManagement Organisation has madethe agreement legally binding. � It is certainly true that the activitiesof reduction fishing cause a decrease inpredator populations. Striking anappropriate balance between seabirdor marine mammal stocks and pelagicfish stocks implies making a similarjudgment as between food securityand biodiversity (akin to the ‘set-aside’question in agriculture). There is nosimple answer and one practical solu-tion is the creation of marine reservesto safeguard breeding populations,especially of endangered species.� As regards the view that forage fishare more valuable in the water than inthe net, this ignores the conversionratio in the wild which is of the orderof 10 kg of prey to 1 kg of food fish,whereas the aquaculture alternative ismuch more productive (see paragraph15 (ii)).
(iv)Are there valid human healthconcerns about eating farmed fish?
On grounds of public health a reportabout the presence of organic contam-inants in farmed salmon11 raised con-cerns about eating farmed fish owingto the presence of marine contami-nants in marine ingredients, whichthen enter the food chain via aquacul-
ture products. It has since been shownthat the potential health risks areextremely small compared to thehealth benefits of consuming salmonproducts. Indeed the benefits are esti-mated to be at least 100-fold greaterthan the estimates of harm, which maynot exist at all26,27. In any event recentdata28 show that farmed salmon andtrout contained on average lower levelsof dioxins and PCBs than wild-caughtsalmon and trout, at least for Europe.Following the discovery of a prion pro-tein in fish29, concerns were expressedabout the possibility of fish suffering aversion of ‘mad cow disease’. Itappears that fish prions are differentfrom those in mammals and it isunlikely that transmission could jumpfrom fish to mammals30. Nevertheless itis now recognised aquaculture practiceto avoid feeding fish material to otherfish of the same or closely relatedspecies. The risk of transmitting diseaseorganisms from fish to fish by feedingmarine ingredients is low when usingproperly stored fishmeal owing to thehigh processing temperatures involvedin feed manufacture, but more likelywith wet fish diets31.
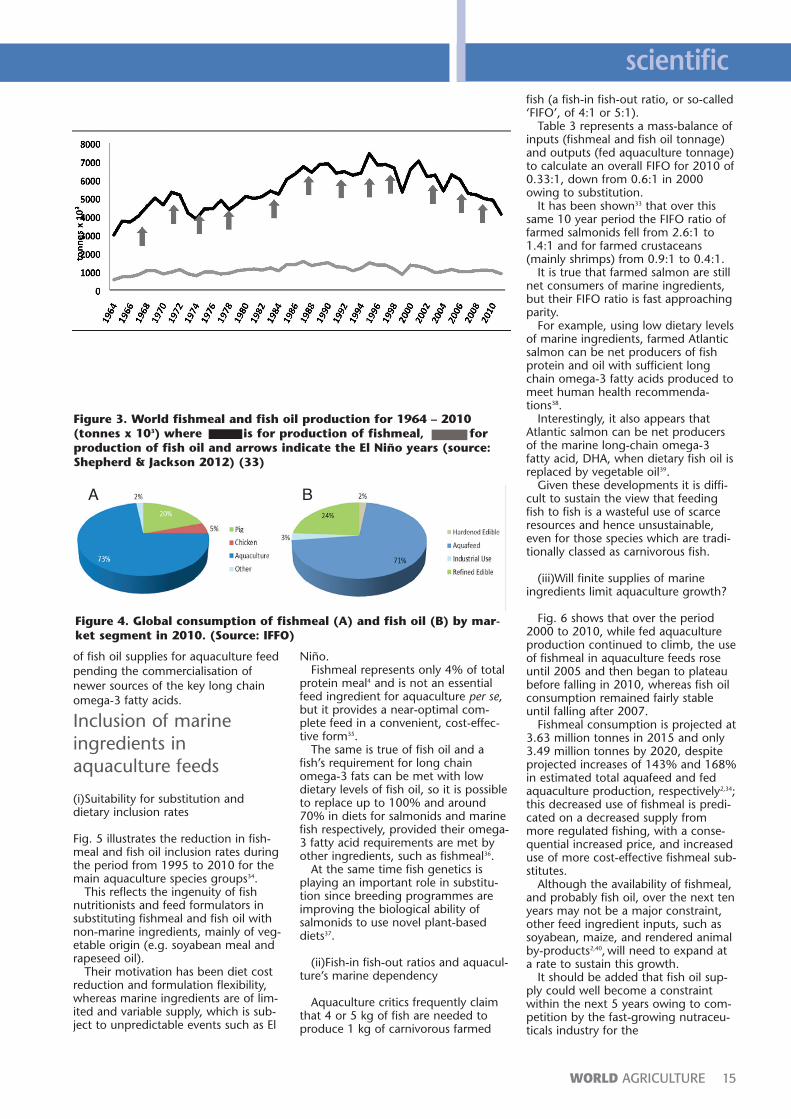
Production and markets formarine ingredientsThe total annual supply of fishmealand fish oil worldwide between 1964and 2010 is shown in Fig. 3. Thissupply has stabilized at about 5 milliontonnes and 1 million tonnes perannum respectively despite El Niñoevents. This is clearly less than the1994 peak and the decline is due tostricter fishing controls, increasedprocessing for human consumption offish used formerly for fishmeal, andother factors, such as climate-changeeffects32,33. Fig. 4 illustrates the use in2010 of fishmeal and fish oil, inaquaculture, representing 73% and71% of world consumptionrespectively. The main competitor ofaquaculture for fishmeal is pig feed,especially for young pigs at weaning,but aquaculture is gradually takingmarket share from land animals as pigfarmers tend to be more price sensitivethan fish farmers and substitute withother ingredients when fishmeal pricesincrease. The opposite is true for thegrowing demand from nutraceuticalproducers of human nutritionalsupplements (e.g. capsules), wherebuyers will pay a 20% – 25% premiumfor fish oil with a high level of omega-3fatty acids. This is raising concern about themedium-term sustainability
14 18/12/12 15:00 Page 1
WORLD AGRICULTURE 15
scientific
of fish oil supplies for aquaculture feedpending the commercialisation ofnewer sources of the key long chainomega-3 fatty acids.
Inclusion of marineingredients inaquaculture feeds
(i)Suitability for substitution anddietary inclusion rates
Fig. 5 illustrates the reduction in fish-meal and fish oil inclusion rates duringthe period from 1995 to 2010 for themain aquaculture species groups34.
This reflects the ingenuity of fishnutritionists and feed formulators insubstituting fishmeal and fish oil withnon-marine ingredients, mainly of veg-etable origin (e.g. soyabean meal andrapeseed oil).
Their motivation has been diet costreduction and formulation flexibility,whereas marine ingredients are of lim-ited and variable supply, which is sub-ject to unpredictable events such as El
Niño. Fishmeal represents only 4% of total
protein meal4 and is not an essentialfeed ingredient for aquaculture per se,but it provides a near-optimal com-plete feed in a convenient, cost-effec-tive form35.
The same is true of fish oil and afish’s requirement for long chainomega-3 fats can be met with lowdietary levels of fish oil, so it is possibleto replace up to 100% and around70% in diets for salmonids and marinefish respectively, provided their omega-3 fatty acid requirements are met byother ingredients, such as fishmeal36.
At the same time fish genetics isplaying an important role in substitu-tion since breeding programmes areimproving the biological ability ofsalmonids to use novel plant-baseddiets37.
(ii)Fish-in fish-out ratios and aquacul-ture’s marine dependency
Aquaculture critics frequently claimthat 4 or 5 kg of fish are needed toproduce 1 kg of carnivorous farmed
fish (a fish-in fish-out ratio, or so-called‘FIFO’, of 4:1 or 5:1).
Table 3 represents a mass-balance ofinputs (fishmeal and fish oil tonnage)and outputs (fed aquaculture tonnage)to calculate an overall FIFO for 2010 of0.33:1, down from 0.6:1 in 2000owing to substitution.
It has been shown33 that over thissame 10 year period the FIFO ratio offarmed salmonids fell from 2.6:1 to1.4:1 and for farmed crustaceans(mainly shrimps) from 0.9:1 to 0.4:1.
It is true that farmed salmon are stillnet consumers of marine ingredients,but their FIFO ratio is fast approachingparity.
For example, using low dietary levelsof marine ingredients, farmed Atlanticsalmon can be net producers of fishprotein and oil with sufficient longchain omega-3 fatty acids produced tomeet human health recommenda-tions38.
Interestingly, it also appears thatAtlantic salmon can be net producersof the marine long-chain omega-3fatty acid, DHA, when dietary fish oil isreplaced by vegetable oil39.
Given these developments it is diffi-cult to sustain the view that feedingfish to fish is a wasteful use of scarceresources and hence unsustainable,even for those species which are tradi-tionally classed as carnivorous fish.
(iii)Will finite supplies of marineingredients limit aquaculture growth?
Fig. 6 shows that over the period2000 to 2010, while fed aquacultureproduction continued to climb, the useof fishmeal in aquaculture feeds roseuntil 2005 and then began to plateaubefore falling in 2010, whereas fish oilconsumption remained fairly stableuntil falling after 2007.
Fishmeal consumption is projected at3.63 million tonnes in 2015 and only3.49 million tonnes by 2020, despiteprojected increases of 143% and 168%in estimated total aquafeed and fedaquaculture production, respectively2,34;this decreased use of fishmeal is predi-cated on a decreased supply frommore regulated fishing, with a conse-quential increased price, and increaseduse of more cost-effective fishmeal sub-stitutes.
Although the availability of fishmeal,and probably fish oil, over the next tenyears may not be a major constraint,other feed ingredient inputs, such assoyabean, maize, and rendered animalby-products2,40, will need to expand ata rate to sustain this growth.
It should be added that fish oil sup-ply could well become a constraintwithin the next 5 years owing to com-petition by the fast-growing nutraceu-ticals industry for the
Figure 3. World fishmeal and fish oil production for 1964 – 2010(tonnes x 103) where is for production of fishmeal, forproduction of fish oil and arrows indicate the El Niño years (source:Shepherd & Jackson 2012) (33)
Figure 4. Global consumption of fishmeal (A) and fish oil (B) by mar-ket segment in 2010. (Source: IFFO)
A B
15 18/12/12 15:00 Page 1

long chain omega-3 fatty acids in fishoil41,42. This is unlikely to limit the con-tinuing growth of aquaculture, but islikely to reduce the content of omega-3 fats and increase the level of omega-6 fats in the final product with poten-tially negative consumer health impli-cations43. However, alternative algalproduction of these omega-3 fattyacids has already commenced to sup-ply nutraceuticals, while research todevelop genetically-modified (GM)omega-3 oils from oilseeds, such assoyabean, rapeseed and relatedspecies, is showing commercial prom-ise, despite a lack of universal marketacceptance for GM materials44.
Conclusions� Nutritional and genetic innovation isenabling substitution of fishmeal byother feed ingredients. The use of fish-meal and fish oil in aquaculture diets isstatic and there is every likelihood thataquaculture will continue its rapidglobal expansion despite a limitedglobal supply of marine ingredients. � Except for concerns around poorlymanaged Asian fisheries, the evidenceis that in general reduction fisheries arebeing managed responsibly, thereforeincreased demand for fishmeal and fishoil is unlikely to result in increasedcatches for reduction. Taking also intoaccount substitutability, there seems lit-
tle risk of a fishmeal trap, at least out-side Asia. � There is a medium-term concernregarding fish oil owing to the growthof demand for human consumption. Itseems unlikely that this will constrainaquaculture production, but it will cer-tainly reduce the content of long chainomega-3 fatty acids in some farmedfish until such time as cost-effectivealternative sources currently underdevelopment become available.� Striking the right balance betweenthe level of reduction catch and leav-ing fish in the water for predatory fish,birds and mammals is as much downto subjective judgement as to scientificmethod, but probably all fisherieswould benefit from adopting ecosys-tem management. It seems, however,that calculations of the costs and bene-fits of reduction fishing are likely to beerroneous if they ignore the far greaterconversion efficiency of aquaculture cf.wild fish with natural predation byother fish in the wild. � Using fish landed by industrial fish-eries in the Americas and Europe asfeed for aquaculture in the long runsignificantly expands the effective sup-ply of fish for human consumption, –to the extent of at least 11 milliontonnes net increment per annum35. Asregards the ethical argument that it ismorally wrong to feed fish to fish andcrustaceans; taking Peruvian anchovyas an example, it is clear that there is alack of effective demand for humanconsumption in respect of most of theanchovy caught (despite promotionaleffort), as the potential consumers livefar from the site of the catch. If 8 mil-lion tonnes were to be supplied insteadas a canned product, the annual costwould be in the order of USD 25 bil-lion per year, – this is not a feasiblesolution and a subsidized productcould well be challenged under WorldTrade Organisation rules13.� From having been commodities sup-plying bulk protein and energy, itseems that fishmeal and fish oil arenow speciality feed ingredients foraquaculture, used strategically andsparingly. Innovation has underpinnedthe dramatic growth in aquacultureand dietary development. In the sameway the signs are that medium- andlonger-term concerns about availabilityof long chain omega-3 fatty acids willbe resolved by algal cultivation andplant breeding of those fatty acids.� Aquaculture will soon overtake con-ventional fishing as the major source ofseafood for human consumption. Assuch, aquaculture already represents akey element of food security in someregions and its sustainability is moreclosely linked to the availability of ter-restrial feed ingredients than to thoseof marine origin.
16 WORLD AGRICULTURE
scientific
Figure 5. Estimated mean percentage dietary inclusion rate for (A)fishmeal and (B) fish oil in the different groups of farmed speciesbetween 1995 and 2010 (modified after Tacon et al. 2011) (34)
Table 2. Mass balance estimate for 2010 for combined consumption offishmeal and fish oil inputs and fed aquaculture output (tonnes x 103)and corresponding fish-in fish-out ratios, based on whole fish inputsfor different market segments (modified after Shepherd & Jackson2012) (33).
16 24/12/12 11:55 Page 1

WORLD AGRICULTURE 17
scientific
AcknowledgementsParticular thanks are due to AnneChamberlain, Mark Griffin, AndrewJackson, David Jones, and Dan Lee,who kindly commented on earlier ver-sions of the manuscript.
References1. OECD/FAO (2012) OECD-FAO Agriculturaloutlook 2012-2021,<http://dx.doi.org/10.18787/agr_outlook-2012-en>.
2. FAO (2012a) The state of world fisheries andaquaculture – 2012, Rome, FAO Fisheries andaquaculture department, the Food &Agriculture Organisation of the UnitedNations.
3. Naylor, R L, Hardy, R W, Bureau, D P, Chiu,A, Elliott, M & Farrell, A P (2009) Feedingaquaculture in an era of finite resources.Proceedings of the National Academy of Sciencesof the United States of America, 106, 15103-15110.
4. Asche, F & Bjørndal, T (2011) The economicsof salmon aquaculture. Second Edition,Chichester, Wiley-Blackwell, 2011 ISBN 978-0-8523-8289-9.
5. Cury, P M, Boyd, I L, Bonhommeau, S,Anker-Nilssen, T, Crawford, R J M, Furness, RW, Mills, J A, Murphy, E J, Ósterblom, H,Paleczny, M, Platt, J F, Roux, J-P, Shannon, L &Sydeman, W J (2011) Global seabird responseto forage fish depletion – one third for thebirds. Science, 334, 1703-1706.
6. Smith, A D M, Brown, C J, Bulman, C M,Fulton, E A, Johnson, P, Kaplan, I C, Lozano-Montes, H, Mackinson, S, Marzloff, M,Shannon, L J, Shin, Y-J & Tam, J (2011)Impacts of fishing low-trophic level species onmarine ecosystems. Science, 333, 1147-1150.
7. Pauly, D, Christensen, V, Dalsgaard, J,Froese, R & Torres, F (1998) Fishing downmarine food webs. Science, 279, 1360-1366.
8. Alder, J, Campbell, B, Karpouzi, V, Kashner,
K & Pauly, D (2008) Forage fish: from ecosys-tem to markets. Annual Review of Environmentand Resources, 33,153-166.
9. Allsopp, M P, Johnston, P & Santillo, D(2008) Challenging the aquaculture industry onsustainability. Amsterdam, GreenpeaceInternational.
10. Welch, A, Hoenig, R, Steiglitz, J, Benetti, D,Tacon, A, Sims, N & O’Hanlon, B (2010) Fromfishing to the sustainable farming of carnivo-rous marine finfish, Reviews in Fisheries Science,18, 235–247.
11. Hites, R A, Foran, J A, Carpenter, D O,Hamilton, M C, Knuth, B A & Schwager, S J(2004) Global assessment of organic contami-nants in farmed salmon. Science, 303, 226-229.
12. Peron, G, Mittaine, J F & Le Gallic, B(2010) Where do fishmeal and fish oil productscome from ? An analysis of the conversionratios in the global fishmeal industry. MarinePolicy, 34, 815-820.
13. Wijkström, U N (2012) Is feeding fish withfish a viable practice? In: Farming the Waters forPeople and Food (eds., Subasinghe, R P, Arthur,J R, Bartley, D M, De Silva, S S, Halwart, M,Hishamunda, N, Mohan, C V and Sorgeloos,P). Proceedings of the Global Conference onAquaculture 2010, Phuket, Thailand. FAO,Rome and NACA, Bangkok, 22-25 September2010 pp.33-35.
14. Produce (2011) Desembarque de recursoshidrobiológicos marítimos por tipo de uti-lización según especie. Ministry of Production,Government of Peru, Lima, Peru. <www.pro-duce.gob.pe/RepositorioAPS/3/jer/DESEMSUB-MENU01/2011/diciembre/0103.pdf>.
15. FAO (2012b) FAO Fisheries Department,Fishery Information, Data and Statistics Unit.Fishstat Plus: Universal software for fishery sta-tistical time series. Aquaculture production:quantities 1950 – 2010, Aquaculture produc-tion: values 1984 – 2010; Capture production:1950 – 2010; Commodities production andtrade: 1950 – 2010; Version 2.30.
16. FAO (2011) Aquaculture development. 5.
Use of wild fish as feed in aquaculture. FAOTechnical Guidelines for Responsible Fisheries.No. 5, Suppl. 5. Rome, FAO. 70p.
17. FAO (1995) Code of Conduct forResponsible Fisheries, Rome, FAO, 1995 ISBN92-5-103834-5.
18. Sustainable Fisheries Partnership (2012)Global sustainability overview of fisheries usedfor fishmeal and fish oil. <http://www.sustain-ablefish.org/about-us/staff/staff-list> accessedJune 2012.
19. IFFO (2012) International Fishmeal andFish Oil Organisation. Global Standard forResponsible Supply (IFFO-RS). <www.iffo.net>.
20. Mondoux, S, Pitcher, T & Pauly, D (2008)Ranking maritime countries by the sustainabili-ty of their fisheries. In: Fisheries Centre ResearchReport (eds., J Alder and D Pauly), 16, 13-27.
21. Funge-Smith, S, Lindebo, E & Staples, D(2011) Asian fisheries today: the production anduse of low-value/trash fish from marine fisheriesin the Asia-Pacific region. Bangkok, The Asia-Pacific Fishery Commission, RAP Publication2005/16, 47 pp.
22. FAO (2010) The state of world fisheries andaquaculture 2010. Rome, Italy, FAO Fisheriesand aquaculture department, The Food andAgriculture Organisation of the UnitedNations, 218 pp.
23. Frederiksen, M, Wanless, S, Harris, M P,Rothery, P & Wilson, L J (2004) The role ofindustrial fisheries and oceanographic changein the decline of North Sea black-legged kitti-wakes. Journal of Applied Ecology, 41, 1129-1139.
24. Macleod, C D, Begoña Santos, M, Reid, RJ, Scott, B E & Pierce, G J (2007) Linkingsandeel consumption and the likelihood ofstarvation in harbour porpoises in the ScottishNorth Sea: could climate change mean morestarving porpoises? Biology Letters 3, 185-188.
25. Lenfest (2012) Little fish big impact. Areport from the Lenfest Forage Fish Task Force,Washington D.C., USA, Lenfest OceanProgram, 108pp.
Figure 6. World fishmeal and fish oil consumption by aquaculture compared with growth in ‘fed’ aquacul-ture (millions of tonnes) during 2000-2010 (Solid line = Fed aquaculture; Broken line = Fish meal in aqua-culture; Dotted line = Fish oil in aquaculture), (left hand vertical axis refers to fed aquaculture; right handvertical axis refers to world fishmeal and fish oil consumption by fed aquaculture). (Shepherd & Jackson2012, based on data from IFFO and FAO 2012a) (33,2)
(tonnes x106)
(tonnes x106)
17 18/12/12 15:02 Page 1

18 WORLD AGRICULTURE
scientific26. Cohen, J T, Bellinger, D C & Connor, W E(2005) A quantitative risk-benefit analysis ofchanges in population fish consumption.American Journal of Preventive Medicine, 29,325-334.
27. Mozaffarian, D & Rimm, E B (2006) Fishintake, contaminants, and human health –evaluating the risks and the benefits. Journal ofthe American Medical Association, 29,1885–1895.
28. European Food Safety Authority (2012)Update of the monitoring of levels of dioxinand PCBs in food and feed. Scientific Report ofEFSA. EFSA Journal, 10, 2832.
29. Rivera-Milla, E, Stuermer, C A O &Málaga-Trillo, E (2003) An evolutionary basisfor scrapie disease: identification of a fishprion mRNA. Trends in Genetics, 19, 72-75.
30. Málaga-Trillo, E, Salta, E, Figueras, A,Panagiotidis, C & Sklaviadis, T (2011) Fishmodels in prion biology: underwater issues.Biochimica et Biophysica Acta, 1812, 402-414.
31. Roberts, R J & Shepherd, C J (1997).Handbook of trout and salmon diseases. ThirdEdition, Oxford, Blackwell Science, 1997 ISBN0 85238 244 8.
32. Mittaine, J F (2012). World fishmeal andoil supply/demand and outlook for markettrends. In: 7th JCI Spring Conference on Chinesefeed raw materials market. Hainan, China, 22 –23 March 2012.
33. Shepherd, C J & Jackson, A J (2012).Global fishmeal and fish oil supply – inputs,outputs and markets. Journal of Fish Biology (InPress).
34. Tacon, A G J, Hasan, M R & Metian, M(2011). Demand and supply of ingredients forfarmed fish and crustaceans - trends andprospects. FAO Fisheries and AquacultureTechnical Paper No. 564. FAO, 87 pp.
35. Tacon, A G & Metian, M (2008). Globaloverview on the use of fishmeal and fish oil inindustrially compounded aquafeeds: trends
and future prospects. Aquaculture, 285, 146 –158.
36. Turchini, G M, Ng, W-K. & Tocher, D R(2011). Fish oil replacement and alternative lipidsources in aquaculture feeds. Baton Rouge, CRCPress, 2011 ISBN 978-1-4398-0862-7.
37. Quinton, C D, Kause, A, Koskela, J &Ritola, A (2007). Breeding salmonids for feedefficiency in current fishmeal and future plant-based diet environments. Genetics SelectionEvolution 39, 431-446.
38. Crampton, V O, Nanton, D A, Ruohonen,K, Skjervold, P-O, & El-Mowafi, A (2010).Demonstration of salmon farming as a netproducer of fish protein and oil. AquacultureNutrition, 16, 437-446.
39. Sanden, M, Stubhaug, I, Berntssen, M HG, Lie, Ø & Torstensen, B E (2011). Atlanticsalmon (Salmo salar) as a net producer oflong-chain marine omega-3 fatty acids. Journalof Agricultural and Food Chemistry, 59, 12697-12706.
40. Olsen, R L & Hasan, M R (2012). A limitedsupply of fishmeal: impact on future increasesin global aquaculture production. Trends inFood Science & Technology, 27, 120-128.
41. Ismail, A (2010). The future of fish oils inthe omega-3 market. Presentation to the IFFOmembers’ Meeting. The International Fishmealand Fish Oil Organisation, Miami, USA, 14April 2010.
42. Steine, G, Tveterås, R and Pettersen, I(2011). Fish oil availability going forward –based on a memorandum to the NorwegianSeafood Federation. Presentation on 12th May2011.
43. Shepherd, C J (2012). Implications ofincreased competition for fish oil. Bergen,FishfarmingXpert, September 2012, 5, 40-45.
44. Jackson, A J (2012). The growing demandfor novel long chain omega-3 supplies.Presentation to the Omega-3 Summit, Ghent,Belgium, 23 April 2012. Aquaculture farm
Pelagic fish: a shoal of mackerel.
18 18/12/12 15:05 Page 1
WORLD AGRICULTURE 19
economic & social
GM crops, developingcountries andfood security
Francisco José Areal1, Laura Riesgo2 and Emilio Rodriguez-Cerezo3
School of Agriculture, Policy and Development, University ofReading1, UK; Department of Economics, University Pablo Olavide2,Spain; European Commission, Joint Research Centre (JRC), Institute
for Prospective Technological Studies (IPTS), Spain3
SummaryThe agronomic and economic performance of genetically modified (GM) crops relative to their conventional counterpartshas been largely investigated worldwide. As a result there is considerable information to conduct a meta-analysis toevaluate the agronomic and economic relative performance of GM crops vs. non GM crops by crop, GM trait, andcountry’s level of development. Such meta-analysis has been recently conducted showing that overall GM cropsoutperform non GM crops in both agronomic and economic terms (1). This paper focuses on the agronomic andeconomic performance of GM crops in developing and developed countries as well as the potential implications for globalfood security of adoption of GM crops by developing countries. The presumption that technology only benefits thedeveloped world is not supported by the meta-analysis conducted. No evidence that GM technology benefits more-developed than developing countries was found. Indeed, the agronomic and economic performance of GM crops vs.conventional crops tends to be better for developing than for developed countries. Although it is manifested that theconventional agronomic practices in developing countries are different to those in developed countries, it is also apparentthat GM crop adoption in developing countries may help to tackle the growing concerns over the scarcity of food globally. Key words: Developing countries, Food security, meta-analysis, genetically modified crops, Abbreviations: PDF, Probability density function.
Introduction
Discussions on the potentialagronomic, economic andenvironmental consequences
associated with adoption of geneticallymodified crops are becomingincreasingly relevant under currentfood security concerns (i.e. continuingpopulation and consumption growthmeans increase in the global demandfor food) (2) .
Since the adoption of GM cropsstarted in 1996 the adoption of thesecrops has grown rapidly. Currently, atotal of 148 million ha are covered byGM crops worldwide; herbicidetolerant (HT) and insect resistant (Bt)being the two main commercialisedtraits (3). There has been a lot ofdiscussion about the comparativeperformance of GM and conventionalcrops. A recent paper (1) used thescientific information available up todate to shed some light on this issue.Overall, the authors concluded thatthe agronomic and economicperformance of GM crops outweighsthe performance of their conventionalcounterparts. In particular, Bt (1) cropsperformed both agronomically andeconomically (gross margin)
significantly better than theirconventional counterparts. The picturefor HT (2) crops is less clear with resultssuggesting marginal benefits from GMcrops. GM crops economicallyoutperformed non GM crops in bothdeveloping (3) and developedcountries discrediting any presumptionon new technologies only benefitingthe developed world.
Data and MethodologyThe authors conducted a meta-analysisto investigate the agronomic and eco-nomic performance of commercialisedGM crops compared with their coun-terparts worldwide using a significantamount of information availablethrough a total of 63 scientific publica-tions. A weighted approach was usedin order to give more weight to infor-mation (i.e. absolute differences inyield, production costs and gross mar-gins between GM and conventionalcrops) obtained from studies withlarge samples. Inferences about theagronomic and economic perform-ance of GM crops in comparison withconventional crops were made usingBayesian methods.
Specifically, means of the absolutedifferences in yield, production costs
and gross margin were obtained. Amajor difference between the classicaland the Bayesian approach is that thelatter treats parameters as randomvariables. This means that the Bayesianapproach yields distributional informa-tion for the parameter studied. Also,Bayesian analysis can incorporate priorinformation about the parameteranalysed (in this case the absolute dif-ference of the variable of interest:yield, production cost, or gross mar-gin) using an appropriately chosenpdf.
In this case, a relatively diffuse priorwas used reflecting no prior informa-tion on what the absolute difference ofyield, production cost or gross marginbetween GM crops and their conven-tional counterparts may be. This effec-tively produces similar results to thatusing a classical approach (1).
Would GM technologyadoption benefit thedeveloping world?The scope of the meta-analysis con-ducted by (1) covers different levelssuch as crop level, level of country’sdevelopment, world region and as a
19 18/12/12 15:05 Page 1

20 WORLD AGRICULTURE
economic & social
whole. One important question in theGM crop debate is whether GM cropsperform well in developing countries,and whether, as a result, this may helpdelivering global food security chal-lenges.
With a continuously growing popu-lation, the pressure on the global foodsystem entails significant challengesregarding the stability of food suppliesand prices while maintaining the bio-diversity and ecosystem services andcontributing to the mitigation of cli-mate change (3).
Evidence suggests that adoption ofGM crops may play a role in helpingto achieve the stability of food sup-plies.
New technologies are usually devel-oped and taken first by developedcountries and made available later fordeveloping countries.
This has not been different for GMcrops. However, although the GMcrops area in developing countries wasmuch smaller than in developed coun-tries, the rapid adoption of GM tech-nology by developing countries, espe-cially since 2003, has meant that theGM crops area in developing countrieshas matched the GM crops area ofdeveloped countries in 2011, approxi-mately 80 million hectares (4).
Table 1 shows the mean and stan-dard deviation of conditional posteriordistributions of absolute difference of
the yield, production costs and grossmargins between GM and convention-al for developed and developing coun-tries (1). The table also shows theprobability of each absolute differenceto be above zero (i.e. the probabilitythat GM, Bt and HT crops outperformstheir conventional crops).
Figure 1 shows the posterior densityfunction of the absolute differencesbetween GM and conventional cropsfor yield, production costs and grossmargins per countries’ developmentlevel and GM trait.
The posterior density function wasestimated using kernel density estima-tion (i.e. using a kernel smoothingfunction). The values in the y axes arevalues for this function. A kernel is amore sophisticated version of a his-togram.
Therefore values in the y axes repre-sent a function of the frequency forvalues of the x-axis. While the x-axisrepresents the absolute differencesbetween GM and non-GM crops forthe variables of interest (i.e. yields,production costs and gross margins)the y-axis measures the frequency ofthese differences.
For instance, the top left graph (GMvs conventional yield) shows that onaverage most of the results for devel-oping countries fall between 0.3 and0.4 tonnes/ha difference between GMand conventional (i.e. GM crops havehigher yields than conventional).
Although most of the scientificpapers focus their analysis in Bt cot-ton, (1) conducted the analysis percrop and showed that the average dif-ference in yield between Bt maize andconventional was 0.5 tonnes/ha forboth developing and developed coun-tries. Hence the adoption of GM cropsby developing countries would con-tribute to the improvement of foodsecurity throughout a yield increaseeffect.
GM crops outperformed non-GMcrops in both developing and devel-oped countries in both agronomic andeconomic (gross margin) termsdespite the relatively high price forGM seeds.
GM crops perform agronomicallybetter than conventional crops in bothdeveloping and developed countries,with no significant differences in yieldsbetween them.
With regard to production costsadopting GM crops would have twoeffects: a reduction in costs due tosavings in pesticides and an increase incosts due to higher GM seed prices.
The overall picture for productioncosts suggests that the GM seed pricestend to be higher than the savings inpesticides, particularly in developingcountries, from where more informa-tion is available.
The better economic performanceof GM crops is mainly attributed tothe performance of Bt crops wheremost of the research has focused up todate. So far the evidence collatedabout the performance of HT crops issmall and no conclusions should betaken from it.
The relatively large difference ingross margins in developing countrieswith respect to developed countries(see Figure 1) is possibly due to impor-tant differences in the quality of thecrop between GM and their non GMcounterparts that are reflected inprices.
Such differences in gross marginsare evident for Bt crops.
In particular, for developing coun-tries Bt crops guarantee high cropquality (i.e. no mycotoxins) whereasthe conventional treatment in devel-oping countries is not adequate, andpossibly not comparable to conven-tional treatment in developed coun-tries (5,6,7).
Developing countries’ economieswould not only benefit from theincrease in supply derived from betteragronomic performance of their crop
Table 1. Mean of absolute difference of the yield, production costsand gross margins between GM and conventional crops for develop-ing and developed countries.
20 18/12/12 15:07 Page 1

WORLD AGRICULTURE 21
economic & social
Figure 1. Comparisons of the distribution of absolute values for the difference between GM and conven-tional crops in yield, production costs and gross margin for developed and developing countries. The verti-cal axis is the value of the kernel smoothing function to show the distribution of the differences; values onthe horizontal axes are expressed as: tonnes/ha, or as €/ha. Curves are based on results from 63 publishedsets of data where the difference parameter was calculated as: (GM minus non GM).
production. Also, increase in house-hold income derived from higher grossmargins can have a positive impact ondeveloping countries’ economies byincreasing their aggregate demand.The use of redistribution policies wouldalso help to ensure low income mem-bers of society also benefit from theeconomic effect of new technologies.
Discussions &conclusionsThe meta-analysis conducted using thescientific evidence to date (1) showsthat the adoption of new technologiesin developing countries may increaseglobal food security by 1) offeringfood available through increasingyields; 2) increasing the quality ofcrops supplied in developing countries.
One important aspect that helpstowards achieving food security chal-lenges is to build resilience in the foodsystem. In this respect, the environ-mental impacts from the adoption ofGM crops are less clear than the eco-nomic and agronomic impacts. Forinstance, it is unclear whether HTcrops could result in more herbicideresistant weeds (8,9).
A large number of producers indeveloping countries may be resistingGM crop adoption due to two main
factors: the relatively high price of GMseeds and the increased dependencyof farmers on multinational companiescontrolling the GM seed market(10,11). Also, potential loss of agricul-tural genetic diversity in developingcountries is a cause of concern (12).These aspects embrace market failuresassociated with not factoring in socialand environmental effects. Measures toensure such genetic diversity is main-tained, such as keeping separation dis-tances between adjacent GM and non-GM fields and the direct allocation ofareas where GM can be grown, areoptions that may help protect geneticdiversity. These are not small issuesand any attempt to contribute to foodsecurity through GM crop adoption indeveloping countries should take theseaspects into account.
Research on crop biotechnology isnot stopping and new areas of activityin crop biotechnology are likely to beexploited in 10 to 20 years (13). In thefuture it is foreseen that importantcrop biotechnological advances suchas improvements in photosyntheticefficiency, as well as improvements intolerance to plant pests and resistanceto diseases will occur. These new areasshould provide opportunities for devel-
oped and developing countries to con-tribute to global food security.
DisclaimerThe views expressed are purely thoseof the authors and may not in any cir-cumstances be regarded as stating anofficial position of the EuropeanCommission.
References(1). Amongst Bt crops only Bt maize and Btcotton were analysed this paper.
(2).HT crops include HT oilseed, HT soybeanand HT maize.
(3).Countries were grouped into developingand developed countries following theInternational Monetary Fund’s classification.
1.Areal, F J, Riesgo, L, Rodriguez-Cerezo, E(2012) Economic and agronomic impact ofcommercialized GM crops: a meta-analysis.Journal of Agricultural Science, 151, 7-33.
2.Godfray, H C J, Beddington, J R, Crute, I R,Haddad, L, Lawrence, D, Muir, J F, Pretty, J,Robinson, S, Thomas, S M, Toulmin, C (2010)Food Security: The challenge of feeding 9 bil-lion people. Science, 327, 812-17.
3.The Government Office for Science (2011)Foresight. The future of food and farming. FinalProject Report. London
4.James, C (2011) Global status of commer-cialised biotech/GM crops: 2010. ISAAA Brief42-2010. Ithaca, NT: ISAAA.
5.Wu, F (2006) Mycotoxin reduction in Btcorn: potential economic, health and regulato-ry issues. Transgenic Research, 15, 277-89.
21 18/12/12 15:07 Page 1

22 WORLD AGRICULTURE
economic & social6. Huesing, J, and English, L (2004) The impactof Bt crops on developing crop. AgBioForum, 7,84-95.
7.Qaim, M, Pray, C E, Zilberman, D (2008)Economic and social considerations in theadoption of Bt crops, in Romeis et al. (eds.)Integration of insect-resistant genetically modifiedcrops within IPM programs, 329-56.Netherlands: Springer.
8.Bonny, S (2011) Herbicide-tolerant soybeanover 15 years of cultivation: pesticide use,weed resistance, and some economic issues.The case of the USA. Sustainability, 3, 1302-22.
9.Cerdeira, A L, Gazziero, D L P, Duke, S O,Matallo, M B, Spadotto, C A (2007)Review ofpotential environmental impacts of transgenicglyphosate-resistant soybean in Brazil. Journalof Environmental Science and Health, Part B:Pesticides, Food Contaminants, and Agricultural
Wastes, 42, 539-49.
10.Qaim, M, and de Janvry, A (2003):Genetically modified crops, corporate pricingstrategies, and farmers’ adoption: the case ofBt cotton in Argentina. American Journal ofAgricultural Economics, 85, 814-28.
11.FAO (2002) World Agriculture: Towards2015/2030. Rome: FAO. Available online:http://www.fao.org/docrep/004/y3557e/y3557e00.htm Snow, A A (2002) Transgenic crops –why gene flow matters. Nature Biotechnology,20, 542.
12.Snow, A A (2002) Transgenic crops – whygene flow matters. Nature Biotechnology, 20,542.
13.Dunwell, J M (2010) Foresight project onglobal food and farming futures. Crop biotech-nology: prospects and opportunities. Journal ofAgricultural Science, 1-11.
Bt cotton crop in Texas.
HT soybeans
22 18/12/12 15:08 Page 1

WORLD AGRICULTURE 23
economic & social
Land Degradation and theRural Poor
Edward B. BarbierJohn S. Bugas Professor of Economics, University of Wyoming
SummaryBy 2025, the rural population of the developing world will have increased to almost 3.2 billion, placing increasingpressure on natural resources, especially arable land. Around 1.3 billion people in developing economies live in mar-ginal areas and on ecologically fragile land, such as converted forest frontier areas, poor quality uplands, and convert-ed wetlands. Around two-thirds are among the poorest rural households, who have very few productive assets, exceptland and unskilled labour, and live in remote areas. It is these “asset-less” poor who are most likely to suffer fromextreme land degradation, resulting in a “poverty-environment trap”. In addition, developing economies with highconcentrations of their populations on fragile lands and in remote areas not only display high rates of rural poverty butalso are some of the poorest countries in the world today. Policies to eradicate poverty and reduce land degradationtherefore need to be targeted at the poor where they live, especially the rural poor clustered in fragile environments,remote areas and marginal land.Keywords: developing countries, fragile environment, land degradation, rural povertyAbbreviations: PES, Payment for ecosystem services.Glossary: Remote areas: locations with poor market access, requiring five or more hours to reach amarket town of 5,000 or more.
IntroductionLand use in developing countries iscritically bound up with their patternof economic development. Most ofthese economies, and certainly themajority of the populations living with-in them, depend directly on naturalresources. Primary product exportsaccount for the vast majority of theexport earnings of many developingeconomies, and one or two primarycommodities make up the bulk ofexports (1). Agricultural value addedaccounts for an average of 40% ofgross domestic product (GDP), andnearly 80% of the labour force areengaged in agricultural or resource-based activities (2). Further adding tothese disparities, by 2025, the ruralpopulation of the developing worldwill have increased to almost 3.2 bil-lion, placing increasing pressure onnatural resources, especially arableland (3).
As a result of these trends, expan-sion of less-favoured agricultural landsis occurring primarily to meet the sub-sistence and near-subsistence needs ofpoor rural households. This is not anew phenomenon, yet this process hasbecome a major structural feature ofmost poor economies. Many of theworld's rural poor continue to be con-centrated in the less ecologicallyfavoured and remote areas of develop-ing regions, such as converted forestfrontier areas, poor quality uplands,converted wetlands, and similar landswith limited agricultural potential (4-
7). Population increases and othereconomic pressures are driving manyof the rural poor to bring yet moremarginal land into production (3,8,9).Such marginal land expansion contin-ues to absorb the growing number ofrural poor in developing economies(5,8,10).
The result is that the rural poorlocated on marginal and low produc-tivity agricultural land typically employtraditional farming methods, earn neg-ligible land rents or profits, face inse-cure tenure arrangements, enduresevere land degradation, and haveinadequate access to transport, infra-structure and markets (1,5,10-14).
This paper argues that, because ofthe increasing concentration of therural poor in areas of fragile environ-ments prone to land degradation andremote from markets, there is a needto re-think global development strate-gies to cope with this problem.
The next section provides evidenceof the scale of the poverty and landproblem. It is subsequently shownthat the economic vulnerability of the“asset-less” poor in remote and fragileenvironments creates problems of“poverty traps”. Overcoming suchtraps and reducing land degradationrequires a different policy strategyaimed at targeting the rural poorwhere they are concentrated inremote and less favoured areas, andalleviating the constraints that theyface to improving their livelihoods.
Marginal LandSince 1950, the estimated populationin developing economies on “fragilelands” prone to land degradation hasdoubled (6). These fragile environ-ments consist of upland areas, forestsystems and drylands that suffer fromlow agricultural productivity, and areasthat present significant constraints forintensive agriculture. Today, nearly 1.3billion people – almost a fifth of theworld’s population – live in such areasin developing regions (6).
Other estimates suggest that poorpeople in developing countries arepredominantly found in areas with thegreatest potential for land and waterdegradation; i.e., land with highlyweathered soils, steep slopes, inade-quate or excess rainfall, and high tem-peratures (4). About 630 million of therural poor live on these unfavourablelands in the developing world, where-as just under 320 million of the poorhave access to favoured lands (4).
Figure 1 further illustrates that ruralpoverty is correlated with the fractionof the population in developing coun-tries found in degradable and poorquality lands. As the figure indicates,for a sample of 92 low and middleincome economies, the incidence ofrural poverty rises with the share ofthe total population concentrated onfragile lands. Although the averagepoverty rate across all economies is45.3%, the rate falls to 36.4% forthose countries with less than 20% of
23 24/12/12 11:59 Page 1

24 WORLD AGRICULTURE
economic & social
their population in fragile environ-ments. For those with more than 50%of their populations in marginal areas,however, the incidence of rural povertyrises to 50% or more.
The rural poor of developingeconomies also tend to be concentrat-ed in remote areas, locations with poormarket access and that require five ormore hours to reach a market town of5,000 or more (see Figure 2). Around430 million people in developingcountries live in such distant ruralareas, and nearly half (49%) of thesepopulations are located in lessfavoured areas, which are semi-desertand semi-arid regions characterized byfrequent moisture stress that limitsagricultural production and landdegradation (7). As indicated in Figure2, developing countries that have alarger share of their rural populationslocated in remote rural areas also dis-play higher rural poverty rates. Across91 developing countries, the average(median) share of rural population in
remote areas is 26.9% (19.0%), where-as the average (median) share of ruralpopulation in poverty is 45.2%(46.5%).
Developing economies with highconcentrations of their populations onfragile lands and in remote areas notonly display high rates of rural povertybut also are some of the poorest coun-tries in the world today. As indicatedin Figure 3, for a sample of 104 lowand middle income economies, realGDP per capita declines sharply withthe share of the population in fragileenvironments. For all economies, theaverage GDP per capita is $1,952, butfor those economies with less than20% of their populations on fragilelands, real GDP per capita more thandoubles to $3,961. In contrast, forthose economies with 50% or more ofthe population in fragile lands, GDPper capita falls to $822 or less. Thelow-income, or poorest, economies ofthe world are those in which 2009Gross National Income per capita was
$995 or less (2). Similarly, as Figure 4indicates, developing economies with alarge share of their rural populationslocated in remote areas tend to be rel-atively poor. Across 104 countries, theaverage (median) share of rural popu-lation in remote areas is 26.9%(18.7%), and the average (median)share of real GDP per capita is $2,075($1,100).
The rural poor will continue to beclustered on marginal lands, fragileenvironments and remote areas, givencurrent global rural population andpoverty trends. First, despite rapidglobal urbanization, the rural popula-tion of developing regions continues togrow, albeit at a slower rate in recentyears. From 1950 to 1975, annualrural population growth in theseregions was 1.8%, and from 1975 to2007 it was just over 1.0% (3).Second, the vast majority of theworld’s poor still live in rural areas,even allowing for the higher cost of liv-ing facing the poor in urban areas. Ingeneral, about twice as many poorpeople live in rural than in urban areasin the developing world (9). Around30% of the rural population in devel-oping economies survive on less thanUS $1 a day and 70% live on less thanUS$2 a day, yet the respective povertyrates in urban areas are less than halfof these rural rates (9).
Review of evidenceBecause the rural poor of developingeconomies are often concentrated inecologically fragile and remote loca-tions, these areas can become signifi-cant poverty traps. To understandwhy, it is important to identify the typi-cal conditions facing the “asset-less”poor in such regions that influencetheir use of available natural capital.
The poorest rural households indeveloping economies have very fewproductive assets (11). First, land isone of the few productive assetsowned by the rural poor, and almostall households engage in some form ofagriculture, but the size of landhold-ings tends to be very small. Second,poor rural households tend to rely onselling their only other asset, unskilledlabour. Agriculture is generally not themainstay of most these households;instead, they generally obtain most oftheir income from off-farm work asagricultural labourers or in unskilledpaid work or occupations outside ofagriculture. However, when house-holds do engage in outside employ-ment, they tend to migrate only tem-porarily and for short distances.
Figure 1: The rural poor and population on fragile lands in developingeconomies.
Figure 2: The rural poor and population in remote areas of developingeconomies.
24 18/12/12 15:09 Page 1

WORLD AGRICULTURE 25
economic & social
Permanent migration over long dis-tances for work is rare for most poorrural households (11). Thus, given thelack of ownership of assets by the ruralpoor, and their tendency to staywhere they are located, it is not sur-prising that the livelihoods of the"asset-less" poor are often the mostdependent on their surrounding natu-ral environments, including the poorquality "marginal" land available forcultivation.
The range of choices and trade-offsavailable to the poor is also affectedby their access to key markets, such asfor land, labour, credit as well asgoods and services, as well as thequality and state of the land and sur-rounding environment on which theirlivelihoods depend (1,5,7,10-15).Because of missing or inaccessiblemarkets, therefore, the “asset-less”poor often depend on exploiting thesurrounding environment and avail-able marginal land for survival (12).This is especially the case in remote
rural areas, where local markets areisolated from larger regional andnational markets and essential publicservices are lacking (13).
Lack of assets and access to keymarkets may also constrain the abilityof poor households to adopt technolo-gies to improve their farming systemsand livelihoods. A meta-analysis basedon 120 cases of agricultural andforestry technology by smallholdersacross the developing world foundthat credit, savings, prices, marketconstraints, and access to extensionand training, as well as tenure andplot characteristics, such as soil qualityand landholding size, are importantdeterminants of adoption behaviour(16). Not surprisingly, the result is lowadoption rates for sustainable agricul-tural and forestry technologies amongpoor smallholders, especially thosewith lower quality soils. InMozambique, market access throughan adequate road network and trans-port services is crucial in determining
the successful adoption of improvedagricultural technologies, and mayeven compensate for the disadvan-tages of marginal environments, suchas poor rainfall (17). In Nepal andEthiopia, the lack of vital infrastruc-ture, such as roads, irrigation andinfrastructure, severely constrains theability of poor farmers in remote andenvironmentally fragile areas to adoptnew technologies and increase agricul-tural incomes (18, 19).
Given that poor rural householdsengage in some agriculture, and arehighly dependent on outside employ-ment for income, their livelihoodstrategies across these activities mustbe inter-dependent. In particular, asthe "natural" assets and land availableto them degrade or disappear, therural poor are likely to search for morepaid work to increase their earningsfrom outside jobs. Such environmen-tal degradation effectively lowers the“reservation wage” of the poor foraccepting paid work, as householdsare forced to look for additional workto make up the lost income (12,15,20-22).
For example, in the Yucatán,Mexico, in response to increased pop-ulation density and declining soil fertil-ity, only the better off households areable to devote more labour to off-farmemployment; in contrast, the poorerhouseholds allocate even more labourto shifting cultivation, thus perpetuat-ing problems of shortened fallows anddeclining yields (21,22). On the otherhand, in the rain-fed upland areas ofHonduras, favourable rainfall duringthe secondary season lowers the prob-ability that a household's income-earn-ing strategy focuses on off-farm work,probably because it makes own farmvegetable production more profitable(20).
Evidence from the Philippines con-firms that higher wages for off-farmemployment can draw away small-holder labour that would otherwise beused for clearing more forests for on-farm agricultural production (10,Shively and Fisher 2004). However,poorer households in remote locationsare the least likely to participate in off-farm employment, as they face highertransaction and transportation costs(23). Similar results have been foundin Nepal; higher wages reduce small-holder deforestation, but only if thereare paid employment opportunitiesavailable in remote areas (24). Non-farm employment and improvedwages in Honduras has also been asso-ciated with investments to improve
Figure 3. Fragile land population and GDP per capita in developingeconomies.
Figure 4. Remote rural population and GDP ($) per capita in develop-ing economies: (2,7).
25 24/12/12 12:00 Page 1

26 WORLD AGRICULTURE
economic & socialcropland quality in Honduras andimproved resource conditions inUganda (25). In El Salvador, as theemployment opportunities and incomeper capita of agricultural wage ownersdeclined, they relied increasingly oncultivating land for subsistence produc-tion. But rising income growth alsoenables poor and near poor house-holds to acquire more land for cultiva-tion, as a precaution against possiblefuture income losses (26). In Honduras,there is concern that the 30-50%decline in real wages over the pastdecade has shifted upland householdsto income strategies emphasizing hill-side cropland expansion and resourcedegradation that has worsened ruralpoverty (20). Similarly, in the Yucatán,because they have limited access tooff-farm employment, the least poorhouseholds tend to over-supply labourto shifting cultivation and thus cleartoo much forest land (22).
Although higher non-farm incomemay discourage cropland expansionand deforestation, it does not necessar-ily follow that households will investmore in conserving and improvingexisting land. For example, in theEthiopian highlands, better access tolow-wage non-farm employmentimproved substantially the income ofhouseholds, but because it alsoreduced farming activities and foodproduction, increased non-farmincome also undermined the incentivesfor soil conservation (27). Similarly, asreal wages rise, the poorest householdsin the Yucatán actually decrease theirsupply of labour to outside employ-ment and increase clearing forests forshifting cultivation. In contrast, richerhouseholds respond to higher realwages but supplying more labour tooutside work, thus reducing shiftingcultivation and deforestation (22).
Towards a new povertyeradication strategyTo summarize, a distinct geographicpattern of natural resource use andrural poverty has emerged in develop-ing economies. Many low and middle-income economies display a high con-centration of a large segment of thepopulation in fragile environments andin remote areas with poor marketaccess, and rural poverty. Moreover,there appears to be a correlation ofthis pattern of resource use with pooreconomic performance: those develop-ing countries that are highly resourcedependent and whose populations thatare concentrated in marginal andremote areas tend not only to have a
high incidence of rural poverty but alsoare some of the poorest economies inthe world.
To eradicate such persistent prob-lems of geographically concentratedrural poverty in developing economieswill require a new poverty eradicationstrategy. Such a targeted strategy forthe rural poor in remote and lessfavoured areas will require the follow-ing components:
� Provide financing directly, throughinvolving the poor in payment forecosystem services schemes and similarincentive mechanisms that enhancethe environments on which the poordepend.
� Target investments directly toimproving the livelihoods of the ruralpoor, especially their existing agricul-tural and resource production activi-ties, thus reducing their dependenceon exploiting environmental resources.
� Improve access of the rural poor inless favoured and remote areas to well-functioning and affordable markets forcredit, insurance and land.
� Reduce the high transportation andtransaction costs that prohibit thepoorest households in remote areas toengage in off-farm employment and tointegrate with larger markets.
� Addressing the specific problem ofover-grazing and land degradation insemi-arid and arid regions.
� Improving education of women inremote and environmentally fragilerural areas.
If policies are to be targeted toimprove both rural livelihoods and toprotect the fragile environments onwhich many poor people depend, sucha strategy must take into accountmany important factors influencinghouseholds’ behaviour, including lackof income opportunities or access tokey markets for land, labour and credit,and the availability and quality of natu-ral resources, including land, to exploit(12). Nevertheless, there are severalways in which a strategy could bedeveloped to target improving thelivelihoods of the poor.
The first is to provide financingdirectly, through involving the poor inpayment for ecosystem servicesschemes and other measures thatenhance the environments on whichthe poor depend (28-31). Paymentsfor the conservation of standing forestsor wildlife habitat are the most fre-quent type of compensation pro-grammes used currently in developingcountries, and they have been mainly
aimed at paying landowners for theopportunity costs of preserving naturallandscapes that provide one or morediverse services: carbon sequestration,watershed protection, biodiversity ben-efits, wildlife protection and landscapebeauty (28, 29,31). Wherever possible,the payment schemes should bedesigned to increase the participationof the poor, to reduce any negativeimpacts on non-participants while cre-ating additional job opportunities forrural workers, and to provide technicalassistance, access to inputs, credit andother support to encourage poorsmallholders to adopt the desired landuse practices. More effort must also bedevoted to designing projects and pro-grams that include the direct participa-tion of the landless and near landless.
Spatial targeting of payments forecosystem services may be one way ofboth reducing costs of implementationand also ensuring that more benefitsreach the rural poor, as programmesand studies in Costa Rica, Ecuador,Guatemala and Madagascar haveshown (32-34). Even in a poor Africaneconomy, such as Tanzania, a correctlydesigned payment for ecosystem serv-ices (PES) programme can provide animportant source of funding for sus-tainable land use practices in agricul-ture while leading to greater watershedprotection (35). In the upstreamcatchment area of the Ruvu River, poorfarmers face financial and technicalobstacles to adopting sustainable landmanagement that reduce soil erosionand enhance downstream water quali-ty. By providing institutional, technicaland financial support to farmers, a PESscheme for watershed protection deliv-ers on these environmental goals whileat the same time boosting crop pro-ductivity from improved soil conserva-tion and fertility and thus raising farmincomes. The PES scheme is nowbeing used to enhance sustainability byinvesting in an appropriate legal andinstitutional framework for long-termfinancing and expansion of sustainableland management among farmers toimprove watershed management.
A second objective is to targetinvestments directly to improving thelivelihoods of the rural poor in remoteand fragile environments. For exam-ple, in Ecuador, Madagascar andCambodia poverty maps have beendeveloped to target public investmentsto geographically defined sub-groupsof the population according to theirrelative poverty status, which couldsubstantially improve the performanceof the programmes in term of poverty
26 18/12/12 15:10 Page 1
WORLD AGRICULTURE 27
economic & socialalleviation (36). A study that examined122 targeted programmes in 48 devel-oping countries confirms their effec-tiveness in reducing poverty, if they aredesigned properly (37). A review ofpoverty alleviation programmes inChina, Indonesia, Mexico and Vietnamalso found evidence of success inspecifically targeting spatially disadvan-taged areas and households, althoughthe benefits are larger when pro-grammes, such as PROGRESA inMexico, were successful in employingsecond-round targeting to identifyhouseholds in poor locations and thusreducing leakages to non-poor house-holds (38).
Research, extension and agriculturaldevelopment has historically been ori-ented towards major commercial andexport-oriented crops in developingeconomies, not targeted for improvinglow-productivity agricultural systems orfarming in less favourable environ-ments. Yet such improvements cansubstantially improve the livelihoods ofthe poor, increase employment oppor-tunities and even reduce environmen-tal degradation (1,8,10,18,39,40).Empirical evidence of technicalchange, increased public investmentsand improved extension services inremote regions indicates that anyresulting land improvements that doincrease the value of homesteads canhave a positive effect on both landrents and in reducing agriculturalexpansion (10,18,19,40-42).
In addition, policies need to addressthe lack of access of the rural poor inless favoured areas to well-functioningand affordable markets for credit,insurance and land, and the hightransportation and transaction coststhat prohibit the poorest households inremote areas to engage in off-farmemployment, which are the majorlong-run obstacles that need to beaddressed. As discussed previously,such problems lie at the heart of thepoverty trap faced by many poor peo-ple in remote and less favoured areas(12-13). For example, improving mar-ket integration may depend on target-ed investments in a range of publicservices and infrastructure in remoteand ecologically fragile regions, suchas extension services, roads, communi-cations, protection of property, market-ing services and other strategies toimprove smallholder accessibility tolarger markets. For poor households inremote areas of a wide range of devel-oping countries, the combination oftargeting agricultural research andextension services to poor farmers
combined with investments in ruralroad infrastructure to improve marketaccess appears to generate positivedevelopment and poverty alleviationbenefits (16-19,41,43). In Mexico,poverty mapping was found toenhance the targeting of maize cropbreeding efforts to poor rural commu-nities in less favourable and remoteareas (41). In the Central Highlands ofVietnam, the introduction of fertilizer,improved access to rural roads andmarkets, and expansion of irrigationincreased dramatically agricultural pro-ductivity and incomes (43).
Because they face higher transactionand transportation costs, poorerhouseholds in remote locations are theleast likely to participate in off-farmemployment. Yet, as discussed previ-ously, when off-farm employmentopportunities are available in remoteareas, they can reduce conditions fos-tering the poverty-environment trapfaced by poor households (10,21-24,26). For example, in Columbia,high-input, intensified, highly mecha-nized cropping on the most suitableland, as well as expansion in cattlegrazing has drawn labour from moretraditional agriculture, so that areas ofmarginal land are slowly being aban-doned and revegetating (44).Investments in expanded marketopportunities, improving market accessand expanding public infrastructureand services, including, rural educationand health services, seem to be impor-tant factors in both reducing the barri-ers to household participation in off-farm opportunities and expandingtheir supply.
Of particular concern is addressingthe problem of overgrazing of range-lands in remote semi-arid and aridregions. Around 10 to 20% of globaldrylands experience some form ofsevere land degradation, affecting thelivelihoods of around 250 million inthe developing world (45). Raisinglivestock is often the predominant useof these lands, which supports thelivelihoods of the poorest rural house-holds. For example, in Kenya range-lands have some of the highest povertyrates in Kenya, and they are also theareas with poorest access to roads,education and health services, andgeneral infrastructure (46). A concert-ed effort is required to target policiesand investments directly to improvingthe livelihoods of the rural poordependent on rangelands in drylandregions and improving the sustainabili-ty of grazing methods. There is also aneed to improve upon and develop
community-based payment schemesfor ecosystem services that target therural poor on rangelands (47).
Tackling gender inequalities withinhouseholds in remote rural areas isoften identified as important forimproving and diversifying livelihoods(48, 49). Evidence suggests thatfemale-headed households may alsolack access to crucial productiveresources, certain labour-intensiveactivities are more difficult for house-holds without sufficient youthful andable-bodied workers, and women maybe excluded from participating inschooling or off-farm labour markets(49). Remote and less-favored areasnot only have fewer health and educa-tion programmes, but women in theseareas especially lack access to such pro-grammes, further contributing tohousehold poverty, poor nutrition andchild morbidity and mortality (49).Policies and investments that addresswomen's education and health inremote and fragile rural areas as wellas the particular production and liveli-hood constraints faced by female-headed households are urgently need-ed.
ConclusionOvercoming the problem of wide-spread rural poverty and land degrada-tion in developing economies willrequire new strategies for povertyeradication that take into account theincreasing geographical concentrationof the rural poor in remote and lessfavoured areas. Rural poverty rates indeveloping economies have declinedover the past decade but remain highin South Asia (40%) and Sub-SaharanAfrica (51%), and where reduction inrural poverty has occurred, it is largelydue to rural development and notrural-urban migration (7).
Policies to eradicate poverty there-fore need to be targeted at the poorwhere they live, especially the ruralpoor clustered in fragile environmentsand remote areas. The specific ele-ments of such a strategy includeinvolving the poor in payment forecosystem services schemes and othermeasures that enhance the environ-ments on which the poor depend, tar-geting investments directly to improv-ing the livelihoods of the rural poor,thus reducing their dependence onexploiting environmental resources,and tackling the lack of access of therural poor in less favoured areas towell-functioning and affordable mar-kets for credit, insurance and land, andthe high transportation and transaction
27 18/12/12 15:11 Page 1

28 WORLD AGRICULTURE
economic & socialcosts that prohibit the poorest house-holds in remote areas to engage in off-farm employment. A special effort isalso needed to target women andfemale-headed households in remoteand poor rural areas, as well as range-land systems in drylands.
Finally, a policy strategy targeted atimproving the livelihoods of the ruralpoor located in remote and fragileenvironments must be assessed againstan alternative strategy, which is toencourage greater out-migration fromthese areas. Rarely, however, are thetwo types of policy strategies, invest-ment in poor rural areas and targetedout-migration, directly compared. Inaddition, only recently have the link-ages between rural out-migration,smallholder agriculture and land usechange and degradation in remoteareas been analyzed (50). Anotherimportant emerging area of research isto examine the economic choicesmade by poor rural households tomigrate to remote and environmental-ly poor frontier regions as opposed tourban areas (1,8,12). Researchingsuch linkages will become increasinglyimportant to understanding the condi-tions under which policies to encour-age greater rural out-migration shouldbe preferred to a targeted strategy toovercome the root cause of the pover-ty-environment and spatial-povertytraps in remote and fragile areas.
References1. Barbier, E B (2005) Natural resources and eco-nomic development. Cambridge, CambridgeUniversity Press 2005 ISBN 0-521-82313-7.2. World Bank (2012) Word development indica-tors 2012. Washington DC, The World Bank.3. Population Division of the United NationsSecretariat (2008) World urbanization prospects:the 2007 revision: executive summary. New York,United Nations.4. Comprehensive Assessment of WaterManagement in Agriculture (2007) Water forfood, water for life: a comprehensive assessment ofwater management in agriculture. London,Earthscan and International Water ManagementInstitute, Colombo, Sri Lanka.5. International Fund for AgriculturalDevelopment (2010) Rural poverty report 2011.New Realities, new challenges: new opportunitiesfor tomorrow’s generation. Rome, IFAD.6. World Bank (2003) World development report2003. Washington DC, World Bank.7. World Bank (2008) World development report2008. Washington DC, World Bank.8. Carr, D (2009) Population and deforestation:why rural migration matters Progress in HumanGeography 33, 355-378.9. Chen S & Ravallion, M. (2007) Absolutepoverty measures for the developing world,1981-2004. Proceedings of the National Academyof Sciences 104(43), 16757-16762.10. Coxhead, I, Shively, G E & Shuai, X (2002)Development policies, resource constraints, andagricultural expansion on the Philippine landfrontier Environment and Development Economics7, 341-364.11. Banerjee, A V & Duflo, E. (2007). The eco-nomic lives of the poor Journal of Economic
Perspectives 21(1), 141-168.12. Barbier, E B (2010) Poverty, developmentand environment. Environment and DevelopmentEconomics 15,635-660. 13. Barrett, C (2008) Smallholder market par-ticipation: concepts and evidence from easternand southern Africa Food Policy 33,299-317.14. Dercon, S (2009) Rural poverty: old chal-lenges in new contexts World Bank ResearchObserver 24, 1-28.15. Dasgupta, P (1993) An inquiry into well-beingand destitution New York, Oxford UniversityPress ISBN 0-19-828835-2.16. Pattanayak, S K, Mercer, D E, Sills, E & YangJ-C (2003) Taking stock of agroforestry adoptionstudies. Agroforestry Systems 57,173-186.17. Cunguara, B & Darnhofer, I (2011) Assessingthe impact of improved agricultural technologieson household income in rural Mozambique.Food Policy 36, 378-390.18. Dercon, S, Gilligan, D O, Hoddinott, J &Woldehanna, T (2009) The impact of agricultur-al extension and roads on poverty and con-sumption growth in fifteen Ethiopian villages.American Journal of Agricultural Economics91,1007-1021.19. Dillon, A, Sharma, M & Zhang, X (2011)Estimating the impact of rural investments inNepal. Food Policy 36,250-258.20. Jansen, H G P, Rodriguez, A, Damon, A,Pender, J, Chenier, J & Schipper, R (2006)Determinants of income-earning strategies andadoption of conservation practices in hillsidecommunities in rural Honduras. AgriculturalSystems 88,92-110.21. Pascual, U & Barbier, E B (2006) Deprivedland-use intensification in shifting cultivation:the population pressure hypothesis revisited.Agricultural Economics 34,155-165.22. Pascual, U & Barbier, E B (2007) On priceliberalization, poverty, and shifting cultivation:an example from Mexico. Land Economics83(2),192-216.23. Shively, G E & Fisher, M (2004) Smallholderlabour and deforestation: a systems approach.American Journal of Agricultural Economics86(5),1361-1366.24. Bluffstone, R A (1995) The effect of labourmarket performance on deforestation in devel-oping countries under open access: an examplefrom rural Nepal. Journal of EnvironmentalEconomics and Management 29,42-63.25. Pender, J. (2004) Development pathways forhillsides and highlands: some lessons fromCentral America and East Africa. Food Policy29,339-367.26. Gonazález-Vega, C J, Rodríguez-Meza, J,Southgate, D & Maldonado, J H (2004) Poverty,structural transformation, and land use in ElSalvador: learning from household panel data.American Journal of Agricultural Economics86(5),1367-1374. 27. Holden, S, Shiferaw, B & Pender, J (2004)Non-farm income, household welfare, and sus-tainable land management in a less-favouredarea in the Ethiopian highlands. Food Policy 29,369-392.28. Grieg-Gran, M-A, Porras, I, & Wunder, S(2005) How can market mechanisms for forestenvironmental services help the poor?Preliminary lessons from Latin America. WorldDevelopment 33(9),1511–1527.29. Pagiola, S, Arcenas, A & Platais, G (2005)Can payments for environmental services helpreduce poverty? An exploration of the issues andthe evidence to date from Latin America. WorldDevelopment 33(2),237-253.30. Pattanayak, S K, Wunder, S & Ferraro, P J(2010) Show me the money: do payments sup-ply environmental services in developing coun-tries? Review of Environmental Economics andPolicy 4(2),254-274.31. Wunder, S (2008) Payments for environmen-tal services and the poor: concepts and prelimi-nary evidence. Environment and DevelopmentEconomics 13,279-297.32. Southgate, D, Haab, T, Lundine, J &Rodríguez, F (2009) Payments for environmentalservices and rural livelihood strategies in Ecuador
and Guatemala. Environment and DevelopmentEconomics 15,21-37.33. Wendland, K J (2010) Targeting and imple-menting payments for ecosystem services:Opportunities for bundling biodiversity conser-vation with carbon and water services inMadagascar. Ecological Economics 69,2093-2107.34. Wünscher, T, Engel, S & Wunder, S (2008)Spatial targeting of payments for environmentalservices: A tool for boosting conservation bene-fits. Ecological Economics 66,822-833.35. Branca, G, Lipper, L, Neves, B, Lopa, D &Mwanyoka, I (2011) Payments for watershedservices supporting sustainable agriculturaldevelopment in Tanzania. Journal of Environmentand Development 20,278-302.36. Elbers, C, Fujii, T, Lanjouw, P, Özler, B & Yin,W (2007) Poverty alleviation through geograph-ic targeting: How much does disaggregationhelp? Journal of Development Economics 83,198-213.37. Coady, D, Grosh, M & Hoddinott, J (2004)Targeting outcomes redux. World Bank ResearchObserver 19(1),61–85. 38. Higgins, K, Bird, K & Harris, D (2010) Policyresponses to the spatial dimensions of poverty.ODI Working Paper 328. London, OverseasDevelopment Institute.39. Caviglia-Harris, J L & Harris, D (2008)Integrating survey and remote sensing data toanalyze land use scale: insights from agriculturalhouseholds in the Brazilian Amazon.International Regional Science Review 31,115-137.40. Maertens, M, Zeller, M &Birner, R (2006)Sustainable agricultural intensification in forestfrontier areas. Agricultural Economics 34,197-206.41. Bellon, M R., Hodson, D, Bergvinson, DBeck, D, Martinez-Romero, E & Montoya, Y(2005) Targeting agricultural research to benefitpoor farmers: Relating poverty mapping tomaize environments in Mexico. Food Policy30,476-492.42. Sills, E & Caviglia-Harris, J L (2008) Evolutionof the Amazonian frontier: Land values inRondônia, Brazil. Land Use Policy 26,55-67.43. Müller, D & Zeller Z (2002) Land usedynamics in the central highlands of Vietnam: aspatial model combining village survey data withsatellite imagery interpretation. AgriculturalEconomics 27, 333-354.44. Etter A, McAlpine, C, & Possingham, H(2008) Historical patterns and drivers of land-scape change in Colombia since 1500: a region-alized spatial approach. Annals of the Associationof American Geographers 98,2-23.45. Reynolds, J F, Stafford Smith, D M, Lambin, EF, Turner, B L, Mortimore, M, Batterbury, S P J,Downing, T E, Dowlatabadi, H, Fernández, R J,Herrick, J E, Huber-Sannwald, E, Jiang, H,Leemans, R, Lynam, T, Maestre, F T, Ayarza, M,& Walker, B (2007) Global Desertification:Building a Science for Dryland Development.Science 316, 847-851.46. Okwi, P O, Ndeng’e, g, Kristjanson, P,Arunga, M, Notenbaert, A, Omolo, A,Henninger, N, Benson, T, Kariuki, P & Owuoi, J(2007) Spatial determinants of poverty in ruralKenya.” Proceedings of the National Academy ofSciences 104,16769-16774.47. Dougill, A J, Stringer, L C, Leventon, J,Riddell, M, Rueff, H, Spracklen, D V & Butt, E(2012). Lessons from community-based pay-ment for ecosystem service schemes: fromforests to rangelands. Philosophical Transactionsof the Royal Society B 367, 3178-3190.48. Ellis, F (2000) The Determinants of RuralLivelihood Diversification in DevelopingCountries. Journal of Agricultural Economics 51,289-302.49. Bird, K, Hulme, D, Moore, K & Shepherd, A(2002) Chronic Poverty and Remote Rural AreasCPRC Working Paper No. 13. Chronic PovertyResearch Centre, University of Manchester,Manchester.50. Mendola, M (2012) Review article: rural
out-migration and economic development atorigin: a review of the evidence. Journal ofInternational Development 24,102-122.
28 18/12/12 15:11 Page 1

WORLD AGRICULTURE 29
economic & social
Uganda Agrochemical dealers’practises and interactions
with farmersJ. Lamontagne-Godwin, P. Taylor
CAB International (CABI), Bakeham Lane, TW20 9TY, UK Corresponding author: [email protected]
SummaryThe agricultural industry is an essential component of the Uganda economy and often struggles to obtain good advicethrough its existing national agricultural extension and research system. Agricultural dealers (agrodealers) are often theprimary source of advice for farmers with a crop health problem, yet we have little practical information on agrodeal-ers’ background, their relationship to farmers and how they position themselves in the agrochemical industry. Througha questionnaire based study, 975 agrodealers were asked about their interactions with farmers, level of training, andknowledge of plant health problems and their role in the agrochemical industry. The majority of agrodealers enteredthe industry in order to help farmers and seed is the most important of the products stocked and sold in their stores.However, 14% had not received any training before opening their stores. Most agrodealers price their productsaccording to trade and local market conditions and not by government guidelines. The vast majority of agrodealersalready give farmers pest and disease advice, and would welcome further training to help their business develop. Thisstudy introduces the types of problems Ugandan agrodealers face. A competent recording and communicationscheme between agrodealers, government and manufacturers is vital for the positive growth of the industry andshould be used to enhance national food security.
Keywords: Agrodealer, social study, Uganda, UNADA, CABIAbbreviations: AGRA, Association for a Green Revolution in Africa; IFDC, International FertiliserDevelopment Centre; MAAIF, Ministry of Agriculture, Animal, Irrigation and Fisheries; NAADS, NationalAgricultural Advisory Services (Uganda); NGO, Non-Government Organisation; UNADA, UgandanNational AgroDealer Association; UBOS,Uganda Bureau of Statistics; USAID, U.S. Agency forInternational Development.
IntroductionEighty per cent of the workforce inUganda works in agriculture1. Despitethis, over 50% of the populationexperience food shortages2.
Agricultural inputs are a means toincrease agricultural productivity, andare used widely worldwide. Theagricultural supply industry is firmlyestablished in Uganda: approximately2000 registered agrochemical dealers(agrodealers) currently operate andserve the farming community3. Theyare often the first source of advice forfarmers in countries with weaknational agricultural extension andresearch systems. Their advice andknowledge directly affects farmers’behaviour and therefore the country’scrop yields and food security.
The creation of a plant healthsystem4 involves five actors eachinteracting in a proper manner. Thefarmer, extension worker, regulators,research bodies and the agrochemicalsupply trade all need to work inunison with appropriate connections
to each other to create a strongenvironment for crop production.There is the potential, however, thatthe agrodealers are ignored by theNational Agricultural Advisory Services(NAADS) in action plans5 developed tocreate a dynamic new outlook foragricultural support.. This is commonpractice in public action plans. Theintegration of agrodealers into publicagricultural initiatives has historicallybeen slow for two main reasons. Firstlyagrodealers are often viewed withsome suspicion by independentagriculturists and public services, whobelieve them to provide biased adviceand promote the use of unnecessaryand/or inappropriate products andgenerally to act in their own interestsrather than that of the customer6.Secondly, they are an extremelyheterogeneous group in relation totheir education, agriculturalknowledge and economic situation,making it difficult to design policiesthat will benefit all agrodealers9.Historically studies on agriculturalinput supply have focused mainly on
the ecological, medical and socio-economic effects of chemicals on endusers7,8,9. Recently, however, morestudies have concentrated on thesocio-economics of the dealersthemselves investigating how theywork within the agricultural inputsupply industry6,10. However, even themost basic of information has notpreviously been asked of agrochemicaldealers in a systematic way, such as:
� The level of training they havereceived in the past, and their futureneeds;
� The range of chemicals they sell,and how they stock their shops;
� Their perceived knowledge of plantpests and diseases;
� Their relationships with farmers, theagrochemical industry, and policymakers;
Despite a recent study11 on theinteractions between women farmersand agrodealers, there has been noattempt to garner information fromthe dealers themselves. Nevertheless, it
29 18/12/12 15:12 Page 1

30 WORLD AGRICULTURE
economic & socialis important to understand theperceived role of the agrochemicaldealers in crop production from withinthe industry.
There is no legal obligation to havegained any qualifications to trade inagricultural chemicals, so it is hard toassess agrodealers without the help ofan existing structure.
Half the agrodealers in Uganda areregistered as members of The NationalSecretariat of the “Ugandan NationalAgroDealer Association” (UNADA).
This trade organisation is funded bythe Alliance for a Green Revolution inAfrica (AGRA) and the U.S. Agency forInternational Development (USAID)and it was members of UNADA whowere the source of information for thisstudy.
MethodsUNADA conducted monthly regionaltraining sessions between Aug 2009and Aug 2010 around Uganda, eachattended by approximately 80agrodealers.
Sessions were designed to helpmembers respond to changing needswithin the industry and featuredtraining in business management,market development, on-farmdemonstrations, radio and printadvertising, trade fairs, advocacy andpolicy analysis updates, as well asmarket linkages and information onprices and products.
Study Design:
The questionnaire was devised by CABIand approved by UNADA staff andintegrated as an exercise in thetraining course. Initially, UNADA staffbased their training on the aims of thestudy.
Interviewees were given ample timeto answer all the questions adequatelyand with assistance. The first 80agrodealers in the UNADA training
programme in August 2009 were usedas a test sample.
Subsequently, three ambiguousquestions were corrected to ensure theparticipants answered either “yes” or“no” and the previously ambiguousquestions were not used in the overalldata analysis.
Overall, 975 participants completedthe questionnaire between August2009 and August 2010.
Questionnaire design
Owing to its multiple aims, thequestionnaire had 35 questions andparticipants were given half an hour tocomplete the study. The design of thequestionnaire was based upon themodel described in Bradburn et al.12.
Different formats were used forquestions, depending on theinformation needed for analysis.
Certain questions had a markingsystem applied to them, listing theirpreferences, while others had a moredirect approach, asking theagrodealers to fill in only one answerdesigned to categorise the way theyviewed a particular aspect of their work(Table 1 gives an example).
At the end of the study, data werecollated, inserted into an Excelspreadsheet (Microsoft Corporation)and analysed using single-variateanalyses and summary statistics.
The Pearson’s Product MomentCorrelation Coefficient was used forthe measure of correlation betweenvariables .
This statistical test is used as ameasure of the strength of lineardependence between two variables.
ResultsDemographics: The training covered973 dealers, with an average age of35.6 years (median = 33). Theyoungest participant was 14 years old,
and the eldest, 71. The averagenumber of years in practice was 4.1,with a median of 3 years.
One trainee was just starting out inthe industry, whilst the greatestnumber of years of practice for anyparticipant was 41 years.
Table 2 shows the reasons dealersjoined the sector.
Products stocked in shop: The mostcommonly stocked product was seed,with 51% of the responses comparedto 14% for both pesticide andherbicide, whilst 54% of the responsesstated “Nematicide” as the “LeastImportant” product.
Frequency and choice of restock: Ofthe 925 responses, 46% bought theirproducts monthly; 37% bought theirproducts every week, and 12% every 6months.
Daily and yearly restocking wasinfrequent (2% and 3% respectively).
Pricing of the products: Intervieweeswere also asked how they determinedthe price of their products.
Of the 960 respondents, 26.7%decided the price themselves, 10%used government guide prices, 44%based the price on the wholesale priceand 18.9% observed other dealersprices.
Counterfeit chemicals: 96.5% ofparticipants sold their chemicals in theoriginal containers. 93% also thoughtcounterfeit chemicals were a bigproblem in Uganda, and 84% wereconcerned that products they boughtin the past had been counterfeit.
Time spent with customers: Of the946 responses, 58% spent 5-10minutes with customers, and 30%spent less than half an hour withclients. 12% spent over half an hourwith customers.
Product payment: 96% ofagrochemical sales at the shop werecash over the counter sales.
However, 27% of these gavetemporary loans and extended creditto returning and known clients. Only2% of agrodealers gave clients anofficial shop account, as recorded intheir official sales ledger.
Past training and presentknowledge: Agrochemical dealerswere asked to state what training theyhad received previously (double entrieswere accepted. e.g. a dealer mightTable 1 Example of question format intended to elicit the dealer’s
attitude to his business.
30 18/12/12 15:12 Page 1

have received a “Safe use andHandling of Chemicals” training aswell as a “Product Knowledge” coursein the past). Participants had attended1053 training courses in total.
Of the 972 agrodealers in the study,218 did not respond to the questionstudy and 153 (14.5%) stated theyhad received no training (43% of thesewere from dealers who entered theagrochemical industry for economicreasons).
Fifty per cent of all training coursesreceived were the “Safe use andHandling of Chemicals”. “FertiliserApplication”, “Agricultural Sciences”,“Business Management”, “ProductKnowledge” and “Crop Protection” allfeatured in 1 to 6% of courses.
Official government training was themost frequent form of training,according to 41% of the interviewees,followed by Suppliers (30%).
Chemical products labels and leafletsgiven by suppliers were also seen as agood source of information by 49% ofinterviewees.
When asked if they knew how thechemicals they sold workedbiologically, 70% stated “Yes”, 21%said that they knew “For most ofthem”, and only 9% said “No”.
Future training: 99% of allinterviewees would like to be involvedin training in the future. They wouldprefer NGO training (46% listed this astheir preferred option), but 37% wouldwant government training, and 17%would endorse a private companygiving them training.
Future business model: When askedhow they would like their business togrow, 40% of all interviewees listed thecategory “To Become More
Knowledgeable” as the most importantaspect. The least important for thegrowth of their business was “To OpenMore Stores” (32% of intervieweesplacing this in the Least Importantcategory).
Customers’ demands: 46% of allagrodealers regularly get customerscoming into their shop to demand achemical by simply describing theproblem on their crop.
A specific brand name is wanted by39 % and 15% demand a group ofchemicals (for example: a fungicide).Of clients who came into their shop 62% came to buy chemicals, whilst 38%thought their customers came in to askfor advice and 61% of agrodealers saidgood advice was more important thanthe right chemical.
Table 3 summarises the advice andbuying habits of agrodealer clientfarmers.
DiscussionAs was stated earlier, there have beenfew studies of agrodealers, and ourattempt to describe the demographicsprovided interesting results.
The average age of agrodealers is 35.6y and those who join a family businessform the youngest category.
Pearson’s test gives a medium strongcorrelation between the age of anagrodealer and his choice ofprofession. Indeed, their young age isto be expected if they start workingearly, as a helper, for their relative whoowns the shop.
This is a traditional concept inAfrican countries. It is, however,worrying, as they most likely have notreceived the same amount of trainingas the person who opened the shop.
The Agrodealers interviewed hadpractised for an average of 4.1 years.This could be due to (1) a highturnover rate in the industry, causingmany agrodealers to close down theirbusiness and (2) that the Ugandanagrochemical industry is growing andyoung professionals have decided tojoin.
Those who joined the industry forprofessional reasons have the highestlevel of training. They are willing tostay in the industry once trained, orqualified.
Indeed, based on the correlationbetween “age” and “years of practice”,most young agrochemical dealersremain in the industry, particularly ifacademically, or professionally, trained.
Seed is the most important productstocked by agrodealers, presumablybecause of its constant use by farmers,as confirmed by the UB OS13.
Unsurprisingly, nematicides were theleast popular product to be stocked, asappropriate types are not readilylocated and are expensive to use.
Also, nematodes, despite generallycausing noticeable signs on the rootsof plants, are little understood by theagricultural sector.
It is interesting that almost half(44%) of agrodealers chose theirselling prices according to wholesalers’prices, and only 8% use officialgovernment advice.
It is uncertain if this is an indicationthat local and national governmentcould be engaging more with smallagrodealer businesses.
It is within their mandate. Thegovernment, through the CropProtection Department in the Ministryof Agriculture, Animal, Industry andFisheries (MAAIF) is responsible for theregulation of agricultural inputs toensure farmers get value for theirmoney.
The government administration,through the chief commissioner ofAgricultural inspection and theprincipal Agricultural Inspectorate,lacks funding and manpower to ensureproper engagement with agrochemicalsuppliers15.
However, it is apparent that theprivate industry has a firm grip onprice regulation in Uganda. Mostagrodealers (93%) realise there are
WORLD AGRICULTURE 31
economic & social
Table 2. Reason given by the 902 responding participants for enteringthe industry.
31 24/12/12 10:25 Page 1

32 WORLD AGRICULTURE
economic & social
serious problems caused by counterfeitchemicals, which are of unknown,generally foreign, provenance. Thiscould explain the highly favourablestatistic relating to the selling ofchemicals in their original containers.The fact that 84% were concernedthat they had potentially bought somecounterfeit chemicals in the pastreinforces the importance of theproblem. Accordingly, 85% ofagrodealers believe that theagrochemical industry should becontrolled by government, a statementof faith that public involvement couldrid the industry of some of its mostserious problems. A joint Croplife,National Environment ManagementAuthority and Ministry of AgricultureWorkshop entitled the “ObsoleteStock/Empty Containers” was arrangedin June 201214.
Agrodealers are generally the sourceof advice for most rural farmers. In thisstudy, 98% of agrodealers gave plantpest and disease advice (61% thinkingthat the right advice was moreimportant that the right chemical) and97% gave health and safety advicerelated to the use of chemicals (50%had already followed a course on SafeHandling and Use of Pesticides).Discussions between shop owner andcustomer must therefore consider
aspects of the farmers’ fields andhusbandry before a problem isunderstood and a solution found.Indeed, 46% of interviewees statedthat customers simply describe theproblem on their crop. Consequently,many agrodealers (80%) findthemselves visiting customers’ fields inorder to understand the problem atfirst hand.
A farmer’s crop health issues arecomplex. However, we find that 58%of agrodealers spend between 5 and10 minutes with their clients, and only12% of agrodealers spend over half anhour discussing and recommendingsolutions to a problem. Based onfarmer interviews at plant clinics inCABI’s Plantwise initiative15, advisorsare encouraged to spend 15 minuteswith a farmer in order to get allrelevant information, beforerecommending a product.
However, a shop owner needs to seean adequate number of clients. He isunable to spend all day with onecustomer and visit his field to thedetriment of other clients. Most of theproducts being sold are seed, so thesetransactions are relatively quick, bycomparison with plant healthproblems. Agrodealers’ jobs are alsoaided by the fact that customerssometimes bring affected plant
samples, or know the type or even thebrand of chemical needed, therebymaking a proportion of the agrodealersmanagement recommendations moreappropriate and faster.
Seventy seven per cent ofagrodealers have farmers returning tocomplain if the product sold did nothave the desired effect. Farmers aretherefore keen to let their agrodealerknow if the product has not worked.
Recommendations andconclusionsThis study reviews Ugandanagrodealers’ situation and interactionwith their clients. This is a developingand complex industry. Agrodealers findthemselves in a unique position: theyneed to possess a great deal ofknowledge to help with their clients’enquiries, but they also need to makea living.
There is a close relationship betweenfarmers and agrodealers. Field visits areregularly arranged, and farmers willvisit the agrodealer to let him know ifthe product has not worked. Thefrequency of the field trips might besmall, but that they happen at allindicates that the agrochemicalindustry is a maturing one, developingservices to meet the demands of theclients. It would be interesting to findout what agrodealers offer their clientsif the product has not worked, and thiscould be the subject of a future study.
A study of agrodealers’ knowledge ofpests and diseases and theagrochemicals they sell would also beparticularly relevant to plandevelopment of an approved trainingprogramme, or qualification foragrodealers and their shops. For themoment, it seems international NGOs,such as UNADA or CropLife funded byAGRA and IFDC, are the onlyorganisations committed to trainingagrodealers.
In Uganda, many agrodealers do nothave the relevant licenses, mainly dueto the limited infrastructure availablefor their approval and release16.
A focused study on the professionalpathways for agrodealers would bevery helpful and would highlight theproblems in the existing infrastructureto improve support. In the UK, BASIS17
is an independent organisation set upto establish and assess standards in thepesticide industry and the professionalcompetence of staff. A similar system
Table 3 Advisory role of agrodealers, customer buying habits and sat-isfaction
32 24/12/12 10:26 Page 1

WORLD AGRICULTURE 33
economic & socialcould perhaps be implemented infuture to enhance and manageUgandan agrodealer professionalstandards.
This survey provides no informationon the ownership structure of theagrodealer network. Although themajority of agrodealers understand thethreat that counterfeit, or obsolete,chemicals constitute, they are stillpresent within the agrochemicalindustry. The survey highlights thisproblem and raises questions oftrading standards and the role of themajor agrochemical companies inUganda to control the flow of theseillegal chemicals.
In Uganda, the link betweenagrodealers, government and theprivate industry is loose anduncoordinated. The agriculturalinspectorate in Uganda should bepromoting an environment whereconstructive and intensive dialoguebetween all relevant stakeholders is aregular occurrence. Liaison betweenthese organisations is vital to ensurethat agricultural and political benefitsare fully recognised and acceptedthroughout the agrochemical industry.
Agrodealers play an unequivocallyimportant role in agriculture. Thissurvey provides basic information ontheir role and structure in Uganda. Anext step would be to find out moreabout the industry, particularly asagricultural productivity and food
security are such an important part ofthe wider political, economic andsocial politics.
References1. Information on Uganda; Index Mundi(2012) http://www.indexmundi.com/uganda/
2. Summary report on Uganda Census ofAgriculture (2008-2009); Uganda Bureau ofStatistics, in collaboration with the Ministry ofAgriculture, Animal Industries and Fisheries(MAAIF). Volume 1, December 2010
3. UNADA personal communication October2010
4. Danielsen S., Centeno J., López J., LezamaL., Varela G., Castillo P., Narváez C., (2011)Innovations In Plant Health Services InNicaragua: From Grassroots Experiment To ASystems Approach; Journal of International+Development, J. Int. Dev. Published online inWiley Online Library, (wileyonlinelibrary.com)DOI: 10.1002/jid.1786
5. National Agricultural Advisory Services(NAADS) Phase I and Phase II programme,Uganda http://www.naads.or.ug/ (Accessed07/11/2012)
6. Chinsinga B.; FAC Working Paper 31.Agrodealers, Subsidies and Rural MarketDevelopment in Malawi: A Political EconomyEnquiry. Future Agricultures Consortium,Brighton, UK 2011
7. Frampton G., K., Jänsch S., Scott-FordsmandJ., J., Römbke J., van den Brink P. J.; Effects ofpesticides on soil invertebrates in laboratorystudies: A review and analysis using speciessensitivity distributions. EnvironmentalToxicology and Chemistry, Volume 25, Issue 9,2006
8. Pingali P., L., Roger P., A.; Impact ofPesticides on Farmer Health and the Rice
Environment (Natural Resource Managementand Policy) Kluwer Academic Publishers, 1995;ISBN 10: 0792395220
9. Wilson C., Tisdell C.; why farmers continueto use pesticides despite environmental, healthand sustainability costs. Ecological Economics,Volume 39, Issue 3, 2001
10. Odame, Hannington, Muange E.; "CanAgrodealers Deliver the Green Revolution inKenya?" IDS Bulletin 42.4, 2011
11. Okello B., Paruzzolo S., Mehra R., ShettyA., Weiss E.; Agrodealerships in Western Kenya:How Promising for Agricultural Developmentand Women Farmers? International Center forResearch on Women, 2012
12. Bradburn N.,M., Sudman S., Wansink B.;Asking Questions: The Definitive Guide toQuestionnaire Design - For Market Research,Political Polls, and Social and HealthQuestionnaires (Research Methods for theSocial Sciences); Jossey Bass Publishing, 2004,ISBN – 10: 078797088-3
13. Ugandan Bureaux Of Statistics 2012;Government of Ugandahttp://www.ubos.org/index.php?st=pagerela-tions&id=16&p=related%20pages:Demographic%20Statistics (Accessed 13/02/2012)
14. Training report on Counterfeit and IllegalPesticides Training in Uganda. June 2012http://www.croplifeafrica.org/?module=pages&method=view&conf[page]=website_coun-tries_display&conf[id]=62 (Accessed07/11/2012)
15. CABI Plantwise initiative.www.plantwise.org (accessed 28/11/2012)
16. UNADA Personal communication (October2010)
17. BASIS (Registration) Ltd. PromotingProfessional Standards http://www.basis-reg.com/about.aspx (Accessed 26/11/2012)
Grassland on the shore of Victoria Lake. Entebbe, Uganda.
33 18/12/12 15:14 Page 1

34 WORLD AGRICULTURE
Comment & Opinion
The global, environmental andeconomic impact of biotech
crops 1996-2010 Graham Brookes and Peter Barfoot
PG Economics Ltd, Dorchester,UK, DT2 9NB
IntroductionAlthough the first commercial genetically modified (GM) crops were planted in 1994 (tomatoes), 1996 was the first year inwhich a significant area of crops containing GM traits was planted (1.66 million hectares). Since then there has been asignificant increase in plantings and by 2010/11, the global planted area reached over 139 million hectares.
GM traits have largely been adopted in four main crops; canola, maize, cotton and soybeans, although small areas of GMsugar beet (adopted in the USA and Canada since 2008), papaya (in the USA since 1999 and China since 2008) and squash(in the USA since 2004) have also been planted. GM traits accounted for 42% of the global plantings to soybeans, maize,cotton and canola in 2010.
The main traits so far commercialised have essentially been derived from bacteria and convey:� Tolerance to specific herbicides (notably glyphosate and glufosinate) in maize, cotton, canola (spring oilseed rape) and
soybeans2. The technology allows for the ‘over the top’ spraying of crops with the trait, of these specific broad-spectrumherbicides, that target both grass and broad-leaved weeds;
� Resistance to specific insect pests of maize and cotton. This ‘Bt’ technology offers farmers resistance in the plants tomajor pests such as corn borers and rootworm (e.g. Ostrinia nubilalis, Diabrotica spp.) in maize and bollworm/budworm(Heliothis spp.) in cotton.
The analysis provides an assessment of some of the key economic and environmental impacts associated with the globaladoption of biotech crops. The aim is to contribute to greater understanding of the impact of this technology and facilitatemore informed decision making, especially in countries where crop biotechnology is currently not permitted.
The environmental impact analysis focuses on:� Changes in the amount of insecticides and herbicides applied to the biotech crops relative to conventionally grown
alternatives and; � The contribution of biotech crops towards reducing global GHG emissions. It is widely accepted that increases in atmospheric levels of greenhouse gases such as carbon dioxide, methane and
nitrous oxide are detrimental to the global environment3. Therefore, if the adoption of crop biotechnology contributes to a
SummaryThis is a review of published (mostly) peer-reviewed scientific and economic evidence relating to some of the importanteconomic and environmental impacts of biotech crops, following their commercial introduction in 1996. It examinesthe economic impacts on yields, key costs of production, direct farm income and the production base of the four maincrops of soybeans, maize, cotton and canola. The analysis shows that there have been substantial net economicbenefits at the farm level, amounting to $14 billion in 2010 and $78.4 billion for the fifteen year period. Biotech cropshave also made important contributions to increasing global production of the four main crops; adding, for example,97.5 million tonnes and 159 million tonnes to global production of soybeans and maize respectively. It also examinesthe impact of changes in pesticide use and greenhouse gas emissions arising from the use of biotech crops. Thetechnology has reduced pesticide spraying by 443 million kg (9.1%) and, as a result, decreased the environmentalimpact associated with herbicide and insecticide use on these crops (as measured by the indicator the EnvironmentalImpact Quotient (EIQ) by 17.9 %. The technology has also significantly reduced the greenhouse gas emissions fromthis cropping area, which, in 2010, was equivalent to removing 8.6 million cars from the roads.
Keywords: Herbicide tolerance, glyphosate, insect resistance, maize, soybeans, cotton, canola,pesticides, greenhouse gas emissions
Literature CitationsThis paper presents an assessment ofthe global economic andenvironmental impact of GM crops
since their commercial introduction in1996. It is based on two papers bythe authors in the peer reviewedjournal GM Crops1. This article is a
synopsis of those specific papers, sowe have adopted a slightly differentreferencing system to that normallyadopted.
Abbreviations GM genetically modified; HT herbicide tolerance; IR insect resistance; Bt Bacillus thuringiensis; NT notillage cultivation; RT reduced tillage cultivation; Mt million tonnes; G billion, 1000 M, or 109; GHG greenhouse gases.
34 19/12/12 11:46 Page 1

WORLD AGRICULTURE 35
Comment & Opinionreduction in the level of greenhouse gas emissions from agriculture, this represents a positive development for the world.
The economic analysis concentrates on farm income because this is a primary driver of adoption amongst farmers and alsoquantifies the (net) production impact of the technology. The authors recognise that an economic assessment could exam-ine a broader range of potential impacts (e.g. on labour usage, households, local communities and economies). However,these are not included because undertaking such an exercise would add considerably to the length of the paper and aneconomic assessment of wider economic impacts would probably merit a separate assessment in its own right.
Methodology
The results are based on extensiveanalysis of existing farm levelimpact data for GM crops.
Whilst primary data for impacts ofcommercial cultivation were notavailable for every crop, in every yearand for each country, a substantialbody of representative data areavailable and these have been used asthe basis for the analysis. Furtherdetails of the methodology, datasources and references4 can be foundin the two GM Crops journal papersreferred to above.
Readers of this paper are thereforeencouraged to read the original papers(available from the journal on openaccess). The considerable body ofliterature examining the impact of thetechnology, available in peer reviewedliterature forms the cornerstone of thisanalysis.
Results and discussionEnvironmental impacts of insecticideand herbicide use Since 1996, the useof pesticides on the biotech crop areahas been reduced by 443 million kg ofactive ingredient (9.1% reduction),and the environmental impactassociated with herbicide andinsecticide use on these crops, asmeasured by the EIQ indicator5, hasreduced by17.9% (Table 1).
In absolute terms, the largestenvironmental gain has beenassociated with the adoption of GMinsect resistant (IR) cotton (a 23.9%reduction in the volume of activeingredient used and a 26% reductionin the EIQ indicator 1996-2010). Thisreflects the significant reduction ininsecticide use that the technologyfacilitated in what has traditionallybeen an intensive user of insecticides.
The quantity of herbicide activeingredient used in biotech soybeancrops also decreased by 34 million kg(1996-2010), a 1.7% reduction, whilstthe overall environmental impactassociated with herbicide use onbiotech soybeans decreased by asignificantly larger 16.4%. Thishighlights the switch in herbicidesused with most GM herbicide tolerant(HT) crops to active ingredients with amore environmentally benign profilethan those generally used on
conventional crops.
In maize, herbicide and insecticideuse decreased by 212.8 million kg(1996-2010) and the associatedenvironmental impact of pesticide usedecreased, due to a combination ofreduced insecticide use (37.7%) and aswitch to more environmentallybenign herbicides (11.5%). In canola,biotech farmers reduced herbicideactive ingredient use by14.4 million kg(18.2%) and the associatedenvironmental impact of herbicide useon this crop area fell by 27.6%, againowing to use of more environmentallybenign herbicides.
The environmental benefitsassociated with reduced insecticideand herbicide use (Table 2) shows a
reduction between 1996 and 2010,respectively in developed anddeveloping countries of 55% and 45%.Over three-quarters (76%) of theenvironmental gains in developingcountries have been from the use ofGM IR cotton.
In some regions where GM HT cropshave been widely grown, some farmers(eg, in the USA and Argentina) haverelied too much on the use of singleherbicides, like glyphosate, for weedcontrol and this has contributed to thedevelopment of resistant weedpopulations.
The development of weeds resistantto herbicides, or of gene flow fromcrops to wild relatives, is not new inagriculture and is, therefore, not an
Table 1 Effect of changes in the use of herbicides and insecticides inglobal biotech crops, 1996-2010 (ai, active ingredient; EIQ, environ-mental impact quotient – see Kovach et al., 1992
Table 2 Effect of lower insecticide and herbicide use 1996-2010 inbiotech crops for developing compared with developed countries.(EIQ, environmental impact quotient – see Kovach et al., 1992
35 19/12/12 11:47 Page 1

36 WORLD AGRICULTURE
Comment & Opinionissue unique to the adoption of cropbiotechnology. All weeds have theability to adapt to selection pressure,and there are examples of weeds thathave developed resistance to a numberof herbicides and also to mechanicalmethods of weed control (e.g.prostrate weeds such as dandelionwhich can survive mowing).
Weed resistance occurs mostly whenthe same herbicide(s), with the samemode of action, has been applied on acontinuous basis over a number ofyears.
There are hundreds of resistant weedspecies confirmed in the InternationalSurvey of Herbicide Resistant Weeds(www.weedscience.org). Worldwide,there are 24 weed species that are6
resistant to glyphosate, compared to107 weed species resistant to ALSherbicides and 69 weed speciesresistant to triazine herbicides, such asatrazine.
Several of the confirmed glyphosateresistant weed species have also beenfound in areas where no GM HT cropshave been grown. For example, thereare currently 13 weeds recognised inthe US as exhibiting resistance toglyphosate, of which two are notassociated with glyphosate tolerantcrops.
A few of the glyphosate resistantspecies, such as marestail (Conyzacanadensis) and palmer pigweed(Amaranthus palmeri) are nowwidespread in the USA. In Argentina,development of resistance toglyphosate in weeds such as Johnsongrass (Sorghum halepense) is alsoreported.
Where this has occurred, farmershave had to adopt reactive weedmanagement strategies incorporating amix of herbicides. While the overalllevel of weed resistance in areasplanted to GM HT crops is stillrelatively low, growers of GM HT cropsare increasingly being advised to bemore proactive and include otherherbicides in combination withglyphosate in their weed managementprogrammes, even where weedresistance to glyphosate has not beenfound, in order to reduce the risk ofresistance developing.
This is because proactive weedmanagement programmes generallyrequire fewer herbicides and are moreeconomical than reactive programmes.The adoption of both reactive andproactive weed managementprogrammes in GM HT crops hasalready begun to influence the mix,
total amount and overallenvironmental profile of herbicidesapplied to GM HT soybeans, cotton,maize and canola and this is reflectedin the data presented in this paper.
For example, in the USA GM HTsoybean crop in 2010, just over a thirdof the area received an additionaltreatment of one of the followingactive ingredients7, 2 4 D, chlorimuron,clethodim and flumioxazin, comparedwith 13% of the crop which receivedone of these four herbicides in 2006.As a result, the average amount ofherbicide active ingredient applied toGM HT soybeans in the US (perhectare) has increased by about a thirdover the last five years (the associatedEIQ value has increased by about27%).
Nevertheless, this compares with theaverage amount of herbicide activeingredient applied to conventional(non GM) soybean, which increased by15% over the same period (theassociated EIQ value for conventionalsoybeans increased by 27%). Theincrease in the use of herbicides onconventional soybeans in the US canalso be partly attributed to thedevelopment of weed resistance toherbicides commonly used andhighlights that the development ofweed resistance to herbicides is aproblem faced by all farmers,regardless of production method.Currently, the environmental profile ofGM HT crops (as measured by the EIQindicator) continues to represent animprovement compared to theconventional alternative.
Impact on GHG emissions
The scope for biotech cropscontributing to lower levels of GHGemissions comes from two principlesources8:
a) Reduced fuel use from less frequentherbicide or insecticide applications anda reduction in the energy used in soilcultivation. The fuel savings associatedwith making fewer spray runs (relativeto conventional crops) and the switchto conservation, reduced and no-tillfarming systems reduced carbondioxide emissions by 1,715 million kg,arising from reduced fuel use of 642.2million litres in 2010 (Table 3). Thelargest reductions in carbon dioxideemissions have come from GM HTsoybeans (about 85% of total savings),particularly in South America.
Over the period 1996 to 2010, thecumulative permanent reduction infuel use of 4,582 million litres has been
equivalent to 12,232 million kg ofcarbon dioxide..
b) The use of ‘no-till’ and ‘reduced-till’farming systems. These productionsystems have increased significantlywith the adoption of GM HT crops.The technology has improved growers’ability to control competing weeds,reducing the need to rely on soilcultivation and seed-bed preparationas means of weed control. As a result,in addition to reduced fuel use fortillage, soil quality is enhanced and soilerosion reduced. In turn more carbonremains in the soil and this leads tolower GHG emissions.
Based on savings arising from therapid adoption of no till/reducedtillage farming systems in North andSouth America, an extra 4,805 millionkg of soil carbon is estimated to havebeen sequestered in 2010 alone(equivalent to 17,634 million tonnes ofcarbon dioxide that has not beenreleased into the global atmosphere:Table 3).
Since 1996, the equivalent of133,639 million tonnes of carbondioxide has not been released into theglobal atmosphere9. The reader shouldnote that this increase in soil carbon isbased on savings arising from the rapidadoption of NT/RT farming systems inNorth and South America (Argentinaand Southern Brazil), for which theavailability of GM HT technology, hasbeen cited by many farmers as animportant facilitator.
GM HT technology has, therefore,probably been an importantcontributor to increased soil carbonsequestration, no doubt aided by theavailability of relatively cheap genericglyphosate (the real price ofglyphosate fell threefold between 1995and 2000 once patent protection forthe product expired). Cumulatively,the amount of carbon sequesteredmay be higher than these estimatesdue to year-on-year benefits to soilquality (e.g. increased organic matter,reduced soil erosion, greater waterretention and reduced levels ofnutrient run off).
However, it is equally likely that thetotal cumulative soil sequestrationgains have been lower because only aproportion of the crop area will haveremained in NT/RT. It is not possibleto estimate confidently cumulative soilsequestration gains that take intoaccount reversions to conventionaltillage because of a lack of data.Consequently, the estimate of 133,639million tonnes of carbon dioxide not
36 19/12/12 11:48 Page 1

WORLD AGRICULTURE 37
Comment & Opinion
released into the atmosphere shouldbe treated with caution as it is notpossible to confidently estimate theprobable soil carbon sequestrationgains since 1996.
These carbon dioxide emissionreductions for 2010 are equivalent:
� To removing 0.76 million cars fromthe road.
� The additional probable soil carbonsequestration gains are equivalent toremoving 7.84 million cars from theroads.
Impact on farm income
GM technology has had a significantpositive impact on farm incomederived from a combination of
enhanced productivity and efficiencygains (Table 4).
In 2010, the direct global farmincome benefit from biotech crops was$14 billion. This is equivalent toadding 4.3% to the value of globalproduction of the soybean, maize,canola and cotton crops. Since 1996,GM technology has increased farmincomes by $78.4 billion.
The largest gains in farm income in2010 are from cotton, largely fromyield gains, with $5 billion ofadditional income generated by GMinsect resistant (GM IR) cotton in 2010.This is equivalent to adding 14% tothe value of the crop in the biotechgrowing countries, or adding the
equivalent of 11.9% to the $42 billionvalue of the global cotton crop in2010.
Substantial gains have also arisen inmaize through a combination ofhigher yields and lower costs. In 2010,maize farm income in the biotechadopting countries increased by almost$5 billion and since 1996, the sectorhas benefited from an additional $21.6billion. The 2010 income gains areequivalent to adding 6% to the valueof the maize crop in these countries, or3.5% to the $139 billion value of totalglobal maize production. This is asubstantial increase in value addedterms for two new maize seedtechnologies. Significant increases infarm incomes have also resulted in thesoybean and canola crops. GM HTtechnology in soybeans increased farmincomes by $3.3 billion in 2010, andsince 1996 has delivered over $28billion of extra farm income (thehighest cumulative increase in farmincome of the biotech traits). Forcanola, (largely in North American) anadditional $2.7 billion has beengenerated between 1996 and 2010. Atthe country level (Table 5), US farmershave been the largest beneficiaries ofhigher incomes, realising over $35billion in extra income between 1996and 2010. This is not surprising giventhat US farmers were the first to makewidespread use of GM croptechnology and for several years theGM adoption levels in all four US cropshave been in excess of 80%.Important farm income benefits ($17.7billion) have occurred in SouthAmerica (Argentina, Bolivia, Brazil,Paraguay and Uruguay), mostly fromGM technology in soybeans andmaize. GM IR cotton has also beenresponsible for an additional $20billion additional income for cottonfarmers in China and India.
In 2010, 54.8% of the farm incomebenefits were earned by farmers indeveloping countries. The vastmajority of these gains have been fromGM IR cotton and GM HT soybeans.Over the fifteen years, 1996-2010, thecumulative farm income gain derivedby developing country farmers was$39.24 billion, equal to 50% of thetotal farm income during this period.
The cost to farmers for accessing GMtechnology, across the four mainbiotech crops, in 2010, was equal to28% of the total value of technologygains (defined as the farm incomegains referred to above plus the cost ofthe technology payable to the seedsupply chain10).
Table 3. Effect of biotech crops on fuel usage, carbon dioxide emis-sions and carbon sequestration in 2010.Note: It is assumed an average family car produces 150 grams of carbon dioxide per kmand covers 15,000 km/year producing 2.250kg of CO2/year.
Table 4. Global farm income benefits from growing biotech crops1996-2010.Note: 1000 Million = 1 billion; All values are nominal and others are excluded from thetotal. Farm income calculations are net of key variable costs (e.g, seed and crop protection)� Others: virus resistant papaya and squash and HT sugar beet which are excluded fromtotals.
37 24/12/12 10:27 Page 1

38 WORLD AGRICULTURE
Comment & Opinion
In developing countries the total costwas equal to 17% of total technologygains compared with 37% indeveloped countries.
Whilst circumstances vary betweencountries, the higher share of totaltechnology gains accounted for byfarm income in developing countriesrelative to developed countries reflectsfactors such as weaker provision andenforcement of intellectual propertyrights in developing countries and thehigher average level of farm incomegain per hectare derived by farmers indeveloping countries compared tothose in developed countries.
Crop production effects
Based on the yield impacts used in thedirect farm income benefit calculationsabove and taking account of thesecond soybean crop facilitation inSouth America (see below), biotechcrops have added important volumes
to global production of corn, cotton,canola and soybeans since 1996 (Table6).
The biotech IR traits, used in cornand cotton, have accounted for 98%of the additional corn production and99.4% of the additional cottonproduction. Positive yield impactsfrom the use of this technology haveoccurred in all user countries (exceptfor GM IR cotton in Australia11) whencompared to average yields derivedfrom crops using conventionaltechnology (such as application ofinsecticides and seed treatments). Theaverage yield impact across the totalarea planted to these traits over the 15years since 1996 has been +9.6% formaize and +14.4% for cotton (Figure1). Although the primary impact ofbiotech HT technology has been toprovide more cost effective (lessexpensive) and easier weed control, as
opposed to improving yields, theimproved weed control has,nevertheless, delivered higher yields insome (especially developing12)countries (e.g. HT soybeans inRomania, Bolivia and Mexico, HT cornin Argentina and the Philippines).
Biotech HT soybeans have alsofacilitated the adoption of no tillageproduction systems, shortening theproduction cycle. This enables manyfarmers in South America to plant acrop of soybeans immediately after awheat crop in the same growingseason. This second crop, additionalto traditional soybean production, hasadded 96.1 Mt to soybean productionin Argentina and Paraguay between1996 and 2010 (accounting for 98.5%of the total biotech-related additionalsoybean production).
Concluding commentsDuring the last 15 years, the adoptionof crop biotechnology (by 15.4 millionfarmers in 2011) has deliveredimportant economic andenvironmental benefits by facilitatingmore environmentally friendly farmingpractices.
More specifically: � biotech IR traits have mostlydelivered higher incomes throughimproved yields, and environmentalgains, mostly from decreased use ofinsecticides;� The gains from biotech HT traitshave come from a combination ofeffects. The farm income gains havemostly arisen from reduced costs ofproduction. Environmentalimprovements are associated with theincreased use of more environmentallybenign herbicides and the facilitationof changes in farming systems. Thus,biotech HT technology (especially insoybeans) has played an important rolein enabling farmers to capitalise on theavailability of a low cost, broad-spectrum herbicide (glyphosate) and inturn, facilitated the move away fromconventional to low/no-tillageproduction systems in both North andSouth America. This change inproduction system has deliveredreduced levels of GHG emissions (fromreduced tractor fuel use and additionalsoil carbon sequestration).
Over reliance on the use ofglyphosate by some farmers, in someregions, has contributed to thedevelopment of weed resistance.
As a result, farmers are increasinglyadopting a mix of reactive andproactive weed management strategiesincorporating a mix of herbicides.
Table 5. Overall benefits of GM crop farm income 1996-2010 forselected countries (M US $).Notes: 1) All values are nominal. 2) Farm income calculations are net of key variable costs(eg, seed and crop protection). N/a = not applicable; 3) The USA total figure also includes$M296.4 for other crops/traits; 4) Table excludes extra farm income of $M4.3 from GM HTsugar beet in Canada; $M655.0 and $M223.1 from GM HT soya in Paraguay and Boliviarespectively; $M10,911.2 and $M9395.2 for GM IR cotton in China and India respectively.5) 1000 Million = 1 billion.
Table 6. Additional crop production arising from positive yield effectsof biotech crops (Mt).
38 24/12/12 10:28 Page 1

WORLD AGRICULTURE 39
Comment & Opinion
Nevertheless, the overall environmentalgains arising from the use of biotechcrops have been, and continue to be,substantial.
Even though there is a considerablebody of evidence, in peer reviewedliterature, and summarised in thispaper, that quantifies these positiveeconomic and environmental impactsof crop biotechnology, many remainopposed to the technology.
These groups, who are ideologicallyopposed to GM technology and oftenhave vested interests in other forms ofagricultural production, continue todenigrate GM technology. Almost allof the papers cited by these groups to‘support’ their claims tend not to bepublished in peer review journals.Some are inaccurate or misleading andmake inappropriate use of official data.
The ‘inconvenient truth’ that thoseopposed to GM crop technology fail toaddress is that the rate of adoptionand use of crop biotechnology inglobal agriculture since the mid-1990shas been rapid and widespread.
The analysis in this paper providesinsights into the reasons why so manyfarmers around the world haveadopted and continue to use thetechnology. Readers are encouragedto read the peer reviewed papers cited,and the many others who havepublished on this subject (and listed inthe references of Brookes and Barfoot)and to draw their own conclusions.
References� 1.GM Crops and Food 3:2, p 1-9 April-June2012 (environmental impact paper) and Vol. 4,Oct/Dec 2012 forthcoming for economicimpact paper. Available at www.landesbio-
science.com/journal/gmcrops � 2.Also sugar beet in North America� 3.See for example Intergovernmental Panelon Climate Change (2006)� 4.The total number of reference sourcesused totals about 150, most of which are frompeer reviewed journals� 5.The environmental impact quotient (EIQ),developed by Kovach et al (1992), effectivelyintegrates the various environmental impactsof individual pesticides into a single ‘field valueper hectare’. The EIQ value is multiplied bythe amount of pesticide active ingredient (ai)used per hectare to produce a field EIQ value.For example, the EIQ rating for glyphosate is15.33. By using this rating multiplied by theamount of glyphosate used per hectare (e.g., ahypothetical example of 1.1 kg applied perha), the field EIQ value for glyphosate wouldbe equivalent to 16.86/ha. The EIQ indicatorprovides an improved assessment of theimpact of GE crops on the environment whencompared to only examining changes in vol-ume of active ingredient applied, because itdraws on some of the key toxicity and environ-mental exposure data related to individualproducts, as applicable to impacts on farmworkers, consumers and ecology.� 6. www.weedscience.org - accessed July2012� 7.The four most used herbicide active ingre-dients used on soybeans after glyphosate(source: derived from GfK Kynetec)� 8.The methodology used to assess impacton greenhouse gas emissions combinesreviews of literature relating to changes in fueland tillage systems and carbon emissions cou-pled with evidence from the development ofrelevant biotech crops and their impact onboth fuel use and tillage systems. Reductionsin the level of GHG emissions associated withthe adoption of biotech crops are acknowl-edged in a wide body of literature includingAmerican Soybean Association ConservationTillage Study. 2001, Fabrizzi K et al. 2003, JasaP 2002, Reicosky D 1995, Robertson G et al.2000, Johnson et al. 2005, Leibig et al. 2005and West T. Post W. 2002� 9.These estimates are based on fairly conser-vative assumptions. Also, some of the addi-tional soil carbon sequestration gains fromRT/NT systems may be lost if subsequentploughing of the land occurs. Estimating thepossible losses that may arise from subsequentploughing would be complex and difficult to
undertake. This factor should be taken intoaccount when using the estimates presented inthis paper � 10.The cost of the technology accrues to theseed supply chain including sellers of seed tofarmers, seed multipliers, plant breeders, dis-tributors and the GM technology providers.� 11.This reflects the levels of Heliothis spp(boll and bud worm pests) pest control previ-ously obtained with intensive insecticide use.The main benefit and reason for adoption ofthis technology in Australia has arisen from sig-nificant cost savings (on insecticides) and theassociated environmental gains from reducedinsecticide use.� 12.But not exclusively.
References cited in footnotes in this paper� American Soybean Association ConservationTillage Study (2001)http://soygrowers.com/ctstudy/ctstudy_files/frame.htm.� Brookes, G & Barfoot, P (2012) GlobalImpact of Biotech Crops: Environmental Effects,1996-2010. GM Crops and Food 3: 2 April-June 2012, p 1-9. Available on-line athttp://www.landesbioscience.com/journal/gmcrops.� Brookes, G & Barfoot, P (2012) The incomeand production effects of biotech crops globally1996-2010. GM Crops and Food 4: Oct-Dec2012 (in press). Available on-line athttp://www.landesbioscience.com/journal/gmcrops� Fabrizz,i K., Moron, A. & Garan, F. (2003)Soil Carbon and Nitrogen Organic Fractions inDegraded VS Non-Degraded Mollisols inArgentina. Soil Science Society of AmericaJournal. 67:1831-1841.� GfK Kynetec (2012) USA Pesticide usagefarm panel dataset (annually updated).www.gfk.com� Intergovernmental Panel on Climate Change(2006) Chapter 2: GenericMethodologies Applicable to Multiple Land-Use Categories. Guidelines forNational Greenhouse Gas Inventories Volume4. Agriculture, Forestry andOther Land Use. (http://www.ipcc-nggip.iges.or.jp/public/2006gl/pdf/4_Volume4/V4_02_Ch2_Generic.pdf).� Jasa P. (2002) Conservation Tillage Systems,Extension Engineer, University of Nebraska. � Reicosky D. (1995) Conservation tillage andcarbon cycling: soil as a source or sink forcarbon. University of Davis, USA. � Johnson et al. (2005) Greenhouse gas con-tributions and mitigation potential of agricul-ture in the central USA. Soil Tillage Research.83. 73-94.� Kovach, J. C. et al (1992). A method tomeasure the environmental impact of pesti-cides. New York's Food and Life SciencesBulletin. NYS Agricul. Exp. Sta. CornellUniversity, Geneva, NY, 139. 8 pp. Annuallyupdated http://www.nysipm.cornell.edu/publi-cations/EIQ.html� Leibig et al. (2005) Greenhouse gas contri-butions and mitigation potential of agriculturepractices in north-western USA and WesternCanada. Soil Tillage Research. 83. 25-52.� West T. & Post W. (2002) Soil OrganicCarbon Sequestration Rates by Tillage andCrop Rotation: A Global Analysis. Soil ScienceSociety of American Journal. 66November/December: 930-1046.� Robertson, G., P, E & Harwood R. (2000)Greenhouse Gases in Intensive Agriculture:Contributions of Individual Gases to theRadioactive Forces of the Atmosphere. Science.289, No. 5486, 1922-1925.
Figure 1. Average increase in yield (%) of biotech IR traits 1996-2010by country and trait (IRCB, resistant to corn boring pests; IRCRW,resistant to corn rootworm; IR, insect resistant cotton.
39 19/12/12 11:50 Page 1

40 WORLD AGRICULTURE
Instructions
World Agriculture problems and potential
Instruction to contributorsThis international Journal
publishes articles based uponscientifically derived evidence
that addresses problems and issuesconfronting world agriculture andfood supplies.
Articles will be subject to review bytwo or more scrutineers beforeacceptance. Authors are encouragedto take a critical approach to world-wide issues and to advance newconcepts. Those wishing to submit anunsolicited article should in the firstinstance send a short summary of theirintended paper in English byelectronic mail to the Editor. TheJournal will publish suitable articles onagriculture and horticulture and theirclimatic, ecological, economic andsocial interactions. Relevant aspects offorestry and fisheries as well as foodstorage and distribution will also beacceptable.
The Journal is not available forcommunication of previouslyunpublished experimental work,although original deductions fromexisting information are welcome.Statements must be based on soundscientifically derived evidence and allarguments must be rational andlogically derived. Typical articles willbe between 1,000 and 3,000 words,with photographs, and figures, linedrawings and tables, where relevant.Articles outside these lengths may beacceptable, if the length can bejustified.
Articles that pose questions and raiseissues for which answers are neededwill be accepted if they meet thenecessary criteria. Such questions mayfor example, describe an economic orhusbandry problem in a developingcountry or ocean, resulting fromclimate change or some unintendedconsequence of policy, for which noclear solution is at hand.
World Agriculture will produce onevolume each year with Issue Numbers1 and 2 occurring within each volume.Page numbers will run consecutivelythroughout each volume from pageone onwards.
SectionsThe Journal has three main Sections:(1) Scientific, (2) Economic & Social,and (3) Comment & Opinion. It alsoaccepts Letters to the Editor andincludes Book Reviews and Editorials.
Scientific, Economic and SocialStatements of fact in the first twoSections must be based on evidencefrom peer-reviewed publications whichmust be fully referenced. Comment and OpinionSubmissions must be based onconsiderable experience and belogically argued. Articles that posequestions and raise issues for whichanswers are needed will be accepted ifthey meet the necessary criteriafollowing rigorous examination. Suchquestions may for example, describean economic or husbandry problem ina developing country or ocean,resulting from climate change or someunintended consequence of policy, forwhich no clear solution is at hand.References are not essential, althoughthey should be used to justifystatements where appropriate.
Layout and typinginstructionsSI units and the English language mustbe used, the spelling being generallythat of the Concise Oxford Dictionary,9th Ed, so that words such as fertilisershould use ‘ise’ rather than theAmerican ‘ize’ spelling.
Times New Roman 12 point fontshould be justified for normal text andArial should be used for headings.Standard abbreviations (e.g. Fig. andFigs) are acceptable, but specialistabbreviations and terms should bedefined in a short Glossary,immediately beneath the Summary.
Additionally, keywords should alsobe included beneath the summary.Full stops are not used in commonlyaccepted abbreviations (e.g. USA, UK)and should not be used when anabbreviated word ends with the sameletter as the complete word (e.g.,Florida as FA and cultivar as cv.). Latinterms such as circa should beitalicized, for which ca is theabbreviation.
Commercial chemicals should bereferred to by their approved commonnames, but where a proprietary nameis relevant and unavoidable it shouldbe used with a capital initial and themanufacturer named at the firstmention.
Billion may be expressed asthousand million (eg a billion hectaresas 1 000 Mha) although the SI
expression Gha is acceptable.Concentrations and rates ofapplication should be clearly expressedand unambiguous, using, for example,mg/litre, or mg/L, mg/kg (not ppm).
Dates should be expressed as day,month, year, as for example, 18thMay 2010.
Currency references should use thestandard international abbreviations,although US$, € nd £ are acceptablefor US dollars, Euro and GB £respectively.
Wherever possible financial detailsshould be quoted in one of thesecurrencies, although where this is notpossible a standard list ofabbreviations is available at<http://www.forex-rates.biz/currency-abbreviations.htm> which wasaccessed in March 2011.
The full Latin name of an organismshould be given at the first mention,e.g. Heterodera avenae; an abbreviatedname of the organism may be usedfor subsequent mentions, e.g. H.avenae. Names should follow theappropriate international codes.Naturally occurring infraspecificvariants should be described asvarieties, as for example Medicagopolymorpha var hispida and whereused repeatedly in the text variety maybe abbreviated to var. or vars.
The word cultivar should berestricted to forms in cultivation andwhich need to be propagated eitherby seed or vegetatively and can beabbreviated to cv. or cvs after first usein the text. They will normally havespecific advantages and distinctivefeatures which will enable them to bedescribed and differentiated fromothers. Named cultivars should be innormal, ie not italicised font as forexample Taxus baccata ‘Variegata’ orTaxus baccata cv Variegata.
Always use numerals for specificunits of measurement (e.g. 14 m, 2 d,3 wk). For other quantities up to andincluding nine, spell out in full (e.g.four plots, two experiments, ninelarvae). Use numerals in all instancesfor ten or over (e.g. 20 fields).
Large numbers should be separatedby spaces every 000, rather than byuse of a comma, e.g., 10 000.
Hyphens should be avoided ifpossible, for example use ‘cooperate’rather than co-operate’.
40 19/12/12 11:50 Page 1

WORLD AGRICULTURE 41
InstructionsWhere authors need to reproduce
information protected by copyrightthey must obtain permission toreproduce the item before the article ispublished in World Agriculture.
Sequence of headingsEach paper should commence with ashort concise, accurate andinformative Summary, normally ofapproximately 250 words, thatincludes the issues posed, the subjectcovered and the conclusions drawn.
The Introduction should set out thebackground to the subject. This is tobe followed by the main body of thearticle in sections each of which isheaded by terms defined by thenature of the paper, for example:Background, Review of evidence, thePresent situation, Problems to beconfronted and Resolution.
The paper should conclude with aDiscussion and/or Conclusionssection and finally References. Layoutof headings should follow theguidance below:Title, bold 16 point centredAuthor name, Arial 14 point centred Affiliation, Arial 14 point centred italicsMain headings central bold Arial 14point fontSecondary headings: left justified,bold Arial 12 point font Tertiary level: left justified, Arial 12point font Quaternary (if necessary) left justified,Arial 12 point italics
Tables, figures, linedrawings, photographsand graphsFigures, Tables and Photographsshould be placed in a separate set offiles from the text (indicate in textdesired location, e.g. with the phraseTable xx near here on a separate linein square brackets if possible). Eachshould be numbered sequentially withthe title in Times New Roman 12 pointfont beneath. All figures and tablesshould be of high resolution. Ifpossible figures and tables should besubmitted in Excel (same table(s)could be in Word, in addition) andalso if possible submit the data fromwhich the figure has been produced.Make sure all the denominations areaccording to international standardsand the legends are clear.
Tables with suitable titles must benumbered using Arabic numerals insequence and be understandablewithout reference to the text. Use ahorizontal line to separate columnheadings from data and at the bottomof the table; avoid column lines.Excessive numbers of columns shouldbe avoided.
Illustrations in the form of textfigures, line drawings, and computergenerated figures and graphs withtheir captions should all becomprehensible without reference tothe text. All photographs should behalf tone or colour, have a highdefinition (>5 million pixels/photo)and the software should be IBM/DOScompatible. Each photograph shouldbe adequately identified with theauthor, paper and plate number.Photographs submitted electronicallymust be in separate jpg files with theessential information included in theproperties box for the file.Alternatively, photographs may beposted to the Editor on disk (requestaddress by e-mail). The plate number,authors and an indication of the papertitle should also be given in a separateelectronic file. Electronic-mail issatisfactory for correspondence, textand tables.
Standard deviations, standard errorsof the means and “n”, the number ofobservations associated with eachmean, should all be presented.
References and citationsAll references in the text should begiven as numbers, although theauthor(s) name may be givenimmediately before the number, ifhelpful.
References should be numberedsequentially in the order in which theyappear, the first as (1), with allsubsequent references to the samepaper using the same number. Wheremore than one paper is cited, thenumbers should be listed in numericalorder.
In the Reference Section papersshould be listed in numerical order inthe format:
1. Anon (yyyy) Web page title.<http://www.organisation/page/file_or_other_address> accessed dd mmmyyyy.
2. Klass, D W (ed.) (1979) Currentpractice of clinicalelectroencephalography. New York,Raven Press, 1979 ISBN n nn nnn nnnnnn.
3. Organisation (yyyy) Web pagetitle.<http://www.organisation/page/file_or_other_address> accessed ddmmm yyyy.
4. Regan, D & Smith, A (1979)Electrical responses evoked from thehuman brain. Scientific American, 241,134-52.
5. Smil, V (2011) Nitrogen cycleand world food production. WorldAgriculture, 2 (1) 9-13.
6. Blogs, P (2010) Personalcommunication.
7. Baggins, B (1991) Title of paper.In: Proceedings of--- (ed., R.E. Blogs),Name of sponsor or organiser, USA, 6-8 June 1991, pp.91-4
When a reference includes an issuenumber, include the volume numberin bold and the issue number inbrackets, between the volume and thefirst and last page numbers.
Communications withthe Editor for publicationComments & Opinion and Letters tothe Editor by e-mail will also beconsidered for publication. Theseshould be concise and submitted forthe purpose of making objectivecomments on published articles, or onimportant subjects that have not beencovered.
Submission, Editing andAcceptanceManuscripts should be formatted toA4 justified using MS Word and 12 ptTimes New Roman font.
Authors’ names, qualifications,honours and affiliations should beincluded and submission will assumethat the author accepts the conditionslaid down in these Instructions toContributors and that copyright isheld by World Agriculture: problemsand potential.
Manuscripts should be submitted tothe Editor by electronic mail, with theaddress of: [email protected].
Articles that are accepted by theeditorial board will be edited and theEditor reserves the right to modifystatements made by the author, or toask for a revision, although the editedversions will be sent to the author forhis or her agreement beforepublication.
The author’s response must occurwithin 96 h. Moreover, during therevision process it is essential thatauthors respond quickly and reliably torequests for amendments, otherwisethe publication deadline will beforfeited.
Inside back 19/12/12 12:15 Page 1

Back 18/12/12 15:41 Page 1