working paper series - european central bank · no 895 / may 2008 on the empirical evidence of the...
TRANSCRIPT

Work ing PaPer Ser i e Sno 895 / May 2008
on the eMPirical evidence of the interteMPoral current account Model for the euro area countrieS
by Michele Ca’ Zorzi and Michał Rubaszek

WORKING PAPER SER IESNO 895 / MAY 2008
In 2008 all ECB publications
feature a motif taken from the
10 banknote.
ON THE EMPIRICAL EVIDENCE OF
THE INTERTEMPORAL CURRENT
ACCOUNT MODEL FOR THE EURO
AREA COUNTRIES 1
by Michele Ca’ Zorzi 2
and Michał Rubaszek 3
This paper can be downloaded without charge from
http://www.ecb.europa.eu or from the Social Science Research Network
electronic library at http://ssrn.com/abstract_id=1120701.
1 We have benefited from valuable comments by the participants of an internal ECB seminar and an anonymous referee. The views expressed in
this paper are those of the authors and do not necessarily represent those of the European Central Bank.
2 European Central Bank, Kaiserstrasse 29, 60311 Frankfurt am Main, Germany; e-mail: [email protected]
3 National Bank of Poland, ul. Świętokrzyska 11/21, 00-919 Warsaw, Poland and Warsaw School of
Economics, al. Niepodległosci 162, 02-554 Warsaw, Poland; e-mail: [email protected].
The paper was written when the author was visiting the European Central Bank.
© European Central Bank, 2008
Address Kaiserstrasse 29 60311 Frankfurt am Main, Germany
Postal address Postfach 16 03 19 60066 Frankfurt am Main, Germany
Telephone +49 69 1344 0
Website http://www.ecb.europa.eu
Fax +49 69 1344 6000
All rights reserved.
Any reproduction, publication and reprint in the form of a different publication, whether printed or produced electronically, in whole or in part, is permitted only with the explicit written authorisation of the ECB or the author(s).
The views expressed in this paper do not necessarily reflect those of the European Central Bank.
The statement of purpose for the ECB Working Paper Series is available from the ECB website, http://www.ecb.europa.eu/pub/scientific/wps/date/html/index.en.html
ISSN 1561-0810 (print) ISSN 1725-2806 (online)

3ECB
Working Paper Series No 895May 2008
Abstract 4
Non-technical summary 5
1 Introduction 6
2 The model 82.1 General features 82.2 Households 92.3 Production 102.4 The current account 11
3 Model simulations 123.1 Parameterisation 123.2 Convergence path simulation 13
4 Empirical evidence 154.1 The data 154.2 The results 16
5 Conclusion 19
Appendix 20
References 22
European Central Bank Working Paper Series 24
contentS

4ECBWorking Paper Series No 895May 2008
Abstract
In this paper we present a novel approach to the empirical validation of the intertemporal approach to the current account. We develop a calibrated model highlighting the role of consumption smoothing and capital accumulation in the economic convergence process. After solving the model, we derive the theoretical values for the euro area countries’ current account, testing to what extent they match reality. The model explains most of the dispersion in the current account and saving ratio, though cannot equally well capture differences in the investment ratios. The conclusion that we draw is that consumption smoothing, based on expectations of economic convergence, is driving the current account of the euro area countries over medium-term horizons. Capital accumulation appears to play a less pronounced role.
Keywords: General equilibrium models, intertemporal optimisation, current account, euro area. JEL Classification: D91, F36, F41
5ECB
Working Paper Series No 895May 2008
2
Non-technical summary
The early 1980s experienced substantial growth in the literature that emphasised the role of forward-looking expectations in driving current account developments. In this approach, the current account of a country is treated mainly as a reflection of consumption and investment decisions that span over long-term horizons. Over the years, alternative methodological frameworks have been developed to assess whether the intertemporal optimisation hypothesis finds empirical support in the data. While broad confirmation of the theory was found in some of the studies, none of them thoroughly tested if the underlying intertemporal models generate numbers similar to the current account patterns seen in Europe.
In this paper we propose a novel approach to the empirical validation of the intertemporal approach to the current account. With the help of a simple general equilibrium model, we investigate whether the dispersion of the current account balances in the euro area countries could be explained on the basis of a small set of economic fundamentals, such as productivity, capital stock and net foreign assets. After solving the model, we derive the theoretical values for the euro area countries’ current account, saving and investment, testing to what extent they match reality. The model is sufficiently rich to explain about three quarters in the dispersion of the current account and saving ratio of the euro area countries in the period 2001-2006, though cannot equally well capture differences in the investment ratios. We come to the conclusion that consumption smoothing plays a much more important role than capital accumulation in driving medium-term current account developments in the euro area countries.
Abstract
In this paper we present a novel approach to the empirical validation of the intertemporal approach to the current account. We develop a calibrated model highlighting the role of consumption smoothing and capital accumulation in the economic convergence process. After solving the model, we derive the theoretical values for the euro area countries’ current account, testing to what extent they match reality. The model explains most of the dispersion in the current account and saving ratio, though cannot equally well capture differences in the investment ratios. The conclusion that we draw is that consumption smoothing, based on expectations of economic convergence, is driving the current account of the euro area countries over medium-term horizons. Capital accumulation appears to play a less pronounced role.
Keywords: General equilibrium models, intertemporal optimisation, current account, euro area. JEL Classification: D91, F36, F41

6ECBWorking Paper Series No 895May 2008
3
1. Introduction
The early 1980s experienced substantial growth in the literature analysing the intertemporal aspects of the current account. Following Buiter (1981) and Sachs (1981), a number of authors have emphasised the role of forward-looking expectations in explaining current account patterns. In the proposed models, the current account of a country is treated mainly as a reflection of consumption and investment decisions that span over long-term horizons. For example, a temporary fall in output triggered by a negative productivity shock would lead to a current account deficit, as economic agents smooth their consumption. A relatively high marginal rate on capital would similarly lead to a deterioration of the current account balance, in this case via an increase in investment. In comparison to the traditional Keynesian approach, the intertemporal approach to the current account (ICA) puts considerably less emphasis on international price competitiveness and relative demand in explaining current account movements.
The empirical applications of the ICA model evolved along two main lines of research. The first strand of the literature applied the “present value test”, as developed by Campbell (1987) and Campbell and Shiller (1987), to examine whether the theoretical implications of the ICA model are supported by the data. The standard ICA model implication is that the current account balance equals to the present value of expected future declines in net output, in turn defined as output less investment and government spending. Sheffrin and Woo (1990) or Otto (1992) tested this theoretical implication by forecasting future declines in net output with a bivariate VAR model for the current account and net output. The present value framework was then extended in several directions, in particular by emphasising the role of interest and exchange rates variability (Bergin and Sheffrin, 2000); by incorporating consumption habits (Gruber, 2004); or by adding an exogenous world real interest rate shock (Nason and Rogers, 2006). Most often than not, the above literature concluded that the ICA model is rejected by the data on account of higher volatility of the observed current account figures in comparison to the model-predicted series (see Mercereau and Miniane, 2004). An additional finding that emerges from these studies is that the ICA hypothesis holds generally better for euro area countries than for other economies (see Campa and Gavian, 2006).
The second strand of the literature applied standard econometric techniques to establish if there is a long-term relationship between the current account and standard macroeconomic fundamentals, such as relative GDP per capita, the demographic structure or fiscal policy. The most prominent examples of this

7ECB
Working Paper Series No 895May 2008
4
analytical approach are the studies by Debelle and Faruquee (1996), Chinn and Prasad (2003) or Bussiere et al. (2004). The associated panel data regressions generally confirm some of the ICA model implications, among other in particular, that there is a significant and positive relationship between the current account and GDP per capita across countries. For converging economies, the current account balance is also found to be dependent on financial market developments.
Concerning other studies that are relevant to this article, a number of authors have applied calibrated general equilibrium ICA models to rationalise the qualitative features of current account developments that have been observed in selected European countries. Most notably, Blanchard and Giavazzi (2002) propose an overlapping generation open economy model to show that increased goods and financial markets integration helps explain the widening in the current account deficit in Greece and Portugal. Fagan and Gaspar (2007) follow a similar approach. On the basis of a calibrated ICA model they can rationalise why a group of converging economies, having seen a sizeable fall in their domestic interest rates after joining the euro area, experienced at the same time a rise in their current account deficit and a process of real exchange rate appreciation. In the same vein, Bems and Schellekens (2007) make reference to an intertemporal general equilibrium framework to point to the positive correlation between total factor productivity growth rates and current account deficits in central and eastern Europe.
All of the above studies employ calibrated simulations aimed at explaining stylised facts in the current account; none of them thoroughly test, however, if the underlying models generate numbers matching closely the current account patterns seen in Europe. In this paper we propose a novel approach to the empirical validation of the ICA model. With the help of a simple intertemporal optimising framework, we investigate whether the dispersion of the current account balances across the euro area countries could be explained on the basis of a small set of economic fundamentals, such as productivity, capital stock and net foreign assets. In this regard, we develop a calibrated ICA model that highlights two key aspects of the intertemporal optimisation in the economic convergence process: consumption smoothing and capital accumulation. After solving the model, we derive the theoretical values for the euro area countries’ current account and test to what extent they match reality. We come to the conclusion that the proposed model, notwithstanding its simplicity, is sufficiently rich to explain most of the dispersion of the current account and saving ratio in the euro area countries. By contrast, differences in the investment ratios cannot be equally well captured by the model. The conclusion that we draw is that consumption smoothing, based on expectations of economic convergence, is driving

8ECBWorking Paper Series No 895May 2008
the current account of the euro area countries over medium-term horizons. Capital accumulation appears to play a less pronounced role.
The contribution of the paper is therefore mainly twofold. First, we develop an intertemporal model aimed at describing the underlying convergence path of the euro area countries’ main economic aggregates, abstracting from cyclical considerations. Second, we propose an additional benchmark for empirically validating the intertemporal approach to the current account. To our knowledge this is the first study that explicitly tests the ability of a calibrated ICA model to reflect the current account patterns in the euro area countries. Price competitiveness is not, under this approach, the main force driving current account developments over medium-term horizons.
The remainder of the paper is organised as follows. Section 2 develops the intertemporal current model, a complete and analytically simplified version of which is given in Appendix A. In section 3 the model is calibrated and its properties are investigated. Section 4 describes the data and focuses on the empirical correspondence between model implied and actual values of the current account, saving and investment. The final section contains our main conclusions.
2. The model 2.1. General features
The model considers a small open economy where production, consumption and investment are all based on a single homogenous good. The law of one price holds in each period, and there are neither transport costs nor impediments to international trade. In contrast, international financial markets are incomplete as investors require a premium for lending that depends positively on the stock of net foreign liabilities of the domestic economy. The process of capital accumulation is assumed to be subject to adjustment costs, which introduces further frictions to the model. For ease of exposition, the foreign economy, whose variables are denoted by a star “*”, is assumed to be permanently in its steady state. The model also assumes that the structure and the parameters of the domestic and foreign economies are the same.
While the model does not incorporate all the relevant factors to current account modelling, for instance cyclical or demographic, it relies on two crucial mechanisms through which intertemporal optimisation is said to operate in converging economies, i.e. the process of consumption smoothing by consumers and of capital accumulation by investors. As a result, the model is designed for explaining what drives the underlying current account among highly integrated economies, such as those belonging to a common currency area, and not for being an overarching
9ECB
Working Paper Series No 895May 2008
modelling framework of the current account. The features considered in this model are shown to be sufficient to characterise adequately the medium-term current account positions for most euro area countries. 2.2. Households
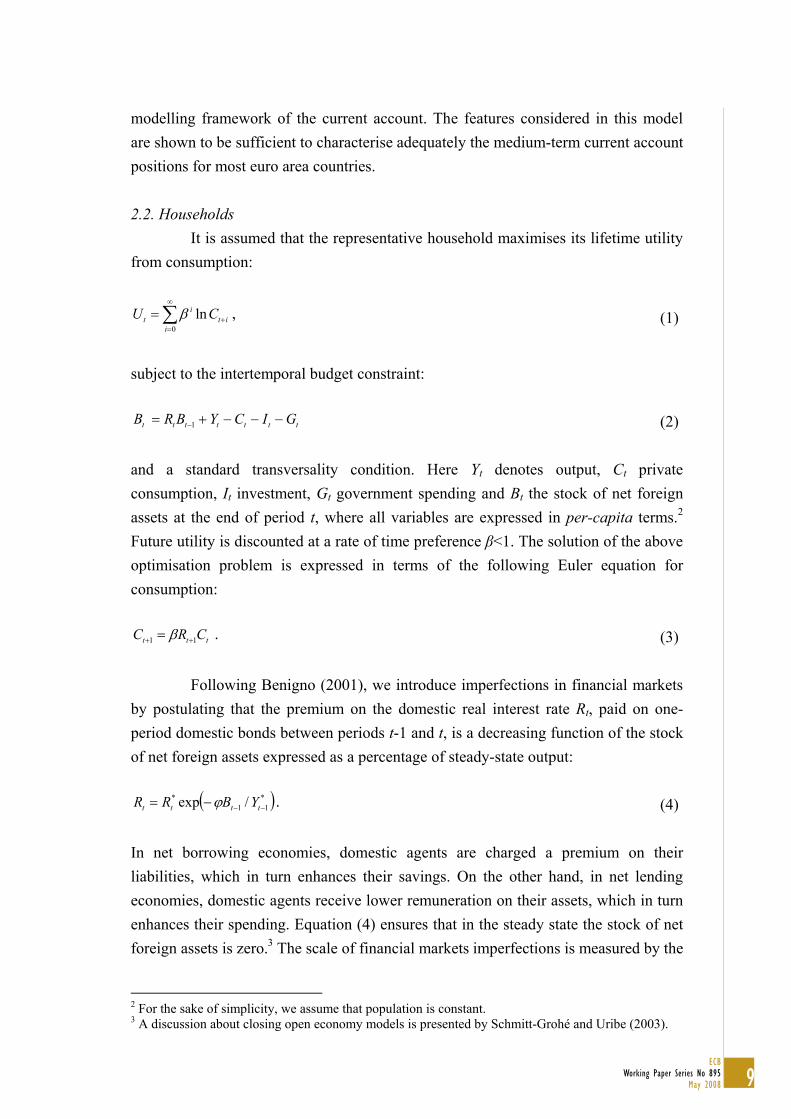
It is assumed that the representative household maximises its lifetime utility from consumption:
0
lni
iti
t CU , (1)
subject to the intertemporal budget constraint:
ttttttt GICYBRB 1 (2) and a standard transversality condition. Here Yt denotes output, Ct private consumption, It investment, Gt government spending and Bt the stock of net foreign assets at the end of period t, where all variables are expressed in per-capita terms.2 Future utility is discounted at a rate of time preference <1. The solution of the above optimisation problem is expressed in terms of the following Euler equation for consumption:
ttt CRC 11 . (3)
Following Benigno (2001), we introduce imperfections in financial markets by postulating that the premium on the domestic real interest rate Rt, paid on one-period domestic bonds between periods t-1 and t, is a decreasing function of the stock of net foreign assets expressed as a percentage of steady-state output:
*11
* /exp tttt YBRR . (4) In net borrowing economies, domestic agents are charged a premium on their liabilities, which in turn enhances their savings. On the other hand, in net lending economies, domestic agents receive lower remuneration on their assets, which in turn enhances their spending. Equation (4) ensures that in the steady state the stock of net foreign assets is zero.3 The scale of financial markets imperfections is measured by the
2 For the sake of simplicity, we assume that population is constant. 3 A discussion about closing open economy models is presented by Schmitt-Grohé and Uribe (2003).
10ECBWorking Paper Series No 895May 2008
parameter , whereby values close to zero represent almost completely integrated financial markets. 2.3. Production
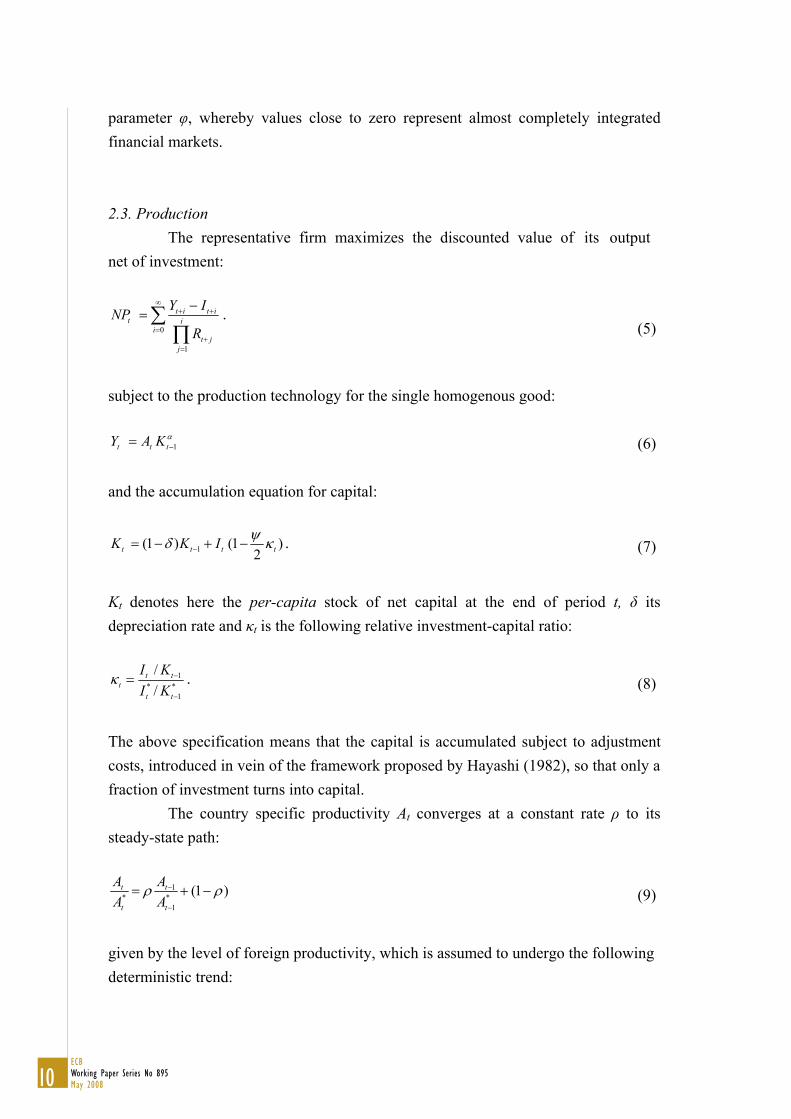
The representative firm maximizes the discounted value of its output net of investment:
0
1
ii
jjt
ititt
R
IYNP . (5)
subject to the production technology for the single homogenous good:
1ttt KAY (6) and the accumulation equation for capital:
)2
1()1( 1 tttt IKK . (7)
Kt denotes here the per-capita stock of net capital at the end of period t, its depreciation rate and t is the following relative investment-capital ratio:
*1
*1
//
tt
ttt KI
KI . (8)
The above specification means that the capital is accumulated subject to adjustment costs, introduced in vein of the framework proposed by Hayashi (1982), so that only a fraction of investment turns into capital.
The country specific productivity At converges at a constant rate to its steady-state path:
)1(*1
1*
t
t
t
t
AA
AA (9)
given by the level of foreign productivity, which is assumed to undergo the following deterministic trend:

11ECB
Working Paper Series No 895May 2008
*1
1* )1( tt AA . (10) As a result, according to the above specification, steady-state output, net capital stock, consumption and investment all grow at an annual rate equal to .
The solution to the above maximisation problem specifies the shadow price of installed capital, i.e. Tobin’s Q:
ttQ
11 (11)
and the investment Euler equation:
211
11
1 2)(11
ttttt
t QKAR
Q . (12)
2.4. The current account
To close the model we assume that government spending is a constant fraction of output:
tt YG . (13)
Equations (2)-(4) and (6)-(13) taken together form the complete general equilibrium model. Given the initial conditions, represented by the stock of net capital
1tK , net foreign assets Bt-1 and productivity At-1, the model endogenously determines
the optimal convergence path for output, consumption, investment, capital stock, and the stock of net foreign assets. Finally, the current account CAt can be calculated as the change in the stock of net foreign assets:
1ttt BBCA , (14) which, given relationship (2), equals the sum of the trade and income balance:
1)1()( ttttttt BRGICYCA . (15)
12ECBWorking Paper Series No 895May 2008
3. Model simulations
In this section we present the results of a number of simulations that show the convergence path of the domestic economy depending on the chosen starting point. We consider three cases that depend on the different initial values assigned to productivity, stock of capital and net foreign assets, respectively. We start by discussing the parameterisation of the model. 3.1. Parameterisation
The model is calibrated at an annual frequency. Since the structure of the economy is assumed to be the same at home as abroad, the corresponding parameters are also the same. Their values are chosen to reflect the euro area economic environment. Our assumptions are summarised in Table 1.
For the standard parameters we take the following values. In per-capita terms, the steady-state growth rate is calibrated at 1.5 percent per year, reflecting the average dynamics of the euro area in the years 1999-2006. We assume the discount factor to be 0.975 so that the steady-state value of the real interest rate R* equals 1.04. To match the sample mean of the investment-output ratio, we set the depreciation rate of capital to 8 percent and the share of capital in production to 30 percent, which are both broadly consistent with the values by Smets and Wouters(2003). The steady-state share of government spending in output is postulatedto be 20 percent, in line with the historical 1999-2006 euro area average.
Calibrating the remaining three parameters of the model is less straightforward, given the lack of consensus in the literature about their values. We proceed as follows. The capital adjustment parameter is set to 0.5, so that the half-life of capital stock adjustment is around fifteen years. This value is twice as high as in Bernanke et al. (1998) and four times as low as in King and Wolman (1996). The risk premium coefficient is set to 0.0015, which implies that a decrease in net foreign assets to steady-state output ratio by 100 percentage points is associated with a higher domestic interest rate by 15 basis points. Our choice broadly reflects the magnitude of the negative correlation between sovereign bond yields and net international investment position in the euro area countries. This compares to 0.00074 chosen by Schmitt-Grohé and Uribe (2003) and 0.001 by Benigno (2001). The final parameter to be calibrated is the pace of convergence of productivity to the steady state. On the basis of the econometric evidence presented by Crespo-Cuaresma et al. (2002) and Badinger et al. (2002), we assume that the annual rate of convergence is 5

13ECB
Working Paper Series No 895May 2008
percent, which means that the half-life of the productivity gap amounts to around thirteen years.
Table 1. Calibrated parameters Parameter Valuegrowth rate 0.015 external real interest rate R* 1.04 depreciation rate 0.08 capital share 0.30 government spending 0.20 capital adjustment cost 0.50 risk premium coefficient 0.0015 convergence pace 0.95
3.2. Convergence path simulation
In the first simulation4 we analyse the convergence path of the model economy from a low level of productivity. According to the results presented in Table 2, in the initial years the shortfall in private consumption is smaller than the deviation of output from the steady state, which indicates a relatively low saving rate. Investments are subdued against a backdrop of a lower return on capital, which is reflected by a low value of the Tobin’s Q. However, in the light of the expected productivity convergence, the investment-output ratio remains above its steady-state level. Taken together these two factors mean that the domestic economy is characterised by a current account deficit and a consequent accumulation of net foreign liabilities, which in turn need to be serviced and paid back in later periods. Table 2. Convergence path of the economy with lower initial productivity
Deviation from steady state (%) Shares in output (%) t Yt At Kt Qt It Ct Rt Bt CAt Saving Investment
0 -10.0 0.0 0.0 1 -9.5 -9.5 -0.4 -6.5 -6.9 -5.6 0.00 -2.8 -2.8 19.3 22.1 2 -9.2 -9.0 -0.8 -5.9 -6.7 -5.6 0.00 -5.5 -2.7 19.4 22.1 5 -8.2 -7.7 -1.8 -4.3 -6.0 -5.6 0.02 -12.7 -2.4 19.6 22.0
10 -6.7 -6.0 -2.8 -2.4 -5.1 -5.4 0.03 -22.1 -1.9 20.0 21.9 25 -3.8 -2.8 -3.5 0.3 -3.2 -4.8 0.05 -35.9 -1.0 20.7 21.6 50 -1.5 -0.8 -2.4 0.8 -1.6 -3.5 0.05 -35.3 -0.2 21.2 21.5
100 -0.3 -0.1 -0.8 0.3 -0.5 -1.5 0.03 -18.0 0.0 21.5 21.5 Note: The steady-state investment and saving-output ratios equal to 21.5.
In the second simulation we investigate the convergence path from a low level of capital stock, as it could originate for example from a series of negative
4 All calculations were performed using the MATLAB-based DYNARE package that is available at http://www.cepremap.cnrs.fr/dynare/. The employed codes are available on request from the authors.
14ECBWorking Paper Series No 895May 2008
11
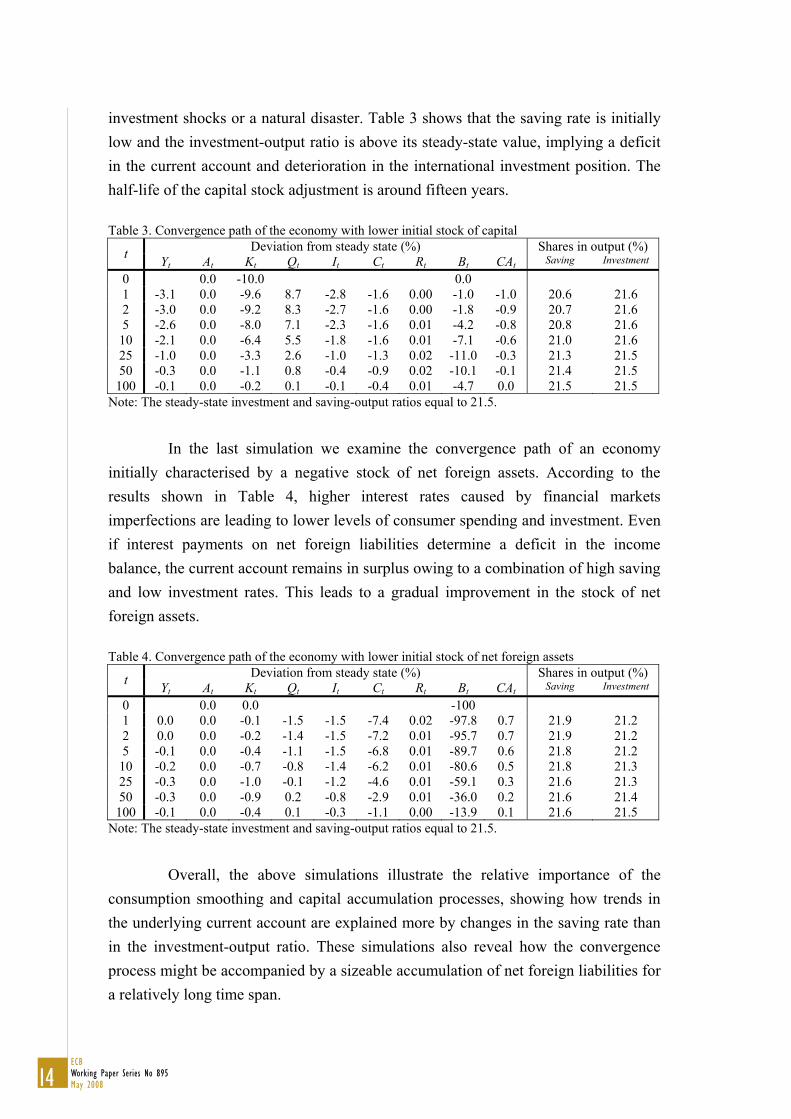
investment shocks or a natural disaster. Table 3 shows that the saving rate is initially low and the investment-output ratio is above its steady-state value, implying a deficit in the current account and deterioration in the international investment position. The half-life of the capital stock adjustment is around fifteen years. Table 3. Convergence path of the economy with lower initial stock of capital
Deviation from steady state (%) Shares in output (%) t Yt At Kt Qt It Ct Rt Bt CAt Saving Investment
0 0.0 -10.0 0.0 1 -3.1 0.0 -9.6 8.7 -2.8 -1.6 0.00 -1.0 -1.0 20.6 21.6 2 -3.0 0.0 -9.2 8.3 -2.7 -1.6 0.00 -1.8 -0.9 20.7 21.6 5 -2.6 0.0 -8.0 7.1 -2.3 -1.6 0.01 -4.2 -0.8 20.8 21.6
10 -2.1 0.0 -6.4 5.5 -1.8 -1.6 0.01 -7.1 -0.6 21.0 21.6 25 -1.0 0.0 -3.3 2.6 -1.0 -1.3 0.02 -11.0 -0.3 21.3 21.5 50 -0.3 0.0 -1.1 0.8 -0.4 -0.9 0.02 -10.1 -0.1 21.4 21.5
100 -0.1 0.0 -0.2 0.1 -0.1 -0.4 0.01 -4.7 0.0 21.5 21.5 Note: The steady-state investment and saving-output ratios equal to 21.5.
In the last simulation we examine the convergence path of an economy
initially characterised by a negative stock of net foreign assets. According to the results shown in Table 4, higher interest rates caused by financial markets imperfections are leading to lower levels of consumer spending and investment. Even if interest payments on net foreign liabilities determine a deficit in the income balance, the current account remains in surplus owing to a combination of high saving and low investment rates. This leads to a gradual improvement in the stock of net foreign assets.
Table 4. Convergence path of the economy with lower initial stock of net foreign assets
Deviation from steady state (%) Shares in output (%) t Yt At Kt Qt It Ct Rt Bt CAt Saving Investment
0 0.0 0.0 -100 1 0.0 0.0 -0.1 -1.5 -1.5 -7.4 0.02 -97.8 0.7 21.9 21.2 2 0.0 0.0 -0.2 -1.4 -1.5 -7.2 0.01 -95.7 0.7 21.9 21.2 5 -0.1 0.0 -0.4 -1.1 -1.5 -6.8 0.01 -89.7 0.6 21.8 21.2
10 -0.2 0.0 -0.7 -0.8 -1.4 -6.2 0.01 -80.6 0.5 21.8 21.3 25 -0.3 0.0 -1.0 -0.1 -1.2 -4.6 0.01 -59.1 0.3 21.6 21.3 50 -0.3 0.0 -0.9 0.2 -0.8 -2.9 0.01 -36.0 0.2 21.6 21.4
100 -0.1 0.0 -0.4 0.1 -0.3 -1.1 0.00 -13.9 0.1 21.6 21.5 Note: The steady-state investment and saving-output ratios equal to 21.5.
Overall, the above simulations illustrate the relative importance of the
consumption smoothing and capital accumulation processes, showing how trends in the underlying current account are explained more by changes in the saving rate than in the investment-output ratio. These simulations also reveal how the convergence process might be accompanied by a sizeable accumulation of net foreign liabilities for a relatively long time span.
15ECB
Working Paper Series No 895May 2008
4. Empirical evidence
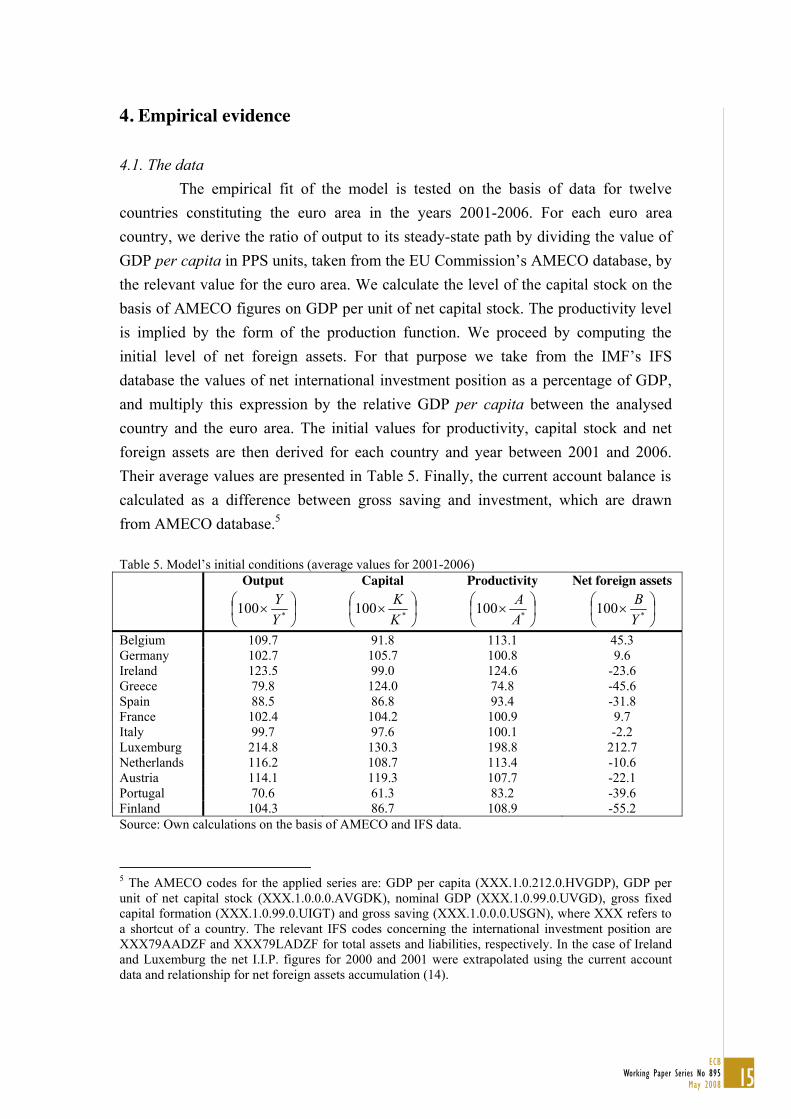
4.1. The data The empirical fit of the model is tested on the basis of data for twelve
countries constituting the euro area in the years 2001-2006. For each euro area country, we derive the ratio of output to its steady-state path by dividing the value of GDP per capita in PPS units, taken from the EU Commission’s AMECO database, by the relevant value for the euro area. We calculate the level of the capital stock on the basis of AMECO figures on GDP per unit of net capital stock. The productivity level is implied by the form of the production function. We proceed by computing the initial level of net foreign assets. For that purpose we take from the IMF’s IFS database the values of net international investment position as a percentage of GDP, and multiply this expression by the relative GDP per capita between the analysed country and the euro area. The initial values for productivity, capital stock and net foreign assets are then derived for each country and year between 2001 and 2006. Their average values are presented in Table 5. Finally, the current account balance is calculated as a difference between gross saving and investment, which are drawn from AMECO database.5 Table 5. Model’s initial conditions (average values for 2001-2006) Output
*100YY
Capital
*100KK
Productivity
*100AA
Net foreign assets
*100YB
Belgium 109.7 91.8 113.1 45.3 Germany 102.7 105.7 100.8 9.6 Ireland 123.5 99.0 124.6 -23.6 Greece 79.8 124.0 74.8 -45.6 Spain 88.5 86.8 93.4 -31.8 France 102.4 104.2 100.9 9.7 Italy 99.7 97.6 100.1 -2.2 Luxemburg 214.8 130.3 198.8 212.7 Netherlands 116.2 108.7 113.4 -10.6 Austria 114.1 119.3 107.7 -22.1 Portugal 70.6 61.3 83.2 -39.6 Finland 104.3 86.7 108.9 -55.2 Source: Own calculations on the basis of AMECO and IFS data.
5 The AMECO codes for the applied series are: GDP per capita (XXX.1.0.212.0.HVGDP), GDP per unit of net capital stock (XXX.1.0.0.0.AVGDK), nominal GDP (XXX.1.0.99.0.UVGD), gross fixed capital formation (XXX.1.0.99.0.UIGT) and gross saving (XXX.1.0.0.0.USGN), where XXX refers to a shortcut of a country. The relevant IFS codes concerning the international investment position are XXX79AADZF and XXX79LADZF for total assets and liabilities, respectively. In the case of Ireland and Luxemburg the net I.I.P. figures for 2000 and 2001 were extrapolated using the current account data and relationship for net foreign assets accumulation (14).
16ECBWorking Paper Series No 895May 2008
4.2. The results
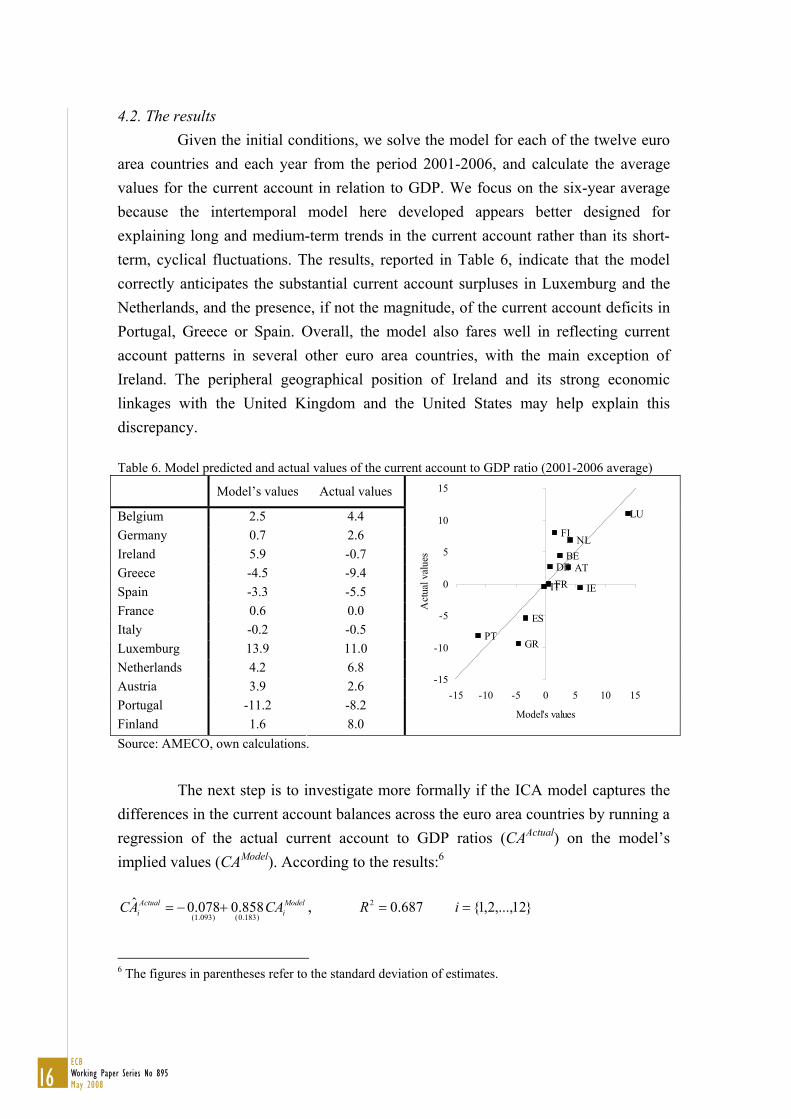
Given the initial conditions, we solve the model for each of the twelve euro area countries and each year from the period 2001-2006, and calculate the average values for the current account in relation to GDP. We focus on the six-year average because the intertemporal model here developed appears better designed for explaining long and medium-term trends in the current account rather than its short-term, cyclical fluctuations. The results, reported in Table 6, indicate that the model correctly anticipates the substantial current account surpluses in Luxemburg and the Netherlands, and the presence, if not the magnitude, of the current account deficits in Portugal, Greece or Spain. Overall, the model also fares well in reflecting current account patterns in several other euro area countries, with the main exception of Ireland. The peripheral geographical position of Ireland and its strong economic linkages with the United Kingdom and the United States may help explain this discrepancy.
Table 6. Model predicted and actual values of the current account to GDP ratio (2001-2006 average)
Model’s values Actual values
Belgium 2.5 4.4 Germany 0.7 2.6 Ireland 5.9 -0.7 Greece -4.5 -9.4 Spain -3.3 -5.5 France 0.6 0.0 Italy -0.2 -0.5 Luxemburg 13.9 11.0 Netherlands 4.2 6.8 Austria 3.9 2.6 Portugal -11.2 -8.2 Finland 1.6 8.0
BEDE
IE
GR
ES
FRIT
LU
NL
AT
PT
FI
-15
-10
-5
0
5
10
15
-15 -10 -5 0 5 10 15
Model's values
Act
ual v
alue
s
Source: AMECO, own calculations.
The next step is to investigate more formally if the ICA model captures the
differences in the current account balances across the euro area countries by running a regression of the actual current account to GDP ratios (CAActual) on the model’s implied values (CAModel). According to the results:6
Modeli
Actuali CAAC
)183.0()093.1(858.0078.0ˆ , 687.02R }12,...,2,1{i
6 The figures in parentheses refer to the standard deviation of estimates.

17ECB
Working Paper Series No 895May 2008
the slope coefficient is not significantly different from unity, whereas the determination coefficient shows that the regression is able to explain 68.7% of the current account dispersion among the euro area countries. The empirical evidence in favour of the ICA model appears, of course, stronger when Ireland is excluded fromthe regression sample:
Modeli
Actuali CAAC
)171.0()020.1(932.0377.0ˆ , 768.02R }11,...,2,1{i
as in this case the slope coefficient is closer to one and the determination coefficient increases to 76.8%.
The proposed model delivers also predictions for other macroeconomic variables. As a result, it is possible to analyse to what extent the medium-term current account patterns in the euro area countries are determined by the consumption smoothing and capital accumulation channel. Similarly to what was done before for the current account, we compare the model predictions for the saving and investment to the corresponding data.
The results for saving, reported in Table 7, indicate that the model correctly anticipates the high saving rate in Luxemburg, and its low level in Portugal and Greece. In the case of Ireland, the predicted value is not very distant from the actual one, which means that the inability of the model to reflect Ireland’s current account is mostly due to the underprediction of investment. Generally, the model fares very well in replicating observed saving rates for other euro area countries.
Table 7. Model predicted and actual values of the saving to GDP ratio (2001-2006 average)
Model’s values Actual values
Belgium 23.0 24.3 Germany 22.0 20.8 Ireland 25.3 23.1 Greece 15.6 15.0 Spain 18.7 22.4 France 22.0 19.4 Italy 21.6 20.1 Luxemburg 30.3 32.0 Netherlands 24.5 26.5 Austria 24.3 23.4 Portugal 12.5 15.0 Finland 22.2 26.7
BE
DE
IE
GR
ES
FRIT
LU
NL
AT
PT
FI
10
15
20
25
30
35
10 15 20 25 30 35
Model's value
Act
ual v
alue
Source: AMECO, own calculations.
13
4.2. The results
Given the initial conditions, we solve the model for each of the twelve euro area countries and each year from the period 2001-2006, and calculate the average values for the current account in relation to GDP. We focus on the six-year average because the intertemporal model here developed appears better designed for explaining long and medium-term trends in the current account rather than its short-term, cyclical fluctuations. The results, reported in Table 5, indicate that the model correctly anticipates the substantial current account surpluses in Luxemburg and the Netherlands, and the presence, if not the magnitude, of the current account deficits in Portugal, Greece or Spain. Overall, the model also fares well in reflecting current account patterns in several other euro area countries, with the main exception of Ireland. The peripheral geographical position of Ireland and its strong economic linkages with the United Kingdom and the United States may help explain this discrepancy.
Table 5. Model predicted and actual values of the current account to GDP ratio (2001-2006 average)
Model’s values Actual values
Belgium 2.5 4.4 Germany 0.7 2.6 Ireland 5.9 -0.7 Greece -4.5 -9.4 Spain -3.3 -5.5 France 0.6 0.0 Italy -0.2 -0.5 Luxemburg 13.9 11.0 Netherlands 4.2 6.8 Austria 3.9 2.6 Portugal -11.2 -8.2 Finland 1.6 8.0
BEDE
IE
GR
ES
FRIT
LU
NL
AT
PT
FI
-15
-10
-5
0
5
10
15
-15 -10 -5 0 5 10 15
Model's values
Act
ual v
alue
s
Source: AMECO, own calculations.
The next step is to investigate more formally if the ICA model captures the
differences in the current account balances across the euro area countries by running a regression of the actual current account to GDP ratios (CAActual) on the model’s implied values (CAModel). According to the results:6
Modeli
Actuali CAAC
)183.0()093.1(858.0078.0ˆ , 687.02R }12,...,2,1{i
6 The figures in parentheses refer to the standard deviation of estimates.
18ECBWorking Paper Series No 895May 2008
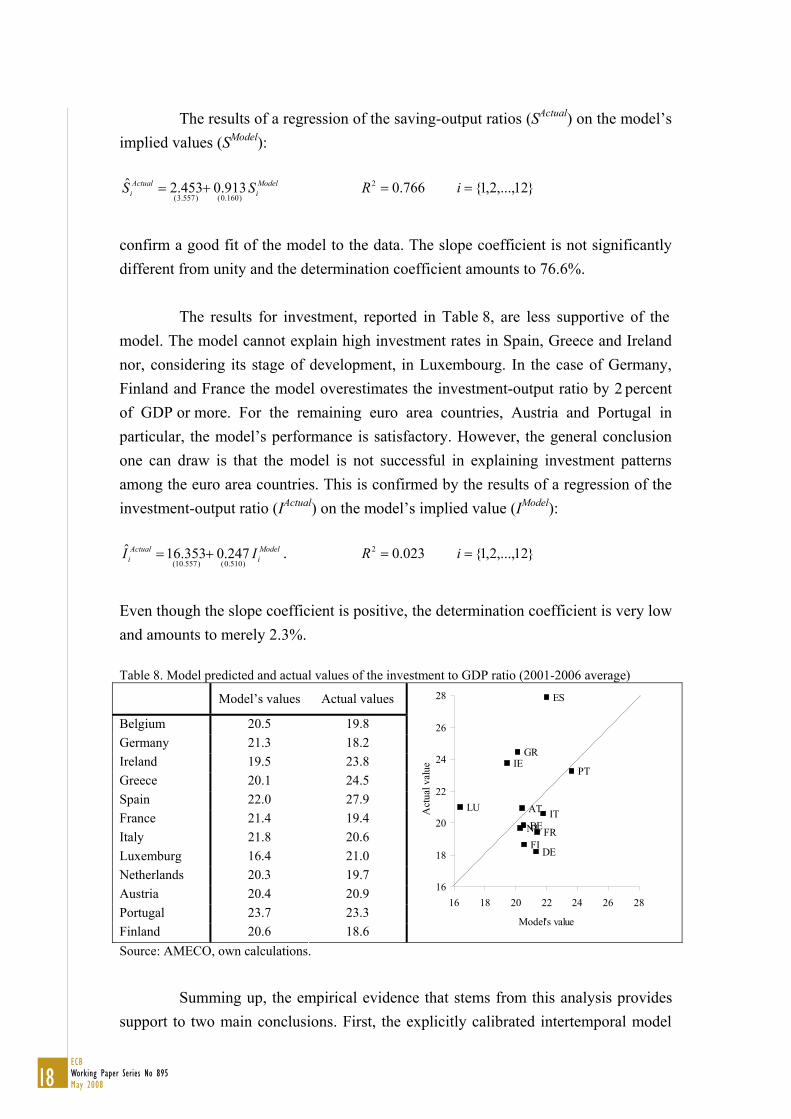
The results of a regression of the saving-output ratios (SActual) on the model’s implied values (SModel):
Modeli
Actuali SS
)160.0()557.3(913.0453.2ˆ 766.02R }12,...,2,1{i
confirm a good fit of the model to the data. The slope coefficient is not significantly different from unity and the determination coefficient amounts to 76.6%.
The results for investment, reported in Table 8, are less supportive of the
model. The model cannot explain high investment rates in Spain, Greece and Ireland nor, considering its stage of development, in Luxembourg. In the case of Germany, Finland and France the model overestimates the investment-output ratio by 2 percent of GDP or more. For the remaining euro area countries, Austria and Portugal in particular, the model’s performance is satisfactory. However, the general conclusion one can draw is that the model is not successful in explaining investment patterns among the euro area countries. This is confirmed by the results of a regression of the investment-output ratio (IActual) on the model’s implied value (IModel):
Modeli
Actuali II
)510.0()557.10(247.0353.16ˆ . 023.02R }12,...,2,1{i
Even though the slope coefficient is positive, the determination coefficient is very low and amounts to merely 2.3%. Table 8. Model predicted and actual values of the investment to GDP ratio (2001-2006 average)
Model’s values Actual values
Belgium 20.5 19.8 Germany 21.3 18.2 Ireland 19.5 23.8 Greece 20.1 24.5 Spain 22.0 27.9 France 21.4 19.4 Italy 21.8 20.6 Luxemburg 16.4 21.0 Netherlands 20.3 19.7 Austria 20.4 20.9 Portugal 23.7 23.3 Finland 20.6 18.6
BE
DE
IEGR
ES
FR
ITLU
NL
AT
PT
FI
16
18
20
22
24
26
28
16 18 20 22 24 26 28
Model's value
Act
ual v
alue
Source: AMECO, own calculations.
Summing up, the empirical evidence that stems from this analysis provides
support to two main conclusions. First, the explicitly calibrated intertemporal model

19ECB
Working Paper Series No 895May 2008
16
of the current account successfully characterises the medium-term current account patterns that are presently prevailing in the twelve euro area countries. It is able to explain about 70% of the current account dispersion observed in the period 2001-2006. Second, between the two plausible intertemporal factors that may drive current account developments, consumption smoothing appears to play a much more important role than capital accumulation in driving medium-term current account developments in the euro area countries.
5. Conclusion
In this paper we have argued that intertemporal factors help explain the current account dispersion in the euro area countries from a theoretical standpoint. The way we proceeded was as follows. We developed a calibrated general equilibrium model emphasising the role of consumption smoothing and capital accumulation in saving and investment decisions. On the basis of the calculated values of productivity, capital stock and net foreign assets in the euro area countries, we derived the theoretical current account balances by solving the model and compared these figures to actual realisations. A simple regression analysis has led us to conclude that, notwithstanding its simplicity, this theoretical framework characterises well the medium-term current account patterns seen in the euro area countries.
The following step was to analyse whether the model is successful in explaining differences in the current account via the consumption smoothing or capital accumulation channel. Having compared the model predictions for both saving and investment rates, we found that the model explains well saving but not investment behaviour. This suggests that the consumption smoothing channel, prompted by expectations of economic convergence, is the key driving force for the dispersion of the current account in the euro area. Capital stock differences are not enough to rationalise the dispersion of investment.
The analysis could be extended in various directions to embody other
features that may be appropriate in explaining current account fluctuations. One could relax the one-good assumption and suppose that there are an infinite number of goods sold at the monopolistically competitive market. As indicated by Blanchard and Giavazzi (2002), this would have a dampening effect on the model’s predictions for the current account deficits in converging economies as the future repayment of foreign liabilities would require a deterioration in the terms of trade. Second, as Bems
15
The results of a regression of the saving-output ratios (SActual) on the model’s implied values (SModel):
Modeli
Actuali SS
)160.0()557.3(913.0453.2ˆ 766.02R }12,...,2,1{i
confirm a good fit of the model to the data. The slope coefficient is not significantly different from unity and the determination coefficient amounts to 76.6%.
The results for investment, reported in Table 7, are less supportive of the
model. The model cannot explain high investment rates in Spain, Greece and Ireland nor, considering its stage of development, in Luxembourg. In the case of Germany, Finland and France the model overestimates the investment-output ratio by over 2 percent of GDP. For the remaining euro area countries, Austria and Portugal in particular, the model’s performance is satisfactory. However, the general conclusion one can draw is that the model is not successful in explaining investment patterns among the euro area countries. This is confirmed by the results of a regression of the investment-output ratio (IActual) on the model’s implied value (IModel):
Modeli
Actuali II
)510.0()557.10(247.0353.16ˆ . 023.02R }12,...,2,1{i
Even though the slope coefficient is positive, the determination coefficient is very low and amounts to merely 2.3%. Table 7. Model predicted and actual values of the investment to GDP ratio (2001-2006 average)
Model’s values Actual values
Belgium 20.5 19.8 Germany 21.3 18.2 Ireland 19.5 23.8 Greece 20.1 24.5 Spain 22.0 27.9 France 21.4 19.4 Italy 21.8 20.6 Luxemburg 16.4 21.0 Netherlands 20.3 19.7 Austria 20.4 20.9 Portugal 23.7 23.3 Finland 20.6 18.6
BE
DE
IEGR
ES
FR
ITLU
NL
AT
PT
FI
16
18
20
22
24
26
28
16 18 20 22 24 26 28
Model's value
Act
ual v
alue
Source: AMECO, own calculations.
Summing up, the empirical evidence that stems from this analysis provides
support to two main conclusions. First, the explicitly calibrated intertemporal model

20ECBWorking Paper Series No 895May 2008
and Schellekens (2007) or Fagan and Gaspar (2007) suggest, the model could include traded and non-traded goods sectors to address the relative price implications of the convergence process. Third, the way financial markets imperfections are modelled could be modified, for example by assuming that there is a maximum level of net foreign liabilities that is deemed acceptable by market participants, as in the default model presented by Obstfeld and Rogoff (1996). Fourth, as in Bussiere et al. (2004), the model could be extended for credit-constrained consumers to emphasise the possible impact of fiscal policy on the current account. Finally, cyclical factors or nominal rigidities could be included to increase the time variability of the model derived current account positions. However, as the analysis seems empirically successful in addressing the issue at hand, it might be argued that there is no need to move to a more complex framework. Appendix A. Analytically simplified version of the model
Since the structure of the economy at home is the same as abroad and the foreign economy is always in its steady state, the latter also represents the steady state for the domestic economy. As a result, in equilibrium output, household consumption, investment, government consumption and net capital stock all grow at the rate given by the productivity trend. International market imperfections ensure that the steady-state current account *
tCA and net foreign assets *tB are zero.
To write down an analytically simpler and computable version of the model, let */ˆ
ttt XXX denotes the ratio of a variable to its steady-state value. The exceptions
to this rule are the variables whose equilibrium value is zero, namely CAt and Bt. They are related to steady-state output: */ˆ
ttt YXX . The analytically solvable version of the
model takes the following form. The Euler equation for consumption is:
11ˆˆˆ
ttt CRC
and financial markets imperfections relationship yields: }ˆexp{ˆ
1tt BR .
The production function is given by:
1ˆˆˆ
ttt KAY ,
where the productivity convergence equation can be written as: )1(ˆˆ
1tt AA .
The capital accumulation equation is:
21ECB
Working Paper Series No 895May 2008
18
tttt IKK ˆ2
1ˆ2
)(2ˆ)1(ˆ)1( 1 ,
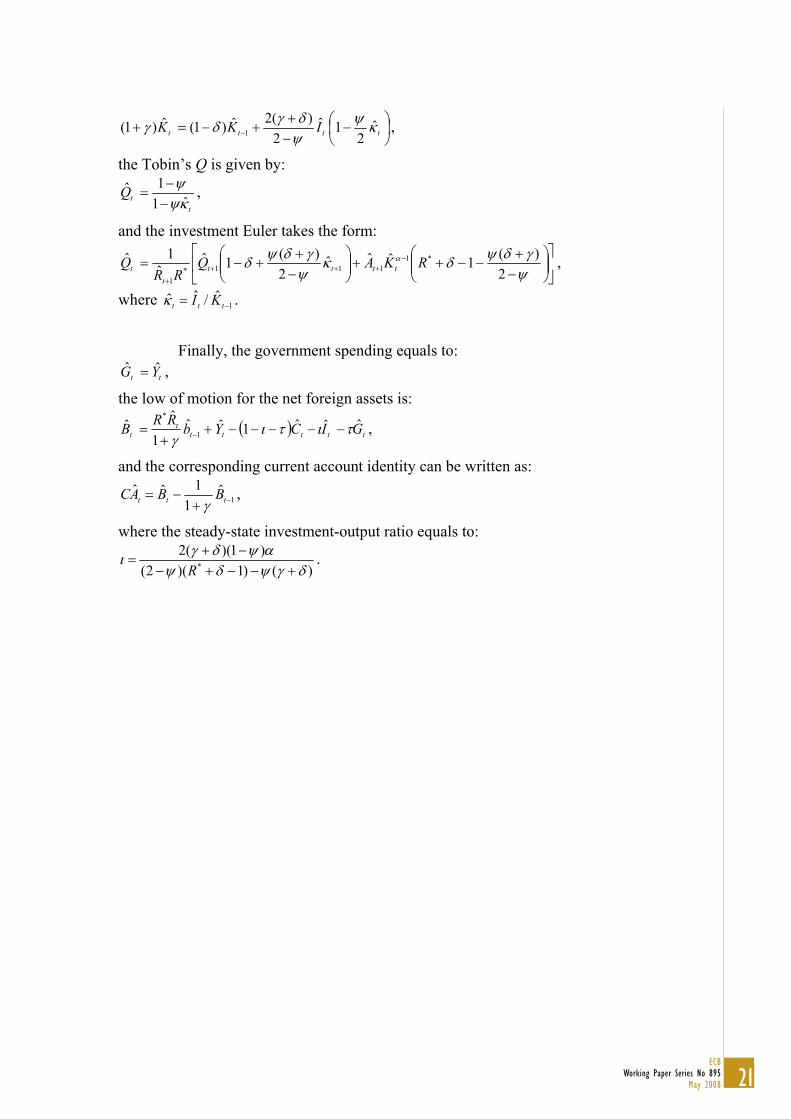
the Tobin’s Q is given by:
ttQ
ˆ11ˆ ,
and the investment Euler takes the form:
2)(1ˆˆˆ
2)(1ˆ
ˆ1ˆ *1
111*1
RKAQRR
Q ttttt
t ,
where 1ˆ/ˆˆ ttt KI .
Finally, the government spending equals to:
tt YG ˆˆ ,
the low of motion for the net foreign assets is:
tttttt
t GICYbRRB ˆˆˆ1ˆˆ1
ˆˆ1
*
,
and the corresponding current account identity can be written as:
1ˆ
11ˆˆ
ttt BBAC ,
where the steady-state investment-output ratio equals to:
)()1)(2()1)((2
*R.
References: Badinger, H., Müller, W.G., Tondl, G., 2002. Regional convergence in the European
Union (1985-1999): A spatial dynamic panel analysis. IEF Working Paper 47. Bems, R., Schellekens, P., 2007. Finance and convergence: What’s ahead for
Emerging Europe? IMF Working Paper WP/07/244. Benigno, P., 2001. Price stability with imperfect financial integration. CEPR
Discussion Paper 2854. Bergin, P.R., Sheffrin, S.M., 2000. Interest rates, exchange rates and present value
models of the current account, Economic Journal 110, 535-558. Bernanke, B., Gertler, M., Gilchrist, S., 1998. The financial accelerator in a
quantitative business cycle framework, NBER Working Papers 6455. Blanchard, O., Giavazzi, F., 2002. Current account deficits in the euro area: The end
of the Feldstein-Horioka puzzle. Brookings Papers on Economic Activity 2, 147-209.

22ECBWorking Paper Series No 895May 2008
18
tttt IKK ˆ2
1ˆ2
)(2ˆ)1(ˆ)1( 1 ,
the Tobin’s Q is given by:
ttQ
ˆ11ˆ ,
and the investment Euler takes the form:
2)(1ˆˆˆ
2)(1ˆ
ˆ1ˆ *1
111*1
RKAQRR
Q ttttt
t ,
where 1ˆ/ˆˆ ttt KI .
Finally, the government spending equals to:
tt YG ˆˆ ,
the low of motion for the net foreign assets is:
tttttt
t GICYbRRB ˆˆˆ1ˆˆ1
ˆˆ1
*
,
and the corresponding current account identity can be written as:
1ˆ
11ˆˆ
ttt BBAC ,
where the steady-state investment-output ratio equals to:
)()1)(2()1)((2
*R.
References: Badinger, H., Müller, W.G., Tondl, G., 2002. Regional convergence in the European
Union (1985-1999): A spatial dynamic panel analysis. IEF Working Paper 47. Bems, R., Schellekens, P., 2007. Finance and convergence: What’s ahead for
Emerging Europe? IMF Working Paper WP/07/244. Benigno, P., 2001. Price stability with imperfect financial integration. CEPR
Discussion Paper 2854. Bergin, P.R., Sheffrin, S.M., 2000. Interest rates, exchange rates and present value
models of the current account, Economic Journal 110, 535-558. Bernanke, B., Gertler, M., Gilchrist, S., 1998. The financial accelerator in a
quantitative business cycle framework, NBER Working Papers 6455. Blanchard, O., Giavazzi, F., 2002. Current account deficits in the euro area: The end
of the Feldstein-Horioka puzzle. Brookings Papers on Economic Activity 2, 147-209.
19
Buiter, W.H., 1981. Time preference and international lending and borrowing in an
overlapping-generations model. The Journal of Political Economy 89(4), 769-797.
Bussiere, M., Fratzscher, M., Muller, G.J., 2004. Current account dynamics in OECD
and EU acceding countries. An intertemporal approach. ECB Working Paper 311.
Campa, J.M., Gavilan, A., 2006. Current accounts in the euro area: An intertemporal
approach. IESE Research Papers D/651. Campbell, J.Y., 1987. Does saving anticipate declining labor income? An alternative
test of the permanent income hypothesis. Econometrica 55(6), 1249-1273. Campbell, J.Y., Shiller, R.J., 1987. Cointegration and tests of present value models.
Journal of Political Economy 95(5), 1062-1088. Chinn, M., Prasad, E., 2003. Medium-term determinants of current accounts in
industrial and developing countries: An empirical exploration. Journal of International Economics 59, 47-76.
Crespo-Cuaresma, J., Dimitz, M.A., Ritzberger-Grünwald, D., 2002. Growth,
convergence and EU membership. Oesterreichische Nationalbank Working Paper 62.
Debelle, G., Faruqee, H., 1996. What determines the current account? A cross-
sectional and panel approach. IMF Working Paper WP/96/58. Fagan, G., Gaspar, V., 2007. Adjusting to the euro. ECB Working Papers 716. Gruber, J.W., 2004. A present value test of habits and the current account. Journal of
Monetary Economics 51, 1495-1507. Hayashi, F., 1982. Tobin's marginal q and average q: A neoclassical interpretation.
Econometrica 50(1), 213-224. King, R.G., Wolman, A.L., 1996. Inflation targeting in a St. Louis model of the 21st
Century. NBER Working Papers 5507. Mercereau, B., Miniane, J., 2004. Challenging the empirical evidence from present
value models of the current account, IMF Working Papers WP/04/106. Nason, J.M., Rogers, J.H., 2006. The present-value model of the current account has
been rejected: round up the usual suspects. Journal of International Economics 68(1), 159-187.
Obstfeld, M., Rogoff, K., 1996a. The intertemporal approach to the current account.
NBER Working Paper 4893.

23ECB
Working Paper Series No 895May 2008
19
Buiter, W.H., 1981. Time preference and international lending and borrowing in an
overlapping-generations model. The Journal of Political Economy 89(4), 769-797.
Bussiere, M., Fratzscher, M., Muller, G.J., 2004. Current account dynamics in OECD
and EU acceding countries. An intertemporal approach. ECB Working Paper 311.
Campa, J.M., Gavilan, A., 2006. Current accounts in the euro area: An intertemporal
approach. IESE Research Papers D/651. Campbell, J.Y., 1987. Does saving anticipate declining labor income? An alternative
test of the permanent income hypothesis. Econometrica 55(6), 1249-1273. Campbell, J.Y., Shiller, R.J., 1987. Cointegration and tests of present value models.
Journal of Political Economy 95(5), 1062-1088. Chinn, M., Prasad, E., 2003. Medium-term determinants of current accounts in
industrial and developing countries: An empirical exploration. Journal of International Economics 59, 47-76.
Crespo-Cuaresma, J., Dimitz, M.A., Ritzberger-Grünwald, D., 2002. Growth,
convergence and EU membership. Oesterreichische Nationalbank Working Paper 62.
Debelle, G., Faruqee, H., 1996. What determines the current account? A cross-
sectional and panel approach. IMF Working Paper WP/96/58. Fagan, G., Gaspar, V., 2007. Adjusting to the euro. ECB Working Papers 716. Gruber, J.W., 2004. A present value test of habits and the current account. Journal of
Monetary Economics 51, 1495-1507. Hayashi, F., 1982. Tobin's marginal q and average q: A neoclassical interpretation.
Econometrica 50(1), 213-224. King, R.G., Wolman, A.L., 1996. Inflation targeting in a St. Louis model of the 21st
Century. NBER Working Papers 5507. Mercereau, B., Miniane, J., 2004. Challenging the empirical evidence from present
value models of the current account, IMF Working Papers WP/04/106. Nason, J.M., Rogers, J.H., 2006. The present-value model of the current account has
been rejected: round up the usual suspects. Journal of International Economics 68(1), 159-187.
NBER Working Paper 4893.
20
Otto, G., 1992. Testing a present-value model of the current account: evidence from
U.S. and Canadian times series. Journal of International Money and Finance 11(5), 414–430.
Sachs, J.D., 1981. The current account and macroeconomic adjustment in the 1970s.
Brookings Papers on Economic Activity 1, 201-268. Schmitt-Grohé, S., Uribe, U., 2003. Closing small open economy models. Journal of
International Economics 61, 163-185. Shefferin, S.M., Woo, W.T., 1990. Present value tests of an intertemporal model of
the current account. Journal of International Economics 29, 237–253. Smets, F., Wouters, R., 2003. An Estimated Dynamic Stochastic General Equilibrium
Model of the Euro Area. Journal of the European Economic Association 1(5), 1123-1175.
Obstfeld, M., Rogoff, K., 1996. The intertemporal approach to the current account.
24ECBWorking Paper Series No 895May 2008
European Central Bank Working Paper Series
For a complete list of Working Papers published by the ECB, please visit the ECB’s website (http://www.ecb.europa.eu).
862 “Stock market volatility and learning” by K. Adam, A. Marcet and J. P. Nicolini, February 2008.
863 “Population ageing and public pension reforms in a small open economy” by C. Nickel, P. Rother and A. Theophilopoulou, February 2008.
864 “Macroeconomic rates of return of public and private investment: crowding-in and crowding-out effects” by A. Afonso and M. St. Aubyn, February 2008.
865 “Explaining the Great Moderation: it is not the shocks” by D. Giannone, M. Lenza and L. Reichlin, February 2008.
866 “VAR analysis and the Great Moderation” by L. Benati and P. Surico, February 2008.
867 “Do monetary indicators lead euro area inflation?” by B. Hofmann, February 2008.
868 “Purdah: on the rationale for central bank silence around policy meetings” by M. Ehrmann and M. Fratzscher, February 2008.
869 “The reserve fulfilment path of euro area commercial banks: empirical testing using panel data” by N. Cassola, February 2008.
870 “Risk management in action: robust monetary policy rules under structured uncertainty” by P. Levine, P. McAdam, J. Pearlman and R. Pierse, February 2008.
871 “The impact of capital flows on domestic investment in transition economies” by E. Mileva, February 2008.
872 “Why do Europeans work part-time? A cross-country panel analysis” by H. Buddelmeyer, G. Mourre and M. Ward, February 2008.
873 “The Feldstein-Horioka fact” by D. Giannone and M. Lenza, February 2008.
874 “How arbitrage-free is the Nelson-Siegel model?” by L. Coroneo, K. Nyholm and R. Vidova-Koleva, February 2008.
875 “Global macro-financial shocks and expected default frequencies in the euro area” by O. Castrén, S. Dées and F. Zaher, February 2008.
876 “Are sectoral stock prices useful for predicting euro area GDP?” by M. Andersson and A. D’Agostino, February 2008.
877 “What are the effects of fiscal policy shocks? A VAR-based comparative analysis” by D. Caldara and C. Kamps, March 2008.
878 “Nominal and real interest rates during an optimal disinflation in New Keynesian models” by M. Hagedorn, March 2008.
879 “Government risk premiums in the bond market: EMU and Canada” by L. Schuknecht, J. von Hagen and G. Wolswijk, March 2008.
880 “On policy interactions among nations: when do cooperation and commitment matter?” by H. Kempf and L. von Thadden, March 2008.
25ECB
Working Paper Series No 895May 2008
881 “Imperfect predictability and mutual fund dynamics: how managers use predictors in changing systematic risk” by G. Amisano and R. Savona, March 2008.
882 “Forecasting world trade: direct versus “bottom-up” approaches” by M. Burgert and S. Dées, March 2008.
883 “Assessing the benefits of international portfolio diversification in bonds and stocks” by R. A. De Santis and L. Sarno, March 2008.
884 “A quantitative perspective on optimal monetary policy cooperation between the US and the euro area” by S. Adjemian, M. Darracq Pariès and F. Smets, March 2008.
885 “Impact of bank competition on the interest rate pass-through in the euro area” by M. van Leuvensteijn, C. Kok Sørensen, J. A. Bikker and A. A. R. J. M. van Rixtel, March 2008.
886 “International evidence on sticky consumption growth” by C. D. Carroll, J. Slacalek and M. Sommer, March 2008.
887 “Labor supply after transition: evidence from the Czech Republic” by A. Bičáková, J. Slacalek and M. Slavík, March 2008.
888 “House prices, money, credit and the macroeconomy” by C. Goodhart and B. Hofmann, April 2008.
889 “Credit and the natural rate of interest” by F. De Fiore and O. Tristani, April 2008.
890 “Globalisation, domestic inflation and global output gaps: evidence from the euro area” by A. Calza, April 2008.
891 “House prices and the stance of monetary policy” by M. Jarociński and F. Smets, April 2008.
892 “Identification of New Keynesian Phillips Curves from a global perspective” by S. Dées, M. H. Pesaran, L. V. Smith and R. P. Smith, April 2008.
893 “Sticky wages: evidence from quarterly microeconomic data” by T. Heckel, H. Le Bihan and M. Montornès, May 2008.
894 “The role of country-specific trade and survey data in forecasting euro area manufacturing production: perspective from large panel factor models” by M. Darracq Pariès and L. Maurin, May 2008.
895 “On the empirical evidence of the intertemporal current account model for the euro area countries” by M. Ca’Zorzi and M. Rubaszek, May 2008.