issn 2281-5252 working paper 31 june 2014
TRANSCRIPT

The TransaTlanTic relaTionship and The fuTure Global Governance
This projecT has received funding from The european union’s sevenTh framework programme for research,Technological developmenT and demonsTraTion under granT agreemenT no 290454
This paper compares mass and elite percep-tions of environmental issues in the United States, the European Union, and Turkey. It covers four topics related to the importan-ce of the issue area, general attitudes, the role of indi-viduals and in-stitutions as well as policy instruments aiming to manage en-vironmental p r o b l e m s . Drawing on survey data from the last decade, there is no doubt that en-vironmental problems are taken seriously in the US and Europe. However, personal concerns and environmental friendly attitu-des can hardly be translated into concrete
actions if these require financial contribution. Americans, nevertheless, appear somewhat
more likely to make personal expen-ses for the environment than
Europeans. While in gene-ral the EU is perceived
as not doing enough for environmental
problems, it se-ems to be de-livering more than the Ame-rican stakehol-ders. Turning to policy instru-ments, there
is broad sup-port for a wide
range of actions which do not dif-
fer drastically among Europeans or Ameri-
cans, the public or elites. Re-duction of greenhouse gas emis-
sions is a target policy aim and specific instruments are already under consideration.
Darina Peycheva, Jana Pötzschke,
Theron Delano Hall and Hans Rattinger
working paper 31 | June 2014iSSn 2281-5252
attitudes Towards environmental issues: empirical evidences in
europe and the united States
Public opinionEU
WORKING PAPER 312
US EnvironmentTurkey
Darina Peycheva, Jana Pötzschke, Theron Delano Hall and Hans Rattinger*
attitudes Towards environmental issues: empirical evidences in europe and the united States
Introduction
Today, a variety of environmental problems affect our world. As globalisation continues to open up nations to each other and the Earth’s natural processes transform local problems into international ones, few societies are left untouched by major environmental problems. Some of the more serious problems affecting the world nowadays are air pollution, water pollution, climate change and global warming to name a few. However, it is not only in the recent years that these problems have become matters of serious concern. Issues that affect the planet have been debated for decades. Institutions such as the United Nations and its many sub-divisions have been established throughout the years to address these issues, as well as to stimulate debate and implement policies for combating these threats in an efficient manner.
A major step in fighting environmental threats is the increased knowledge about the environment and the awareness that many environmental problems are largely human-made. Moreover, the lack of environmental knowledge is a major barrier to personal engagement with protecting the environment. Nevertheless, efforts to build up and disseminate greater knowledge on environmental problems, while laying the foundations for the measures needed to counteract the issues, have recently made a strong presence in the environmental issues agenda.
Although the environmental problems are of global concern, the degree of their importance as well as public attitudes towards ways to dealing with them is different for different nations. This may be due to a number of factors. There may be costs associated with implementing policies and these policies may impact both industrialised countries and developing countries (Newell and Paterson 1998). When it comes to climate change, for example, Thomas C. Schelling found that “any costs of mitigating climate change during the coming decades will surely be borne by the high-income countries” (Schelling 1997: 8). This perhaps provoked Lorenzoni and Pigeon (2006) to point out that the response to the threat of global warming has been quite different on both sides of the Atlantic.
* Darina Peycheva was a Guest Researcher at the University of Mannheim and Ph.D. candidate in Survey Methodology, Bulgarian Academy of Sciences. Jana Pötzschke is Research Associate at the Chair of Comparative Political Behaviour, University of Mannheim. Theron Delano Hall is Research Assistant at the Chair of Comparative Political Behavior, University of Mannheim. Hans Rattinger is Professor of Comparative Political Behaviour, University of Mannheim. The authors are grateful to Vivienne Brando for excellent research assistance and to the participants at the Transworld WP7 workshop in February 2013 for constructive comments.
WORKING PAPER 313
Moreover, historical evidence suggests that Americans have been lukewarm about the issue of climate change, at least on the political level.1 This perception is also evident because on several occasions the US Senate has impeded pieces of legislation that would enact policies confronting the environmental issues.2 However, that is not to say that Americans generally do not believe climate change is an issue. As the present analysis will later show, most Americans do believe it is a serious international threat.
The aim of this paper is to provide a secondary data analysis3 on public attitudes towards the environment, and whenever possible, to exploit similarities and differences between the general public and elites. It is limited to empirical evidences from the European Union countries and the United States. Additionally, Turkey is included in the analysis as it is member of the North Atlantic Treaty Organization (NATO), an important actor in transatlantic relations and a potentially interesting non-EU country. The paper covers four topics of scientific interest related to salience and importance of the issue area and general attitudes towards environmental problems. Furthermore, the role of individuals and institutions in addressing and fighting environmental challenges is analysed at both national and international levels. The paper also covers policies and policy instruments aiming to manage the environmental problems and the extent to which they are supported in the society. The following analysis focuses on surveys conducted during the last decade in order to draw a relevant and up-to-date image of public and elite perceptions towards environmental problems.4
1. Importance of Environmental Issues
How seriously have environmental issues been perceived by the public and elites? Do opinions of Europeans and Americans differ with regard to the seriousness of environmental problems? In the first step we focus on perceptions of the salience of environmental problems in general facing the world. This way, we can evaluate the importance of environmental issues with comparison to other socio-economic issues such as nuclear proliferation, religious and ethnic hatred, AIDS and other infectious diseases. In the second step, the analysis turns to specific environmental problems and tries to indicate whether these environmental issues are of concern.
In a global context, environmental problems are not the greatest cause. There are other major threats people are more concerned about. As late as 2007, the agreed perception of both Europeans (25%) and Americans (29%) is that religious and ethnic hatred is the greatest threat to the world (table 1). However, in 2002, the Americans had a different view on what was the greatest threat to the world. One year after the terror attacks, 34 percent of Americans believed spread of nuclear weapons were the greatest threat to the world, but for the EU, religious and ethnic hatred (32%) was still seen as the greatest threat to the world. However, after further analysis of several European countries, we can observe differences on what they consider greatest threats to the world. In 2007, Bulgaria (28%), Poland (36%), and Spain (27%), consider the growing gap between the rich
1 Under the Clinton administration, the Senate voted 95-0 against the Kyoto Protocol.
2 The US House of Representatives passed a nationwide cap and trade system for carbon trade - the American Clean Energy and Security Act of 2009 (ACES) - but this was blocked by the Senate, who did not bring the issue up for a vote. Though this is and was not the Kyoto protocol, it was some semblance of a concerted effort to address the issue in the US. For more information and a detail breakdown of the votes, see the official roll call vote http://clerk.house.gov/evs/2009/roll477.xml. For more information and attitudes of Senators towards that particular legislation visit the US Senate Committee on Environment and Public Works’ minority webpage: EPW Republicans to Majority: American Public Deserves to Know What Is In the Global Warming Bill, 7 July 2009, http://www.epw.senate.gov/public/index.cfm?FuseAction=Minority.PressReleases&ContentRecord_id=567bcb03-802a-23ad-43b2-c9ad4c60bf02.
3 A full list with the surveys and data analysed is provided in the appendix.
4 Whenever the number of item non-response is unusually high, we present the exact percentages within the tables.

WORKING PAPER 314
and the poor as the world’s greatest threat. The only country which is most concerned about pollution and other environmental issues is Sweden (43%). The position of Slovakia also appears to be interesting as the country’s citizens found it difficult to determine the most important threat. They equally rated environmental problems and the spread of nuclear weapons (27%) as threatening global societies nowadays. When analysing the opinion of the Turkish people, in 2007, we can see that the spread of nuclear weapons (35%) is seen as the greatest threat to the world; in 2002, the spread of nuclear weapons was only 28 percent. Whereas the growing gap between the rich and the poor (40%) was seen as the greatest threat to the world in 2002. For Turkey, the rational for this change in attitude could be because of several reasons. One possibility may be its geographical closeness to Iran and the concern for that country’s nuclear program.
When asked what posed the second greatest threat to the world (table 2), in the opinions of both Americans and the Europeans, pollution and other environmental problems pose the second greatest problem to the world (US 23%, EU 27%). However, Turkey deviates from the dominant considerations once again; 27 percent of Turks believe that spread of nuclear weapons is the second greatest threat to the world. Consequently, environmental issues seem to be estimated as global concerns (18%).
Having focused on a range of threats facing the world, we now shift the focus to specific environmental issues at the local level. How serious do we consider poor water quality, poor air quality, and poor sewage and sanitation in our own communities? The perception of the seriousness of specific types of municipal environmental problems varies between Americans, Europeans, and Turkey. US citizens appear to be more concerned than EU citizens. Surprising is the finding that there is an almost equal distribution of the Europeans responding “very serious” (29%) and “not serious at all” (32%) in regards to the issues listed above. However, there are again significant differences across the EU countries (table 3). In Germany, 44 percent of respondents believe poor air quality is “not serious at all”; whereas only 13 percent believe that it is “very serious”. The same attitude can also be seen in Sweden and Finland. In Sweden, 82 percent of respondents see poor water quality as “not serious at all”, and 39 percent of Fins also see poor water quality as “not serious at all”.
With regard to poor water quality, some EU member states such as Bulgaria and Cyprus, also join Turkey in seeing this problem as “very serious”. In Turkey, 73 percent see the issue as “very serious”, while Bulgaria see it as 60 percent and Cyprus as 63 percent. In regards to poor air quality seems to, a similar pattern develops as to seriousness. In Turkey, 68 percent see this as “very serious”. Cyprus (63%) and Bulgaria (58%) also see poor air quality as “very serious”.
In general, the US citizens generally consider the problem of poor water quality more important. 36 percent of Americans see poor water quality as “very serious”, when compared to the Europeans (29%). Americans also evaluate poor air quality more seriously than the Europeans (US 38%, EU 29%). The picture does not change much with regard to poor sewage and sanitation. In general, there is no strong difference between the opinion of European and American citizens who consider the problem as “very serious”. However, the Americans do not appear to be as extreme in their evaluation as the Europeans. For example, over 30 percent of the European citizens determine the poor sewage and sanitation as “not serious at all”. This percentage is two times higher when compared to Americans sharing this view. Once again, the problem is “very serious” in countries like Turkey (67%), Cyprus (61%), and Bulgaria (56%), and “not serious at all” in Sweden (69%), Germany (52%), and Finland (50%).

WORKING PAPER 315
Summarising which environmental issues are of the greatest concern at the local level, the results show that for Americans the quality of the air is most important (67%), for Europeans it is poor sewage and sanitation (49%) and in Turkey it is the quality of the water (86%).
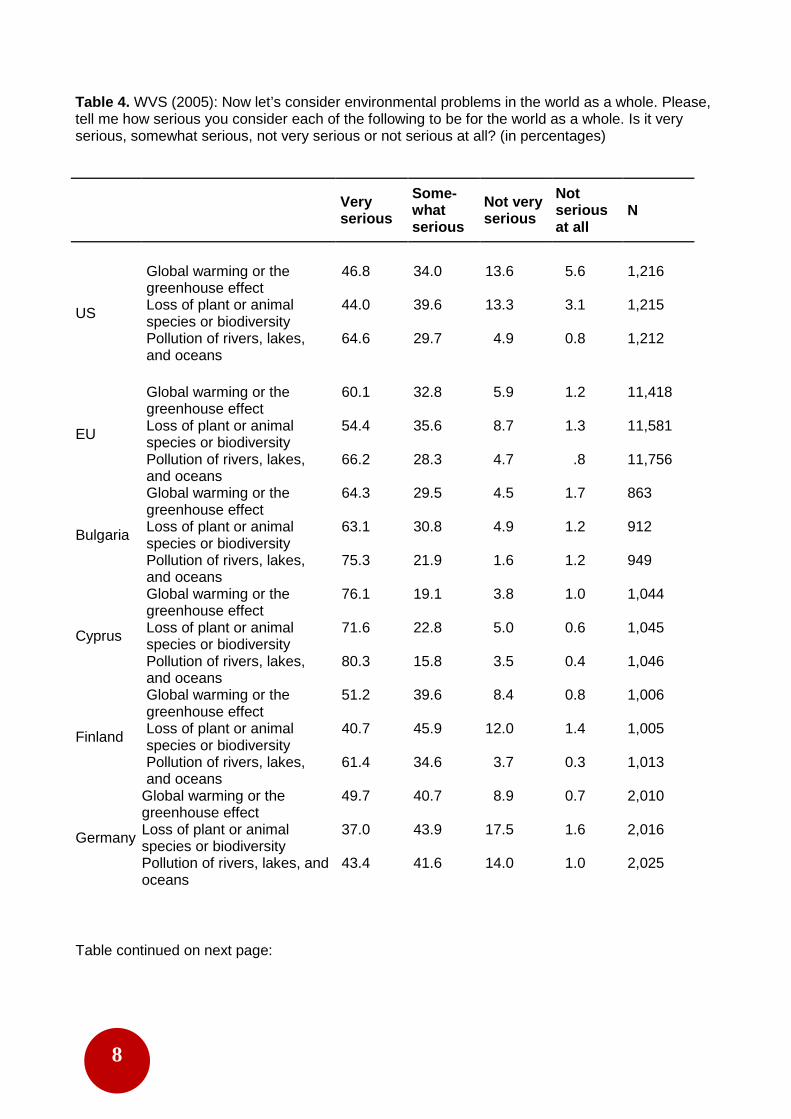
As it is evident, perceptions about several key environmental issues tend to vary when changing the focus from national to global level. Perceived internationally, environmental problems become more serious and more real. That’s why environmental challenges can hardly be limited to national borders and their overall importance appears more seriously at the global level. This becomes even clearer in the following example. When asked “How important is global warming, the greenhouse effect, the loss of plant or animal species or biodiversity, the pollution of rivers, lakes, and oceans, considered as a world problem?”, over 80 percent of Americans and over 90 percent of Europeans agree that these issues are serious environmental problems facing the world (table 4); the percentage for Turkey is over 96.
Unlike previous evaluations of European countries where there were differences among member states as far as greatest threat to the world, or serious threat, there seems to be a genuine consensus on the issue of global warming. Global warming and greenhouse effect appear as very serious world problems in Cyprus (95%), Finland (91%), and Germany (90%) – among the European Union countries. With regards to biodiversity, pollution of rivers, lakes, and oceans, which are once again estimated as very serious world problems in all European countries (90%), but higher in Turkey (97%). However, if we try to point out the main environmental concern in the world, it will be “pollution of rivers, lakes, and oceans” – equally high numbers of Americans (94%), Europeans (95%) and Turkish people (98%) identified these as “very serious” or “somewhat serious”.
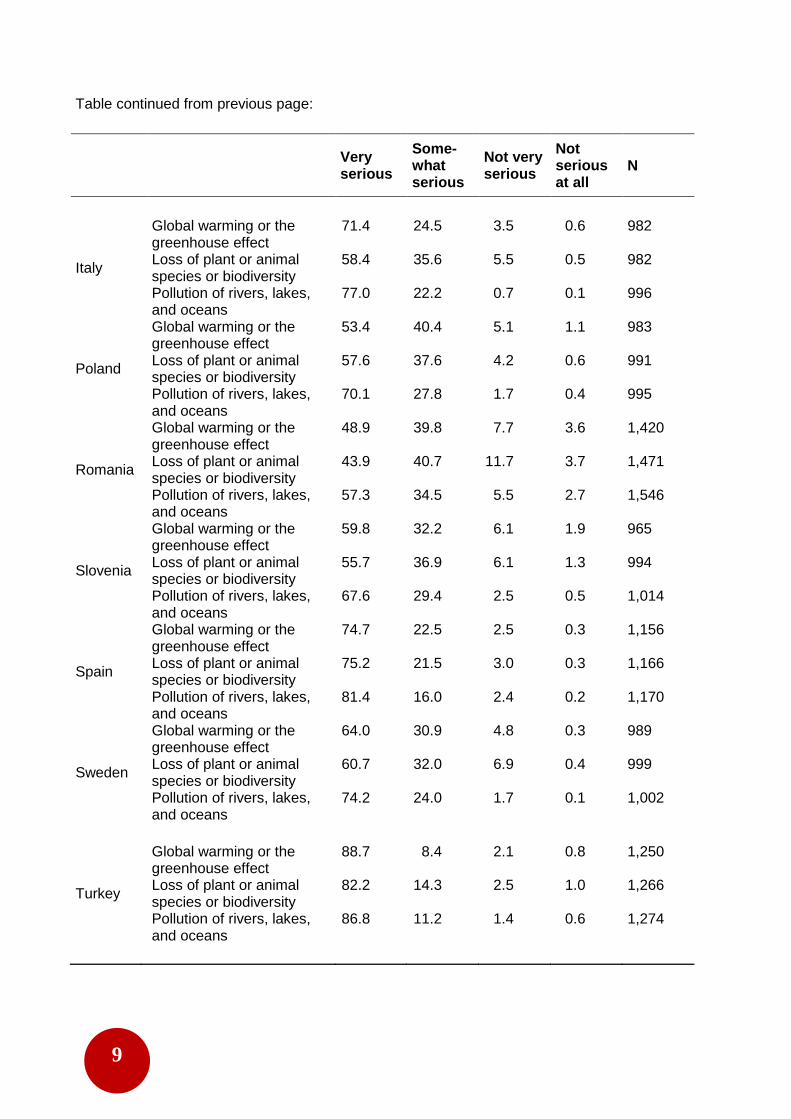
Delving further into Europeans, Americans, and Turkish citizens attitudes towards global issues, we analyse a Global Attitudes Project (GAP) 2010 survey on how serious people of these countries view global climate change (table 5). The results show that global climate change is a serious environmental problem for the majority of both Europeans and Americans. On this issue, the Europeans (84%) show stronger awareness towards the issue when compared to the Americans (69%); however, this is still a significant percent of the population. Within the European Union countries, Germany (86%) considers global climate change most seriously, while Poland (85%) and the United Kingdom (76%) tend to underrate it. Apparently, the problem of climate change has been perceived as a “very serious” threat in Turkey; overall 94 percent of Turks perceive it as a very serious or somewhat serious problem.
In a trend perspective, during the time period from 2007 to 2009, global warming was perceived as a very serious problem. It is especially evident in Turkey, where during 2007, 2008, and 2009, over 70 percent believed that global warming is a very serious problem (table 6). Once more, the seriousness of the problem seems to be undervalued by the Americans. The opinion of Americans (44%, 2009) on whether global warming is a very serious problem does not correspond to the opinion of Europeans (56%, 2009). Within the European Union countries, United Kingdom (50%) and Poland (38%) tend to have closer views to those of the Americans, while countries like France (68%) and Spain (63%) find global warming “very serious”.
Now transitioning to the opinion of the transatlantic elites, do the elites have a different perspective on the importance of environmental issues than their respective public? How seriously do elites perceive the environmental threats? Following the same approach, starting from a range of issues to the specific environmental problems, we see similar attitudes among the American elites. It is not climate change specifically, nor the environmental problems in general that are the biggest challenges currently facing the transatlantic

WORKING PAPER 316
community (table 7). The major threats for the American elites appear to be the global economy and economic decline (44%), followed by the lack of international cooperation (18%) and terrorism (13%). Following the global economic crises and that of the EU, the elites rank the EU’s internal problems fourth (11%), as biggest challenge currently facing the transatlantic community. Climate change comes right after these issues; only 10 percent of the surveyed American elites define the problem as biggest challenge to the transatlantic community. Environmental problems (2%), presented in a separate response category, can be found at the bottom of the ranking.
An interesting observation is the difference between the European public and the European elites with regard to the seriousness of the effects of global warming within the next 10 years (table 8). More than 60 percent of the general public consider the effects of global warming as a very important threat to Europe in the next 10 years; whereas for the elites this percentage is much lower - only 40 percent. When analysing members of the European member states independently, vast differences of opinions appears. As for the general public opinion, only 34 percent of Poles see global warming as a very important threat, when compared to Spain (85%). However, when observing the views of the elites in these same two countries, the trend is similar; 7 percent of Poland elites see effects of global warming as very important compared to Spanish elites (40%). However, there seems to be one exception where the elites see effects of global warming as a very important threat when compared to the general public of the same country, and that is the Netherlands (62% for elites vs. 46% for general public).
2. General Attitudes towards Environmental Issues
Considering the seriousness of the environmental warnings, especially for states that will be most affected, the important question becomes, whose responsibility is the environment? Are environmental problems the responsibility of an individual, institutions, or both? Can the environmental sensitiveness of individuals always be translated into concrete individual actions?
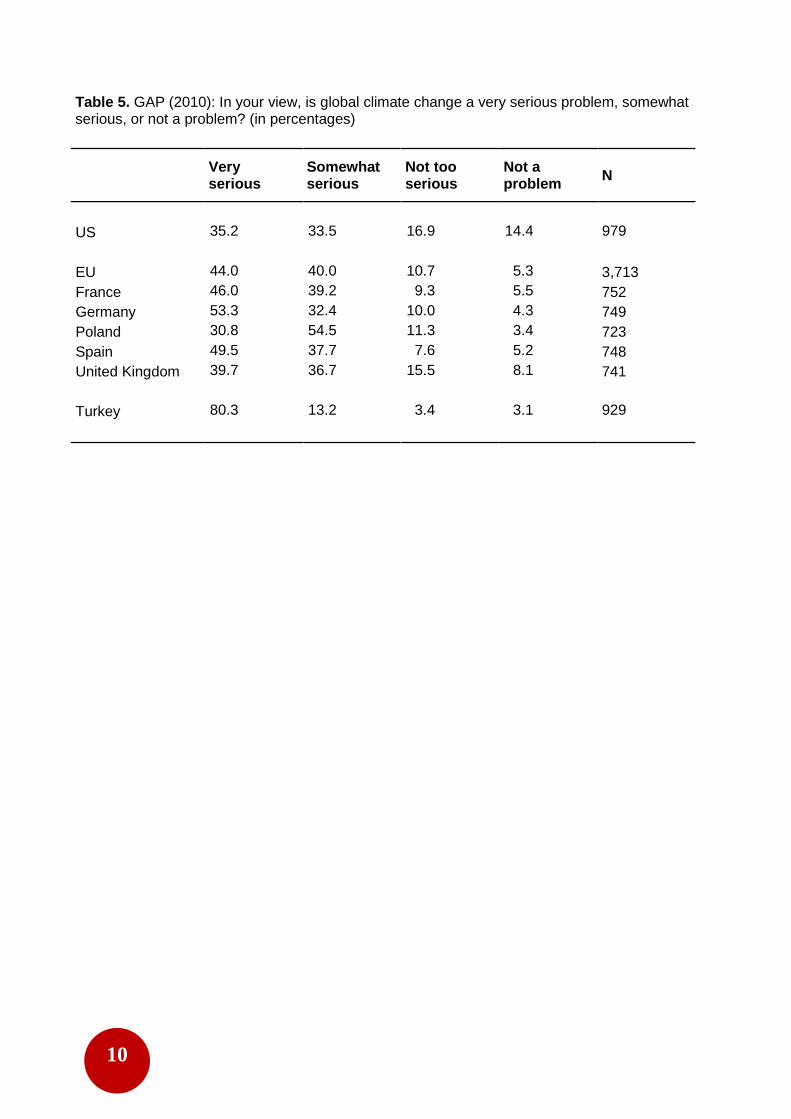
Individuals have an environmental consciousness about climate change and the way they should fight it. The majorities of both Europeans (66%) and Americans (65%) disagree with the statement that climate change is an unstoppable process and that we cannot do anything about it (table 9). Moreover, the dominant opinion in the United States (76%), the European Union countries (84%), and Turkey (79%) is that the personal actions that we take to fight climate change can make a difference (table 10).
Both Americans (67%) and Europeans (78%) share the opinion that we should do as much as we can to fight climate change, even if others do less (table 11). Although the majority of Turkish citizens support the statement, their percentage is lower, only 48 percent share the opinion compared to Americans and Europeans. Moreover, among the European Union countries, this statement receives a very high support in Portugal (90%), Italy (87%), Germany (86%), and Spain (84%). However, this ideal picture of individual concern is about to change with a series of somewhat inconsistent responses of the Europeans and Turkish residents. First, the ambivalence appears in their dominating agreement that it is the companies and industries, not citizens, which have to change their behaviour. This could be understood as a way of transferring the responsibility from the individual to the state level. Second, although personally concerned for the environment, there is little evidence that their environmental friendly attitude be translated into concrete actions.

WORKING PAPER 317
How willing are the Europeans and the Americans to fight climate change, if it is considered to slow down the progress of the economy (table 12)? Based on the results, 67 percent of European members believe that “we should fight climate change even if it slows economic growth”. This position is strongly supported in France (79%), Italy (78%), and Spain (76%). Major shares of the US respondents, approximately 43 percent, also consider it more important to combat climate change. However, 40 percent of the surveyed Americans supported the position of maximising the economic growth at the expense of the effort to combat climate change. Consequently, the Americans’ position is separated along the economic progress lines.
Based on the evidence, there is little doubt that the environment concerns both Europeans and Americans, to a certain degree. However, it appears it does not concern them enough to make personal expenses for environmental protection. Worrying about the environment and realizing the importance of the personal actions in fighting environmental problems, individuals are still not likely to bear personal expenses for environment protection. The number of those willing to cut their standard of living or to pay higher prices and taxes in order to protect the environment is extremely limited (table 13). Americans (47%) are more likely to pay much higher prices to protect the environment than Europeans (27%); in Turkey only 25 percent are willing to pay higher prices. The attitudes of Americans and Europeans differ even more considering the option to pay much higher taxes for the environment. Evidently, an important share of Europeans (58%) is very unwilling to pay higher taxes, especially Latvia (78%), Bulgaria, and the Czech Republic (both 68%). The opinion of Turkey (55%) is, again, closer to the one of the EU countries. A cut in the standard of living is appreciated by the public as a way to fight environmental problems. Further analysis also reveals that almost 70 percent of Americans favour paying 15 dollars per month per an average household in order to reduce greenhouse gas emissions (table 14).
3. The Role of the Main Stakeholders in the Area of Environmental Issues
From the public standpoint we already saw that personal actions are perceived to be effective in dealing with environmental problems, even taking into consideration the prevailing reluctance to personally finance this endeavour. Another important question to raise here is if the individuals are primarily responsible for dealing with environmental problems or if there is a need for political attention? How do individuals see the role of institutions in tackling environmental warnings? Do national governments have a more important role in addressing environmental issues than international institutions?
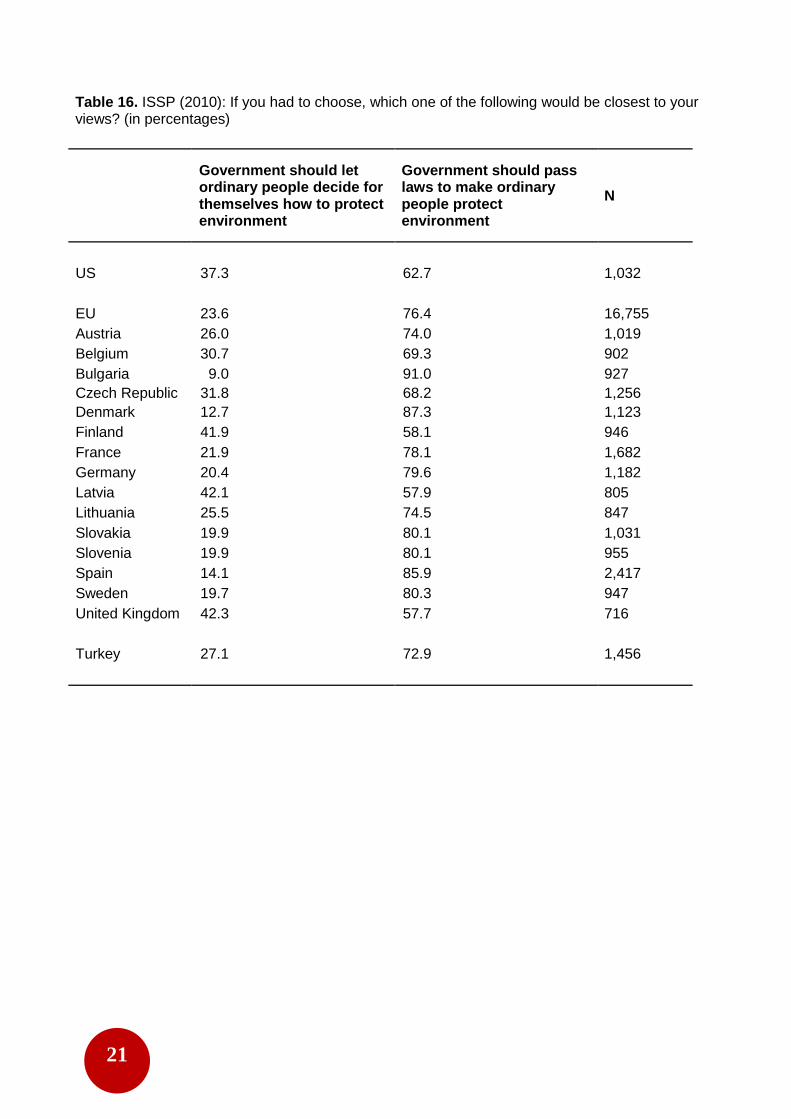
Here, the difference in perceptions prevails as well as the different estimations of Americans and Europeans continue. A majority of Americans (60%) tend to disagree with the statement that it is governments, not citizens that are primarily responsible for dealing with climate change; whereas the majority of Europeans (57%) tend to agree with this statement (table 15). An overwhelming 74 percent of Turkish respondents share the opinion that it is the government needs to take the main responsibility towards environmental challenges. Among all discussed publics, there is a strong consensus that the government should pass laws to make ordinary people protect the environment; 63 percent of Americans, 76 percent of Europeans and 73 percent of Turkish share this view (table 16). For Europeans, it is mainly the national government that should be held responsible for fighting climate change. As table 17 suggests, there is some degree of dissatisfaction with respect to how much national governments have done to counter climate change; over 76 percent of respondents in Turkey and 73 percent in the EU share this negative opinion (table 17).

WORKING PAPER 318
Delving further into the results, we find that people from Bulgaria and Latvia (both 93%) as well as from Slovenia (87%), Hungary (85%), and Greece (84%) are very unsatisfied with their national governments’ performance to address environmental issues. The assessment of Americans does not seem to be very different. A majority of the general public in the US (47%) shares the opinion that the US government is not doing enough to deal with the problem of climate change. Approximately 32 percent, on the contrary, think the government is doing about the right amount, and only about 11 percent hold the opinion that it is doing too much (table 18).
This negative evaluation of the role and the effort of national governments could be the reason for transferring the responsibility for environmental problems to higher political levels – to international and supranational institutions. Otherwise it could be the perception that global problems need global response. Americans and Europeans tend to agree that climate change can only be addressed effectively at the international level (table 19). However, the attitude of Europeans seems to be somewhat clearer as 78 percent of the EU citizens share this view. As for Turkey, 64 percent of Turkish citizens agree that climate change should be addressed at the international level. Although the majority of Americans share the same opinion, this is categorically lower (53%). This somewhat position probably does not surprise, as an important first step towards the global emission reduction has already been taken by the international agreement on climate change (the Kyoto Protocol) which has not been ratified by the US.
The European public’s dissatisfaction with dealing with climate change at the national level is evident on the international level as well. When asked whether enough effort was put into combating climate change by the EU the general attitude is negative. The majority of Europeans (67%) share the opinion that the European Union is not doing enough to combat the environmental challenge (table 20). This point of view is also supported by the Turkish respondents in the survey (63%). Within the EU, strong majorities in France (80%), Austria (80%), Slovenia (79%), Sweden (79%), and Latvia (78%) share the opinion that the European Union is not doing enough to fight climate change.
The inconsistency in the European attitudes is particularly interesting. This time, however, it is found in the assurance that the European Union is ahead of the United States when it comes to environmental protection (table 21). This is especially peculiar, because previously we observed high levels of dissatisfaction of Europeans with the institutions on both the national and international levels. This trend seems to be stable since 2005 (2009: 51%, 2005: 55%). Moreover, based on the results (table 22a, 22b), the Europeans believe that the United States play a negative role regarding environmental protection, while the European Union plays a predominantly positive role.
The self-assessment of Americans, on the other hand, on the role of the US in fighting environmental problems, appears to be more modest. For example, the majority of Americans (52%) considers the US to be willing to do about the average in limiting the greenhouse gases compared to other developed countries. Actually, in the opinion of 47 percent of Americans, it is doing about the average (table 23); although about a third of Americans (28%) thinks that the US is doing less than average to limit the greenhouse gases.
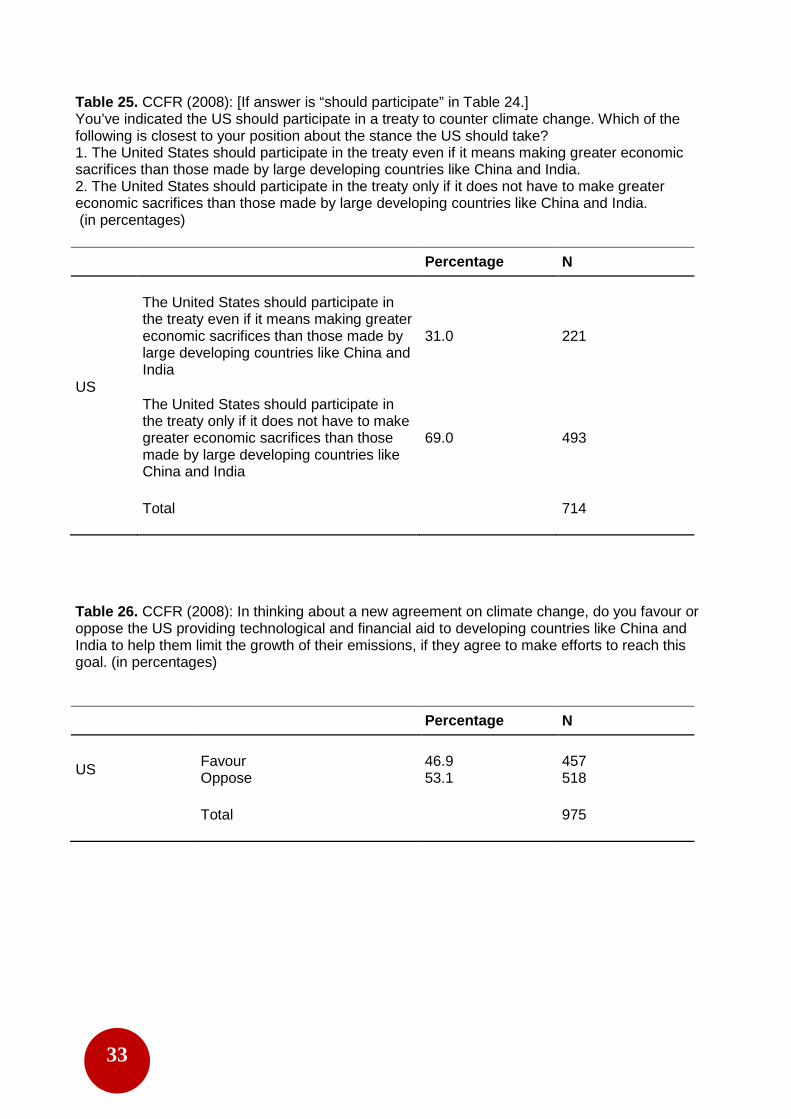
With regard to reducing greenhouse gas emissions, almost 75 percent of the Americans support the opinion that the US should participate in a new international treaty to address climate change (table 24). However, 31 percent of these hold the opinion that the US should participate in a treaty to counter climate change. They share the opinion that the US should only participate in the treaty if it does not have to make greater economic sacrifices than the large developing countries like China and India (table 25). Moreover, considering new

WORKING PAPER 319
agreements on climate change, more than a half of the respondents oppose the US providing technological and financial aid to developing countries like China and India in order to help them limit the growth of their emissions. However, approximately 47 percent favour this type of foreign assistance (table 26).
4. Policies and Instruments Applied in the Area of Environmental Issues
What should be done to tackle environmental problems? How should environmental problems be approached? What policies and policy instruments are considered important?
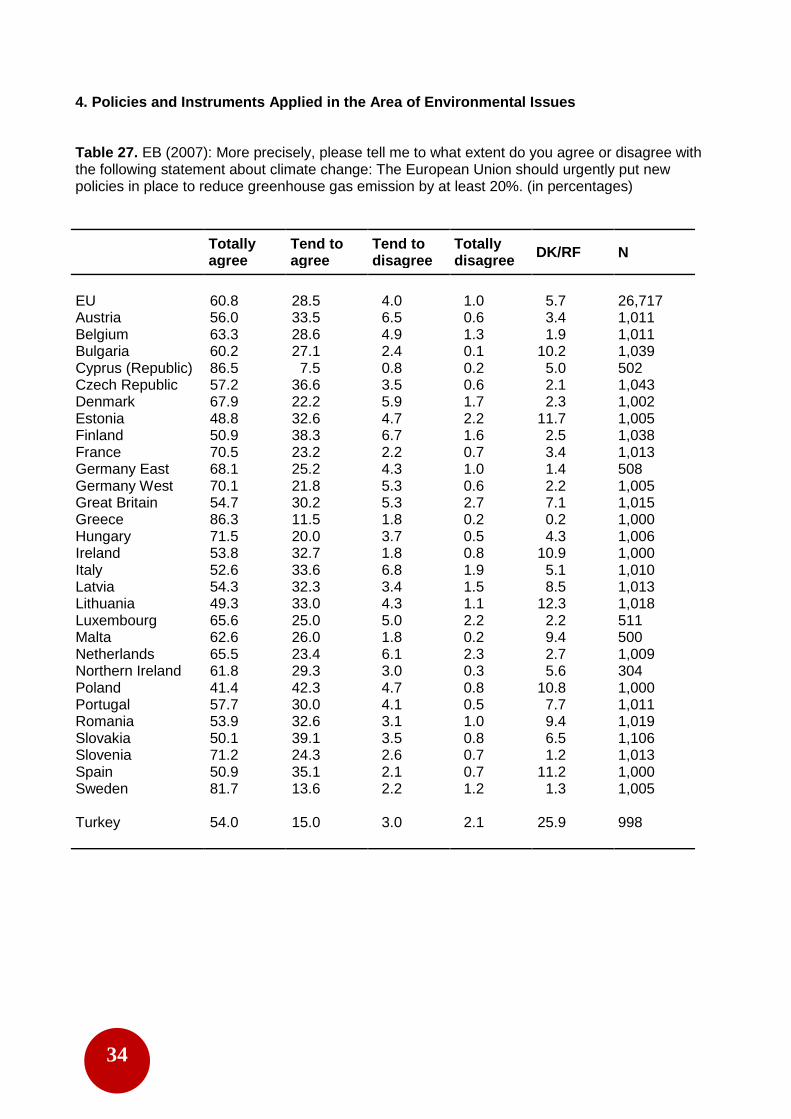
Europeans strongly support the implementation of new policies to reduce greenhouse gas emissions. Almost 90 percent of Europeans agree that the European Union should urgently put new policies in place to reduce greenhouse gas emission by at least 20 percent by 2020 (table 27). This position seems to be also strongly supported in Turkey (69%). Even so, one out of four Turkish respondents cannot give an answer to this question (don’t know/refusal: 26%). Among the EU member states such as Bulgaria, Estonia, Ireland, Lithuania, Poland, and Spain, roughly 10 percent are indifferent on the matter. Given the fact that a majority of member states respondents agree that reducing greenhouse gas emissions is right, across all member states, a substantial percentage appear not to be sure if the European Union is the level to handle this problem or the target of reducing at least 20 percent by 2020 might be too ambitious for the EU.
Increasing energy efficiency in the EU by 20 percent by 2020 is supported by almost 60 percent of Europeans (table 28). Increasing the share of renewable energy in the EU by 20 percent by 2020 is supported by more than 56 percent of Europeans. Furthermore, more than 80 percent of Europeans agree that a minimum percentage of the usage of renewable energy sources should be set in each member state (table 29). Whereas some of the new member states like Bulgaria (56%), Latvia (58%), and Estonia (55%) support this idea more reservedly.
Considering that one third of the electricity in the EU comes from nuclear energy, a major share of Europeans (60%) tend to support the statement that the share of nuclear energy should be decreased, as it poses safety problems like nuclear waste, or the danger of accidents (table 30). On the contrary, almost 30 percent consider that the share of nuclear energy should be increased, as it does not negatively contribute to climate change and global warming. People in Bulgaria (51%), Czech Republic (48%), Sweden (44%), and Slovakia (42%) tend to agree more on this issue than the general public in other EU member states.
Among the specific policy instruments aiming to fight environmental problems, the Europeans point out the importance of a refocused research on climate change. According to them, thinking about innovation and renewable energy sources, specific research on climate change, energy and resource efficiency should be the first priority to Europeans. Moreover, such scientific research should be financially supported, and also small businesses and households should receive financial support to make their energy consumption more efficient (table 31).
The position of Americans towards limiting greenhouse gas emissions has already been shown. We saw that Americans generally support introducing taxes on each household in order to implement the policy. Moreover, asked if there was a survey of scientists who found that global warming is occurring and poses a significant threat, the following response of the majority of Americans, 38 percent, was that the US should take steps to reduce greenhouse gases even if this involves significant costs. Not surprisingly, the majority, 45 percent, shared

WORKING PAPER 3110
the opinion that the US should take steps to reduce greenhouse gases, but only those that are low in cost (table 32). To make it more clear, 71 percent of Americans said the US economy will become more competitive, because the efforts to reduce the release of greenhouse gases will result in a more efficient energy use, saving money in the long run (table 33). With regard to possible approaches to reduce greenhouse gas emissions which may contribute to climate change, 85 percent of Americans favour the provision of tax incentives to utility companies to encourage them to sell environmentally clean energy. Likewise, 85 percent of Americans favour cash incentives like tax credits and rebates to individual households that upgrade to more energy efficient appliances like refrigerators and air conditioners. Almost 82 percent favour the continuation of the tax credit for purchasing a hybrid-electric car (table 34).
Although the position of the US general public is to reduce its greenhouse gases, the country has not ratified yet the UNFCCC5 international environmental treaty aiming at the stabilization of greenhouse gas concentrations in the atmosphere. In 2001, approximately 44 percent of Americans disapproved President Bush’s decision to reject the Kyoto Protocol; with more than 26 percent of the respondents who did not have an opinion on this issue (table 35). Furthermore, Bush’s decision has not been approved by almost 85 percent of Europeans. On the contrary, in 2010, the public opinion towards the policies of President Obama in dealing with climate change generally approved his handling of the issue in the US and in the EU (table 36). However, respondents in Turkey tended to be more sceptical. Actually, the opinion of the public has not yet changed: in 2009, both Americans and Europeans share the opinion that Obama will take significant measures to control global climate change (table 37). Whereas Turkey has the opposite position as approximately 40 percent of the Turkish citizens considered that Obama will not take significant measures to address the problem.
Conclusion
Not the most important global problem, but a serious world concern – this is how both the general public and the elites, the EU and the US opinion on environment and environmental warnings could be summarised. There is no doubt that environmental problems are taken seriously and that the environment plays an important role in people’s everyday lives. Moreover, people feel they can play a vital role in solving today’s environmental problems.
However, this is where the ambivalence starts. Personal concerns and environmental friendly attitudes can hardly be translated into concrete actions if these require financial contribution. Americans, nevertheless, appear somewhat more likely to make personal expenses for the environment than Europeans or the Turkish populace. Moreover, the American household seems to be willing to pay specific amounts in order to protect the environment. The position of the Europeans on this issue cannot be considered coherent as they categorically state they will do as much as they can for environmental protection, even sacrificing economic growth. But when confronted with compensating for tackling environmental problems, this attitude somehow disappears.
Ambivalent towards the environmental protection – this appears not to be the only description of Europeans, which to some extent, could also be relevant for the Americans. But also dissatisfied – with the way environmental problems are dealt with. Dissatisfied with tackling the issues on national levels, and dissatisfied with addressing it at the international level. However, while in general the European Union is not doing enough for these specific problems, it seems to be doing more than the American stakeholders.
5 United Nations Framework Convention on Climate Change.

WORKING PAPER 3111
Americans on the other side appear more constraint in their self-assessment when dealing with environmental problems. Based on the results, there appears to be many conflicts on how to do with the issues. While continuously rejecting already existing international attempts to protect the environment through emissions cut and setting standards, Americans are looking forward to a new international treaty aiming to fight the problem. Reduction of greenhouse gas emissions is a target policy aim and specific instruments are already considered.
When we turn to policy actions aiming to help fight environmental problems, we find broad support for a wide range of actions which do not differ drastically among Europeans or Americans, public or elites. The lack of polarisation in supporting specific policies and policy tools certainly shows that a global problem needs a global response. And while there obviously are some differences in the opinions, we could not say these are drastically differing views.
WORKING PAPER 3112
References
Lorenzoni, Irene, and Pidgeon, Nick F. (2006), “Public Views on Climate Change: European and USA Perspectives”, Climatic Change, Vol. 77, No. 1-2 (July), p. 73-95
Newell, Peter, and Paterson, Matthew (1998), “A Climate for Business: Global Warming, the State and Capital”, Review of International Political Economy, Vol. 5, No. 4 (Winter), p. 679-703
Schelling, Thomas C. (1997), “The Cost of Combating Global Warming. Facing the Tradeoffs”, Foreign Affairs, Vol. 76, No. 6 (November/December), p. 8-14, http://www.foreignaffairs.com/node/53573
Data
Chicago Council on Foreign Relations (CCFR), Worldviews 2002, http://www.thechicagocouncil.org/files/Studies_Publications/POS/POS2002/comparinmg_.aspx.
Eurobarometer (EB), http://ec.europa.eu/public_opinion/archives/eb_arch_en.htm.
European Elites Survey (EES), http://www.compagniadisanpaolo.it/Pubblicazioni.
Flash Eurobarometer (FEB), http://ec.europa.eu/public_opinion/flash/fl_252_en.pdf.
International Social Survey Programme (ISSP), http://www.issp.org/page.php?pageId=4.
Pew Research Global Attitudes Project (GAP), http://www.pewglobal.org.
PIPA, http://worldpublicopinion.org.
Transatlantic Trends Leaders (TTL), http://trends.gmfus.org/leaders.
Transatlantic Trends Survey (TTS), http://trends.gmfus.org/archives/transatlantic-trends.
World Values Survey (WVS), http://www.worldvaluessurvey.org/index_surveys.
1
Annex Data Sources: The current secondary data analysis is based on a number of cross-national comparative surveys. Taking into account the differences in surveys methodology we consider important that the reader is aware of the key aspects in the surveys design and refer to them when comparing data between surveys.
Survey Sample N Coverage Method
Chicago Council on Foreign Relations (CCFR) 2008 Mass 1,027 US CATI
2010 Mass 2,717 US CATI
Eurobarometer (EB) 2004 Mass 29,334 AT, BE, BG, CY, CZ, DE, DK, EE,
ES, FI, FR, GR, HR, HU, IE, IT, LT, LU, LV, MT, NL, PL, PT, RO, SE, SI, SK, TR, UK
F2F
2005
Mass 29,430 AT, BE, BG, CY, CZ, DE, DK, EE, ES, FI, FR, GR, HR, HU, IE, IT, LT, LU, LV, MT, NL, PL, PT, RO, SE, SI, SK, TR, UK
F2F
2006 Mass 29,152 AT, BE, BG, CY, CZ, DE, DK, EE, ES, FI, FR, GR, HU, HR, IE, IT, LT, LU, LV, MT, NL, PL, PT, RO, SE, SI, SK, TR, UK
F2F
2007 Mass 30,224 AT, BE, BG, CY, CZ, DE, DK, EE, ES, FI, FR, GR, HR, HU, IE, IT, LT, LU, LV, MT, NL, PL, PT, RO, SE, SI, SK, TR, UK
F2F
2008
Mass 30,170 AT, BE, BG, CY, CZ, DE, DK, EE, FI, FR, GR, HR, HU, IE, IT, LT, LU, LV, MK, MT, NL, PL, RO, SE, SI, SK, TR, UK
F2F
2009
Mass 30,238 AT, BE, BG, CY, CZ, DE,DK, EE, ES, FI, FR, GR,HR, HU, IE, IT, LT, LU, LV, MK, MT, NL, PL, PT, RO, SE SI, SK, TR, UK
F2F
Table continued on next page:

2
Table continued from previous page:
Survey Sample N Coverage Method
Eurobarometer (EB) 2011
Mass 31,769
AT, BE, BG, CY, CZ, DE, DK, ES, FI, FR, GR, HR, HU, IE, IS, IT, LT, LU, LV, ME, MK, MT, NL, PL, PT, RO, SE, SI, SK, TR, UK
F2F
European Elites Survey (EES) 2006 Elite 255 Members of European Parliament
and top-level officials of the EU Commission
CATI
Flash Eurobarometer (FEB) 2007
Mass 25,809 AT, BE, BG, CY, CZ, DE, DK, EE, ES, FI, FR, GR, HU, IE, IT, LT, LU, LV, MT, NL, PL, PT, RO, SE, SI, SK, UK
CATI
Global Attitudes Project (GAP) 2001 Mass 5,188 DE, FR, IT, UK, US CATI 2002 Mass 38,263 AO, AR, BD, BO, BR, BG, CA, CN,
CZ, EG, FR, DE, GH, GT, HN, IN, ID, IT, CI, JP, JO, KE, LB, ML, MX, NG, PK, PE, PH, PL, RU, SN, SK, ZA, KR, TZ, UG, UA, UK, US, UZ, VE, VN
F2F, CATI
2008 Mass 24,717 AU, AR, BR, CN, DE, EG, ES, FR, ID, IN, JO, JP, KR, LB, MX, NG, PK, PL, RU, TR, TZ, UK, US, ZA
F2F, CATI
2009 Mass 26,397 AR, BR, CA, CN, DE, EG, ES, FR, ID, IL, IN, JO, JP, KE, KR, LB, MX, NG, PK, PL, PS, RU, TR, UK, US
F2F, CATI
2010 Mass 24,790 AR, BR, CN, DE, EG, ES, FR, ID, IN, JP, JO, KE, KR, LB, MX, NG, PK, PL, RU, TR, UK, US
F2F, CATI
International Social Survey Programme (ISSP) 2010 Mass 41,923 AR, AT, BE, BG, CA, CH, CL, CN,
CZ, DE, DK, ES, FI, HR, IL, JP, KR, LV, MX, NO, NZ, PH, RU, SE, SI, SK, TR, TW, UK, US, ZA
F2F, CAPI, CATI, CAWI, PAPI
Table continued on next page:

3
Table continued from previous page:
Survey Sample N Coverage Method
Program of International Policy Attitudes (PIPA) 2004 Mass 753 US CAWI
2005 Mass 812 US CAWI
Transatlantic Trends Leaders (TTL) 2010 Elite 519 DE, EU, FR, IT, PL, SP, UK, US CATI, CAWI
Transatlantic Trends Survey (TTS) 2006 Mass 13,044 BG, DE, FR, IT, NL, PL, PT, RO, SK,
SP, TR, UK, US CAPI, CATI, PAPI
2009 Mass 13,095 BG, DE, FR, IT, NL, PL, PT, RO, SK, SP, TR, UK, US
CAPI, CATI, PAPI
World Values Survey (WVS) 2005 Mass 67,268
AD, AR, AU, BR, BG, BF, CA, CL, CN, CY, EG, ET, FI, GE, DE, GH, GT, IN, ID, IT, JP, JP, MY, ML, MX, MD, MA, NO, PE, PL, RO, RW, RS, SI, ZA, KR, ES, SE, CH, TW, TH, TT, TR, UA, UY, US, VN, ZM
F2F
Note: The analysis is limited to the US, EU member countries, and Turkey.

4
1. Importance of Environmental Issues Table 1. GAP (2007, 2002): Now turning to the world situation, here is a list of five dangers in the world today. In your opinion, which one of these poses the greatest threat to the world? (in percentages)
Spread of nuclear weapons
Religious and ethnic hatred
AIDS and other infectious diseases
Pollution and other environ-mental problems
Growing gap between the rich and poor
N
US 2007 25.7 29.2 10.7 16.2 18.2 959 2002 34.0 33.1 11.5 7.5 13.9 1,466 EU 2007 19.5 25.3 9.8 23.0 22.4 4,832 2002 22.8 31.5 10.2 11.2 24.3 3,948 Bulgaria 2007 26.2 9.3 15.7 20.4 28.4 485 2002 25.3 16.1 12.6 8.1 37.9 494 Czech Republic 2007 22.7 29.3 8.6 26.8 12.6 444 2002 20.0 39.3 8.9 16.6 15.2 495 France 2007 9.6 31.9 11.4 23.0 24.1 502 2002 15.5 38.1 15.3 11.7 19.4 504 Germany 2007 16.3 35.0 2.6 18.7 27.4 492 2002 23.6 34.7 4.1 9.4 28.3 983 Italy 2007 24.5 27.1 7.2 24.7 16.5 498 2002 22.3 27.8 15.2 16.0 18.7 507 Poland 2007 22.9 13.3 19.3 8.7 35.8 497 2002 26.4 23.4 13.8 4.6 31.8 478 Slovakia 2007 26.8 19.8 8.4 26.9 18.1 443 2002 26.9 25.9 8.2 14.6 24.4 487 Spain 2007 20.6 17.8 13.6 21.1 26.9 494 Sweden 2007 10.9 23.2 4.7 43.3 17.9 487 United Kingdom 2007 15.9 45.7 6.3 17.6 14.5 490 2002 22.0 43.2 9.7 9.5 15.6 495 Turkey 2007 34.7 21.4 7.3 10.4 26.2 924 2002 28.3 15.5 10.0 6.7 39.5 966

5
Table 2. GAP (2007, 2002): And which of these poses the second greatest threat to the world? (in percentages)
Spread of nuclear weapons
Religious and ethnic hatred
AIDS and other infectious diseases
Pollution and other environ-mental problems
Growing gap between the rich and poor
N
US 2007 21.5 18.5 20.5 22.7 16.8 934 2002 26.2 20.1 21.3 16.3 16.1 1,438 EU 2007 19.9 19.6 14.4 26.6 19.5 4,722 2002 20.0 21.3 18.6 20.7 19.4 4,381 Bulgaria 2007 19.2 13.3 20.6 26.9 20.0 475 2002 17.2 15.5 24.3 22.0 21.0 477 Czech Republic 2007 23.2 21.4 15.0 22.8 17.6 439 2002 19.8 19.4 19.2 25.6 16.0 495 France 2007 11.8 23.1 15.2 28.7 21.2 501 2002 14.3 21.5 21.7 17.9 24.5 502 Germany 2007 18.3 23.7 6.5 27.6 23.9 490 2002 18.6 27.1 13.4 18.0 22.9 971 Italy 2007 22.5 18.9 13.5 27.7 17.4 476 2002 26.4 18.8 17.6 23.8 13.4 500 Poland 2007 25.5 9.8 19.0 25.9 19.8 478 2002 22.3 15.9 23.8 16.3 21.7 466 Slovakia 2007 24.4 19.4 17.4 24.4 14.4 438 2002 24.4 19.4 15.8 23.1 17.3 480 Spain 2007 20.9 17.8 14.6 26.6 20.1 494 Sweden 2007 16.9 26.1 9.8 25.4 21.8 468 United Kingdom 2007 16.5 22.5 12.9 29.5 18.6 484 2002 18.2 26.5 18.8 21.4 15.1 490 Turkey 2007 26.6 19.9 15.1 18.3 20.1 885 2002 20.1 24.5 14.1 16.8 24.5 926

6
Table 3. WVS (2005): I am going to read out a list of environmental problems facing many communities. Please, tell me how serious you consider each one to be here in your own community. Is it very serious, somewhat serious, not very serious or not serious at all? (in percentages)
Very serious
Some-what serious
Not very serious
Not serious at all
N
US
Poor water quality 36.3 24.2 24.9 14.6 1,221 Poor air quality 38.0 29.0 22.2 10.8 1,218 Poor sewage and sanitation 32.9 22.7 28.1 16.3 1,212
EU
Poor water quality 29.6 17.0 19.2 34.2 10,785 Poor air quality 28.3 19.8 22.4 29.5 10,811 Poor sewage and sanitation 29.2 19.6 19.9 31.3 10,740
Bulgaria
Poor water quality 60.2 23.0 7.8 9.0 971 Poor air quality 58.3 22.1 9.4 10.2 972 Poor sewage and sanitation 56.1 27.7 8.7 7.5 950
Cyprus
Poor water quality 69.3 12.8 9.6 8.3 1,046 Poor air quality 63.2 15.0 10.5 11.3 1,046 Poor sewage and sanitation 60.6 16.7 12.4 10.3 1,046
Finland
Poor water quality 15.1 11.5 25.0 48.4 1,013 Poor air quality 13.9 15.1 31.7 39.3 1,013 Poor sewage and sanitation 12.3 10.2 27.8 49.7 1,012
Germany
Poor water quality 12.3 14.1 25.4 48.2 2,029 Poor air quality 13.0 19.2 23.9 43.9 2,036 Poor sewage and sanitation 11.3 13.2 23.5 52.0 2,022
Italy
Poor water quality 16.5 19.8 28.8 34.9 991 Poor air quality 19.9 23.5 30.1 26.5 998 Poor sewage and sanitation 24.4 24.8 25.4 25.4 988
Poland
Poor water quality 47.5 28.4 16.9 7.2 997 Poor air quality 46.8 27.9 17.6 7.7 997 Poor sewage and sanitation 45.7 31.3 15.8 7.2 993
Romania
Poor water quality 35.4 20.4 17.1 27.1 1,724 Poor air quality 30.4 18.9 20.1 30.6 1,723 Poor sewage and sanitation 40.5 26.5 15.7 17.3 1,729
Table continued on next page:

7
Table continued from previous page:
Very serious
Some-what serious
Not very serious
Not serious at all
N
Slovenia
Poor water quality 18.6 20.1 27.3 34.0 1,019 Poor air quality 16.5 22.7 30.6 30.2 1,029 Poor sewage and sanitation 16.6 21.2 28.3 33.9 1,018
Sweden
Poor water quality 4.9 3.7 9.7 81.7 995 Poor air quality 7.0 15.1 27.5 50.4 997 Poor sewage and sanitation 4.9 6.5 20.0 68.6 982
Turkey
Poor water quality 73.3 12.5 8.7 5.5 1,339 Poor air quality 68.3 12.9 10.2 8.6 1,336 Poor sewage and sanitation 66.9 16.8 10.1 6.2 1,333
8
Table 4. WVS (2005): Now let’s consider environmental problems in the world as a whole. Please, tell me how serious you consider each of the following to be for the world as a whole. Is it very serious, somewhat serious, not very serious or not serious at all? (in percentages)
Very serious
Some-what serious
Not very serious
Not serious at all
N
US
Global warming or the greenhouse effect
46.8 34.0 13.6 5.6 1,216
Loss of plant or animal species or biodiversity
44.0 39.6 13.3 3.1 1,215
Pollution of rivers, lakes, and oceans
64.6 29.7 4.9 0.8 1,212
EU
Global warming or the greenhouse effect
60.1 32.8 5.9 1.2 11,418
Loss of plant or animal species or biodiversity
54.4 35.6 8.7 1.3 11,581
Pollution of rivers, lakes, and oceans
66.2 28.3 4.7 .8 11,756
Bulgaria
Global warming or the greenhouse effect
64.3 29.5 4.5 1.7 863
Loss of plant or animal species or biodiversity
63.1 30.8 4.9 1.2 912
Pollution of rivers, lakes, and oceans
75.3 21.9 1.6 1.2 949
Cyprus
Global warming or the greenhouse effect
76.1 19.1 3.8 1.0 1,044
Loss of plant or animal species or biodiversity
71.6 22.8 5.0 0.6 1,045
Pollution of rivers, lakes, and oceans
80.3 15.8 3.5 0.4 1,046
Finland
Global warming or the greenhouse effect
51.2 39.6 8.4 0.8 1,006
Loss of plant or animal species or biodiversity
40.7 45.9 12.0 1.4 1,005
Pollution of rivers, lakes, and oceans
61.4 34.6 3.7 0.3 1,013
Germany
Global warming or the greenhouse effect
49.7 40.7 8.9 0.7 2,010
Loss of plant or animal species or biodiversity
37.0 43.9 17.5 1.6 2,016
Pollution of rivers, lakes, and oceans
43.4 41.6 14.0 1.0 2,025
Table continued on next page:
9
Table continued from previous page:
Very serious
Some-what serious
Not very serious
Not serious at all
N
Italy
Global warming or the greenhouse effect
71.4 24.5 3.5 0.6 982
Loss of plant or animal species or biodiversity
58.4 35.6 5.5 0.5 982
Pollution of rivers, lakes, and oceans
77.0 22.2 0.7 0.1 996
Poland
Global warming or the greenhouse effect
53.4 40.4 5.1 1.1 983
Loss of plant or animal species or biodiversity
57.6 37.6 4.2 0.6 991
Pollution of rivers, lakes, and oceans
70.1 27.8 1.7 0.4 995
Romania
Global warming or the greenhouse effect
48.9 39.8 7.7 3.6 1,420
Loss of plant or animal species or biodiversity
43.9 40.7 11.7 3.7 1,471
Pollution of rivers, lakes, and oceans
57.3 34.5 5.5 2.7 1,546
Slovenia
Global warming or the greenhouse effect
59.8 32.2 6.1 1.9 965
Loss of plant or animal species or biodiversity
55.7 36.9 6.1 1.3 994
Pollution of rivers, lakes, and oceans
67.6 29.4 2.5 0.5 1,014
Spain
Global warming or the greenhouse effect
74.7 22.5 2.5 0.3 1,156
Loss of plant or animal species or biodiversity
75.2 21.5 3.0 0.3 1,166
Pollution of rivers, lakes, and oceans
81.4 16.0 2.4 0.2 1,170
Sweden
Global warming or the greenhouse effect
64.0 30.9 4.8 0.3 989
Loss of plant or animal species or biodiversity
60.7 32.0 6.9 0.4 999
Pollution of rivers, lakes, and oceans
74.2 24.0 1.7 0.1 1,002
Turkey
Global warming or the greenhouse effect
88.7 8.4 2.1 0.8 1,250
Loss of plant or animal species or biodiversity
82.2 14.3 2.5 1.0 1,266
Pollution of rivers, lakes, and oceans
86.8 11.2 1.4 0.6 1,274
10
Table 5. GAP (2010): In your view, is global climate change a very serious problem, somewhat serious, or not a problem? (in percentages)
Very serious
Somewhat serious
Not too serious
Not a problem N
US 35.2 33.5 16.9 14.4 979
EU 44.0 40.0 10.7 5.3 3,713 France 46.0 39.2 9.3 5.5 752 Germany 53.3 32.4 10.0 4.3 749 Poland 30.8 54.5 11.3 3.4 723 Spain 49.5 37.7 7.6 5.2 748 United Kingdom 39.7 36.7 15.5 8.1 741 Turkey 80.3 13.2 3.4 3.1 929

11
Table 6. GAP (2009, 2008, 2007): In your view, is global warming a very serious problem, somewhat serious, not too serious, or not a problem at all? (in percentages)
Very serious
Somewhat serious
Not too serious
Not a problem N
US 2009 44.3 30.5 13.8 11.4 982 2008 43.9 31.3 13.2 11.6 968 2007 48.6 28.9 13.3 9.2 979 EU 2009 56.2 34.2 7.0 2.6 3,681 2008 62.1 29.5 6.0 2.4 3,708 2007 61.4 30.8 5.6 2.2 4,758 Bulgaria 2007 71.8 21.0 5.9 1.3 461 Czech Republic
2007 60.9 28.8 7.6 2.7 448 Italy 2007 60.1 37.6 1.7 0.6 471 France 2009 67.6 27.6 3.5 1.3 753 2008 71.9 24.5 2.8 0.8 754 2007 68.2 26.8 3.6 1.4 503 Germany 2009 60.7 30.5 6.5 2.3 742 2008 61.0 29.5 7.5 2.0 746 2007 61.1 26.7 8.1 4.1 491 Poland 2009 38.0 49.0 10.6 2.4 715 2008 53.5 37.2 7.8 1.5 716 2007 41.6 48.7 7.8 1.9 485 Spain 2009 63.2 29.8 4.5 2.5 729 2008 67.4 28.5 2.1 2.0 745 2007 72.5 25.5 1.7 0.3 483 Slovakia 2007 65.5 28.2 5.2 1.1 447 Sweden 2007 66.6 26.3 5.0 2.1 482 United Kingdom 2009 50.4 34.9 10.1 4.6 742 2008 56.4 28.3 9.8 5.5 747 2007 46.6 38.0 9.9 5.5 487 Turkey 2009 72.0 20.7 3.8 3.5 913 2008 87.1 7.5 3.6 1.8 949 2007 75.8 19.7 3.6 0.9 894

12
Table 7. TTL (2010): What is the biggest challenge currently facing the transatlantic community?
Percentage N
US (elites)
Economic decline 44.4 106
Lack of International cooperation 18.0 43
Terrorism 13.4 32
EUs internal problems/failure as a partner 10.9 26
Climate change 10.0 24
Iran 5.4 13
Afghanistan 4.6 11 Trade/Balance of trade/Free trade agreements 4.2 10
Hot spots/Wars 3.8 9
National security 3.8 9
Middle East 3.8 9
Debt 3.3 8
Human rights/Poverty 2.9 7
Energy/fossil fuel issues 2.5 6
Demographics/Population changes 2.1 5
China 2.1 5
Environmental issues 2.1 5
Unemployment/Job development 1.7 4
Monetary policy 0.8 2
Some other response 12.1 29 Total 151.9 363 Note: Multiple response.

13
Table 8. TTS (2006), EES (2006): I am going to read you a list of possible international threats to [EUROPE / US] in the next 10 years, please tell me if you think each one on the list is very important threat. (in percentages) ---The effects of global warming
Very important threat
Somewhat important threat
Not very important threat
Not an important threat at all
N
EU (general public) 60.4 28.6 8.5 2.5 5,323
Bulgaria 40.2 41.1 13.0 5.7 460
France 80.0 15.2 3.4 1.4 501
Germany 61.1 28.8 9.3 0.8 483
Italy 58.4 32.2 7.4 2.0 502
Netherlands 45.6 37.7 12.3 4.4 472
Poland 34.0 47.3 14.7 4.0 476
Portugal 89.7 7.5 1.6 1.2 494
Romania 56.5 33.4 9.4 0.7 437
Slovakia 33.3 42.8 18.7 5.2 481
Spain 84.6 12.6 1.8 1.0 500
United Kingdom 75.8 19.3 3.9 1.0 517
EU (elites) 39.8 39.0 16.7 4.5 251
Bulgaria
France 57.8 34.6 3.8 3.8 26
Germany 32.5 40.0 27.5 0.0 40
Italy 43.9 39.0 12.2 4.9 41
Netherlands 61.5 23.1 15.4 0.0 13
Poland 7.1 32.1 50.0 10.8 28
Portugal 36.4 63.6 0.0 0.0 11
Slovakia 28.6 28.5 42.9 0.0 7
Spain 40.0 53.3 6.7 0.0 15
United Kingdom 45.7 40.0 7.2 7.1 70

14
2. General Attitudes towards Environmental Issues Table 9. TTS (2009): For each of the following statements, please tell me whether you totally agree, tend to agree, tend to disagree or totally disagree. (in percentages) --- Climate change is an unstoppable process, we cannot do anything about it.
Agree strongly
Agree somewhat
Disagree somewhat
Disagree strongly N
US 21.8 12.9 22.2 43.1 952 EU 13.2 21.1 31.2 34.5 10,675 Bulgaria 17.8 28.9 29.4 23.9 942 France 11.4 15.9 25.3 47.4 991 Germany 11.5 18.6 30.9 39.0 991 Italy 7.8 17.2 32.3 42.7 996 Netherlands 10.2 20.3 32.2 37.3 994 Portugal 23.5 12.5 18.8 45.2 966 Poland 10.0 30.1 41.9 18.0 887 Romania 19.7 30.0 31.4 18.9 942 Slovakia 10.3 26.3 40.2 23.2 988 Spain 5.8 13.2 38.8 42.2 992 United Kingdom 17.5 21.1 22.3 39.0 986 Turkey 18.3 32.2 22.6 26.9 804
15
Table 10. TTS (2009): To what extent do you agree with the following statements about climate change? (in percentages) --- The personal actions that we take to fight climate can make a difference.
Agree strongly
Agree somewhat
Disagree somewhat
Disagree strongly N
US 52.8 23.6 8.0 15.6 952 EU 43.7 39.8 11.2 5.3 10,711 Bulgaria 32.2 46.0 13.6 8.2 943 France 49.5 37.0 8.5 5.0 997 Germany 49.0 35.8 10.6 4.6 989 Italy 54.3 33.2 9.7 2.8 998 Netherlands 40.1 43.5 10.4 6.0 1,000 Poland 26.0 51.3 17.3 5.4 913 Portugal 70.0 22.2 3.9 3.9 964 Romania 29.8 48.6 16.4 5.2 943 Slovakia 33.7 49.3 13.3 3.7 986 Spain 38.9 44.0 12.0 5.1 996 United Kingdom 55.3 28.4 7.7 8.6 982 Turkey 33.1 45.9 13.3 7.7 809

16
Table 11. TTS (2009): Some people say that (in Europe: the European countries/ in USA: the US) should do as much as it can to fight climate change, even if others do less. Others says that (in Europe: the European countries/ in USA: the US) should do only as much as others do. Which view comes closest to your own? (in percentages)
We should do as much as we can, even if others do less
We should only do as much as others do
DK/RF N
US 67.2 21.6 11.2 1,000 EU 78.2 17.9 3.9 11,093 Bulgaria 65.0 24.3 10.7 1,030 France 82.3 16.0 1.7 1,004 Germany 86.0 12.9 1.1 1,000 Italy 87.2 11.8 1.0 1,000 Netherlands 73.8 24.0 2.2 1,009 Poland 67.3 23.9 8.8 1,000 Portugal 90.4 7.6 2.0 1,001 Romania 71.1 21.2 7.7 1,028 Slovakia 72.1 22.6 5.3 1,018 Spain 84.4 14.6 1.0 1,002 United Kingdom 81.3 17.1 1.6 1,001 Turkey 48.1 30.7 21.2 1,002

17
Table 12. TTS (2009): Some people say that we should do everything possible to fight climate change, even if it slows economic growth. Others say that we should do everything possible to maximize economic growth, even if it hurts efforts to combat climate change. Which view comes closest to your own? (in percentages)
We should fight climate change even if it slows economic growth
We should maximize economic growth even if it hurts efforts to combat climate change
DK/RF N
US 42.8 39.6 17.6 1,000 EU 66.5 21.2 12.3 11,093 Bulgaria 62.8 15.4 21.8 1,030 France 79.3 16.6 4.1 1,004 Germany 67.8 23.2 9.0 1,000 Italy 77.8 17.4 4.8 1,000 Netherlands 66.9 24.4 8.7 1,009 Poland 53.5 24.8 21.7 1,000 Portugal 73.6 17.1 9.3 1,001 Romania 59.7 19.3 21.0 1,028 Slovakia 53.2 25.2 21.6 1,018 Spain 76.0 20.4 3.6 1,002 United Kingdom 61.2 29.9 8.9 1,001 Turkey 56.5 19.9 23.6 1,002

18
Table 13. ISSP (2010): How willing would you be to pay much higher prices, to pay much higher taxes, to accept cuts in your standard of living in order to protect the environment? (in percentages)
Very willing
Fairly willing
Neither nor
Fairly un-willing
Very un-willing
N
US higher prices 8.1 38.7 21.5 16.3 15.4 1,361 higher taxes 6.0 27.6 20.7 20.7 25.0 1,368 standard of living 5.6 29.8 21.0 20.0 23.6 1,374
EU higher prices 3.2 24.1 26.5 25.6 20.6 18,929 higher taxes 2.3 16.6 23.3 28.4 29.4 18,932 standard of living 3.9 25.5 25.4 24.0 21.2 18,904
Austria higher prices 3.7 27.1 20.0 28.1 21.1 992 higher taxes 2.1 15.6 19.5 31.9 30.9 990 standard of living 6.7 41.3 21.0 19.9 11.1 978
Belgium higher prices 2.8 30.5 29.5 20.0 17.2 1,093 higher taxes 2.1 19.1 25.8 21.8 31.2 1,103 standard of living 3.7 27.7 32.2 21.7 14.7 1,092
Bulgaria higher prices 3.3 21.6 13.9 22.2 39.0 988 higher taxes 3.0 15.2 13.4 22.2 46.2 985 standard of living 2.1 11.5 12.2 22.0 52.2 984
Czech Republic
higher prices 1.2 14.9 23.4 31.0 29.5 1,407 higher taxes 1.4 10.4 20.3 29.7 38.2 1,395 standard of living 1.4 12.9 23.4 31.0 31.3 1,408
Denmark higher prices 5.3 40.2 34.1 14.2 6.2 1,231 higher taxes 5.4 31.2 29.4 20.8 13.2 1,238 standard of living 5.6 34.2 34.6 17.8 7.8 1,235
Finland higher prices 1.9 25.3 27.9 29.5 15.4 1,171 higher taxes 2.0 16.8 25.6 32.2 23.4 1,178 standard of living 4.3 34.0 29.2 22.7 9.8 1,161
France higher prices 4.3 25.3 26.3 24.9 19.2 2,165 higher taxes 2.3 14.1 23.0 25.5 35.1 2,177 standard of living 5.6 27.0 26.3 20.9 20.2 2,188
Germany higher prices 4.9 32.2 30.8 22.1 10.0 1,350 higher taxes 2.6 19.8 27.8 30.5 19.3 1,326 standard of living 4.6 34.8 25.7 22.9 12.0 1,335
Latvia higher prices 1.3 9.2 18.3 35.0 36.2 947 higher taxes 0.7 7.3 14.2 33.9 43.9 943 standard of living 1.0 5.7 14.8 33.2 45.3 945
Lithuania higher prices 1.5 11.5 27.1 27.5 32.4 956 higher taxes 0.9 11.4 24.7 28.7 34.3 954 standard of living 1.1 8.8 19.2 31.5 39.4 947
Table continued on next page:

19
Table continued from previous page:
Very willing
Fairly willing
Neither nor
Fairly unwilling
Very unwilling N
Slovakia higher prices 2.3 17.2 29.0 27.3 24.2 1,089 higher taxes 1.8 12.1 28.8 28.2 29.1 1,085 standard of living 4.1 21.2 31.3 25.5 17.9 1,090
Slovenia higher prices 2.8 25.5 33.2 16.9 21.6 1,025 higher taxes 1.7 15.9 28.3 23.6 30.5 1,037 standard of living 3.2 29.8 32.4 16.0 18.6 1,034
Spain higher prices 3.0 23.8 25.7 29.5 18.0 2,495 higher taxes 2.1 18.3 20.1 35.2 24.3 2,492 standard of living 3.5 27.9 24.0 26.7 17.9 2,480
Sweden higher prices 4.0 27.9 24.3 31.1 12.7 1,138 higher taxes 3.1 20.4 24.1 31.8 20.6 1,142 standard of living 6.6 35.6 25.8 22.0 10.0 1,142
United Kingdom
higher prices 3.7 23.6 33.8 20.0 18.9 882 higher taxes 3.6 19.2 26.2 22.0 29.0 887 standard of living 2.5 19.0 24.1 27.2 27.2 885
Turkey higher prices 6.0 19.3 24.5 29.6 20.6 1,594 higher taxes 6.1 16.8 22.6 33.0 21.5 1,601 standard of living 4.8 13.4 26.1 34.1 21.6 1,576
Table 14. PIPA (2004): If in fact it appears that it would likely cost $15 a month for an average household, would you favour or oppose enacting such a bill to reduce greenhouse gas emissions? (in percentages)
Percentage N
US Favour 69.2 501 Oppose 30.8 223
Total 724

20
3. The Role of the Main Stakeholders in the Area of Environmental Issues Table 15. TTS (2009): To what extent do you agree with the following statements about climate change? (in percentages) --- It is governments, not citizens, that are primarily responsible for dealing with climate change.
Agree strongly
Agree somewhat
Disagree somewhat
Disagree strongly N
US 15.3 24.4 25.0 35.3 917 EU 25.3 31.4 26.6 16.7 10,669 Bulgaria 33.4 35.6 22.6 8.4 949 France 18.9 22.0 30.4 28.7 992 Germany 23.2 28.2 30.3 18.3 985 Italy 22.8 37.0 24.4 15.8 996 Netherlands 16.5 24.9 30.7 27.9 992 Poland 17.7 38.3 33.2 10.8 901 Portugal 25.9 23.0 25.6 25.5 965 Romania 35.7 35.4 21.6 7.3 939 Slovakia 29.1 40.7 25.0 5.2 983 Spain 26.4 34.3 25.8 13.5 992 United Kingdom 29.1 27.2 22.7 21.0 975 Turkey 29.8 43.7 19.2 7.3 838
21
Table 16. ISSP (2010): If you had to choose, which one of the following would be closest to your views? (in percentages)
Government should let ordinary people decide for themselves how to protect environment
Government should pass laws to make ordinary people protect environment
N
US 37.3 62.7 1,032 EU 23.6 76.4 16,755 Austria 26.0 74.0 1,019 Belgium 30.7 69.3 902 Bulgaria 9.0 91.0 927 Czech Republic 31.8 68.2 1,256 Denmark 12.7 87.3 1,123 Finland 41.9 58.1 946 France 21.9 78.1 1,682 Germany 20.4 79.6 1,182 Latvia 42.1 57.9 805 Lithuania 25.5 74.5 847 Slovakia 19.9 80.1 1,031 Slovenia 19.9 80.1 955 Spain 14.1 85.9 2,417 Sweden 19.7 80.3 947 United Kingdom 42.3 57.7 716 Turkey 27.1 72.9 1,456

22
Table 17. EB (2008): In your opinion, has the government done too little, too much or the right amount to address the environmental issues in this country? (in percentages)
Too much About the right amount Not enough N
EU 2.8 24.1 73.1 24,404 Austria 2.3 23.8 73.9 908 Belgium 3.1 30.0 66.9 960 Bulgaria 0.5 6.6 92.9 792 Cyprus 2.5 31.7 65.8 477 Czech Republic 2.3 21.7 76.0 961 Denmark 2.6 38.8 58.6 979 Estonia .9 28.2 70.9 880 Finland 2.3 40.6 57.1 976 France 2.0 18.0 80.0 980 Germany East 8.1 33.4 58.5 494 Germany West 8.8 41.6 49.6 984 Great Britain 7.6 36.4 56.0 923 Greece 1.0 14.7 84.3 998 Hungary 0.9 14.1 85.0 936 Ireland 2.3 37.7 60.0 815 Italy 2.2 17.0 80.8 920 Latvia 0.4 6.9 92.7 933 Lithuania 0.6 15.0 84.4 899 Luxembourg 4.7 42.5 52.8 464 Malta 2.9 26.9 70.2 442 Netherlands 8.3 30.5 61.2 996 Northern Ireland 3.6 22.7 73.7 278 Poland 2.1 17.2 80.7 895 Portugal 1.7 19.0 79.3 858 Romania 2.4 16.4 81.2 850 Slovakia 0.7 31.7 67.6 1,016 Slovenia 0.6 12.9 86.5 973 Spain 2.8 19.7 77.5 844 Sweden 3.9 35.3 60.8 973 Turkey 4.7 19.0 76.3 872

23
Table 18. CCFR (2010): To deal with the problem of climate change, do you think your government is doing:
Percentage N
US Too much 10.4 273 About the right amount 31.7 407 Not enough 46.9 601
Total 1,281 Table 19. TTS (2009): To what extent do you agree with the following statements about climate change? (in percentages) --- Climate change can only be addressed effectively at the international level.
Agree strongly
Agree somewhat
Disagree somewhat
Disagree strongly DK/RF N
US 32.8 20.9 14.9 25.4 6.0 1,000 EU 52.1 25.6 11.6 7.1 3.6 11,093 Bulgaria 66.1 22.8 2.3 1.5 7.3 1,030 France 68.3 19.2 5.2 6.4 0.9 1,004 Germany 72.9 19.3 3.6 3.4 0.8 1,000 Italy 52.4 25.0 14.9 7.2 0.5 1,000 Netherlands 74.6 17.3 3.9 3.3 0.9 1,009 Portugal 31.3 21.2 22.0 21.9 3.6 1,001 Poland 28.0 39.0 19.0 5.4 8.6 1,000 Romania 41.7 28.9 13.8 6.1 9.5 1,028 Slovakia 36.3 36.4 16.9 5.2 5.2 1,018 Spain 46.2 33.5 13.1 6.5 0.7 1,002 United Kingdom 54.8 19.4 12.8 11.4 1.6 1,001 Turkey 31.3 32.8 11.1 5.8 19.0 1,002

24
Table 20. EB (2008): In your opinion, has the following currently doing too much, doing about the right, or not doing enough to fight climate change? (in percentages) --- European Union
Too much About the right amount Not enough N
EU 2.9 30.2 66.9 23,056 Austria 4.7 15.3 80.0 890 Belgium 3.9 32.8 63.3 944 Bulgaria 4.6 34.2 61.2 634 Cyprus 7.9 50.0 42.1 442 Czech Republic 3.0 39.0 58.0 905 Denmark 2.1 29.3 68.6 946 Estonia 3.0 43.0 54.0 839 Finland 2.0 31.2 66.8 950 France 2.3 17.4 80.3 919 Germany East 5.0 32.7 62.3 477 Germany West 3.5 39.4 57.1 952 Great Britain 6.3 32.6 61.1 764 Greece 2.5 25.4 72.1 990 Hungary 0.9 30.8 68.3 882 Ireland 2.8 40.1 57.1 761 Italy 2.5 22.8 74.7 882 Latvia 0.7 21.0 78.3 877 Lithuania 1.7 32.6 65.7 836 Luxembourg 2.6 35.2 62.2 454 Malta 4.5 44.9 50.6 421 Netherlands 4.1 22.2 73.7 906 Northern Ireland 2.4 29.0 68.6 255 Poland 2.7 37.1 60.2 828 Portugal 2.4 24.5 73.1 821 Romania 3.1 30.0 66.9 796 Slovakia 3.0 43.3 53.7 981 Slovenia 0.9 20.4 78.7 957 Spain 3.2 22.1 74.7 814 Sweden 1.3 20.2 78.5 933 Turkey 8.9 27.8 63.3 817

25
Table 21. EB (2009, 2005): For each of the following, please tell me whether in your opinion the European Union is ahead, behind or at the same level as the United States. (in percentages) --- Protecting the environment
Ahead At the same level Behind DK/RF N
EU 2009 51.4 21.1 17.2 10.3 26,731 2005 54.8 19.8 12.8 12.6 26,925 Austria 2009 73.6 15.3 9.4 1.7 1,030 2005 68.7 15.1 7.8 8.4 1,020 Belgium 2009 62.3 19.2 15.6 2.9 1,006 2005 74.1 15.1 7.7 3.1 1,024 Bulgaria 2009 24.4 31.3 21.1 23.2 1,008 2005 26.1 30.0 10.5 33.4 1,001 Cyprus 2009 64.0 14.1 7.7 14.2 506 2005 74.1 13.5 4.2 8.2 502 Czech Republic 2009 37.3 37.0 22.1 3.6 1,056 2005 47.8 33.3 14.1 4.8 1,161 Denmark 2009 85.4 8.1 3.4 3.1 1,006 2005 81.3 9.1 4.6 5.0 1,032 Estonia 2009 46.1 21.9 14.4 17.6 1,002 2005 41.4 25.8 7.6 25.2 1,000 Finland 2009 82.5 10.3 4.9 2.3 1,018 2005 78.5 12.7 5.5 3.3 1,028 France 2009 65.0 15.7 11.1 8.2 1,005 2005 70.6 14.6 6.8 8.0 1,009 Germany East 2009 83.5 7.7 3.5 5.3 514 2005 86.0 8.2 3.9 1.9 513 Germany West 2009 85.8 7.1 2.2 4.9 1,000 2005 79.5 7.6 7.0 5.9 1,021 Table continued on next page:

26
Table continued from previous page:
Ahead At the same level Behind DK/RF N
Great Britain 2009 53.5 18.9 16.8 10.8 1,018 2005 64.1 14.5 8.5 12.9 1,021 Greece 2009 46.0 29.7 21.8 2.5 1,000 2005 55.4 24.9 16.4 3.3 1,000 Hungary 2009 32.9 25.7 34.9 6.5 1,023 2005 42.2 21.6 20.8 15.4 1,000 Ireland 2009 39.6 20.0 22.0 18.4 1,011 2005 50.0 18.9 19.9 11.2 1,009 Italy 2009 22.2 27.3 41.5 9.0 1,036 2005 29.8 29.9 28.2 12.1 1,000 Latvia 2009 36.1 27.7 16.8 19.4 1,006 2005 31.7 30.3 11.2 26.8 1,033 Lithuania 2009 26.9 23.1 32.0 18.0 1,023 2005 21.7 25.7 22.0 30.6 1,020 Luxembourg 2009 71.5 15.3 7.8 5.4 502 2005 76.6 9.6 7.1 6.7 510 Malta 2009 29.4 28.0 18.8 23.8 500 2005 46.4 28.8 6.8 18.0 500 Northern Ireland 2009 45.3 14.5 27.0 13.2 304 2005 57.5 16.7 12.4 13.4 299 Poland 2009 36.8 27.4 16.4 19.4 1,000 2005 37.1 29.2 14.4 19.3 1,000 Portugal 2009 23.6 32.0 26.0 18.4 1,025 2005 30.3 23.9 29.1 16.7 1,003 Table continued on next page:

27
Table continued from previous page:
Ahead At the same level Behind DK/RF N
Romania 2009 18.2 31.9 28.1 21.8 1,021 2005 28.4 28.0 18.7 24.9 1,000 Slovakia 2009 39.2 33.7 22.3 4.8 1,040 2005 45.1 31.0 16.2 7.7 1,096 Slovenia 2009 70.1 13.8 9.8 6.3 1,015 2005 66.2 14.4 14.1 5.3 1,034 Spain 2009 39.7 23.4 24.4 12.5 1,020 2005 44.4 13.7 20.6 21.3 1,015 Sweden 2009 87.9 5.9 3.5 2.7 1,032 2005 83.6 7.5 5.1 3.8 1,033

28
Table 22a. EB (2006, 2004): In your opinion, does the European Union tend to play a positive role, a negative role or neither positive nor negative role regarding…? (in percentages) --- Protection of the environment
Positive Neither nor Negative DK/RF N
EU 2006 63.4 19.8 10.5 6.3 24,565 2004 62.2 19.1 10.6 8.1 24,791 Austria 2006 44.7 32.7 19.0 3.6 1,016 2004 38.6 35.7 18.7 7.0 1,007 Belgium 2006 66.9 18.5 13.5 1.1 1,003 2004 69.0 16.7 11.6 2.7 974 Cyprus 2006 82.5 10.5 2.4 4.6 503 2004 76.2 12.8 3.2 7.8 500 Czech Republic 2006 75.4 16.8 6.1 1.7 1,091 2004 73.9 17.1 4.3 4.7 1,075 Denmark 2006 58.5 24.0 13.1 4.4 1,003 2004 52.7 16.7 23.7 6.9 1,028 Estonia 2006 74.6 12.2 2.9 10.3 1,000 2004 76.7 9.9 2.1 11.3 1,000 Finland 2006 68.8 21.4 7.3 2.5 1,000 2004 76.1 13.7 7.0 3.2 1,005 France 2006 60.1 18.6 15.1 6.2 1,007 2004 57.7 19.4 15.0 7.9 1,020 Germany East 2006 70.4 14.2 11.8 3.6 507 2004 74.0 18.3 4.9 2.8 508 Germany West 2006 67.1 15.5 13.1 4.3 1,018 2004 63.5 18.9 11.9 5.7 1,037 Great Britain 2006 46.8 22.9 19.5 10.8 1,000 2004 53.4 21.9 12.2 12.5 1,011 Greece 2006 59.0 28.2 12.3 0.5 1,000 2004 58.0 26.7 9.9 5.4 1,000 Hungary 2006 65.8 17.5 10.8 5.9 1,005 2004 70.0 16.5 4.2 9.3 1,014 Table continued on next page:

29
Table continued from previous page:
Positive Neither nor Negative DK/RF N Ireland 2006 63.8 15.1 9.6 11.5 1,000 2004 67.7 14.9 8.0 9.4 1,000 Italy 2006 51.0 22.8 18.2 8.0 1,006 2004 43.1 24.1 24.7 8.1 1,020 Latvia 2006 65.7 20.7 4.2 9.4 1,015 2004 61.3 19.2 6.5 13.0 1,005 Lithuania 2006 72.0 16.6 1.9 9.5 1,000 2004 70.9 13.2 1.8 14.1 1,002 Luxembourg 2006 69.2 17.6 9.6 3.6 500 2004 64.7 18.3 12.0 5.0 502 Malta 2006 76.4 9.0 3.6 11.0 500 2004 84.6 6.0 3.0 6.4 500 Netherlands 2006 59.9 22.5 13.7 3.9 1,018 2004 55.9 22.6 15.7 5.8 1,009 Northern Ireland 2006 54.5 13.6 17.5 14.4 308 2004 50.5 16.1 11.4 22.0 299 Poland 2006 73.0 17.4 5.0 4.6 1,000 2004 70.2 15.0 5.0 9.8 1,000 Portugal 2006 52.8 23.2 12.6 11.4 995 2004 42.5 24.4 19.9 13.2 1,000 Slovakia 2006 69.4 20.6 6.5 3.5 1,023 2004 65.7 23.5 5.0 5.8 1,252 Slovenia 2006 68.8 22.6 5.6 3.0 1,031 2004 69.0 17.1 6.9 7.0 1,000 Spain 2006 50.4 19.7 13.2 16.7 1,003 2004 54.2 20.0 15.1 10.7 1,023 Sweden 2006 60.3 20.5 12.8 6.4 1,013 2004 54.1 24.1 15.2 6.6 1,000 Turkey 2006 48.3 14.0 29.5 8.2 1,005 2004 60.0 10.8 19.9 9.3 1,027

30
Table 22b. EB (2006, 2004): In your opinion, does the United States tend to play a positive role, a negative role or neither positive nor negative role regarding …? (in percentages) --- Protection of the environment
Positive Neither nor Negative DK/RF N
EU 2006 19.5 18.0 54.2 8.3 24,565 2004 19.7 17.7 52.5 10.1 24,791 Austria 2006 15.6 20.6 59.4 4.4 1,016 2004 8.9 20.0 64.2 6.9 1,007 Belgium 2006 12.8 14.5 70.7 2.0 1,003 2004 12.1 15.3 70.1 2.5 974 Cyprus 2006 10.3 8.7 73.6 7.4 503 2004 9.8 12.4 70.2 7.6 500 Czech Republic
2006 38.9 25.1 33.5 2.5 1,091 2004 36.8 24.5 31.1 7.6 1,075 Denmark 2006 5.7 14.3 75.2 4.8 1,003 2004 7.9 12.1 72.5 7.5 1,028 Estonia 2006 28.0 24.0 28.1 19.9 1,000 2004 33.8 21.4 25.6 19.2 1,000 Finland 2006 9.5 15.8 70.2 4.5 1,000 2004 15.4 12.8 66.3 5.5 1,005 France 2006 7.4 9.6 77.1 5.9 1,007 2004 7.9 8.4 77.0 6.7 1,020 Germany East 2006 5.3 12.2 79.3 3.2 507 2004 6.9 10.6 78.4 4.1 508 Germany West 2006 11.4 10.2 75.0 3.4 1,018 2004 8.1 14.5 71.5 5.9 1,037 Great Britain 2006 14.1 12.2 66.5 7.2 1,000 2004 19.0 15.2 59.1 6.7 1,011 Greece 2006 5.2 15.1 79.3 0.4 1,000 2004 9.2 10.2 76.6 4.0 1,000 Hungary 2006 31.6 18.7 39.8 9.9 1,005 2004 30.5 25.5 30.4 13.6 1,014 Table continued on next page:

31
Table continued from previous page:
Positive Neither nor Negative DK/RF N Ireland 2006 20.2 17.3 49.5 13.0 1,000 2004 24.3 15.1 46.6 14.0 1,000 Italy 2006 29.1 20.0 42.1 8.8 1,006 2004 25.4 19.1 45.6 9.9 1,020 Latvia 2006 27.4 33.7 24.8 14.1 1,015 2004 28.8 27.5 25.6 18.1 1,005 Lithuania 2006 47.9 23.5 13.2 15.4 1,000 2004 49.8 22.5 9.2 18.5 1,002 Luxembourg 2006 10.2 12.4 69.8 7.6 500 2004 13.9 13.3 65.7 7.0 502 Malta 2006 40.6 15.8 22.6 21.0 500 2004 40.8 10.6 27.2 21.4 500 Netherlands 2006 6.6 12.5 77.6 3.3 1,018 2004 10.7 16.4 67.2 5.7 1,009 Northern Ireland 2006 15.3 13.6 60.1 11.0 308 2004 20.4 16.7 46.5 16.4 299 Poland 2006 36.2 27.7 24.7 11.4 1,000 2004 33.6 23.6 24.5 18.3 1,000 Portugal 2006 18.1 15.0 52.7 14.2 995 2004 13.9 16.9 55.1 14.1 1,000 Slovakia 2006 27.8 25.3 42.5 4.4 1,023 2004 26.4 30.2 34.5 8.9 1,252 Slovenia 2006 14.3 22.7 59.2 3.8 1,031 2004 11.0 16.7 64.3 8.0 1,000 Spain 2006 18.5 13.7 49.1 18.7 1,003 2004 15.4 11.6 62.4 10.6 1,023 Sweden 2006 7.8 16.3 69.1 6.8 1,013 2004 5.8 19.7 66.2 8.3 1,000 Turkey 2006 17.8 8.0 67.4 6.8 1,005 2004 19.8 8.6 63.7 7.9 1,027

32
Table 23. PIPA (2005): At the G-8 Summit some countries may be willing to do more than other countries to limit their greenhouse gases. As compared to the other developed countries do you think the US should do more than average to limit its greenhouse gases, about the average, less than average? / At present, do you think the US, compared to other developed countries does more than average to limit its greenhouse gases, about the average, less than average? (in percentages)
More than average
About the average
Less than average N
US The US should do 44.2 51.9 3.9 584 The US does 24.7 47.3 28.0 575
Total 1,159 Table 24. CCFR (2008): Based on what you know, do you think the US should or should not participate in the following treaties and agreements? ---A new international treaty to address climate change by reducing greenhouse gas emissions. (in percentages)
Percentage N
US Should participate 74.6 728 Should not participate 25.4 248
Total 976
33
Table 25. CCFR (2008): [If answer is “should participate” in Table 24.] You’ve indicated the US should participate in a treaty to counter climate change. Which of the following is closest to your position about the stance the US should take? 1. The United States should participate in the treaty even if it means making greater economic sacrifices than those made by large developing countries like China and India. 2. The United States should participate in the treaty only if it does not have to make greater economic sacrifices than those made by large developing countries like China and India. (in percentages)
Percentage N
US
The United States should participate in the treaty even if it means making greater economic sacrifices than those made by large developing countries like China and India
31.0 221
The United States should participate in the treaty only if it does not have to make greater economic sacrifices than those made by large developing countries like China and India
69.0 493
Total 714 Table 26. CCFR (2008): In thinking about a new agreement on climate change, do you favour or oppose the US providing technological and financial aid to developing countries like China and India to help them limit the growth of their emissions, if they agree to make efforts to reach this goal. (in percentages)
Percentage N
US Favour 46.9 457 Oppose 53.1 518
Total 975
34
4. Policies and Instruments Applied in the Area of Environmental Issues Table 27. EB (2007): More precisely, please tell me to what extent do you agree or disagree with the following statement about climate change: The European Union should urgently put new policies in place to reduce greenhouse gas emission by at least 20%. (in percentages)
Totally agree
Tend to agree
Tend to disagree
Totally disagree DK/RF N
EU 60.8 28.5 4.0 1.0 5.7 26,717 Austria 56.0 33.5 6.5 0.6 3.4 1,011 Belgium 63.3 28.6 4.9 1.3 1.9 1,011 Bulgaria 60.2 27.1 2.4 0.1 10.2 1,039 Cyprus (Republic) 86.5 7.5 0.8 0.2 5.0 502 Czech Republic 57.2 36.6 3.5 0.6 2.1 1,043 Denmark 67.9 22.2 5.9 1.7 2.3 1,002 Estonia 48.8 32.6 4.7 2.2 11.7 1,005 Finland 50.9 38.3 6.7 1.6 2.5 1,038 France 70.5 23.2 2.2 0.7 3.4 1,013 Germany East 68.1 25.2 4.3 1.0 1.4 508 Germany West 70.1 21.8 5.3 0.6 2.2 1,005 Great Britain 54.7 30.2 5.3 2.7 7.1 1,015 Greece 86.3 11.5 1.8 0.2 0.2 1,000 Hungary 71.5 20.0 3.7 0.5 4.3 1,006 Ireland 53.8 32.7 1.8 0.8 10.9 1,000 Italy 52.6 33.6 6.8 1.9 5.1 1,010 Latvia 54.3 32.3 3.4 1.5 8.5 1,013 Lithuania 49.3 33.0 4.3 1.1 12.3 1,018 Luxembourg 65.6 25.0 5.0 2.2 2.2 511 Malta 62.6 26.0 1.8 0.2 9.4 500 Netherlands 65.5 23.4 6.1 2.3 2.7 1,009 Northern Ireland 61.8 29.3 3.0 0.3 5.6 304 Poland 41.4 42.3 4.7 0.8 10.8 1,000 Portugal 57.7 30.0 4.1 0.5 7.7 1,011 Romania 53.9 32.6 3.1 1.0 9.4 1,019 Slovakia 50.1 39.1 3.5 0.8 6.5 1,106 Slovenia 71.2 24.3 2.6 0.7 1.2 1,013 Spain 50.9 35.1 2.1 0.7 11.2 1,000 Sweden 81.7 13.6 2.2 1.2 1.3 1,005 Turkey 54.0 15.0 3.0 2.1 25.9 998

35
Table 28. EB (2011): Thinking about each of the following objectives to be reached by 20% in the EU, would you say that it is too ambitious, about right or too modest? (in percentages) --- To reduce EU greenhouse gas emissions by at least 20%. --- To increase the share of renewable energy in the EU by 20%. --- To increase the energy efficiency in the EU by 20%.
Too ambitious
About right
Too modest DK/RF N
EU Reduce greenhouse gas 21.3 52.9 17.9 7.9 26,713 Increase renewable energy 18.3 56.3 17.7 7.7 26,713 Increase energy efficiency 16.9 59.6 15.0 8.5 26,713 Austria Reduce greenhouse gas 18.5 47.1 31.7 2.7 1,018 Increase renewable energy 15.6 47.3 34.5 2.6 1,018 Increase energy efficiency 13.4 51.5 31.1 4.0 1,018 Belgium Reduce greenhouse gas 26.8 42.0 30.6 0.6 1,020 Increase renewable energy 20.4 46.4 32.0 1.2 1,020 Increase energy efficiency 21.0 49.8 27.8 1.4 1,020 Bulgaria Reduce greenhouse gas 20.7 53.8 10.0 15.5 1,000 Increase renewable energy 22.7 52.2 7.7 17.4 1,000 Increase energy efficiency 17.4 57.3 10.8 14.5 1,000 Cyprus Reduce greenhouse gas 24.1 45.9 23.2 6.8 501 Increase renewable energy 25.9 49.5 18.6 6.0 501 Increase energy efficiency 25.3 51.9 16.4 6.4 501 Czech Republic Reduce greenhouse gas 23.7 48.3 21.7 6.3 1,022 Increase renewable energy 23.0 57.0 13.7 6.3 1,022 Increase energy efficiency 23.0 57.6 12.4 7.0 1,022 Denmark Reduce greenhouse gas 24.0 49.2 22.7 4.1 1,007 Increase renewable energy 15.0 56.6 25.7 2.7 1,007 Increase energy efficiency 13.3 64.6 16.8 5.3 1,007 Estonia Reduce greenhouse gas 19.7 55.9 9.8 14.6 1,000 Increase renewable energy 20.2 58.3 9.5 12.0 1,000 Increase energy efficiency 15.5 64.2 7.7 12.6 1,000 Finland Reduce greenhouse gas 27.5 55.5 14.3 2.7 1,003 Increase renewable energy 20.5 64.1 13.2 2.2 1,003 Increase energy efficiency 17.0 69.7 10.8 2.5 1,003 France Reduce greenhouse gas 26.3 48.2 19.8 5.7 1,022 Increase renewable energy 18.9 56.5 20.1 4.5 1,022 Increase energy efficiency 19.2 56.5 15.5 8.8 1,022 Table continued on next page:
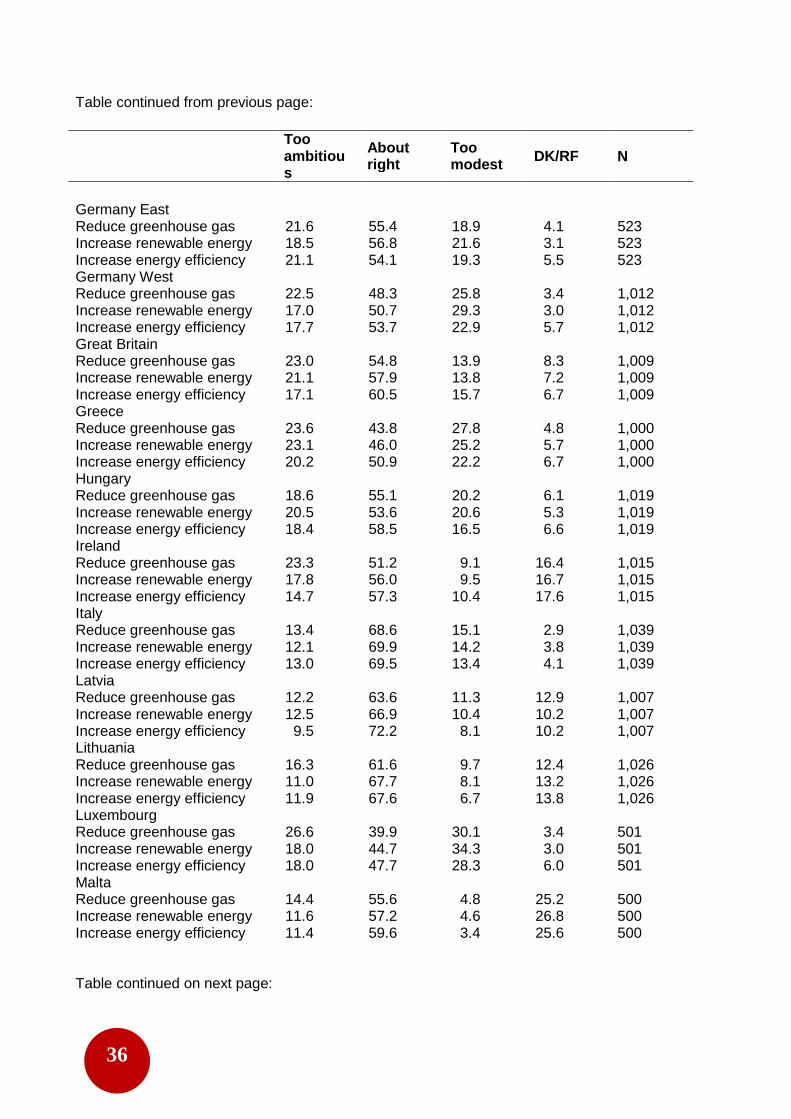
36
Table continued from previous page:
Too ambitious
About right
Too modest DK/RF N
Germany East Reduce greenhouse gas 21.6 55.4 18.9 4.1 523 Increase renewable energy 18.5 56.8 21.6 3.1 523 Increase energy efficiency 21.1 54.1 19.3 5.5 523 Germany West Reduce greenhouse gas 22.5 48.3 25.8 3.4 1,012 Increase renewable energy 17.0 50.7 29.3 3.0 1,012 Increase energy efficiency 17.7 53.7 22.9 5.7 1,012 Great Britain Reduce greenhouse gas 23.0 54.8 13.9 8.3 1,009 Increase renewable energy 21.1 57.9 13.8 7.2 1,009 Increase energy efficiency 17.1 60.5 15.7 6.7 1,009 Greece Reduce greenhouse gas 23.6 43.8 27.8 4.8 1,000 Increase renewable energy 23.1 46.0 25.2 5.7 1,000 Increase energy efficiency 20.2 50.9 22.2 6.7 1,000 Hungary Reduce greenhouse gas 18.6 55.1 20.2 6.1 1,019 Increase renewable energy 20.5 53.6 20.6 5.3 1,019 Increase energy efficiency 18.4 58.5 16.5 6.6 1,019 Ireland Reduce greenhouse gas 23.3 51.2 9.1 16.4 1,015 Increase renewable energy 17.8 56.0 9.5 16.7 1,015 Increase energy efficiency 14.7 57.3 10.4 17.6 1,015 Italy Reduce greenhouse gas 13.4 68.6 15.1 2.9 1,039 Increase renewable energy 12.1 69.9 14.2 3.8 1,039 Increase energy efficiency 13.0 69.5 13.4 4.1 1,039 Latvia Reduce greenhouse gas 12.2 63.6 11.3 12.9 1,007 Increase renewable energy 12.5 66.9 10.4 10.2 1,007 Increase energy efficiency 9.5 72.2 8.1 10.2 1,007 Lithuania Reduce greenhouse gas 16.3 61.6 9.7 12.4 1,026 Increase renewable energy 11.0 67.7 8.1 13.2 1,026 Increase energy efficiency 11.9 67.6 6.7 13.8 1,026 Luxembourg Reduce greenhouse gas 26.6 39.9 30.1 3.4 501 Increase renewable energy 18.0 44.7 34.3 3.0 501 Increase energy efficiency 18.0 47.7 28.3 6.0 501 Malta Reduce greenhouse gas 14.4 55.6 4.8 25.2 500 Increase renewable energy 11.6 57.2 4.6 26.8 500 Increase energy efficiency 11.4 59.6 3.4 25.6 500 Table continued on next page:

37
Table continued from previous page:
Too ambitious
About right
Too modest DK/RF N
Netherlands Reduce greenhouse gas 27.3 45.7 24.8 2.2 1,016 Increase renewable energy 21.8 50.2 26.3 1.7 1,016 Increase energy efficiency 21.9 56.0 18.6 3.5 1,016 Northern Ireland Reduce greenhouse gas 23.3 55.3 12.1 9.3 300 Increase renewable energy 20.7 59.0 12.6 7.7 300 Increase energy efficiency 17.7 66.3 9.3 6.7 300 Poland Reduce greenhouse gas 20.3 55.8 9.0 14.9 1,000 Increase renewable energy 16.6 57.1 12.0 14.3 1,000 Increase energy efficiency 14.8 60.4 9.7 15.1 1,000 Portugal Reduce greenhouse gas 24.0 53.9 9.0 13.1 1,048 Increase renewable energy 22.5 56.1 8.1 13.3 1,048 Increase energy efficiency 23.3 54.4 8.8 13.5 1,048 Romania Reduce greenhouse gas 19.5 54.5 9.2 16.8 1,023 Increase renewable energy 17.8 55.3 10.2 16.7 1,023 Increase energy efficiency 15.7 57.5 10.5 16.3 1,023 Slovakia Reduce greenhouse gas 22.2 55.5 16.9 5.4 1,010 Increase renewable energy 23.2 56.2 14.2 6.4 1,010 Increase energy efficiency 22.1 59.4 12.4 6.1 1,010 Slovenia Reduce greenhouse gas 21.3 60.4 14.2 4.1 1,018 Increase renewable energy 16.8 66.9 12.0 4.3 1,018 Increase energy efficiency 15.1 69.9 9.1 5.8 1,018 Spain Reduce greenhouse gas 20.2 57.8 14.5 7.5 1,010 Increase renewable energy 17.1 63.2 12.6 7.1 1,010 Increase energy efficiency 16.3 64.9 11.4 7.4 1,010 Sweden Reduce greenhouse gas 14.1 46.1 37.5 2.3 1,044 Increase renewable energy 11.8 46.9 38.0 3.3 1,044 Increase energy efficiency 10.3 56.3 28.7 4.7 1,044 Turkey Reduce greenhouse gas 20.7 33.5 16.7 29.1 1,000 Increase renewable energy 18.2 38.1 14.7 29.0 1,000 Increase energy efficiency 19.2 41.2 11.6 28.0 1,000

38
Table 29. FEB (2007): There are energy sources, for example the wind energy, that we never run out of. These are the so-called renewable energy sources. Would you agree that the European Union sets a minimum percentage of the energy used in each Member State that should come from renewable sources, or not? (in percentages)
Yes
No, because that would raise energy prices
No, because we should be able to decide indepen-dently
No, because this should not be regulated at all
DK/RF N
EU 81.4 3.0 6.0 2.5 7.1 25,079 Austria 84.1 1.7 7.5 2.0 4.7 978 Belgium 92.1 1.7 0.8 1.3 4.1 979 Bulgaria 56.1 5.8 19.8 6.5 11.8 975 Cyprus 91.1 1.4 0.8 1.0 5.7 508 Czech Republic 67.9 6.6 12.8 3.7 9.0 978 Denmark 85.9 4.7 3.7 1.9 3.8 982 Estonia 54.5 6.1 20.5 2.9 16.0 1,007 Finland 83.8 1.8 6.7 2.5 5.2 949 France 89.4 2.6 2.2 1.1 4.7 995 Germany 86.5 1.7 6.3 2.2 3.3 980 Greece 91.8 1.2 1.3 1.0 4.7 996 Hungary 77.9 3.6 5.3 4.9 8.3 1,017 Ireland 94.8 0.5 1.0 0.4 3.3 993 Italy 90.8 1.6 1.6 0.7 5.3 977 Latvia 58.2 7.5 15.0 9.3 10.0 963 Lithuania 64.5 7.1 8.9 6.3 13.2 985 Luxembourg 94.8 1.0 1.0 0.2 3.0 499 Malta 90.6 0.4 0.8 0.0 8.2 500 Netherlands 91.6 0.7 2.6 0.4 4.7 969 Poland 80.8 3.7 4.6 4.2 6.7 974 Portugal 88.3 1.2 1.1 0.8 8.6 997 Romania 77.8 4.0 5.7 2.6 9.9 985 Slovakia 72.3 3.5 9.6 3.9 10.7 987 Slovenia 92.9 0.8 2.6 0.7 3.0 978 Spain 91.3 2.5 1.9 0.4 3.9 1,004 Sweden 74.1 2.5 7.7 4.0 11.7 951 United Kingdom 90.5 0.9 2.4 0.7 5.5 973

39
Table 30. FEB (2007): One third of EU electricity comes from nuclear energy. Regarding nuclear energy there are two fundamental approaches, which one do you tend to agree more? (in percentages)
The share of nuclear energy should be increased, as it does
The share of nuclear energy should be decreased, as it poses
DK/RF N
EU 29.3 59.5 11.2 25,809 Austria 14.3 78.7 7.0 1,007 Belgium 25.2 55.8 19.0 1,000 Bulgaria 51.0 33.5 15.5 1,016 Cyprus 17.7 75.9 6.4 515 Czech Republic 48.4 37.8 13.8 1,010 Denmark 25.6 67.5 6.9 1,001 Estonia 23.8 60.1 16.1 1,045 Finland 41.6 47.4 11.0 1,010 France 27.8 60.0 12.2 1,022 Germany 27.9 66.1 6.0 1,019 Greece 12.4 83.1 4.5 1,012 Hungary 26.4 58.8 14.8 1,041 Ireland 27.3 67.3 5.4 1,002 Italy 29.2 57.5 13.3 1,004 Latvia 22.5 67.3 10.2 1,005 Lithuania 31.8 54.9 13.3 1,014 Luxembourg 19.7 65.9 14.4 508 Malta 24.7 58.3 17.0 506 Netherlands 37.1 55.4 7.5 1,021 Poland 32.3 59.0 8.7 1,004 Portugal 21.2 56.4 22.4 1,010 Romania 25.9 61.1 13.0 1,016 Slovakia 41.9 44.0 14.1 1,008 Slovenia 27.4 65.7 6.9 1,002 Sweden 43.7 48.6 7.7 1,000 United Kingdom 33.7 59.1 7.2 1,000

40
Table 31. EB (2011): Thinking about innovation what do you think should be the EU's priority? (in percentages)
Refocus research on new challenges such as climate change, energy and resource efficiency
Encourage cooperation between researchers
Give more financial support to research
DK/RF N
EU 42.2 25.1 26.1 6.6 26,713 Austria 42.6 26.1 25.1 6.2 1,018 Belgium 43.3 31.9 24.0 0.8 1,020 Bulgaria 40.3 19.1 30.5 10.1 1,000 Cyprus 60.5 16.5 18.2 4.8 501 Czech Republic
48.2 27.2 20.4 4.2 1,022
Denmark 56.1 23.3 16.9 3.7 1,007 Estonia 28.4 29.6 30.5 11.5 1,000 Finland 55.7 29.5 13.1 1.7 1,003 France 32.1 30.1 31.4 6.4 1,022 Germany East
48.9 26.4 21.3 3.4 523
Germany West
53.1 21.1 21.5 4.3 1,012
Great Britain 36.9 21.5 30.5 11.1 1,009 Greece 40.1 23.5 32.2 4.2 1,000 Hungary 42.1 26.0 27.5 4.4 1,019 Ireland 36.8 23.7 27.9 11.6 1,015 Italy 31.0 33.7 30.8 4.5 1,039 Latvia 39.1 23.1 30.1 7.7 1,007 Lithuania 40.1 22.3 26.5 11.1 1,026 Luxembourg 50.1 25.1 21.2 3.6 501 Malta 40.0 15.8 30.0 14.2 500 Netherlands 51.1 31.7 14.7 2.5 1,016 Northern Ireland
41.3 19.7 28.3 10.7 300
Poland 33.1 26.1 31.0 9.8 1,000 Portugal 30.0 34.2 24.3 11.5 1,048 Romania 32.5 22.5 31.7 13.3 1,023 Slovakia 51.6 19.7 25.7 3.0 1,010 Slovenia 47.0 25.1 24.6 3.3 1,018 Spain 29.2 21.0 39.7 10.1 1,010 Sweden 57.3 20.9 20.5 1.3 1,044

41
Table 32. PIPA (2005): There is a controversy over what the countries of the world, including the US, should do about the problem of global warming. I'm going to read you three statements. Please tell me which statement comes closest to your own point of view. (in percentages)
Percentage N
US
Until we are sure that global warming is really a problem, we should not take any steps that would have economic costs
21.4 171
The problem of global warming should be addressed, but its effects will be gradual, so we can deal with the problem gradually by taking steps that are low in cost
44.9 358
Global warming is a serious and pressing problem. We should begin taking steps now even if this involves significant costs
33.7 269
Total 798 Table 33. PIPA (2005): Which comes closer to your opinion? (in percentages) 1. Efforts in the United States to reduce the release of greenhouse gases will cost too much money and hurt the US economy. 2. The US economy will become more competitive because these efforts will result in more efficient energy use, saving money in the long run.
Percentage N
US
Efforts in the United States to reduce the release of greenhouse gases will cost too much money and hurt the US economy
22.3 137
The US economy will become more competitive because these efforts will result in more efficient energy use, saving money in the long run
70.9 436
DK/RF 6.8 42
Total 615

42
Table 34. PIPA (2005): Here is a list of possible approaches to reducing greenhouse gas emissions that may contribute to climate change. For each one please say whether you favour or oppose it: (in percentages) --- Provide tax incentives to utility companies to encourage them to sell environmentally clean
energy, such as solar and wind power to consumers. --- Give cash incentives like tax credits and rebates to individual households that upgrade to more
energy efficient appliances like refrigerators and air conditioners. --- Continue the tax credit for purchasing a hybrid-electric car.
Favour Oppose N
US
Provide tax incentives to utility companies
84.5 15.5 592
Give cash incentives to individual households
84.7 15.3 593
Continue the tax credit for purchasing a hybrid-electric car
81.9 18.1 592
Total 1,777
Table 35. GAP (2001): As I read some specific policies of President George W. Bush tell me if you approve or disapprove of them. (in percentages) --- Bush’s decision that the US should not support the Kyoto protocol to reduce greenhouse gas
emissions.
Approve Disapprove DK/RF N
US 29.5 44.1 26.4 1,277 EU 9.7 84.6 5.7 3,911
Germany 7.9 88.5 3.6 944
Italy 11.7 80.7 7.6 1,000 France 9.4 85.6 5.0 967 United Kingdom 9.6 83.9 6.5 1,000

43
Table 36. GAP (2010): Please tell me if you approve or disapprove of the way President Barack Obama is dealing with …? (in percentages) --- Climate change
Approve Disapprove DK/RF N
US 45.1 37.4 17.5 984 EU 52.0 32.1 15.9 3,735 Germany 63.0 28.1 8.9 740 France 45.6 53.2 1.2 752 Poland 55.7 19.3 25.0 748 Spain 51.5 30.0 18.5 746 United Kingdom 44.3 29.9 25.8 749 Turkey 15.7 44.0 40.3 987 Table 37. GAP (2009): Now I’m going to read you some statements about what President Barack Obama might do in the future. Do you think he will get the United States to take significant measures to control global climate change or don’t you think so? (in percentages)
Will Will not DK/RF N
US 69.9 24.7 5.4 993 EU 69.0 23.7 7.3 3,749 Germany 76.9 20.4 2.7 746 France 81.1 18.7 0.2 753 Poland 55.7 24.0 20.3 749 Spain 64.8 28.6 6.6 749 United Kingdom 66.8 26.6 6.6 752 Turkey 25.9 39.0 35.1 990

WORKING PAPER 3113
The Project
Consortium
Advisory Board
In an era of global flux, emerging powers and growing interconnectedness, transatlantic relations appear to have lost their bearings. As the international system fragments into different constellations of state and non-state powers across different policy domains, the US and the EU can no longer claim exclusive leadership in global governance. Traditional paradigms to understand the transatlantic relationship are thus wanting. A new approach is needed to pinpoint the direction transatlantic relations are taking. TRANSWORLD provides such an approach by a) ascertaining, differentiating among four policy domains (economic, security, environment, and human rights/democracy), whether transatlantic relations are drifting apart, adapting along an ad hoc cooperation-based pattern, or evolving into a different but resilient special partnership; b) assessing the role of a re-defined transatlantic relationship in the global governance architecture; c) providing tested policy recommendations on how the US and the EU could best cooperate to enhance the viability, effectiveness, and accountability of governance structures.
Mainly funded under the European Commission’s 7th Framework Programme, TRANSWORLD is carried out by a consortium of 13 academic and research centres from the EU, the US and Turkey: Istituto Affari Internazionali, CoordinatorGerman Marshall Fund of the United StatesUniversity of EdinburghFree University of BerlinFondation Nationales des Sciences PolitiquesSabanci University of IstanbulChatham HouseEuropean University InstituteUniversity of SienaCharles University of PragueUniversity of MannheimTNS OpinionAmerican University of Washington
Shaun Breslin, University of WarwickZhimin Chen, Fudan University, ShanghaiRenato G. Flores Jr., FGV, Rio de JaneiroRanabir Samaddar, Mahanirban Calcutta Research CentreDmitri Trenin, Carnegie Moscow CenterStephen Walt, Harvard University
www.transworld-fp7.eu