with graphene oxide- based biosensors
TRANSCRIPT
Ming Li, Nianqiang (Nick) Wu*
Mechanical & Aerospace Engineering
West Virginia UniversityMorgantown, WV 26506
Detection of Mercury(II) and
Lead(II) with Graphene Oxide-
Based Biosensors

Presentation Outline
• Background and motivation
• Fluorescent sensors based on energy and charge
transfer
• Graphene oxide
• Detection of Hg(II) with graphene oxide as the
fluorescent quencher
• Detection of Pb(II) with graphene oxide as fluorophore

Sources of Toxic Heavy Metals
Forest fire
Volcanic activity
Coal-fired power plants
• Toxic heavy metals: Pb2+, Hg2+, As3+, Cd2+,
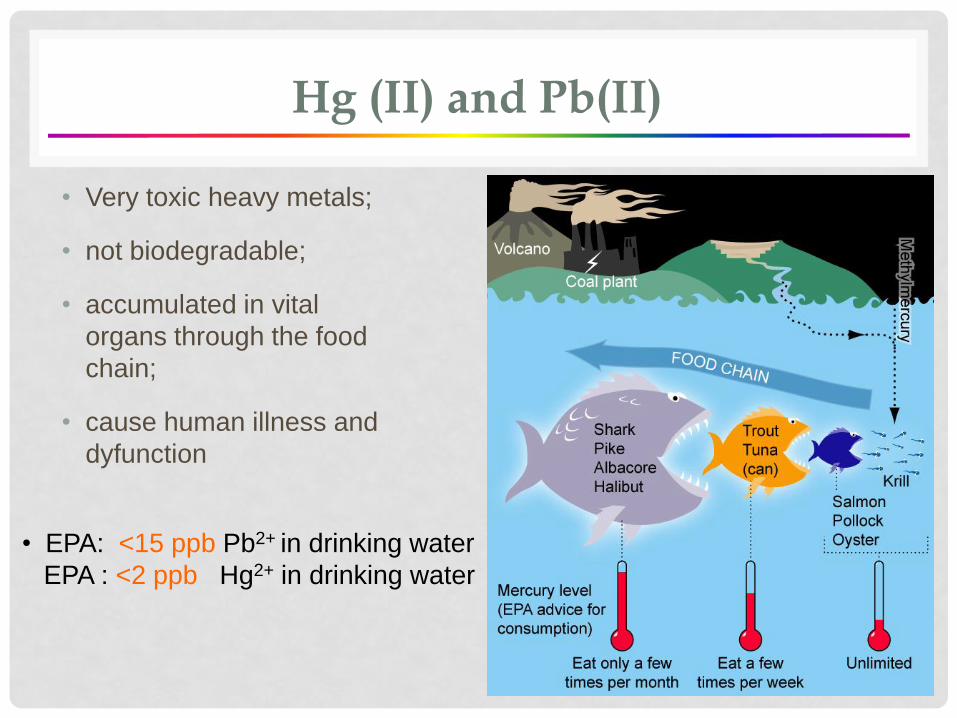
Hg (II) and Pb(II)
• Very toxic heavy metals;
• not biodegradable;
• accumulated in vital
organs through the food
chain;
• cause human illness and
dyfunction
• EPA: <15 ppb Pb2+ in drinking water
EPA : <2 ppb Hg2+ in drinking water
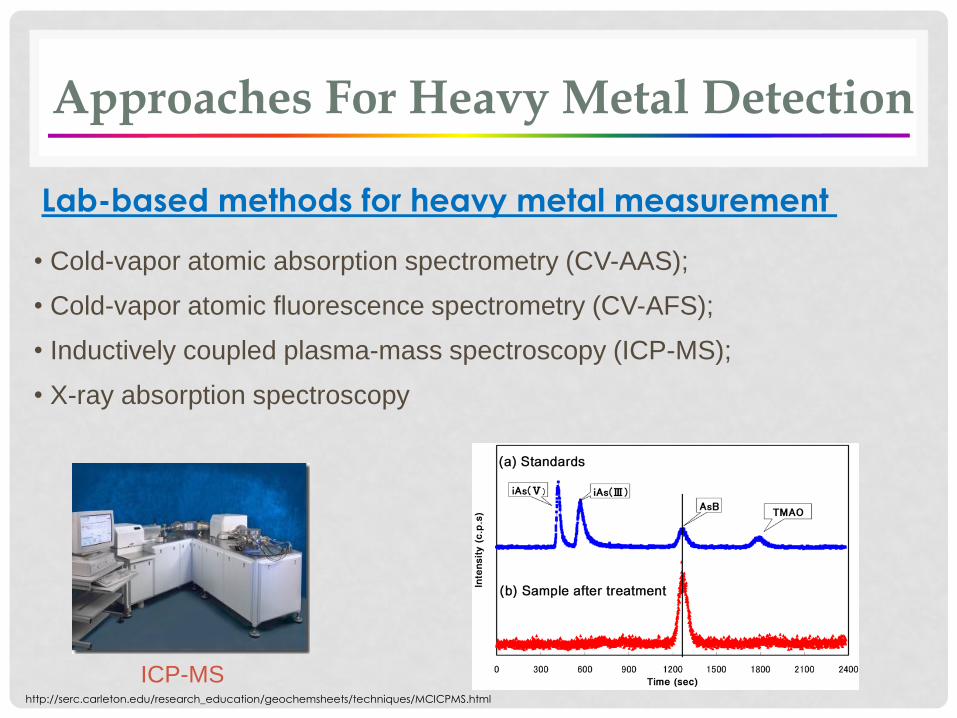
Approaches For Heavy Metal Detection
• Cold-vapor atomic absorption spectrometry (CV-AAS);
• Cold-vapor atomic fluorescence spectrometry (CV-AFS);
• Inductively coupled plasma-mass spectroscopy (ICP-MS);
• X-ray absorption spectroscopy
Lab-based methods for heavy metal measurement
ICP-MShttp://serc.carleton.edu/research_education/geochemsheets/techniques/MCICPMS.html
Approaches for Heavy Metal Detection
Disadvantages of Lab-based analytical method
labor-intensive, time-consuming
laboratory-based large0scale instruments
require large sample volume
need Professional operation
cannot be used as portable instruments for on-site
detection or point-of-care use
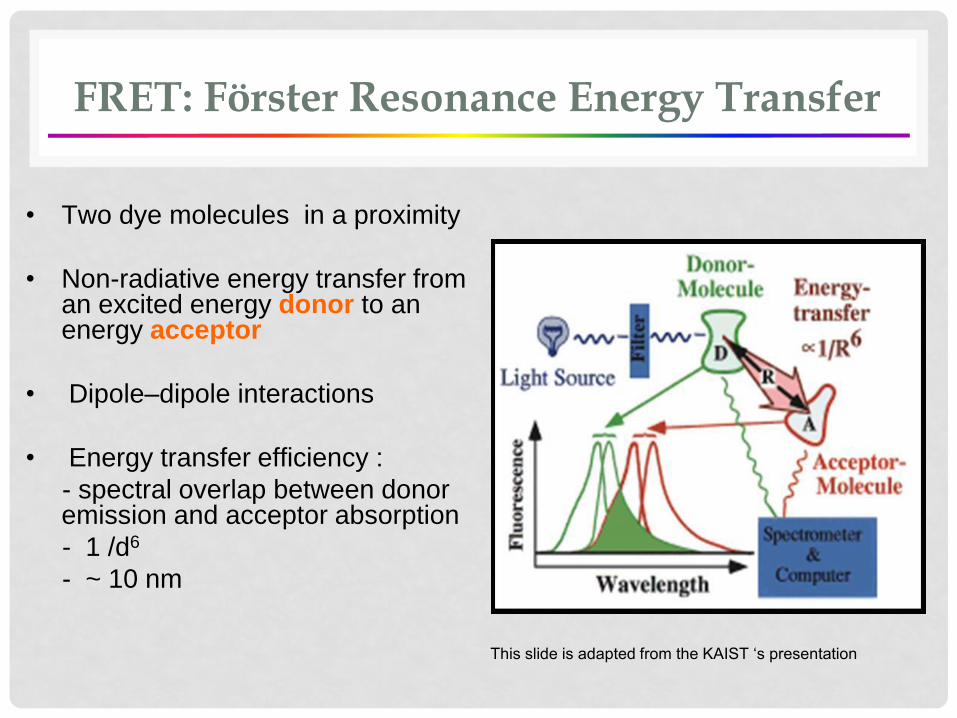
FRET: Förster Resonance Energy Transfer
• Two dye molecules in a proximity
• Non-radiative energy transfer from an excited energy donor to an energy acceptor
• Dipole–dipole interactions
• Energy transfer efficiency :
- spectral overlap between donor emission and acceptor absorption
- 1 /d6
- ~ 10 nm
This slide is adapted from the KAIST ‘s presentation
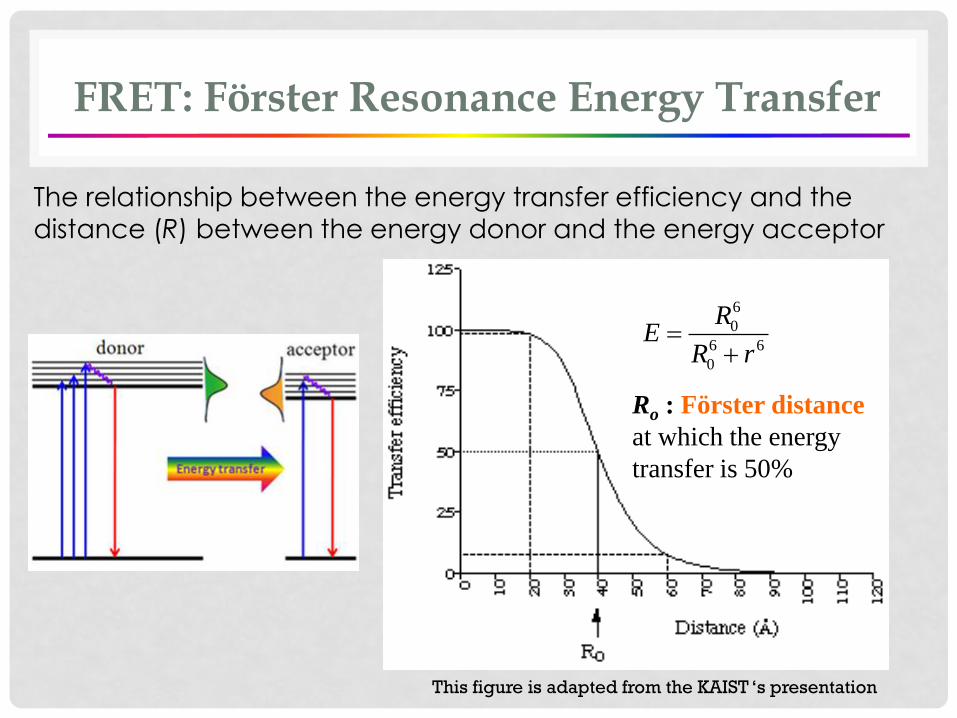
FRET: Förster Resonance Energy Transfer
Ro : Förster distance
at which the energy
transfer is 50%
The relationship between the energy transfer efficiency and the
distance (R) between the energy donor and the energy acceptor
This figure is adapted from the KAIST ‘s presentation
6
0
6 6
0
RE
R r

Fluorophores for FRET Sensors
Typical organic dyes as donors and acceptors in FRET systems
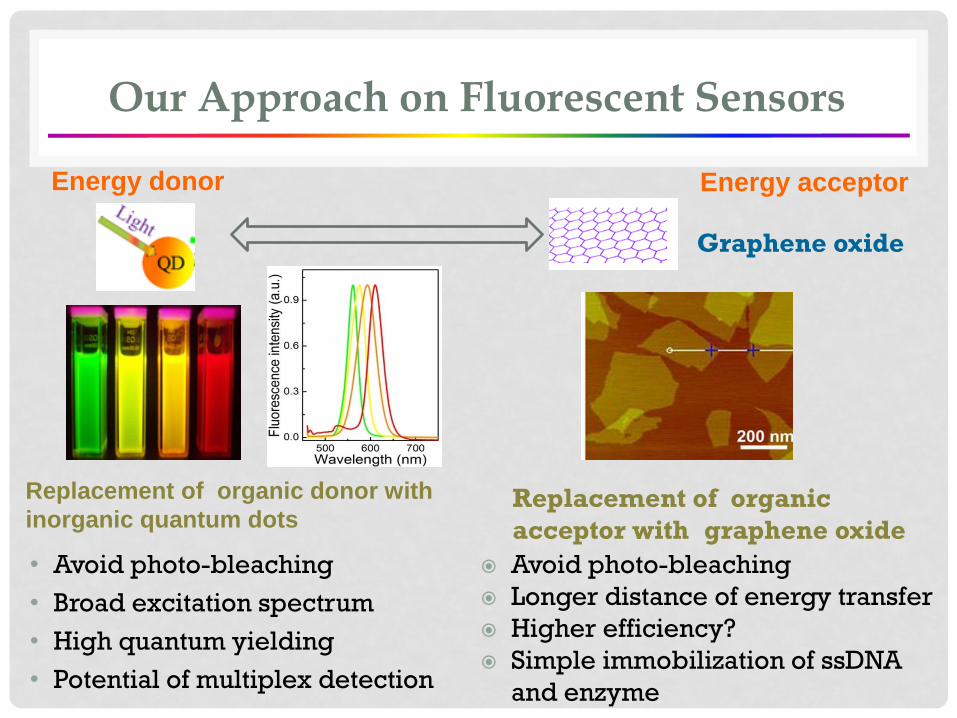
Our Approach on Fluorescent Sensors
Energy donor Energy acceptor
Replacement of organic donor with
inorganic quantum dots
• Avoid photo-bleaching
• Broad excitation spectrum
• High quantum yielding
• Potential of multiplex detection
Avoid photo-bleaching
Longer distance of energy transfer
Higher efficiency?
Simple immobilization of ssDNA
and enzyme
Replacement of organic
acceptor with graphene oxide
Graphene oxide
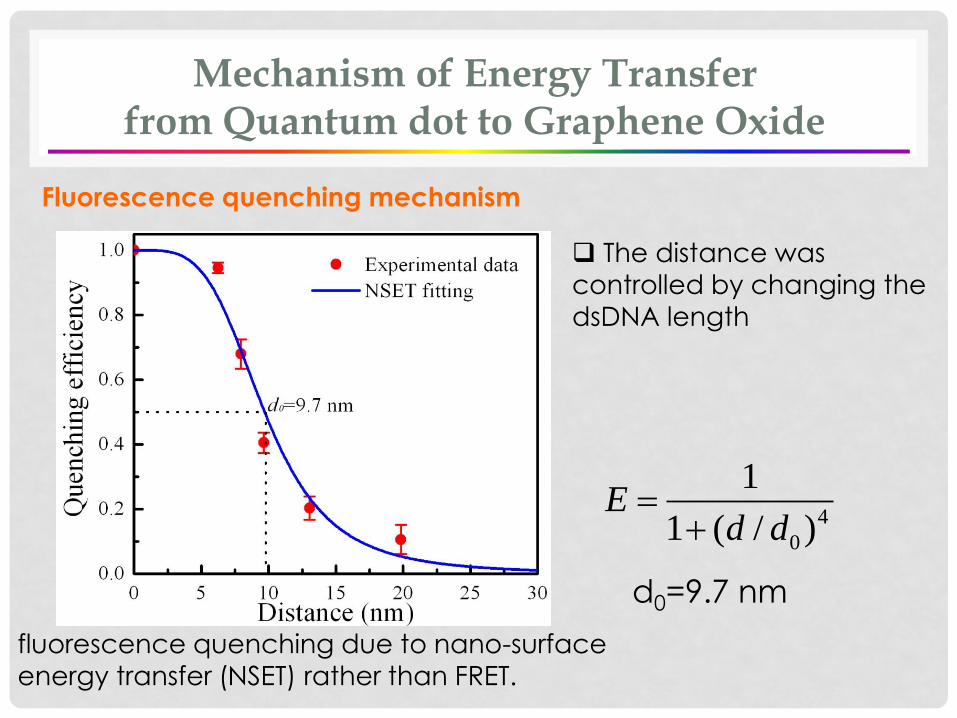
Fluorescence quenching mechanism
4
0
1
1 ( / )E
d d
The distance was
controlled by changing the
dsDNA length
d0=9.7 nm
fluorescence quenching due to nano-surface
energy transfer (NSET) rather than FRET.
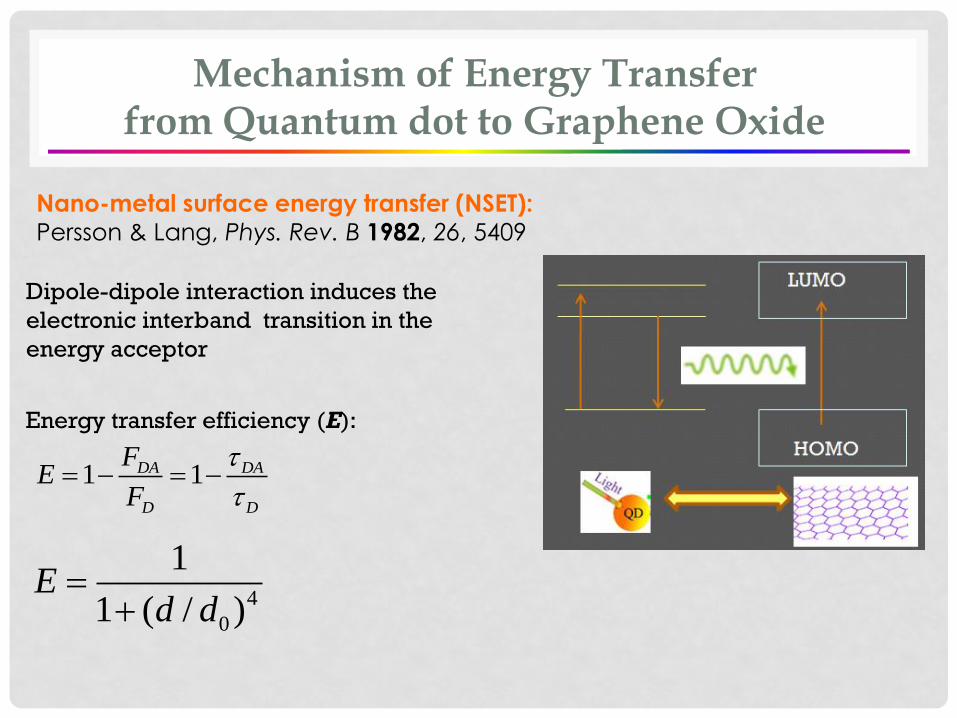
Mechanism of Energy Transfer from Quantum dot to Graphene Oxide
Mechanism of Energy Transfer from Quantum dot to Graphene Oxide
Nano-metal surface energy transfer (NSET):
Persson & Lang, Phys. Rev. B 1982, 26, 5409
Dipole-dipole interaction induces the
electronic interband transition in the
energy acceptor
4
0
1
1 ( / )E
d d
1 1DA DA
D D
FE
F
Energy transfer efficiency (E):
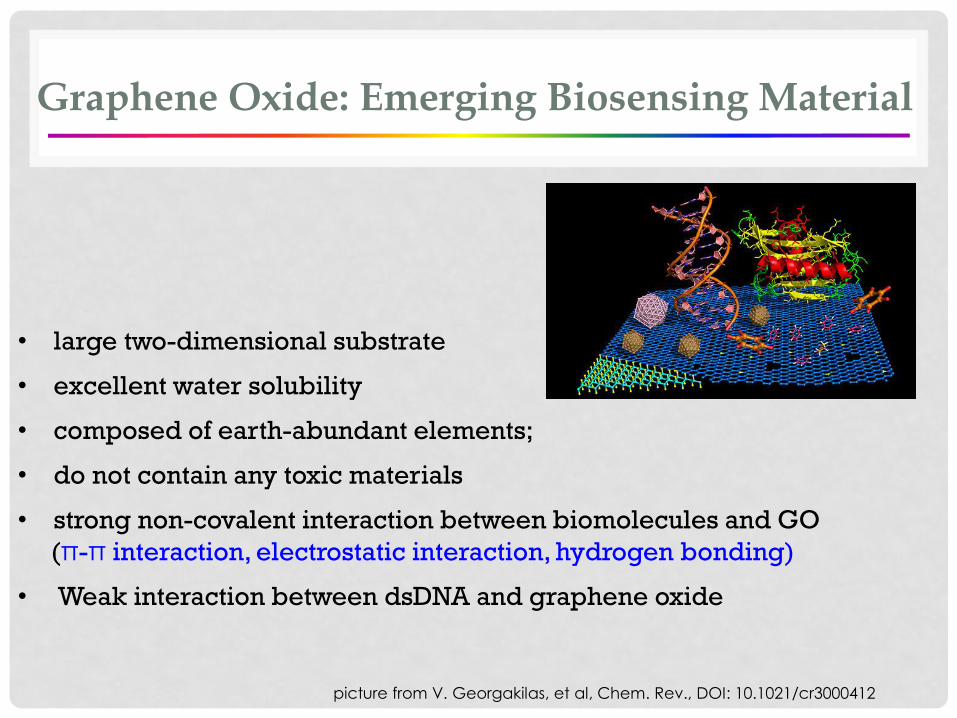
Graphene Oxide: Emerging Biosensing Material
• large two-dimensional substrate
• excellent water solubility
• composed of earth-abundant elements;
• do not contain any toxic materials
• strong non-covalent interaction between biomolecules and GO
(π-π interaction, electrostatic interaction, hydrogen bonding)
• Weak interaction between dsDNA and graphene oxide
picture from V. Georgakilas, et al, Chem. Rev., DOI: 10.1021/cr3000412
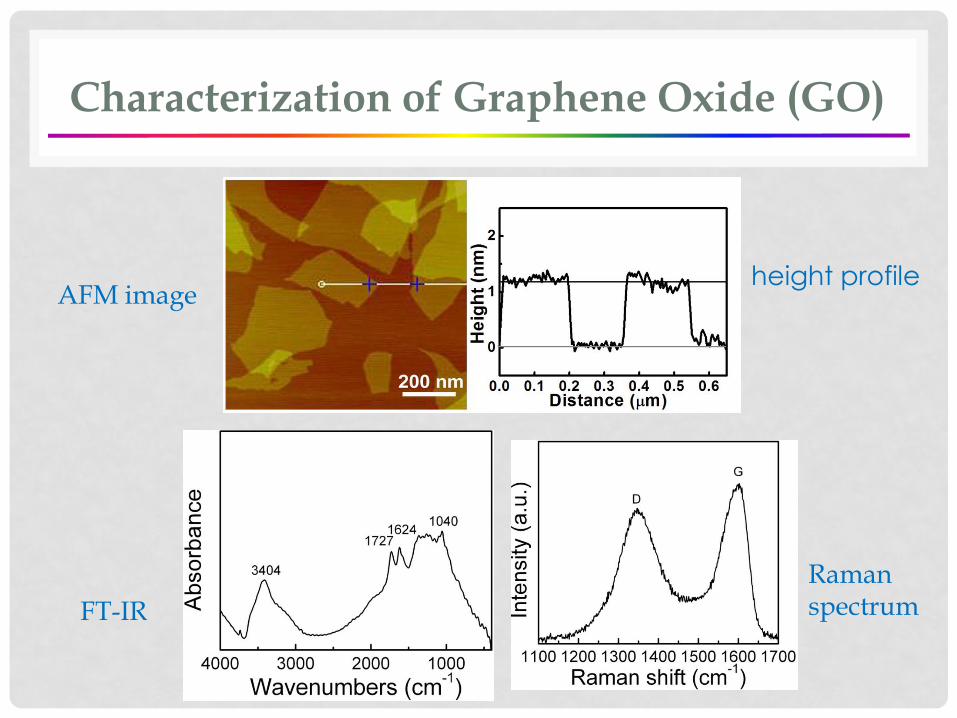
FTIR of GO
AFM imageheight profile
FT-IR
Raman spectrum
Characterization of Graphene Oxide (GO)
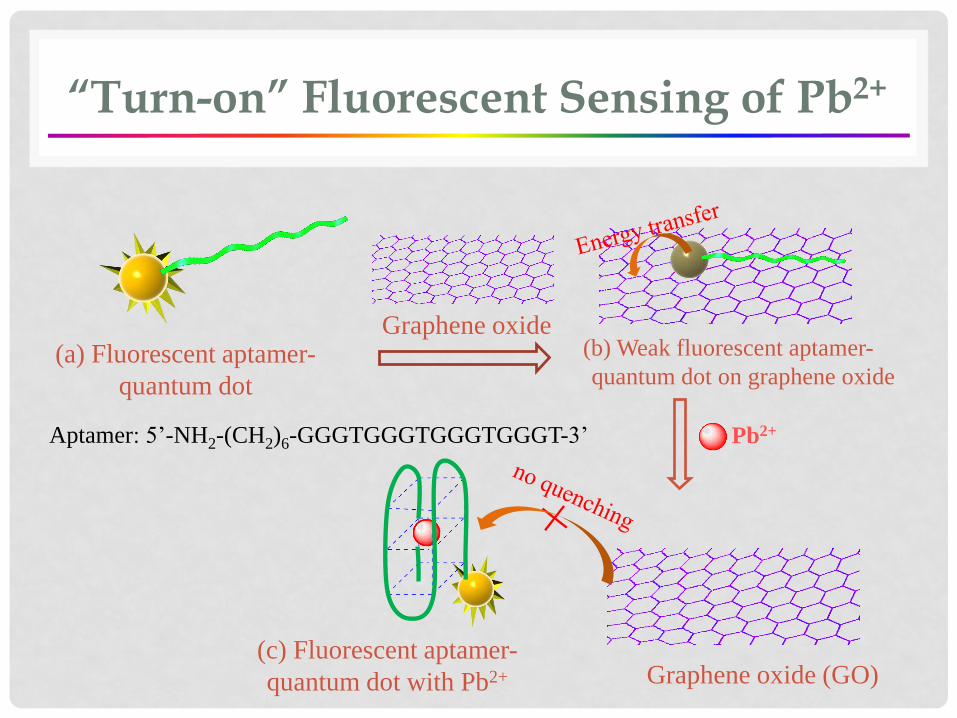
“Turn-on” Fluorescent Sensing of Pb2+
(a) Fluorescent aptamer-
quantum dot
Graphene oxide (GO)
(b) Weak fluorescent aptamer-
quantum dot on graphene oxide
Pb2+
(c) Fluorescent aptamer-
quantum dot with Pb2+
Aptamer: 5’-NH2-(CH2)6-GGGTGGGTGGGTGGGT-3’
Graphene oxide
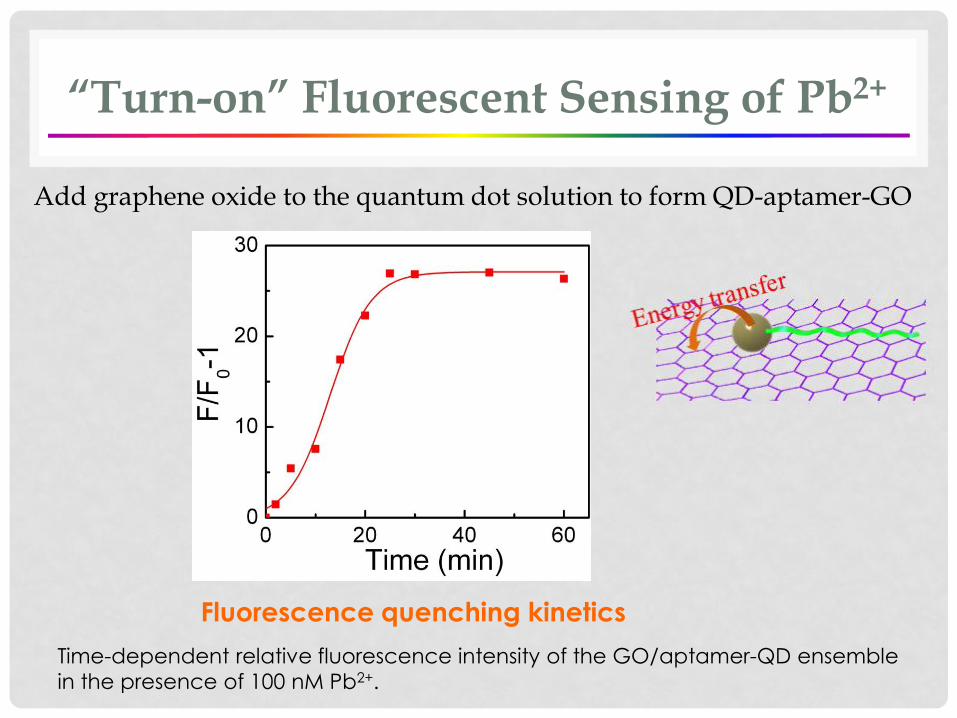
Fluorescence quenching kinetics
“Turn-on” Fluorescent Sensing of Pb2+
Time-dependent relative fluorescence intensity of the GO/aptamer-QD ensemble
in the presence of 100 nM Pb2+.
Add graphene oxide to the quantum dot solution to form QD-aptamer-GO
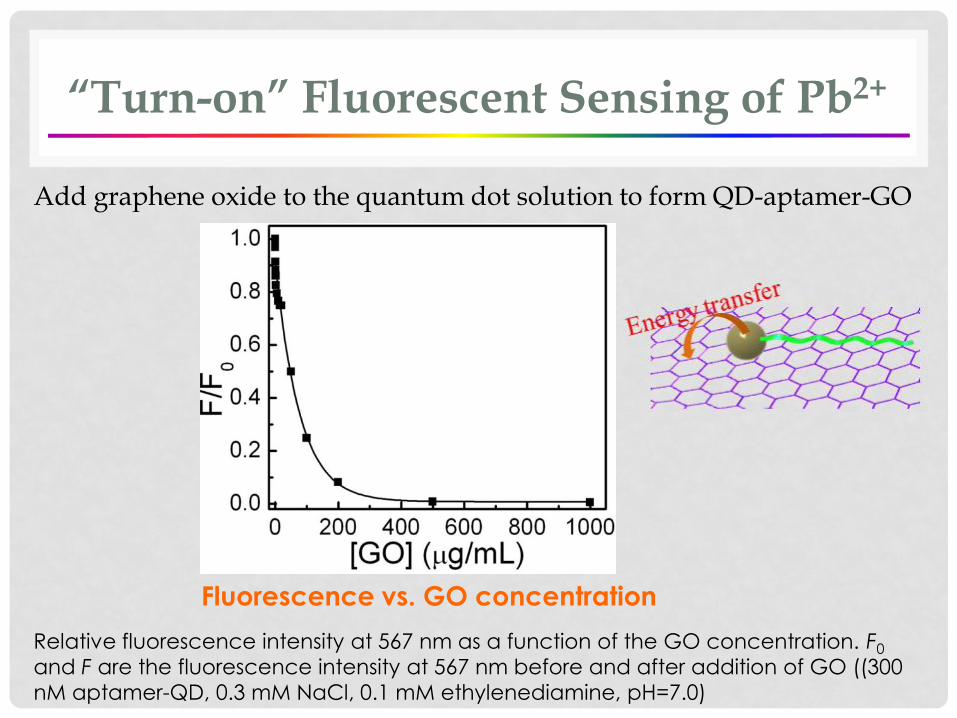
Fluorescence vs. GO concentration
“Turn-on” Fluorescent Sensing of Pb2+
Relative fluorescence intensity at 567 nm as a function of the GO concentration. F0
and F are the fluorescence intensity at 567 nm before and after addition of GO ((300
nM aptamer-QD, 0.3 mM NaCl, 0.1 mM ethylenediamine, pH=7.0)
Add graphene oxide to the quantum dot solution to form QD-aptamer-GO
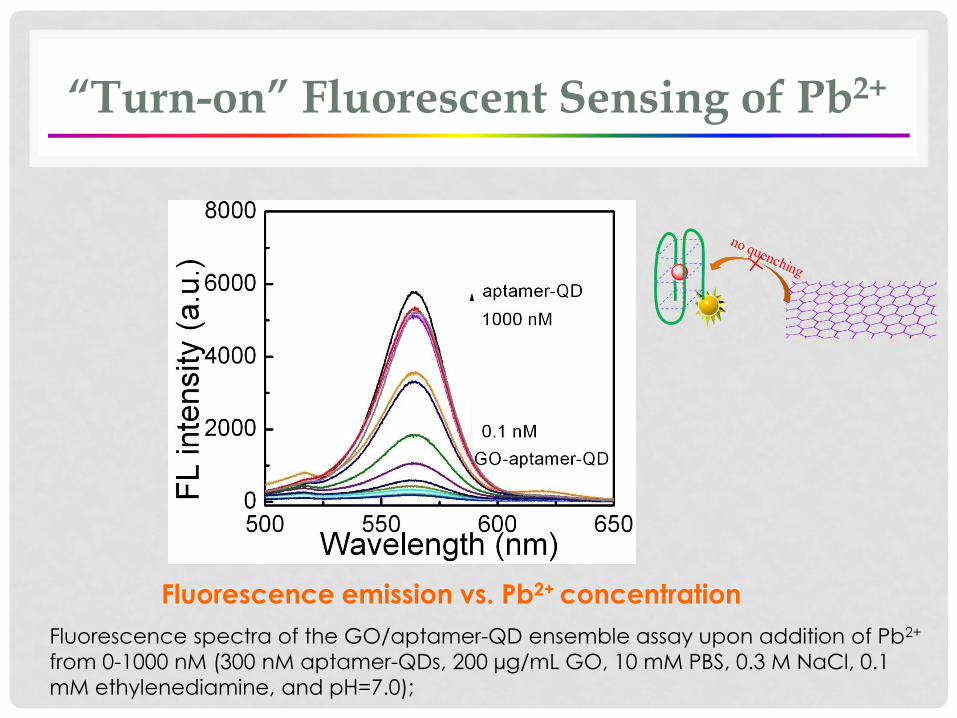
Fluorescence spectra of the GO/aptamer-QD ensemble assay upon addition of Pb2+
from 0-1000 nM (300 nM aptamer-QDs, 200 µg/mL GO, 10 mM PBS, 0.3 M NaCl, 0.1
mM ethylenediamine, and pH=7.0);
Fluorescence emission vs. Pb2+ concentration
“Turn-on” Fluorescent Sensing of Pb2+
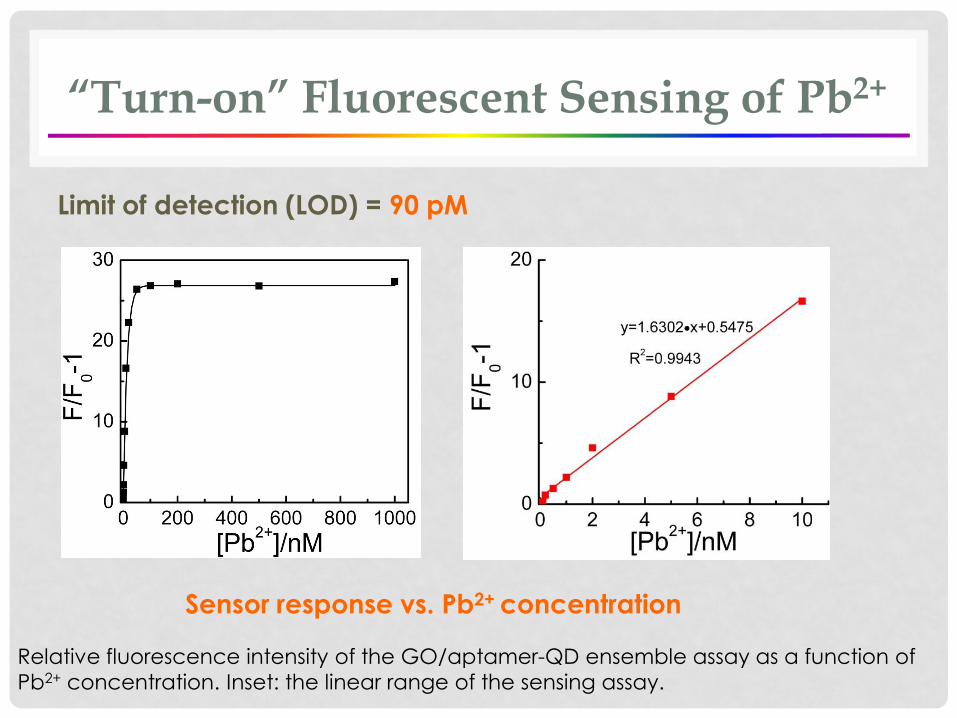
Relative fluorescence intensity of the GO/aptamer-QD ensemble assay as a function of
Pb2+ concentration. Inset: the linear range of the sensing assay.
Limit of detection (LOD) = 90 pM
“Turn-on” Fluorescent Sensing of Pb2+
Sensor response vs. Pb2+ concentration
“Turn-on” Fluorescent Sensing of Pb2+
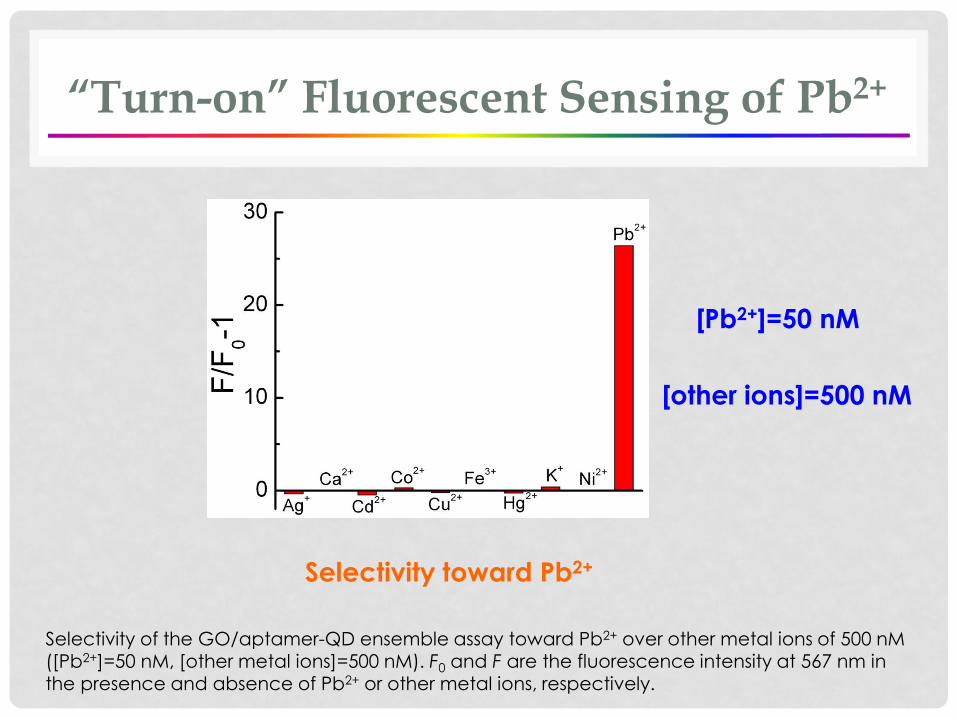
Selectivity toward Pb2+
Selectivity of the GO/aptamer-QD ensemble assay toward Pb2+ over other metal ions of 500 nM([Pb2+]=50 nM, [other metal ions]=500 nM). F0 and F are the fluorescence intensity at 567 nm in
the presence and absence of Pb2+ or other metal ions, respectively.
[Pb2+]=50 nM
[other ions]=500 nM
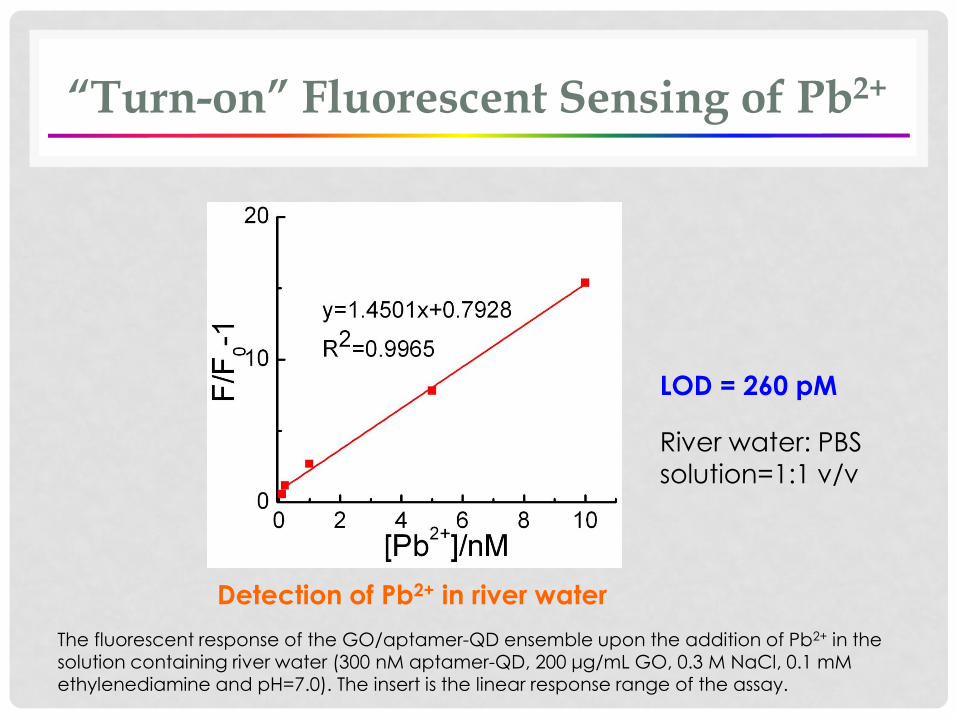
Detection of Pb2+ in river water
LOD = 260 pM
The fluorescent response of the GO/aptamer-QD ensemble upon the addition of Pb2+ in the solution containing river water (300 nM aptamer-QD, 200 μg/mL GO, 0.3 M NaCl, 0.1 mMethylenediamine and pH=7.0). The insert is the linear response range of the assay.
River water: PBS
solution=1:1 v/v
“Turn-on” Fluorescent Sensing of Pb2+
Graphene oxide acts as not only an energy acceptor
(quencher)
but also an interesting energy donor (fluorophore)
Graphene Oxide: Emerging Biosensing Material
Graphene Oxide: Emerging Biosensing Material
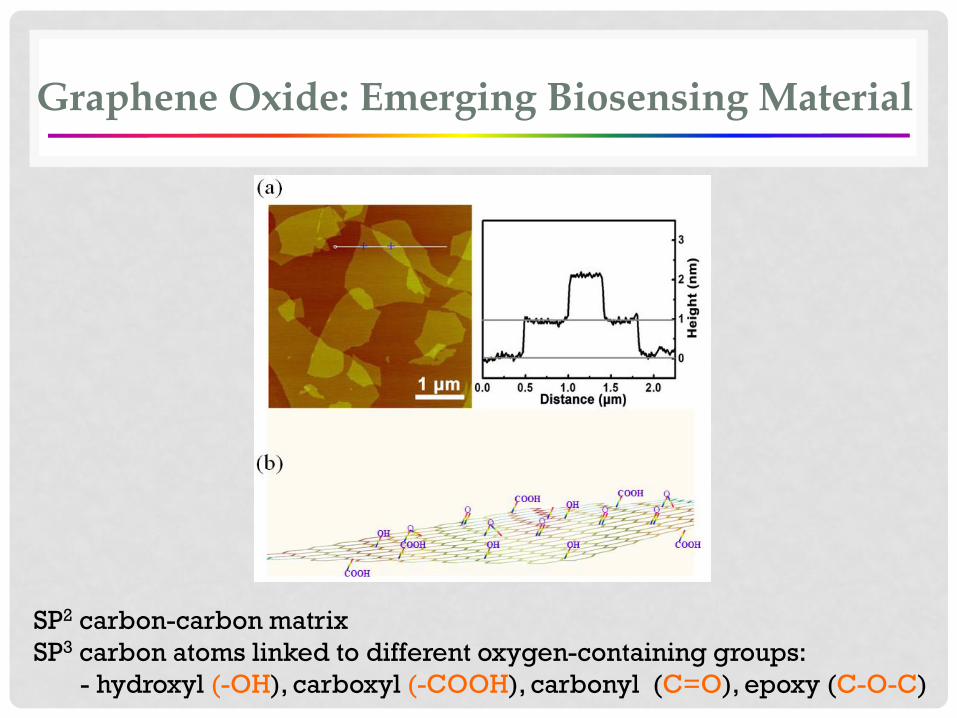
SP2 carbon-carbon matrix
SP3 carbon atoms linked to different oxygen-containing groups:
- hydroxyl (-OH), carboxyl (-COOH), carbonyl (C=O), epoxy (C-O-C)
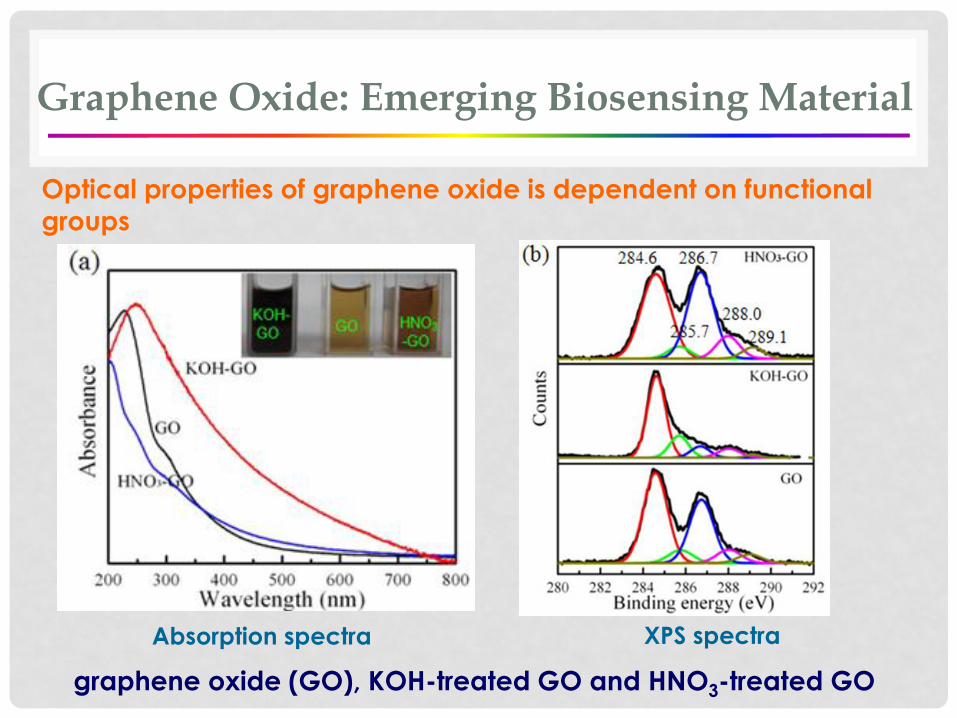
Graphene Oxide: Emerging Biosensing Material
graphene oxide (GO), KOH-treated GO and HNO3-treated GO
Optical properties of graphene oxide is dependent on functional
groups
Absorption spectra XPS spectra

Graphene Oxide: Emerging Biosensing Material
graphene oxide (GO), KOH-treated GO and HNO3-treated GO
Absorption
Fluorescence
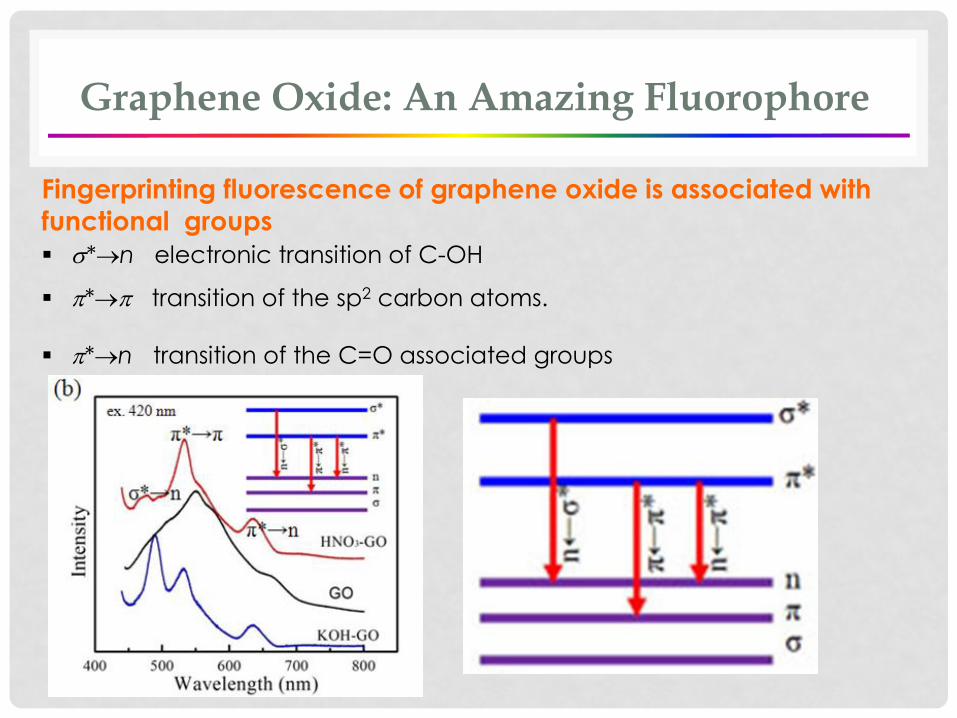
Graphene Oxide: An Amazing Fluorophore
*n electronic transition of C-OH
* transition of the sp2 carbon atoms.
*n transition of the C=O associated groups
Fingerprinting fluorescence of graphene oxide is associated with
functional groups
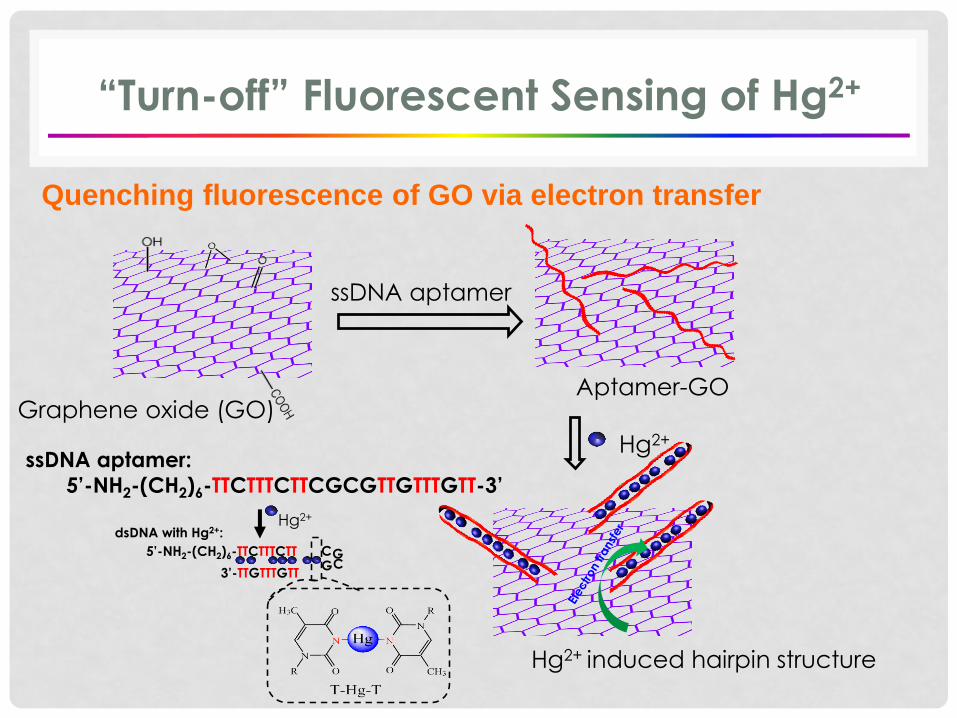
“Turn-off” Fluorescent Sensing of Hg2+
Quenching fluorescence of GO via electron transfer
ssDNA aptamer
Graphene oxide (GO)Aptamer-GO
Hg2+
Hg2+ induced hairpin structure
ssDNA aptamer:
5’-NH2-(CH2)6-TTCTTTCTTCGCGTTGTTTGTT-3’
dsDNA with Hg2+:
5’-NH2-(CH2)6-TTCTTTCTT
3’-TTGTTTGTTGC
CG
Hg2+
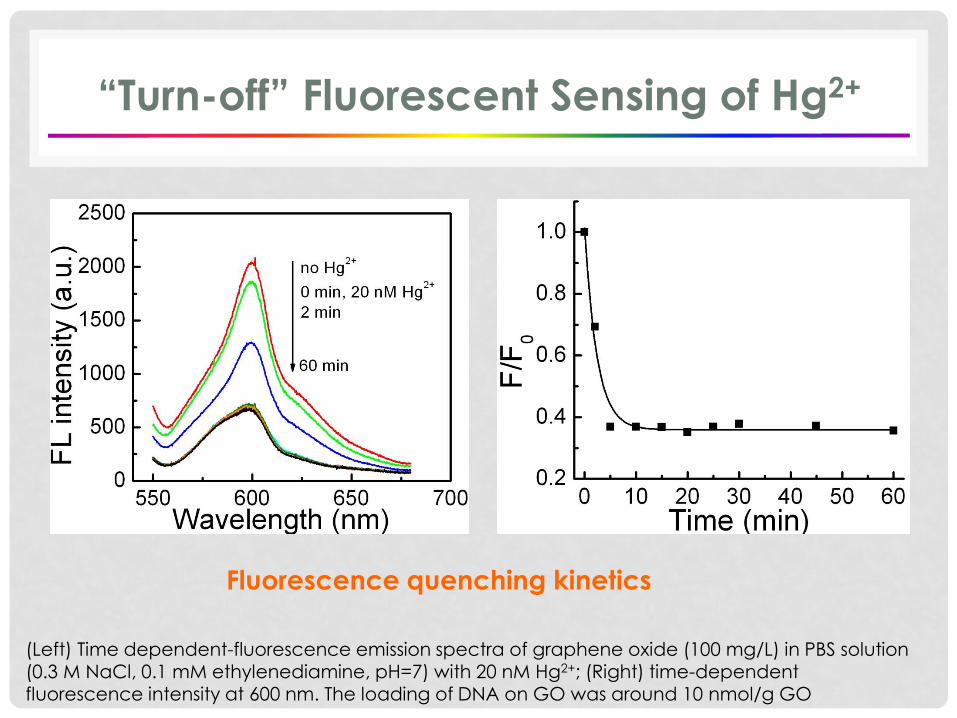
“Turn-off” Fluorescent Sensing of Hg2+
Fluorescence quenching kinetics
(Left) Time dependent-fluorescence emission spectra of graphene oxide (100 mg/L) in PBS solution (0.3 M NaCl, 0.1 mM ethylenediamine, pH=7) with 20 nM Hg2+; (Right) time-dependent fluorescence intensity at 600 nm. The loading of DNA on GO was around 10 nmol/g GO
“Turn-off” Fluorescent Sensing of Hg2+
Sensor response vs. Hg2+ concentration
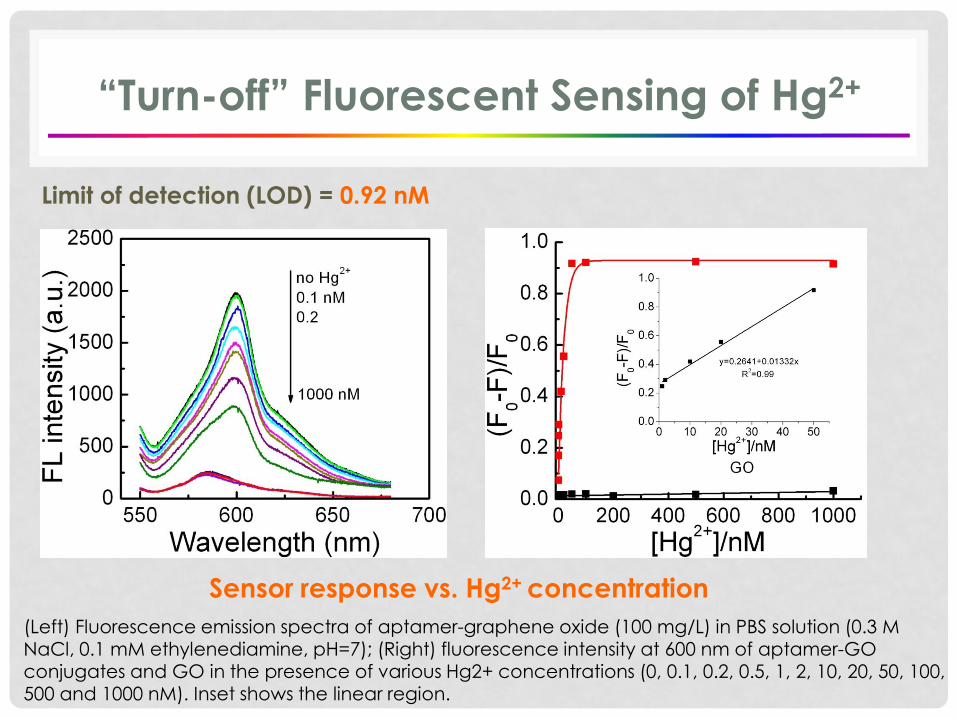
(Left) Fluorescence emission spectra of aptamer-graphene oxide (100 mg/L) in PBS solution (0.3 M NaCl, 0.1 mM ethylenediamine, pH=7); (Right) fluorescence intensity at 600 nm of aptamer-GO conjugates and GO in the presence of various Hg2+ concentrations (0, 0.1, 0.2, 0.5, 1, 2, 10, 20, 50, 100, 500 and 1000 nM). Inset shows the linear region.
Limit of detection (LOD) = 0.92 nM
“Turn-off” Fluorescent Sensing of Hg2+
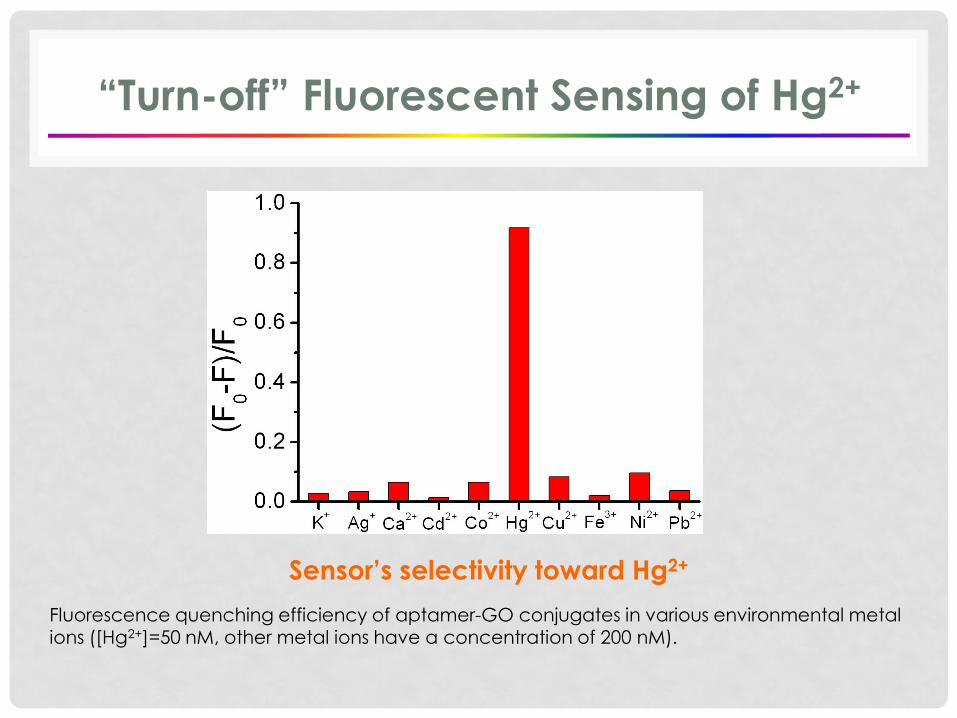
Sensor’s selectivity toward Hg2+
Fluorescence quenching efficiency of aptamer-GO conjugates in various environmental metal ions ([Hg2+]=50 nM, other metal ions have a concentration of 200 nM).
Lab-on-Chip for Heavy Metal Detection
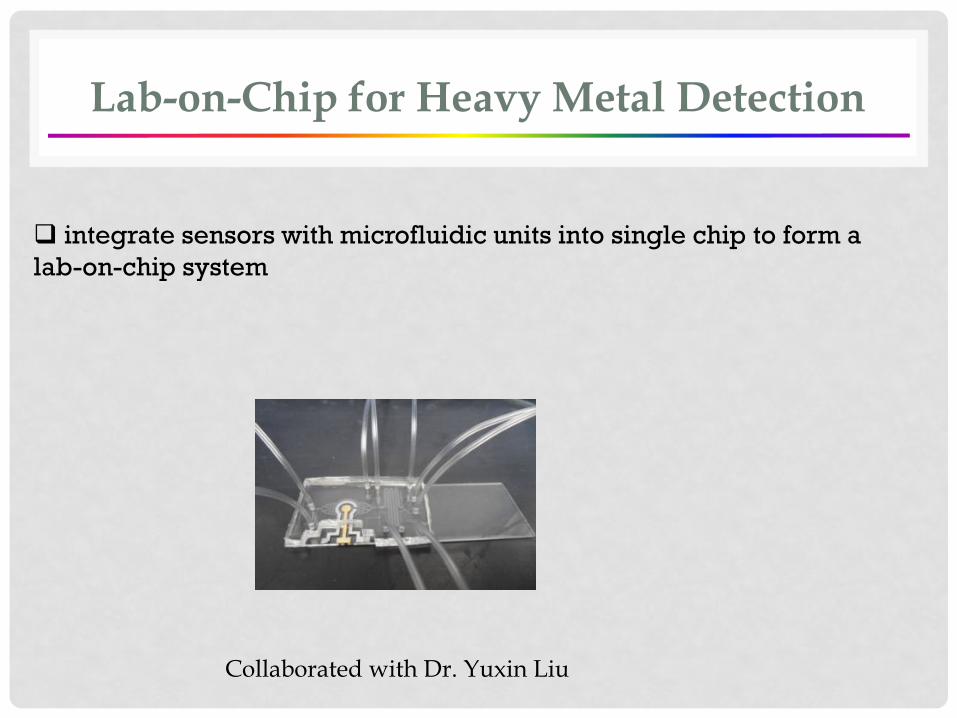
integrate sensors with microfluidic units into single chip to form a
lab-on-chip system
Collaborated with Dr. Yuxin Liu
Summary
“Turn-on” fluorescence detection of Pb2+ was developed with GO
as super fluorescence quencher and CdSe/ZnS quantum dots
attached by Pb2+ specific ssDNA;
The developed fluorescent sensor for Pb2+ detection has a LOD of
90 pM and excellent selectivity toward Pb2+
A fluorescent sensor for Hg2+ detection was developed by the
electron transfer from GO to the bounded Hg2+
The Hg2+ sensor shows a LOD as low as 0.92 nM and excellent
selectivity.
Acknowledgment
Financial support from
NSF (CBET-0754405)
NSF RII Grant (EPS 1003907)
West Virginia University Research Corporation
WV EPSCOR Program
Ming Li
Honglei Gou
Yuxin Liu