winter performance assessment of permeable pavements · pdf filewinter performance assessment...
TRANSCRIPT
WINTER PERFORMANCE ASSESSMENT OF PERMEABLE PAVEMENTS
A COMPARATIVE STUDY OF POROUS ASPHALT, PERVIOUS CONCRETE,
AND CONVENTIONAL ASPHALT IN A NORTHERN CLIMATE
BY
KRISTOPHER M. HOULE
BS, Worcester Polytechnic Institute, 2006
THESIS
Submitted to the University of New Hampshire
in Partial Fulfillment of
the Requirements for the Degree of
Master of Science
in
Civil Engineering
September, 2008
This thesis has been examined and approved.
_______________________________________ Thesis Director, Dr. Thomas P. Ballestero
Associate Professor of Civil Engineering
_______________________________________ Dr. Robert M. Roseen
Director, UNH Stormwater Center
_______________________________________ Douglas Heath
Hydrologist, U.S. EPA Region 1
_______________________ Date
iii
ACKNOWLEDGEMENTS
This research was supported by funding from the National Oceanic and
Atmospheric Administration (NOAA) through the Cooperative Institute for Coastal and
Estuarine Environmental Technology (CICEET). Additional support was received from
the University of New Hampshire, the Northern New England Concrete Promotion
Association (NNECPA), the Northeast Cement Shippers Association, and the National
Ready Mix Concrete Association (NRMCA).
I would like to thank my advisors, Dr. Thomas Ballestero and Dr. Robert Roseen,
for all of their knowledge and guidance along the way. They have been invaluable
resources and I hope that our efforts together will continue for years to come. I would
like to thank everyone at the UNH Stormwater Center - Jamie, Pedro, George, Josh, Iulia,
Tim, Jay, Heather, and Alison - for their willingness to help in all conditions and for
providing a constant supply of fun and good humor. I would like to thank the final
member of my committee, Douglas Heath, for his insight and notable contributions to my
research. Many more have assisted me during my time at UNH, including: Jon Kuell of
NNECPA, Thomas Byron and the UNH Grounds & Roads Dept., Maddy Wasiewski,
Kelly Hinton, and countless others in the Environmental Research Group.
Finally, I would like to offer a special thank you to my family – Mom, Dad,
Kelly, Katie, Willie, Brian – and my girlfriend Abigail, who have supported me in so
many ways over the years.
iv
TABLE OF CONTENTS
ACKNOWLEDGEMENTS............................................................................................... iii
TABLE OF CONTENTS................................................................................................... iv
LIST OF TABLES............................................................................................................. vi
LIST OF FIGURES .......................................................................................................... vii
LIST OF ABBREVIATIONS.......................................................................................... viii
ABSTRACT....................................................................................................................... ix
CHAPTER 1 ........................................................................................................................1
INTRODUCTION .........................................................................................................1
CHAPTER 2 ........................................................................................................................3
A WINTER PERFORMANCE ASSESSMENT OF POROUS ASPHALT AND ITS FUNCTION FOR CHLORIDE SOURCE CONTROL..............................................3
Abstract ....................................................................................................................3
Introduction..............................................................................................................4
Background..............................................................................................................6
Methodology ............................................................................................................7
Results and Discussion ..........................................................................................11
Conclusions............................................................................................................30
CHAPTER 3 ......................................................................................................................32
A WINTER PERFORMANCE COMPARISON OF POROUS ASPHALT, PERVIOUS CONCRETE, AND CONVENTIONAL ASPHALT PAVEMENTS.....32
Abstract ..................................................................................................................32
v
Introduction............................................................................................................33
Background............................................................................................................34
Methodology ..........................................................................................................37
Results and Discussion ..........................................................................................42
Conclusions............................................................................................................66
CHAPTER 4 ......................................................................................................................69
AN ANALYSIS OF PROJECT COSTS......................................................................69
CHAPTER 5 ......................................................................................................................74
CONCLUSIONS AND RECOMMENDATIONS ......................................................74
Conclusions............................................................................................................74
Recommendations for Future Research .................................................................75
REFERENCES ..................................................................................................................77
APPENDICES ...................................................................................................................81
APPENDIX A....................................................................................................................82
SALT BRINE USE FOR WINTER MAINTENANCE OF PERMEABLE PAVEMENTS..............................................................................................................82
APPENDIX B ....................................................................................................................87
CROSS-SECTIONS OF UNHSC PERMEABLE PAVEMENTS..............................87
APPENDIX C ....................................................................................................................89
FROST DEPTH ...........................................................................................................89
APPENDIX D....................................................................................................................92
SURFACE INFILTRATION CAPACITY..................................................................92
APPENDIX E ....................................................................................................................96
SURFACE COVER AND SKID RESISTANCE........................................................96
APPENDIX F...................................................................................................................131
SALT APPLICATION DATES ................................................................................131
APPENDIX G..................................................................................................................133
CHLORIDE RECOVERY.........................................................................................133

vi
LIST OF TABLES
Table 1: Seasonal statistical comparison of porous asphalt surface infiltration capacity (in/hr) using a Student’s t-test........................................................................ 16
Table 2: Winter storm event characteristics (‘06-‘07)...................................................... 19 Table 3: Snow & ice cover monitoring characteristics for all study areas (’06-’07)........ 23 Table 4: Student’s t-test p-value comparison of snow & ice cover (’06-’07) .................. 23 Table 5: Skid resistance descriptive statistics for PA and DMA pavements and winter
surface conditions (’06-’07) .......................................................................... 25 Table 6: Weighted skid resistance descriptive statistics for all study areas (’06-’07)...... 27 Table 7: Student’s t-test p-value comparison for weighted skid resistance (’06-’07) ...... 27 Table 8: Required salt loads and possible salt reductions on porous asphalt (’06-’07).... 30 Table 9: Winter storm event characteristics (‘07-‘08)...................................................... 47 Table 10: Snow & ice cover monitoring characteristics for all study areas (’07-’08)...... 53 Table 11: Student’s t-test p-value comparison of snow & ice cover (’07-’08) ................ 54 Table 12: Skid resistance descriptive statistics for all pavements and winter surface
conditions (’07-’08) ....................................................................................... 56 Table 13: Weighted skid resistance descriptive statistics for all study areas (’07-’08).... 58 Table 14: Student’s t-test p-value comparison for weighted skid resistance (’07-’08) .... 61 Table 15: Required salt loads & possible salt reductions for each pavement (’07-’08) ... 65 Table 16: UNHSC PA and DMA lots costs and estimation of a typical PA design (2004
$US) (Briggs, 2006)....................................................................................... 71 Table 17: Costs of UNHSC PC lot and cost estimation of a typical design (2007 $US) . 73 Table 18: Salt brine application rate parameters............................................................... 84 Table 19: Winter storm event characteristics (‘08)........................................................... 84 Table 20: Frost depth raw data (‘06-‘07).......................................................................... 89 Table 21: Frost depth raw data (‘07-‘08).......................................................................... 90 Table 22: Porous asphalt mean surface infiltration capacity raw data (‘04-‘07).............. 92 Table 23: Porous asphalt surface infiltration capacity raw data (‘08) .............................. 93 Table 24: Pervious concrete surface infiltration capacity raw data (‘07-‘08) .................. 94 Table 25: Surface cover observations and weighted skid resistance values (‘06-‘07) ..... 96 Table 26: Surface cover observations and weighted skid resistance values (‘07-‘08) ... 105 Table 27: Salt application dates on PA and DMA lots (‘06-‘07) ................................... 131 Table 28: Salt application dates on PC, PA, and DMA lots (‘07-‘08)............................ 132 Table 29: Recovered chloride mass from PA and DMA lots (‘06-‘07).......................... 133 Table 30: Recovered chloride mass from PC, PA, and DMA lots (‘07-‘08).................. 133
vii
LIST OF FIGURES
Figure 1: Porous asphalt (PA) and dense mix asphalt (DMA) study areas (’06-’07)......... 9 Figure 2: Frost depth penetration in the porous asphalt system (11/06 to 4/07)............... 13 Figure 3: Porous asphalt surface infiltration capacity (’04-’08) (Briggs, 2006)............... 14 Figure 4: Analysis of asphalt binder content in PA core samples (Briggs et al., 2007) ... 15 Figure 5: Pavement conditions before and after plowing (2/3/07) ................................... 20 Figure 6: Instantaneous pavement conditions after thawing and refreezing of meltwater
(3/18/07) ........................................................................................................ 21 Figure 7: Comparison of percent snow & ice cover for each study area (’06-’07) .......... 22 Figure 8: Skid resistance for PA and DMA pavements and all winter surface conditions
(’06-’07)......................................................................................................... 24 Figure 9: Weighted skid resistance as a function of snow & ice cover (’06-’07) ............ 26 Figure 10: Comparison of recovered chloride for PA and DMA lots (’06-’07)............... 28 Figure 11: Particle-size distributions for PA and PC aggregate mixes............................. 35 Figure 12: Pervious concrete (PC) study areas (‘07-‘08) ................................................. 39 Figure 13: Porous asphalt (PA) and dense mix asphalt (DMA) study areas (‘07-‘08)..... 39 Figure 14: Frost depth penetration comparison between permeable pavements and
reference soil sites (11/07 – 4/08).................................................................. 43 Figure 15: Porous asphalt surface infiltration capacity (Houle, 2008; Briggs, 2006) ...... 45 Figure 16: Pervious concrete surface infiltration capacity (’07-’08)................................ 46 Figure 17: Changing pavement conditions with time: PA vs. DMA............................... 49 Figure 18: Instantaneous pavement conditions after freezing-rain: PA vs. DMA............ 49 Figure 19: Pervious concrete surface conditions with varying levels of shading............. 50 Figure 20: Pavement conditions after thawing and refreezing of meltwater .................... 51 Figure 21: Comparison of snow & ice percent cover for all study areas (’07-’08) .......... 52 Figure 22: Skid resistance for all pavements and winter surface conditions (’07-’08) .... 55 Figure 23: Weighted skid resistance as a function of surface cover (’07-’08) ................. 58 Figure 24: Cumulative chloride mass balance for PA and PC systems (10/06-6/08)....... 62 Figure 25: Comparison of snow & ice percent cover for all study areas (’07-’08) .......... 85 Figure 26: Weighted skid resistance as a function of surface cover (’07-’08) ................. 86 Figure 27: Cross-section of UNHSC porous asphalt parking lot...................................... 87 Figure 28: Cross-section of UNHSC pervious concrete parking lot................................. 88
viii
LIST OF ABBREVIATIONS
ADAT Average daily air temperature ASTM American Society for Testing and Materials BMP Best Management Practice BPN British Pendulum Number BPT British Pendulum Tester BRG Bank Run Gravel CICEET Cooperative Center for Coastal and Estuarine Environmental
Technology Cl Chloride CRREL Cold Regions Research and Engineering Laboratory DI De-ionized (water) DMA Dense Mix Asphalt DRI Double Ring Infiltrometer IC Infiltration Capacity MPCA Minnesota Pollution Control Agency n Number of samples Na Sodium NCDC National Climatic Data Center NH New Hampshire NHDES New Hampshire Department of Environmental Services NHSCO New Hampshire State Climate Office NNECPA Northern New England Concrete Promotion Association NOAA National Oceanic and Atmospheric Agency NPDES National Pollutant Discharge Elimination System NRMCA National Ready-Mix Concrete Association OGFC Open Graded Friction Course PA Porous Asphalt PC Pervious Concrete PVC Poly-vinyl Chloride SC Specific Conductivity SCS Soil Conservation Service SI Surface Inundation (Test) SR Standard Reference (parking lot) TMDL Total Maximum Daily Load UNH University of New Hampshire UNHSC University of New Hampshire Stormwater Center USBLS United States Bureau of Labor Statistics USEPA United States Environmental Protection Agency WE West Edge (Lot)
ix
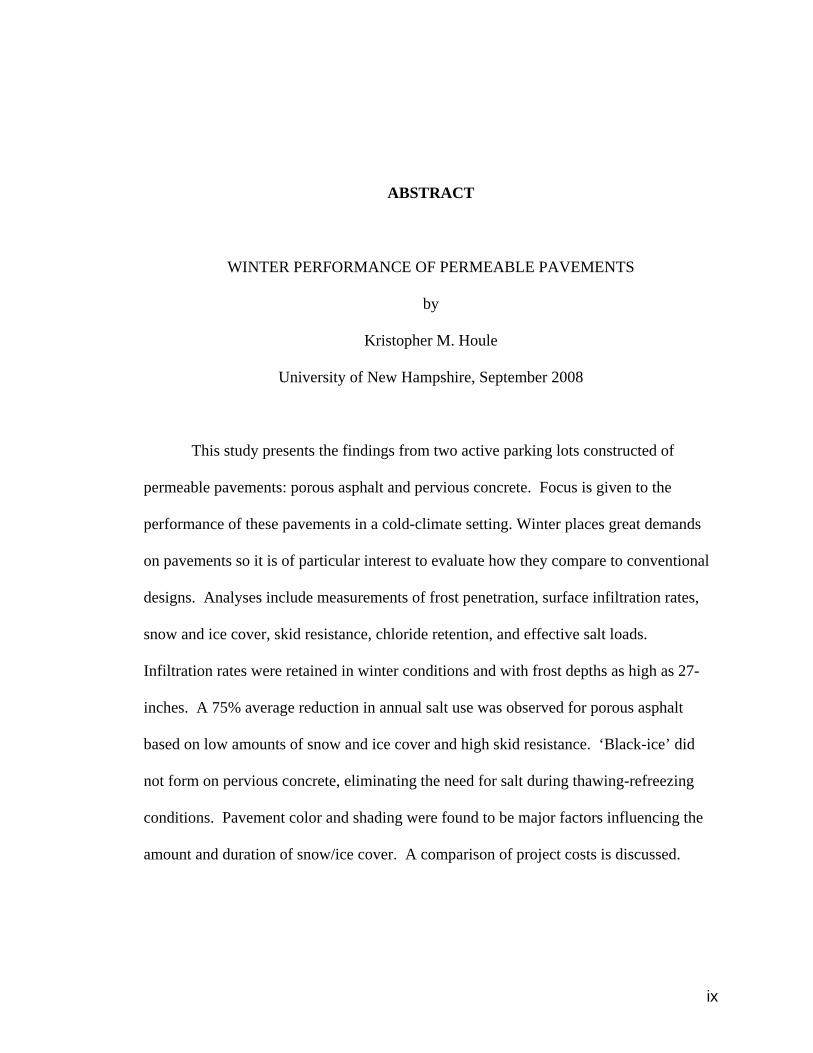
ABSTRACT
WINTER PERFORMANCE OF PERMEABLE PAVEMENTS
by
Kristopher M. Houle
University of New Hampshire, September 2008
This study presents the findings from two active parking lots constructed of
permeable pavements: porous asphalt and pervious concrete. Focus is given to the
performance of these pavements in a cold-climate setting. Winter places great demands
on pavements so it is of particular interest to evaluate how they compare to conventional
designs. Analyses include measurements of frost penetration, surface infiltration rates,
snow and ice cover, skid resistance, chloride retention, and effective salt loads.
Infiltration rates were retained in winter conditions and with frost depths as high as 27-
inches. A 75% average reduction in annual salt use was observed for porous asphalt
based on low amounts of snow and ice cover and high skid resistance. ‘Black-ice’ did
not form on pervious concrete, eliminating the need for salt during thawing-refreezing
conditions. Pavement color and shading were found to be major factors influencing the
amount and duration of snow/ice cover. A comparison of project costs is discussed.
1
CHAPTER 1
INTRODUCTION
Permeable pavements are a low impact development (LID) stormwater
management technology that is at the forefront of today’s industry. These strategies not
only function as transportation surfaces but serve as self-contained treatment systems that
require almost no additional land for development. Historically, there has been
skepticism and misinformation on how these technologies perform in cold climates due to
concerns over freeze-thaw damage as well as clogging from deicing sand and salt
treatments. The objective of this research stems from these concerns and addresses the
winter performance of two types of permeable pavements: porous asphalt and pervious
concrete. The two pavements are compared against conventional, impermeable asphalt to
reveal any advantages or disadvantages that exist between strategies. A series of
performance metrics are used to measure the effectiveness of the pavements in a range of
weather conditions. The study is broken down into chapters highlighting two winters of
evaluation, beginning with 2006-2007 in Chapter 2 and continuing with 2007-2008 in
Chapter 3. The reason for this method of organization was to develop two independent
research papers that could be submitted for publication to a peer-reviewed journal.
The first paper presented focuses primarily on the ability of porous asphalt to
reduce the amount of salt needed for typical parking lot winter maintenance operations.
Analyses of snow and ice cover, skid resistance, and recoverable chloride mass are used
2
to quantify the effectiveness of varying salting rates and to present recommendations for
adequate maintenance. In order to provide a basis for interpretation, results are directly
compared to an adjacent impermeable asphalt parking lot.
The second paper is a continuation of the first but with the majority of the
research taking place in the 2007-2008 winter season. The study is expanded to include
pervious concrete pavement in addition to porous asphalt and dense-mix asphalt. Results
from analyses similar to those in Chapter 2 are presented, in addition to measurements of
frost penetration, surface infiltration capacity, and chloride retention. Comparisons are
made to assess the overall winter performance of the different parking lot materials.
Chapter 4 of this document consists of an analysis of design, construction, and
material costs of the three pavements. Material and project costs are presented as both
total costs and costs per unit area, weight, and volume. Supplementary supporting tables
and figures for all chapters are presented in the Appendices.
3
CHAPTER 2
A WINTER PERFORMANCE ASSESSMENT OF POROUS ASPHALT AND ITS FUNCTION FOR CHLORIDE SOURCE CONTROL
Abstract
This study examined the effectiveness of using reduced salting strategies on a
porous asphalt parking lot compared with a standard dense-mix asphalt lot. Chloride is
an integral component of winter maintenance and safe usage of transportation surfaces.
Anti-icing and deicing is routinely needed to control both ice development caused by the
pooling and freezing of meltwater and the accumulation of compacted snow and ice not
removed by standard winter maintenance procedures (plowing). Chloride laden runoff
from impervious surfaces threaten aquatic habitat and degrade drinking water supplies.
Research at the University of New Hampshire Stormwater Center has identified parking
lot runoff with chloride concentrations in excess of 5,000 mg/L over extended periods
annually, exceeding regulatory standards. No existing stormwater management
technology is designed to reduce chloride, leaving source control or deicing substitutes as
the only viable chloride best management practices. This study identified porous asphalt
as a potential strategy for minimizing the use of deicing chemicals for winter
maintenance. Following de-icing, excess salt crystals remained on the porous pavement
for longer durations and in greater amounts than the standard asphalt. Analyses quantify
snow and ice cover, skid resistance, recoverable chloride mass, and effective salt loads.
4
Results demonstrate that porous asphalt requires considerably less salt for winter
maintenance than standard asphalt. The lack of standing water on porous asphalt greatly
reduces the frequency and mass of salt applications needed during winter precipitation or
freeze-thaw periods. The annual median snow/ice surface cover amounts on the DMA lot
were at least three times greater than on the PA lot. On an event basis, snow/ice surface
cover on the PA was lower 60% of the time and equal 12% of the time. The low amounts
of snow and ice cover and a higher exhibited skid resistance contributed to a 77%
reduction in annual salt load for porous asphalt.
Introduction
For as many as six months out of a year, transportation surfaces in much of New
England require winter maintenance operations that emphasize deicing by means of
chemical treatment (road salt). Typically, the objective is to provide high levels of safety
on trafficked (vehicle and pedestrian) surfaces during winter weather conditions
consisting of periods of snow, ice, and/or freezing rain. The common strategy for
treatment of roadways and parking lots often involves wide-spread application of salt
(NaCl). Salt is effective as a deicing agent on impermeable surfaces because it melts
through the snow or ice and forms a layer of highly saline water (brine) that melts the
surrounding ice (Trost et al., 1987). Furthermore, the brine coats the pavement surface
impeding ice development and delaying additional snow accumulation. One of the major
problems with this strategy is the potential impact on freshwater resources. When salt
crystals are applied to paved surfaces and react with the snow and ice, they tend to
dissociates into sodium (Na+) and chloride (Cl-) ions. Chloride can contaminate
5
receiving water bodies and groundwater supplies through runoff or by infiltrating
underlying aquifers (Wegner & Yaggi, 2001). At the University of New Hampshire
Stormwater Center (UNHSC), chloride concentrations from a nine-acre, impervious
parking lot that is subjected to standard winter maintenance practices have been measured
as high as 5,000 mg/L (Avellaneda, 2005). Monitoring of a first-order receiving stream
in Durham, NH has identified chloride levels that regularly exceed regulatory standards
(Houle, 2007). Chronic exposure levels for chloride are not to exceed 230 mg/L for a 96
hour period more than once every three years on average, while acute exposure levels
must not exceed 860 mg/L for a one hour period more than once every three years on
average (U.S. EPA, 1988). Similar conditions have been observed in southern New
Hampshire and have fueled the implementation chloride TMDLs (Total Maximum Daily
Loads) for four different watersheds. These TMDLs state that each stream flow in the
four-day-average flow duration curve should not exhibit chloride concentrations
exceeding 207 mg Cl per liter, or 90 percent of the regulatory chronic exposure level
(Trowbridge, 2007a, 2007b).
One of the easiest, cost-effective, and most practical methods for minimizing
potential chloride contamination is through source control of deicing constituents (i.e.
using fewer chemicals). This study examines the effectiveness of reduced salt
application rates on a porous asphalt parking lot. Conclusions are made by directly
comparing the results to similar data collected on an adjacent standard dense-mix asphalt
lot. Both qualitative and quantitative analyses were used to evaluate the different
strategies.
6
Background
Porous asphalt was first developed in the 1970s. It differs from standard dense-
mix asphalt in that the ‘fines’ (particles smaller than 600 microns) are removed from the
aggregate mix, thereby allowing the formation of pores for water to pass (Cahill et al.,
2003; Ferguson, 2005). In reference to cold climates, sources have reported that porous
asphalt appears to become free of ice and snow quicker than standard pavement. One
such observation specifically documented the lack of ice formation that is common in
‘freeze-thaw’ climates (MacDonald, 2006). Similar assessments were made at the
UNHSC facility prior to this study, but were only confirmed anecdotally.
Site Description
This study was performed at the University of New Hampshire Durham campus.
The porous asphalt (PA) site is located along the eastern perimeter of a nine-acre
commuter parking lot (West Edge Lot), but is hydrologically isolated from the rest of the
parking area. The PA lot is approximately 4,500-ft2 and contains 17 parking spaces.
Immediately adjacent, but also hydrologically separated, is an identically-sized, standard
dense-mix asphalt (DMA) lot. This DMA lot was used as the control with which to
compare the porous asphalt data.
The winter climate (January through March) in Durham, NH generally consists of
average temperatures near 27.7 ºF, with maximum and minimum temperature of 37.5 ºF
and 17.3 ºF, respectively. Total precipitation during this time period is approximately
16.4 inches and snowfall is around 63.1 inches (NHSCO, 2008).
7
Methodology
Frost Depth Penetration
It has been documented in literature that the temperature of porous asphalt can be
governed mainly by ambient air temperature, which in some cases may lower the
temperature of PA faster than that of standard impermeable pavement (Noort, 1996; Shao
et al., 1994). However, research has also demonstrated that porous asphalt may be more
resistant to freezing due to high water content in the sub-base and associated latent heat
levels (Backstrom, 2000). To evaluate this phenomena frost depth penetration within the
porous asphalt system was measured using a “field assembled frost gage” (Ricard et al.,
1976) installed in a screened, PVC groundwater monitoring well. Frost depth was
determined by measuring the depth of frozen water-methylene blue solution. Frost depth
and air temperature were recorded regularly over the 2006-2007 winter season.
Surface Infiltration Capacity
As a measure of PA hydraulic performance, the surface infiltration capacity was
measured on a near-monthly basis since installation. The test performed was a
modification of a falling head surface inundation (SI) test as explained by Bean (2004).
It involved placing a cylinder of known diameter onto the pavement surface and sealing
the edge with pliable foam. The ring was situated within a square, plywood base which
provided a small platform for loading weights in order to improve the pavement seal to
the equipment. Water was poured into the cylinder up to a predetermined depth and
volume and the time required for all the water to enter the pavement was recorded
(Briggs, 2006). The result was a rate in length per time of the surface infiltration capacity
(IC) of the pavement surface.
8
Three randomly selected locations (A, B, & C) within the 4,500-ft2 surface were
tested beginning in November 2004. Location C near the entrance of the site exhibited an
infiltration rate that was too slow to be accurately represented by the SI test; leakage
during the test was common. In response to this problem, a double-ring infiltrometer
(DRI) test was utilized for this location (Briggs, 2006). The DRI test is a constant-head
test that is typically used for measuring infiltration rates of soils. It can provide more
representative results than the SI test due to dual columns of infiltrating water (Bean,
2004). The method used followed ASTM Standard D 3385-03. SI data is presented from
2004 to 2008 in order to more clearly demonstrate long-term variations.
Salt Application
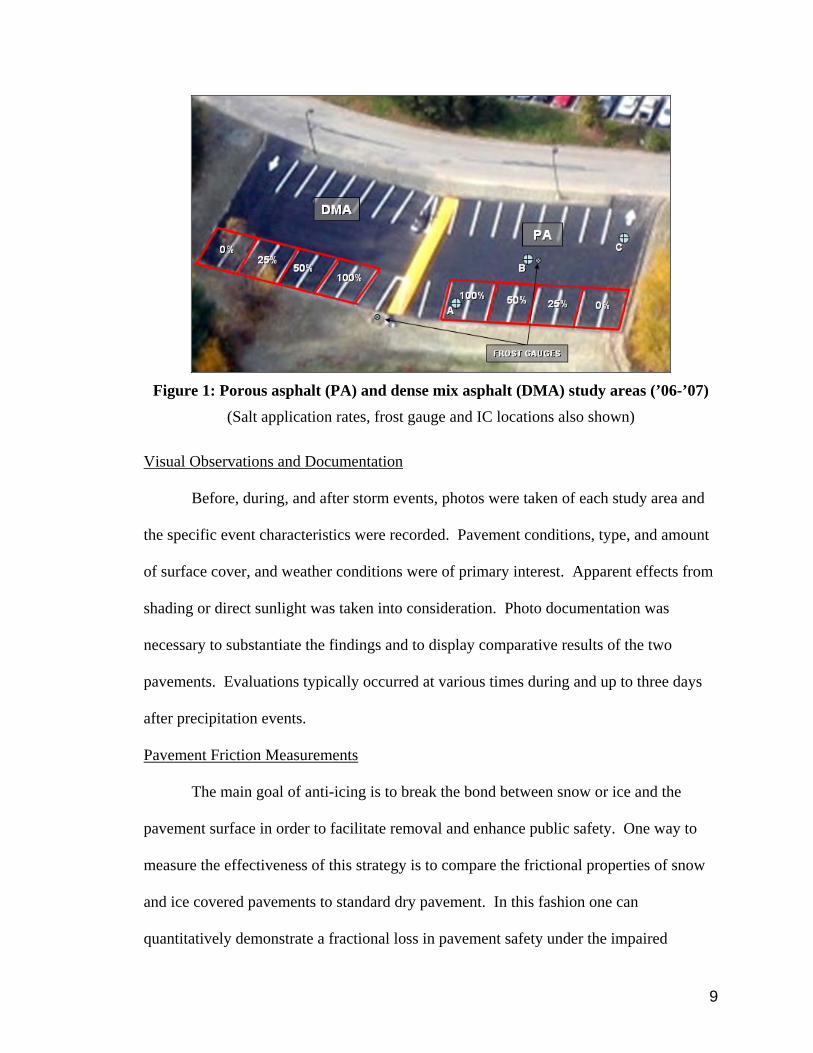
The PA and DMA lots were both divided into four equally-sized areas (Figure 1),
each to receive a different salt application rate. Rates applied were 100%, 50%, 25%,
and 0% (as a control) of the recommended standard of practice rate of 3.0-lbs per 1000-
ft2 of application area (MPCA, 2006). The method for applying salt was designed to
mimic municipal anti-icing and de-icing strategies by applying salt prior to and
immediately following (as needed) winter precipitation events. The salt used in the study
was standard rock salt with less than 10% added fines by mass; it was taken from the
stockpile at the UNH Grounds & Roads Department.
9
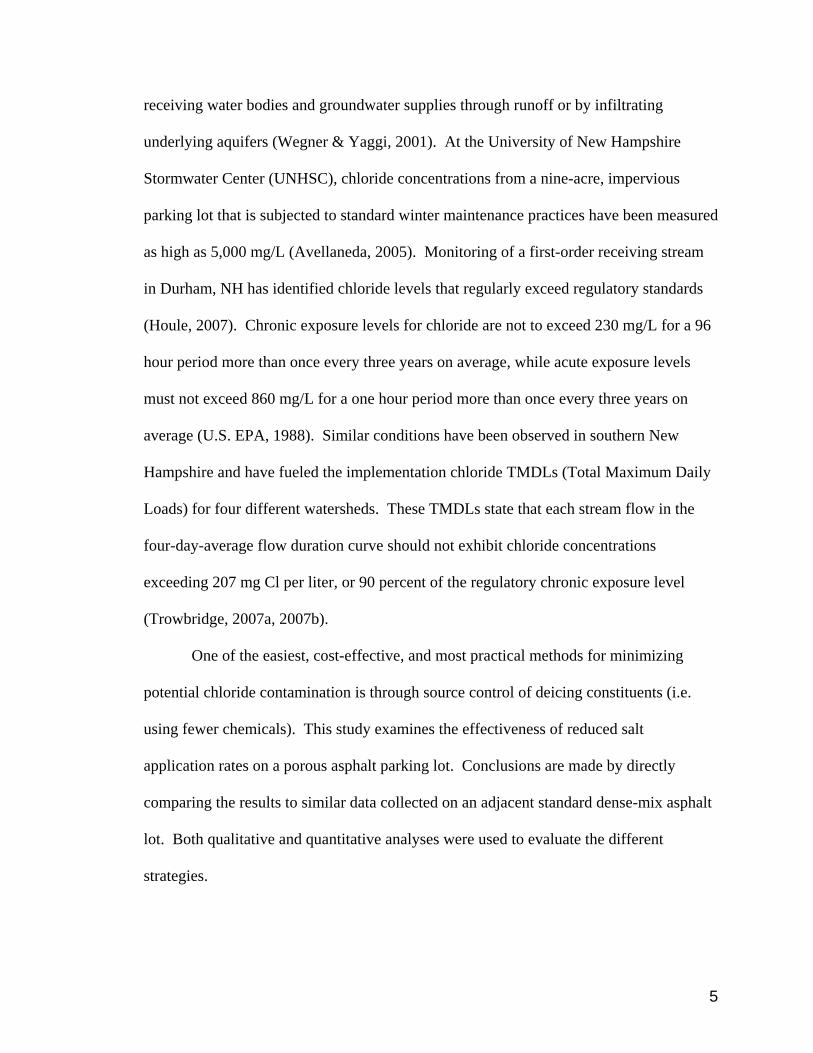
Figure 1: Porous asphalt (PA) and dense mix asphalt (DMA) study areas (’06-’07)
(Salt application rates, frost gauge and IC locations also shown)
Visual Observations and Documentation
Before, during, and after storm events, photos were taken of each study area and
the specific event characteristics were recorded. Pavement conditions, type, and amount
of surface cover, and weather conditions were of primary interest. Apparent effects from
shading or direct sunlight was taken into consideration. Photo documentation was
necessary to substantiate the findings and to display comparative results of the two
pavements. Evaluations typically occurred at various times during and up to three days
after precipitation events.
Pavement Friction Measurements
The main goal of anti-icing is to break the bond between snow or ice and the
pavement surface in order to facilitate removal and enhance public safety. One way to
measure the effectiveness of this strategy is to compare the frictional properties of snow
and ice covered pavements to standard dry pavement. In this fashion one can
quantitatively demonstrate a fractional loss in pavement safety under the impaired
10
conditions. Pavement frictional measurements were performed in this study using a
Munro Stanley London British Pendulum Skid Resistance Tester.
The British Pendulum Tester (BPT) is a dynamic pendulum impact device used to
measure the energy loss by a rubber slider edge swung over a test surface (ASTM, 2004).
It produces a skid resistance number, or British Pendulum Number (BPN), ranging from
0 to 150, and can be related to pavement coefficient of friction by dividing by 100
(Munro Environmental, 2007). The higher the frictional resistance of the surface, the
greater the resulting BPN. The method used for operating the BPT followed ASTM
Standard E 303–93.
Skid resistance measurements were taken at various locations within each study
area, repeated five times, and seasonally averaged in order to characterize the variability
in friction between each type of pavement cover (ice, snow, wet, and dry). The mean
values were then multiplied by their respective surface cover type percentages in order to
develop a weighted skid resistance value for each observation. The significance of the
weighted skid resistance value was to obtain a number that can easily be related to safety
for each of the varying salt application rates.
Chloride Recovery
Past observations at the UNH Stormwater Center concluded that after winter
storm events, salt would often remain on the surface of the PA longer than on the DMA.
To corroborate this claim, residual salt mass was recovered from parking stalls on both
pavements and measured. These parking stalls were coned-off to prevent vehicle
tracking of salt in order to maintain a consistent treatment rate in the observation areas.
A portable wet/dry vacuum was used for recovering the undissolved salt mass. The
11
method was sufficient at capturing much of the particles that remained on or, in the case
of PA, near the pavement surface.
The recovered mass, which also contained sediments and other parking lot debris,
was diluted with 500-mL of warm, deionized water (DI), and mixed on a stir plate for
approximately 1.5-minutes. The mixing time was found sufficient for dissolving all
recoverable salt crystals. Specific conductivity (SC) readings were taken on each sample
with a portable YSI 556 MPS water quality meter. The chloride mass per sample was
calculated using a chloride concentration regression equation that was developed for the
West Edge parking lot in 2005 (Avellaneda).
Statistical Comparison Methods
A ‘Student’s t’ means comparison test was employed for all portions of this study
that include statistical assessment. These analyses include surface infiltration capacity,
snow & ice cover, and skid resistance. The Student’s t-test is a test to determine
differences in central location (mean) for two independent groups (Helsel and Hirsh,
2002). Group comparisons with p-values less than 0.05 (with a 95% confidence interval)
were deemed statistically different.
Results and Discussion
Frost Depth Penetration
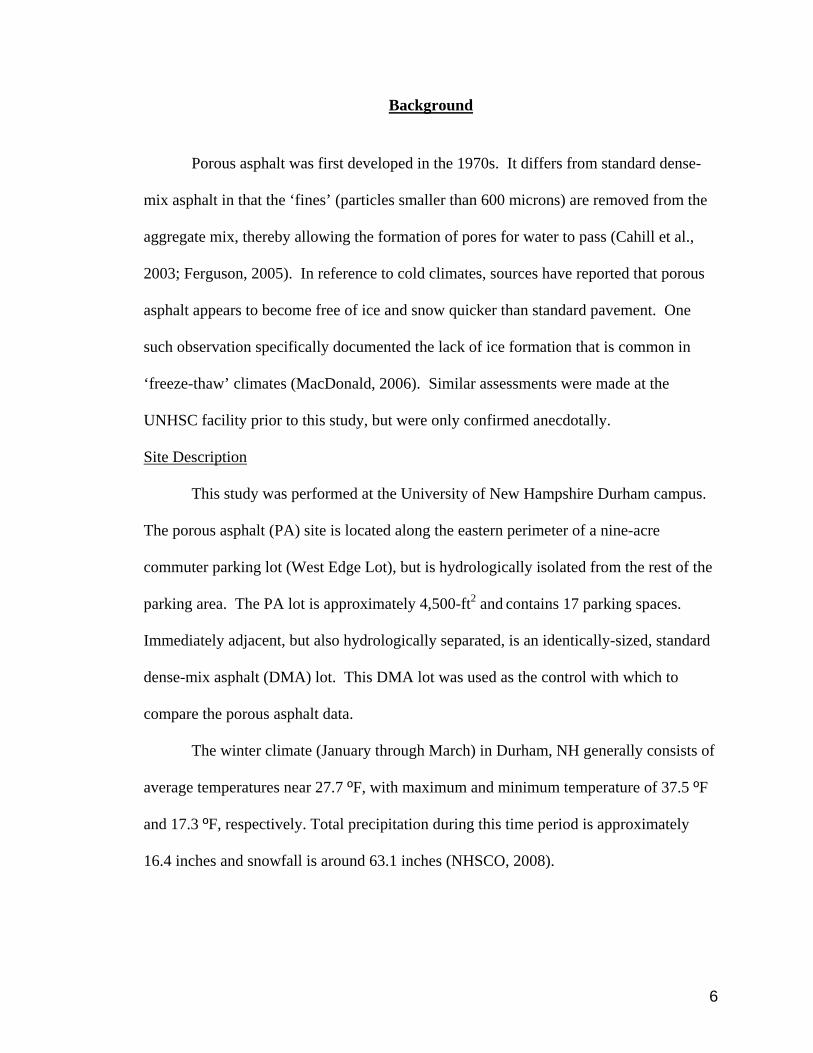
Frost depth penetration from November 2006 to April 2007 within the porous
asphalt system is presented in Figure 2. It is plotted against frost depth observed at a
reference location and average daily air temperature (on a reverse axis). The reference
location for this study was a nearby tree-filter stormwater treatment unit that consisted of
12
a typical bioretention soil-mix. The maximum frost penetration within the PA was
approximately equal to the depth measured at the reference location; 27.25-inches to
27.5-inches, respectively, demonstrating that porous asphalt can exhibit comparable frost
penetration to soil or other existing stormwater BMPs, even with several inches of open-
graded surface material. Conversely, the data shows that frost depth in PA is highly
influenced by air temperature and abrupt changes in the temperature are quickly reflected
within the system. On 1/17/07, the average air temperature dropped to 7.1 ºF and the PA
frost penetration reached about ten inches one day later, while the reference site only
increased to four inches. A greater frost depth in the PA was observed until the systems
equalized around 1/31/07. These frost depths remained nearly equal until the PA rapidly
thawed in early March, approximately two-weeks prior to the reference location.
Backstrom (2000) observed rapid thawing in a porous asphalt parking lot studied in
Sweden and hypothesized that it was due to latent heat and energy content of infiltrated
water and convection of air through the asphalt pores. The thawing of the UNHSC PA
lot also correlated with two March rain events on 3/2/07 and 3/11/07. The rapid thawing
of the PA is a significant finding given that much skepticism over the use of porous
asphalt exists concerning its durability in ‘freeze-thaw’ climatic conditions. If the system
is thawing weeks earlier than expected, much of the “problematic” freeze-thaw time
period is reduced, helping to decrease the risk of pavement failure. In addition, it should
be noted that after four winters of observation (2004-2008), no noticeable heaving of the
porous asphalt surface has been witnessed. Finally, when the porous asphalt freezes, it
becomes a frozen porous media that possesses an extremely high infiltration rate. If and
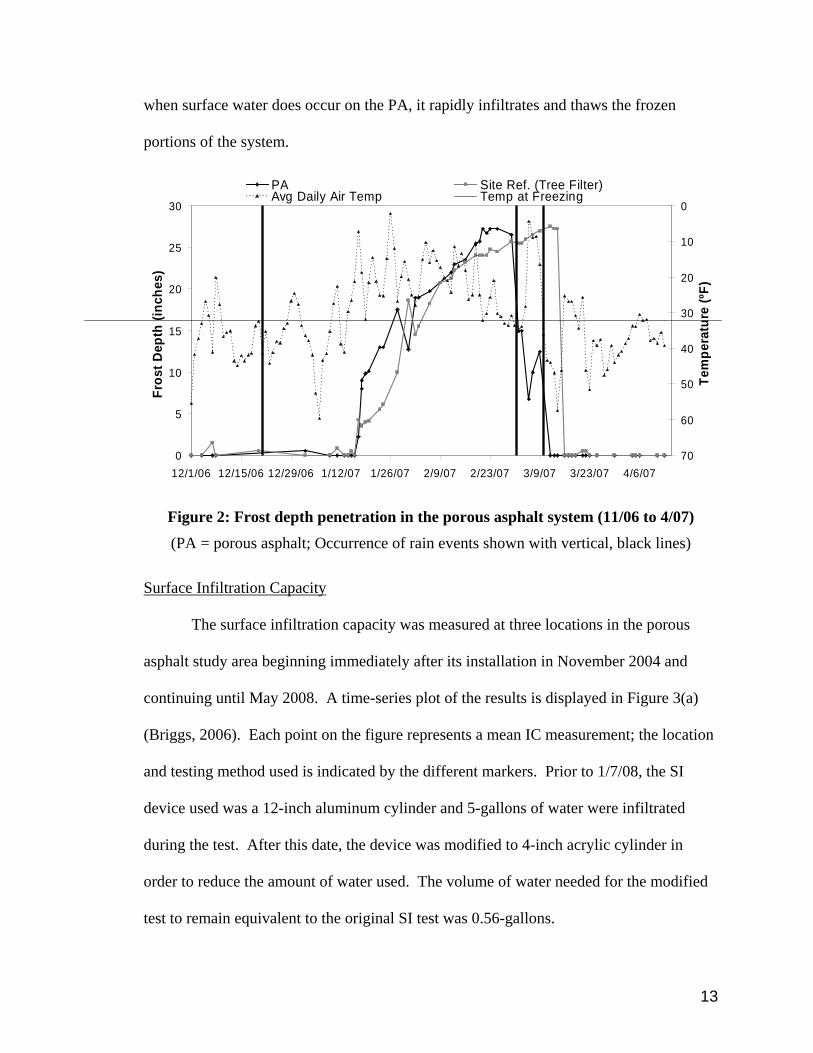
13
when surface water does occur on the PA, it rapidly infiltrates and thaws the frozen
portions of the system.
Figure 2: Frost depth penetration in the porous asphalt system (11/06 to 4/07) (PA = porous asphalt; Occurrence of rain events shown with vertical, black lines)
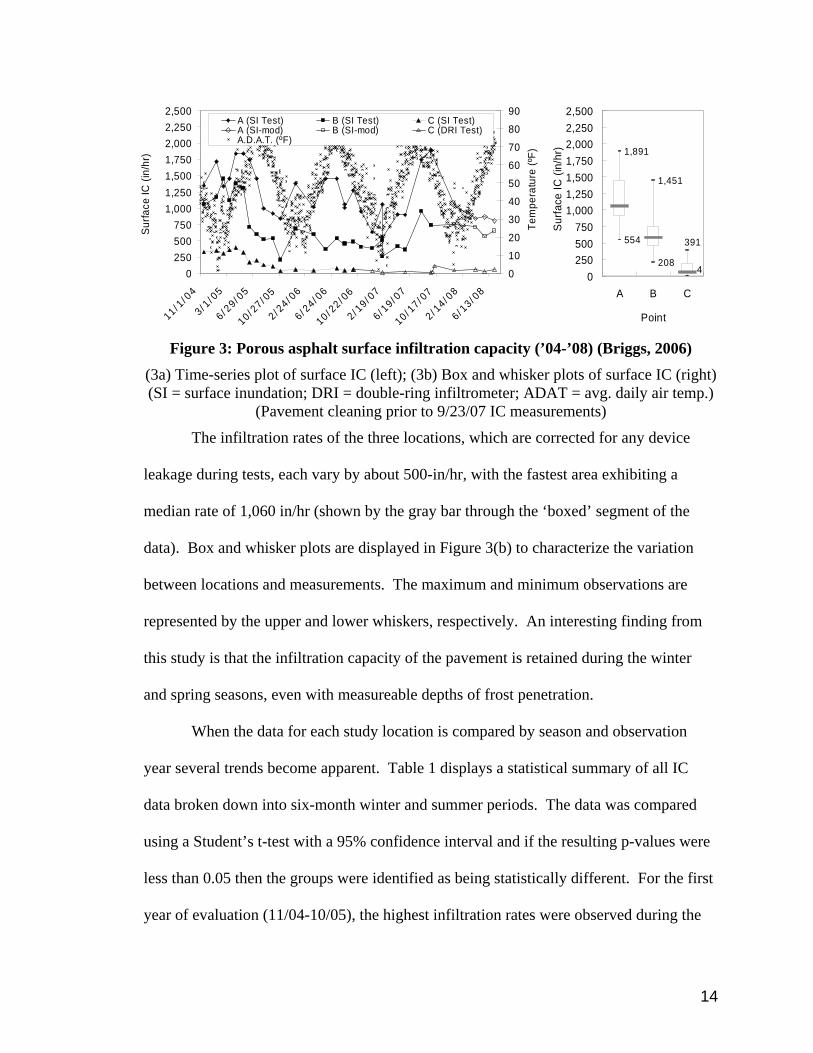
Surface Infiltration Capacity
The surface infiltration capacity was measured at three locations in the porous
asphalt study area beginning immediately after its installation in November 2004 and
continuing until May 2008. A time-series plot of the results is displayed in Figure 3(a)
(Briggs, 2006). Each point on the figure represents a mean IC measurement; the location
and testing method used is indicated by the different markers. Prior to 1/7/08, the SI
device used was a 12-inch aluminum cylinder and 5-gallons of water were infiltrated
during the test. After this date, the device was modified to 4-inch acrylic cylinder in
order to reduce the amount of water used. The volume of water needed for the modified
test to remain equivalent to the original SI test was 0.56-gallons.
0
5
10
15
20
25
30
12/1/06 12/15/06 12/29/06 1/12/07 1/26/07 2/9/07 2/23/07 3/9/07 3/23/07 4/6/07
Fros
t Dep
th (i
nche
s)
0
10
20
30
40
50
60
70
Tem
pera
ture
(ºF)
PA Site Ref. (Tree Filter)Avg Daily Air Temp Temp at Freezing
14
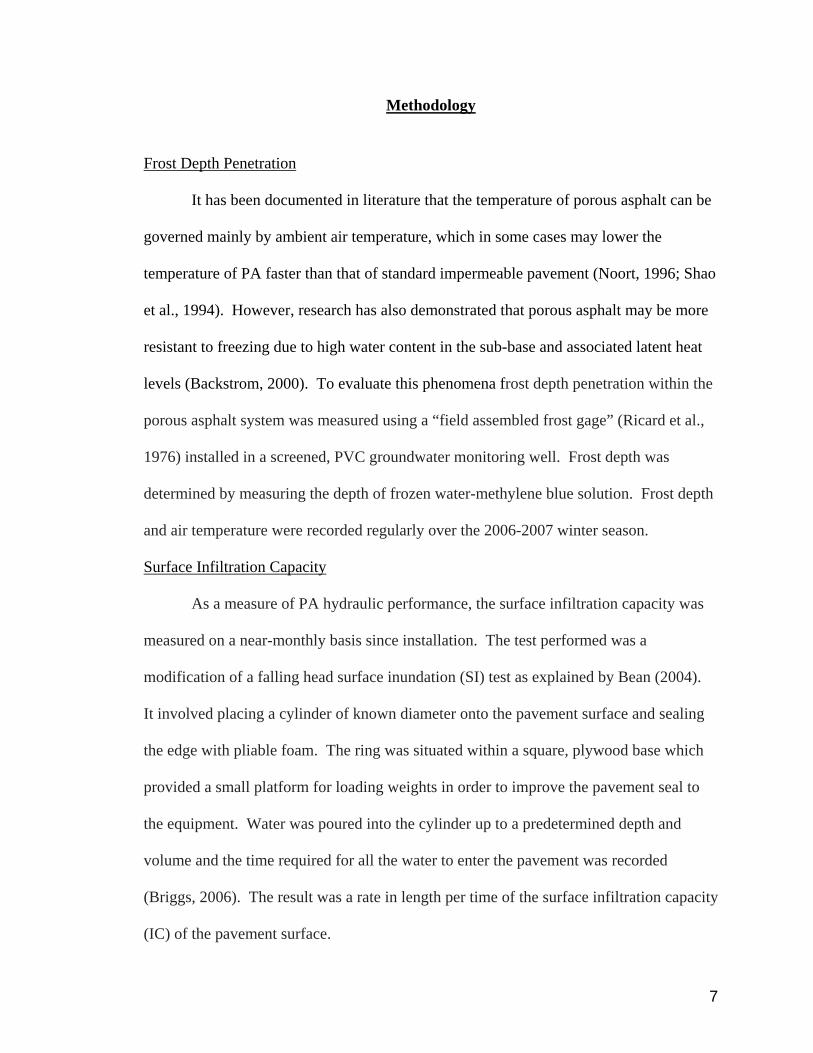
Figure 3: Porous asphalt surface infiltration capacity (’04-’08) (Briggs, 2006)
(3a) Time-series plot of surface IC (left); (3b) Box and whisker plots of surface IC (right) (SI = surface inundation; DRI = double-ring infiltrometer; ADAT = avg. daily air temp.)
(Pavement cleaning prior to 9/23/07 IC measurements)
The infiltration rates of the three locations, which are corrected for any device
leakage during tests, each vary by about 500-in/hr, with the fastest area exhibiting a
median rate of 1,060 in/hr (shown by the gray bar through the ‘boxed’ segment of the
data). Box and whisker plots are displayed in Figure 3(b) to characterize the variation
between locations and measurements. The maximum and minimum observations are
represented by the upper and lower whiskers, respectively. An interesting finding from
this study is that the infiltration capacity of the pavement is retained during the winter
and spring seasons, even with measureable depths of frost penetration.
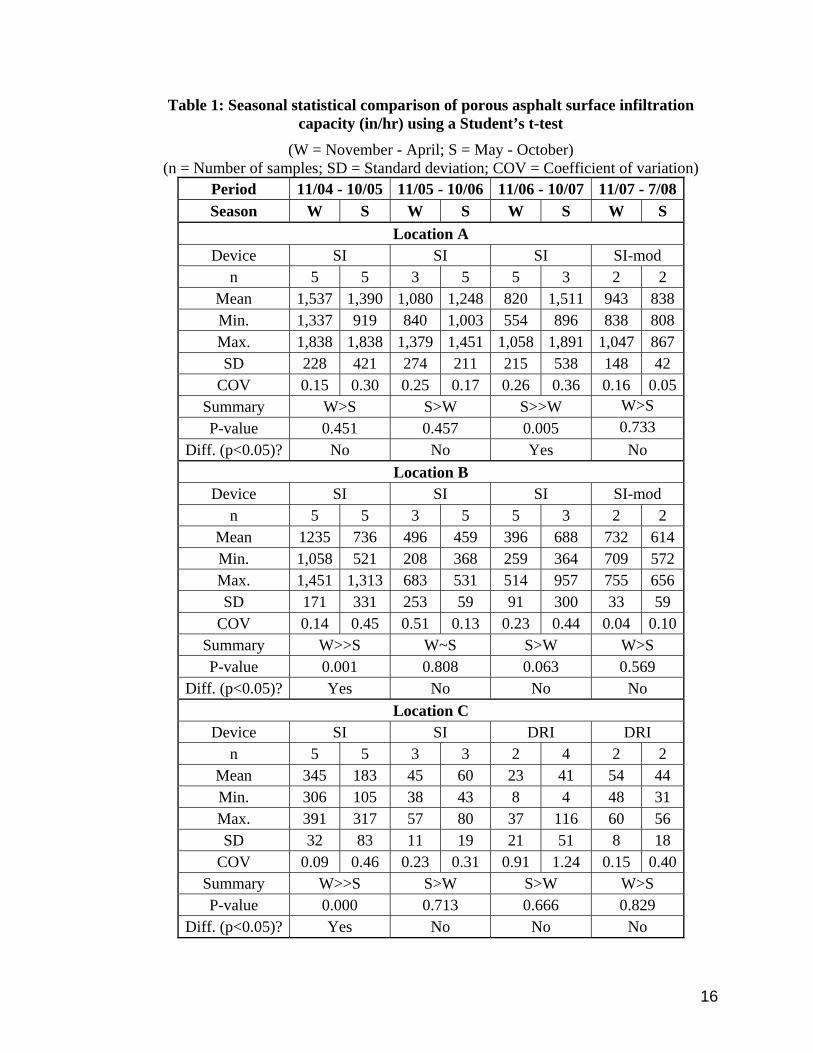
When the data for each study location is compared by season and observation
year several trends become apparent. Table 1 displays a statistical summary of all IC
data broken down into six-month winter and summer periods. The data was compared
using a Student’s t-test with a 95% confidence interval and if the resulting p-values were
less than 0.05 then the groups were identified as being statistically different. For the first
year of evaluation (11/04-10/05), the highest infiltration rates were observed during the
0250500750
1,0001,2501,5001,7502,0002,2502,500
11/1/0
4
3/1/0
5
6/29/0
5
10/27/0
5
2/24/0
6
6/24/0
6
10/22/0
6
2/19/0
7
6/19/0
7
10/17/0
7
2/14/0
8
6/13/0
8
Surfa
ce IC
(in/
hr)
0
10
20
30
40
50
60
70
80
90
Tem
pera
ture
(ºF)
A (SI Test) B (SI Test) C (SI Test)A (SI-mod) B (SI-mod) C (DRI Test)A.D.A.T. (ºF)
554
208
1,891
1,451
4
391
0250500750
1,0001,2501,5001,7502,0002,2502,500
A B C
Point
Surfa
ce IC
(in/
hr)
15
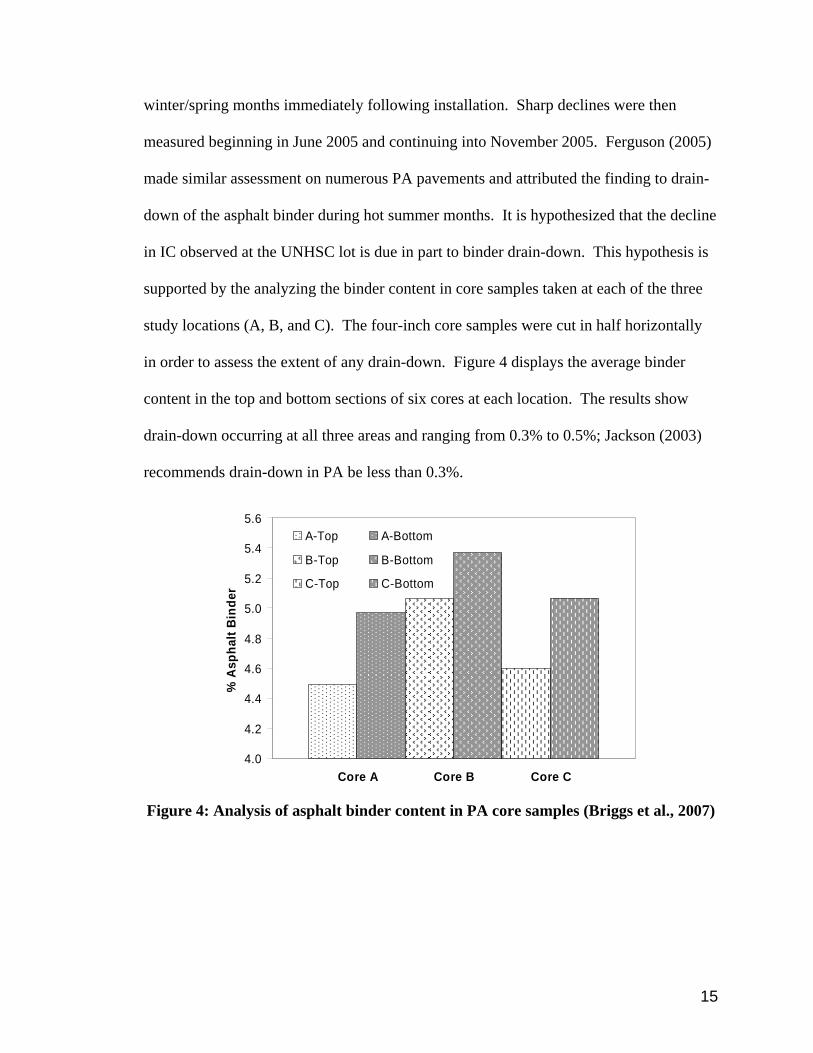
winter/spring months immediately following installation. Sharp declines were then
measured beginning in June 2005 and continuing into November 2005. Ferguson (2005)
made similar assessment on numerous PA pavements and attributed the finding to drain-
down of the asphalt binder during hot summer months. It is hypothesized that the decline
in IC observed at the UNHSC lot is due in part to binder drain-down. This hypothesis is
supported by the analyzing the binder content in core samples taken at each of the three
study locations (A, B, and C). The four-inch core samples were cut in half horizontally
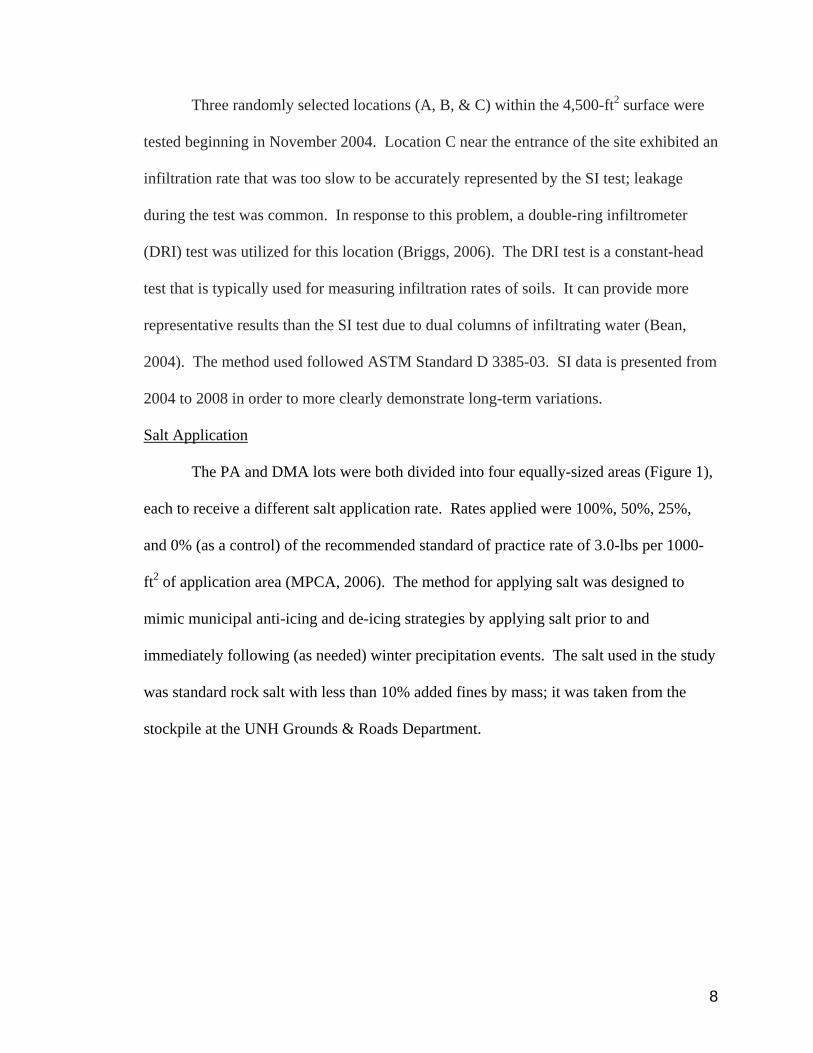
in order to assess the extent of any drain-down. Figure 4 displays the average binder
content in the top and bottom sections of six cores at each location. The results show
drain-down occurring at all three areas and ranging from 0.3% to 0.5%; Jackson (2003)
recommends drain-down in PA be less than 0.3%.
4.0
4.2
4.4
4.6
4.8
5.0
5.2
5.4
5.6
1
% A
spha
lt B
inde
r
A-Top A-Bottom
B-Top B-Bottom
C-Top C-Bottom
Core A Core C Core B
Figure 4: Analysis of asphalt binder content in PA core samples (Briggs et al., 2007)
16
Table 1: Seasonal statistical comparison of porous asphalt surface infiltration capacity (in/hr) using a Student’s t-test
(W = November - April; S = May - October) (n = Number of samples; SD = Standard deviation; COV = Coefficient of variation)
Period 11/04 - 10/05 11/05 - 10/06 11/06 - 10/07 11/07 - 7/08Season W S W S W S W S
Location A Device SI SI SI SI-mod
n 5 5 3 5 5 3 2 2 Mean 1,537 1,390 1,080 1,248 820 1,511 943 838 Min. 1,337 919 840 1,003 554 896 838 808 Max. 1,838 1,838 1,379 1,451 1,058 1,891 1,047 867 SD 228 421 274 211 215 538 148 42
COV 0.15 0.30 0.25 0.17 0.26 0.36 0.16 0.05Summary W>S S>W S>>W W>S P-value 0.451 0.457 0.005 0.733
Diff. (p<0.05)? No No Yes No Location B
Device SI SI SI SI-mod n 5 5 3 5 5 3 2 2
Mean 1235 736 496 459 396 688 732 614 Min. 1,058 521 208 368 259 364 709 572 Max. 1,451 1,313 683 531 514 957 755 656 SD 171 331 253 59 91 300 33 59
COV 0.14 0.45 0.51 0.13 0.23 0.44 0.04 0.10Summary W>>S W~S S>W W>S P-value 0.001 0.808 0.063 0.569
Diff. (p<0.05)? Yes No No No Location C
Device SI SI DRI DRI n 5 5 3 3 2 4 2 2
Mean 345 183 45 60 23 41 54 44 Min. 306 105 38 43 8 4 48 31 Max. 391 317 57 80 37 116 60 56 SD 32 83 11 19 21 51 8 18
COV 0.09 0.46 0.23 0.31 0.91 1.24 0.15 0.40Summary W>>S S>W S>W W>S P-value 0.000 0.713 0.666 0.829
Diff. (p<0.05)? Yes No No No
17
It is hypothesized that the majority of the asphalt drain-down occurred during the
first summer after installation but then stabilized contributing to long-term conditions that
appear to be correlated with the cyclical trend of average daily air temperature
(A.D.A.T.) (Figure 3). Several laboratory studies have suggested that the IC of porous
asphalt may decline by about 50% in below-freezing temperatures but will remain
sufficient as long as the pavement is not completely covered with ice or clogged by sand
(Stenmark, 1995; Backstrom and Bergstrom, 2000). Declining infiltration rates from
measurements on 2/12/07 to 2/13/07 demonstrate the effect of air temperature on IC.
During this time, the A.D.A.T. decreased by 13ºF and the IC decreased by about 50% at
locations A and B. The apparent correlation of IC with air temperature continued until
April 2008 when the IC rates at locations A and B stabilized around 850-in/hr and 650-
in/hr, respectively. This final trend change may be due in part to the modification of the
SI testing device.
In addition to possible binder drain-down, the low-infiltrating area at Point C may
be the result of several other factors. It is known that the area was compacted more
during construction than Points A or B and therefore possessed the lowest infiltration rate
for the lot since this time. Secondly, it is located approximately five-feet from one of the
main driving lanes in the main DMA West Edge parking lot so it is likely that sediments
and other debris from local winter sanding operations was continually blown or tracked
onto the area. Points A and B are more representative of the typical infiltration capacity
of the entire PA lot; Point C can be considered an anomaly.
It should also be noted that since its construction and throughout the duration of
this study, vacuum maintenance of this PA lot occurred only once on 9/22/07 and was
18
completed with a combination of an Elgin Whirlwind MV ‘sweeper-vac’ and a Billy
Goat yard vacuum. This treatment may have contributed to the increases in IC at
locations A and C between the 8/10/07 and 9/23/07 measurements. The only other
vacuuming to occur was with a low pressure utility vacuum used to collect salt at
locations where IC rates where not measured, therefore having no impact on the surface
infiltration data.
Winter Storm Event Characteristics
For all analyses of winter performance, one season of precipitation events were
evaluated. The types of observed storms consisted of light to heavy snowfall, sleet,
freezing rain, rain, and various combinations of each, with air temperatures ranging
between -2ºF to 70ºF (UNHWS, 2008). A summary of weather conditions for each event
occurring in the present study is displayed in Table 2. Also shown at the bottom of the
table are monthly average weather statistics for Durham, NH (NHSCO, 2008).
19
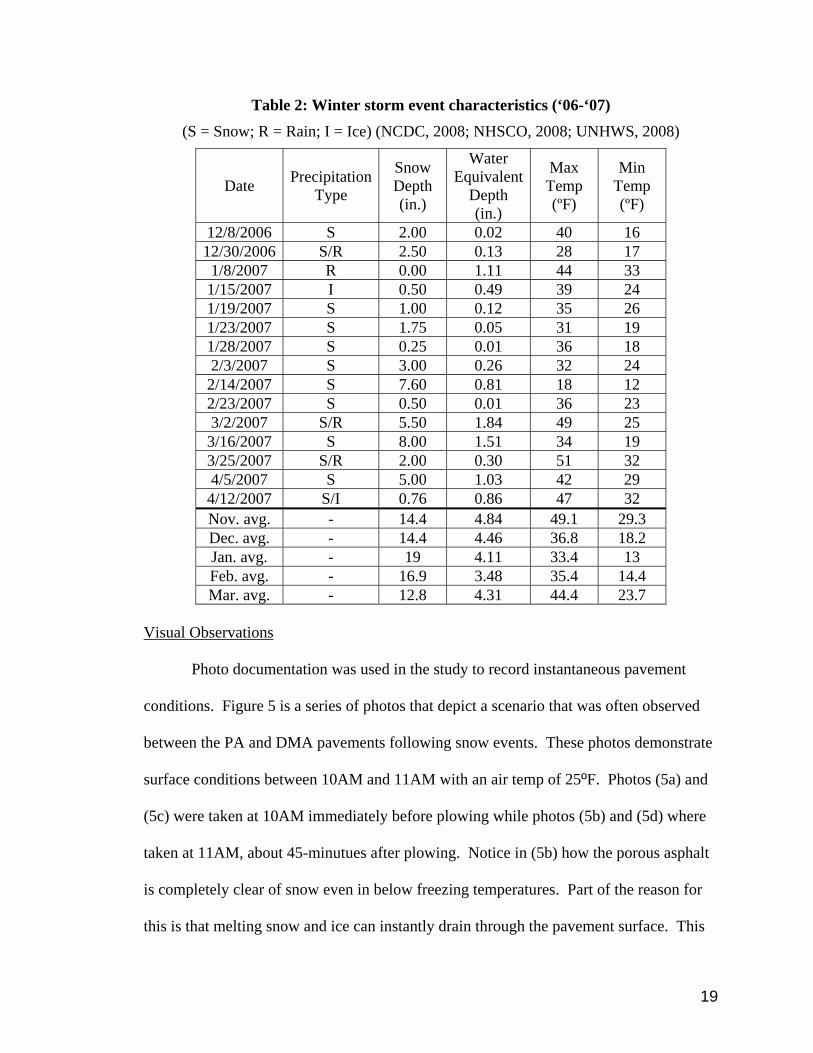
Table 2: Winter storm event characteristics (‘06-‘07) (S = Snow; R = Rain; I = Ice) (NCDC, 2008; NHSCO, 2008; UNHWS, 2008)
Date Precipitation Type
Snow Depth (in.)
Water Equivalent
Depth (in.)
Max Temp (ºF)
Min Temp (ºF)
12/8/2006 S 2.00 0.02 40 16 12/30/2006 S/R 2.50 0.13 28 17
1/8/2007 R 0.00 1.11 44 33 1/15/2007 I 0.50 0.49 39 24 1/19/2007 S 1.00 0.12 35 26 1/23/2007 S 1.75 0.05 31 19 1/28/2007 S 0.25 0.01 36 18 2/3/2007 S 3.00 0.26 32 24
2/14/2007 S 7.60 0.81 18 12 2/23/2007 S 0.50 0.01 36 23 3/2/2007 S/R 5.50 1.84 49 25
3/16/2007 S 8.00 1.51 34 19 3/25/2007 S/R 2.00 0.30 51 32 4/5/2007 S 5.00 1.03 42 29
4/12/2007 S/I 0.76 0.86 47 32 Nov. avg. - 14.4 4.84 49.1 29.3 Dec. avg. - 14.4 4.46 36.8 18.2 Jan. avg. - 19 4.11 33.4 13 Feb. avg. - 16.9 3.48 35.4 14.4 Mar. avg. - 12.8 4.31 44.4 23.7
Visual Observations
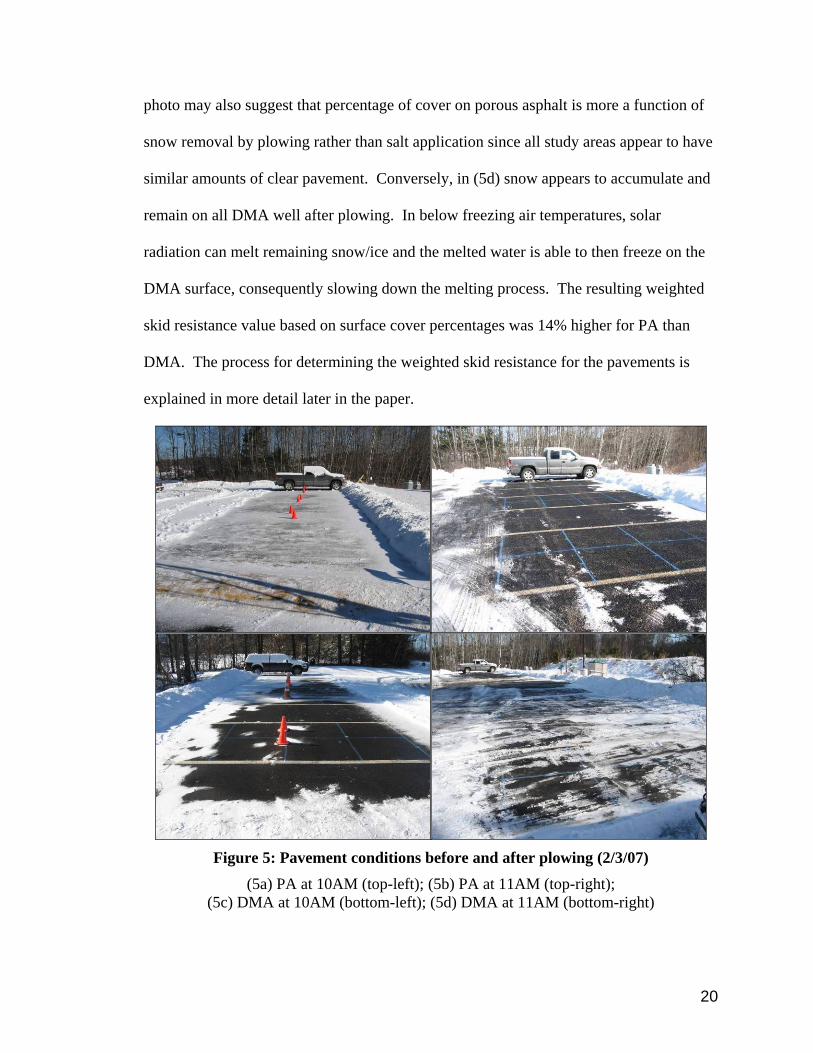
Photo documentation was used in the study to record instantaneous pavement
conditions. Figure 5 is a series of photos that depict a scenario that was often observed
between the PA and DMA pavements following snow events. These photos demonstrate
surface conditions between 10AM and 11AM with an air temp of 25ºF. Photos (5a) and
(5c) were taken at 10AM immediately before plowing while photos (5b) and (5d) where
taken at 11AM, about 45-minutues after plowing. Notice in (5b) how the porous asphalt
is completely clear of snow even in below freezing temperatures. Part of the reason for
this is that melting snow and ice can instantly drain through the pavement surface. This
20
photo may also suggest that percentage of cover on porous asphalt is more a function of
snow removal by plowing rather than salt application since all study areas appear to have
similar amounts of clear pavement. Conversely, in (5d) snow appears to accumulate and
remain on all DMA well after plowing. In below freezing air temperatures, solar
radiation can melt remaining snow/ice and the melted water is able to then freeze on the
DMA surface, consequently slowing down the melting process. The resulting weighted
skid resistance value based on surface cover percentages was 14% higher for PA than
DMA. The process for determining the weighted skid resistance for the pavements is
explained in more detail later in the paper.
Figure 5: Pavement conditions before and after plowing (2/3/07)
(5a) PA at 10AM (top-left); (5b) PA at 11AM (top-right); (5c) DMA at 10AM (bottom-left); (5d) DMA at 11AM (bottom-right)

21
Figure 6 demonstrates a theme that was commonly observed during cyclical
freezing-thawing conditions. The photos were taken at 9AM, one-day after a snow-
event. Any precipitation that remained on the porous asphalt immediately drained
through the pavement (6a). The opposite was true on the standard asphalt (6b). Melt-
water refroze overnight creating icy conditions that morning. It is common during a New
England winter for salt spreading operations to apply chemical on a near-daily basis to
combat (black) ice formation caused by these conditions. The resulting weighted skid
resistance was 10% higher for the PA than the DMA.
Figure 6: Instantaneous pavement conditions after thawing and refreezing of
meltwater (3/18/07) (6a) PA at 9AM (left); (6b) DMA at 9AM (right)
Snow/Ice Surface Cover Analysis
Quantifying the amount of snow and ice accumulation on the study areas was of
considerable interest for this study. During and after storm events, an evaluation of
surface cover (type and amount) was performed for each varying salt application. Snow
and ice cover was typically significantly lower on PA study areas than was observed on
DMA. Figure 7 presents the snow and ice cover for each of the eight study areas; the
median surface cover percentages are displayed next to each data set. The salt
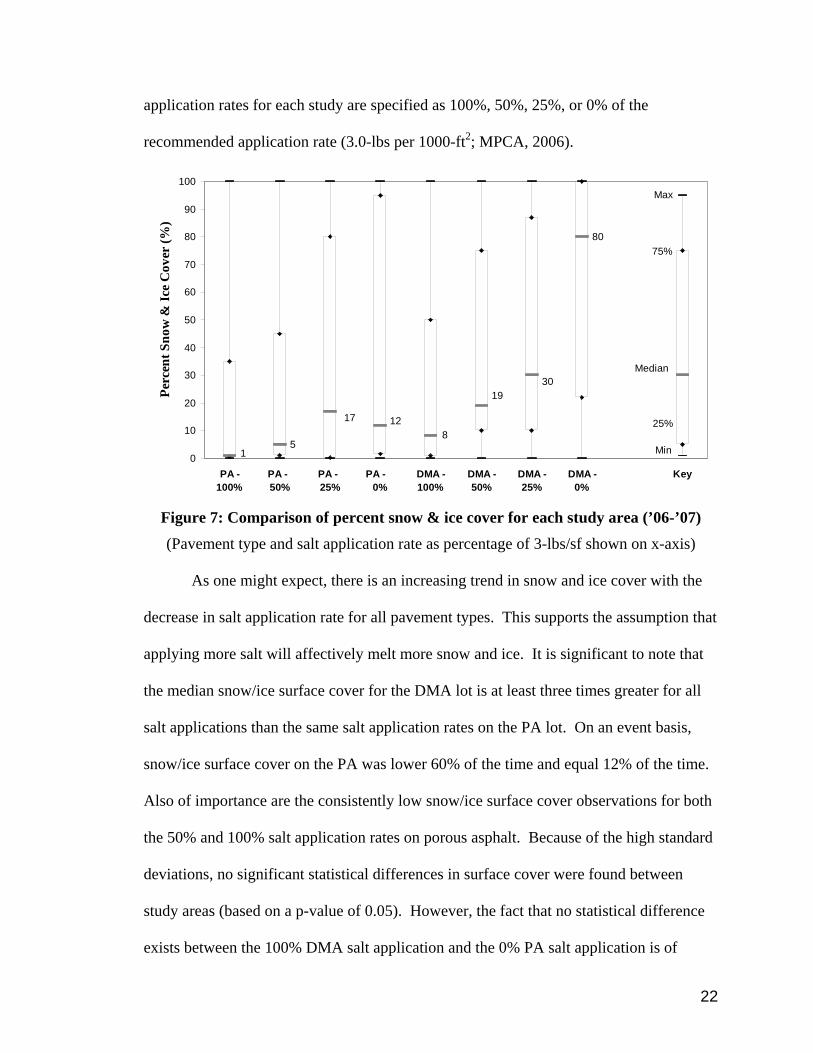
22
application rates for each study are specified as 100%, 50%, 25%, or 0% of the
recommended application rate (3.0-lbs per 1000-ft2; MPCA, 2006).
5
80
25%
Min
30
12
1
19
Median
17
8
Max
75%
0
10
20
30
40
50
60
70
80
90
100
PA -100%
PA - 50%
PA - 25%
PA - 0%
DMA -100%
DMA -50%
DMA -25%
DMA -0%
Key
Perc
ent S
now
& Ic
e C
over
(%)
Figure 7: Comparison of percent snow & ice cover for each study area (’06-’07) (Pavement type and salt application rate as percentage of 3-lbs/sf shown on x-axis)
As one might expect, there is an increasing trend in snow and ice cover with the
decrease in salt application rate for all pavement types. This supports the assumption that
applying more salt will affectively melt more snow and ice. It is significant to note that
the median snow/ice surface cover for the DMA lot is at least three times greater for all
salt applications than the same salt application rates on the PA lot. On an event basis,
snow/ice surface cover on the PA was lower 60% of the time and equal 12% of the time.
Also of importance are the consistently low snow/ice surface cover observations for both
the 50% and 100% salt application rates on porous asphalt. Because of the high standard
deviations, no significant statistical differences in surface cover were found between
study areas (based on a p-value of 0.05). However, the fact that no statistical difference
exists between the 100% DMA salt application and the 0% PA salt application is of
23
importance because it suggests that using no salt on a porous asphalt surface may produce
comparable results to the standard of practice application on conventional dense-mix
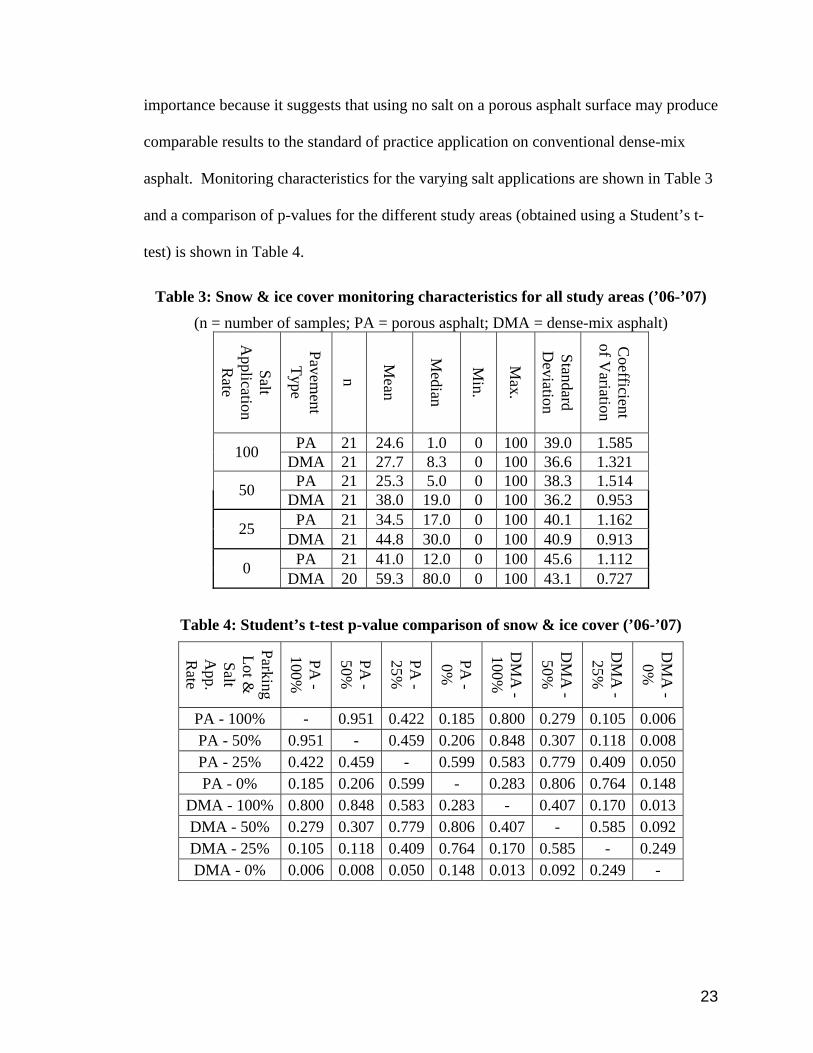
asphalt. Monitoring characteristics for the varying salt applications are shown in Table 3
and a comparison of p-values for the different study areas (obtained using a Student’s t-
test) is shown in Table 4.
Table 3: Snow & ice cover monitoring characteristics for all study areas (’06-’07) (n = number of samples; PA = porous asphalt; DMA = dense-mix asphalt)
Salt A
pplication R
ate
Pavement
Type
n
Mean
Median
Min.
Max.
Standard D
eviation
Coefficient
of Variation
PA 21 24.6 1.0 0 100 39.0 1.585 100 DMA 21 27.7 8.3 0 100 36.6 1.321 PA 21 25.3 5.0 0 100 38.3 1.514 50 DMA 21 38.0 19.0 0 100 36.2 0.953 PA 21 34.5 17.0 0 100 40.1 1.162 25 DMA 21 44.8 30.0 0 100 40.9 0.913 PA 21 41.0 12.0 0 100 45.6 1.112 0
DMA 20 59.3 80.0 0 100 43.1 0.727
Table 4: Student’s t-test p-value comparison of snow & ice cover (’06-’07)
Parking Lot &
Salt A
pp. R
ate
PA -
100%
PA -
50%
PA -
25%
PA -
0%
DM
A -
100%
DM
A -
50%
DM
A -
25%
DM
A -
0%
PA - 100% - 0.951 0.422 0.185 0.800 0.279 0.105 0.006PA - 50% 0.951 - 0.459 0.206 0.848 0.307 0.118 0.008PA - 25% 0.422 0.459 - 0.599 0.583 0.779 0.409 0.050PA - 0% 0.185 0.206 0.599 - 0.283 0.806 0.764 0.148
DMA - 100% 0.800 0.848 0.583 0.283 - 0.407 0.170 0.013DMA - 50% 0.279 0.307 0.779 0.806 0.407 - 0.585 0.092DMA - 25% 0.105 0.118 0.409 0.764 0.170 0.585 - 0.249DMA - 0% 0.006 0.008 0.050 0.148 0.013 0.092 0.249 -
24
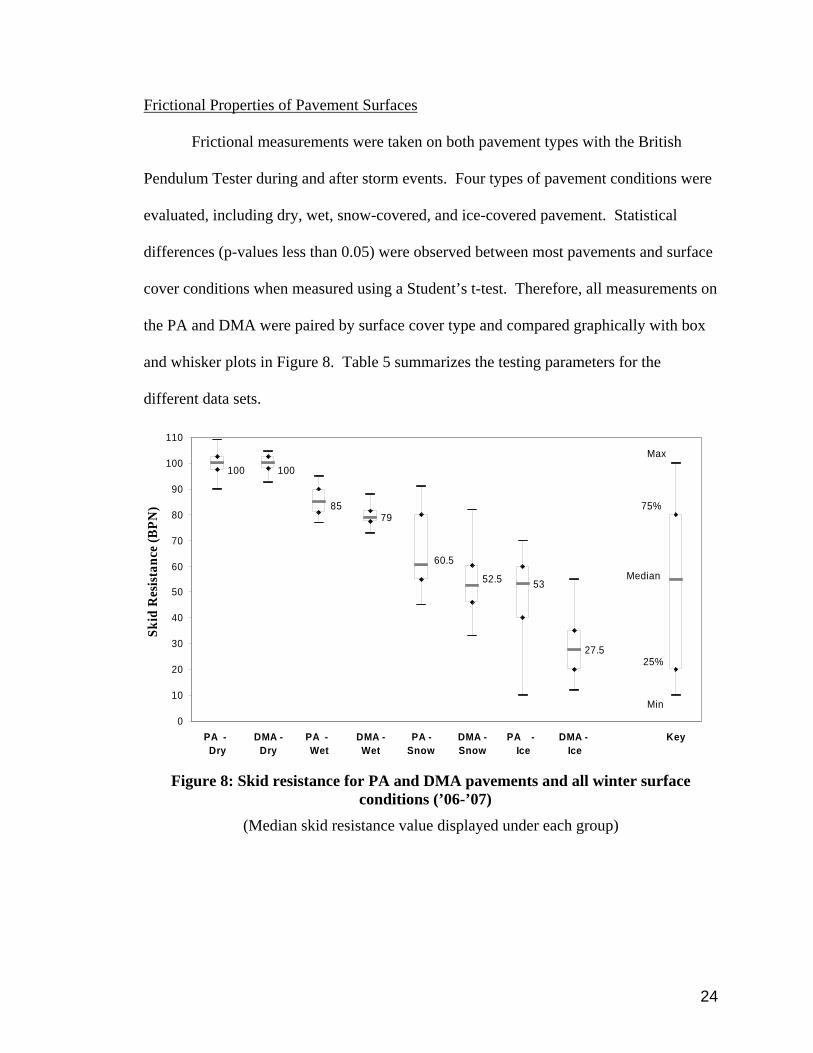
Frictional Properties of Pavement Surfaces
Frictional measurements were taken on both pavement types with the British
Pendulum Tester during and after storm events. Four types of pavement conditions were
evaluated, including dry, wet, snow-covered, and ice-covered pavement. Statistical
differences (p-values less than 0.05) were observed between most pavements and surface
cover conditions when measured using a Student’s t-test. Therefore, all measurements on
the PA and DMA were paired by surface cover type and compared graphically with box
and whisker plots in Figure 8. Table 5 summarizes the testing parameters for the
different data sets.
79
53
27.525%
Min
100
60.5
85
Median 52.5
100 Max
75%
0
10
20
30
40
50
60
70
80
90
100
110
PA - Dry
DMA -Dry
PA - Wet
DMA -Wet
PA -Snow
DMA -Snow
PA - Ice
DMA - Ice
Key
Skid
Res
ista
nce
(BPN
)
Figure 8: Skid resistance for PA and DMA pavements and all winter surface
conditions (’06-’07) (Median skid resistance value displayed under each group)
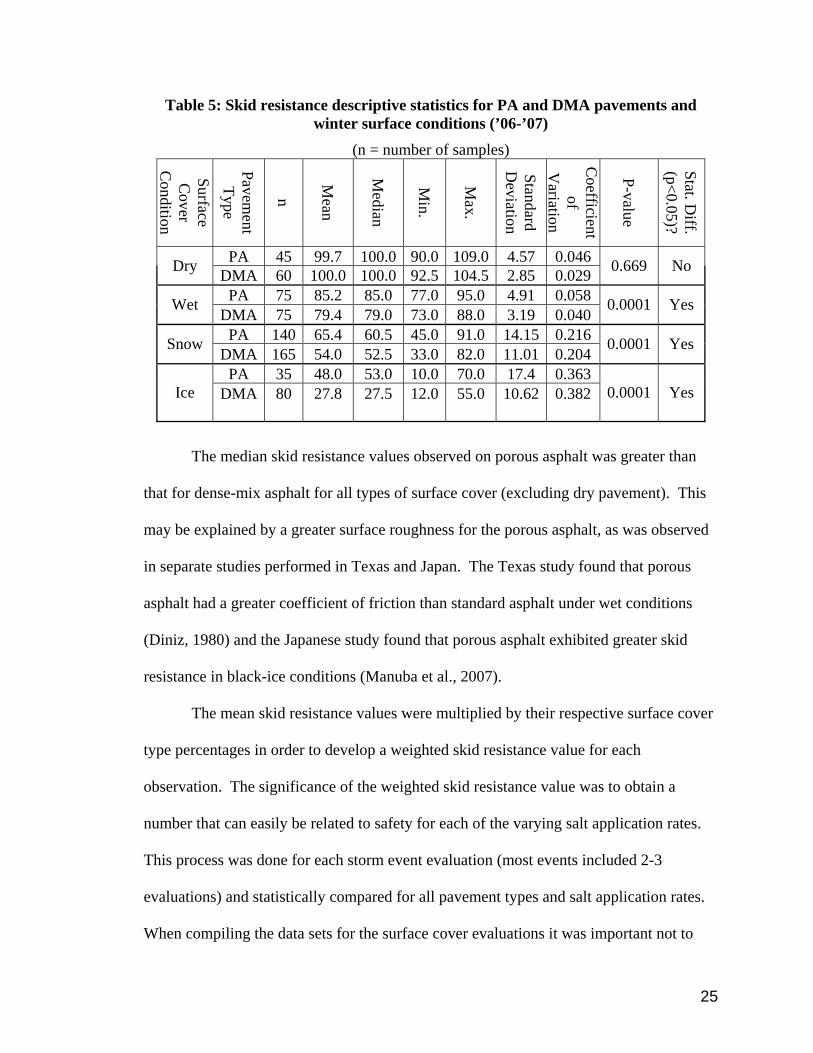
25
Table 5: Skid resistance descriptive statistics for PA and DMA pavements and winter surface conditions (’06-’07)
(n = number of samples)
Surface C
over C
ondition
Pavement
Type
n
Mean
Median
Min.
Max.
Standard D
eviation
Coefficient
of V
ariation
P-value
Stat. Diff.
(p<0.05)?
PA 45 99.7 100.0 90.0 109.0 4.57 0.046 Dry DMA 60 100.0 100.0 92.5 104.5 2.85 0.029 0.669 No
PA 75 85.2 85.0 77.0 95.0 4.91 0.058 Wet DMA 75 79.4 79.0 73.0 88.0 3.19 0.040
0.0001 Yes
PA 140 65.4 60.5 45.0 91.0 14.15 0.216 Snow DMA 165 54.0 52.5 33.0 82.0 11.01 0.204 0.0001 Yes
PA 35 48.0 53.0 10.0 70.0 17.4 0.363 Ice DMA 80 27.8 27.5 12.0 55.0 10.62 0.382 0.0001 Yes
The median skid resistance values observed on porous asphalt was greater than
that for dense-mix asphalt for all types of surface cover (excluding dry pavement). This
may be explained by a greater surface roughness for the porous asphalt, as was observed
in separate studies performed in Texas and Japan. The Texas study found that porous
asphalt had a greater coefficient of friction than standard asphalt under wet conditions
(Diniz, 1980) and the Japanese study found that porous asphalt exhibited greater skid
resistance in black-ice conditions (Manuba et al., 2007).
The mean skid resistance values were multiplied by their respective surface cover
type percentages in order to develop a weighted skid resistance value for each
observation. The significance of the weighted skid resistance value was to obtain a
number that can easily be related to safety for each of the varying salt application rates.
This process was done for each storm event evaluation (most events included 2-3
evaluations) and statistically compared for all pavement types and salt application rates.
When compiling the data sets for the surface cover evaluations it was important not to
26
include observations when all parking lot study areas were entirely dry because a bias
would have been introduced leading the weighted skid resistance toward higher values.
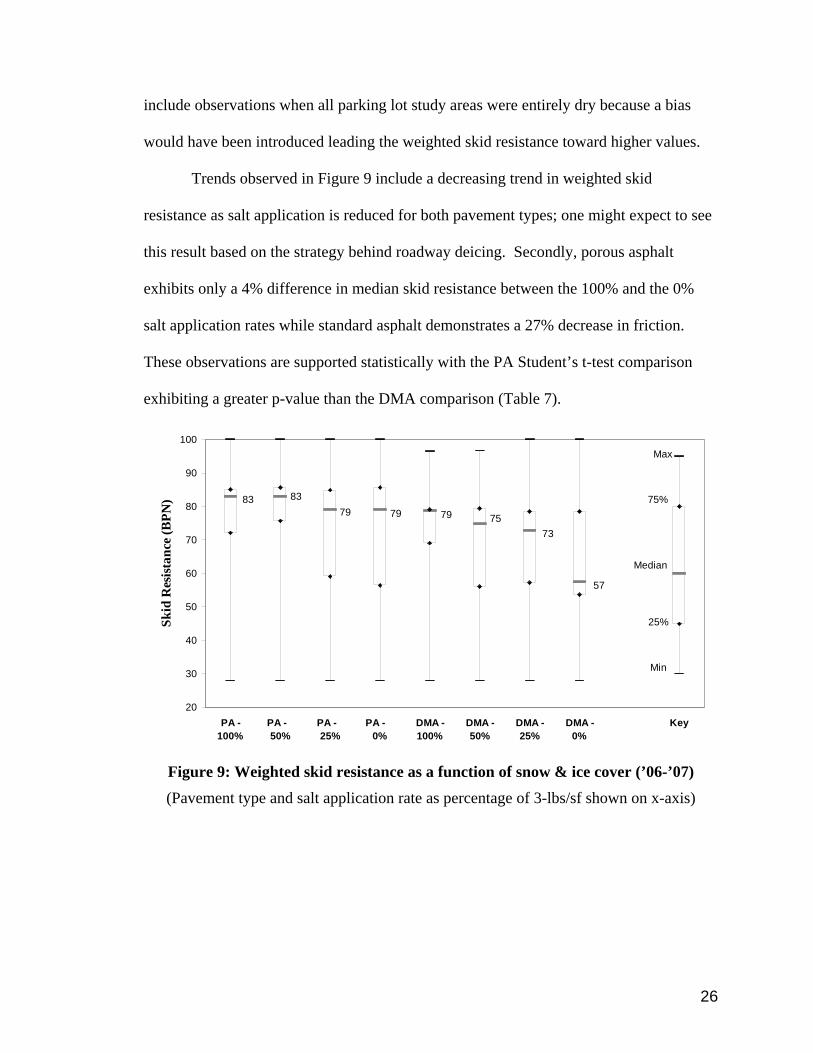
Trends observed in Figure 9 include a decreasing trend in weighted skid
resistance as salt application is reduced for both pavement types; one might expect to see
this result based on the strategy behind roadway deicing. Secondly, porous asphalt
exhibits only a 4% difference in median skid resistance between the 100% and the 0%
salt application rates while standard asphalt demonstrates a 27% decrease in friction.
These observations are supported statistically with the PA Student’s t-test comparison
exhibiting a greater p-value than the DMA comparison (Table 7).
83
25%
Min
797979 75
Median
73
57
83
Max
75%
20
30
40
50
60
70
80
90
100
PA -100%
PA - 50%
PA - 25%
PA - 0%
DMA -100%
DMA -50%
DMA -25%
DMA -0%
Key
Skid
Res
ista
nce
(BPN
)
Figure 9: Weighted skid resistance as a function of snow & ice cover (’06-’07) (Pavement type and salt application rate as percentage of 3-lbs/sf shown on x-axis)
27
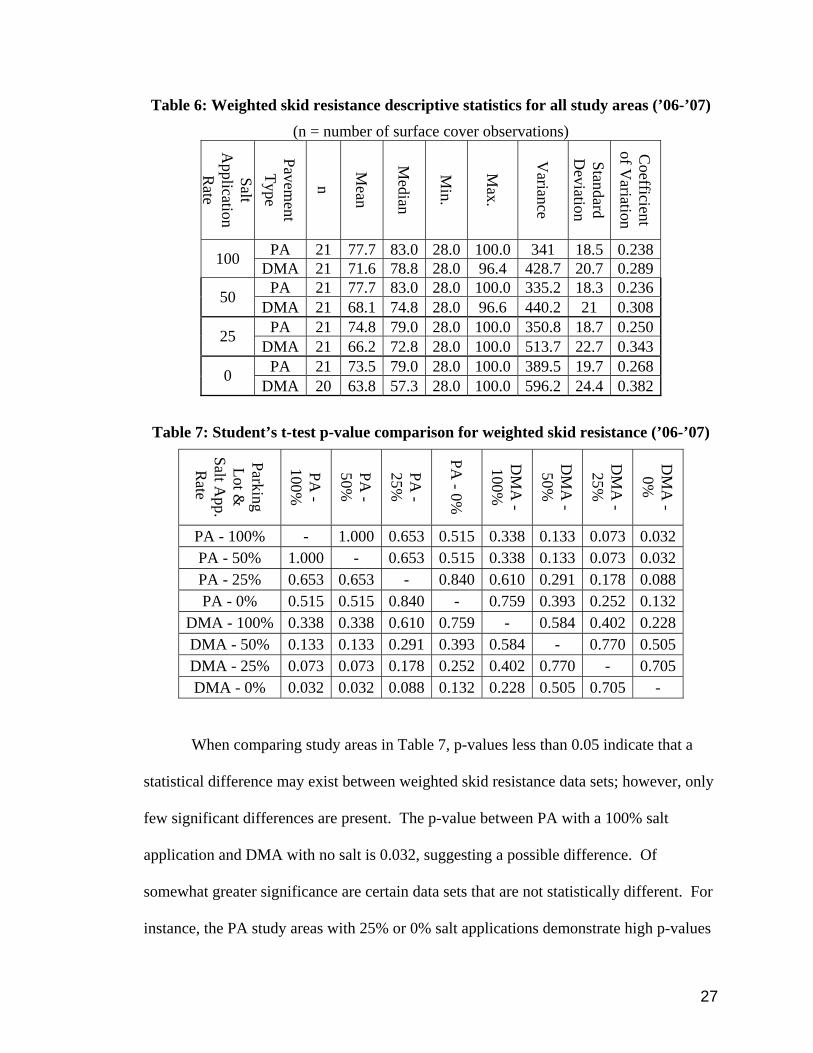
Table 6: Weighted skid resistance descriptive statistics for all study areas (’06-’07) (n = number of surface cover observations)
Salt A
pplication R
ate
Pavement
Type
n
Mean
Median
Min.
Max.
Variance
Standard D
eviation
Coefficient
of Variation
PA 21 77.7 83.0 28.0 100.0 341 18.5 0.238 100 DMA 21 71.6 78.8 28.0 96.4 428.7 20.7 0.289 PA 21 77.7 83.0 28.0 100.0 335.2 18.3 0.236 50 DMA 21 68.1 74.8 28.0 96.6 440.2 21 0.308 PA 21 74.8 79.0 28.0 100.0 350.8 18.7 0.250 25 DMA 21 66.2 72.8 28.0 100.0 513.7 22.7 0.343 PA 21 73.5 79.0 28.0 100.0 389.5 19.7 0.268 0
DMA 20 63.8 57.3 28.0 100.0 596.2 24.4 0.382
Table 7: Student’s t-test p-value comparison for weighted skid resistance (’06-’07)
Parking Lot &
Salt A
pp. R
ate
PA -
100%
PA -
50%
PA -
25%
PA - 0%
DM
A -
100%
DM
A -
50%
DM
A -
25%
DM
A -
0%
PA - 100% - 1.000 0.653 0.515 0.338 0.133 0.073 0.032PA - 50% 1.000 - 0.653 0.515 0.338 0.133 0.073 0.032PA - 25% 0.653 0.653 - 0.840 0.610 0.291 0.178 0.088PA - 0% 0.515 0.515 0.840 - 0.759 0.393 0.252 0.132
DMA - 100% 0.338 0.338 0.610 0.759 - 0.584 0.402 0.228DMA - 50% 0.133 0.133 0.291 0.393 0.584 - 0.770 0.505DMA - 25% 0.073 0.073 0.178 0.252 0.402 0.770 - 0.705DMA - 0% 0.032 0.032 0.088 0.132 0.228 0.505 0.705 -
When comparing study areas in Table 7, p-values less than 0.05 indicate that a
statistical difference may exist between weighted skid resistance data sets; however, only
few significant differences are present. The p-value between PA with a 100% salt
application and DMA with no salt is 0.032, suggesting a possible difference. Of
somewhat greater significance are certain data sets that are not statistically different. For
instance, the PA study areas with 25% or 0% salt applications demonstrate high p-values
28
when compared to DMA with the 100% application. What this means is that the
weighted skid resistance, or safety, of the PA parking lot is likely to exceed that of the
DMA lot even with one-fourth of the amount of salt used on the PA.
Chloride Recovery
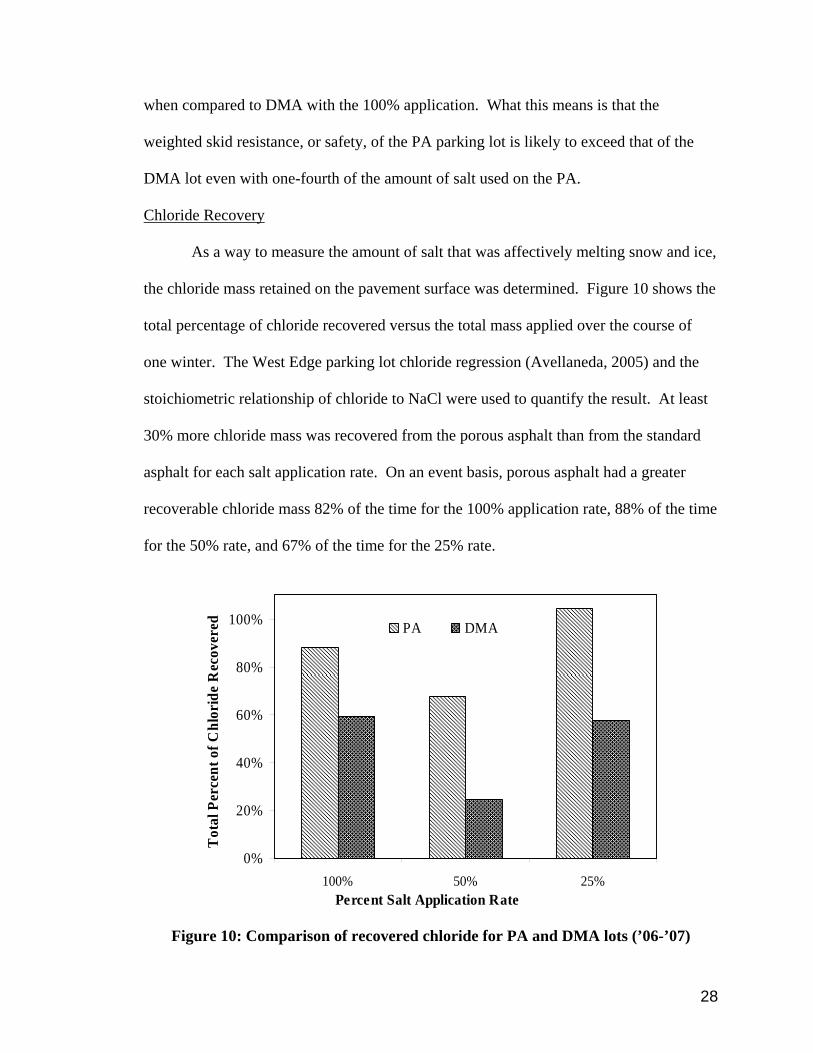
As a way to measure the amount of salt that was affectively melting snow and ice,
the chloride mass retained on the pavement surface was determined. Figure 10 shows the
total percentage of chloride recovered versus the total mass applied over the course of
one winter. The West Edge parking lot chloride regression (Avellaneda, 2005) and the
stoichiometric relationship of chloride to NaCl were used to quantify the result. At least
30% more chloride mass was recovered from the porous asphalt than from the standard
asphalt for each salt application rate. On an event basis, porous asphalt had a greater
recoverable chloride mass 82% of the time for the 100% application rate, 88% of the time
for the 50% rate, and 67% of the time for the 25% rate.
0%
20%
40%
60%
80%
100%
100% 50% 25%Percent Salt Application Rate
Tot
al P
erce
nt o
f Chl
orid
e R
ecov
ered PA DMA
Figure 10: Comparison of recovered chloride for PA and DMA lots (’06-’07)
29
The greater amount of recoverable chloride and salt mass for the PA lot may be
explained in a number of ways. Salt is effective as a deicing agent because it melts a hole
through the snow or ice and forms a layer of highly saline water that melts the
surrounding ice (Trost et al, 1987). On porous asphalt this layer of meltwater cannot
form because it instantly drains through the pavement, leaving behind more of the
original salt crystal. A second explanation may be based on the idea that runoff from the
impermeable lot washes away any residual salt mass. This, of course, does not occur on
porous asphalt. If salt crystals remain on the surface of porous asphalt then reductions
can be made at least for anti-icing practices. Additional reductions are possible for
deicing applications done strictly for freeze-thaw ice conditions.
Salt Load Reductions
Total possible salt load reductions were quantified by revisiting the surface cover
data and determining which events necessitated deicing salt applications. If substantial
snow or ice (>5%) existed on the pavement then it was decided that at least one deicing
salt application was necessary. The majority of events required that either both lots be
deiced, or in some cases, just the DMA pavement. Often times the porous asphalt was
nearly clear of all snow and ice well before the standard. Certain events however, such as
icing or freezing-rain, typically required equal salting maintenance for both lots. The
total number of deicing applications for each lot were summed and added to the number
of necessary anti-icing applications (assumed to be equal to the number of storm events)
to come up with the total annual salt load reflective of all four application rates (Table 8).
30
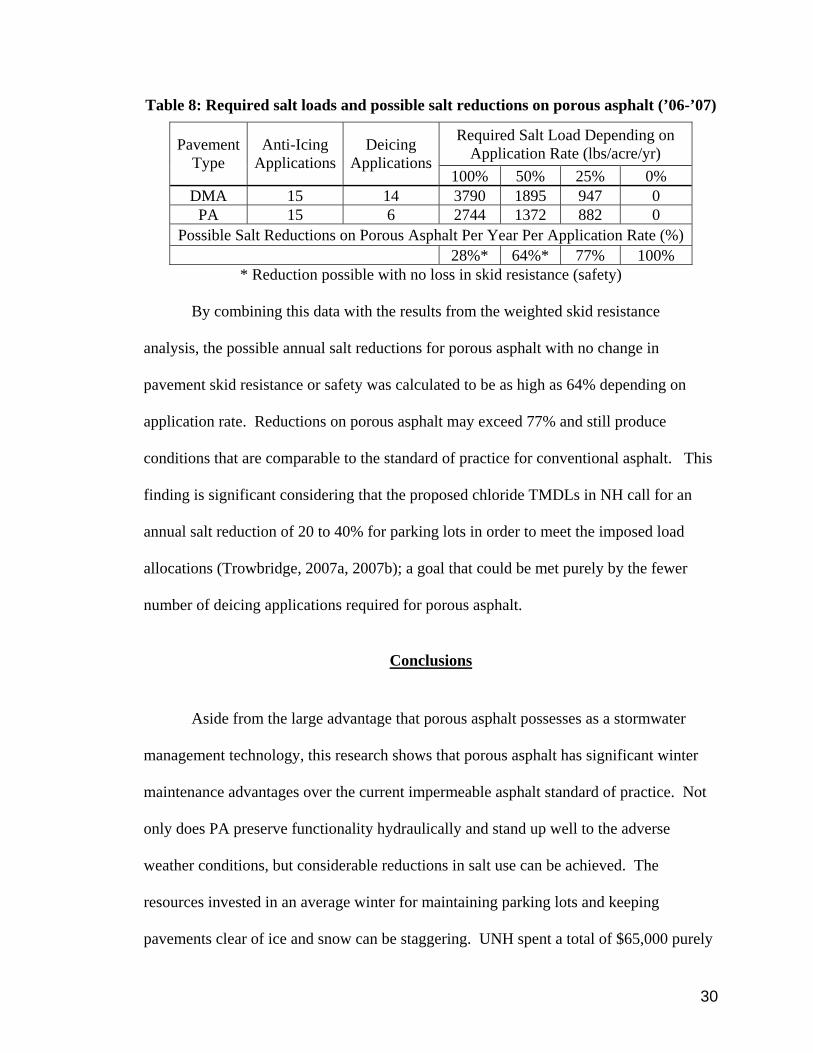
Table 8: Required salt loads and possible salt reductions on porous asphalt (’06-’07)
Required Salt Load Depending on Application Rate (lbs/acre/yr) Pavement
Type Anti-Icing
ApplicationsDeicing
Applications100% 50% 25% 0%
DMA 15 14 3790 1895 947 0 PA 15 6 2744 1372 882 0
Possible Salt Reductions on Porous Asphalt Per Year Per Application Rate (%) 28%* 64%* 77% 100%
* Reduction possible with no loss in skid resistance (safety)
By combining this data with the results from the weighted skid resistance
analysis, the possible annual salt reductions for porous asphalt with no change in
pavement skid resistance or safety was calculated to be as high as 64% depending on
application rate. Reductions on porous asphalt may exceed 77% and still produce
conditions that are comparable to the standard of practice for conventional asphalt. This
finding is significant considering that the proposed chloride TMDLs in NH call for an
annual salt reduction of 20 to 40% for parking lots in order to meet the imposed load
allocations (Trowbridge, 2007a, 2007b); a goal that could be met purely by the fewer
number of deicing applications required for porous asphalt.
Conclusions
Aside from the large advantage that porous asphalt possesses as a stormwater
management technology, this research shows that porous asphalt has significant winter
maintenance advantages over the current impermeable asphalt standard of practice. Not
only does PA preserve functionality hydraulically and stand up well to the adverse
weather conditions, but considerable reductions in salt use can be achieved. The
resources invested in an average winter for maintaining parking lots and keeping
pavements clear of ice and snow can be staggering. UNH spent a total of $65,000 purely

31
on deicing salt during the ’07-’08 winter (Byron, 2008). Estimates in a 10 square-mile
watershed in southern NH suggest that up to 50% of the total salt usage for winter
operations can be directly attributed to parking lot treatments. Additionally, with NPDES
Phase II water quality requirements and chloride TMDLs on the verge of implementation,
cities and municipalities will be forced to reduce contaminant loads from transportation
surfaces (Trowbridge, 2007a, 2007b). Since there is currently no commonly employed
stormwater BMP that can remove chloride from stormwater runoff, and conventional
systems (swales, ponds, catch-basin retrofits) have been shown to be ineffective, and in
some cases export contaminants (Ballestero et al., 2000; Roseen et al., 2006), permeable
pavements may be the most viable option. Future research will consist of additional
winter performance monitoring of the porous asphalt system. The study will also be
expanded to evaluate another type of permeable pavement, pervious concrete, in order to
make comparisons between other existing technologies.
32
CHAPTER 3
A WINTER PERFORMANCE COMPARISON OF POROUS ASPHALT, PERVIOUS CONCRETE, AND CONVENTIONAL ASPHALT
PAVEMENTS
Abstract
In northern climates, runoff from impermeable pavements has varying seasonal
effects on the surrounding environment. During the winter and spring, deicing practices
result in high levels of chloride-laden runoff that is both toxic to aquatic biota and
degrades drinking water supplies. The use of permeable pavements for parking lots,
roads, and sidewalks for new and redevelopment projects is one strategy that can mitigate
watershed impacts associated with stormwater runoff. This study presents the findings
from two active parking lot permeable pavements: porous asphalt and pervious concrete.
The two lots were designed, constructed, maintained, and studied by the University of
New Hampshire Stormwater Center. Winter, in particular, places great demands on
pavements; however, the well-drained nature of permeable pavement systems, including
their porous reservoir base, limits the freeze-thaw effects that can reduce the lifespan of
conventional pavement applications. Frost penetration was observed to reach depths of
eighteen inches; however, surface infiltration capacities remained in excess of 200-in/hr.
Analysis of snow and ice cover and pavement skid resistance demonstrated that up to
72% less salt was needed for porous asphalt to maintain equivalent or better surface
conditions as impermeable asphalt. The annual median snow and ice surface cover for
33
the PA lot was only 6% higher than the DMA lot even though the DMA lot received a
salt application rate four times as great as the PA. The annual median weighted skid
resistance for the PA lot was 12% greater than the DMA lot when measured with a
British Pendulum Tester. Pervious concrete did not demonstrate substantial salt
reduction capabilities during storm events; however, ‘black-ice’ formation did not occur
during freeze-thaw conditions indicating possible annual reductions. Pavement color and
shading were found to be major factors influencing the amount and duration of snow and
ice cover on the PC lot. Overall, pervious pavements were observed to exhibit a high
level of functionality during winter conditions for surface infiltration, skid resistance, and
salt reduction.
Introduction
The implementation of the National Pollutant Discharge Elimination System
(NPDES) Phase II regulations has helped to fuel the research, development, and
implementation of innovative Best Management Practices (BMP) for managing and
treating stormwater runoff. Since 2003, the University of New Hampshire Stormwater
Center (UNHSC) has set out to evaluate over twenty types of BMPs in a fully-monitored
field setting. One class of BMP that is at the forefront of the industry and is being
adopted in both the public and private sectors is permeable pavements. One of the major
benefits of permeable pavements is their dual function as a transportation surface and
self-contained stormwater management device. In addition, research has demonstrated
that porous asphalt may allow for a 77% annual salt reduction for winter maintenance
over conventional practices on impermeable asphalt (Houle, 2008). To date, the UNH
34
Stormwater Center (UNHSC) has constructed and tested two types of permeable
pavement parking lots: porous asphalt and pervious concrete, both of which are located at
the UNH campus in Durham, NH. The objective of this study is to compare and contrast
a series of winter performance metrics of porous asphalt (PA) and pervious concrete
(PC). This paper is the second phase of a research project that was initiated in 2006.
Topics discussed include design details, frost penetration, hydraulic performance as
measured by infiltration capacity, winter performance and maintenance requirements, and
salt reduction opportunities. Historically, there has been some debate among the
engineering community on how permeable pavements perform in northern climates; part
of this debate stems from the confusion between a true porous asphalt stormwater
management system (as is described in this paper) versus open-graded friction course
(OGFC), for example, which is typically used in highway application and differs from
PA by its impermeable asphalt base (Kandhal and Mallick, 2002). This paper to
addresses these misconceptions and identifies the potential benefits of permeable
pavements.
Background
Permeable pavements differ from standard dense-mix asphalt in that the “fines”
(particles smaller than 600 microns) are removed from the aggregate mix, thereby
allowing the formation of pores for water to pass (Cahill et al., 2003; Ferguson, 2005).
Porous asphalt typically consists of stone aggregate, binder material, and other modifiers
and should demonstrate a void space of 18% to 20% (Briggs, 2006). Pervious concrete,
on the other hand, consists of hydraulic cement, stone aggregate, water, and a
35
combination of various chemical additives (admixtures) to enhance the performance,
strength, and ease of placement. Typical void space of a pervious concrete pavement
should be between 15% and 25% (NRMCA, 2007). In the case of the UNHSC designs,
the porous asphalt lot was placed in one, four-inch lift while the pervious concrete lot was
poured to a six-inch depth. Both of these surfaces were placed over a choker (stone)
course underlain by 12-inches or more of a bank run gravel filter course.
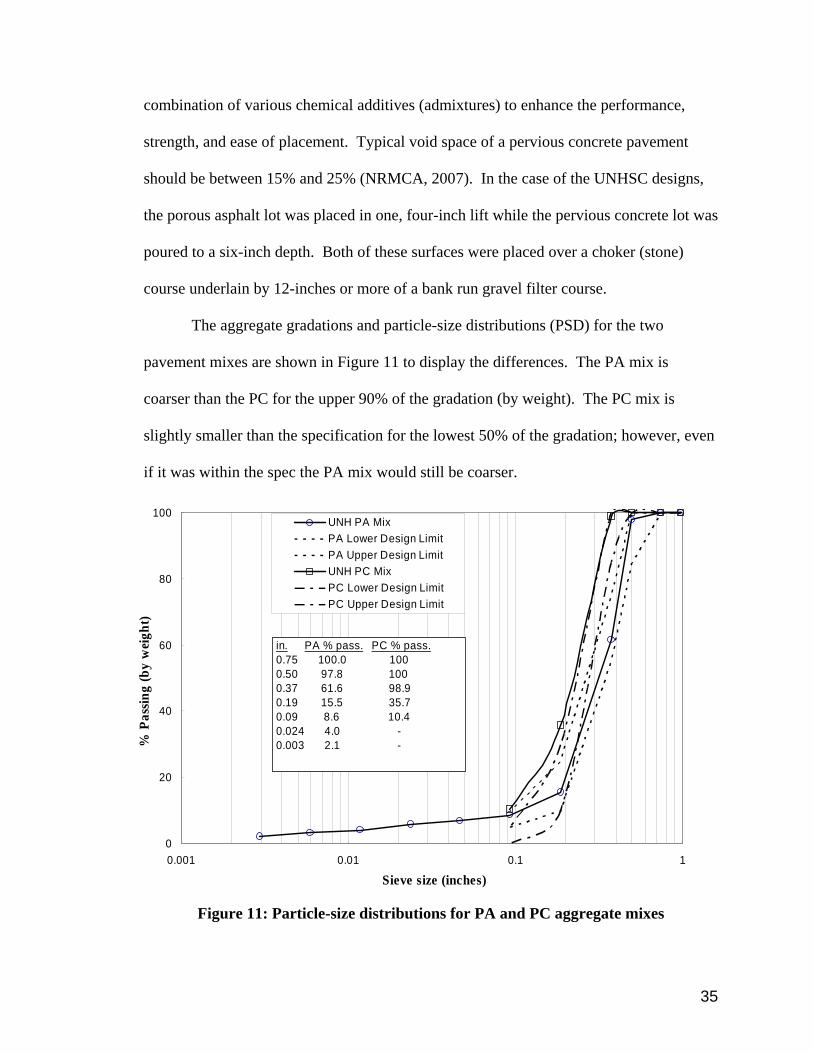
The aggregate gradations and particle-size distributions (PSD) for the two
pavement mixes are shown in Figure 11 to display the differences. The PA mix is
coarser than the PC for the upper 90% of the gradation (by weight). The PC mix is
slightly smaller than the specification for the lowest 50% of the gradation; however, even
if it was within the spec the PA mix would still be coarser.
0
20
40
60
80
100
0.001 0.01 0.1 1
Sieve size (inches)
% P
assin
g (b
y w
eigh
t)
UNH PA MixPA Lower Design LimitPA Upper Design LimitUNH PC MixPC Lower Design LimitPC Upper Design Limit
in. PA % pass. PC % pass.0.75 100.0 1000.50 97.8 1000.37 61.6 98.90.19 15.5 35.70.09 8.6 10.40.024 4.0 -0.003 2.1 -
Figure 11: Particle-size distributions for PA and PC aggregate mixes
36
Many of the sub-base design considerations for porous asphalt and pervious
concrete stormwater management systems are similar to those that would be inherent of
most infiltration-based BMPs. For instance, both UNHSC designs consist of a bank-run-
gravel (BRG) filter course underlain by crushed-stone reservoir layer. The thicknesses of
these layers vary between systems, ranging from 14-inches (PC) to 24-inches (PA) of
filter course and 4-inches (PC) to 21-inches (PA) of crushed-stone reservoir. The total
sub-base depth of the PA site was greater than the PC design in order to meet seasonal-
high-groundwater separation restrictions and due to the presence of a less permeable
native sub-grade soil. Historically, the sub-base of many porous asphalt systems
consisted of only crushed stone; however, with the addition of the filter course, the water
quality performance of the porous asphalt system is substantially improved, resulting in
the removal of most stormwater contaminants (hydrocarbons, microorganisms, sediment,
metals) (Roseen et al., 2007). The major differences between these systems (PA and PC,
in general) are primarily in the wearing course mix designs.
The UNHSC porous asphalt (PA) site is a hydraulically isolated 4,500-ft2, 17-
space parking lot that was installed in 2004. Directly adjacent to this PA lot is an
equally-sized dense-mix asphalt (DMA) parking area that is also hydraulically isolated.
The DMA lot was constructed concurrently with the PA site to serve as a control for most
performance metrics. Both lots are located along the perimeter of a nine-acre, asphalt
commuter parking lot.
The UNHSC pervious concrete (PC) site was installed in August, 2007. It is
approximately 20,000-ft2 and includes 75 parking stalls. It serves as a parking lot for
37
several nearby dormitories and is used to capacity primarily from September to May.
Adjacent to the PC site, is a university-maintained standard asphalt lot that was used as
an additional reference location for the study.
The winter climate (January through March) in Durham, NH generally consists of
average temperatures near 27.7 ºF, with maximum and minimum temperature of 37.5 ºF
and 17.3 ºF, respectively. Total precipitation during this time period is approximately
16.4 inches and snowfall is around 63.1 inches (NHSCO, 2008).
Methodology
The methodology for this research was designed to mimic strategies outlined in
Houle (2008) but altered as needed. References to this previous study are provided
where appropriate.
Frost Depth Penetration
Frost depth penetration within the two types of permeable pavement was
measured using a “field assembled frost gauge” (Ricard et al., 1976) installed in a
screened, PVC groundwater monitoring well. Frost depth was determined by measuring
the depth of frozen water-methylene blue solution. Frost depth and air temperature were
recorded regularly from December 2007 to April 2008.
Surface Infiltration Capacity
Hydraulic performance of the permeable pavements was evaluated by measuring
the surface infiltration capacity (IC) on a near-monthly basis beginning soon after
installation. A falling head surface inundation (SI) test (Bean, 2004) was used for this
process. This involved pouring a known volume of water into a cylinder and measuring
38
the time required for the water to enter the pavement surface. Measurements were taken
at three randomly selected locations (A-C) on the PA lot beginning in 2004, and at six
locations (A-F) on the PC lot beginning in 2007. A double-ring infiltrometer (DRI) test
was used at one location at the PA lot (Point C) because the IC rate was too low to be
accurately represented with the SI device (Briggs, 2006). Further explanation can be
referenced in Houle (2008).
Salt Application
Salt was applied to the parking lots in a manner designed to mimic municipal anti-
icing and de-icing strategies, and consistent with the general practices employed by the
University of New Hampshire. Application rates were selected based on percentages of
the recommend standard of practice rate of 3.0-lbs per 1000-ft2 of application area
(MPCA, 2006). The rates used in Houle (2008) (100%, 50%, 25%, and 0%) were applied
to 20-ft by 20-ft sections of the driving lane through the pervious concrete lot (Figure 12).
The remaining driving lane area received a 100% application rate. The salt used was
standard rock salt with less than 10% added fines by mass; it was identical to the mix
used in the ’06-’07 study.
The number of salt application rates for the porous asphalt and dense-mix asphalt
lots was altered from the previous winter. The entire PA lot received a rate of 25% of the
standard of practice while the DMA lot received a 100% rate (Figure 13). Evaluation
areas included isolated parking stalls, as was the case in Houle (2008) and the lots as a
whole. This change in methodology was performed in order to quantify any differences
that may exist between driving lanes and parking stalls.
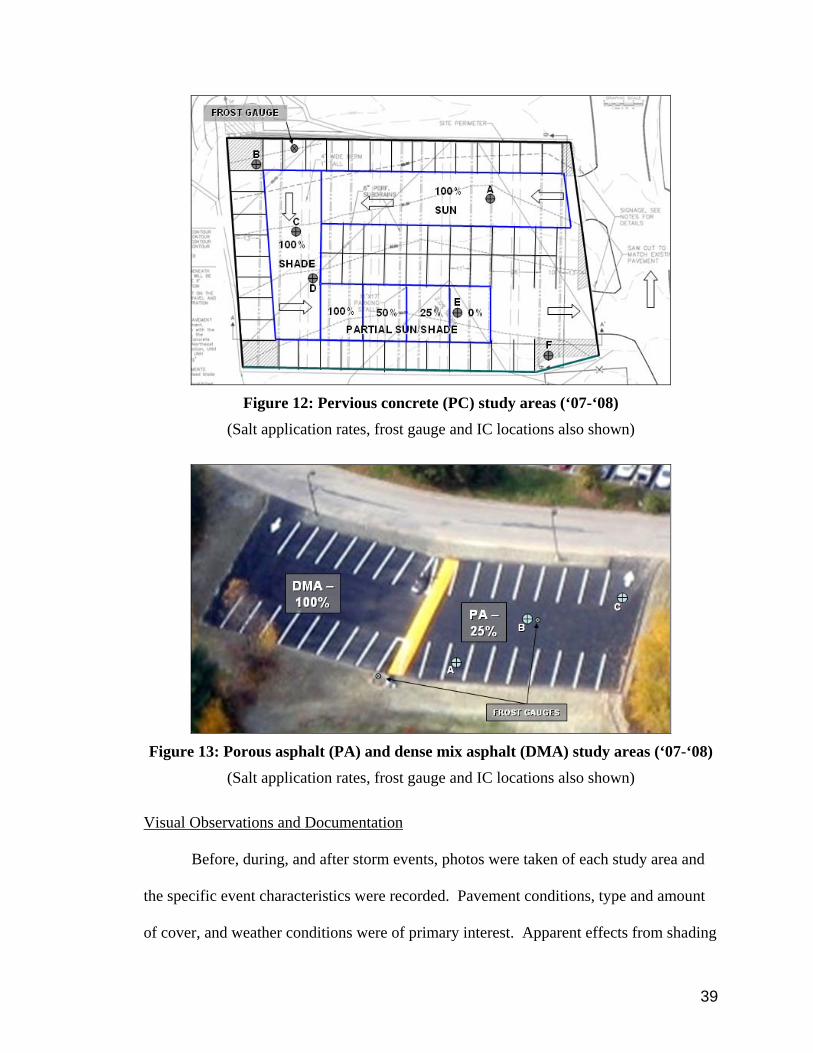
39
Figure 12: Pervious concrete (PC) study areas (‘07-‘08)
(Salt application rates, frost gauge and IC locations also shown)
Figure 13: Porous asphalt (PA) and dense mix asphalt (DMA) study areas (‘07-‘08)
(Salt application rates, frost gauge and IC locations also shown)
Visual Observations and Documentation
Before, during, and after storm events, photos were taken of each study area and
the specific event characteristics were recorded. Pavement conditions, type and amount
of cover, and weather conditions were of primary interest. Apparent effects from shading
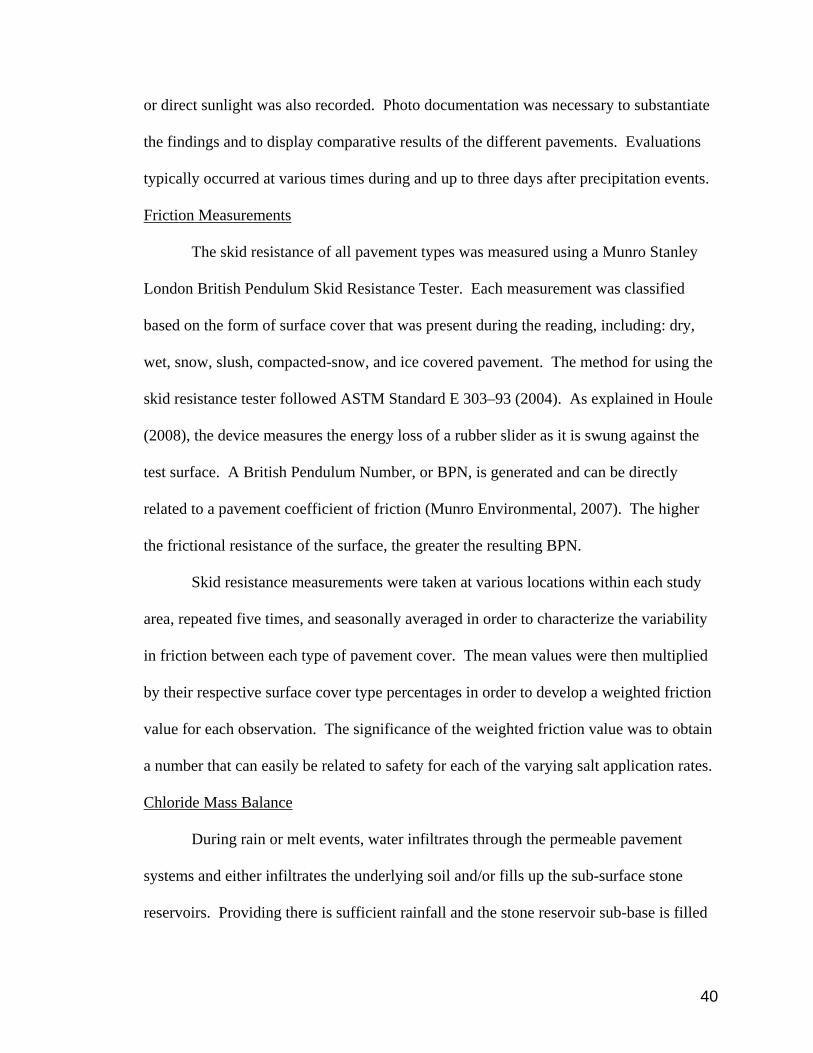
40
or direct sunlight was also recorded. Photo documentation was necessary to substantiate
the findings and to display comparative results of the different pavements. Evaluations
typically occurred at various times during and up to three days after precipitation events.
Friction Measurements
The skid resistance of all pavement types was measured using a Munro Stanley
London British Pendulum Skid Resistance Tester. Each measurement was classified
based on the form of surface cover that was present during the reading, including: dry,
wet, snow, slush, compacted-snow, and ice covered pavement. The method for using the
skid resistance tester followed ASTM Standard E 303–93 (2004). As explained in Houle
(2008), the device measures the energy loss of a rubber slider as it is swung against the
test surface. A British Pendulum Number, or BPN, is generated and can be directly
related to a pavement coefficient of friction (Munro Environmental, 2007). The higher
the frictional resistance of the surface, the greater the resulting BPN.
Skid resistance measurements were taken at various locations within each study
area, repeated five times, and seasonally averaged in order to characterize the variability
in friction between each type of pavement cover. The mean values were then multiplied
by their respective surface cover type percentages in order to develop a weighted friction
value for each observation. The significance of the weighted friction value was to obtain
a number that can easily be related to safety for each of the varying salt application rates.
Chloride Mass Balance
During rain or melt events, water infiltrates through the permeable pavement
systems and either infiltrates the underlying soil and/or fills up the sub-surface stone
reservoirs. Providing there is sufficient rainfall and the stone reservoir sub-base is filled
41
to the perforated sub-drains, water will discharge the systems through the sub-drain to
where it is then monitored and sampled with an automated 6712SR Isco sampler outfitted
with a bubbler-weir flow meter and a YSI Model 600XL Sonde that records several real-
time parameters at regular intervals, including: pH, temperature, dissolved oxygen, and
specific conductance. By measuring the specific conductance of the effluent leaving the
systems and knowing the total salt mass applied for anti-icing and deicing practices, a
chloride mass balance for each lot was performed. Real-time chloride concentrations
were obtained by converting the specific conductance levels with a regression
relationship developed by the UNHSC (Avellaneda, 2005); chloride mass was
determined using the recorded flow measurements. A chloride mass balance is of interest
to investigate the ability of permeable pavement to reduce the peak chloride discharge
and the mass load that would be typical with runoff from conventional impermeable
pavements. Research at the UNHSC has measured chloride concentrations of parking lot
runoff to be in excess of 5,000 mg/L for most of the winter season (Avellaneda, 2005),
levels far above regulatory standards. Chronic exposure levels for chloride are not to
exceed 230 mg/L for a 96 hour period more than once every three years on average,
while acute exposure levels must not exceed 860 mg/L for a one hour period more than
once every three years on average (U.S. EPA, 1988). Any way to reduce these levels
may help to better manage the risks that chloride poses to the environment and drinking
water supplies.
Statistical Comparison Methods
A ‘Student’s t’ means comparison test was employed for all portions of this study
that include statistical assessment. These analyses include surface infiltration capacity,
42
snow & ice cover, and skid resistance. The Student’s t-test is a test to determine
differences in central location (mean) for two independent data sets (Helsel and Hirsh,
2002). Group comparisons with p-values less than 0.05 (with a 95% confidence interval)
were deemed statistically different.
Results and Discussion
Frost Depth Penetration
A time-series from November 2007 to April 2008, displaying frost depth in the
porous asphalt and pervious concrete lots, is shown in Figure 14. Frost depth within the
systems is plotted against average daily air temperature (on a reverse axis) and frost depth
at two reference locations, one in a tree-filter stormwater treatment unit adjacent to the
PA lot consisting of a typical bioretention soil-mix and one in soil adjacent to the PC
study areas. It is apparent from the figure that the PC responded quicker to lower air
temperatures and maintained a greater frost depth than the PA system until early
February when a sudden decrease in depth of frost was observed. It is believed that the
rapid decrease in frost depth was due to a rain-event on 2/5/08 that thawed the systems,
which is consistent with findings by Backstrom (2000) and Houle (2008). Shortly after
this rapid thawing process, the PA lot refroze to a frost depth of about thirteen inches
while the frost depth in PC lot stayed nearly constant at eight-inches. A possible
explanation for this may be due to water levels and latent heat within the two systems.
The PC frost gauge well is located at the low-point of the lot and in an area where the
total system depth is about 30-inches. At the time of observation, the water level was
consistently about 26-inches below the pavement surface (at the base of four-inch
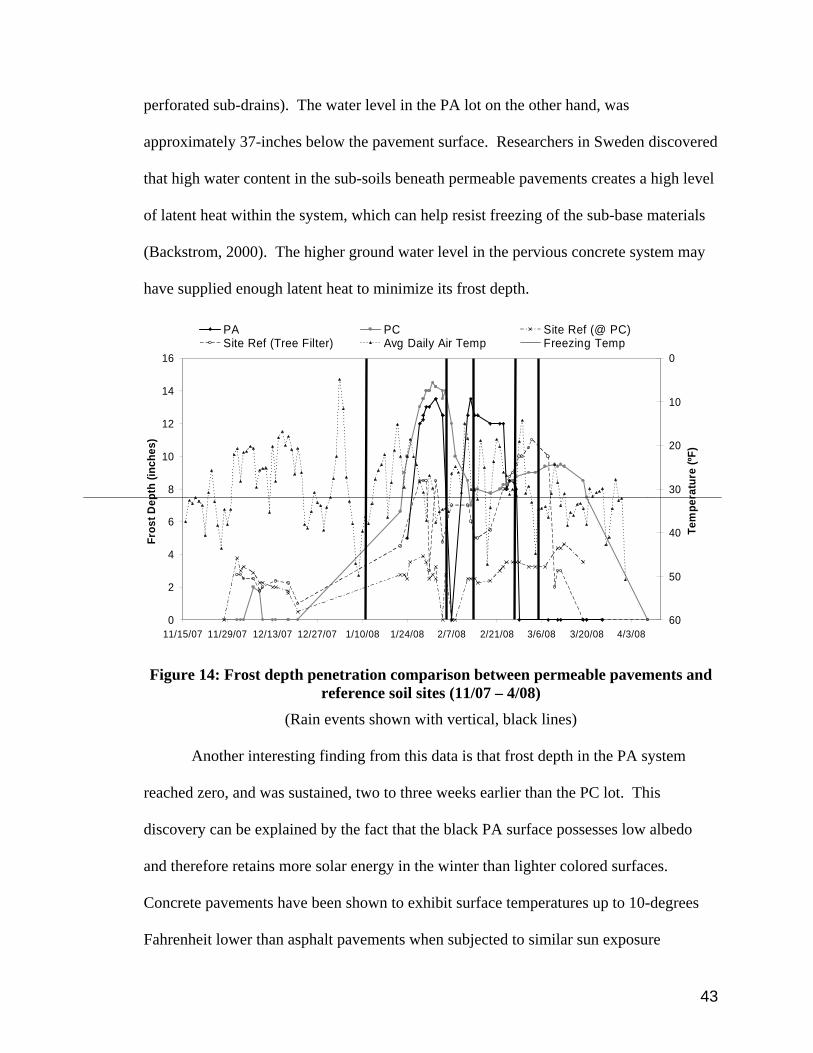
43
perforated sub-drains). The water level in the PA lot on the other hand, was
approximately 37-inches below the pavement surface. Researchers in Sweden discovered
that high water content in the sub-soils beneath permeable pavements creates a high level
of latent heat within the system, which can help resist freezing of the sub-base materials
(Backstrom, 2000). The higher ground water level in the pervious concrete system may
have supplied enough latent heat to minimize its frost depth.
Figure 14: Frost depth penetration comparison between permeable pavements and
reference soil sites (11/07 – 4/08)
(Rain events shown with vertical, black lines)
Another interesting finding from this data is that frost depth in the PA system
reached zero, and was sustained, two to three weeks earlier than the PC lot. This
discovery can be explained by the fact that the black PA surface possesses low albedo
and therefore retains more solar energy in the winter than lighter colored surfaces.
Concrete pavements have been shown to exhibit surface temperatures up to 10-degrees
Fahrenheit lower than asphalt pavements when subjected to similar sun exposure
0
2
4
6
8
10
12
14
16
11/15/07 11/29/07 12/13/07 12/27/07 1/10/08 1/24/08 2/7/08 2/21/08 3/6/08 3/20/08 4/3/08
Fros
t Dep
th (i
nche
s)
0
10
20
30
40
50
60
Tem
pera
ture
(ºF)
PA PC Site Ref (@ PC)Site Ref (Tree Filter) Avg Daily Air Temp Freezing Temp
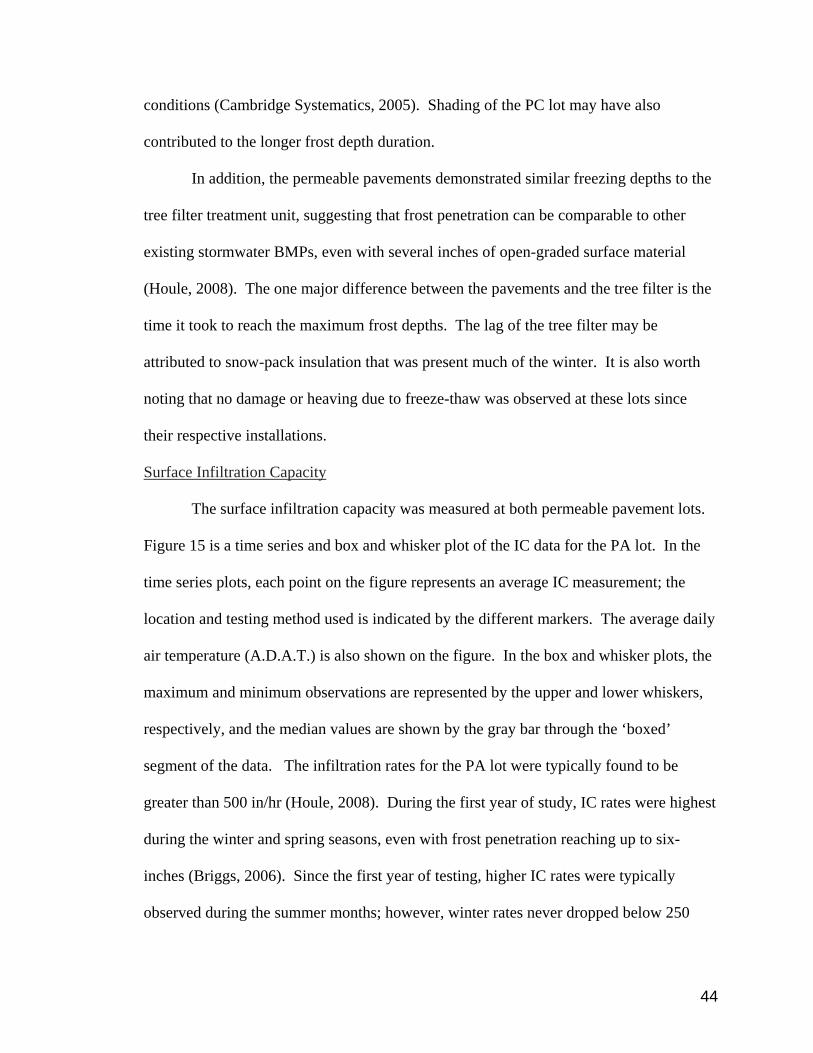
44
conditions (Cambridge Systematics, 2005). Shading of the PC lot may have also
contributed to the longer frost depth duration.
In addition, the permeable pavements demonstrated similar freezing depths to the
tree filter treatment unit, suggesting that frost penetration can be comparable to other
existing stormwater BMPs, even with several inches of open-graded surface material
(Houle, 2008). The one major difference between the pavements and the tree filter is the
time it took to reach the maximum frost depths. The lag of the tree filter may be
attributed to snow-pack insulation that was present much of the winter. It is also worth
noting that no damage or heaving due to freeze-thaw was observed at these lots since
their respective installations.
Surface Infiltration Capacity
The surface infiltration capacity was measured at both permeable pavement lots.
Figure 15 is a time series and box and whisker plot of the IC data for the PA lot. In the
time series plots, each point on the figure represents an average IC measurement; the
location and testing method used is indicated by the different markers. The average daily
air temperature (A.D.A.T.) is also shown on the figure. In the box and whisker plots, the
maximum and minimum observations are represented by the upper and lower whiskers,
respectively, and the median values are shown by the gray bar through the ‘boxed’
segment of the data. The infiltration rates for the PA lot were typically found to be
greater than 500 in/hr (Houle, 2008). During the first year of study, IC rates were highest
during the winter and spring seasons, even with frost penetration reaching up to six-
inches (Briggs, 2006). Since the first year of testing, higher IC rates were typically
observed during the summer months; however, winter rates never dropped below 250
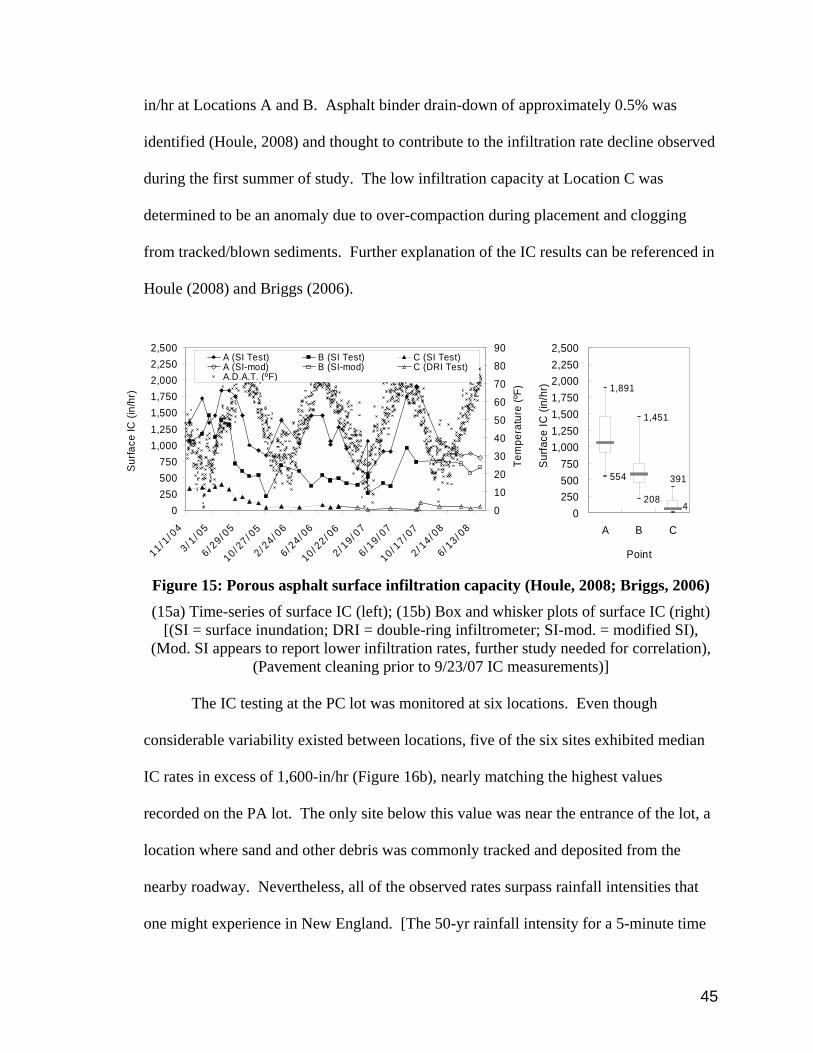
45
in/hr at Locations A and B. Asphalt binder drain-down of approximately 0.5% was
identified (Houle, 2008) and thought to contribute to the infiltration rate decline observed
during the first summer of study. The low infiltration capacity at Location C was
determined to be an anomaly due to over-compaction during placement and clogging
from tracked/blown sediments. Further explanation of the IC results can be referenced in
Houle (2008) and Briggs (2006).
Figure 15: Porous asphalt surface infiltration capacity (Houle, 2008; Briggs, 2006) (15a) Time-series of surface IC (left); (15b) Box and whisker plots of surface IC (right)
[(SI = surface inundation; DRI = double-ring infiltrometer; SI-mod. = modified SI), (Mod. SI appears to report lower infiltration rates, further study needed for correlation),
(Pavement cleaning prior to 9/23/07 IC measurements)]
The IC testing at the PC lot was monitored at six locations. Even though
considerable variability existed between locations, five of the six sites exhibited median
IC rates in excess of 1,600-in/hr (Figure 16b), nearly matching the highest values
recorded on the PA lot. The only site below this value was near the entrance of the lot, a
location where sand and other debris was commonly tracked and deposited from the
nearby roadway. Nevertheless, all of the observed rates surpass rainfall intensities that
one might experience in New England. [The 50-yr rainfall intensity for a 5-minute time
0250500750
1,0001,2501,5001,7502,0002,2502,500
11/1/0
4
3/1/0
5
6/29/0
5
10/27/0
5
2/24/0
6
6/24/0
6
10/22/0
6
2/19/0
7
6/19/0
7
10/17/0
7
2/14/0
8
6/13/0
8
Surfa
ce IC
(in/
hr)
0
10
20
30
40
50
60
70
80
90
Tem
pera
ture
(ºF)
A (SI Test) B (SI Test) C (SI Test)A (SI-mod) B (SI-mod) C (DRI Test)A.D.A.T. (ºF)
554
208
1,891
1,451
4
391
0250500750
1,0001,2501,5001,7502,0002,2502,500
A B C
PointSu
rface
IC (i
n/hr
)
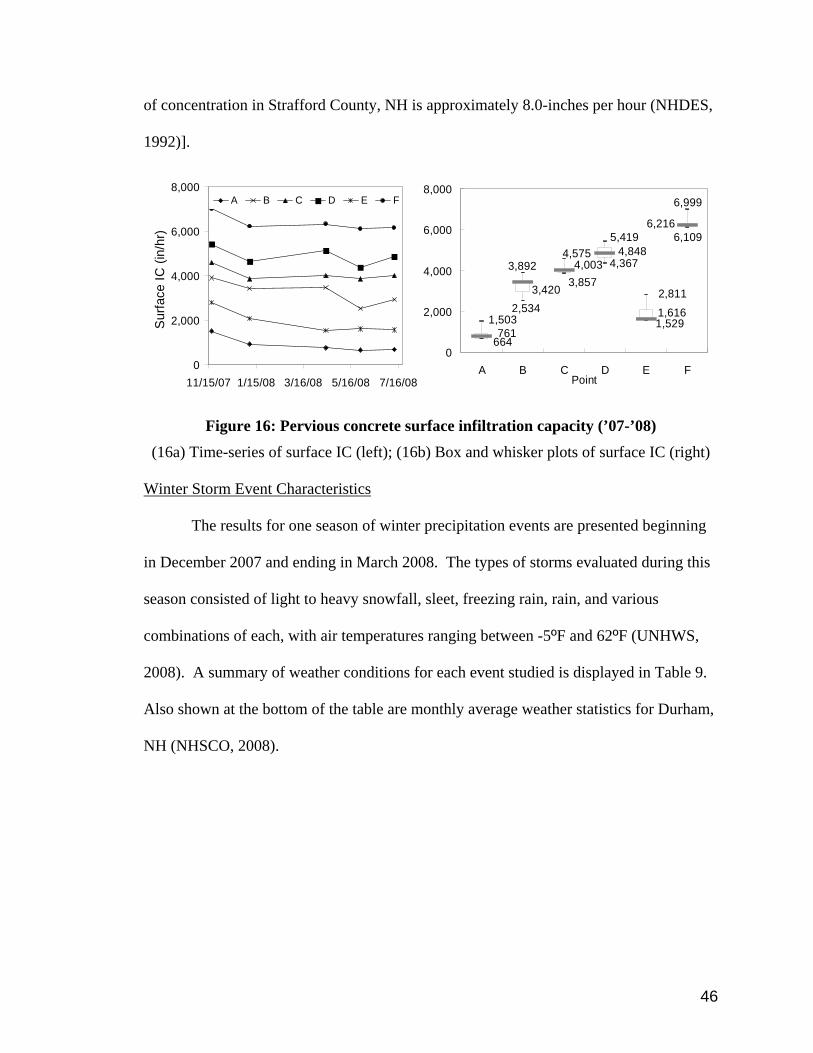
46
of concentration in Strafford County, NH is approximately 8.0-inches per hour (NHDES,
1992)].
Figure 16: Pervious concrete surface infiltration capacity (’07-’08)
(16a) Time-series of surface IC (left); (16b) Box and whisker plots of surface IC (right)
Winter Storm Event Characteristics
The results for one season of winter precipitation events are presented beginning
in December 2007 and ending in March 2008. The types of storms evaluated during this
season consisted of light to heavy snowfall, sleet, freezing rain, rain, and various
combinations of each, with air temperatures ranging between -5ºF and 62ºF (UNHWS,
2008). A summary of weather conditions for each event studied is displayed in Table 9.
Also shown at the bottom of the table are monthly average weather statistics for Durham,
NH (NHSCO, 2008).
0
2,000
4,000
6,000
8,000
11/15/07 1/15/08 3/16/08 5/16/08 7/16/08
Sur
face
IC (i
n/hr
)
A B C D E F
6,109
1,529
4,367
664
3,857
2,534
6,216
1,616
4,848
761
4,003
3,420
6,999
5,4194,575
1,503
3,892
2,811
0
2,000
4,000
6,000
8,000
A B C D E FPoint
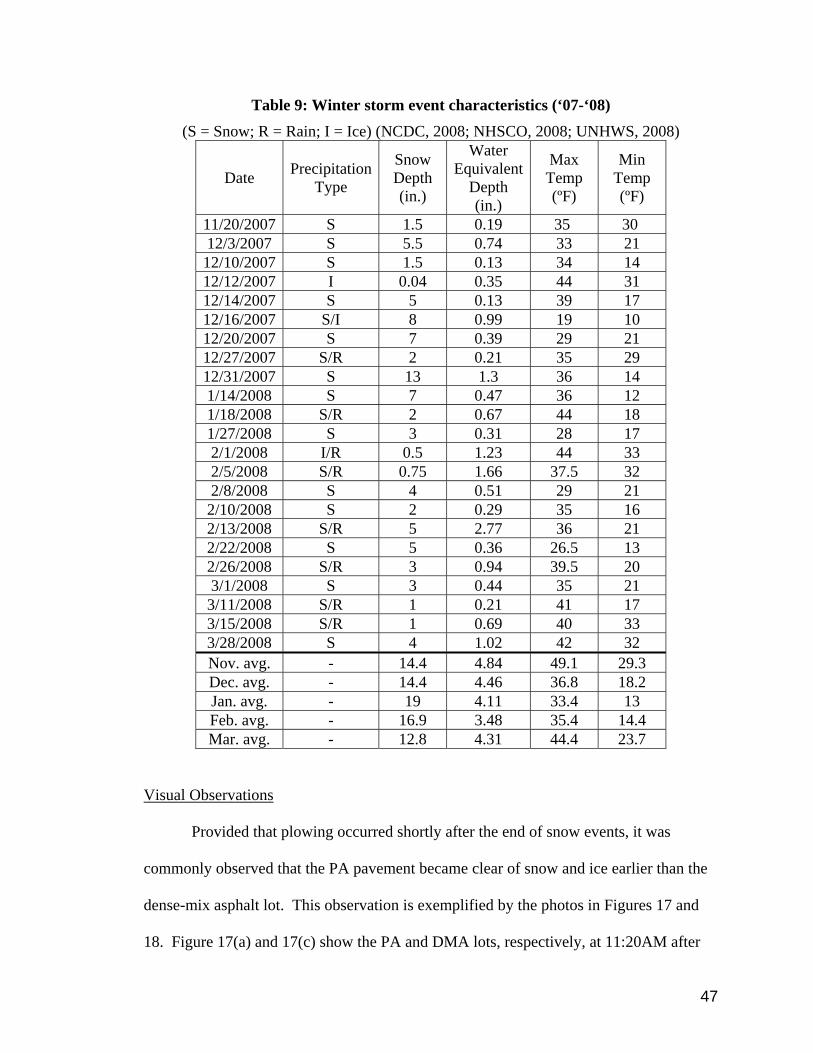
47
Table 9: Winter storm event characteristics (‘07-‘08) (S = Snow; R = Rain; I = Ice) (NCDC, 2008; NHSCO, 2008; UNHWS, 2008)
Date Precipitation Type
Snow Depth (in.)
Water Equivalent
Depth (in.)
Max Temp (ºF)
Min Temp (ºF)
11/20/2007 S 1.5 0.19 35 30 12/3/2007 S 5.5 0.74 33 21
12/10/2007 S 1.5 0.13 34 14 12/12/2007 I 0.04 0.35 44 31 12/14/2007 S 5 0.13 39 17 12/16/2007 S/I 8 0.99 19 10 12/20/2007 S 7 0.39 29 21 12/27/2007 S/R 2 0.21 35 29 12/31/2007 S 13 1.3 36 14 1/14/2008 S 7 0.47 36 12 1/18/2008 S/R 2 0.67 44 18 1/27/2008 S 3 0.31 28 17 2/1/2008 I/R 0.5 1.23 44 33 2/5/2008 S/R 0.75 1.66 37.5 32 2/8/2008 S 4 0.51 29 21
2/10/2008 S 2 0.29 35 16 2/13/2008 S/R 5 2.77 36 21 2/22/2008 S 5 0.36 26.5 13 2/26/2008 S/R 3 0.94 39.5 20 3/1/2008 S 3 0.44 35 21
3/11/2008 S/R 1 0.21 41 17 3/15/2008 S/R 1 0.69 40 33 3/28/2008 S 4 1.02 42 32 Nov. avg. - 14.4 4.84 49.1 29.3 Dec. avg. - 14.4 4.46 36.8 18.2 Jan. avg. - 19 4.11 33.4 13 Feb. avg. - 16.9 3.48 35.4 14.4 Mar. avg. - 12.8 4.31 44.4 23.7
Visual Observations
Provided that plowing occurred shortly after the end of snow events, it was
commonly observed that the PA pavement became clear of snow and ice earlier than the
dense-mix asphalt lot. This observation is exemplified by the photos in Figures 17 and
18. Figure 17(a) and 17(c) show the PA and DMA lots, respectively, at 11:20AM after
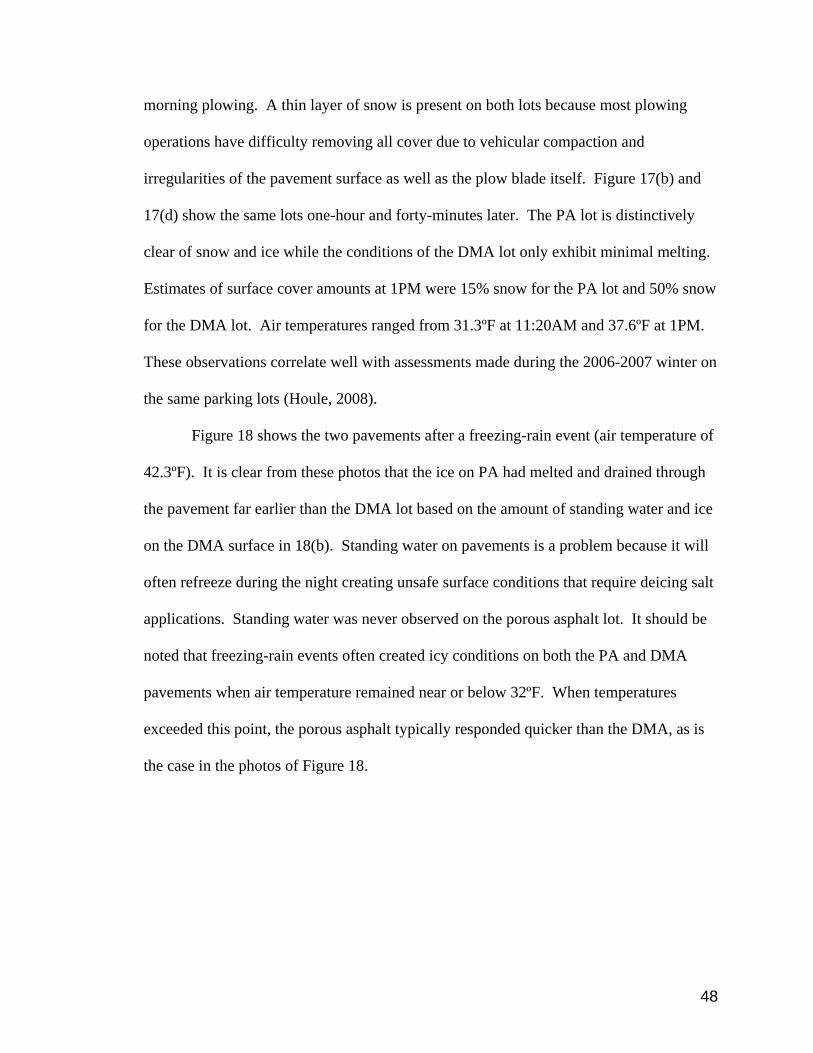
48
morning plowing. A thin layer of snow is present on both lots because most plowing
operations have difficulty removing all cover due to vehicular compaction and
irregularities of the pavement surface as well as the plow blade itself. Figure 17(b) and
17(d) show the same lots one-hour and forty-minutes later. The PA lot is distinctively
clear of snow and ice while the conditions of the DMA lot only exhibit minimal melting.
Estimates of surface cover amounts at 1PM were 15% snow for the PA lot and 50% snow
for the DMA lot. Air temperatures ranged from 31.3ºF at 11:20AM and 37.6ºF at 1PM.
These observations correlate well with assessments made during the 2006-2007 winter on
the same parking lots (Houle, 2008).
Figure 18 shows the two pavements after a freezing-rain event (air temperature of
42.3ºF). It is clear from these photos that the ice on PA had melted and drained through
the pavement far earlier than the DMA lot based on the amount of standing water and ice
on the DMA surface in 18(b). Standing water on pavements is a problem because it will
often refreeze during the night creating unsafe surface conditions that require deicing salt
applications. Standing water was never observed on the porous asphalt lot. It should be
noted that freezing-rain events often created icy conditions on both the PA and DMA
pavements when air temperature remained near or below 32ºF. When temperatures
exceeded this point, the porous asphalt typically responded quicker than the DMA, as is
the case in the photos of Figure 18.
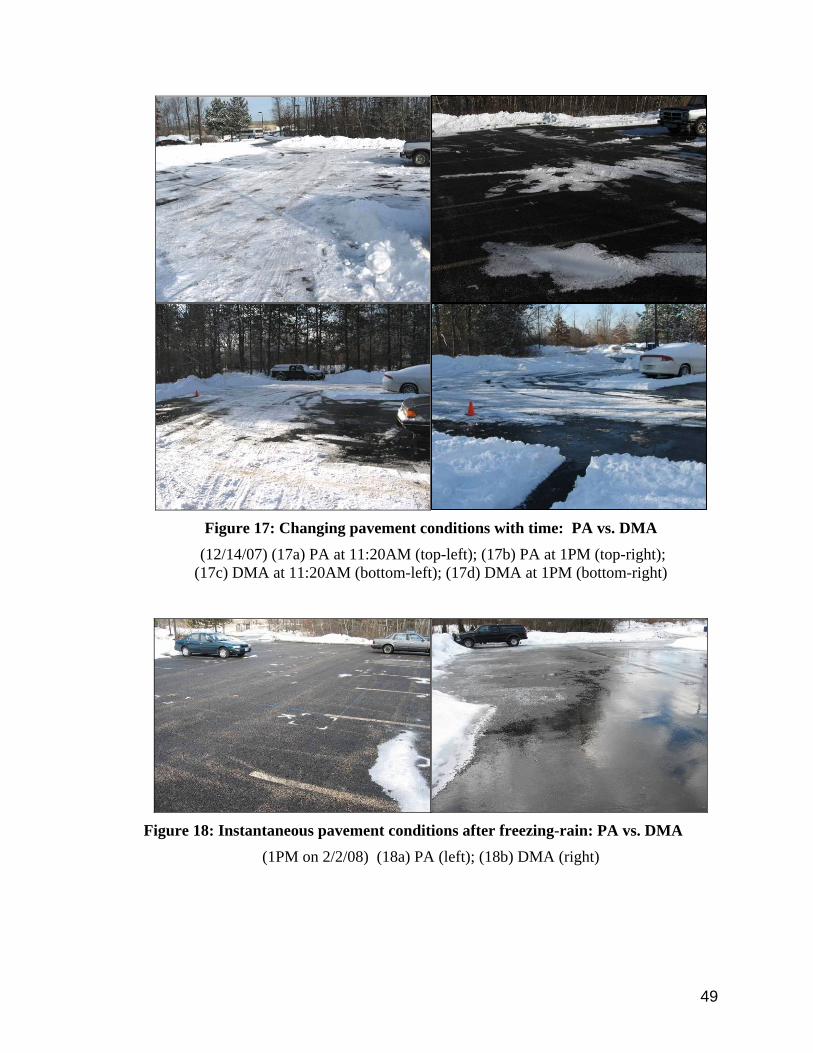
49
Figure 17: Changing pavement conditions with time: PA vs. DMA
(12/14/07) (17a) PA at 11:20AM (top-left); (17b) PA at 1PM (top-right); (17c) DMA at 11:20AM (bottom-left); (17d) DMA at 1PM (bottom-right)
Figure 18: Instantaneous pavement conditions after freezing-rain: PA vs. DMA
(1PM on 2/2/08) (18a) PA (left); (18b) DMA (right)
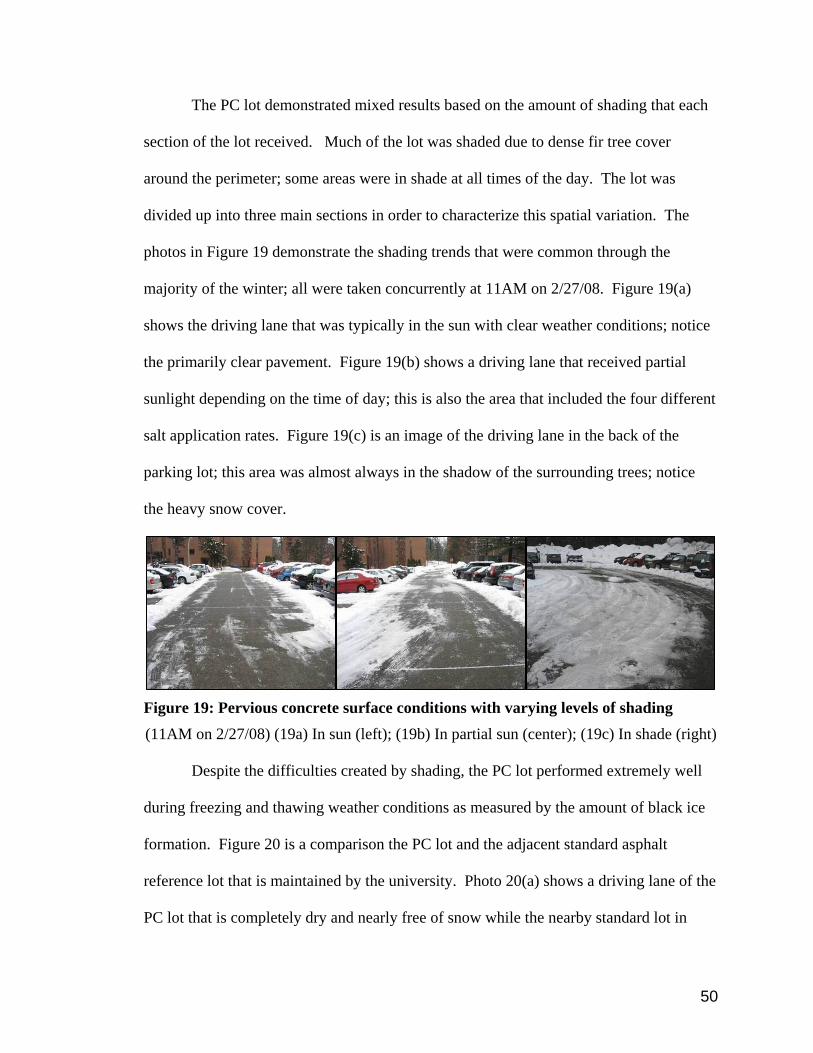
50
The PC lot demonstrated mixed results based on the amount of shading that each
section of the lot received. Much of the lot was shaded due to dense fir tree cover
around the perimeter; some areas were in shade at all times of the day. The lot was
divided up into three main sections in order to characterize this spatial variation. The
photos in Figure 19 demonstrate the shading trends that were common through the
majority of the winter; all were taken concurrently at 11AM on 2/27/08. Figure 19(a)
shows the driving lane that was typically in the sun with clear weather conditions; notice
the primarily clear pavement. Figure 19(b) shows a driving lane that received partial
sunlight depending on the time of day; this is also the area that included the four different
salt application rates. Figure 19(c) is an image of the driving lane in the back of the
parking lot; this area was almost always in the shadow of the surrounding trees; notice
the heavy snow cover.
Figure 19: Pervious concrete surface conditions with varying levels of shading
(11AM on 2/27/08) (19a) In sun (left); (19b) In partial sun (center); (19c) In shade (right)
Despite the difficulties created by shading, the PC lot performed extremely well
during freezing and thawing weather conditions as measured by the amount of black ice
formation. Figure 20 is a comparison the PC lot and the adjacent standard asphalt
reference lot that is maintained by the university. Photo 20(a) shows a driving lane of the
PC lot that is completely dry and nearly free of snow while the nearby standard lot in

51
20(b) is almost entirely covered with black-ice and water. These photos were taken at
12:50PM on 2/16/08 when the air temperature was approximately 22.5ºF; a low of 14ºF
was reached at 7:15AM (UNHWS, 2008). The standard winter maintenance practice for
the UNH Grounds & Roads Dept. is that when nightly air temperatures are below
freezing, salt is applied to most roads and parking lots to combat the formation of black
ice. The lot in 20(b) was treated in this manner. Conversely, no salt was needed on the
PC pavement under these weather conditions since standing water was never an issue. In
these photos, snow is observed in the parking stalls. The stalls are not plowed because
often cars remain there before, during, and after snowfall events.
Figure 20: Pavement conditions after thawing and refreezing of meltwater
(12:50PM on 2/16/08) (20a) PC at 12:50PM (left); (20b) Stnd. Ref. lot at 12:50PM (right)
Snow/Ice Surface Cover Analysis
The amount and type of snow/ice surface cover (dry, wet, slush, snow,
compacted-snow, or ice) that was observed on each study area after storm events was
recorded in order to make comparisons between salt applications and pavement type.
Data for the entire ’07-’08 winter season was grouped and compared statistically and
graphically. Figure 21 presents the snow and ice cover for all study areas; the median
surface cover percentages are displayed next to each data set. Monitoring characteristics
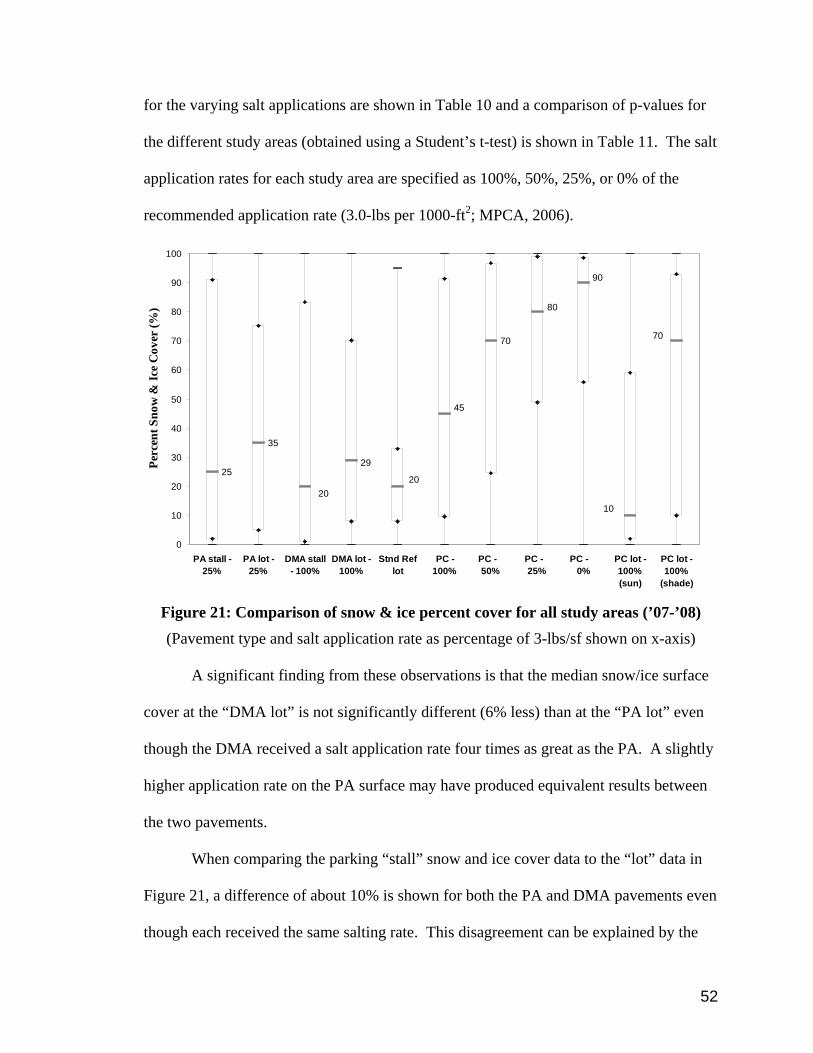
52
for the varying salt applications are shown in Table 10 and a comparison of p-values for
the different study areas (obtained using a Student’s t-test) is shown in Table 11. The salt
application rates for each study area are specified as 100%, 50%, 25%, or 0% of the
recommended application rate (3.0-lbs per 1000-ft2; MPCA, 2006).
25
35
70
29
90
80
45
70
1020
20
0
10
20
30
40
50
60
70
80
90
100
PA stall -25%
PA lot -25%
DMA stall- 100%
DMA lot -100%
Stnd Reflot
PC -100%
PC - 50%
PC - 25%
PC - 0%
PC lot -100%(sun)
PC lot -100%
(shade)
Perc
ent S
now
& Ic
e C
over
(%)
Figure 21: Comparison of snow & ice percent cover for all study areas (’07-’08) (Pavement type and salt application rate as percentage of 3-lbs/sf shown on x-axis)
A significant finding from these observations is that the median snow/ice surface
cover at the “DMA lot” is not significantly different (6% less) than at the “PA lot” even
though the DMA received a salt application rate four times as great as the PA. A slightly
higher application rate on the PA surface may have produced equivalent results between
the two pavements.
When comparing the parking “stall” snow and ice cover data to the “lot” data in
Figure 21, a difference of about 10% is shown for both the PA and DMA pavements even
though each received the same salting rate. This disagreement can be explained by the
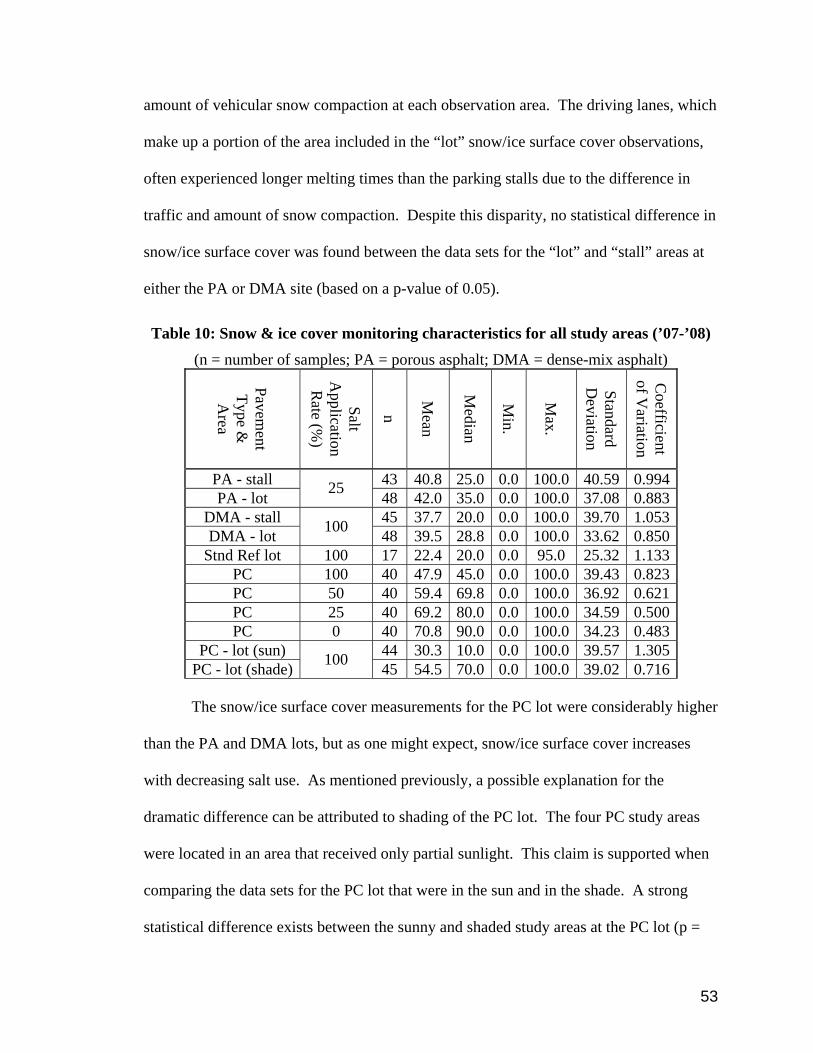
53
amount of vehicular snow compaction at each observation area. The driving lanes, which
make up a portion of the area included in the “lot” snow/ice surface cover observations,
often experienced longer melting times than the parking stalls due to the difference in
traffic and amount of snow compaction. Despite this disparity, no statistical difference in
snow/ice surface cover was found between the data sets for the “lot” and “stall” areas at
either the PA or DMA site (based on a p-value of 0.05).
Table 10: Snow & ice cover monitoring characteristics for all study areas (’07-’08) (n = number of samples; PA = porous asphalt; DMA = dense-mix asphalt)
Pavement
Type &
Area
Salt A
pplication R
ate (%)
n
Mean
Median
Min.
Max.
Standard D
eviation
Coefficient
of Variation
PA - stall 43 40.8 25.0 0.0 100.0 40.59 0.994PA - lot 25 48 42.0 35.0 0.0 100.0 37.08 0.883
DMA - stall 45 37.7 20.0 0.0 100.0 39.70 1.053DMA - lot 100 48 39.5 28.8 0.0 100.0 33.62 0.850
Stnd Ref lot 100 17 22.4 20.0 0.0 95.0 25.32 1.133PC 100 40 47.9 45.0 0.0 100.0 39.43 0.823PC 50 40 59.4 69.8 0.0 100.0 36.92 0.621PC 25 40 69.2 80.0 0.0 100.0 34.59 0.500PC 0 40 70.8 90.0 0.0 100.0 34.23 0.483
PC - lot (sun) 44 30.3 10.0 0.0 100.0 39.57 1.305PC - lot (shade) 100 45 54.5 70.0 0.0 100.0 39.02 0.716 The snow/ice surface cover measurements for the PC lot were considerably higher
than the PA and DMA lots, but as one might expect, snow/ice surface cover increases
with decreasing salt use. As mentioned previously, a possible explanation for the
dramatic difference can be attributed to shading of the PC lot. The four PC study areas
were located in an area that received only partial sunlight. This claim is supported when
comparing the data sets for the PC lot that were in the sun and in the shade. A strong
statistical difference exists between the sunny and shaded study areas at the PC lot (p =
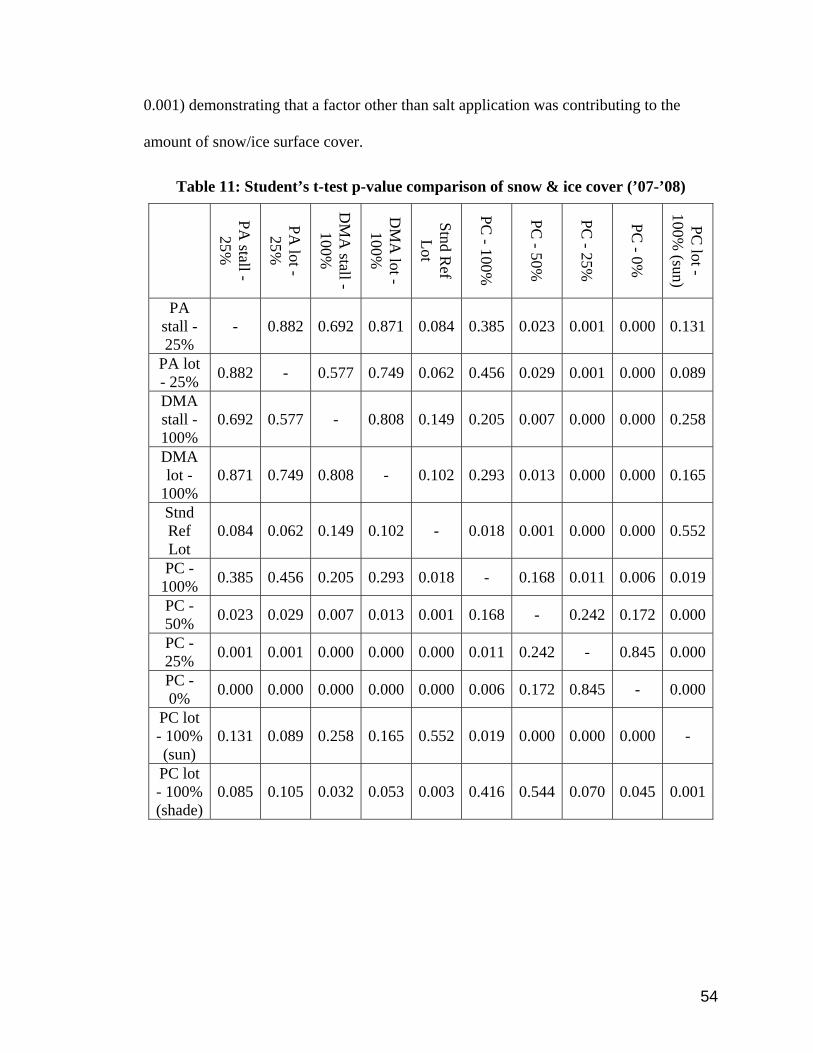
54
0.001) demonstrating that a factor other than salt application was contributing to the
amount of snow/ice surface cover.
Table 11: Student’s t-test p-value comparison of snow & ice cover (’07-’08)
PA stall -
25%
PA lot -
25%
DM
A stall -
100%
DM
A lot -
100%
Stnd Ref
Lot
PC - 100%
PC - 50%
PC - 25%
PC - 0%
PC lot -
100% (sun)
PA stall - 25%
- 0.882 0.692 0.871 0.084 0.385 0.023 0.001 0.000 0.131
PA lot - 25% 0.882 - 0.577 0.749 0.062 0.456 0.029 0.001 0.000 0.089
DMA stall - 100%
0.692 0.577 - 0.808 0.149 0.205 0.007 0.000 0.000 0.258
DMA lot -
100% 0.871 0.749 0.808 - 0.102 0.293 0.013 0.000 0.000 0.165
Stnd Ref Lot
0.084 0.062 0.149 0.102 - 0.018 0.001 0.000 0.000 0.552
PC - 100% 0.385 0.456 0.205 0.293 0.018 - 0.168 0.011 0.006 0.019
PC - 50% 0.023 0.029 0.007 0.013 0.001 0.168 - 0.242 0.172 0.000
PC - 25% 0.001 0.001 0.000 0.000 0.000 0.011 0.242 - 0.845 0.000
PC - 0% 0.000 0.000 0.000 0.000 0.000 0.006 0.172 0.845 - 0.000
PC lot - 100% (sun)
0.131 0.089 0.258 0.165 0.552 0.019 0.000 0.000 0.000 -
PC lot - 100% (shade)
0.085 0.105 0.032 0.053 0.003 0.416 0.544 0.070 0.045 0.001
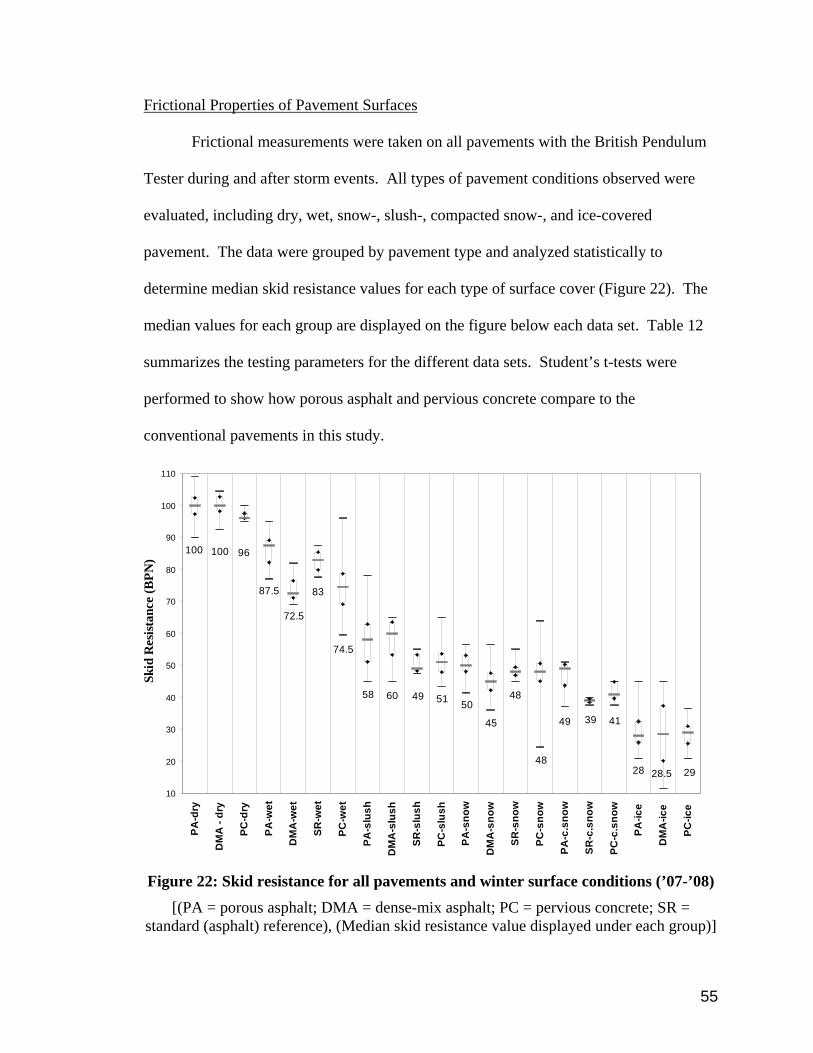
55
Frictional Properties of Pavement Surfaces
Frictional measurements were taken on all pavements with the British Pendulum
Tester during and after storm events. All types of pavement conditions observed were
evaluated, including dry, wet, snow-, slush-, compacted snow-, and ice-covered
pavement. The data were grouped by pavement type and analyzed statistically to
determine median skid resistance values for each type of surface cover (Figure 22). The
median values for each group are displayed on the figure below each data set. Table 12
summarizes the testing parameters for the different data sets. Student’s t-tests were
performed to show how porous asphalt and pervious concrete compare to the
conventional pavements in this study.
45
72.5
2928.528
4149 39
48
48496058
83
96
87.5
100100
74.5
51 50
10
20
30
40
50
60
70
80
90
100
110
PA-d
ry
DM
A -
dry
PC-d
ry
PA-w
et
DM
A-w
et
SR-w
et
PC-w
et
PA-s
lush
DM
A-s
lush
SR-s
lush
PC-s
lush
PA-s
now
DM
A-s
now
SR-s
now
PC-s
now
PA-c
.sno
w
SR-c
.sno
w
PC-c
.sno
w
PA-ic
e
DM
A-ic
e
PC-ic
e
Skid
Res
ista
nce
(BPN
)
Figure 22: Skid resistance for all pavements and winter surface conditions (’07-’08)
[(PA = porous asphalt; DMA = dense-mix asphalt; PC = pervious concrete; SR = standard (asphalt) reference), (Median skid resistance value displayed under each group)]
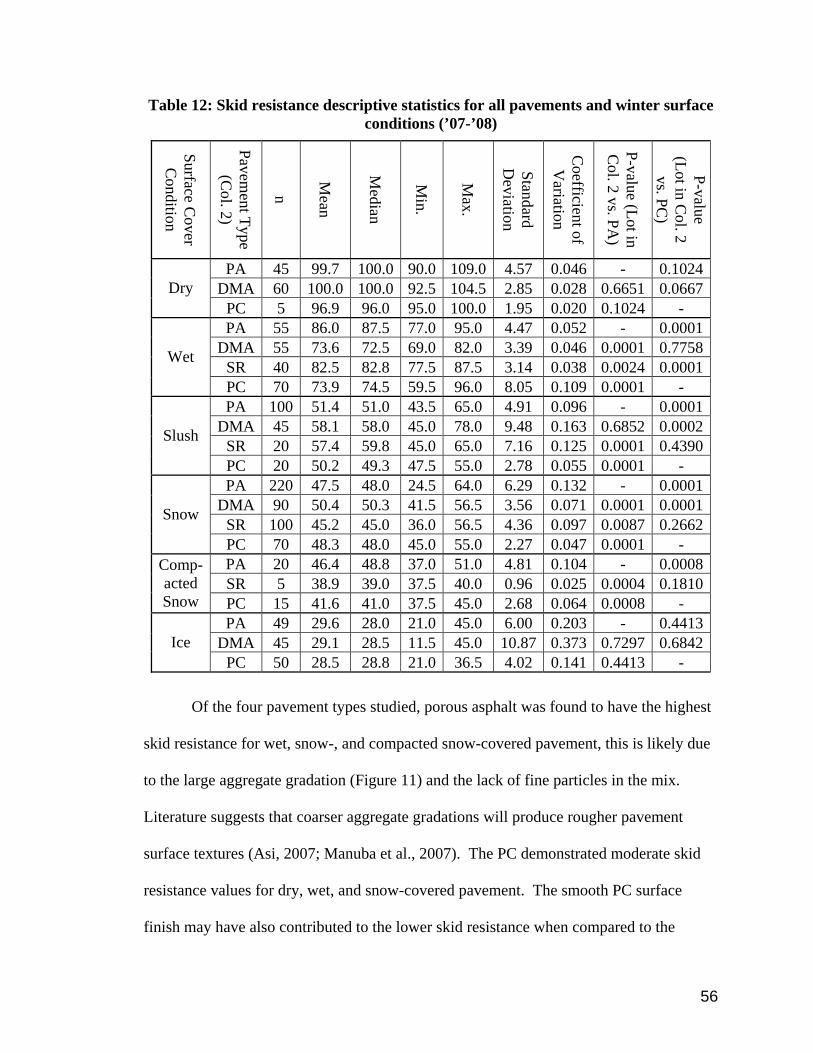
56
Table 12: Skid resistance descriptive statistics for all pavements and winter surface conditions (’07-’08)
Surface Cover
Condition
Pavement Type
(Col. 2)
n
Mean
Median
Min.
Max.
Standard D
eviation
Coefficient of V
ariation
P-value (Lot in C
ol. 2 vs. PA)
P-value (Lot in C
ol. 2 vs. PC
)
PA 45 99.7 100.0 90.0 109.0 4.57 0.046 - 0.1024DMA 60 100.0 100.0 92.5 104.5 2.85 0.028 0.6651 0.0667Dry
PC 5 96.9 96.0 95.0 100.0 1.95 0.020 0.1024 - PA 55 86.0 87.5 77.0 95.0 4.47 0.052 - 0.0001
DMA 55 73.6 72.5 69.0 82.0 3.39 0.046 0.0001 0.7758SR 40 82.5 82.8 77.5 87.5 3.14 0.038 0.0024 0.0001
Wet
PC 70 73.9 74.5 59.5 96.0 8.05 0.109 0.0001 - PA 100 51.4 51.0 43.5 65.0 4.91 0.096 - 0.0001
DMA 45 58.1 58.0 45.0 78.0 9.48 0.163 0.6852 0.0002SR 20 57.4 59.8 45.0 65.0 7.16 0.125 0.0001 0.4390
Slush
PC 20 50.2 49.3 47.5 55.0 2.78 0.055 0.0001 - PA 220 47.5 48.0 24.5 64.0 6.29 0.132 - 0.0001
DMA 90 50.4 50.3 41.5 56.5 3.56 0.071 0.0001 0.0001SR 100 45.2 45.0 36.0 56.5 4.36 0.097 0.0087 0.2662
Snow
PC 70 48.3 48.0 45.0 55.0 2.27 0.047 0.0001 - PA 20 46.4 48.8 37.0 51.0 4.81 0.104 - 0.0008SR 5 38.9 39.0 37.5 40.0 0.96 0.025 0.0004 0.1810
Comp-acted Snow PC 15 41.6 41.0 37.5 45.0 2.68 0.064 0.0008 -
PA 49 29.6 28.0 21.0 45.0 6.00 0.203 - 0.4413DMA 45 29.1 28.5 11.5 45.0 10.87 0.373 0.7297 0.6842Ice
PC 50 28.5 28.8 21.0 36.5 4.02 0.141 0.4413 -
Of the four pavement types studied, porous asphalt was found to have the highest
skid resistance for wet, snow-, and compacted snow-covered pavement, this is likely due
to the large aggregate gradation (Figure 11) and the lack of fine particles in the mix.
Literature suggests that coarser aggregate gradations will produce rougher pavement
surface textures (Asi, 2007; Manuba et al., 2007). The PC demonstrated moderate skid
resistance values for dry, wet, and snow-covered pavement. The smooth PC surface
finish may have also contributed to the lower skid resistance when compared to the
57
tackiness of asphalt mixes. It is significant to note the similarities in skid resistance for
PA and DMA between this winter and the ’06-’07 winter presented in Houle (2008). The
median values exhibit only slight differences between seasons, some of this variation
may be due in part to the inclusion of additional snow/ice surface cover types (slush and
compacted snow) in the ’07-’08 winter.
By multiplying the mean skid resistance values by the snow and ice surface cover
percentages a weighted skid resistance value was developed (Figure 23). The purpose of
a weighted skid resistance was to assign a single number that can describe the pavement
safety when compared to standard, dry conditions. The median skid resistance for the
“PA lot” was 12% higher than the “DMA lot” even though the salt application rate was a
quarter of that which was applied to the DMA surface. Similarly, the standard reference
lots, which received regular plowing and salting by the UNH Grounds & Roads Dept.,
also demonstrated lower frictional resistance than the porous asphalt lot. The weighted
skid resistance for the PA “stall” measurements in Figure 23 correlate extremely well
with the data from the ’06-’07 winter (Figure 9). A median value of 77 BPN was
observed for the ’07-‘08 winter with the 25% salt application rate, whereas for the ’06-
’07 winter, a BPN of 79 was shown. The “stall” measurements serve best for making
comparisons between winters because the ’06-’07 study focused only on areas that were
not utilized for parking. A p-value of 0.662 was calculated between winters for the PA
lot, suggesting that annual differences in weather conditions did not statistically change
the results. The difference between the two seasons for the DMA parking stall study
areas was 7 BPNs with a p-value of 0.298, also suggesting no statistical difference
between winters.
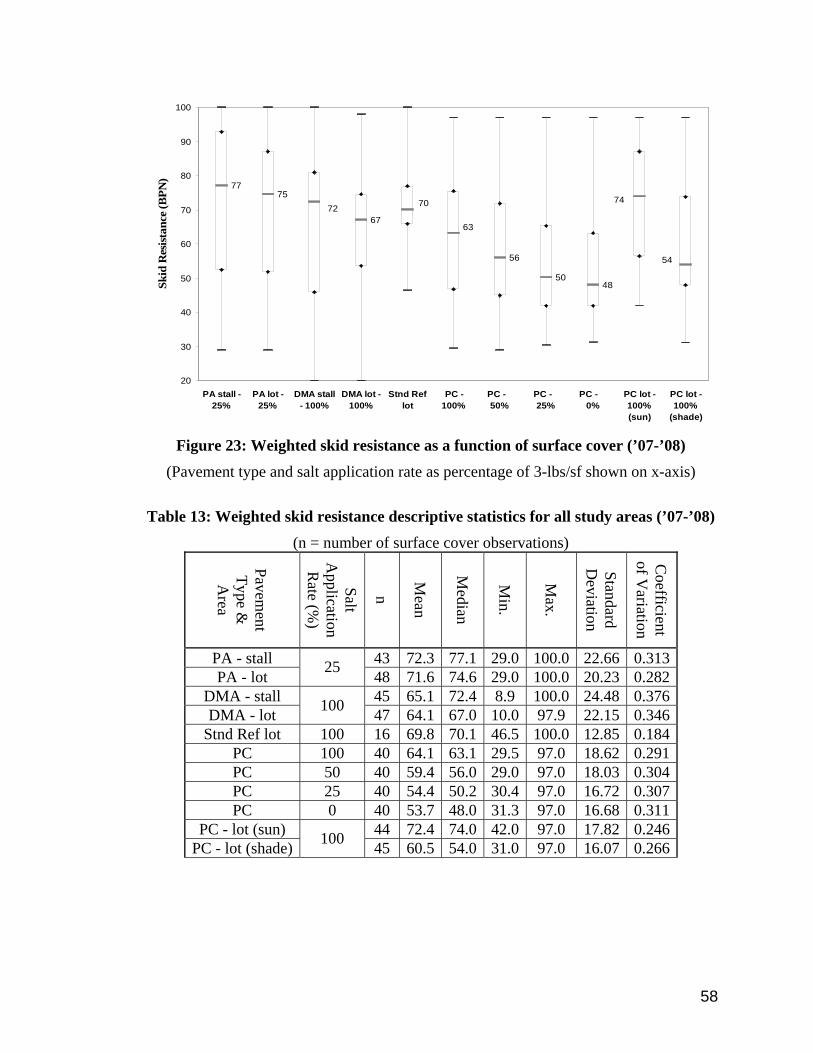
58
7775
67
56
5048
63
54
7472 70
20
30
40
50
60
70
80
90
100
PA stall -25%
PA lot -25%
DMA stall- 100%
DMA lot -100%
Stnd Reflot
PC -100%
PC - 50%
PC - 25%
PC - 0%
PC lot -100%(sun)
PC lot -100%
(shade)
Skid
Res
ista
nce
(BPN
)
Figure 23: Weighted skid resistance as a function of surface cover (’07-’08)
(Pavement type and salt application rate as percentage of 3-lbs/sf shown on x-axis)
Table 13: Weighted skid resistance descriptive statistics for all study areas (’07-’08) (n = number of surface cover observations)
Pavement
Type &
Area
Salt A
pplication R
ate (%)
n
Mean
Median
Min.
Max.
Standard D
eviation
Coefficient
of Variation
PA - stall 43 72.3 77.1 29.0 100.0 22.66 0.313PA - lot 25 48 71.6 74.6 29.0 100.0 20.23 0.282
DMA - stall 45 65.1 72.4 8.9 100.0 24.48 0.376DMA - lot 100 47 64.1 67.0 10.0 97.9 22.15 0.346
Stnd Ref lot 100 16 69.8 70.1 46.5 100.0 12.85 0.184PC 100 40 64.1 63.1 29.5 97.0 18.62 0.291PC 50 40 59.4 56.0 29.0 97.0 18.03 0.304PC 25 40 54.4 50.2 30.4 97.0 16.72 0.307PC 0 40 53.7 48.0 31.3 97.0 16.68 0.311
PC - lot (sun) 44 72.4 74.0 42.0 97.0 17.82 0.246PC - lot (shade) 100 45 60.5 54.0 31.0 97.0 16.07 0.266
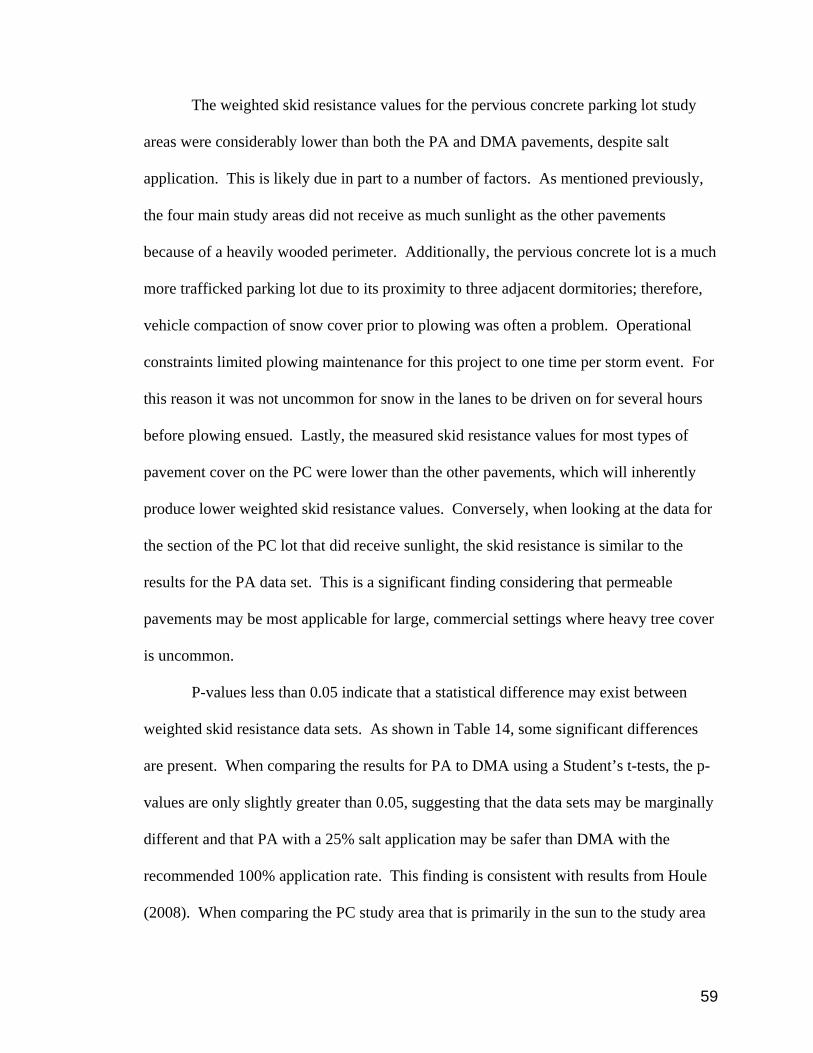
59
The weighted skid resistance values for the pervious concrete parking lot study
areas were considerably lower than both the PA and DMA pavements, despite salt
application. This is likely due in part to a number of factors. As mentioned previously,
the four main study areas did not receive as much sunlight as the other pavements
because of a heavily wooded perimeter. Additionally, the pervious concrete lot is a much
more trafficked parking lot due to its proximity to three adjacent dormitories; therefore,
vehicle compaction of snow cover prior to plowing was often a problem. Operational
constraints limited plowing maintenance for this project to one time per storm event. For
this reason it was not uncommon for snow in the lanes to be driven on for several hours
before plowing ensued. Lastly, the measured skid resistance values for most types of
pavement cover on the PC were lower than the other pavements, which will inherently
produce lower weighted skid resistance values. Conversely, when looking at the data for
the section of the PC lot that did receive sunlight, the skid resistance is similar to the
results for the PA data set. This is a significant finding considering that permeable
pavements may be most applicable for large, commercial settings where heavy tree cover
is uncommon.
P-values less than 0.05 indicate that a statistical difference may exist between
weighted skid resistance data sets. As shown in Table 14, some significant differences
are present. When comparing the results for PA to DMA using a Student’s t-tests, the p-
values are only slightly greater than 0.05, suggesting that the data sets may be marginally
different and that PA with a 25% salt application may be safer than DMA with the
recommended 100% application rate. This finding is consistent with results from Houle
(2008). When comparing the PC study area that is primarily in the sun to the study area
60
primarily in the shade a p-value of 0.004 is shown, suggesting a strong difference. Also
of importance are certain data sets that are not statistically different. The PC lot study
area in the sun compared to the PA lot demonstrate very similar weighted skid resistance
results (p = 0.847). This is a notable finding because it shows that pervious concrete may
exhibit similar surface conditions to porous asphalt if used under more typical site
conditions (i.e. few surrounding trees). A comparison between results for the DMA lot
and for the Standard Reference Lot also exhibits a high p-value. This fact helps to verify
that the winter maintenance methods used in this study were similar to the methods used
by UNH Grounds & Roads.
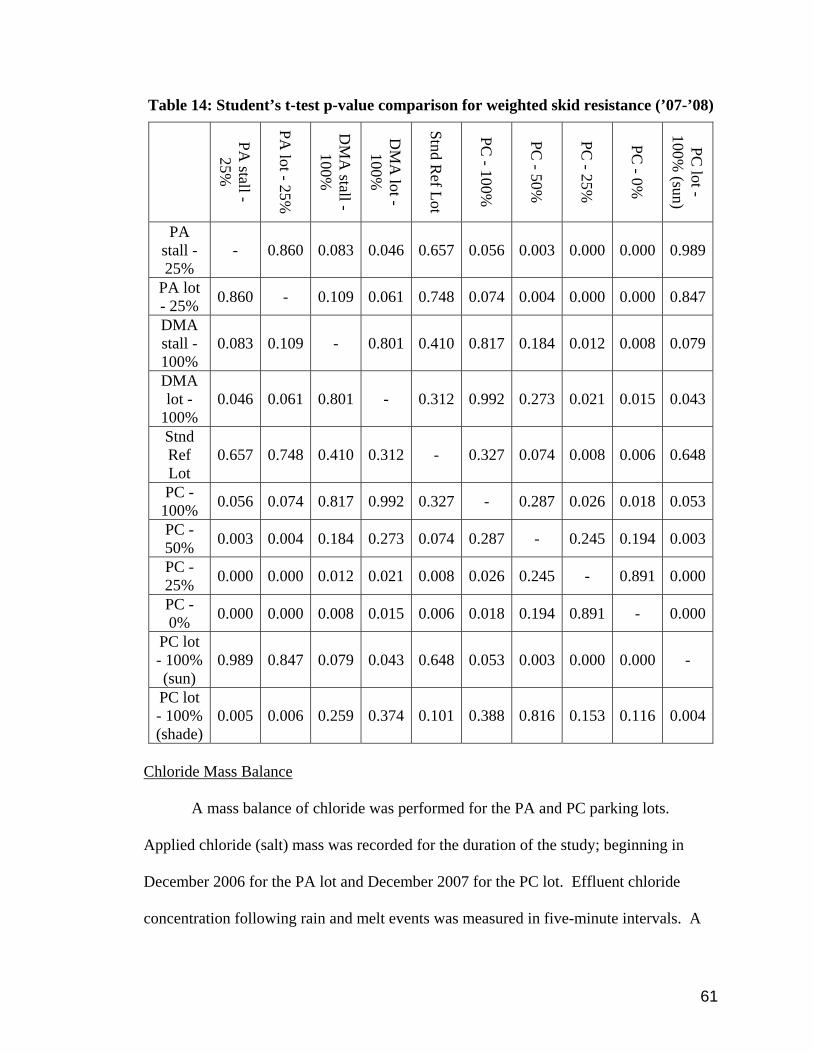
61
Table 14: Student’s t-test p-value comparison for weighted skid resistance (’07-’08)
PA stall -
25%
PA lot - 25%
DM
A stall -
100%
DM
A lot -
100%
Stnd Ref Lot
PC - 100%
PC - 50%
PC - 25%
PC - 0%
PC lot -
100% (sun)
PA stall - 25%
- 0.860 0.083 0.046 0.657 0.056 0.003 0.000 0.000 0.989
PA lot - 25% 0.860 - 0.109 0.061 0.748 0.074 0.004 0.000 0.000 0.847
DMA stall - 100%
0.083 0.109 - 0.801 0.410 0.817 0.184 0.012 0.008 0.079
DMA lot -
100% 0.046 0.061 0.801 - 0.312 0.992 0.273 0.021 0.015 0.043
Stnd Ref Lot
0.657 0.748 0.410 0.312 - 0.327 0.074 0.008 0.006 0.648
PC - 100% 0.056 0.074 0.817 0.992 0.327 - 0.287 0.026 0.018 0.053
PC - 50% 0.003 0.004 0.184 0.273 0.074 0.287 - 0.245 0.194 0.003
PC - 25% 0.000 0.000 0.012 0.021 0.008 0.026 0.245 - 0.891 0.000
PC - 0% 0.000 0.000 0.008 0.015 0.006 0.018 0.194 0.891 - 0.000
PC lot - 100% (sun)
0.989 0.847 0.079 0.043 0.648 0.053 0.003 0.000 0.000 -
PC lot - 100% (shade)
0.005 0.006 0.259 0.374 0.101 0.388 0.816 0.153 0.116 0.004
Chloride Mass Balance
A mass balance of chloride was performed for the PA and PC parking lots.
Applied chloride (salt) mass was recorded for the duration of the study; beginning in
December 2006 for the PA lot and December 2007 for the PC lot. Effluent chloride
concentration following rain and melt events was measured in five-minute intervals. A
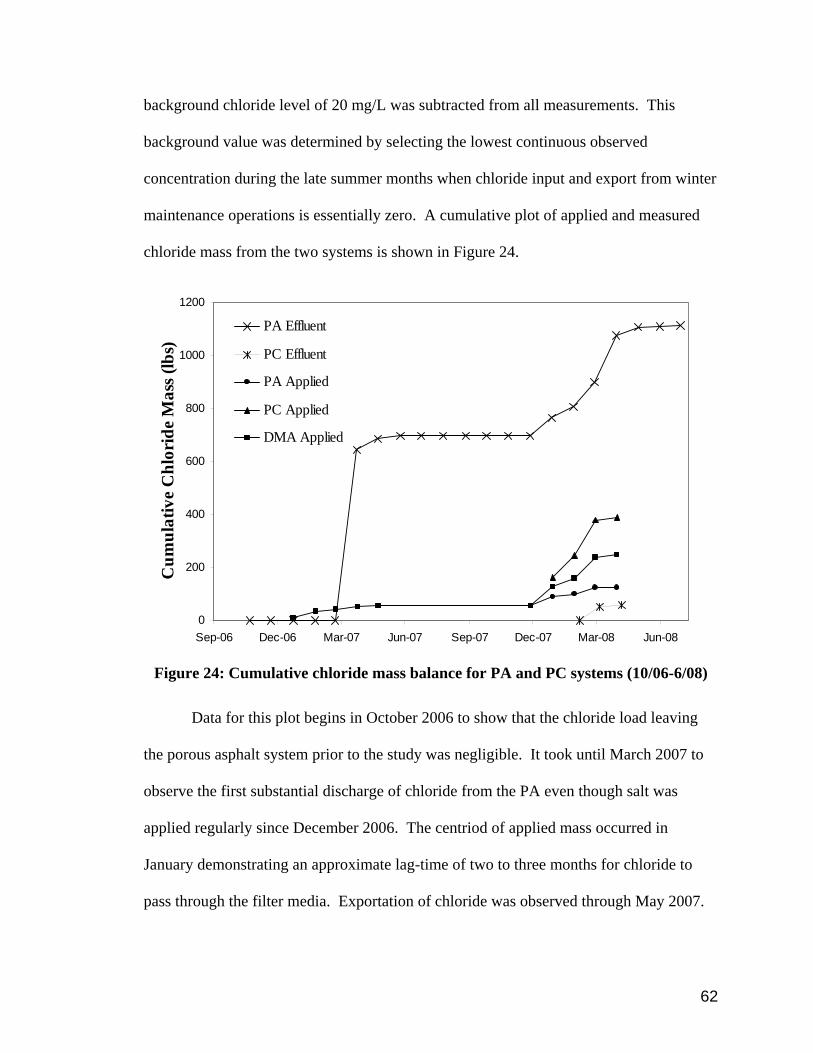
62
background chloride level of 20 mg/L was subtracted from all measurements. This
background value was determined by selecting the lowest continuous observed
concentration during the late summer months when chloride input and export from winter
maintenance operations is essentially zero. A cumulative plot of applied and measured
chloride mass from the two systems is shown in Figure 24.
0
200
400
600
800
1000
1200
Sep-06 Dec-06 Mar-07 Jun-07 Sep-07 Dec-07 Mar-08 Jun-08
Cum
ulat
ive
Chl
orid
e M
ass (
lbs)
PA Effluent
PC Effluent
PA Applied
PC Applied
DMA Applied
Figure 24: Cumulative chloride mass balance for PA and PC systems (10/06-6/08)
Data for this plot begins in October 2006 to show that the chloride load leaving
the porous asphalt system prior to the study was negligible. It took until March 2007 to
observe the first substantial discharge of chloride from the PA even though salt was
applied regularly since December 2006. The centriod of applied mass occurred in
January demonstrating an approximate lag-time of two to three months for chloride to
pass through the filter media. Exportation of chloride was observed through May 2007.
63
It is likely that a 7.5-inch rain event that occurred on 4/16/07 contributed to the abrupt
flushing of the system.
During the ’06-’07 winter a total of 56.1-lbs of chloride (92.5-lbs of salt) was
applied to the PA lot, while 696-lbs Cl- was measured in the effluent. Possible
explanations for this discrepancy may be related to chloride inputs through groundwater
movement into the system. It is probable that road salt from seasonal use infiltrated
through up-gradient soils (from salting of nearby Route 155A and the nine-acre West
Edge lot) penetrated the PA sub-surface reservoir, which then exited the system through
the perforated drains during rainfall events. Seasonal increases in atmospheric
deposition, water softeners, and mineral weathering may account for additional chloride
entering the system (Trowbridge, 2007a, 2007b). There is a septic system up-gradient of
the PA lot. Flow metering measurement errors and inaccuracies in the chloride-specific
conductance regression curve may have led to the underestimation of background
chloride levels. Calibrating the flow/depth measuring instruments and verifying that the
chloride-specific conductance relationship, which was developed for the West Edge
Parking Lot runoff, is also valid for groundwater may help provide further insight.
Research is currently underway at the UNHSC to address these chloride balance issues.
Similar mass-balance errors were observed with the PA system for the ‘07-‘08
winter. A total of 68.5-lbs of chloride was applied, whereas 416-lbs Cl- were measured.
One major difference between study years concerns the lag-time of the chloride leaving
the PA systems. Almost no lag in chloride mass was observed at the start of the winter;
measurable chloride was present the same month as when salt applications commenced
(December, 2007). At the end of the season, elevated chloride (measured as specific
64
conductance) was observed in the effluent two-months after the last salt application,
suggesting that the system has a capacity to store and then distribute the chloride load
over a longer time period than would be observed on a standard, impermeable asphalt
pavement, therefore reducing acute levels at the receiving water.
The PC lot showed the ability to reduce the effluent chloride load. A total of
390.5-lbs of chloride was applied from Dec. ’07 to April ’08 whereas only 60-lbs were
measured leaving the system through the subdrains. Part of the reason for this is that
effluent did not exit through the sub-drains until Feb. ’08. The PC lot is situated on an
SCS Type B soil that has the ability to infiltrate water substantially faster than the D soils
located at the PA site. This fact will reduce chloride levels in surface waters, thereby
improving conditions for fish and other species, but may negatively impact groundwater
systems if they are recharged by the chloride laden infiltration waters. Specific
conductance was not measured at the PC lot until March so it is likely that chloride mass
did leave the system during two February rain events, accounting for some of the
discrepancy. Effluent flow has not been observed through the PC system sub-drains
between April and June 2008. Additional monitoring of all systems, including monthly
sampling of perimeter wells, should be performed in order to refine future annual mass
balances and better quantify chloride reduction and/or lag capabilities.
Salt Load Reductions
Possible annual salt load reductions were estimated by determining which events
required deicing salt applications. If substantial snow or ice (>5%) existed on the
pavement during the surface cover evaluation then it was decided that at least one deicing
salt application was necessary. The majority of events required that all lots be deiced
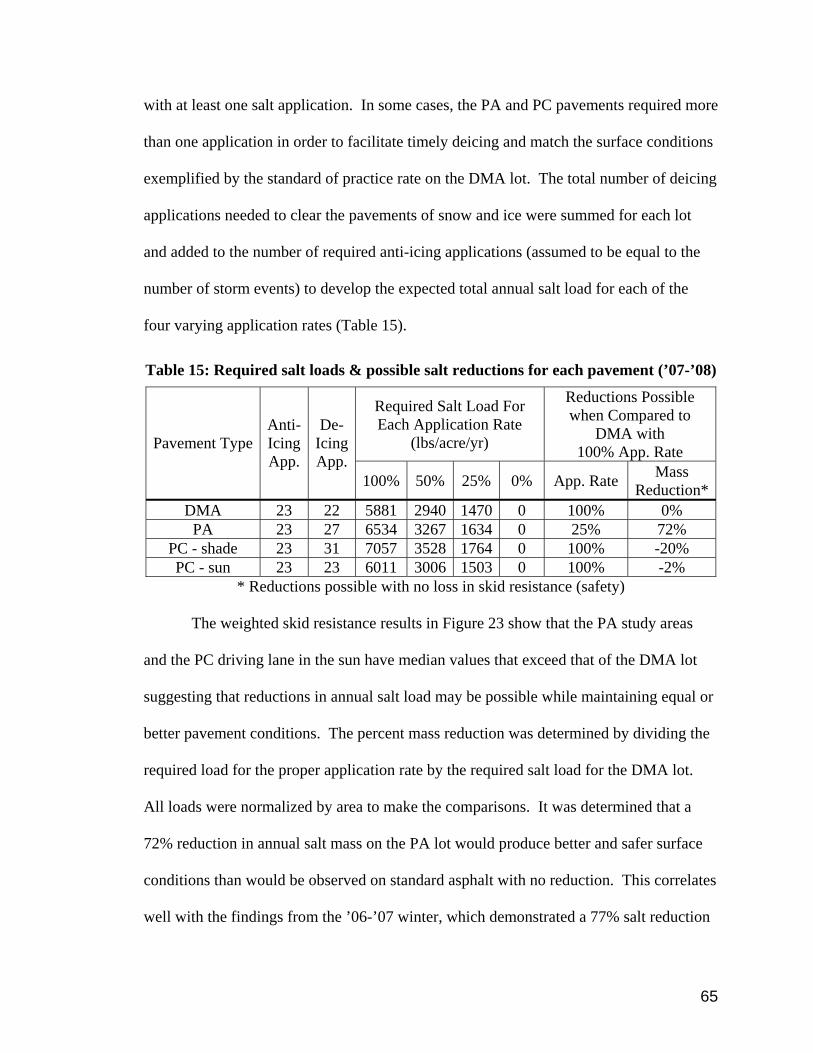
65
with at least one salt application. In some cases, the PA and PC pavements required more
than one application in order to facilitate timely deicing and match the surface conditions
exemplified by the standard of practice rate on the DMA lot. The total number of deicing
applications needed to clear the pavements of snow and ice were summed for each lot
and added to the number of required anti-icing applications (assumed to be equal to the
number of storm events) to develop the expected total annual salt load for each of the
four varying application rates (Table 15).
Table 15: Required salt loads & possible salt reductions for each pavement (’07-’08)
Required Salt Load For Each Application Rate
(lbs/acre/yr)
Reductions Possible when Compared to
DMA with 100% App. Rate Pavement Type
Anti- Icing App.
De- Icing App.
100% 50% 25% 0% App. Rate Mass Reduction*
DMA 23 22 5881 2940 1470 0 100% 0% PA 23 27 6534 3267 1634 0 25% 72%
PC - shade 23 31 7057 3528 1764 0 100% -20% PC - sun 23 23 6011 3006 1503 0 100% -2%
* Reductions possible with no loss in skid resistance (safety)
The weighted skid resistance results in Figure 23 show that the PA study areas
and the PC driving lane in the sun have median values that exceed that of the DMA lot
suggesting that reductions in annual salt load may be possible while maintaining equal or
better pavement conditions. The percent mass reduction was determined by dividing the
required load for the proper application rate by the required salt load for the DMA lot.
All loads were normalized by area to make the comparisons. It was determined that a
72% reduction in annual salt mass on the PA lot would produce better and safer surface
conditions than would be observed on standard asphalt with no reduction. This correlates
well with the findings from the ’06-’07 winter, which demonstrated a 77% salt reduction
66
for the PA lot. This is significant considering that proposed chloride TMDLs in NH will
require that parking lot salt use be reduced by 20 to 40% in order to improve water
quality in several receiving streams (Trowbridge, 2007a, 2007b). The PA lot was the
only pavement studied that demonstrated a possible salt mass reduction. However, the
section of the PC lot that was primarily in the sun required only 2% more salt use than
was needed at the DMA lot (based on the MPCA recommended salting rate of 3.0-lbs per
1000-ft2) and produced skid resistance conditions exceeding those measured at the DMA
lot. It is likely that the conditions of the two pavements would be similar if a slight salt
mass reduction on the PC lot took place because salt crystals were often observed on the
pavement surface long after storm events (Houle, 2008).
Conclusions
In summary, two years of winter performance evaluations have demonstrated that
PA can perform extremely well in northern climates. Frost depth penetration and freeze-
thaw temperature cycles have not compromised the integrity of the system structurally,
visually, or hydraulically. Research has shown (both through literature and field testing)
that PA exhibits greater frictional resistance and can become clear of snow and ice faster
than conventional pavements. Substantial reductions in annual salt loads for anti-
icing/deicing practices were observed, reaching over 70% during the study. Providing
that plowing was regularly performed, salting was needed only for events where freezing
rain created icy conditions. No salt was required on days when refreezing of meltwater
was a problem on standard asphalt.

67
The results obtained from studying PC varied from PA but showed strengths in
other areas. The surface infiltration rates measured on the PC lot exceeded those that
were observed on the PA. The benefit of this is that the PC will have a greater tolerance
for clogging if sand or organic debris is present at the site. Additionally, binder drain-
down is not a consideration with PC, as is the case with some PA mixes, making for a
possible longer service life. Overall, the skid resistance and salt reduction capabilities for
the PC lot were not as great as was shown for the PA. It is suspected that shading was
the main contributing factor for this finding. The reasoning for this can be explained
when looking at sections of PC pavement where shading was not as prominent and trees
did not obstruct direct sunlight. Under these conditions the results drastically improve
and the weighted skid resistance is shown to surpass that of the DMA lot (Figure 23). In
addition to the shading, it is believed that the white pavement color of the PC contributed
to the high levels of surface cover. White pavements are more efficient at reflecting
radiation, which can be beneficial in the summer months by lowering surface and air
temperatures and consequently reducing the urban ‘heat island’ effect often associated
with black, asphalt-based pavements, but non-ideal during the winter since the absorption
of heat into the pavement will help to melt snow and ice (U.S. EPA, 2007). Salt
reductions during freeze-thaw events were achievable provided the lot was adequately
plowed after storm events, an important consideration for all pavements not just PC.
The use of innovative stormwater management technologies is necessary for
communities to comply with current regulations such as NPDES Phase II requirements as
well as the numerous surface water TMDLs in place today. This research has shown that
permeable pavements are an improvement over conventional parking lot designs and can

68
be used to help meet these imposed guidelines. The ability of permeable pavements to
not only serve as self-contained stormwater management/treatment systems but to also
demonstrate winter performance improvements over impermeable designs, including
annual salt reductions, make them attractive in a variety of climates and settings.
69
CHAPTER 4
AN ANALYSIS OF PROJECT COSTS
An analysis of the project costs for porous asphalt (PA), dense-mix asphalt
(DMA), and pervious concrete (PC) parking lots is presented in this chapter. The cost
itemizations were derived from the invoices submitted by the contractors that performed
specific construction tasks. Each project consisted of project management, site
excavations and grading, placement of sub-grade materials, placement of pavement
materials, perimeter construction, landscaping, and miscellaneous work associated with
research and monitoring needs. All incurred costs were tabulated, summed, and broken
down by several metrics, including cost per pavement weight/volume and cost per
parking stall. Adjustments were made to the total costs to account for aspects that were
specific to the UNHSC research designs and not necessarily part of a typical
design/installation. Total costs were also adjusted for inflation from 2004 and 2007 to
May 2008 U.S. dollars; an inflation rate of 15% and 4%, respectively, was assumed
during those periods (U.S. BLS, 2008).
The PA and DMA lots were constructed at the same time and were consequently
billed together. Therefore, the costs for each task had to be divided according to the
percentage associated with each lot. Table 16 displays the allocation of costs for the two
parking lots. In most instances, since the PA and DMA lots were equally sized, the
itemized costs for each lot were assumed to be 50% of each billed cost except where

70
specified. Labor and materials costs were also estimated and each was assumed to make
up half of the itemized costs for each lot (i.e. 25% of the total itemized costs) (Briggs,
2006).
Costs per parking stall for the UNH installation were found to be approximately
$4,455 for PA and $3,456 for DMA in May 2008 dollars. When adjusted for a typical,
non-research installation, the cost for PA was reduced to $2,578, a cost that is
competitive with dense-mix asphalt. Briggs (2006) quoted costs of $2,300 per parking
stall for DMA at the West Edge parking lot. Costs of PA materials per ton of asphalt
were determined to be $388 for the UNH installation and $223 for a typical installation.
A total of 120 tons of porous asphalt material was required for this project. Further
explanation of the construction cost breakdown for the PA and DMA lots can be
referenced in Briggs (2006). When winter maintenance costs associated with salting
operations are considered and factored into long-term project costs (or life cycle costs),
PA becomes even more appealing economically. In Chapters 2 and 3, an average 75%
reduction in annual salt load was shown and with salt reaching $46 per ton in 2008
(Byron, 2008), the consequent savings could be substantial for commercial-type settings
that often use vast quantities of salt.
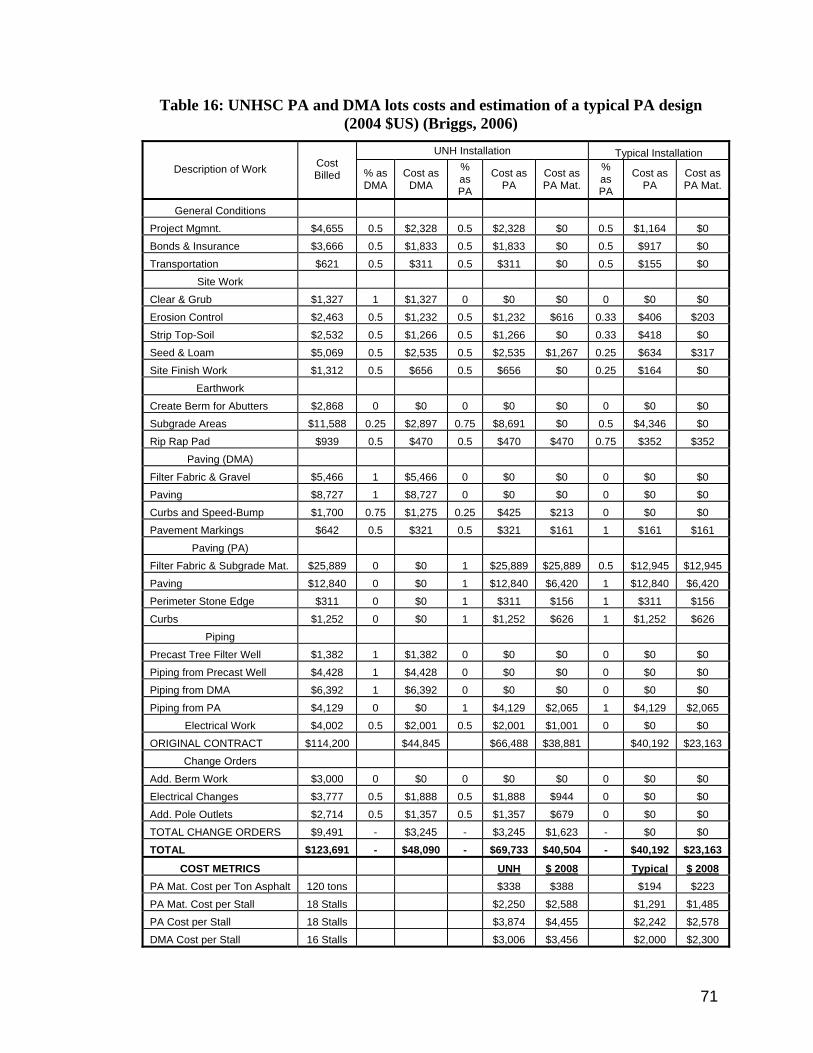
71
Table 16: UNHSC PA and DMA lots costs and estimation of a typical PA design (2004 $US) (Briggs, 2006)
UNH Installation Typical Installation Description of Work Cost
Billed % as DMA
Cost as DMA
% as PA
Cost as PA
Cost as PA Mat.
% as PA
Cost as PA
Cost as PA Mat.
General Conditions
Project Mgmnt. $4,655 0.5 $2,328 0.5 $2,328 $0 0.5 $1,164 $0
Bonds & Insurance $3,666 0.5 $1,833 0.5 $1,833 $0 0.5 $917 $0
Transportation $621 0.5 $311 0.5 $311 $0 0.5 $155 $0
Site Work
Clear & Grub $1,327 1 $1,327 0 $0 $0 0 $0 $0
Erosion Control $2,463 0.5 $1,232 0.5 $1,232 $616 0.33 $406 $203
Strip Top-Soil $2,532 0.5 $1,266 0.5 $1,266 $0 0.33 $418 $0
Seed & Loam $5,069 0.5 $2,535 0.5 $2,535 $1,267 0.25 $634 $317
Site Finish Work $1,312 0.5 $656 0.5 $656 $0 0.25 $164 $0
Earthwork
Create Berm for Abutters $2,868 0 $0 0 $0 $0 0 $0 $0
Subgrade Areas $11,588 0.25 $2,897 0.75 $8,691 $0 0.5 $4,346 $0
Rip Rap Pad $939 0.5 $470 0.5 $470 $470 0.75 $352 $352
Paving (DMA)
Filter Fabric & Gravel $5,466 1 $5,466 0 $0 $0 0 $0 $0
Paving $8,727 1 $8,727 0 $0 $0 0 $0 $0
Curbs and Speed-Bump $1,700 0.75 $1,275 0.25 $425 $213 0 $0 $0
Pavement Markings $642 0.5 $321 0.5 $321 $161 1 $161 $161
Paving (PA)
Filter Fabric & Subgrade Mat. $25,889 0 $0 1 $25,889 $25,889 0.5 $12,945 $12,945
Paving $12,840 0 $0 1 $12,840 $6,420 1 $12,840 $6,420
Perimeter Stone Edge $311 0 $0 1 $311 $156 1 $311 $156
Curbs $1,252 0 $0 1 $1,252 $626 1 $1,252 $626
Piping
Precast Tree Filter Well $1,382 1 $1,382 0 $0 $0 0 $0 $0
Piping from Precast Well $4,428 1 $4,428 0 $0 $0 0 $0 $0
Piping from DMA $6,392 1 $6,392 0 $0 $0 0 $0 $0
Piping from PA $4,129 0 $0 1 $4,129 $2,065 1 $4,129 $2,065
Electrical Work $4,002 0.5 $2,001 0.5 $2,001 $1,001 0 $0 $0
ORIGINAL CONTRACT $114,200 $44,845 $66,488 $38,881 $40,192 $23,163
Change Orders
Add. Berm Work $3,000 0 $0 0 $0 $0 0 $0 $0
Electrical Changes $3,777 0.5 $1,888 0.5 $1,888 $944 0 $0 $0
Add. Pole Outlets $2,714 0.5 $1,357 0.5 $1,357 $679 0 $0 $0
TOTAL CHANGE ORDERS $9,491 - $3,245 - $3,245 $1,623 - $0 $0
TOTAL $123,691 - $48,090 - $69,733 $40,504 - $40,192 $23,163
COST METRICS UNH $ 2008 Typical $ 2008 PA Mat. Cost per Ton Asphalt 120 tons $338 $388 $194 $223
PA Mat. Cost per Stall 18 Stalls $2,250 $2,588 $1,291 $1,485
PA Cost per Stall 18 Stalls $3,874 $4,455 $2,242 $2,578
DMA Cost per Stall 16 Stalls $3,006 $3,456 $2,000 $2,300
72
The costs for the PC parking lot installation are summarized in a similar manner.
Table 17 displays the breakdown of the various tasks associated with design and
construction of the lot. Total costs were adjusted for inflation from 2007 to May 2008
U.S. dollars. Research-based expenses were accounted for and total costs for typical
installations were adjusted accordingly. Total cost per cubic-yard of pervious concrete
was approximately $529 in May 2008 dollars. Costs per parking stall were $2,729 with
the specified design conditions. When comparing PC to other pavement materials, the
cost per stall is approximately 18% greater than PA and 31% greater than DMA.
However, when taking into account service life, PC may be a much more economical
solution. Montalto et al. (2007) found that pervious concrete may last up to 40 years
before requiring resurfacing, whereas porous asphalt and conventional asphalt may need
to be replaced after 8 to 10 years. This would amount to an approximate two-thirds
savings over a 40 year span if PC were to be used.
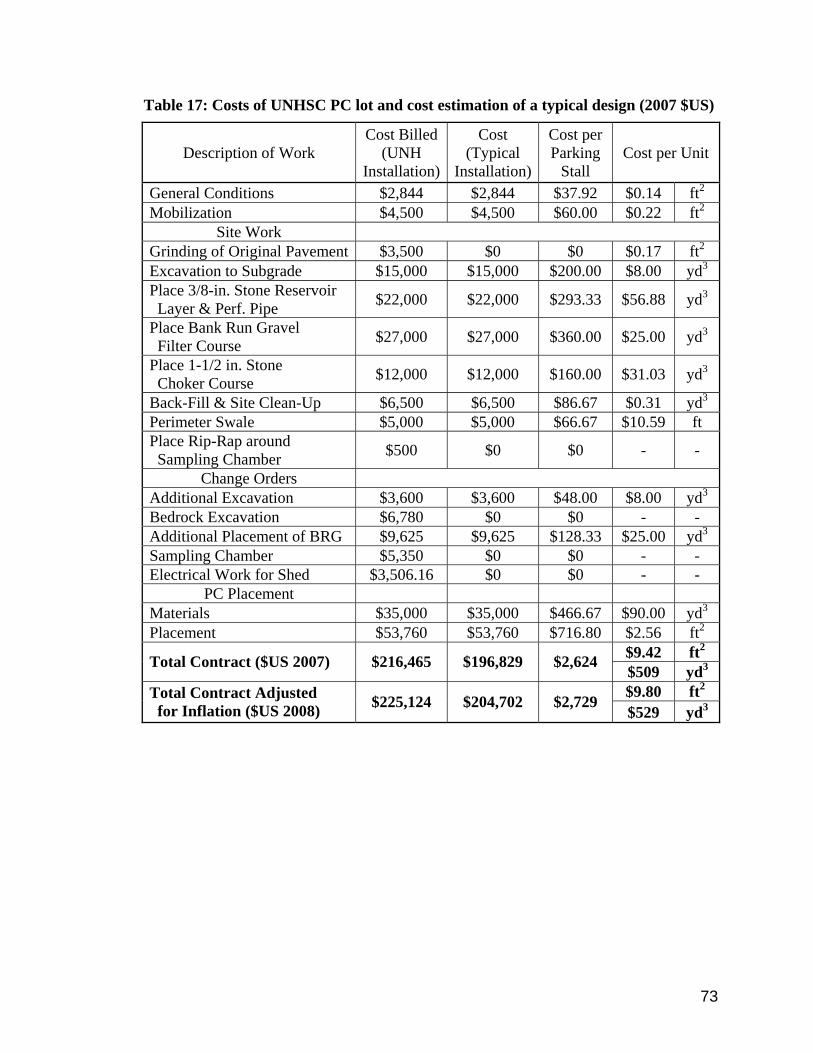
73
Table 17: Costs of UNHSC PC lot and cost estimation of a typical design (2007 $US)
Description of Work Cost Billed
(UNH Installation)
Cost (Typical
Installation)
Cost per Parking
Stall Cost per Unit
General Conditions $2,844 $2,844 $37.92 $0.14 ft2 Mobilization $4,500 $4,500 $60.00 $0.22 ft2
Site Work Grinding of Original Pavement $3,500 $0 $0 $0.17 ft2 Excavation to Subgrade $15,000 $15,000 $200.00 $8.00 yd3 Place 3/8-in. Stone Reservoir Layer & Perf. Pipe $22,000 $22,000 $293.33 $56.88 yd3
Place Bank Run Gravel Filter Course $27,000 $27,000 $360.00 $25.00 yd3
Place 1-1/2 in. Stone Choker Course $12,000 $12,000 $160.00 $31.03 yd3
Back-Fill & Site Clean-Up $6,500 $6,500 $86.67 $0.31 yd3 Perimeter Swale $5,000 $5,000 $66.67 $10.59 ft Place Rip-Rap around Sampling Chamber $500 $0 $0 - -
Change Orders Additional Excavation $3,600 $3,600 $48.00 $8.00 yd3 Bedrock Excavation $6,780 $0 $0 - - Additional Placement of BRG $9,625 $9,625 $128.33 $25.00 yd3 Sampling Chamber $5,350 $0 $0 - - Electrical Work for Shed $3,506.16 $0 $0 - -
PC Placement Materials $35,000 $35,000 $466.67 $90.00 yd3 Placement $53,760 $53,760 $716.80 $2.56 ft2
$9.42 ft2 Total Contract ($US 2007) $216,465 $196,829 $2,624 $509 yd3 $9.80 ft2 Total Contract Adjusted
for Inflation ($US 2008) $225,124 $204,702 $2,729 $529 yd3
74
CHAPTER 5
CONCLUSIONS AND RECOMMENDATIONS
Conclusions
The results indicate that permeable pavements provide better functionality
than impervious pavements in cold climates, and provide many improvements over
conventional designs. Higher skid resistance was exemplified by PA and PC versus
DMA for a range of surface conditions. The ability to reduce salt use on the permeable
surfaces was greatest during the cyclical freeze-thaw conditions that are characteristic of
New England winters. PA demonstrated adequate skid resistance for an average annual
salt reduction of 75% below the standard of practice rate. No quantifiable salt reductions
were observed for PC at the UNHSC site; however, it was determined that site shading
and the light pavement color were the main reasons for this finding. It is important to
note that routine plowing during and after each winter precipitation event is compulsory
to achieving safe and adequate pavement conditions. Without regular winter
maintenance, all parking lots, regardless of pavement type, are susceptible to snow
compaction and subsequent ice formation. Even though this study shows PA excelling in
these non-desirable conditions, it is not recommended to allow such a situation to occur.
75
Recommendations for Future Research
Even though this research was carried out over two winter seasons and
identifiable trends were observed during that time, it would be beneficial to continue with
certain facets of the investigation. For instance, the PC parking lot was only studied for
one winter; an additional year of monitoring would provide further verification of results
and allow for adjustment of the methodology to better account for the shading effects and
the high traffic volume. Two years of study were adequate for obtaining comparable
results for the PA lot; however, additional data collection would further substantiate the
findings. Other analyses that would be useful to continue for both pavements include
surface infiltration testing (to monitor long-term changes in permeability) and
measurements of effluent specific conductivity for an extended chloride mass balance.
Accurate quantification of applied chloride loads would be essential to perform the
balance. It would also be interesting to expand the study to include conventional
concrete as a fourth material for comparison. No impermeable concrete parking lots
currently exist on the UNH campus in Durham, NH so arrangements would have to be
made for future installation.
Salt brine for deicing was tested briefly during the 2007-2008 winter but a
number of factors contributed to fairly inconclusive results. It would be interesting to
continue this experiment for another winter and test other maintenance alternatives such
as non-chloride salts. Additional explanation of the salt brine experiment is provided in
Appendix A.
A test that may help to explain the duration of snow and ice cover and level of
frost penetration would be to outfit the permeable and standard pavements with
76
temperature probes set at various elevations below the surface. Backstrom (2000) looked
at this topic in a PA system and identified that latent heat from ground- and infiltrating
water produced favorable conditions for snow/ice melting. The UNH PC lot was
outfitted with temperature probes during its installation, for similar analysis, but
monitoring has yet to commence. Concurrent measurements of groundwater elevations
within the systems would be necessary.
An analysis of life cycle costs for the different pavement types would be a
beneficial supplement to the cost analysis portion of this research. This may
consequently require that the study areas be assessed long-term for any substantial
deterioration or degradation in order to determine reasonable estimates of pavement
service lives for cold-climate settings. Costs associated with construction, maintenance,
disposal and/or replacement would be inherent in such a study.

77
REFERENCES
Asi, Ibrahim M. 2007. Evaluating skid resistance on different asphalt concrete mixes. Building and Environment, 42: 325-329
ASTM (American Society for Testing and Materials). 2004. Standard test method for measuring surface frictional properties using the British Pendulum Tester: E 303-93. Annual Book of ASTM Standards, 4 (3).
Avellaneda, Pedro. 2005. Specific conductance versus chloride concentration regression for a nine-acre impervious watershed (unpublished results). University of New Hampshire Stormwater Center. Durham, NH.
Backstrom, Magnus. 2000. Ground temperature in porous pavement during freezing and thawing. Journal of Transportation Engineering, 126 (5): 375-381.
Backstrom, M. and Bergstrom, A. 2000. Draining function of porous asphalt during snowmelt and temporary freezing. Canadian Journal of Civil Engineering, 27: 594-598.
Ballestero, T. P., R. Roseen, and J.J. Houle. 2006. UNH Stormwater Center 2005 Data Report. Cooperative Institute for Coastal and Estuarine Environmental Technology, University of New Hampshire, Durham. Bean, E. Z. 2005. A field study to evaluate permeable pavement surface infiltration rates, runoff quantity, runoff quality, and exfiltrate quality. Biological and Agricultural Engineering. North Carolina State University, Raleigh. Briggs, Joshua F. 2006. Performance assessment of porous asphalt for stormwater treatment. M.S. Thesis. University of New Hampshire, Durham. Briggs, J., T. Ballestero, R. Roseen, J. Pochily, and G. Swenson. 2007. Porous asphalt mix properties and infiltration performance (In preparation). University of New Hampshire, Durham.
Burtwell, Marilyn. 2001. Assessment of the performance of prewetted salt for snow removal and ice control. National Research Council. Transportation Research Record: Journal of the Transportation Research Board, No. 1741: 68-74.
Byron, Thomas. 2008. Quote of UNH salt costs during 2007-2008 winter. Phone conversation. Manager, Grounds & Events, University of New Hampshire, Durham.
Cahill, T., M. Adams, and C. Marm. 2003. Porous asphalt: The right choice for porous pavements. Hot Mix Asphalt Technology, September/October: 26-40.
78
Cambridge Systematics. 2005. Cool pavement report: EPA Cool pavements study – Task 5 (draft report). Prepared for Heat Island Reduction Initiative, U.S. EPA. August 18, 2008 (http://www.epa.gov/hiri/resources/pdf/CoolPavementReport_Former%20Guide_complete.pdf).
Diniz, Elvidio V. 1980. Porous pavement, Phase I – Design and operational criteria, EPA-600/2-80-135, Cincinnati: U.S. Environmental Protection Agency Municipal Environmental Research Laboratory. March 26, 2007 (http://www.epa.gov/ednnrmrl/publications/reports/epa600280135/epa600280135.htm).
Ferguson, Bruce K. 2005. Porous Pavements: Integrative Studies in Water Management and Land Development. CRC Publishing, Boca Raton, FL.
Fonnesbech, Jens Kr. 2001. Ice control technology with 20 percent brine on highways. National Research Council. Transportation Research Record: Journal of the Transportation Research Board, No. 1741: 68-74.
Helsel, D.R. and R.M. Hirsch. 2002. Statistical methods in water resources. USGS – TWRI Book 4, Chapter A3 (online). August 15, 2008 (http://pubs.usgs.gov/twri/twri4a3/).
Houle, James J. 2007. Specific conductance of College Brook and runoff from the West Edge Parking Lot at UNH (unpublished results). University of New Hampshire Stormwater Center. Durham, NH.
Houle, Kristopher. 2008. A winter performance assessment of porous asphalt and its function for chloride source control (In preparation). Winter performance assessment of permeable pavements (Chapter 2), M.S. Thesis. University of New Hampshire, Durham. Jackson, N. 2003. Design, construction and maintenance guide for porous asphalt pavements: Information series 131. National Asphalt Pavement Association. Kandhal, P. and R. Mallick. 2002. Design, construction and maintenance of open-graded asphalt friction courses: Information Series 115. National Asphalt Pavement Association.
Knudsen, F., J.K. Fonnesbech and J. Christensen. 2003. Prewetted salt versus brine on motorway. Danish Road Directorate. Nordic Road & Transport Research, No. 2: 10. June 23, 2008 (http://www.vti.se/Nordic/2-03mapp/prewet.htm).
MacDonald, Chuck. 2006. Porous pavements working in northern climates. Hot Mix Asphalt Technology, July/August: 26-28.
Manuba, Chiba, Tako Jun, and Abe Ryuji. 2007. Effectiveness of open-graded pavements as a measure against snowy/icy winter roads. Civil Engineering Research Institute for Cold Region: Monthly report, 644: 21-27.
Montalto, F., C. Behr, K. Alfredo, M. Wolf, M. Arye, and M. Walsh. 2007. Rapid assessment of the cost-effectiveness of low impact development for CSO control. Landscape and Urban Planning, 82: 117-131.
79
MPCA (Minnesota Pollution Control Agency). 2006. Winter parking lot and sidewalk maintenance manual. Minnesota Snow and Ice Control Field Handbook for Snowplow Operators.
Munro Environmental. 2007. Portable skid resistance tester operating instructions. The Munro Group, England.
NCDC (National Climatic Data Center). 2008. Record of climatological observations: Durham, NH. National Oceanic and Atmospheric Association (NOAA). June 2, 2008 (http://cdo.ncdc.noaa.gov/dly/DLY?stnid=20018620).
NHDES (New Hampshire Department of Environmental Services). 1992. Stormwater management and erosion and sediment control handbook for urban and developing areas in New Hampshire. NH Greenbook.
NHSCO (New Hampshire State Climate Office). 2008. NH data: Durham. University of New Hampshire: Department of Geography. June 3, 2008 (http://www.unh.edu/stateclimatologist/).
Noort, Maarten. 1996. Winter Maintenance on Porous Asphalt. 4th International Symposium on Snow Removal and Ice Control Technology, Preprints Vol. I. Transportation Research Board. Reno, NV.
NRMCA (National Ready Mixed Concrete Association). 2007. (Text reference for) Pervious concrete contractor certification. NRMCA Publication #2PPCRT. Ricard, J.A., W. Tobiasson, and A. Greatorex. 1976. The field assembled frost gauge. U.S. Army Cold Regions Research and Engineering Laboratory (CRREL), Hanover, NH.
Roseen, R.M., T.P. Ballestero, J.J. Houle, P. Avellaneda, R. Wildey, and J.F. Briggs. 2006. Storm water low-impact development, conventional, structural, and manufactured treatment strategies for parking lot runoff: Performance evaluations under varied mass loading conditions. Transportation Research Record: Journal of the Transportation Research Board, No. 1984: 135-147.
Roseen, R.M., J. Briggs, T.P. Ballestero, and J. Pochily. 2007. UNHSC Design Specifications for Porous Asphalt Pavement and Infiltration Beds. University of New Hampshire Stormwater Center, Durham.
Russ, A., G.F. Mitchell and W. Richardson. 2008. Durability of brine applications for winter maintenance on asphalt and PCC pavements. Transportation Research Board: 87th Annual Meeting, Paper No. 08-2608. Washington, D.C.
Shao, J., P.J. Lister, and A. McDonald. 1994. A surface-temperature prediction model porous asphalt pavement and its validation. Meteorological Applications, 1 (2): 129-134.
Stenmark, Christer. 1995. An alternative road construction for stormwater management in cold climates. Water Science Technology, 32 (1): 79-84.
80
Trost, S.E., F.J. Heng, and E.L. Cussler. 1987. Chemistry of deicing roads: Breaking the bond between ice and road. Journal of Transportation Engineering, 113 (1): 15-26.
Trowbridge, P. 2007a. Total maximum daily load (TMDL) study for waterbodies in the vicinity of the I-93 corridor from Massachusetts to Manchester, NH: North Tributary to Canobie Lake in Windham, NH. Watershed Management Bureau, New Hampshire Department of Environmental Services, Concord. Trowbridge, P. 2007b. Total maximum daily load (TMDL) study for waterbodies in the vicinity of the I-93 corridor from Massachusetts to Manchester, NH: Policy-Porcupine Brook in Salem and Windham, NH. Watershed Management Bureau, New Hampshire Department of Environmental Services, Concord.
UNHWS (University of New Hampshire Weather Station). 2008. UNH Weather Statistics. University of New Hampshire: Thompson Farm, Durham, NH. June 3, 2008 (http://www.weather.unh.edu/).
U.S. BLS (United States Bureau of Labor Statistics). 2008. Consumer price index inflation calculator. United States Department of Labor, Washington DC. July 4, 2008 (http://www.bls.gov/cpi/home.htm). U.S. EPA (United States Environmental Protection Agency). 1988. Ambient water quality criteria for chloride – 1988. EPA 440/5-88-001. Office of Water, Washington DC. U.S. EPA (United States Environmental Protection Agency). 2007. Heat island effect: basic information. Heat Island Reduction Initiative. July 17, 2008 (http://www.epa.gov/hiri/about/index.html). Wegner, W. and M. Yaggi. 2001. Environmental impacts of road salt and alternatives in the New York City Watershed. Stormwater, July/August, 2 (5): 24-31.

81
APPENDICES
82
APPENDIX A
SALT BRINE USE FOR WINTER MAINTENANCE OF PERMEABLE PAVEMENTS
Introduction & Background
The effectiveness of saturated sodium-chloride brine solution was tested during
the 2007-2008 winter season on the UNHSC porous asphalt and pervious concrete
parking lots. It was measured against the use of standard, dry NaCl rock-salt. Research
has shown that brine solution can provide a means to reduce the amount of salt spread on
roadways while maintaining an adequate level of service. Other advantages over dry salt
include: its ability to be active immediately after application since the salt does not blow
off the pavement surface, improved control when applying material, and its functionality
in temperatures down to 26.6ºF (Russ et al., 2008). Application of brine should take
place prior to winter precipitation events and immediately following plowing operations
in order to provide the most efficient treatment. The Danish Road Directorate suggests
that brine use on open-graded pavements should be avoided because it requires a heavier
application than would be necessitated on conventional pavements due to the surface
porosity (Knudsen et al., 2003). The objective of this study was to provide further insight
into the ability of brine to reduce the impacts associated with chloride for parking lot
winter maintenance.
83
Methodology
An area of 400-ft2 was selected for analysis on each of the three pavement types
studied: porous asphalt (PA), pervious concrete (PC), and dense-mix asphalt (DMA).
The PA and DMA areas were located in parking stalls while the PC area was in one of
the driving lanes. The brine application rate was based upon rates suggested in literature.
Fonnesbech (2001) studied a rate of 0.94-lb NaCl / 1000-ft2 of area (4.6-g NaCl / m2)
which was found to be the most common rate used in Funen County, Denmark. The rate
used in this study was scaled up to 1.5-lb NaCl / 1000-ft2 of area to correspond to the
50% salt application rate used in other aspects of this research so comparisons could be
made. This rate falls within the range of 20-40 mL/m2 observed by Fonnesbech.
The salt brine solution was produced by mixing a measured weight of salt with a
known volume of de-ionized water in order to obtain a blend consisting of approximately
23% salt by mass. Salt is soluble in water up to 35% but 20-23% is usually used to avoid
pipe and nozzle blockage in distribution trucks (Burtwell, 2001). The brine solution was
applied to the study areas by hand with a pressurized garden sprayer (typically used for
applying herbicides or fertilizers). Even application was achieved by calibrating a pace at
which to walk back-and-forth across the study area while also ensuring to maintain
adequate pressure within the sprayer bottle. Both anti-icing and deicing applications
were performed for each event beginning on January 27, 2008, for a total of 12 events. A
summary of event characteristics for the study period is shown in Table 19. Also shown
at the bottom of the table are monthly average weather statistics for Durham, NH
(NHSCO, 2008).

84
Table 18: Salt brine application rate parameters
Size of study area (ft2) 400 Brine application rate (lb/1000-ft2) 1.5 Brine application rate (mL/m2) 32 % salt concentration (by weight) 23
Table 19: Winter storm event characteristics (‘08) (NCDC, 2008; NHSCO, 2008; UNHWS, 2008) (S = Snow; R = Rain; I = Ice)
Date Precipitation Type
Snow Depth (in.)
Water Equivalent
Depth (in.)
Max Temp (ºF)
Min Temp (ºF)
1/27/2008 S 3 0.31 28 17 2/1/2008 I/R 0.5 1.23 44 33 2/5/2008 S/R 0.75 1.66 37.5 32 2/8/2008 S 4 0.51 29 21
2/10/2008 S 2 0.29 35 16 2/13/2008 S/R 5 2.77 36 21 2/22/2008 S 5 0.36 26.5 13 2/26/2008 S/R 3 0.94 39.5 20 3/1/2008 S 3 0.44 35 21
3/11/2008 S/R 1 0.21 41 17 3/15/2008 S/R 1 0.69 40 33 3/28/2008 S 4 1.02 42 32 Nov. avg. - 14.4 4.84 49.1 29.3 Dec. avg. - 14.4 4.46 36.8 18.2 Jan. avg. - 19 4.11 33.4 13 Feb. avg. - 16.9 3.48 35.4 14.4 Mar. avg. - 12.8 4.31 44.4 23.7
Results & Discussion
Effectiveness of the brine application on the different pavements was determined
by quantifying the type and amount of snow/ice surface cover and then measuring the
skid resistance of the study area. Evaluations were carried out with the same
methodology as was discussed in Houle (2008). Figure 25 shows that the lowest median
snow/ice surface cover value for the brine use resulted on the DMA lot, with the highest
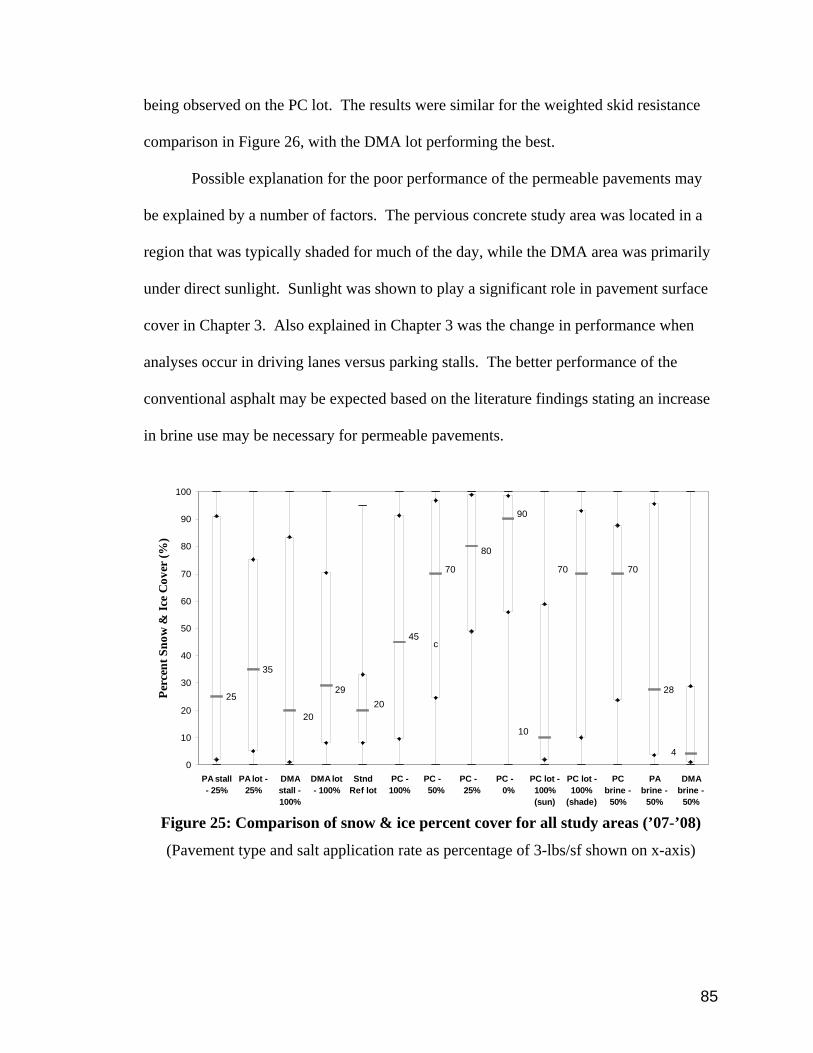
85
being observed on the PC lot. The results were similar for the weighted skid resistance
comparison in Figure 26, with the DMA lot performing the best.
Possible explanation for the poor performance of the permeable pavements may
be explained by a number of factors. The pervious concrete study area was located in a
region that was typically shaded for much of the day, while the DMA area was primarily
under direct sunlight. Sunlight was shown to play a significant role in pavement surface
cover in Chapter 3. Also explained in Chapter 3 was the change in performance when
analyses occur in driving lanes versus parking stalls. The better performance of the
conventional asphalt may be expected based on the literature findings stating an increase
in brine use may be necessary for permeable pavements.
25
35
28
4
90
80
70
29
70
45
70
1020
20
0
10
20
30
40
50
60
70
80
90
100
PA stall- 25%
PA lot -25%
DMAstall -100%
DMA lot- 100%
StndRef lot
PC -100%
PC - 50%
PC - 25%
PC - 0%
PC lot -100%(sun)
PC lot -100%
(shade)
PCbrine -
50%
PAbrine -
50%
DMAbrine -
50%
Perc
ent S
now
& Ic
e C
over
(%)
c
Figure 25: Comparison of snow & ice percent cover for all study areas (’07-’08)
(Pavement type and salt application rate as percentage of 3-lbs/sf shown on x-axis)
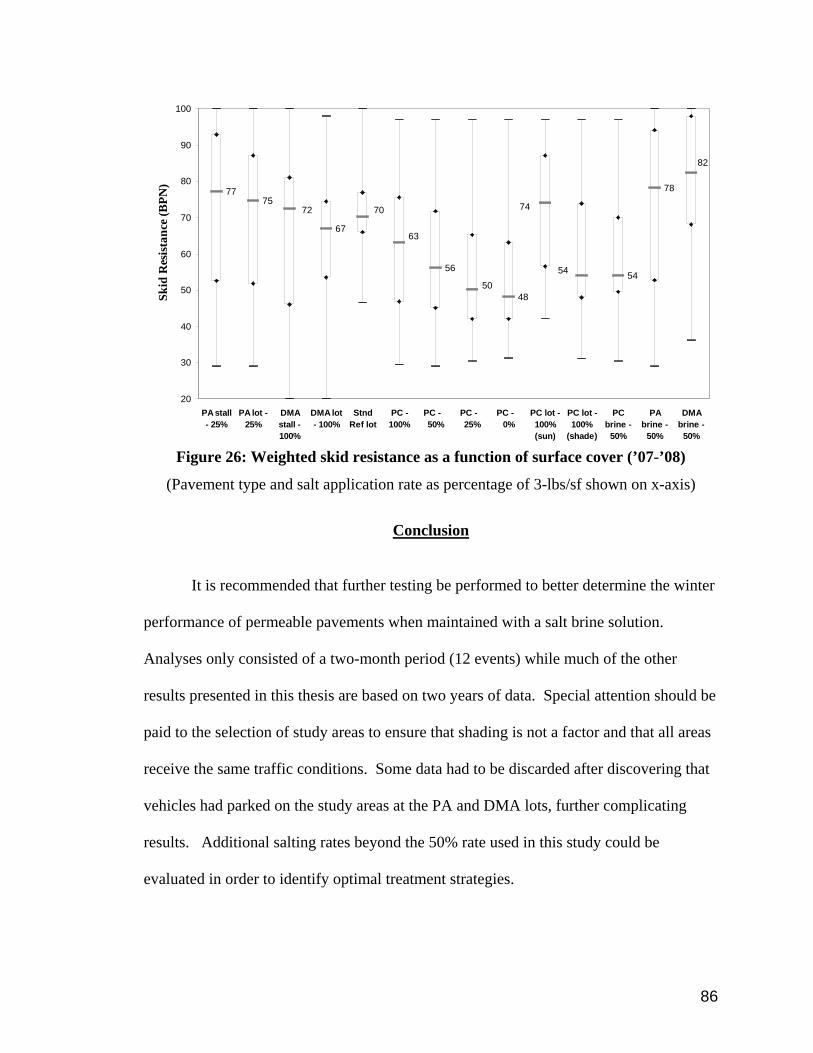
86
7775
67
56
48
78
50
82
7072 74
54
63
54
20
30
40
50
60
70
80
90
100
PA stall- 25%
PA lot -25%
DMAstall -100%
DMA lot- 100%
StndRef lot
PC -100%
PC - 50%
PC - 25%
PC - 0%
PC lot -100%(sun)
PC lot -100%
(shade)
PCbrine -
50%
PAbrine -
50%
DMAbrine -
50%
Skid
Res
ista
nce
(BPN
)
Figure 26: Weighted skid resistance as a function of surface cover (’07-’08)
(Pavement type and salt application rate as percentage of 3-lbs/sf shown on x-axis)
Conclusion
It is recommended that further testing be performed to better determine the winter
performance of permeable pavements when maintained with a salt brine solution.
Analyses only consisted of a two-month period (12 events) while much of the other
results presented in this thesis are based on two years of data. Special attention should be
paid to the selection of study areas to ensure that shading is not a factor and that all areas
receive the same traffic conditions. Some data had to be discarded after discovering that
vehicles had parked on the study areas at the PA and DMA lots, further complicating
results. Additional salting rates beyond the 50% rate used in this study could be
evaluated in order to identify optimal treatment strategies.
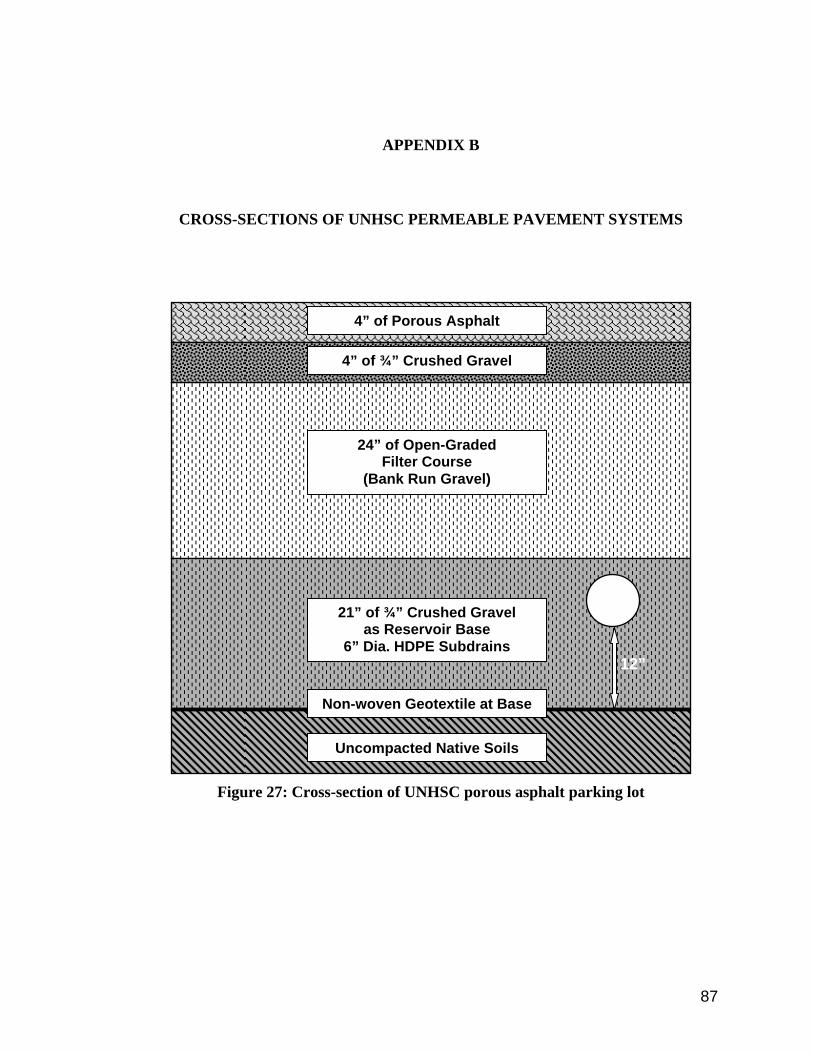
87
APPENDIX B
CROSS-SECTIONS OF UNHSC PERMEABLE PAVEMENT SYSTEMS
Figure 27: Cross-section of UNHSC porous asphalt parking lot
4” of Porous Asphalt
4” of ¾” Crushed Gravel
24” of Open-Graded Filter Course
(Bank Run Gravel)
21” of ¾” Crushed Gravel as Reservoir Base
6” Dia. HDPE Subdrains
Uncompacted Native Soils
1122””
Non-woven Geotextile at Base
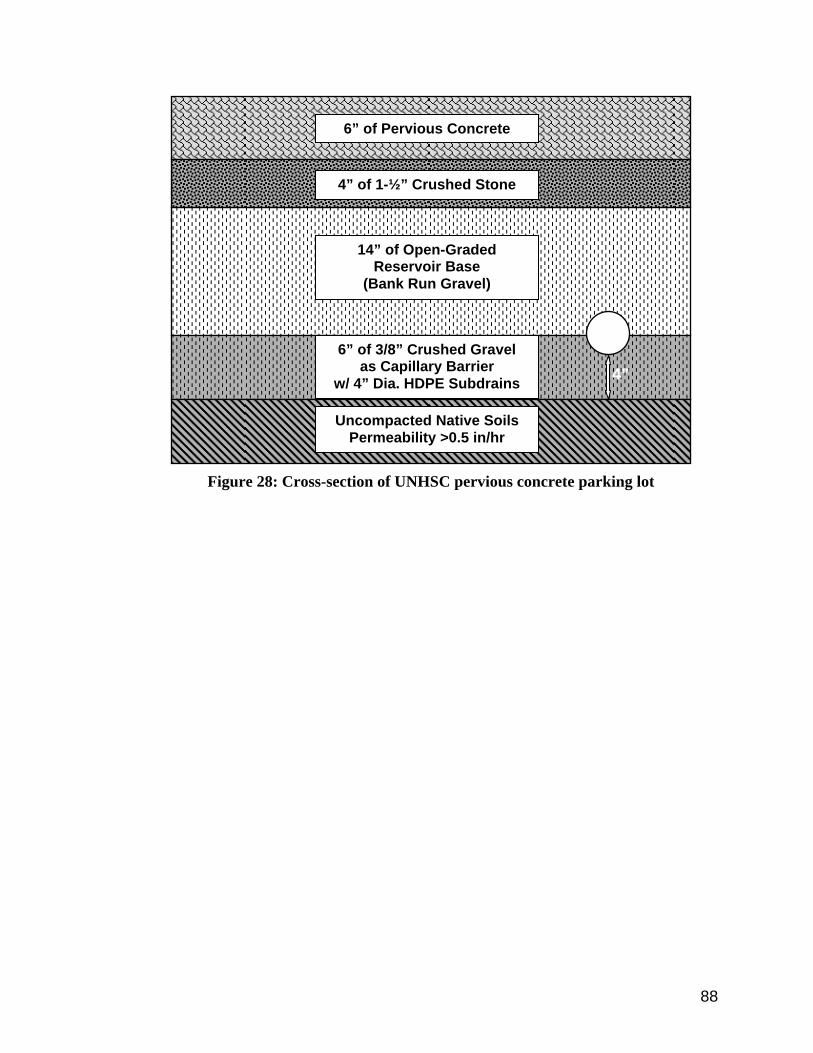
88
Figure 28: Cross-section of UNHSC pervious concrete parking lot
6” of Pervious Concrete
4” of 1-½” Crushed Stone
14” of Open-Graded Reservoir Base
(Bank Run Gravel)
6” of 3/8” Crushed Gravel as Capillary Barrier
w/ 4” Dia. HDPE Subdrains
Uncompacted Native Soils Permeability >0.5 in/hr
44””

89
APPENDIX C
FROST DEPTH
Table 20: Frost depth raw data (‘06-‘07)
Date Time Porous Asphalt
(in)
Tree Filter
Reference (in)
Date Time Porous Asphalt
(in)
Tree Filter
Reference (in)
12/1/06 12:00 0.00 0.00 2/21/07 0:00 27.25 24.00 12/4/06 7:20 0.00 0.00 2/22/07 0:00 26.75 24.00 12/7/06 0:00 0.00 1.50 2/23/07 8:50 27.25 24.75 12/8/06 10:45 0.00 0.00 2/25/07 15:45 27.25 24.50
12/20/06 0:00 - 0.50 3/1/07 22:10 26.50 25.75 1/2/07 10:30 0.50 0.00 3/3/07 8:50 15.00 25.50 1/9/07 0:00 0.00 0.00 3/4/07 8:50 15.00 25.50
1/11/07 0:00 0.00 0.88 3/5/07 0:00 - 26.00 1/13/07 20:15 0.00 0.00 3/6/07 0:00 6.75 - 1/14/07 22:40 0.00 0.00 3/7/07 0:00 10.00 26.50 1/15/07 13:30 0.00 0.50 3/9/07 0:00 12.50 27.00 1/16/07 9:30 0.00 0.00 3/12/07 0:00 0.00 27.50 1/17/07 0:00 2.25 4.25 3/13/07 0:00 0.00 27.25 1/18/07 9:40 8.00 3.50 3/14/07 0:00 0.00 27.25 1/18/07 16:45 9.00 3.63 3/16/07 15:05 0.00 0.00 1/19/07 15:00 9.88 4.00 3/17/07 17:15 0.00 0.00 1/20/07 10:40 10.13 4.13 3/18/07 10:00 0.00 0.00 1/23/07 8:55 13.00 5.50 3/19/07 9:30 0.00 0.00 1/24/07 13:05 13.00 6.13 3/21/07 0:00 0.00 0.50 1/28/07 13:50 17.50 10.00 3/22/07 0:00 0.00 0.50 1/31/07 0:00 12.75 18.63 3/23/07 0:00 0.00 0.00 2/2/07 0:00 19.00 14.50 3/25/07 9:20 0.00 0.00 2/3/07 10:30 19.00 15.50 3/30/07 0:00 0.00 0.00 2/6/07 0:00 19.75 18.25 4/4/07 14:50 0.00 0.00 2/9/07 0:00 - 20.75 4/5/07 10:30 0.00 0.00
2/12/07 0:00 22.00 21.25 4/6/07 8:25 0.00 0.00 2/13/07 20:50 23.00 22.25 4/11/07 13:00 0.00 0.00 2/16/07 0:00 23.50 23.25 4/13/07 8:45 0.00 0.00 2/19/07 0:00 25.50 24.00 Max. Depth (in.) 25.75 24.00 2/20/07 10:00 25.75 24.00 Max. Duration 51 days 56 days
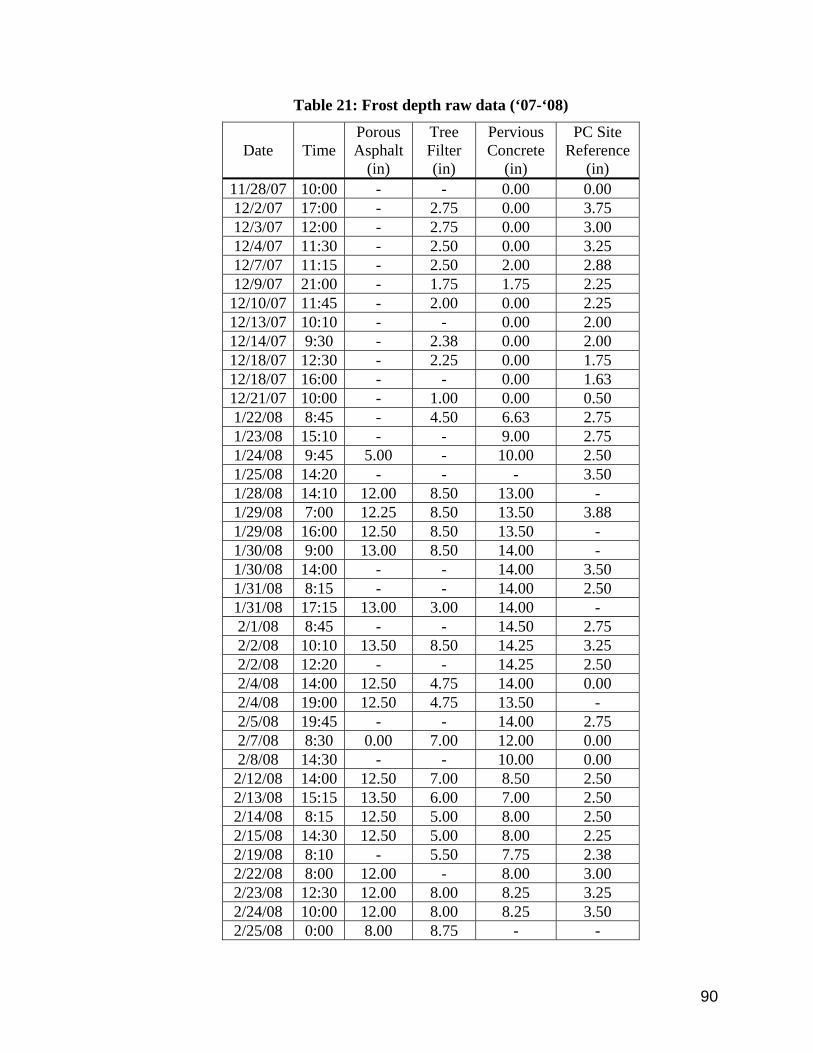
90
Table 21: Frost depth raw data (‘07-‘08)
Date Time Porous Asphalt
(in)
Tree Filter (in)
Pervious Concrete
(in)
PC Site Reference
(in) 11/28/07 10:00 - - 0.00 0.00 12/2/07 17:00 - 2.75 0.00 3.75 12/3/07 12:00 - 2.75 0.00 3.00 12/4/07 11:30 - 2.50 0.00 3.25 12/7/07 11:15 - 2.50 2.00 2.88 12/9/07 21:00 - 1.75 1.75 2.25
12/10/07 11:45 - 2.00 0.00 2.25 12/13/07 10:10 - - 0.00 2.00 12/14/07 9:30 - 2.38 0.00 2.00 12/18/07 12:30 - 2.25 0.00 1.75 12/18/07 16:00 - - 0.00 1.63 12/21/07 10:00 - 1.00 0.00 0.50 1/22/08 8:45 - 4.50 6.63 2.75 1/23/08 15:10 - - 9.00 2.75 1/24/08 9:45 5.00 - 10.00 2.50 1/25/08 14:20 - - - 3.50 1/28/08 14:10 12.00 8.50 13.00 - 1/29/08 7:00 12.25 8.50 13.50 3.88 1/29/08 16:00 12.50 8.50 13.50 - 1/30/08 9:00 13.00 8.50 14.00 - 1/30/08 14:00 - - 14.00 3.50 1/31/08 8:15 - - 14.00 2.50 1/31/08 17:15 13.00 3.00 14.00 - 2/1/08 8:45 - - 14.50 2.75 2/2/08 10:10 13.50 8.50 14.25 3.25 2/2/08 12:20 - - 14.25 2.50 2/4/08 14:00 12.50 4.75 14.00 0.00 2/4/08 19:00 12.50 4.75 13.50 - 2/5/08 19:45 - - 14.00 2.75 2/7/08 8:30 0.00 7.00 12.00 0.00 2/8/08 14:30 - - 10.00 0.00
2/12/08 14:00 12.50 7.00 8.50 2.50 2/13/08 15:15 13.50 6.00 7.00 2.50 2/14/08 8:15 12.50 5.00 8.00 2.50 2/15/08 14:30 12.50 5.00 8.00 2.25 2/19/08 8:10 - 5.50 7.75 2.38 2/22/08 8:00 12.00 - 8.00 3.00 2/23/08 12:30 12.00 8.00 8.25 3.25 2/24/08 10:00 12.00 8.00 8.25 3.50 2/25/08 0:00 8.00 8.75 - -
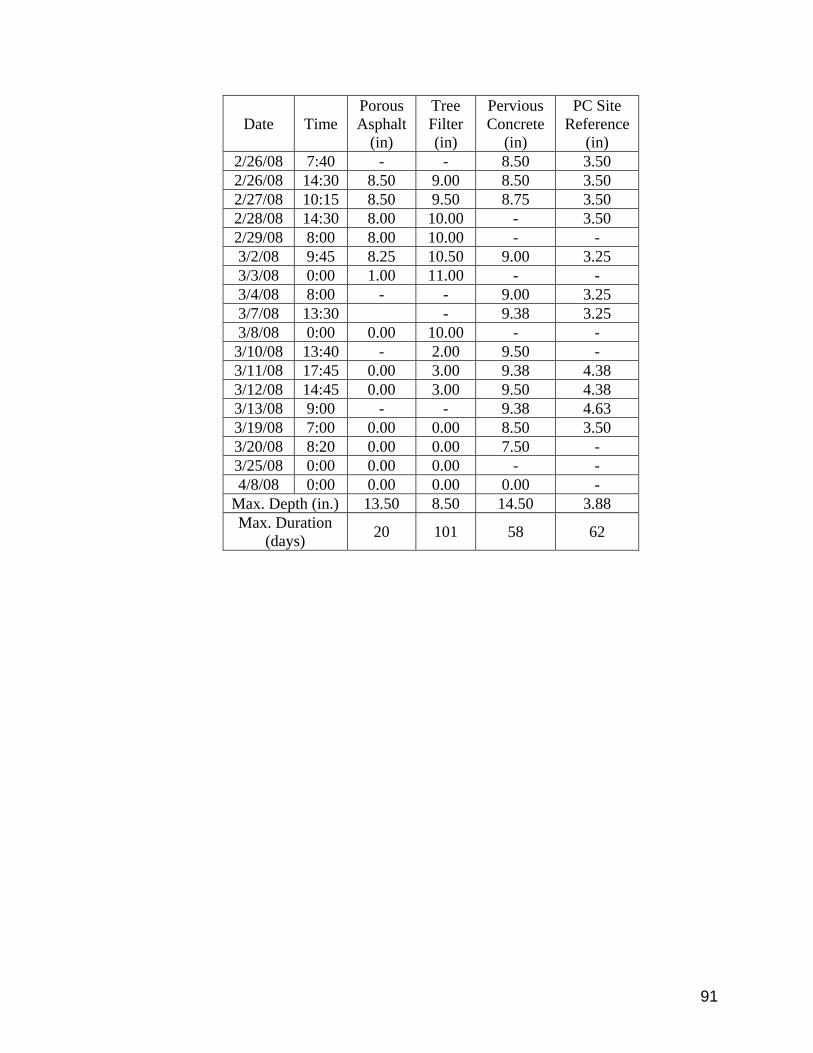
91
Date Time Porous Asphalt
(in)
Tree Filter (in)
Pervious Concrete
(in)
PC Site Reference
(in) 2/26/08 7:40 - - 8.50 3.50 2/26/08 14:30 8.50 9.00 8.50 3.50 2/27/08 10:15 8.50 9.50 8.75 3.50 2/28/08 14:30 8.00 10.00 - 3.50 2/29/08 8:00 8.00 10.00 - - 3/2/08 9:45 8.25 10.50 9.00 3.25 3/3/08 0:00 1.00 11.00 - - 3/4/08 8:00 - - 9.00 3.25 3/7/08 13:30 - 9.38 3.25 3/8/08 0:00 0.00 10.00 - -
3/10/08 13:40 - 2.00 9.50 - 3/11/08 17:45 0.00 3.00 9.38 4.38 3/12/08 14:45 0.00 3.00 9.50 4.38 3/13/08 9:00 - - 9.38 4.63 3/19/08 7:00 0.00 0.00 8.50 3.50 3/20/08 8:20 0.00 0.00 7.50 - 3/25/08 0:00 0.00 0.00 - - 4/8/08 0:00 0.00 0.00 0.00 -
Max. Depth (in.) 13.50 8.50 14.50 3.88 Max. Duration
(days) 20 101 58 62

92
APPENDIX D
SURFACE INFILTRATION CAPACITY
Table 22: Porous asphalt mean surface infiltration capacity raw data (‘04-‘07)
(Briggs, 2006; Briggs et al., 2007)
Surface IC Rate (in/hr) Estimated % Leakage Corrected IC Rate (in/hr) Date A B C A B C A B C Mean
11/18/04 1414 1114 438 5 5 25 1,343 1,058 328 9101/15/05 2451 1671 694 30 30 50 1,716 1,170 347 1,0782/15/05 1671 1935 613 20 25 50 1,337 1,451 306 1,0323/15/05 1935 1599 707 25 30 50 1,451 1,119 354 9754/14/05 2298 1838 782 20 25 50 1,838 1,379 391 1,2035/17/05 2298 1751 634 20 25 50 1,838 1,313 317 1,1566/15/05 1935 836 210 10 15 20 1,742 710 168 8737/17/05 1532 668 334 5 10 40 1,455 602 201 7538/19/05 994 549 167 0 5 25 994 521 125 5479/30/05 1081 668 210 15 20 50 919 535 105 52011/4/05 1050 320 153 20 35 75 840 208 38 3621/12/06 1838 1050 230 25 35 75 1,379 683 57 7064/5/06 1362 919 163 25 35 75 1,021 597 41 553
5/31/06 1935 566 0 25 35 - 1,451 368 9107/20/06 1935 817 320 25 35 75 1,451 531 80 6878/26/06 1414 694 0 25 35 - 1,061 451 7568/26/06 1114 549 171 10 15 75 1,003 466 43 50410/2/06 1414 566 230 10 15 75 1,273 481 57 60411/8/06 1050 477 0 10 15 - 945 406 676
12/28/06 668 409 37 5 5 - 635 388 37 3532/12/07 1114 541 0 5 5 - 1,058 514 - 7862/13/07 584 272 8 5 5 - 554 259 8 2744/23/07 955 435 0 5 5 - 907 413 - 6605/29/07 943 383 22 5 5 - 896 364 22 4278/10/07 1838 1007 0 5 5 - 1,746 957 - 1,3529/23/07 1991 782 4 5 5 - 1,891 743 4 88010/2/07 0 0 21 - - - - - 21 21
10/10/07 0 0 116 - - - - - 116 116
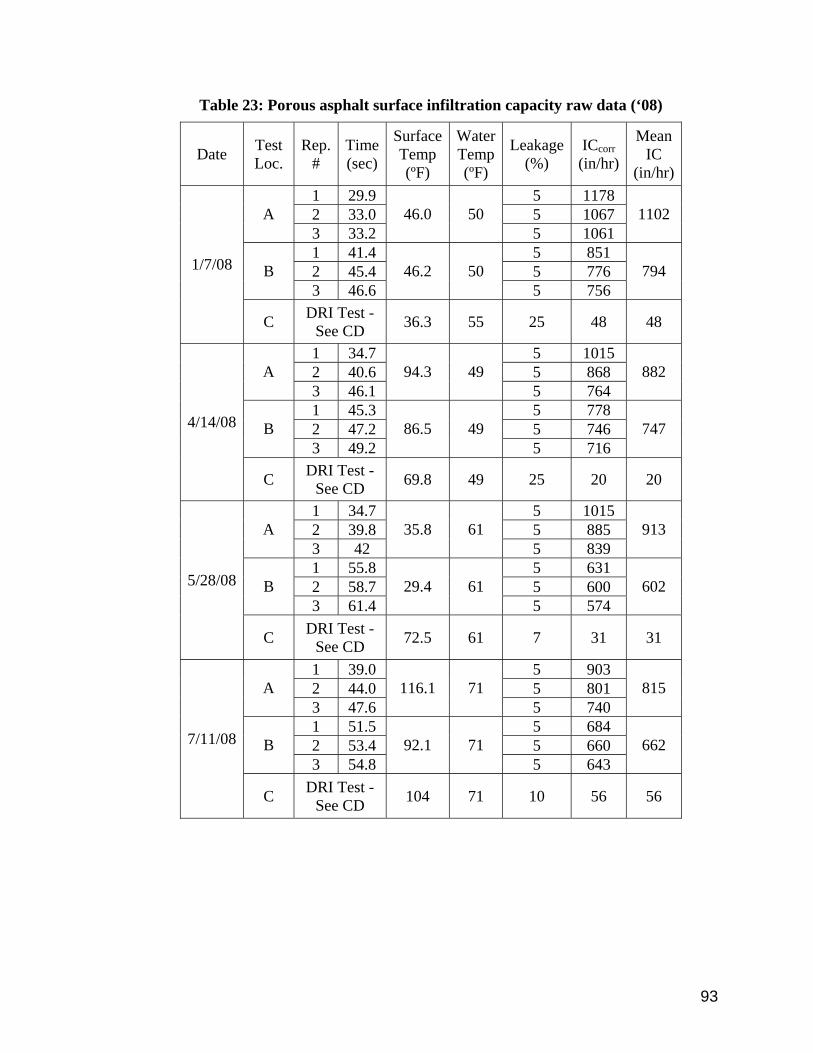
93
Table 23: Porous asphalt surface infiltration capacity raw data (‘08)
Date Test Loc.
Rep. #
Time (sec)
Surface Temp (ºF)
Water Temp (ºF)
Leakage (%)
ICcorr (in/hr)
Mean IC
(in/hr)1 29.9 5 1178 2 33.0 5 1067 A 3 33.2
46.0 50 5 1061
1102
1 41.4 5 851 2 45.4 5 776 B 3 46.6
46.2 50 5 756
794 1/7/08
C DRI Test - See CD 36.3 55 25 48 48
1 34.7 5 1015 2 40.6 5 868 A 3 46.1
94.3 49 5 764
882
1 45.3 5 778 2 47.2 5 746 B 3 49.2
86.5 49 5 716
747 4/14/08
C DRI Test - See CD 69.8 49 25 20 20
1 34.7 5 1015 2 39.8 5 885 A 3 42
35.8 61 5 839
913
1 55.8 5 631 2 58.7 5 600 B 3 61.4
29.4 61 5 574
602 5/28/08
C DRI Test - See CD 72.5 61 7 31 31
1 39.0 5 903 2 44.0 5 801 A 3 47.6
116.1 71 5 740
815
1 51.5 5 684 2 53.4 5 660 B 3 54.8
92.1 71 5 643
662 7/11/08
C DRI Test - See CD 104 71 10 56 56
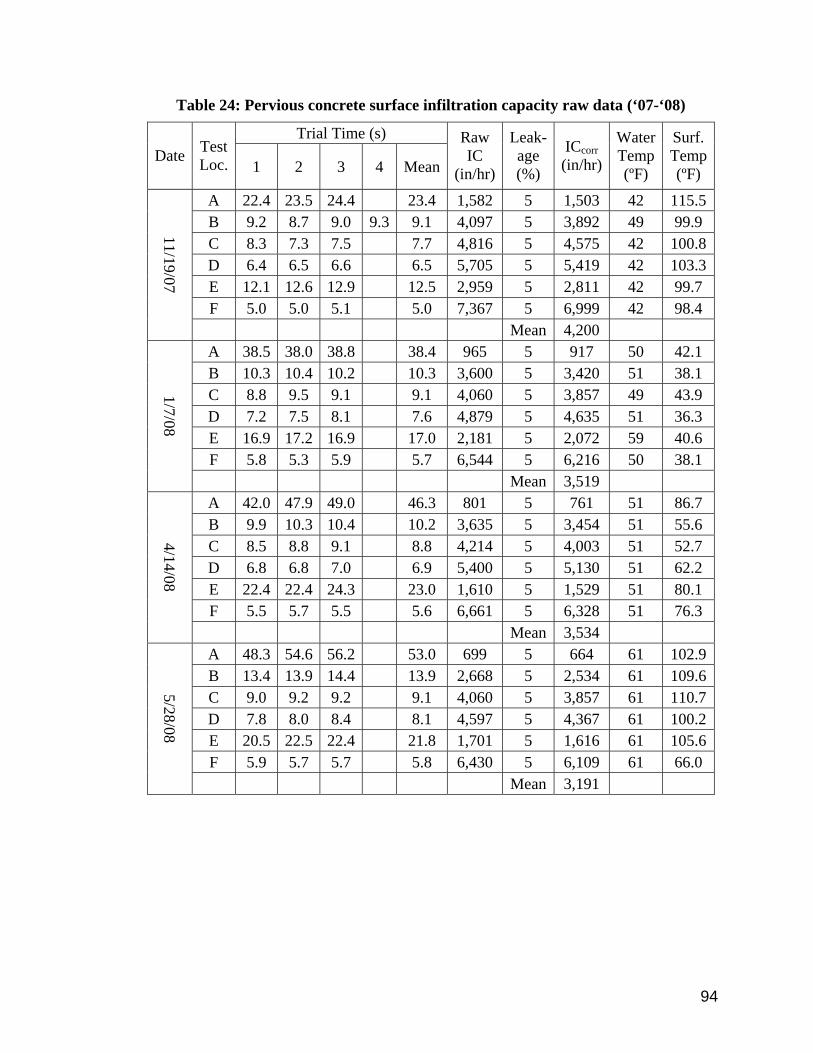
94
Table 24: Pervious concrete surface infiltration capacity raw data (‘07-‘08)
Trial Time (s) Date Test
Loc. 1 2 3 4 Mean
Raw IC
(in/hr)
Leak-age (%)
ICcorr (in/hr)
Water Temp (ºF)
Surf. Temp (ºF)
A 22.4 23.5 24.4 23.4 1,582 5 1,503 42 115.5B 9.2 8.7 9.0 9.3 9.1 4,097 5 3,892 49 99.9 C 8.3 7.3 7.5 7.7 4,816 5 4,575 42 100.8D 6.4 6.5 6.6 6.5 5,705 5 5,419 42 103.3E 12.1 12.6 12.9 12.5 2,959 5 2,811 42 99.7 F 5.0 5.0 5.1 5.0 7,367 5 6,999 42 98.4
11/19/07
Mean 4,200 A 38.5 38.0 38.8 38.4 965 5 917 50 42.1 B 10.3 10.4 10.2 10.3 3,600 5 3,420 51 38.1 C 8.8 9.5 9.1 9.1 4,060 5 3,857 49 43.9 D 7.2 7.5 8.1 7.6 4,879 5 4,635 51 36.3 E 16.9 17.2 16.9 17.0 2,181 5 2,072 59 40.6 F 5.8 5.3 5.9 5.7 6,544 5 6,216 50 38.1
1/7/08
Mean 3,519 A 42.0 47.9 49.0 46.3 801 5 761 51 86.7 B 9.9 10.3 10.4 10.2 3,635 5 3,454 51 55.6 C 8.5 8.8 9.1 8.8 4,214 5 4,003 51 52.7 D 6.8 6.8 7.0 6.9 5,400 5 5,130 51 62.2 E 22.4 22.4 24.3 23.0 1,610 5 1,529 51 80.1 F 5.5 5.7 5.5 5.6 6,661 5 6,328 51 76.3
4/14/08 Mean 3,534 A 48.3 54.6 56.2 53.0 699 5 664 61 102.9B 13.4 13.9 14.4 13.9 2,668 5 2,534 61 109.6C 9.0 9.2 9.2 9.1 4,060 5 3,857 61 110.7D 7.8 8.0 8.4 8.1 4,597 5 4,367 61 100.2E 20.5 22.5 22.4 21.8 1,701 5 1,616 61 105.6F 5.9 5.7 5.7 5.8 6,430 5 6,109 61 66.0
5/28/08
Mean 3,191
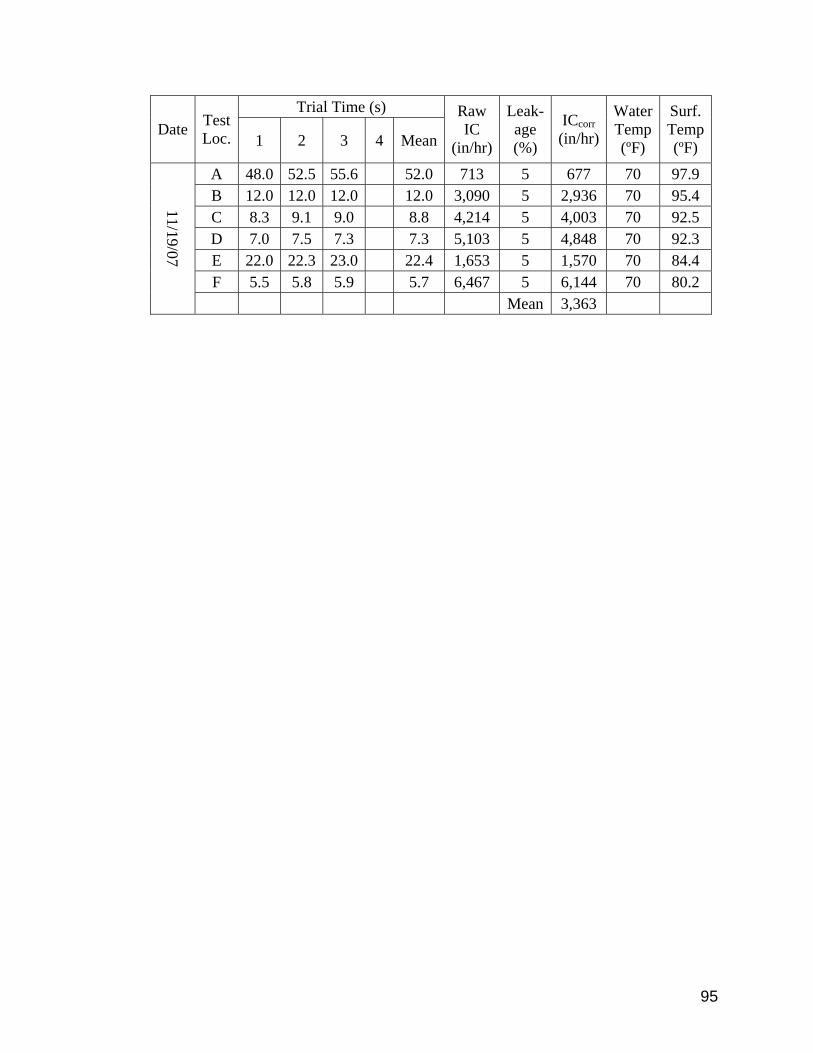
95
Trial Time (s) Date Test
Loc. 1 2 3 4 Mean
Raw IC
(in/hr)
Leak-age (%)
ICcorr (in/hr)
Water Temp (ºF)
Surf. Temp (ºF)
A 48.0 52.5 55.6 52.0 713 5 677 70 97.9 B 12.0 12.0 12.0 12.0 3,090 5 2,936 70 95.4 C 8.3 9.1 9.0 8.8 4,214 5 4,003 70 92.5 D 7.0 7.5 7.3 7.3 5,103 5 4,848 70 92.3 E 22.0 22.3 23.0 22.4 1,653 5 1,570 70 84.4 F 5.5 5.8 5.9 5.7 6,467 5 6,144 70 80.2
11/19/07
Mean 3,363
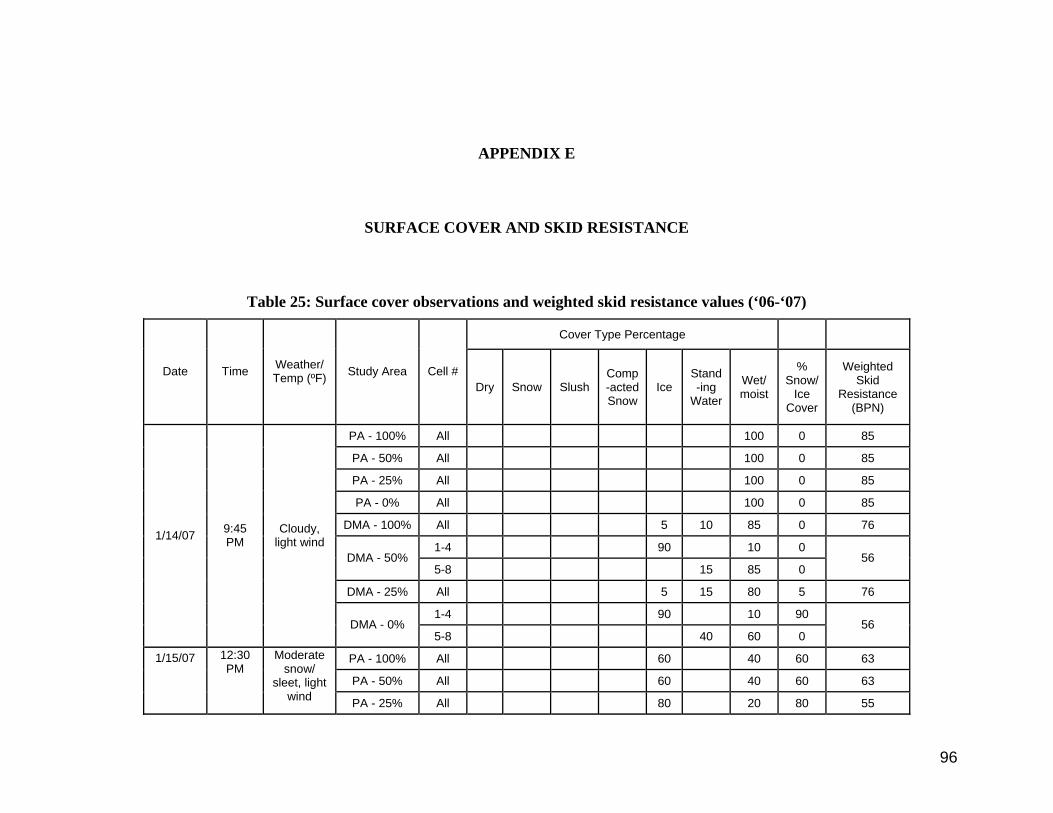
96
APPENDIX E
SURFACE COVER AND SKID RESISTANCE
Table 25: Surface cover observations and weighted skid resistance values (‘06-‘07)
Cover Type Percentage
Date Time Weather/ Temp (ºF) Study Area Cell #
Dry Snow Slush Comp-acted Snow
Ice Stand-ing
Water
Wet/ moist
% Snow/
Ice Cover
Weighted Skid
Resistance (BPN)
PA - 100% All 100 0 85
PA - 50% All 100 0 85
PA - 25% All 100 0 85
PA - 0% All 100 0 85
DMA - 100% All 5 10 85 0 76
1-4 90 10 0 DMA - 50%
5-8 15 85 0 56
DMA - 25% All 5 15 80 5 76
1-4 90 10 90
1/14/07 9:45 PM
Cloudy, light wind
DMA - 0% 5-8 40 60 0
56
PA - 100% All 60 40 60 63
PA - 50% All 60 40 60 63
1/15/07 12:30 PM
Moderate snow/
sleet, light wind PA - 25% All 80 20 80 55
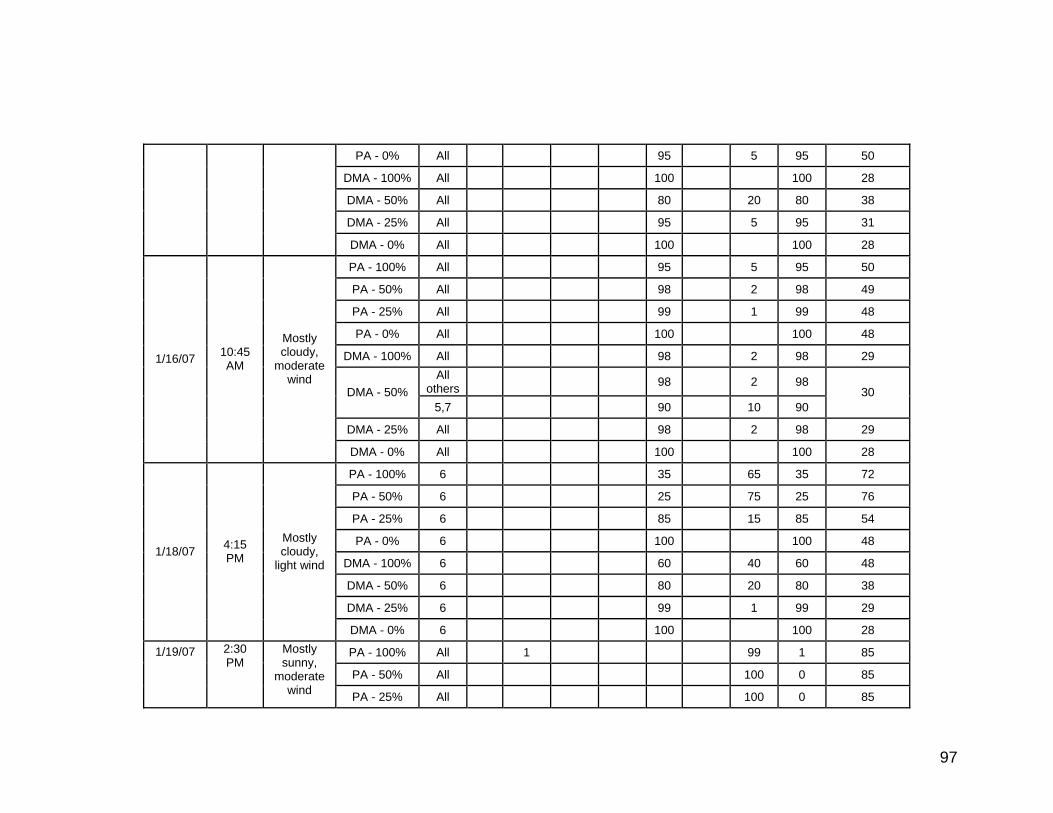
97
PA - 0% All 95 5 95 50
DMA - 100% All 100 100 28
DMA - 50% All 80 20 80 38
DMA - 25% All 95 5 95 31
DMA - 0% All 100 100 28
PA - 100% All 95 5 95 50
PA - 50% All 98 2 98 49
PA - 25% All 99 1 99 48
PA - 0% All 100 100 48
DMA - 100% All 98 2 98 29 All
others 98 2 98 DMA - 50%
5,7 90 10 90 30
DMA - 25% All 98 2 98 29
1/16/07 10:45 AM
Mostly cloudy,
moderate wind
DMA - 0% All 100 100 28
PA - 100% 6 35 65 35 72
PA - 50% 6 25 75 25 76
PA - 25% 6 85 15 85 54
PA - 0% 6 100 100 48
DMA - 100% 6 60 40 60 48
DMA - 50% 6 80 20 80 38
DMA - 25% 6 99 1 99 29
1/18/07 4:15 PM
Mostly cloudy,
light wind
DMA - 0% 6 100 100 28
PA - 100% All 1 99 1 85
PA - 50% All 100 0 85
1/19/07 2:30 PM
Mostly sunny,
moderate wind PA - 25% All 100 0 85
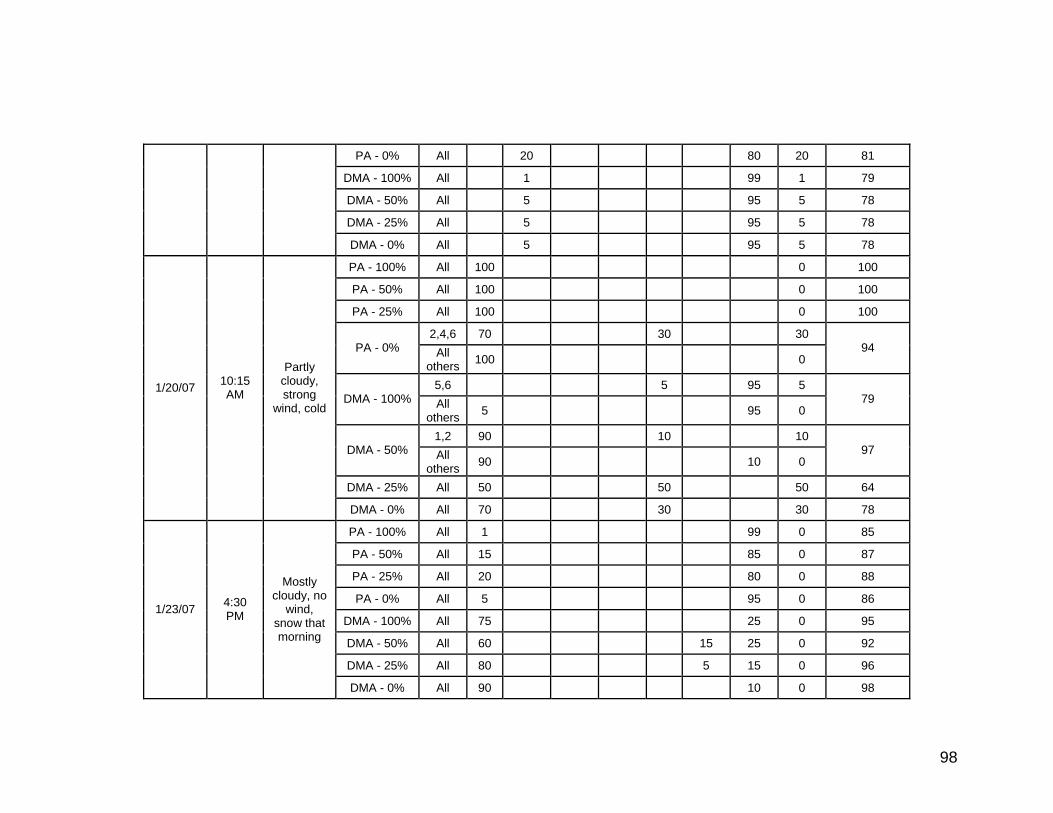
98
PA - 0% All 20 80 20 81
DMA - 100% All 1 99 1 79
DMA - 50% All 5 95 5 78
DMA - 25% All 5 95 5 78
DMA - 0% All 5 95 5 78
PA - 100% All 100 0 100
PA - 50% All 100 0 100
PA - 25% All 100 0 100
2,4,6 70 30 30 PA - 0% All
others 100 0 94
5,6 5 95 5 DMA - 100% All
others 5 95 0 79
1,2 90 10 10 DMA - 50% All
others 90 10 0 97
DMA - 25% All 50 50 50 64
1/20/07 10:15 AM
Partly cloudy, strong
wind, cold
DMA - 0% All 70 30 30 78
PA - 100% All 1 99 0 85
PA - 50% All 15 85 0 87
PA - 25% All 20 80 0 88
PA - 0% All 5 95 0 86
DMA - 100% All 75 25 0 95
DMA - 50% All 60 15 25 0 92
DMA - 25% All 80 5 15 0 96
1/23/07 4:30 PM
Mostly cloudy, no
wind, snow that morning
DMA - 0% All 90 10 0 98
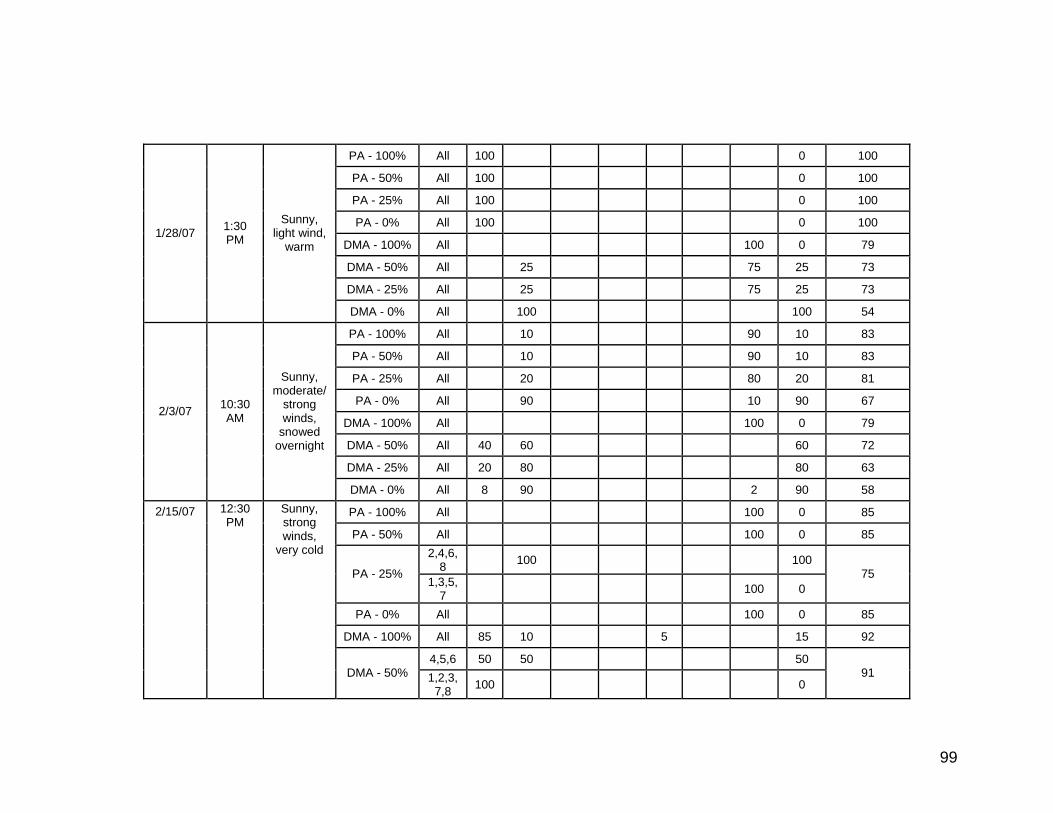
99
PA - 100% All 100 0 100
PA - 50% All 100 0 100
PA - 25% All 100 0 100
PA - 0% All 100 0 100
DMA - 100% All 100 0 79
DMA - 50% All 25 75 25 73
DMA - 25% All 25 75 25 73
1/28/07 1:30 PM
Sunny, light wind,
warm
DMA - 0% All 100 100 54
PA - 100% All 10 90 10 83
PA - 50% All 10 90 10 83
PA - 25% All 20 80 20 81
PA - 0% All 90 10 90 67
DMA - 100% All 100 0 79
DMA - 50% All 40 60 60 72
DMA - 25% All 20 80 80 63
2/3/07 10:30 AM
Sunny, moderate/
strong winds,
snowed overnight
DMA - 0% All 8 90 2 90 58
PA - 100% All 100 0 85
PA - 50% All 100 0 85 2,4,6,
8 100 100 PA - 25%
1,3,5,7 100 0
75
PA - 0% All 100 0 85
DMA - 100% All 85 10 5 15 92
4,5,6 50 50 50
2/15/07 12:30 PM
Sunny, strong winds,
very cold
DMA - 50% 1,2,3,7,8 100 0
91
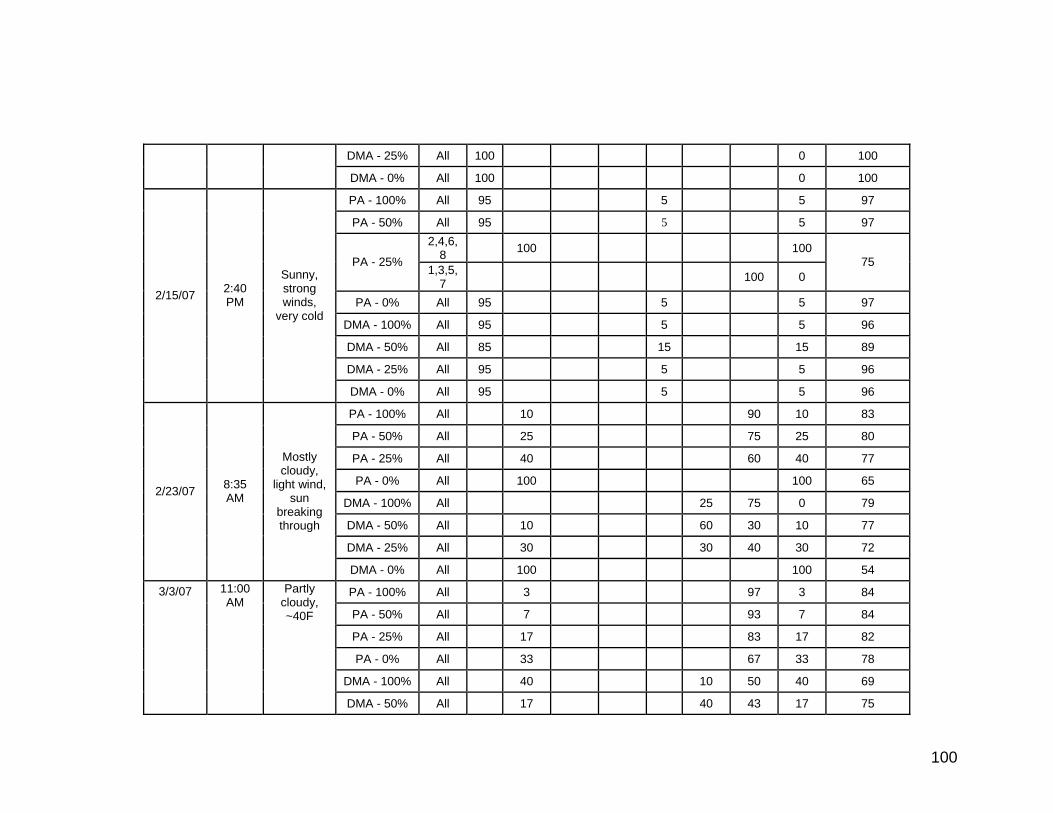
100
DMA - 25% All 100 0 100
DMA - 0% All 100 0 100
PA - 100% All 95 5 5 97
PA - 50% All 95 5 5 97 2,4,6,
8 100 100 PA - 25%
1,3,5,7 100 0
75
PA - 0% All 95 5 5 97
DMA - 100% All 95 5 5 96
DMA - 50% All 85 15 15 89
DMA - 25% All 95 5 5 96
2/15/07 2:40 PM
Sunny, strong winds,
very cold
DMA - 0% All 95 5 5 96
PA - 100% All 10 90 10 83
PA - 50% All 25 75 25 80
PA - 25% All 40 60 40 77
PA - 0% All 100 100 65
DMA - 100% All 25 75 0 79
DMA - 50% All 10 60 30 10 77
DMA - 25% All 30 30 40 30 72
2/23/07 8:35 AM
Mostly cloudy,
light wind, sun
breaking through
DMA - 0% All 100 100 54
PA - 100% All 3 97 3 84
PA - 50% All 7 93 7 84
PA - 25% All 17 83 17 82
PA - 0% All 33 67 33 78
DMA - 100% All 40 10 50 40 69
3/3/07 11:00 AM
Partly cloudy, ~40F
DMA - 50% All 17 40 43 17 75
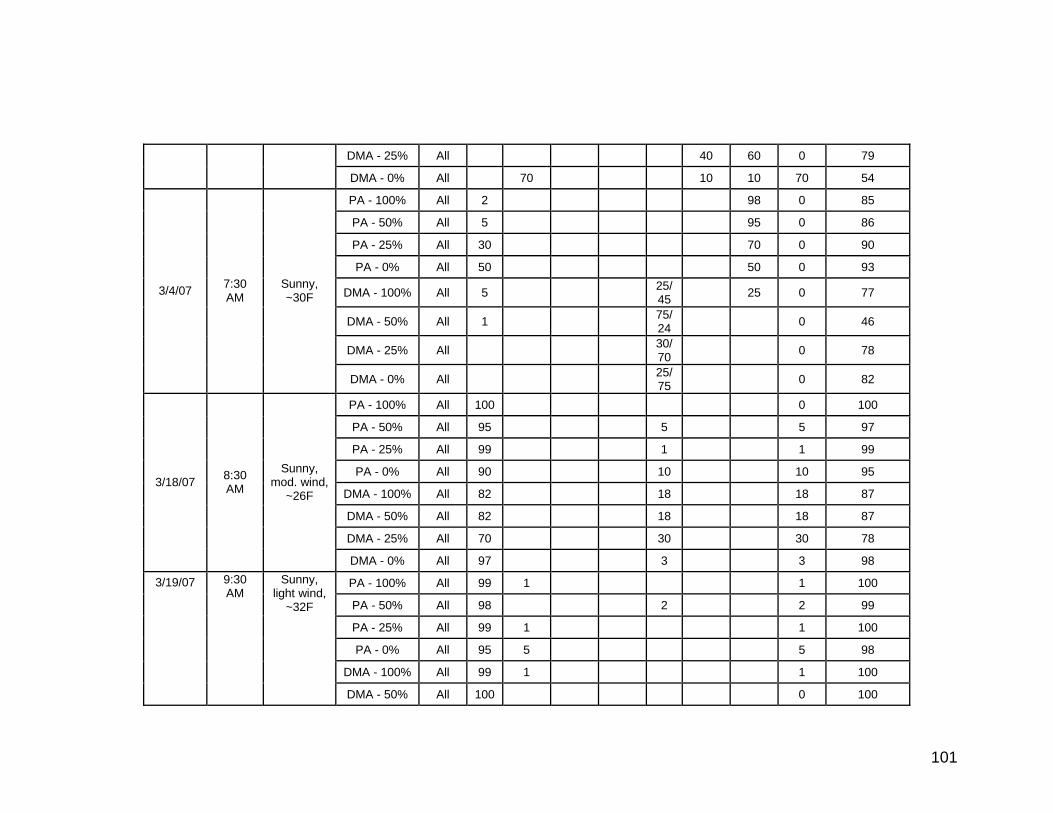
101
DMA - 25% All 40 60 0 79
DMA - 0% All 70 10 10 70 54
PA - 100% All 2 98 0 85
PA - 50% All 5 95 0 86
PA - 25% All 30 70 0 90
PA - 0% All 50 50 0 93
DMA - 100% All 5 25/45 25 0 77
DMA - 50% All 1 75/24 0 46
DMA - 25% All 30/70 0 78
3/4/07 7:30 AM
Sunny, ~30F
DMA - 0% All 25/75 0 82
PA - 100% All 100 0 100
PA - 50% All 95 5 5 97
PA - 25% All 99 1 1 99
PA - 0% All 90 10 10 95
DMA - 100% All 82 18 18 87
DMA - 50% All 82 18 18 87
DMA - 25% All 70 30 30 78
3/18/07 8:30 AM
Sunny, mod. wind,
~26F
DMA - 0% All 97 3 3 98
PA - 100% All 99 1 1 100
PA - 50% All 98 2 2 99
PA - 25% All 99 1 1 100
PA - 0% All 95 5 5 98
DMA - 100% All 99 1 1 100
3/19/07 9:30 AM
Sunny, light wind,
~32F
DMA - 50% All 100 0 100
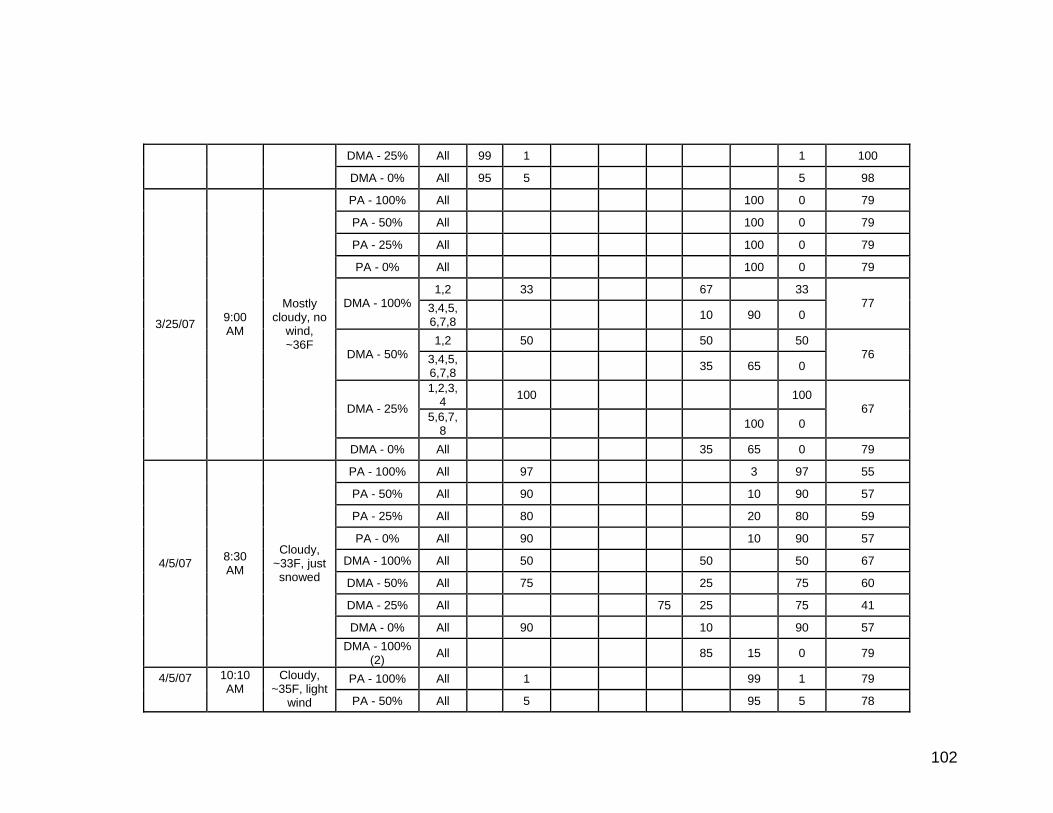
102
DMA - 25% All 99 1 1 100
DMA - 0% All 95 5 5 98
PA - 100% All 100 0 79
PA - 50% All 100 0 79
PA - 25% All 100 0 79
PA - 0% All 100 0 79
1,2 33 67 33 DMA - 100% 3,4,5,
6,7,8 10 90 0 77
1,2 50 50 50 DMA - 50% 3,4,5,
6,7,8 35 65 0 76
1,2,3,4 100 100
DMA - 25% 5,6,7,
8 100 0 67
3/25/07 9:00 AM
Mostly cloudy, no
wind, ~36F
DMA - 0% All 35 65 0 79
PA - 100% All 97 3 97 55
PA - 50% All 90 10 90 57
PA - 25% All 80 20 80 59
PA - 0% All 90 10 90 57
DMA - 100% All 50 50 50 67
DMA - 50% All 75 25 75 60
DMA - 25% All 75 25 75 41
DMA - 0% All 90 10 90 57
4/5/07 8:30 AM
Cloudy, ~33F, just snowed
DMA - 100% (2) All 85 15 0 79
PA - 100% All 1 99 1 79 4/5/07 10:10 AM
Cloudy, ~35F, light
wind PA - 50% All 5 95 5 78
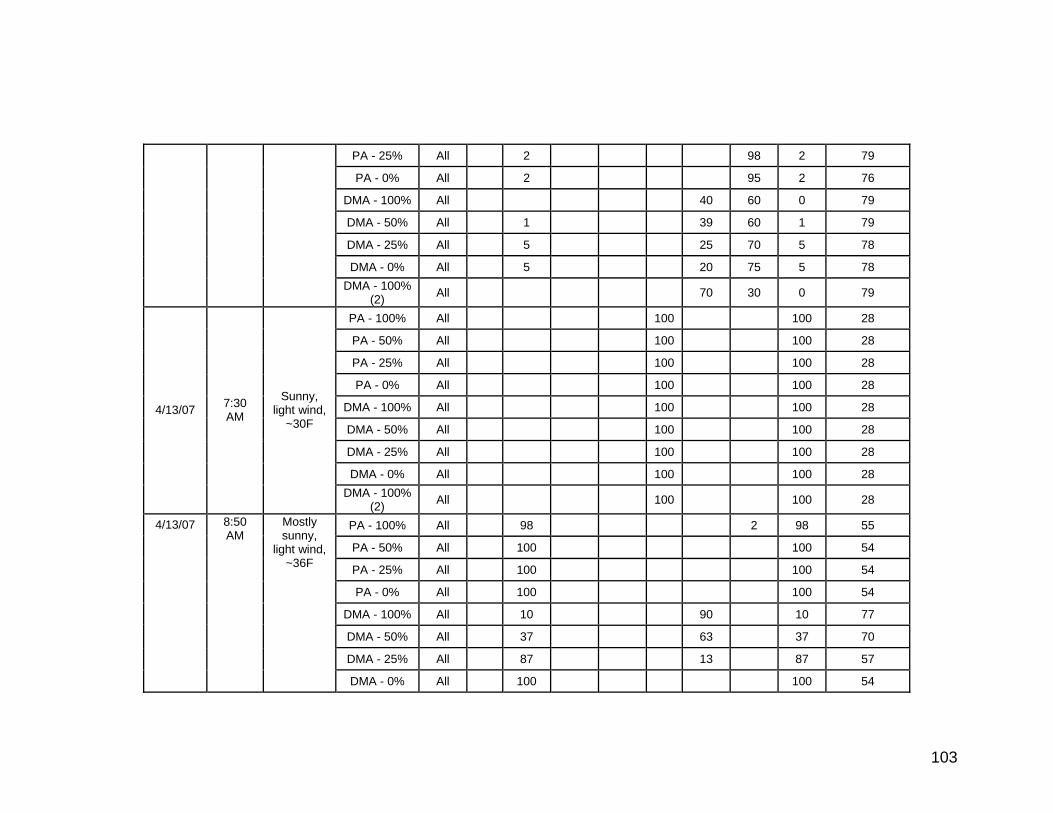
103
PA - 25% All 2 98 2 79
PA - 0% All 2 95 2 76
DMA - 100% All 40 60 0 79
DMA - 50% All 1 39 60 1 79
DMA - 25% All 5 25 70 5 78
DMA - 0% All 5 20 75 5 78 DMA - 100%
(2) All 70 30 0 79
PA - 100% All 100 100 28
PA - 50% All 100 100 28
PA - 25% All 100 100 28
PA - 0% All 100 100 28
DMA - 100% All 100 100 28
DMA - 50% All 100 100 28
DMA - 25% All 100 100 28
DMA - 0% All 100 100 28
4/13/07 7:30 AM
Sunny, light wind,
~30F
DMA - 100% (2) All 100 100 28
PA - 100% All 98 2 98 55
PA - 50% All 100 100 54
PA - 25% All 100 100 54
PA - 0% All 100 100 54
DMA - 100% All 10 90 10 77
DMA - 50% All 37 63 37 70
DMA - 25% All 87 13 87 57
4/13/07 8:50 AM
Mostly sunny,
light wind, ~36F
DMA - 0% All 100 100 54
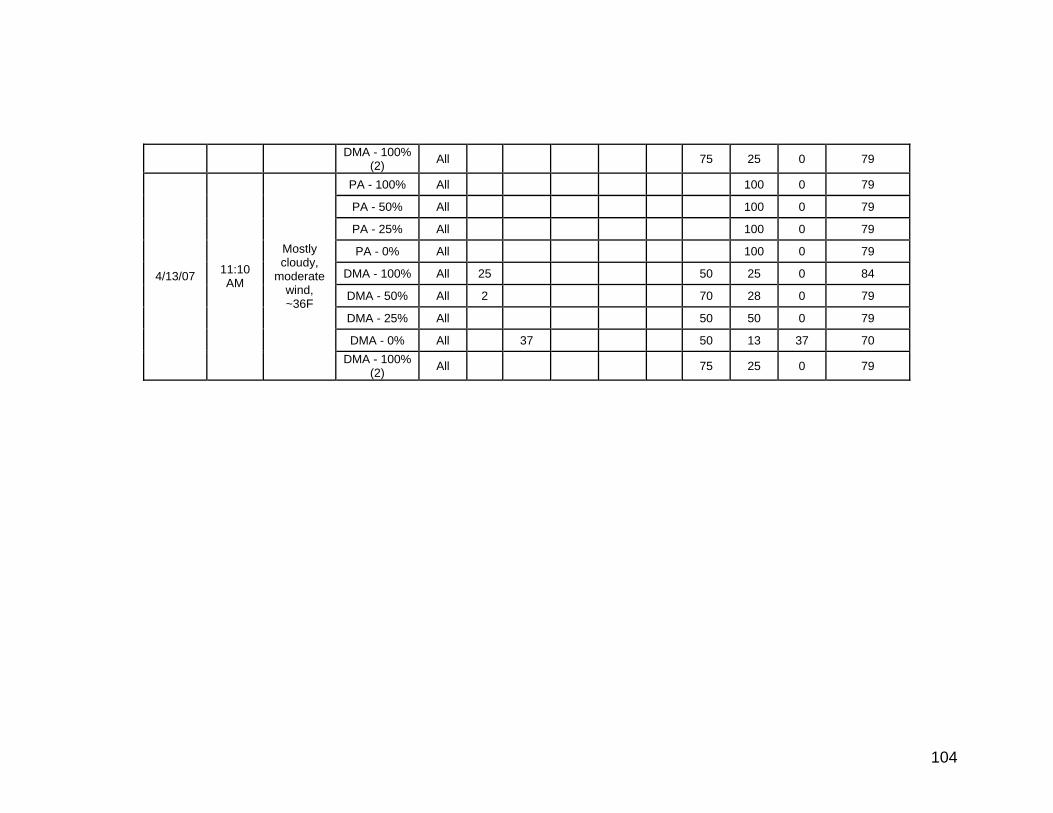
104
DMA - 100% (2) All 75 25 0 79
PA - 100% All 100 0 79
PA - 50% All 100 0 79
PA - 25% All 100 0 79
PA - 0% All 100 0 79
DMA - 100% All 25 50 25 0 84
DMA - 50% All 2 70 28 0 79
DMA - 25% All 50 50 0 79
DMA - 0% All 37 50 13 37 70
4/13/07 11:10 AM
Mostly cloudy,
moderate wind, ~36F
DMA - 100% (2) All 75 25 0 79
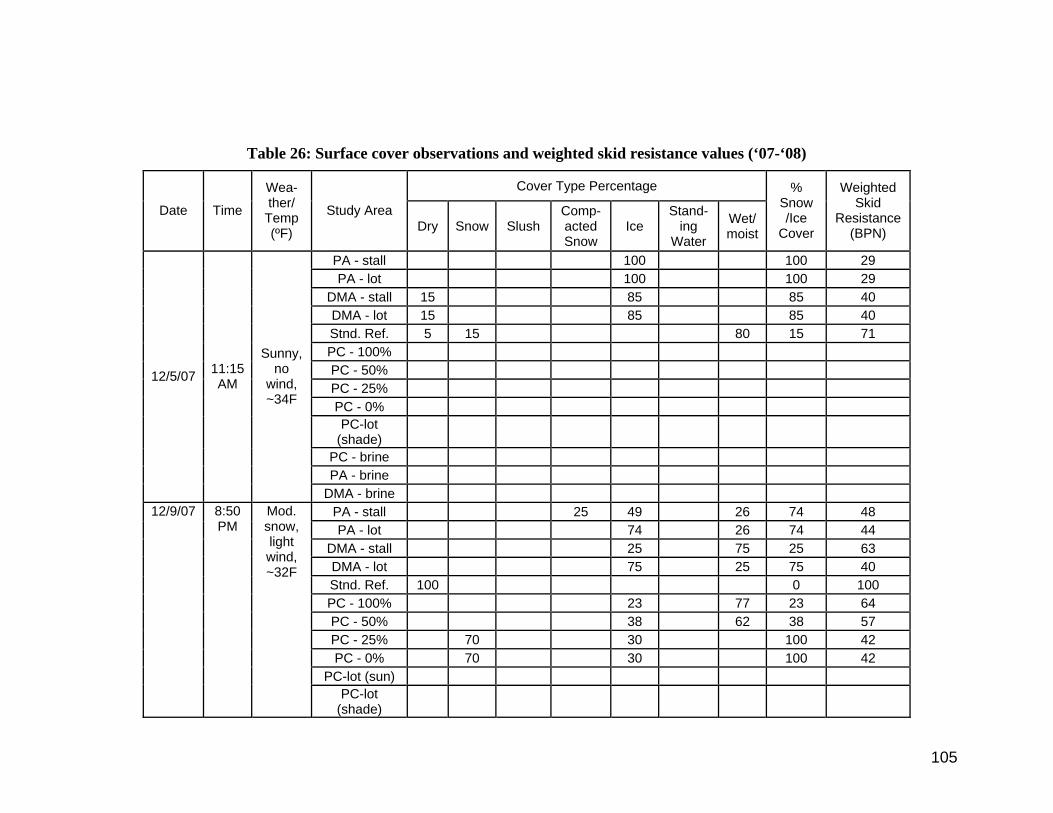
105
Table 26: Surface cover observations and weighted skid resistance values (‘07-‘08)
Cover Type Percentage
Date Time
Wea-ther/
Temp (ºF)
Study Area Dry Snow Slush
Comp-acted Snow
Ice Stand-
ing Water
Wet/ moist
% Snow /Ice
Cover
Weighted Skid
Resistance (BPN)
PA - stall 100 100 29 PA - lot 100 100 29
DMA - stall 15 85 85 40 DMA - lot 15 85 85 40 Stnd. Ref. 5 15 80 15 71 PC - 100% PC - 50% PC - 25% PC - 0% PC-lot
(shade)
PC - brine PA - brine
12/5/07 11:15 AM
Sunny, no
wind, ~34F
DMA - brine PA - stall 25 49 26 74 48 PA - lot 74 26 74 44
DMA - stall 25 75 25 63 DMA - lot 75 25 75 40 Stnd. Ref. 100 0 100 PC - 100% 23 77 23 64 PC - 50% 38 62 38 57 PC - 25% 70 30 100 42 PC - 0% 70 30 100 42
PC-lot (sun)
12/9/07 8:50 PM
Mod. snow, light wind, ~32F
PC-lot (shade)
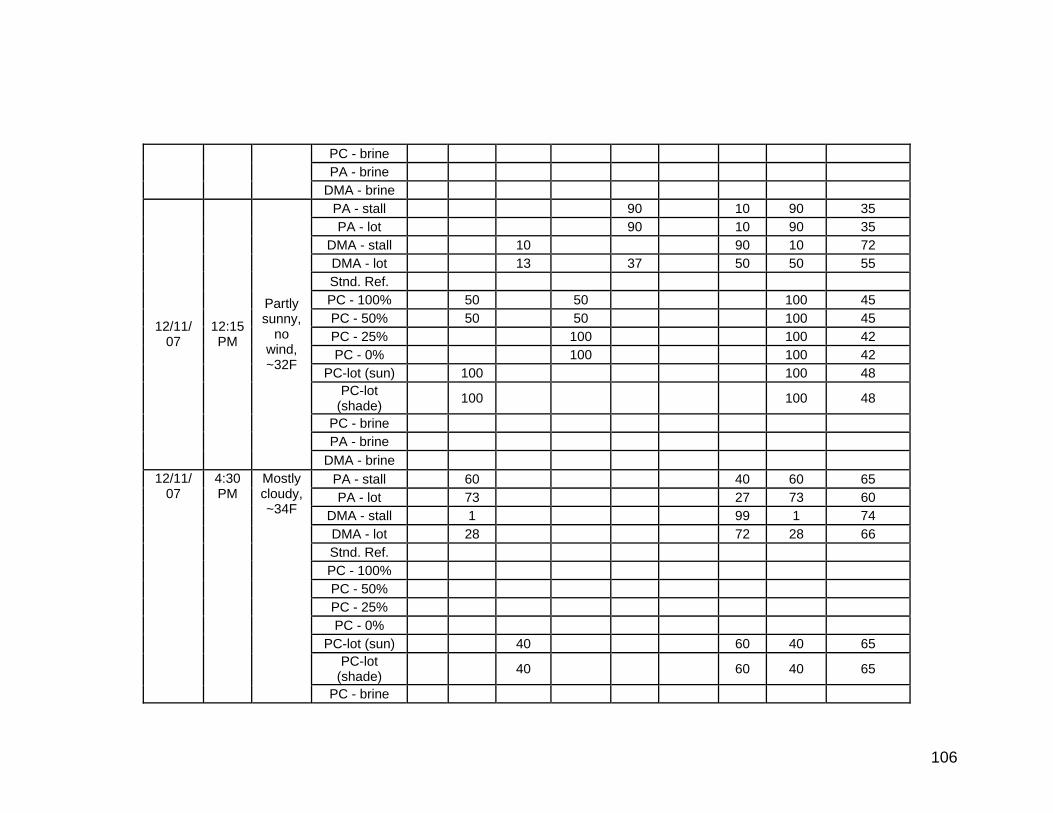
106
PC - brine PA - brine
DMA - brine PA - stall 90 10 90 35 PA - lot 90 10 90 35
DMA - stall 10 90 10 72 DMA - lot 13 37 50 50 55 Stnd. Ref. PC - 100% 50 50 100 45 PC - 50% 50 50 100 45 PC - 25% 100 100 42 PC - 0% 100 100 42
PC-lot (sun) 100 100 48 PC-lot
(shade) 100 100 48
PC - brine PA - brine
12/11/ 07
12:15 PM
Partly sunny,
no wind, ~32F
DMA - brine PA - stall 60 40 60 65 PA - lot 73 27 73 60
DMA - stall 1 99 1 74 DMA - lot 28 72 28 66 Stnd. Ref. PC - 100% PC - 50% PC - 25% PC - 0%
PC-lot (sun) 40 60 40 65 PC-lot
(shade) 40 60 40 65
12/11/ 07
4:30 PM
Mostly cloudy, ~34F
PC - brine
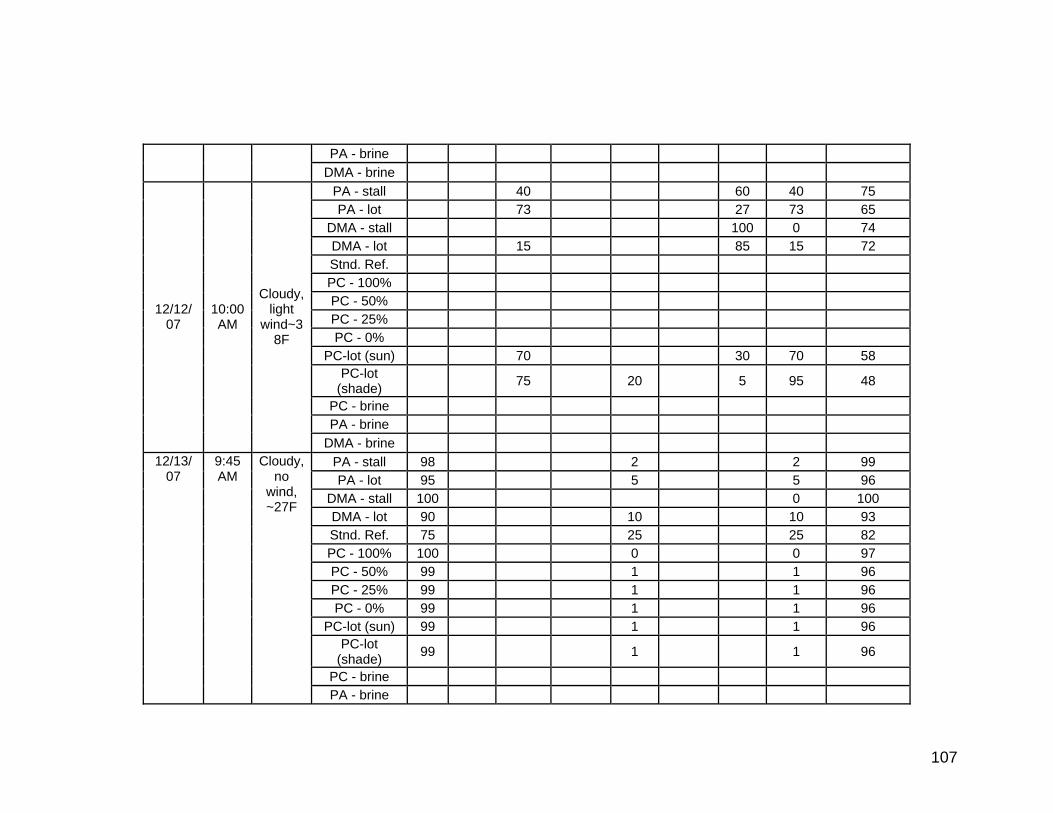
107
PA - brine DMA - brine
PA - stall 40 60 40 75 PA - lot 73 27 73 65
DMA - stall 100 0 74 DMA - lot 15 85 15 72 Stnd. Ref. PC - 100% PC - 50% PC - 25% PC - 0%
PC-lot (sun) 70 30 70 58 PC-lot
(shade) 75 20 5 95 48
PC - brine PA - brine
12/12/ 07
10:00 AM
Cloudy, light
wind~38F
DMA - brine PA - stall 98 2 2 99 PA - lot 95 5 5 96
DMA - stall 100 0 100 DMA - lot 90 10 10 93 Stnd. Ref. 75 25 25 82 PC - 100% 100 0 0 97 PC - 50% 99 1 1 96 PC - 25% 99 1 1 96 PC - 0% 99 1 1 96
PC-lot (sun) 99 1 1 96 PC-lot
(shade) 99 1 1 96
PC - brine
12/13/ 07
9:45 AM
Cloudy, no
wind, ~27F
PA - brine
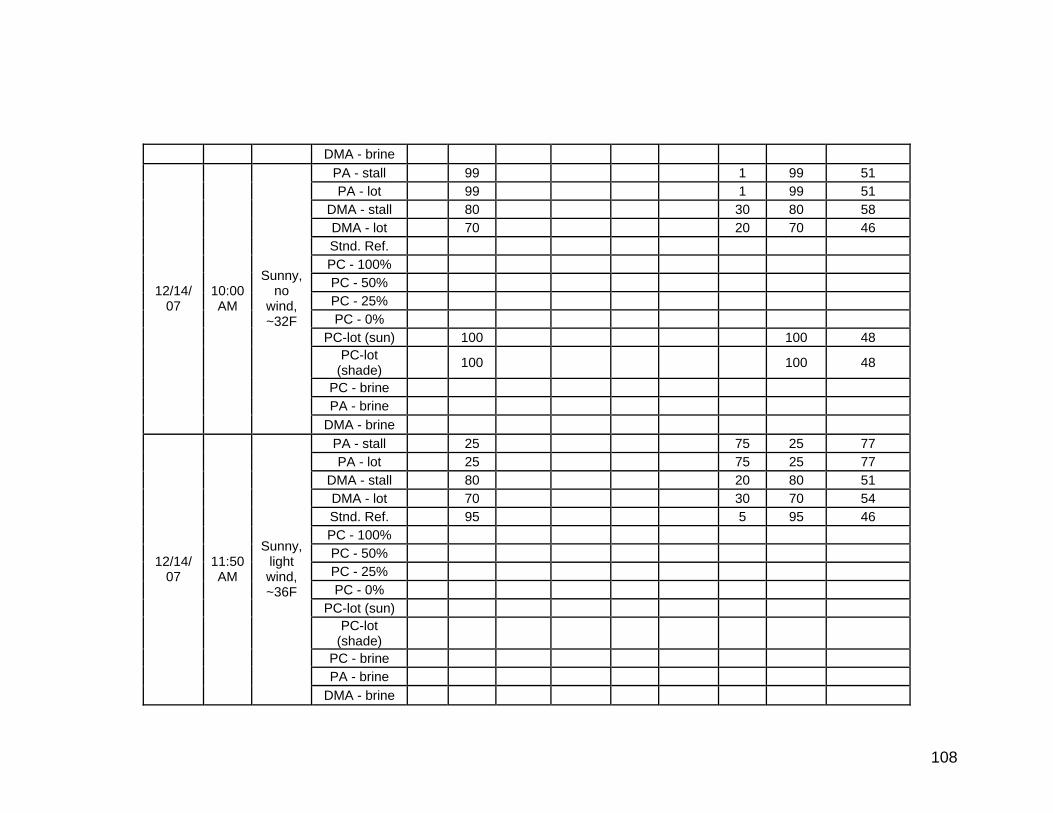
108
DMA - brine PA - stall 99 1 99 51 PA - lot 99 1 99 51
DMA - stall 80 30 80 58 DMA - lot 70 20 70 46 Stnd. Ref. PC - 100% PC - 50% PC - 25% PC - 0%
PC-lot (sun) 100 100 48 PC-lot
(shade) 100 100 48
PC - brine PA - brine
12/14/ 07
10:00 AM
Sunny, no
wind, ~32F
DMA - brine PA - stall 25 75 25 77 PA - lot 25 75 25 77
DMA - stall 80 20 80 51 DMA - lot 70 30 70 54 Stnd. Ref. 95 5 95 46 PC - 100% PC - 50% PC - 25% PC - 0%
PC-lot (sun) PC-lot
(shade)
PC - brine PA - brine
12/14/ 07
11:50 AM
Sunny, light wind, ~36F
DMA - brine
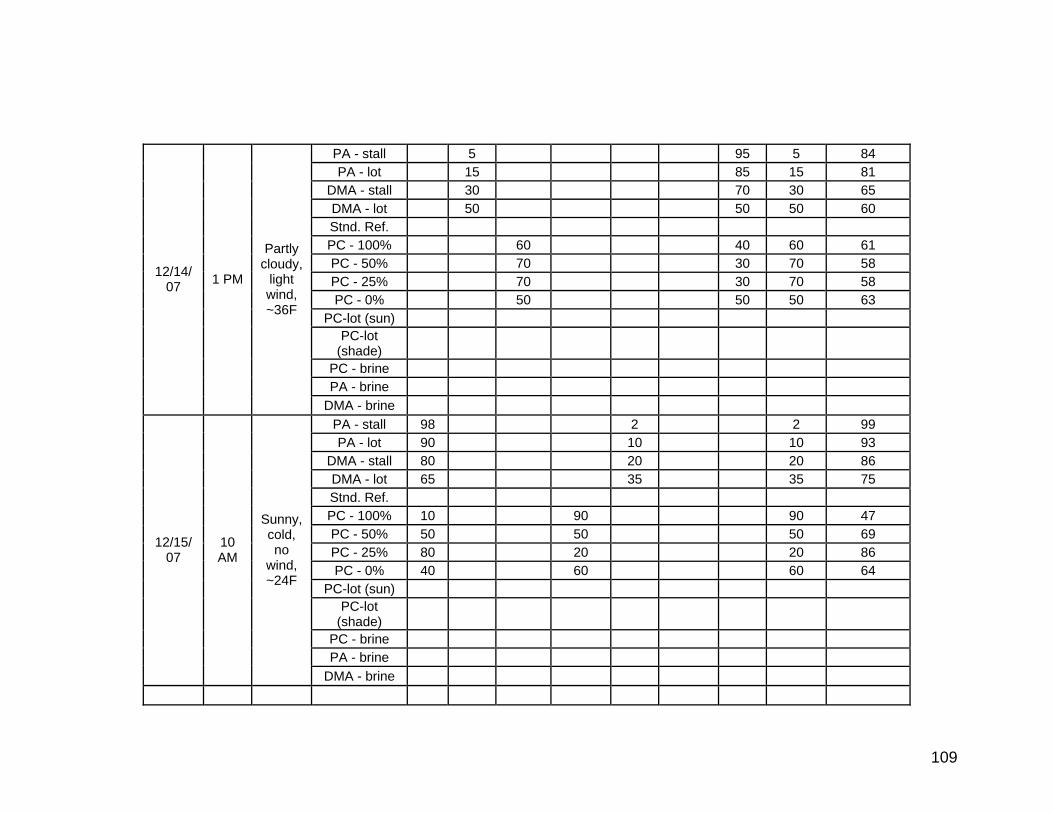
109
PA - stall 5 95 5 84 PA - lot 15 85 15 81
DMA - stall 30 70 30 65 DMA - lot 50 50 50 60 Stnd. Ref. PC - 100% 60 40 60 61 PC - 50% 70 30 70 58 PC - 25% 70 30 70 58 PC - 0% 50 50 50 63
PC-lot (sun) PC-lot
(shade)
PC - brine PA - brine
12/14/ 07 1 PM
Partly cloudy,
light wind, ~36F
DMA - brine PA - stall 98 2 2 99 PA - lot 90 10 10 93
DMA - stall 80 20 20 86 DMA - lot 65 35 35 75 Stnd. Ref. PC - 100% 10 90 90 47 PC - 50% 50 50 50 69 PC - 25% 80 20 20 86 PC - 0% 40 60 60 64
PC-lot (sun) PC-lot
(shade)
PC - brine PA - brine
12/15/ 07
10 AM
Sunny, cold, no
wind, ~24F
DMA - brine
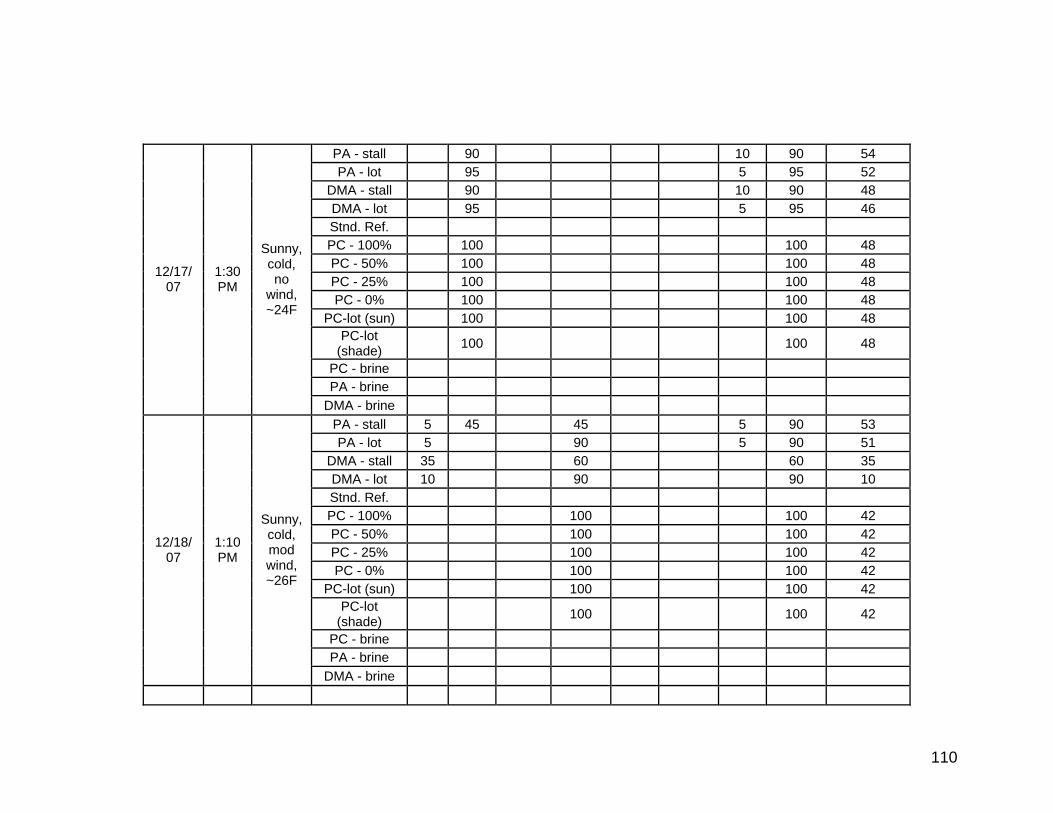
110
PA - stall 90 10 90 54 PA - lot 95 5 95 52
DMA - stall 90 10 90 48 DMA - lot 95 5 95 46 Stnd. Ref. PC - 100% 100 100 48 PC - 50% 100 100 48 PC - 25% 100 100 48 PC - 0% 100 100 48
PC-lot (sun) 100 100 48 PC-lot
(shade) 100 100 48
PC - brine PA - brine
12/17/ 07
1:30 PM
Sunny, cold, no
wind, ~24F
DMA - brine PA - stall 5 45 45 5 90 53 PA - lot 5 90 5 90 51
DMA - stall 35 60 60 35 DMA - lot 10 90 90 10 Stnd. Ref. PC - 100% 100 100 42 PC - 50% 100 100 42 PC - 25% 100 100 42 PC - 0% 100 100 42
PC-lot (sun) 100 100 42 PC-lot
(shade) 100 100 42
PC - brine PA - brine
12/18/ 07
1:10 PM
Sunny, cold, mod wind, ~26F
DMA - brine
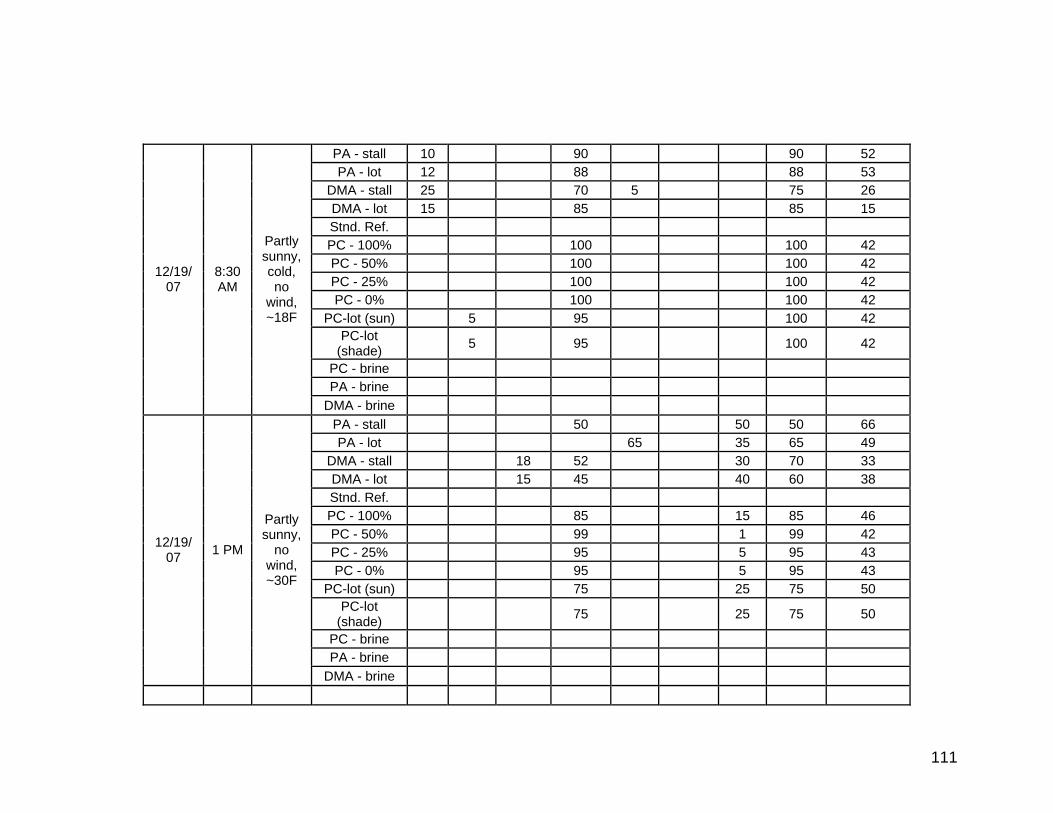
111
PA - stall 10 90 90 52 PA - lot 12 88 88 53
DMA - stall 25 70 5 75 26 DMA - lot 15 85 85 15 Stnd. Ref. PC - 100% 100 100 42 PC - 50% 100 100 42 PC - 25% 100 100 42 PC - 0% 100 100 42
PC-lot (sun) 5 95 100 42 PC-lot
(shade) 5 95 100 42
PC - brine PA - brine
12/19/ 07
8:30 AM
Partly sunny, cold, no
wind, ~18F
DMA - brine PA - stall 50 50 50 66 PA - lot 65 35 65 49
DMA - stall 18 52 30 70 33 DMA - lot 15 45 40 60 38 Stnd. Ref. PC - 100% 85 15 85 46 PC - 50% 99 1 99 42 PC - 25% 95 5 95 43 PC - 0% 95 5 95 43
PC-lot (sun) 75 25 75 50 PC-lot
(shade) 75 25 75 50
PC - brine PA - brine
12/19/ 07 1 PM
Partly sunny,
no wind, ~30F
DMA - brine
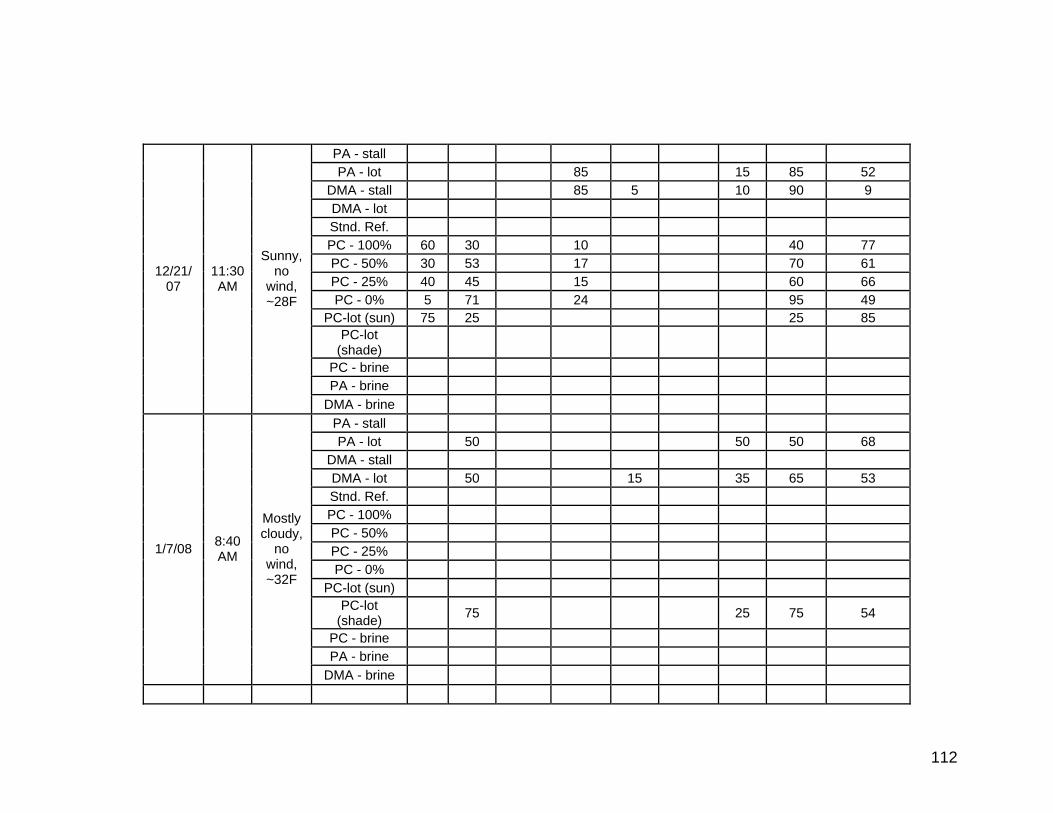
112
PA - stall PA - lot 85 15 85 52
DMA - stall 85 5 10 90 9 DMA - lot Stnd. Ref. PC - 100% 60 30 10 40 77 PC - 50% 30 53 17 70 61 PC - 25% 40 45 15 60 66 PC - 0% 5 71 24 95 49
PC-lot (sun) 75 25 25 85 PC-lot
(shade)
PC - brine PA - brine
12/21/ 07
11:30 AM
Sunny, no
wind, ~28F
DMA - brine PA - stall PA - lot 50 50 50 68
DMA - stall DMA - lot 50 15 35 65 53 Stnd. Ref. PC - 100% PC - 50% PC - 25% PC - 0%
PC-lot (sun) PC-lot
(shade) 75 25 75 54
PC - brine PA - brine
1/7/08 8:40 AM
Mostly cloudy,
no wind, ~32F
DMA - brine
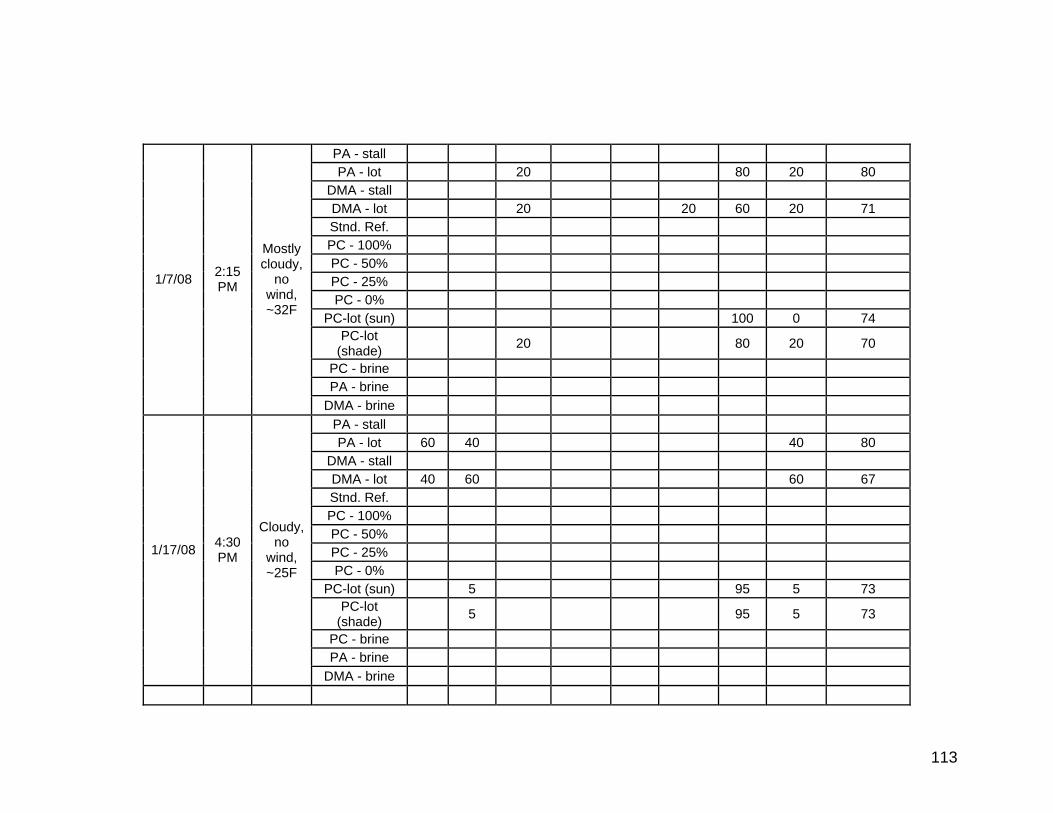
113
PA - stall PA - lot 20 80 20 80
DMA - stall DMA - lot 20 20 60 20 71 Stnd. Ref. PC - 100% PC - 50% PC - 25% PC - 0%
PC-lot (sun) 100 0 74 PC-lot
(shade) 20 80 20 70
PC - brine PA - brine
1/7/08 2:15 PM
Mostly cloudy,
no wind, ~32F
DMA - brine PA - stall PA - lot 60 40 40 80
DMA - stall DMA - lot 40 60 60 67 Stnd. Ref. PC - 100% PC - 50% PC - 25% PC - 0%
PC-lot (sun) 5 95 5 73 PC-lot
(shade) 5 95 5 73
PC - brine PA - brine
1/17/08 4:30 PM
Cloudy, no
wind, ~25F
DMA - brine
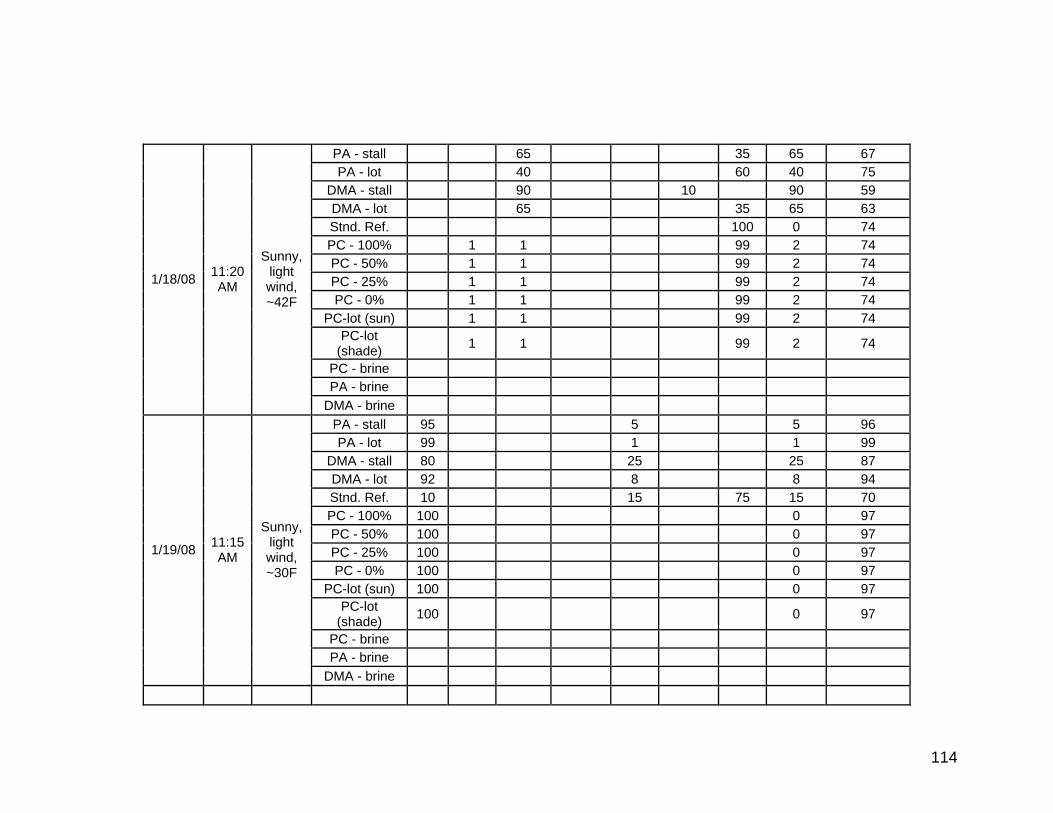
114
PA - stall 65 35 65 67 PA - lot 40 60 40 75
DMA - stall 90 10 90 59 DMA - lot 65 35 65 63 Stnd. Ref. 100 0 74 PC - 100% 1 1 99 2 74 PC - 50% 1 1 99 2 74 PC - 25% 1 1 99 2 74 PC - 0% 1 1 99 2 74
PC-lot (sun) 1 1 99 2 74 PC-lot
(shade) 1 1 99 2 74
PC - brine PA - brine
1/18/08 11:20 AM
Sunny, light wind, ~42F
DMA - brine PA - stall 95 5 5 96 PA - lot 99 1 1 99
DMA - stall 80 25 25 87 DMA - lot 92 8 8 94 Stnd. Ref. 10 15 75 15 70 PC - 100% 100 0 97 PC - 50% 100 0 97 PC - 25% 100 0 97 PC - 0% 100 0 97
PC-lot (sun) 100 0 97 PC-lot
(shade) 100 0 97
PC - brine PA - brine
1/19/08 11:15 AM
Sunny, light wind, ~30F
DMA - brine
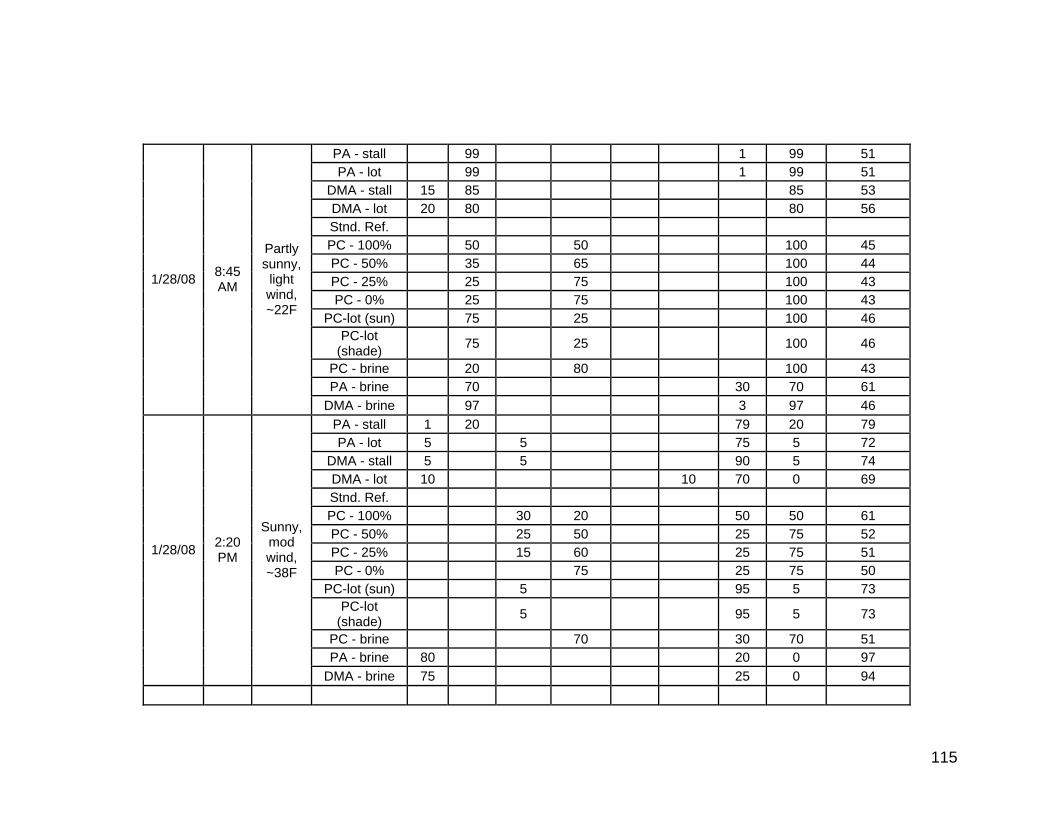
115
PA - stall 99 1 99 51 PA - lot 99 1 99 51
DMA - stall 15 85 85 53 DMA - lot 20 80 80 56 Stnd. Ref. PC - 100% 50 50 100 45 PC - 50% 35 65 100 44 PC - 25% 25 75 100 43 PC - 0% 25 75 100 43
PC-lot (sun) 75 25 100 46 PC-lot
(shade) 75 25 100 46
PC - brine 20 80 100 43 PA - brine 70 30 70 61
1/28/08 8:45 AM
Partly sunny, light wind, ~22F
DMA - brine 97 3 97 46 PA - stall 1 20 79 20 79 PA - lot 5 5 75 5 72
DMA - stall 5 5 90 5 74 DMA - lot 10 10 70 0 69 Stnd. Ref. PC - 100% 30 20 50 50 61 PC - 50% 25 50 25 75 52 PC - 25% 15 60 25 75 51 PC - 0% 75 25 75 50
PC-lot (sun) 5 95 5 73 PC-lot
(shade) 5 95 5 73
PC - brine 70 30 70 51 PA - brine 80 20 0 97
1/28/08 2:20 PM
Sunny, mod wind, ~38F
DMA - brine 75 25 0 94
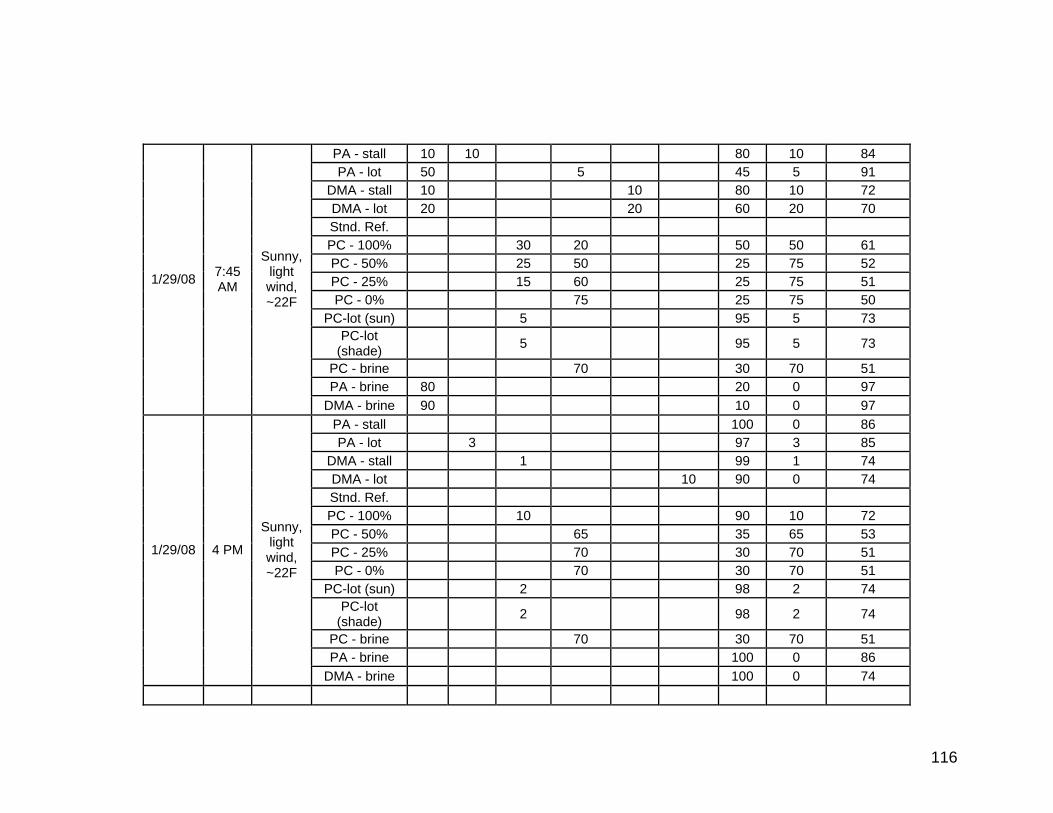
116
PA - stall 10 10 80 10 84 PA - lot 50 5 45 5 91
DMA - stall 10 10 80 10 72 DMA - lot 20 20 60 20 70 Stnd. Ref. PC - 100% 30 20 50 50 61 PC - 50% 25 50 25 75 52 PC - 25% 15 60 25 75 51 PC - 0% 75 25 75 50
PC-lot (sun) 5 95 5 73 PC-lot
(shade) 5 95 5 73
PC - brine 70 30 70 51 PA - brine 80 20 0 97
1/29/08 7:45 AM
Sunny, light wind, ~22F
DMA - brine 90 10 0 97 PA - stall 100 0 86 PA - lot 3 97 3 85
DMA - stall 1 99 1 74 DMA - lot 10 90 0 74 Stnd. Ref. PC - 100% 10 90 10 72 PC - 50% 65 35 65 53 PC - 25% 70 30 70 51 PC - 0% 70 30 70 51
PC-lot (sun) 2 98 2 74 PC-lot
(shade) 2 98 2 74
PC - brine 70 30 70 51 PA - brine 100 0 86
1/29/08 4 PM
Sunny, light wind, ~22F
DMA - brine 100 0 74
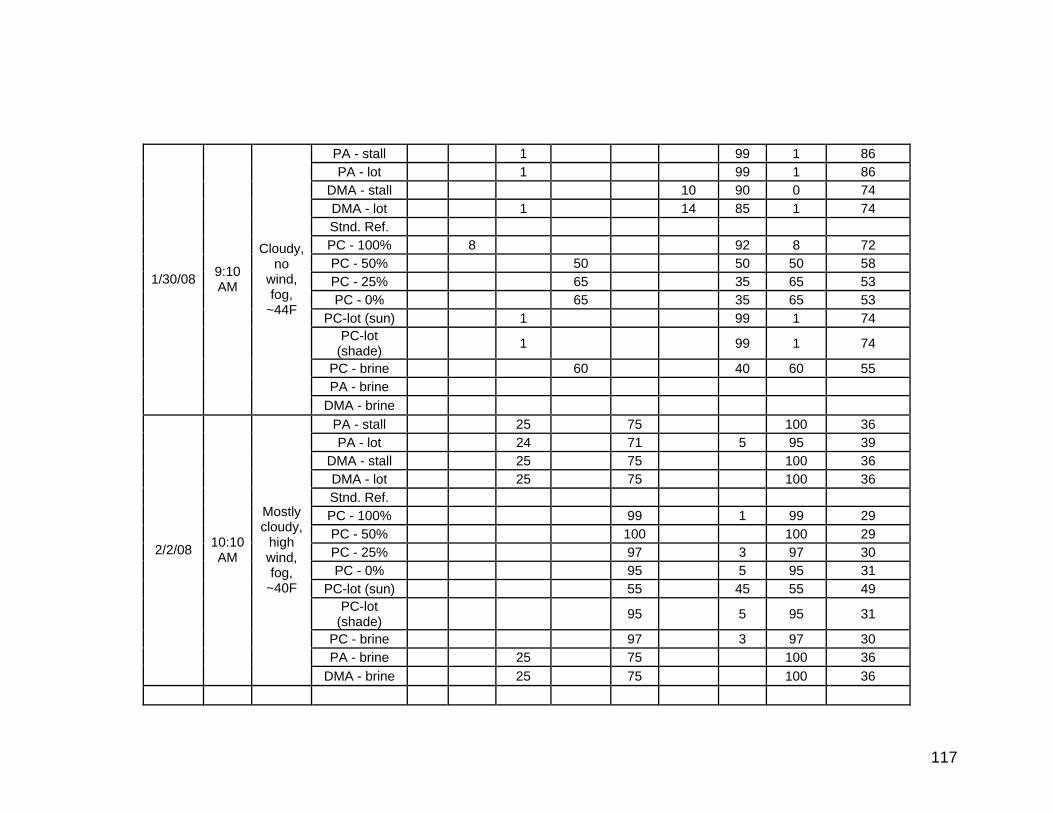
117
PA - stall 1 99 1 86 PA - lot 1 99 1 86
DMA - stall 10 90 0 74 DMA - lot 1 14 85 1 74 Stnd. Ref. PC - 100% 8 92 8 72 PC - 50% 50 50 50 58 PC - 25% 65 35 65 53 PC - 0% 65 35 65 53
PC-lot (sun) 1 99 1 74 PC-lot
(shade) 1 99 1 74
PC - brine 60 40 60 55 PA - brine
1/30/08 9:10 AM
Cloudy, no
wind, fog,
~44F
DMA - brine PA - stall 25 75 100 36 PA - lot 24 71 5 95 39
DMA - stall 25 75 100 36 DMA - lot 25 75 100 36 Stnd. Ref. PC - 100% 99 1 99 29 PC - 50% 100 100 29 PC - 25% 97 3 97 30 PC - 0% 95 5 95 31
PC-lot (sun) 55 45 55 49 PC-lot
(shade) 95 5 95 31
PC - brine 97 3 97 30 PA - brine 25 75 100 36
2/2/08 10:10 AM
Mostly cloudy,
high wind, fog,
~40F
DMA - brine 25 75 100 36
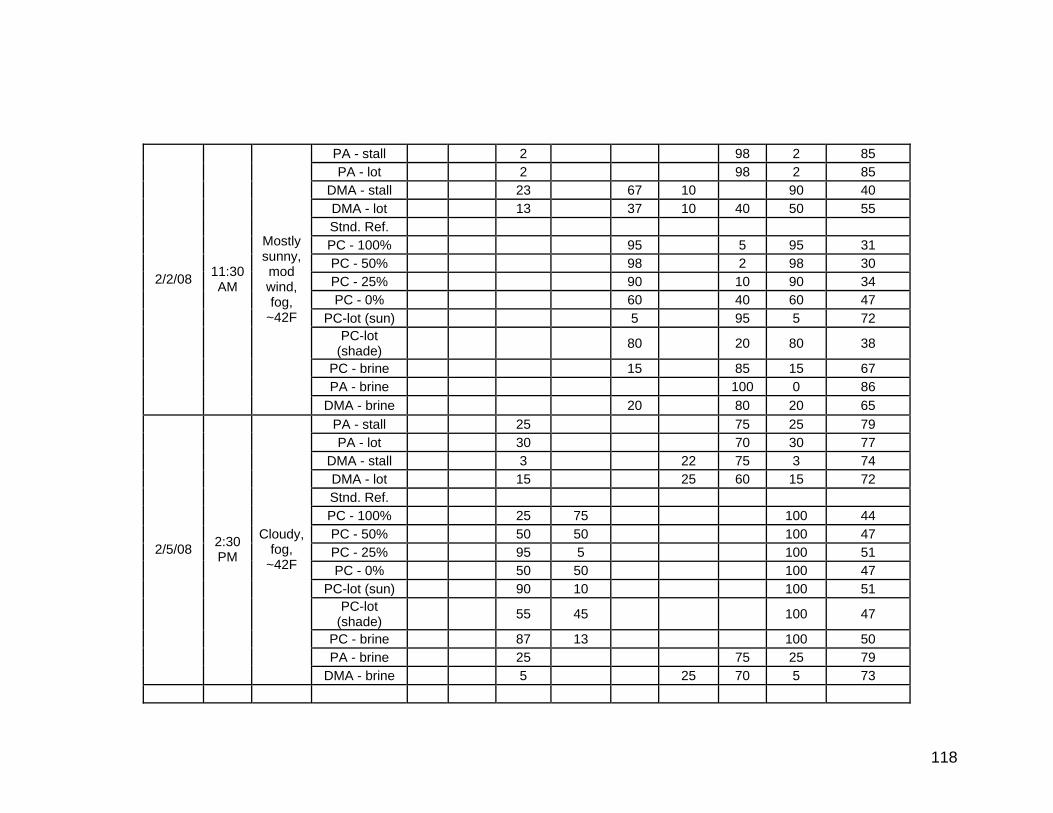
118
PA - stall 2 98 2 85 PA - lot 2 98 2 85
DMA - stall 23 67 10 90 40 DMA - lot 13 37 10 40 50 55 Stnd. Ref. PC - 100% 95 5 95 31 PC - 50% 98 2 98 30 PC - 25% 90 10 90 34 PC - 0% 60 40 60 47
PC-lot (sun) 5 95 5 72 PC-lot
(shade) 80 20 80 38
PC - brine 15 85 15 67 PA - brine 100 0 86
2/2/08 11:30 AM
Mostly sunny, mod wind, fog,
~42F
DMA - brine 20 80 20 65 PA - stall 25 75 25 79 PA - lot 30 70 30 77
DMA - stall 3 22 75 3 74 DMA - lot 15 25 60 15 72 Stnd. Ref. PC - 100% 25 75 100 44 PC - 50% 50 50 100 47 PC - 25% 95 5 100 51 PC - 0% 50 50 100 47
PC-lot (sun) 90 10 100 51 PC-lot
(shade) 55 45 100 47
PC - brine 87 13 100 50 PA - brine 25 75 25 79
2/5/08 2:30 PM
Cloudy, fog,
~42F
DMA - brine 5 25 70 5 73
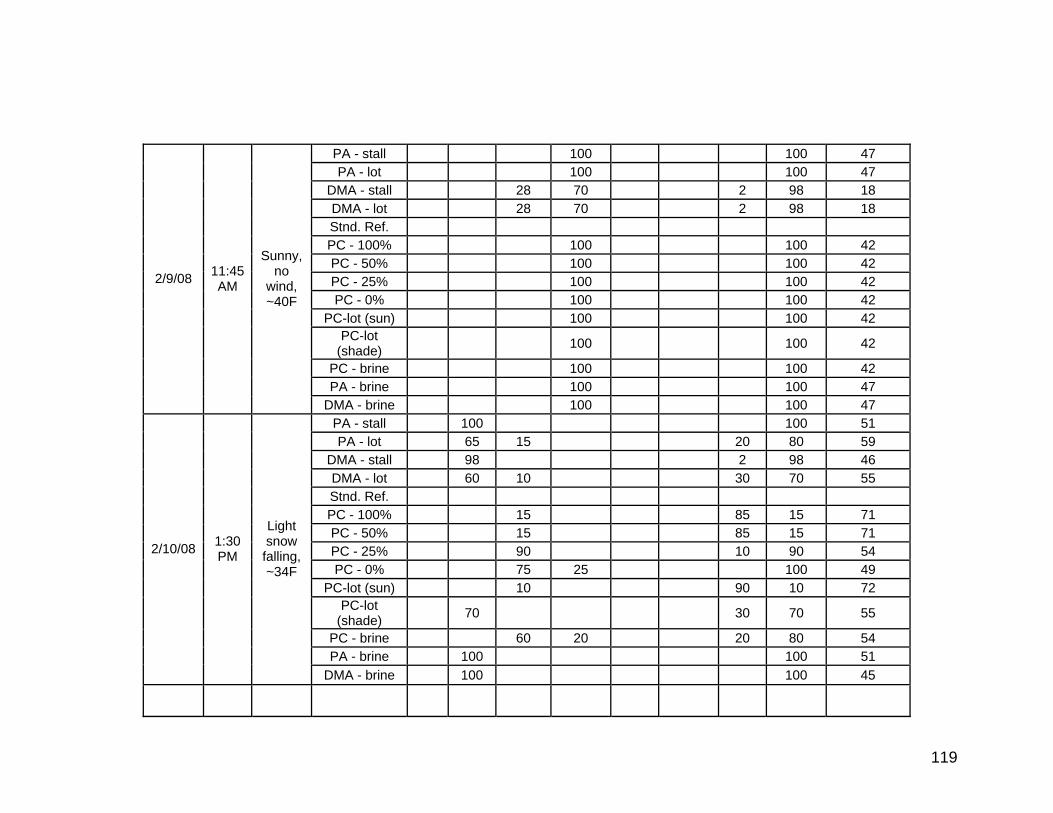
119
PA - stall 100 100 47 PA - lot 100 100 47
DMA - stall 28 70 2 98 18 DMA - lot 28 70 2 98 18 Stnd. Ref. PC - 100% 100 100 42 PC - 50% 100 100 42 PC - 25% 100 100 42 PC - 0% 100 100 42
PC-lot (sun) 100 100 42 PC-lot
(shade) 100 100 42
PC - brine 100 100 42 PA - brine 100 100 47
2/9/08 11:45 AM
Sunny, no
wind, ~40F
DMA - brine 100 100 47 PA - stall 100 100 51 PA - lot 65 15 20 80 59
DMA - stall 98 2 98 46 DMA - lot 60 10 30 70 55 Stnd. Ref. PC - 100% 15 85 15 71 PC - 50% 15 85 15 71 PC - 25% 90 10 90 54 PC - 0% 75 25 100 49
PC-lot (sun) 10 90 10 72 PC-lot
(shade) 70 30 70 55
PC - brine 60 20 20 80 54 PA - brine 100 100 51
2/10/08 1:30 PM
Light snow falling, ~34F
DMA - brine 100 100 45
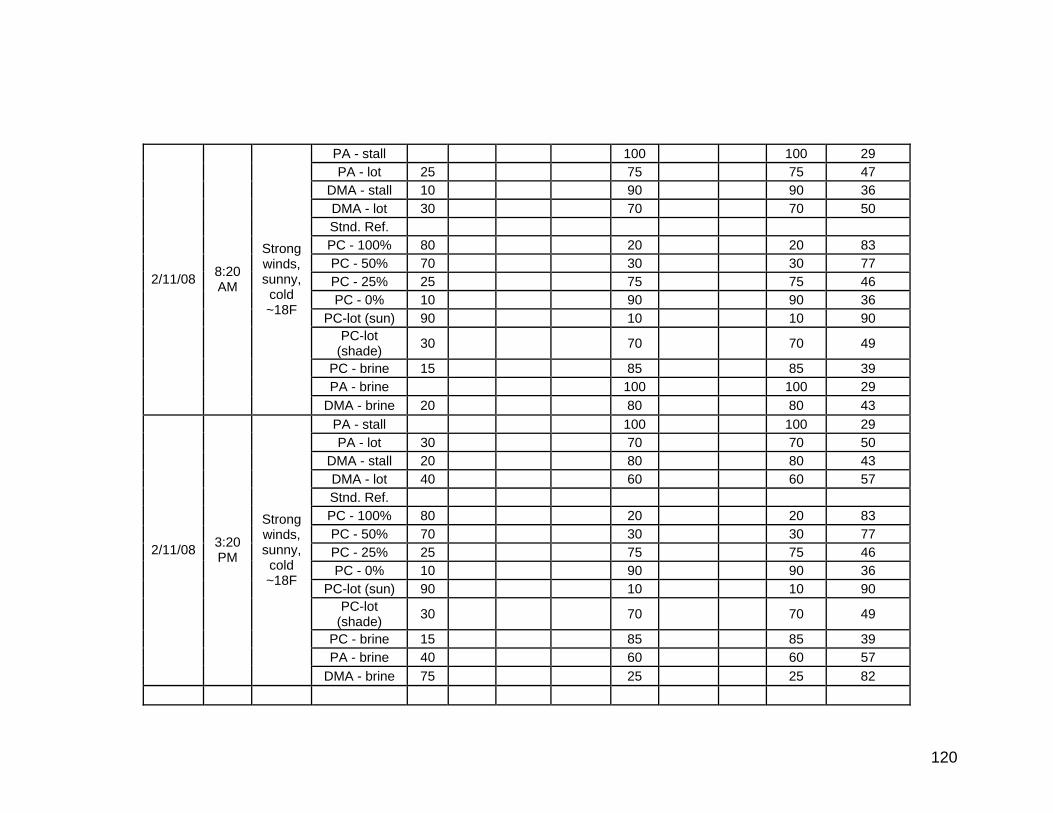
120
PA - stall 100 100 29 PA - lot 25 75 75 47
DMA - stall 10 90 90 36 DMA - lot 30 70 70 50 Stnd. Ref. PC - 100% 80 20 20 83 PC - 50% 70 30 30 77 PC - 25% 25 75 75 46 PC - 0% 10 90 90 36
PC-lot (sun) 90 10 10 90 PC-lot
(shade) 30 70 70 49
PC - brine 15 85 85 39 PA - brine 100 100 29
2/11/08 8:20 AM
Strong winds, sunny, cold ~18F
DMA - brine 20 80 80 43 PA - stall 100 100 29 PA - lot 30 70 70 50
DMA - stall 20 80 80 43 DMA - lot 40 60 60 57 Stnd. Ref. PC - 100% 80 20 20 83 PC - 50% 70 30 30 77 PC - 25% 25 75 75 46 PC - 0% 10 90 90 36
PC-lot (sun) 90 10 10 90 PC-lot
(shade) 30 70 70 49
PC - brine 15 85 85 39 PA - brine 40 60 60 57
2/11/08 3:20 PM
Strong winds, sunny, cold ~18F
DMA - brine 75 25 25 82

121
PA - stall PA - lot 45 45 10 45 67
DMA - stall 34 33 33 33 68 DMA - lot 70 15 15 15 85 Stnd. Ref. PC - 100% 70 5 25 5 88 PC - 50% 60 20 20 20 79 PC - 25% 25 75 75 46 PC - 0% 25 75 75 46
PC-lot (sun) 49 2 49 2 84 PC-lot
(shade) 46 8 46 8 81
PC - brine 40 20 40 20 74 PA - brine 30 40 30 40 67
2/12/08 2:30 PM
Cloudy, light
winds, ~24F
DMA - brine 90 5 5 5 95 PA - stall 10 30 60 40 66 PA - lot 25 50 25 75 50
DMA - stall 20 20 60 40 62 DMA - lot 25 25 50 50 59 Stnd. Ref. PC - 100% 55 40 5 95 44 PC - 50% 55 40 5 95 44 PC - 25% 45 50 5 95 41 PC - 0% 45 50 5 95 41
PC-lot (sun) PC-lot
(shade) 40 40 20 80 47
PC - brine 75 10 15 85 53
PA - brine see photos
2/13/08 3 PM
Heavy rain,
preceded by snow, ~36F
DMA - brine 15 15 70 30 65

122
PA - stall 70 20 10 20 84 PA - lot 40 30 30 30 75
DMA - stall 25 10 25 40 10 76 DMA - lot 45 25 15 15 25 74 Stnd. Ref. PC - 100% 5 10 85 10 71 PC - 50% 5 20 75 20 66 PC - 25% 5 50 45 50 53 PC - 0% 25 50 25 50 57
PC-lot (sun) 50 5 45 5 83 PC-lot
(shade) 10 50 40 50 54
PC - brine 30 20 50 20 72 PA - brine 100 100 51
2/14/08 1:15 PM
Sunny, mod
winds, ~34F
DMA - brine 55 5 15 25 5 85 PA - stall 93 2 5 2 98 PA - lot 90 5 5 5 97
DMA - stall 98 2 0 99 DMA - lot 80 5 15 5 94 Stnd. Ref. 50 50 0 74 PC - 100% 40 5 55 5 82 PC - 50% 55 5 40 5 86 PC - 25% 10 10 80 10 74 PC - 0% 35 5 20 40 25 74
PC-lot (sun) 85 5 10 5 92 PC-lot
(shade) 50 10 25 15 35 72
PC - brine 85 5 10 5 92 PA - brine 95 5 95 52
2/15/08 2:30 PM
Partly cloudy,
light winds, ~40F
DMA - brine 93 2 5 2 98
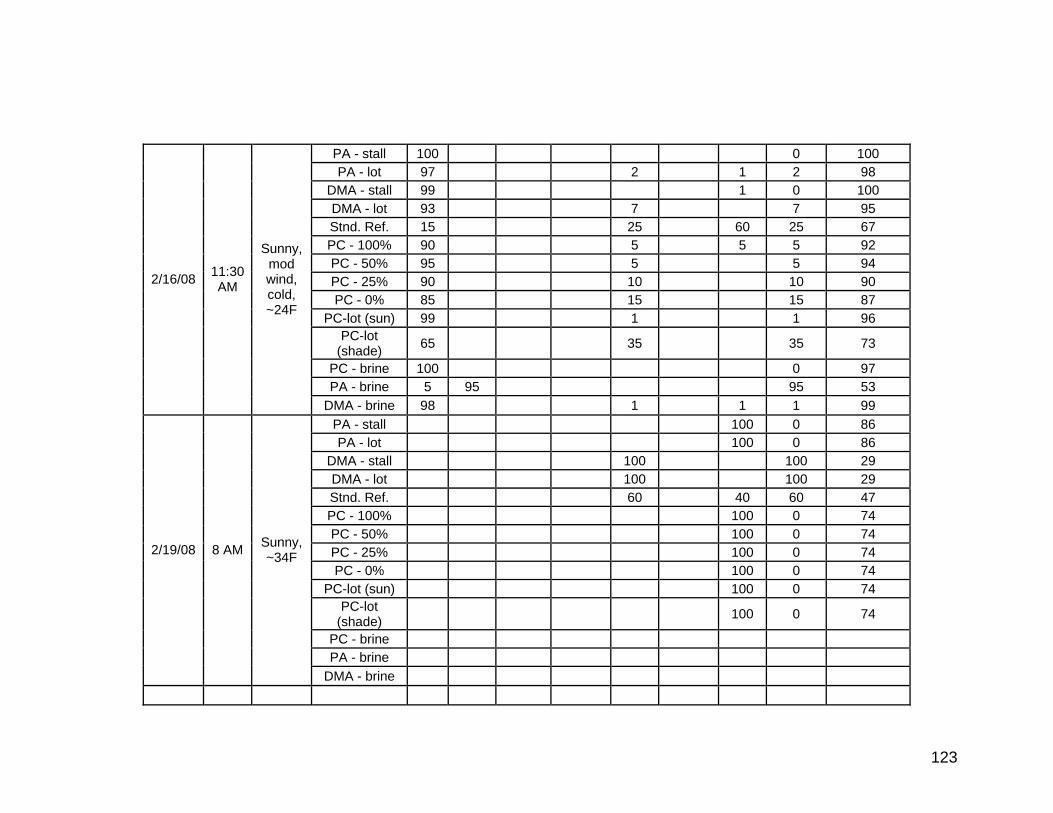
123
PA - stall 100 0 100 PA - lot 97 2 1 2 98
DMA - stall 99 1 0 100 DMA - lot 93 7 7 95 Stnd. Ref. 15 25 60 25 67 PC - 100% 90 5 5 5 92 PC - 50% 95 5 5 94 PC - 25% 90 10 10 90 PC - 0% 85 15 15 87
PC-lot (sun) 99 1 1 96 PC-lot
(shade) 65 35 35 73
PC - brine 100 0 97 PA - brine 5 95 95 53
2/16/08 11:30 AM
Sunny, mod wind, cold, ~24F
DMA - brine 98 1 1 1 99 PA - stall 100 0 86 PA - lot 100 0 86
DMA - stall 100 100 29 DMA - lot 100 100 29 Stnd. Ref. 60 40 60 47 PC - 100% 100 0 74 PC - 50% 100 0 74 PC - 25% 100 0 74 PC - 0% 100 0 74
PC-lot (sun) 100 0 74 PC-lot
(shade) 100 0 74
PC - brine PA - brine
2/19/08 8 AM Sunny, ~34F
DMA - brine

124
PA - stall 50 50 50 72 PA - lot 30 10 60 40 73
DMA - stall 10 60 30 10 72 DMA - lot 20 40 40 20 71 Stnd. Ref. PC - 100% 25 75 25 67 PC - 50% 50 25 25 75 55 PC - 25% 85 5 10 90 50 PC - 0% 95 5 95 49
PC-lot (sun) 25 75 25 68 PC-lot
(shade) 25 75 25 68
PC - brine 85 10 5 95 49 PA - brine 5 95 5 85
2/23/08 12:30 PM
Partly cloudy,
no wind ~36F
DMA - brine 10 1 9 80 1 76 PA - stall 60 40 0 94 PA - lot 40 15 45 15 87
DMA - stall 70 30 0 92 DMA - lot 60 10 20 0 82 Stnd. Ref. PC - 100% 50 20 15 15 35 75 PC - 50% 15 10 75 85 50 PC - 25% 2 2 93 3 95 44 PC - 0% 3 95 2 95 44
PC-lot (sun) 30 10 60 10 78 PC-lot
(shade) 30 10 60 10 78
PC - brine 2 2 93 3 95 44 PA - brine 90 10 0 99
2/24/08 10:00 AM
Sunny, no
wind ~40F
DMA - brine 100 0 100
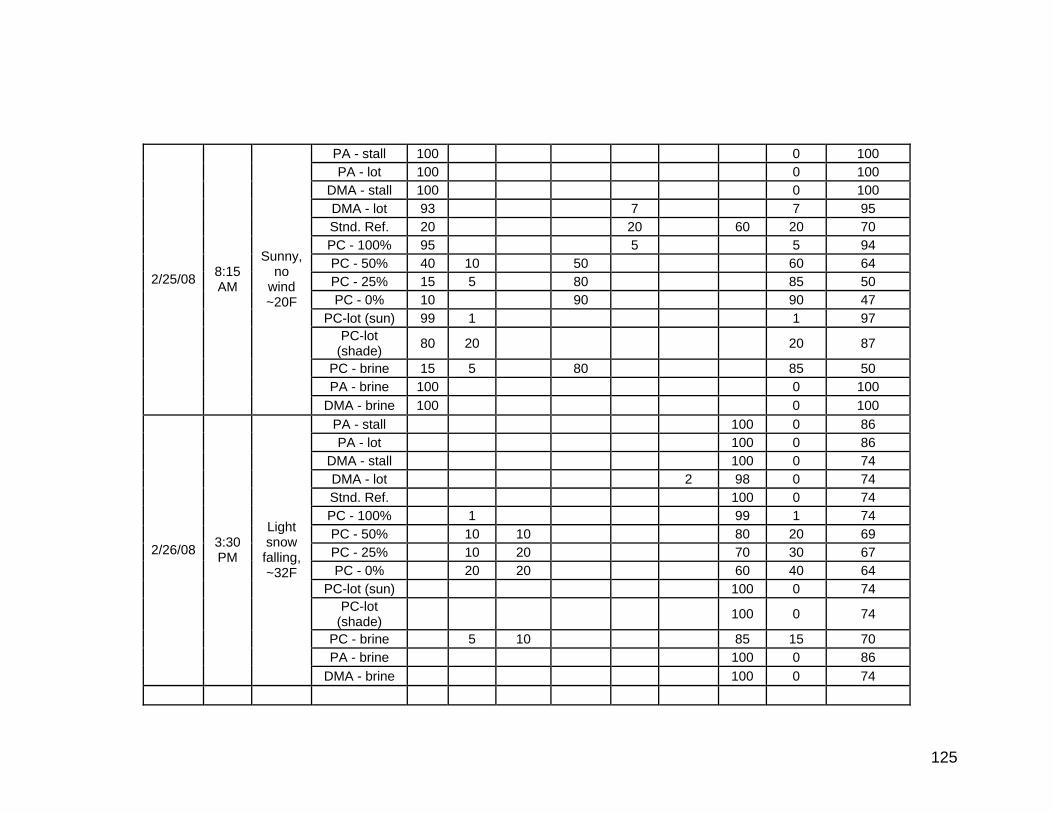
125
PA - stall 100 0 100 PA - lot 100 0 100
DMA - stall 100 0 100 DMA - lot 93 7 7 95 Stnd. Ref. 20 20 60 20 70 PC - 100% 95 5 5 94 PC - 50% 40 10 50 60 64 PC - 25% 15 5 80 85 50 PC - 0% 10 90 90 47
PC-lot (sun) 99 1 1 97 PC-lot
(shade) 80 20 20 87
PC - brine 15 5 80 85 50 PA - brine 100 0 100
2/25/08 8:15 AM
Sunny, no
wind ~20F
DMA - brine 100 0 100 PA - stall 100 0 86 PA - lot 100 0 86
DMA - stall 100 0 74 DMA - lot 2 98 0 74 Stnd. Ref. 100 0 74 PC - 100% 1 99 1 74 PC - 50% 10 10 80 20 69 PC - 25% 10 20 70 30 67 PC - 0% 20 20 60 40 64
PC-lot (sun) 100 0 74 PC-lot
(shade) 100 0 74
PC - brine 5 10 85 15 70 PA - brine 100 0 86
2/26/08 3:30 PM
Light snow falling, ~32F
DMA - brine 100 0 74
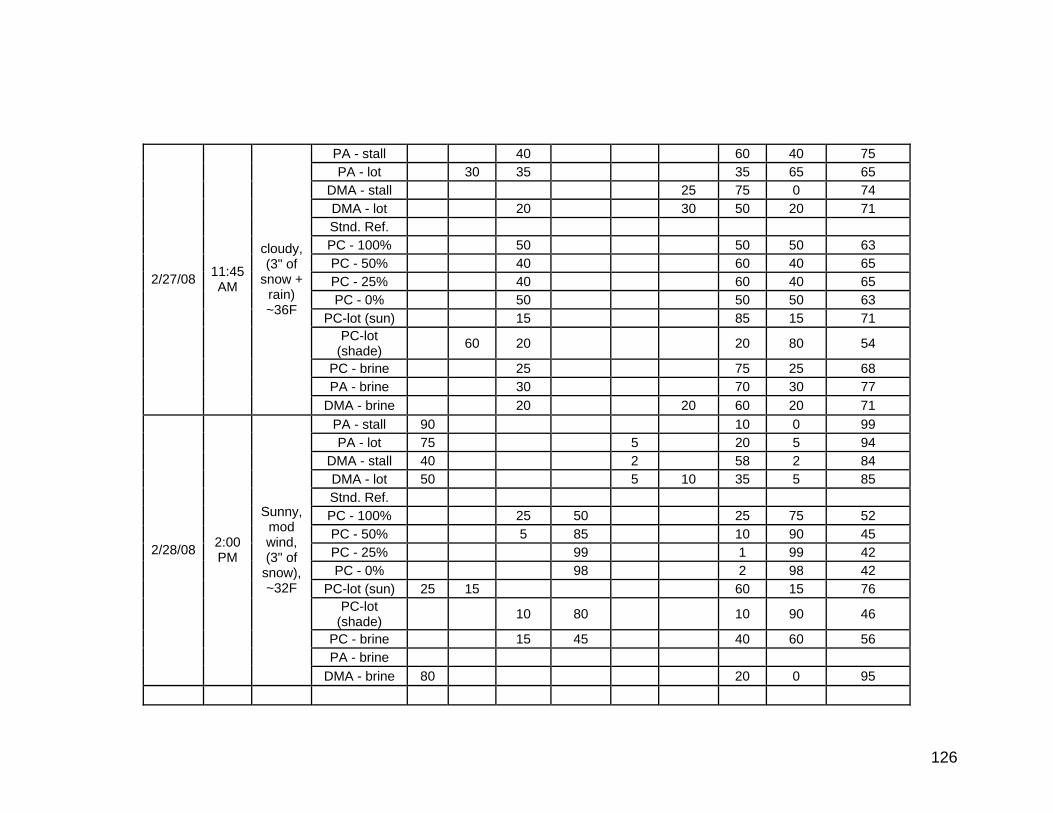
126
PA - stall 40 60 40 75 PA - lot 30 35 35 65 65
DMA - stall 25 75 0 74 DMA - lot 20 30 50 20 71 Stnd. Ref. PC - 100% 50 50 50 63 PC - 50% 40 60 40 65 PC - 25% 40 60 40 65 PC - 0% 50 50 50 63
PC-lot (sun) 15 85 15 71 PC-lot
(shade) 60 20 20 80 54
PC - brine 25 75 25 68 PA - brine 30 70 30 77
2/27/08 11:45 AM
cloudy, (3" of
snow + rain) ~36F
DMA - brine 20 20 60 20 71 PA - stall 90 10 0 99 PA - lot 75 5 20 5 94
DMA - stall 40 2 58 2 84 DMA - lot 50 5 10 35 5 85 Stnd. Ref. PC - 100% 25 50 25 75 52 PC - 50% 5 85 10 90 45 PC - 25% 99 1 99 42 PC - 0% 98 2 98 42
PC-lot (sun) 25 15 60 15 76 PC-lot
(shade) 10 80 10 90 46
PC - brine 15 45 40 60 56 PA - brine
2/28/08 2:00 PM
Sunny, mod wind, (3" of
snow), ~32F
DMA - brine 80 20 0 95
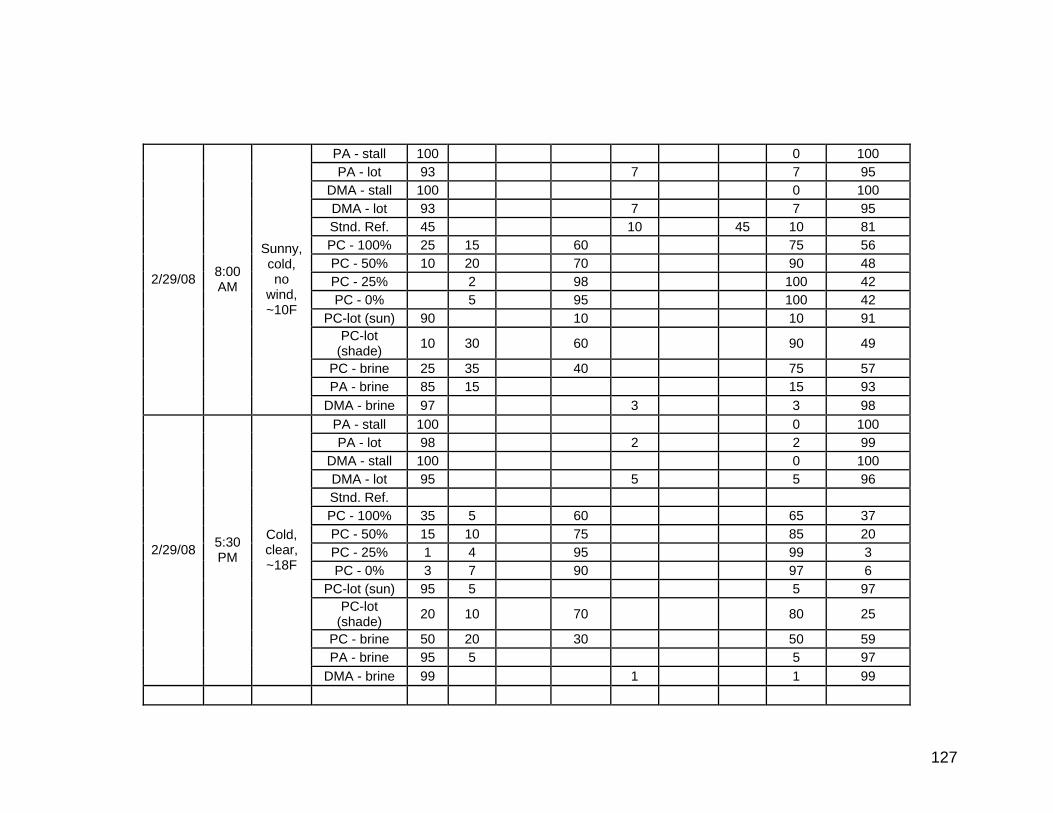
127
PA - stall 100 0 100 PA - lot 93 7 7 95
DMA - stall 100 0 100 DMA - lot 93 7 7 95 Stnd. Ref. 45 10 45 10 81 PC - 100% 25 15 60 75 56 PC - 50% 10 20 70 90 48 PC - 25% 2 98 100 42 PC - 0% 5 95 100 42
PC-lot (sun) 90 10 10 91 PC-lot
(shade) 10 30 60 90 49
PC - brine 25 35 40 75 57 PA - brine 85 15 15 93
2/29/08 8:00 AM
Sunny, cold, no
wind, ~10F
DMA - brine 97 3 3 98 PA - stall 100 0 100 PA - lot 98 2 2 99
DMA - stall 100 0 100 DMA - lot 95 5 5 96 Stnd. Ref. PC - 100% 35 5 60 65 37 PC - 50% 15 10 75 85 20 PC - 25% 1 4 95 99 3 PC - 0% 3 7 90 97 6
PC-lot (sun) 95 5 5 97 PC-lot
(shade) 20 10 70 80 25
PC - brine 50 20 30 50 59 PA - brine 95 5 5 97
2/29/08 5:30 PM
Cold, clear, ~18F
DMA - brine 99 1 1 99
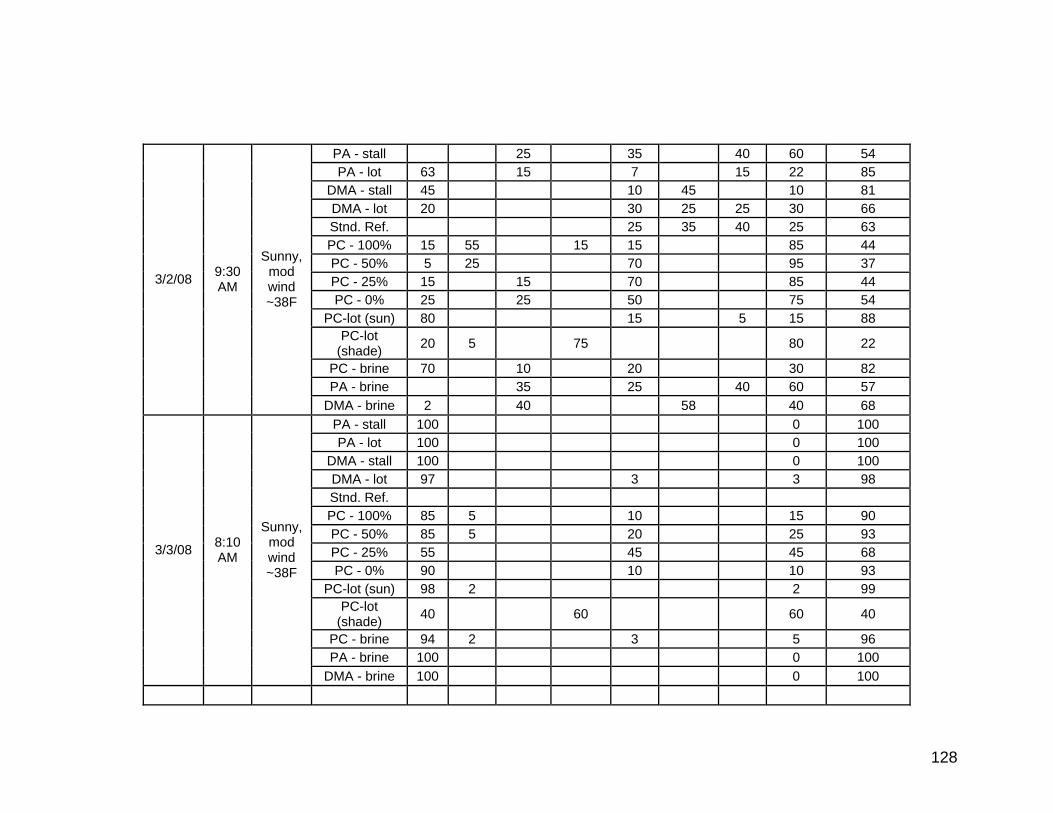
128
PA - stall 25 35 40 60 54 PA - lot 63 15 7 15 22 85
DMA - stall 45 10 45 10 81 DMA - lot 20 30 25 25 30 66 Stnd. Ref. 25 35 40 25 63 PC - 100% 15 55 15 15 85 44 PC - 50% 5 25 70 95 37 PC - 25% 15 15 70 85 44 PC - 0% 25 25 50 75 54
PC-lot (sun) 80 15 5 15 88 PC-lot
(shade) 20 5 75 80 22
PC - brine 70 10 20 30 82 PA - brine 35 25 40 60 57
3/2/08 9:30 AM
Sunny, mod wind ~38F
DMA - brine 2 40 58 40 68 PA - stall 100 0 100 PA - lot 100 0 100
DMA - stall 100 0 100 DMA - lot 97 3 3 98 Stnd. Ref. PC - 100% 85 5 10 15 90 PC - 50% 85 5 20 25 93 PC - 25% 55 45 45 68 PC - 0% 90 10 10 93
PC-lot (sun) 98 2 2 99 PC-lot
(shade) 40 60 60 40
PC - brine 94 2 3 5 96 PA - brine 100 0 100
3/3/08 8:10 AM
Sunny, mod wind ~38F
DMA - brine 100 0 100
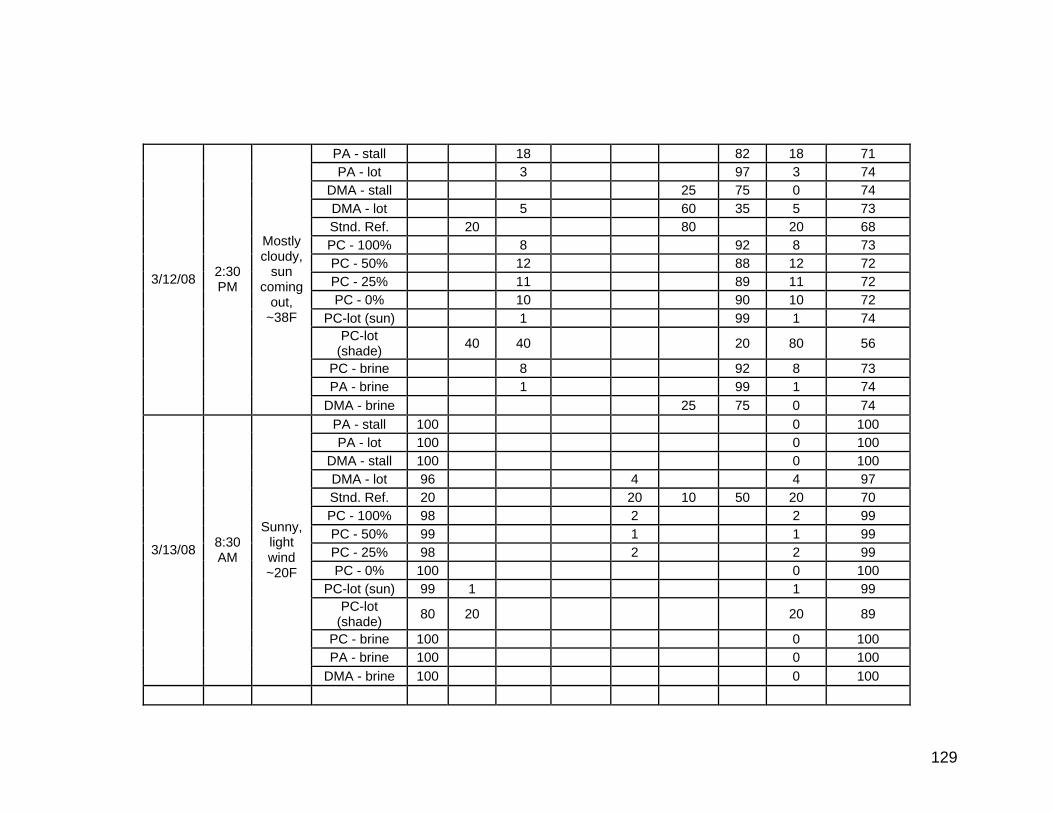
129
PA - stall 18 82 18 71 PA - lot 3 97 3 74
DMA - stall 25 75 0 74 DMA - lot 5 60 35 5 73 Stnd. Ref. 20 80 20 68 PC - 100% 8 92 8 73 PC - 50% 12 88 12 72 PC - 25% 11 89 11 72 PC - 0% 10 90 10 72
PC-lot (sun) 1 99 1 74 PC-lot
(shade) 40 40 20 80 56
PC - brine 8 92 8 73 PA - brine 1 99 1 74
3/12/08 2:30 PM
Mostly cloudy,
sun coming
out, ~38F
DMA - brine 25 75 0 74 PA - stall 100 0 100 PA - lot 100 0 100
DMA - stall 100 0 100 DMA - lot 96 4 4 97 Stnd. Ref. 20 20 10 50 20 70 PC - 100% 98 2 2 99 PC - 50% 99 1 1 99 PC - 25% 98 2 2 99 PC - 0% 100 0 100
PC-lot (sun) 99 1 1 99 PC-lot
(shade) 80 20 20 89
PC - brine 100 0 100 PA - brine 100 0 100
3/13/08 8:30 AM
Sunny, light wind ~20F
DMA - brine 100 0 100
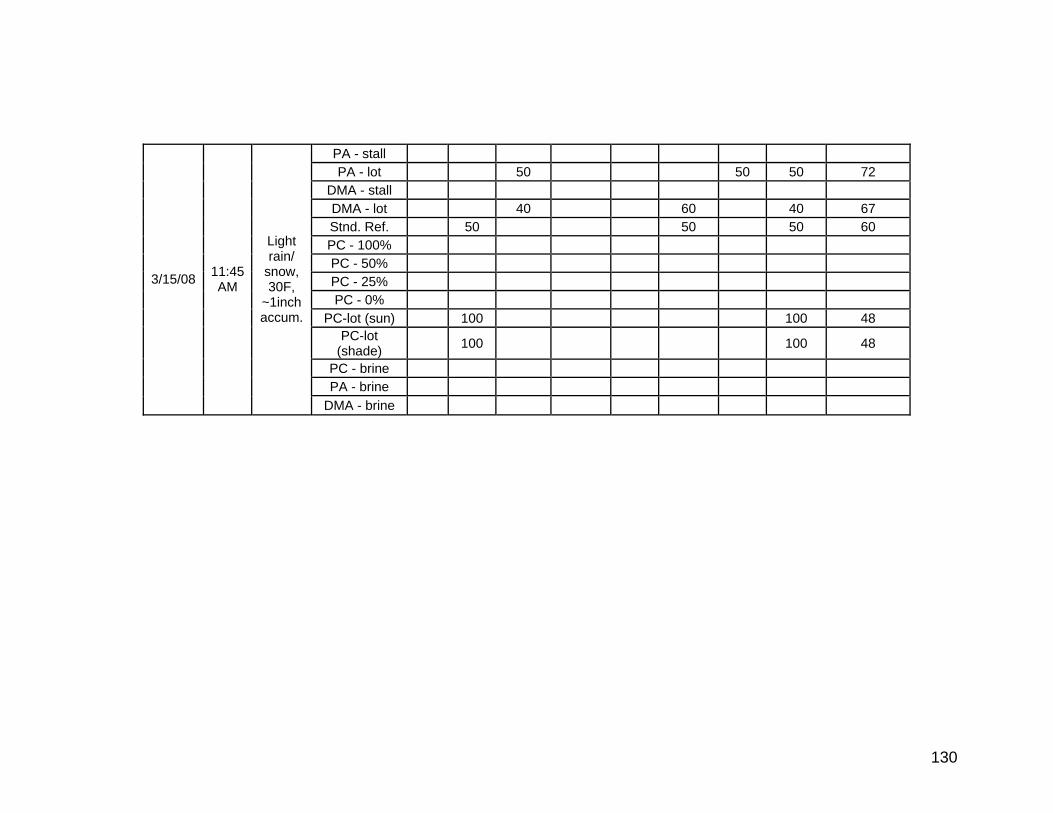
130
PA - stall PA - lot 50 50 50 72
DMA - stall DMA - lot 40 60 40 67 Stnd. Ref. 50 50 50 60 PC - 100% PC - 50% PC - 25% PC - 0%
PC-lot (sun) 100 100 48 PC-lot
(shade) 100 100 48
PC - brine PA - brine
3/15/08 11:45 AM
Light rain/
snow, 30F,
~1inch accum.
DMA - brine
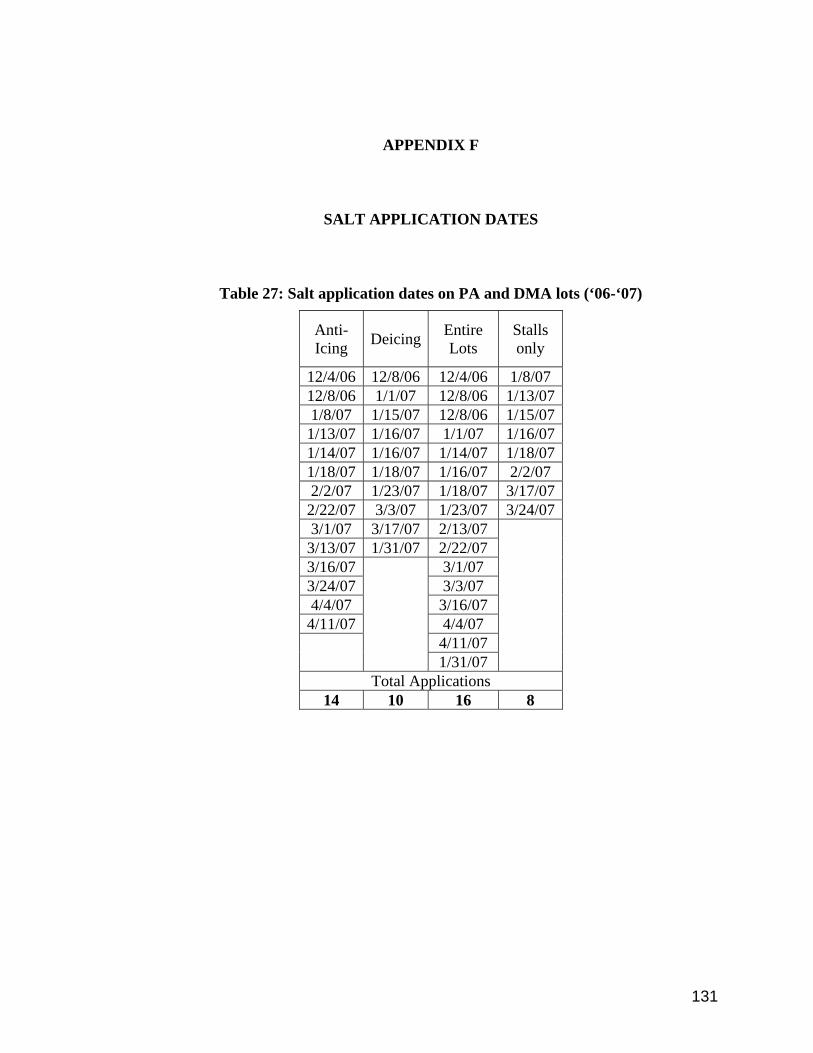
131
APPENDIX F
SALT APPLICATION DATES
Table 27: Salt application dates on PA and DMA lots (‘06-‘07)
Anti-Icing Deicing Entire
Lots Stalls only
12/4/06 12/8/06 12/4/06 1/8/07 12/8/06 1/1/07 12/8/06 1/13/071/8/07 1/15/07 12/8/06 1/15/07
1/13/07 1/16/07 1/1/07 1/16/071/14/07 1/16/07 1/14/07 1/18/071/18/07 1/18/07 1/16/07 2/2/07 2/2/07 1/23/07 1/18/07 3/17/07
2/22/07 3/3/07 1/23/07 3/24/073/1/07 3/17/07 2/13/07
3/13/07 1/31/07 2/22/07 3/16/07 3/1/07 3/24/07 3/3/07 4/4/07 3/16/07
4/11/07 4/4/07 4/11/07
1/31/07
Total Applications 14 10 16 8
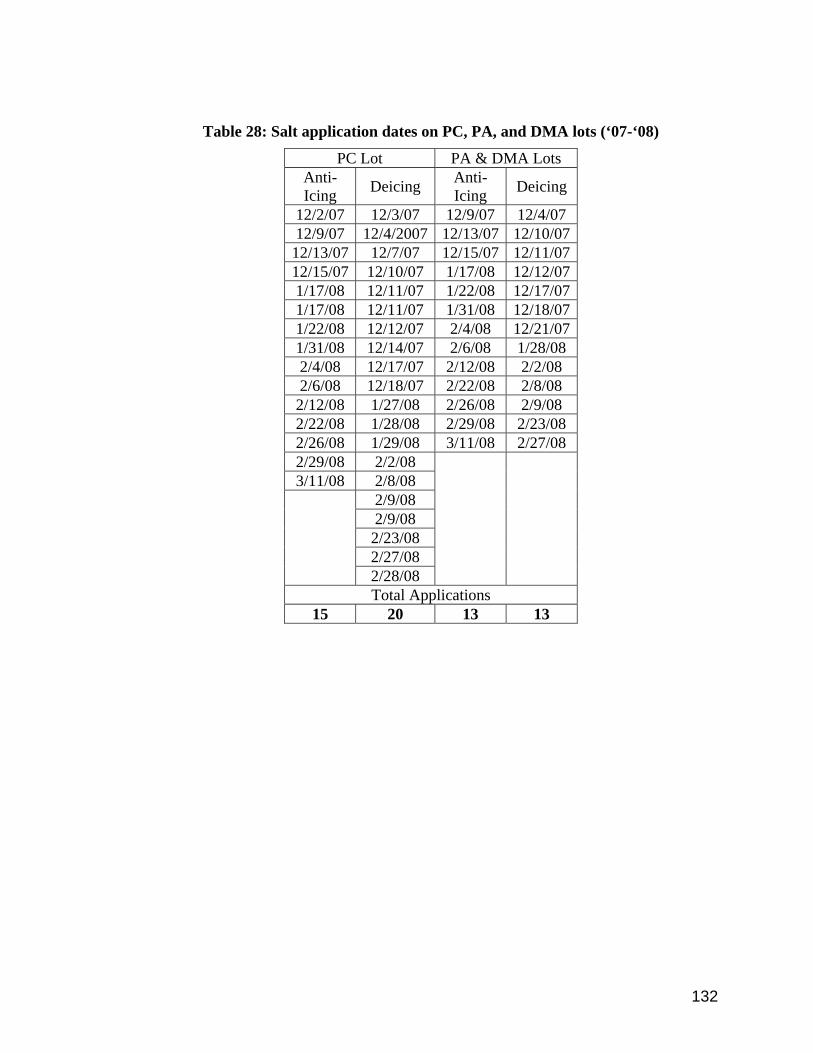
132
Table 28: Salt application dates on PC, PA, and DMA lots (‘07-‘08)
PC Lot PA & DMA Lots Anti-Icing Deicing Anti-
Icing Deicing
12/2/07 12/3/07 12/9/07 12/4/07 12/9/07 12/4/2007 12/13/07 12/10/07
12/13/07 12/7/07 12/15/07 12/11/0712/15/07 12/10/07 1/17/08 12/12/071/17/08 12/11/07 1/22/08 12/17/071/17/08 12/11/07 1/31/08 12/18/071/22/08 12/12/07 2/4/08 12/21/071/31/08 12/14/07 2/6/08 1/28/08 2/4/08 12/17/07 2/12/08 2/2/08 2/6/08 12/18/07 2/22/08 2/8/08
2/12/08 1/27/08 2/26/08 2/9/08 2/22/08 1/28/08 2/29/08 2/23/08 2/26/08 1/29/08 3/11/08 2/27/08 2/29/08 2/2/08 3/11/08 2/8/08
2/9/08 2/9/08
2/23/08 2/27/08
2/28/08
Total Applications 15 20 13 13
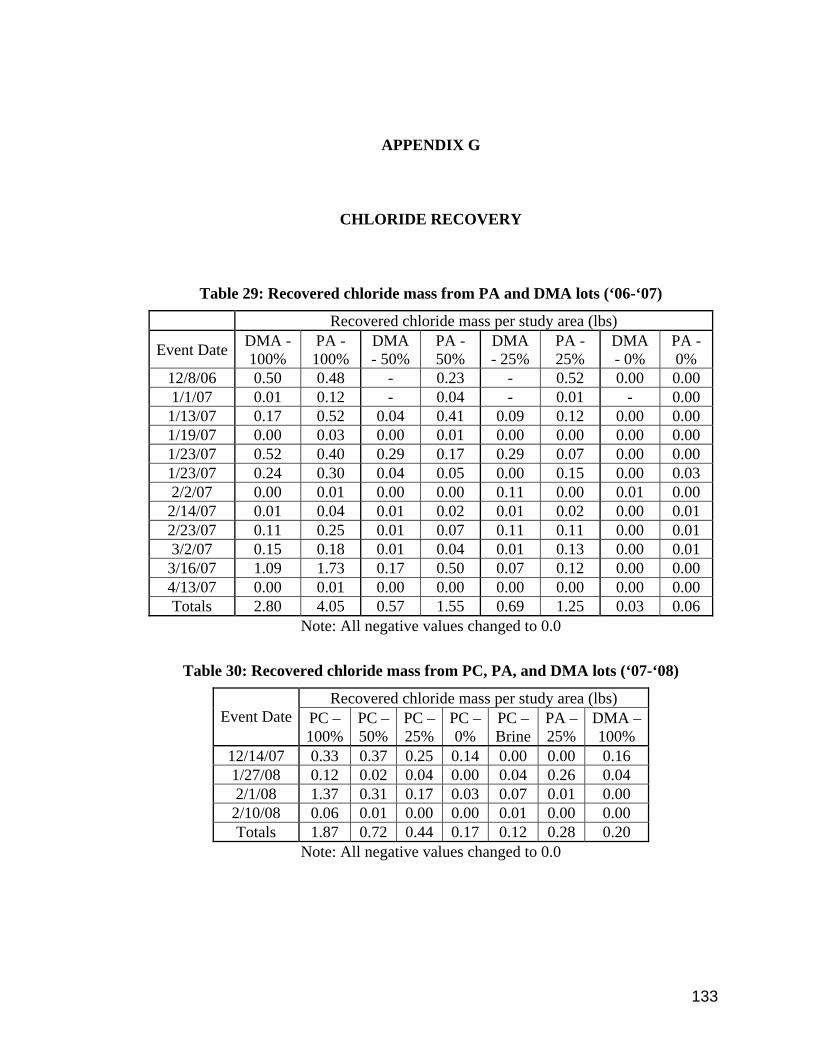
133
APPENDIX G
CHLORIDE RECOVERY
Table 29: Recovered chloride mass from PA and DMA lots (‘06-‘07)
Recovered chloride mass per study area (lbs)
Event Date DMA - 100%
PA - 100%
DMA - 50%
PA - 50%
DMA - 25%
PA - 25%
DMA - 0%
PA - 0%
12/8/06 0.50 0.48 - 0.23 - 0.52 0.00 0.00 1/1/07 0.01 0.12 - 0.04 - 0.01 - 0.00
1/13/07 0.17 0.52 0.04 0.41 0.09 0.12 0.00 0.00 1/19/07 0.00 0.03 0.00 0.01 0.00 0.00 0.00 0.00 1/23/07 0.52 0.40 0.29 0.17 0.29 0.07 0.00 0.00 1/23/07 0.24 0.30 0.04 0.05 0.00 0.15 0.00 0.03 2/2/07 0.00 0.01 0.00 0.00 0.11 0.00 0.01 0.00
2/14/07 0.01 0.04 0.01 0.02 0.01 0.02 0.00 0.01 2/23/07 0.11 0.25 0.01 0.07 0.11 0.11 0.00 0.01 3/2/07 0.15 0.18 0.01 0.04 0.01 0.13 0.00 0.01
3/16/07 1.09 1.73 0.17 0.50 0.07 0.12 0.00 0.00 4/13/07 0.00 0.01 0.00 0.00 0.00 0.00 0.00 0.00 Totals 2.80 4.05 0.57 1.55 0.69 1.25 0.03 0.06
Note: All negative values changed to 0.0
Table 30: Recovered chloride mass from PC, PA, and DMA lots (‘07-‘08)
Recovered chloride mass per study area (lbs) Event Date PC –
100%PC – 50%
PC – 25%
PC – 0%
PC – Brine
PA – 25%
DMA – 100%
12/14/07 0.33 0.37 0.25 0.14 0.00 0.00 0.16 1/27/08 0.12 0.02 0.04 0.00 0.04 0.26 0.04 2/1/08 1.37 0.31 0.17 0.03 0.07 0.01 0.00
2/10/08 0.06 0.01 0.00 0.00 0.01 0.00 0.00 Totals 1.87 0.72 0.44 0.17 0.12 0.28 0.20
Note: All negative values changed to 0.0