surface infiltration rate of permeable pavements · surface infiltration rate of permeable...
TRANSCRIPT
Bean, E., W.F. Hunt III and D. Bidelspach. 2005. "Surface Infiltration Rate of Permeable Pavements." Journal of Water Management Modeling R223-22. doi: 10.14796/JWMM.R223-22.© CHI 2005 www.chijournal.org ISSN: 2292-6062 (Formerly in Effective Modeling of Urban Water Systems. ISBN: 0-9736716-0-2)
451
22 Surface Infiltration Rate of Permeable
Pavements
E. Z. Bean, W. F. Hunt, and D. A. Bidelspach
Asphalt surfaces have greatly increased the amount of pollutant-carrying runoff entering surface waters. To counteract this, permeable pavement can be installed to allow water to infiltrate, thus reducing runoff and acting as a filter. This study tested the surface infiltration rate of 27 permeable pavement sites in North Carolina, Maryland and Delaware. One of these sites in North Carolina was monitored to compare pollutant loads of asphalt runoff to those in infiltrate. Concrete grid pavers (CGP) and permeable interlocking concrete pavers (PICP) were tested with pavement ages ranging from six months to 20 years. Two infiltration tests were run on 14 CGP lots filled with sand. The initial test was on the existing condition of the surface and second test was run after the removal of the top layer of residue (1.3 - 1.9 cm) to simulate maintenance. Maintenance improved the infiltration rate on 13 of 14 sites. Analysis of the data showed that maintenance improves surface permeability at a confidence level of 99.8%. The median average infiltration rate increased from 5.0 cm/h, for existing conditions, to 8.0 cm/h after maintenance. Eleven PICP sites were also tested. Sites built in close proximity to loose fine particles had infiltration rates significantly less than sites free of loose fines. Averages of each condition are 60 cm/h and 2000 cm/h respectively. Even the minimum existing infiltration rates were comparable to those of a grassed sandy loam soil. Water quality data included in this study shows the results of six storms from June to October, 2003. With only a few storms to compare,
Surface infiltration rate of permeable pavements 452
only Zinc has been identified as having a statistically significant difference between infiltrate and runoff.
22.1 Introduction
Permeable pavement is an alternative to traditional asphalt and concrete surfaces. Permeable pavement allows stormwater to infiltrate into either a storage basin below or exfiltrate to the soil and ultimately recharge the water table, while also potentially removing pollutants (EPA, 1999). Urbanization has a detrimental effect on our surface waters systems. Increased runoff rates from paved surfaces have increased peak flow through stream channels causing erosion and stream bank instability along with overland erosion (Leopold et al., 1964). Runoff from parking lots also carries pollutants, such as sediments, nutrients, and heavy metals, into surface waters. In an effort to reduce these effects of urbanization, many municipalities in North Carolina established regulations that limit the amount of impervious surface a property can have (Bennett, 2003). Permeable pavement is a potential solution; in lieu of 100% impermeable lots, perhaps a fraction of runoff can be reduced and pollutants be removed. As a result, the use of permeable pavement is poised to grow.
North Carolina has implemented a stormwater credit system for developed sites to manage onsite runoff. Several best management practices (BMPs) were given credits for pollutant reduction, sediment reduction, and peak flow detention. Permeable pavement has not been included in BMPs receiving credit because they may clog. However, North Carolina has not altogether prevented the use of permeable pavement. Permeable pavement is allowed to be used as a BMP under the “innovative BMP” classification. Innovative BMPs however must be monitored on an individual basis to assess their performance (Bennett, 2003). Few landowners have been willing to assume the cost of this required monitoring, thus limiting the number of permeable pavement installations.
Recent studies have found positive results using permeable pavement with respect to both runoff reduction and water quality improvement. The use of permeable pavement, instead of traditional asphalt has been shown to decrease surface runoff and lower peak discharge significantly (Pratt 1995; Booth, 1996; Hunt et al., 2001). Permeable pavement has also been shown to act as a filter of such pollutants as lead and automotive oil (Brattebo and Booth, 2003; Pratt, 1995).
Surface infiltration rate of permeable pavements 453
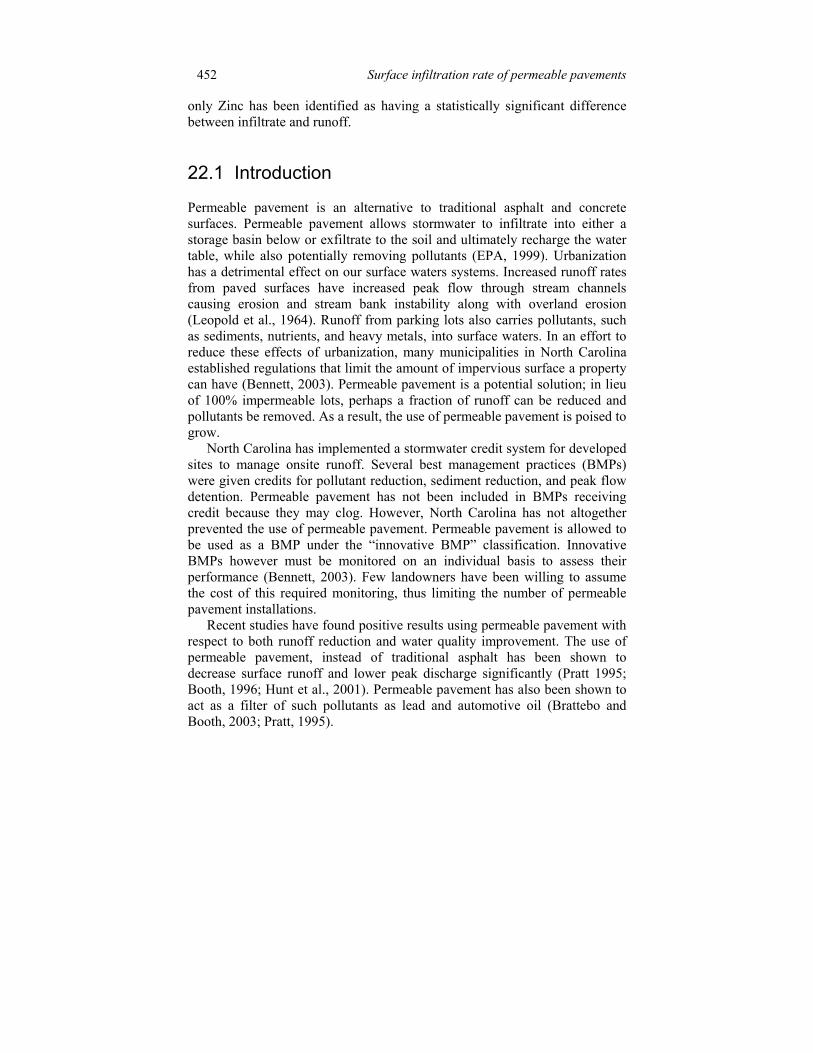
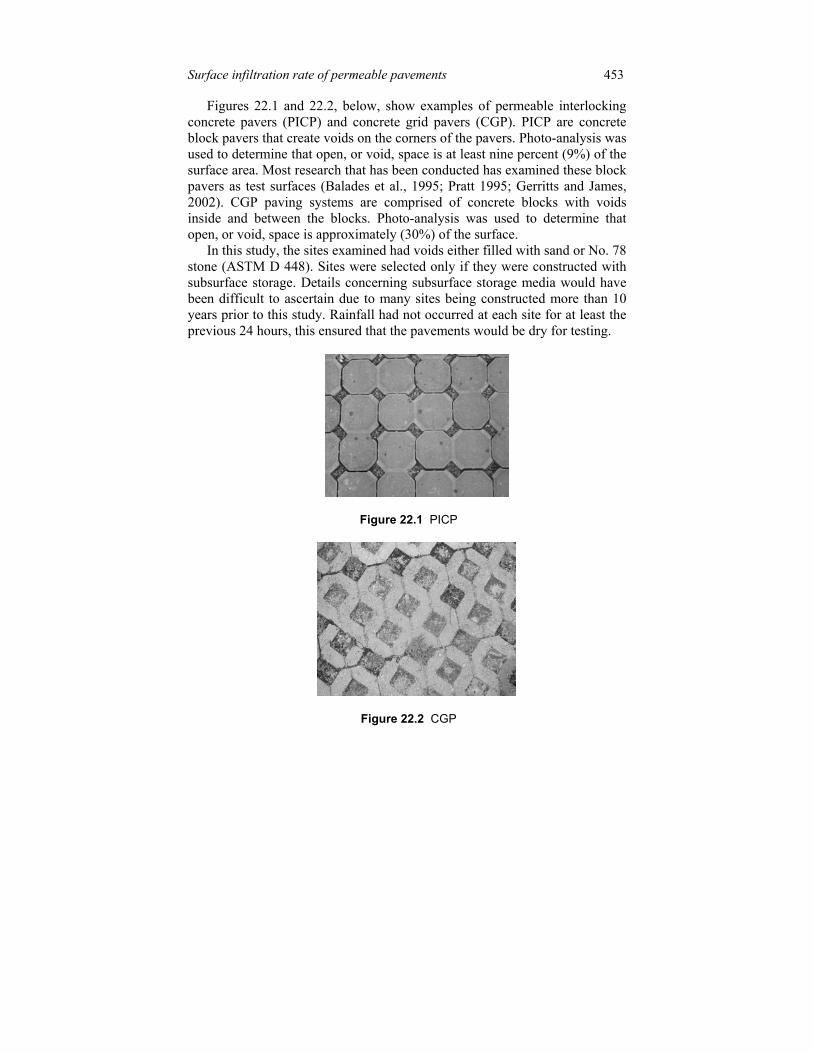
Figures 22.1 and 22.2, below, show examples of permeable interlocking concrete pavers (PICP) and concrete grid pavers (CGP). PICP are concrete block pavers that create voids on the corners of the pavers. Photo-analysis was used to determine that open, or void, space is at least nine percent (9%) of the surface area. Most research that has been conducted has examined these block pavers as test surfaces (Balades et al., 1995; Pratt 1995; Gerritts and James, 2002). CGP paving systems are comprised of concrete blocks with voids inside and between the blocks. Photo-analysis was used to determine that open, or void, space is approximately (30%) of the surface.
In this study, the sites examined had voids either filled with sand or No. 78 stone (ASTM D 448). Sites were selected only if they were constructed with subsurface storage. Details concerning subsurface storage media would have been difficult to ascertain due to many sites being constructed more than 10 years prior to this study. Rainfall had not occurred at each site for at least the previous 24 hours, this ensured that the pavements would be dry for testing.
Figure 22.1 PICP
Figure 22.2 CGP
Surface infiltration rate of permeable pavements 454
Pratt (1995) has found that clogging can be a result of fine particles accumulating in void spaces of permeable pavements. Smaller particles trap larger particles, therefore the rate of clogging increases as more fines are trapped (Balades et al., 1995). However, clogging can be limited by regular maintenance, either by vacuum sweeper or high pressure washing (Balades et al., 1995). Removing the top 15 - 20 mm (0.6 - 0.8 in.) of void space material for low to medium traffic areas substantially regenerates infiltration capacity. Permeable pavements in higher traffic areas improve somewhat when 20 - 25 mm (0.8 - 1 in.) of material is removed (Gerritts and James, 2002). Gerritts and James compared infiltration rates before and after removal of void space material, using a removal depth of between 10 - 20 mm (0.5 – 0.8 in.).
The goals of this study were as follows: (i) determine surface infiltration rates of each pavement system; (ii) compare and evaluate these rates for the pavement systems; (iii) analyze the impact maintenance has on revitalizing surface infiltration rates; (iv) monitor pollutant levels of infiltrate compared to asphalt runoff; (v) offer basic siting guidelines based upon these results. It is important to note that the focus of this study was to determine site surface infiltration rates, which is not an equivalent to the hydraulic conductivity or total infiltration rate of the sites.
22.2 Procedure
22.2.1 Infiltration Measurements
Sixteen CGP and 11 PICP sites were tested in this study to determine infiltration rates. Double- or single-ring infiltrometers were used at each site to measure surface infiltration rates. Two sets of tests were run at 14 of the 16 CGP sites, one set to measure existing conditions, and one set to measure “maintained” conditions.
Each set of tests included three infiltration tests to help counteract variability in the surface conditions and infiltration rates. Locations for these tests were representative of the entire surface.
This study used ASTM D 3385, is the Standard Test Method for Infiltration Rate in Field Soils Using Double-Ring Infiltrometer, as a basis to measure infiltration rates. This test measures infiltration rates for soils with a hydraulic conductivity between 100-60 mm/s to 100-20 mm/s. The test used during this study modified some of the methods and materials in ASTM D
Surface infiltration rate of permeable pavements 455
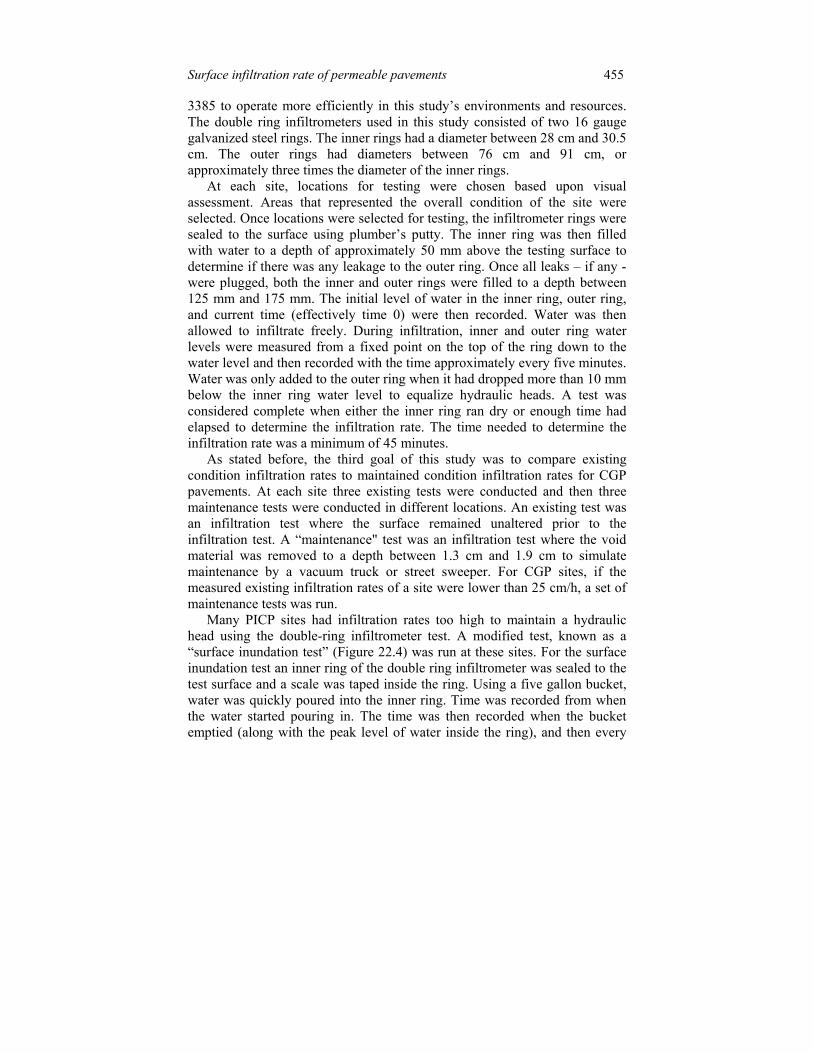
3385 to operate more efficiently in this study’s environments and resources. The double ring infiltrometers used in this study consisted of two 16 gauge galvanized steel rings. The inner rings had a diameter between 28 cm and 30.5 cm. The outer rings had diameters between 76 cm and 91 cm, or approximately three times the diameter of the inner rings.
At each site, locations for testing were chosen based upon visual assessment. Areas that represented the overall condition of the site were selected. Once locations were selected for testing, the infiltrometer rings were sealed to the surface using plumber’s putty. The inner ring was then filled with water to a depth of approximately 50 mm above the testing surface to determine if there was any leakage to the outer ring. Once all leaks – if any - were plugged, both the inner and outer rings were filled to a depth between 125 mm and 175 mm. The initial level of water in the inner ring, outer ring, and current time (effectively time 0) were then recorded. Water was then allowed to infiltrate freely. During infiltration, inner and outer ring water levels were measured from a fixed point on the top of the ring down to the water level and then recorded with the time approximately every five minutes. Water was only added to the outer ring when it had dropped more than 10 mm below the inner ring water level to equalize hydraulic heads. A test was considered complete when either the inner ring ran dry or enough time had elapsed to determine the infiltration rate. The time needed to determine the infiltration rate was a minimum of 45 minutes.
As stated before, the third goal of this study was to compare existing condition infiltration rates to maintained condition infiltration rates for CGP pavements. At each site three existing tests were conducted and then three maintenance tests were conducted in different locations. An existing test was an infiltration test where the surface remained unaltered prior to the infiltration test. A “maintenance" test was an infiltration test where the void material was removed to a depth between 1.3 cm and 1.9 cm to simulate maintenance by a vacuum truck or street sweeper. For CGP sites, if the measured existing infiltration rates of a site were lower than 25 cm/h, a set of maintenance tests was run.
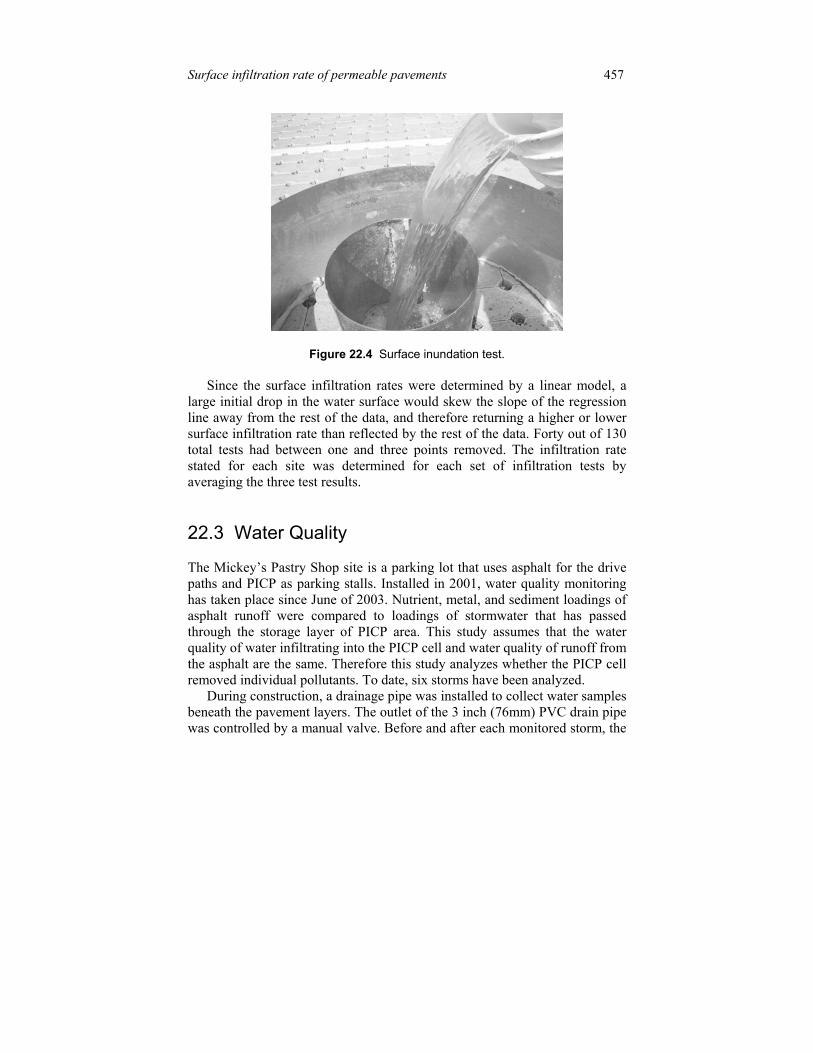
Many PICP sites had infiltration rates too high to maintain a hydraulic head using the double-ring infiltrometer test. A modified test, known as a “surface inundation test” (Figure 22.4) was run at these sites. For the surface inundation test an inner ring of the double ring infiltrometer was sealed to the test surface and a scale was taped inside the ring. Using a five gallon bucket, water was quickly poured into the inner ring. Time was recorded from when the water started pouring in. The time was then recorded when the bucket emptied (along with the peak level of water inside the ring), and then every

Surface infiltration rate of permeable pavements 456
30-60 seconds until the ring emptied. If the ring emptied in less than 30 seconds, then the time that the ring emptied was recorded. This test is neither as accurate nor as precise as the double-ring-infiltrometer test. However, this was a means of obtaining a rough estimate of the surface infiltration rate.
After the data were collected, the water levels were plotted as functions of time for each test. A linear regression model was determined to be the most representative of the data, with R2 values for almost all sites being over 0.99, only four tests being lower than 0.90, and none lower than 0.80. Hydraulic conductivities are typically functions of the corresponding hydraulic head. However, due to the extreme surface infiltration rates, hydraulic head did not seem to affect the infiltration rates, which was evident by the high R2 values using linear regression. The slope of the least squares line for each test was determined to be the surface infiltration rate of the permeable surface. For some tests, the first, second, and/or third data points were removed if they skewed the surface infiltration rate.
Figure 22.3 Double-ring-infiltrometer tests.
Surface infiltration rate of permeable pavements 457
Figure 22.4 Surface inundation test.
Since the surface infiltration rates were determined by a linear model, a large initial drop in the water surface would skew the slope of the regression line away from the rest of the data, and therefore returning a higher or lower surface infiltration rate than reflected by the rest of the data. Forty out of 130 total tests had between one and three points removed. The infiltration rate stated for each site was determined for each set of infiltration tests by averaging the three test results.
22.3 Water Quality
The Mickey’s Pastry Shop site is a parking lot that uses asphalt for the drive paths and PICP as parking stalls. Installed in 2001, water quality monitoring has taken place since June of 2003. Nutrient, metal, and sediment loadings of asphalt runoff were compared to loadings of stormwater that has passed through the storage layer of PICP area. This study assumes that the water quality of water infiltrating into the PICP cell and water quality of runoff from the asphalt are the same. Therefore this study analyzes whether the PICP cell removed individual pollutants. To date, six storms have been analyzed.
During construction, a drainage pipe was installed to collect water samples beneath the pavement layers. The outlet of the 3 inch (76mm) PVC drain pipe was controlled by a manual valve. Before and after each monitored storm, the
Surface infiltration rate of permeable pavements 458
pipe valve was opened to drain the storage basin. Collection was done the day following a rain event. Collection was taken after opening the valve and allowing enough water to drain so that water was coming from the subsurface storage basin. Flushing typically lasted between 10 and 15 s and ensured that the sample collected was from the storage basin and not only from the drain pipe.
Runoff was collected using an ISCO 67 sampler. A trough was installed at the edge of an asphalt drive. The sampler pulled samples from this trough ever 20 minutes into a single collection jar. These samples were also collected the day after a rainfall event. The jar was emptied after each rain event to ensure that only one rain storm is being analyzed.
Both samples were analyzed by Tri-Test of Raleigh, NC. Samples were analyzed for concentrations of: total phosphorus (TP), total suspended solids (TSS), total Kjeldahl nitrogen (TKN), nitrate-nitrite (NOX-N), total nitrogen (TN), copper (Cu), and Zinc (Zn).
22.4 Results
22.4.1 Concrete Grid Pavers
Infiltration rates were measured from 16 sites with CGP. Figure 22.5 is a graphic showing the infiltration rates of the lots tested throughout North Carolina. Of these, 14 sites were “maintained”, and had their maintenance infiltration rate measured. (The “existing” or “unmaintained” and “maintained” were defined earlier in the Procedure section.) Of the two sites that did not have maintenance performed, the measured infiltration rate at one site was greater than 250 mm/h, Kinston TS, and the other had an existing infiltration of 100 mm/h, Wynn Plaza. The site with the lowest surface infiltration rate, Town of Cary Public Works (10 mm/h), could be the result of a combination of factors (i.e. no maintenance and frequent heavy traffic). This site also was constructed in a clay soil area and clays can be more easily transported and deposited in voids, causing clogging. However, since the surrounding area is relatively undisturbed, clay particles being deposited on the surface is most likely not a significant factor.
Of the sites that had maintenance testing, 13 had noticeably higher infiltration rates than the “unmaintained” pavers. The only site that did not increase its infiltration rate was Blackman Beach Access. This anomaly was potentially due to a high infiltration rate of 222 mm/h for one of the existing

Surface infiltration rate of permeable pavements 459
tests, while all other tests, existing and maintained, had infiltration rates less than 100 mm/h . The mean and median average existing surface infiltration rates, where both rates were recorded, were 71 mm/h and 50 mm/h respectively; the mean and median average maintained surface infiltration rate was 118 mm/h and 80 mm/h, respectively. Comparing means, shows that maintaining the lots increased the permeability by 66%.
Concrete Grid Pavers (CGP)
05
101520253035
Kin
ston
CG
P
Mun
icip
alB
ldg. G
ull
Con
ch
Bai
nbrid
ge
Bla
ckm
an
Car
rabb
a's
Ind.
Bea
ch
Site
Infil
tratio
n R
ate
(cm
/hr)
Existing Maintained5
Figure 22.5 Infiltration rates measured from CGP sites.
22.4.1 Permeable Interlocking Concrete Pavers
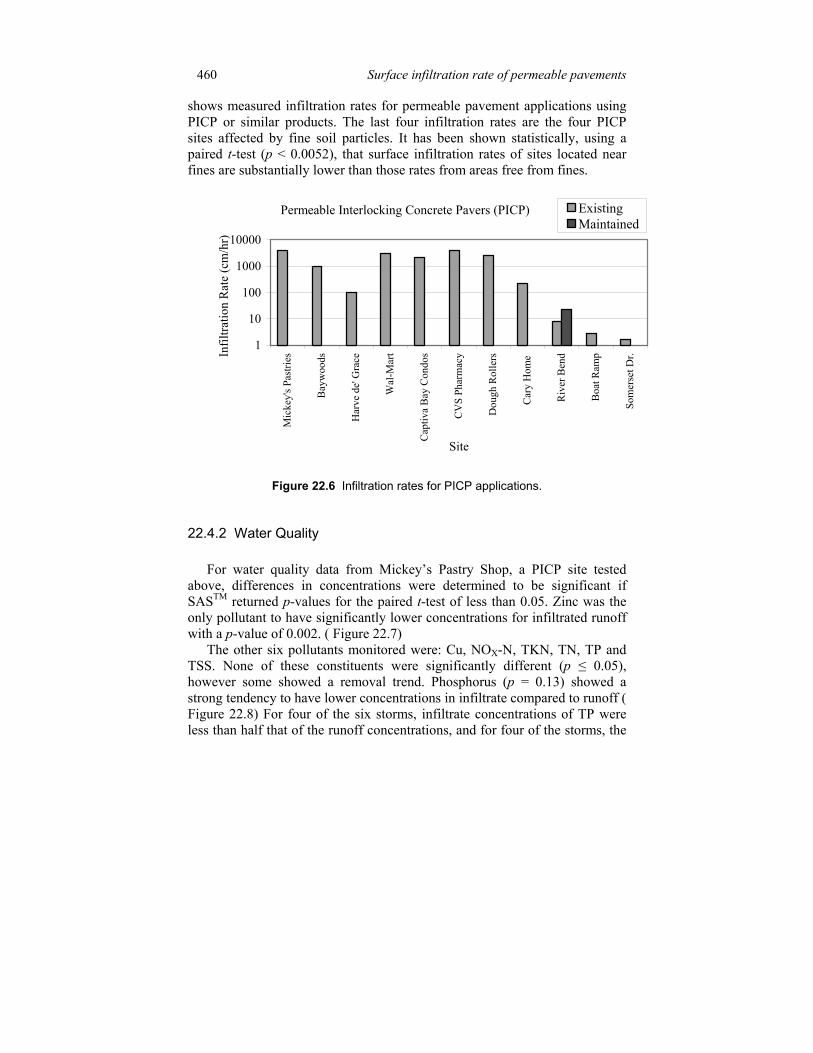
Eleven PICP sites were tested; seven in Maryland, three in North Carolina and one in Delaware. Six of these sites were tested using only the surface inundation test, due to their high infiltration rates (>150 cm/h) Havre de Grace maintained a hydraulic head just enough to fill the double-ring-infiltrometers for testing, but had an average infiltration rate average of 100 cm/h . One of the three tests ran at the Penny Rd. site was a surface inundation test, however the other two were a double-ring-infiltrometer tests. The three remaining PICP sites had surface infiltration rates low enough to maintain a hydraulic head so that standard double-ring infiltrometer tests were able to be performed. The four sites which used double-ring-infiltrometer tests were located in close proximity to areas containing exposed fine soil particles, e.g. gravel drive, a river bed, a beach and a construction site. Figure 22.6
Surface infiltration rate of permeable pavements 460
shows measured infiltration rates for permeable pavement applications using PICP or similar products. The last four infiltration rates are the four PICP sites affected by fine soil particles. It has been shown statistically, using a paired t-test (p < 0.0052), that surface infiltration rates of sites located near fines are substantially lower than those rates from areas free from fines.
Permeable Interlocking Concrete Pavers (PICP)
1
10
100
1000
10000
Mic
key'
s Pas
tries
Bay
woo
ds
Har
ve d
e' G
race
Wal
-Mar
t
Cap
tiva
Bay
Con
dos
CV
S Ph
arm
acy
Dou
gh R
olle
rs
Car
y H
ome
Riv
er B
end
Boa
t Ram
p
Som
erse
t Dr.
Site
Infil
tratio
n R
ate
(cm
/hr)
ExistingMaintained
Figure 22.6 Infiltration rates for PICP applications.
22.4.2 Water Quality
For water quality data from Mickey’s Pastry Shop, a PICP site tested above, differences in concentrations were determined to be significant if SASTM returned p-values for the paired t-test of less than 0.05. Zinc was the only pollutant to have significantly lower concentrations for infiltrated runoff with a p-value of 0.002. ( Figure 22.7)
The other six pollutants monitored were: Cu, NOX-N, TKN, TN, TP and TSS. None of these constituents were significantly different (p ≤ 0.05), however some showed a removal trend. Phosphorus (p = 0.13) showed a strong tendency to have lower concentrations in infiltrate compared to runoff ( Figure 22.8) For four of the six storms, infiltrate concentrations of TP were less than half that of the runoff concentrations, and for four of the storms, the

Surface infiltration rate of permeable pavements 461
infiltrate TP concentration was less than the minimum detectable value (0.05 mg/L).
Zinc by ICP/MS-Water
0
0.02
0.04
0.06
0.08
0.1
0.12
Jun 11 Jul 24 Aug 15 Sept 19 Sept 23 Oct 9 Feb 4 Feb 13Storm
mg/
L
InfiltrateRunoff
Figure 22.7 Zinc concentrations in runoff and infiltrate from six storms.
Copper data (p = 0.18) shows that for storms 1, 2, and 6, concentrations in runoff and infiltrate were relatively equal. However for storms 3, 4, and 5, infiltrate has lower concentrations of copper than the runoff. It should be noted that for storms two through six, the infiltrate concentrations of copper were less than the minimal detectable value (0.01 mg/L). There were essentially no trends for TSS, TN and TKN, while there may have been an increasing trend for NOX-N when comparing runoff from asphalt to the infiltrate. With more storms and data to compare, it will become more certain how well these pollutants, along with Zinc, are removed.
22.5 Analysis and Key Conclusions
There are several observations that can be drawn from this study. The first is that parking lot maintenance is a key to sustaining higher infiltration rates on pavements comprised of CGP, filled with sand. Thirteen of 14 sites had increased infiltration rates after removal of the top layer (1.3 cm typical depth) of accumulated void space material.

Surface infiltration rate of permeable pavements 462
Total Phosphorus
0
0.2
0.4
0.6
0.8
1
1.2
Jun 11 Jul 24 Aug 15 Sept 19 Sept 23 Oct 9 Feb 4 Feb 13Storm
mg/
L
InfiltrateRunoff
Figure 22.8 Phosphorus concentrations in runoff and infiltrate from six storms.
Without maintenance the median average infiltration rate was 50 mm/h, while with maintenance the median infiltration rate was 8.0 cm/h . A SASTM (2003) analysis showed that there was a statistically significant difference between existing and maintained infiltration rates to a 99.8% confidence. It can be stated with high confidence that maintenance significantly improved infiltration rates for the CGP sites with sand in this study.
Infiltration rates of PICP filled with gravel are not limited by their surface infiltration capacity provided they are sited in areas free of soil disturbances. The average PICP infiltration rate was 2000 cm/h, while the PICP sites near disturbed soils with fines was 610 mm/h, a decrease of almost 97%. A SASTM (2003) test was run to determine if there was a significant difference between the infiltration rates of PICP near fines and free of fines. The analysis showed a significant difference in surface infiltration rates at a confidence level of 99.5%. PICP sites free of fines have significantly higher infiltration rates than PICP sites with sandy fines present in this study.
Lastly, each site tested, with the exception of three (Somerset Drive, Hargrove, and Town of Cary Public Works) had infiltration rates greater than 25 mm/h . These rates are equal to or greater than infiltration rates expected for grassed sandy loam. Surface clogging in predominantly coarse grain soil

Surface infiltration rate of permeable pavements 463
environments, therefore, does not cause permeable pavements to have surface infiltration rates reduced below some naturally grassed areas.
As a result of this study, suggested siting and maintenance guidelines are as follows:
For CGP sites filled with sand:
Maintenance, using a vacuum sweeper, should be performed on at least a yearly basis. Removing the top 13 mm of material accumulated within void spaces has been significantly shown to improve infiltration rates. Sand should then be backfilled into the void spaces to prevent sealing at a lower depth.
For PICP sites:
PICP lots installed for infiltration purposes should not be sited adjacent to areas with free fine particles. Fine particles have been shown to severely decrease infiltration rates.
After six storms, water quality analysis from Mickey’s Pastry Shop in Goldsboro, NC, shows that the site had significantly lower concentrations of Zinc in infiltrate as compared to the asphalt runoff. With more storms, this may also be shown with pollutants such as Cu, TSS, TP and TKN. With only six events measured, these pollutants show trends of lower concentrations for infiltrate than runoff.
To conclude, there are several states, including North Carolina, which do not credit permeable pavement with reducing runoff. In regions with coarse grain soil (sandy soils) data from this study suggest that permeable pavement could be counted as truly permeable. Of 27 pavements tested only three sites had infiltration rates less than 1 in/h, including the one site tested in a fine grain soil (clay soil) environment. Evidence suggests that, provided the following conditions are met, permeable pavements do reduce runoff to a significant extent: (i) it is sited in a sandy or loamy sand soil, (ii) it is located in soils without seasonally high water tables, (iii) it is well-maintained, (iv) it is constructed with proper materials and techniques, (v) it is essentially flat and away from disturbed clay soils, and (vi) it does not have overburdening structural loads.
Acknowledgments
Several agencies and people have aided this research in many different ways. Thanks go to the Interlocking Concrete Pavement Institute, the North Carolina

Surface infiltration rate of permeable pavements 464
Department of Environmental Health and Natural Resources, which administers the EPA 319(h) grants, helped fund this study. The contributions of Brandon Eckrote, Lucas Sharkey, and L. T. Woodlief were critical in gathering infiltration data. Jonathan Smith provided assistance and guidance throughout this study. The authors would like to thank Amy Moran and Mike Regans for their help in setting up data collection and analysis. Thanks goes to all of the property owners, town officials, and extension agents who assisted in site selection and background information for each site. Their assistance was vital to this study.
References ASTM D 3385-03. Standard Test Method for Infiltration Rate of Soils in Field Using
Double-Ring Infiltrometer. American Society for Testing and Materials. 10 Jun 2003. Conshohocken, PA
ASTM D 448-03. Standard Classification for Sizes of Aggregate for Road and Bridge Construction. American Society for Testing and Materials. 10 Feb 2003. Conshohocken, PA
Balades, J. D., Legret, M., and Madiec, H. (1995) Permeable Pavements: Pollution Management Tools. Water Science and Technology. 32(1): 49-56.
Bennett, B. (2003) Personal communication. 3 November. Booth, D. B., Leavitt, J., and Peterson, K. (1996) The University of Washington Permeable
Pavement Demonstration Project. Brattebo, B. O., and Booth, D. B. (2003) Long-Term Stormwater Quantity and Quality
Performance of Permeable Pavement Systems. 1 July 2003 University of Washington, Department of Civil and Environmental Engineering, Seattle, W.A.
EPA. (1999) Storm Water Technology Fact Sheet: Porous Pavement. EPA: 832-F-99-023. Washington, D. C.: Environmental Protection Agency.
Gerritts, C, and James, W. (2002) Restoration of Infiltration Capacity of Permeable Pavers. In: Proceedings of 9th International Conference on Urban Drainage. ASCE. Portland, O.R.
Hunt, W. F., Stephens, S., and Mayes, D. (2002) Permeable Pavement Effectiveness in Eastern North Carolina. In: Proceedings of 9th International Conference on Urban Drainage. ASCE. Portland, O.R.
Leopold, L. B., Wolman, M. G., and Miller, J. P. (1964) Fluvial Processes in Geomorphology. San Francisco, C. A.: W.H. Freeman and Company.
Pratt, C. J., Mantle, J. D. G., and Schofield, P. A. (1995) UK Research into the Performance of Permeable Pavement, Reservoir Structures in Controlling Stormwater Discharge Quanitity and Quality. Water Science and Technology. 32(1): 63-69.
SAS. (2003) SAS User's Guide: Statistics. Ver. 8.2. Cary, N.C.: SAS Institute, Inc.