winter 2006 (pdf) - cooling technology institute
TRANSCRIPT


CTI Journal, Vol. 27, No. 1 1
The CTI Journal(ISSN: 0273-3250)
PUBLISHED SEMI-ANNUALLYCopyright 2006 by The CoolingTechnology Institute, PO Box 73383,Houston, TX 77273. Periodicalspostage paid at FORT WORTH, Texas.
MISSION STATEMENTIt is CTI�s objective to: 1) Maintain andexpand a broad base membership ofindividuals and organizationsinterested in Evaporative HeatTransfer Systems (EHTS), 2) Identifyand address emerging and evolvingissues concerning EHTS, 3) Encour-age and support educationalprograms in various formats toenhance the capabilities andcompetence of the industry to realizethe maximum benefit of EHTS, 4)Encourge and support cooperativeresearch to improve EHTS Technologyand efficiency for the long-termbenefit of the environment, 5) Assureacceptable minimum quality levelsand performance of EHTS and theircomponents by establishing standardspecifications, guidelines, andcertification programs, 6) Establishstandard testing and performanceanalysis systems and prcedures forEHTS, 7) Communicate with andinfluence governmental entitiesregarding the environmentallyresponsible technologies, benefits,and issues associated with EHTS, and8) Encourage and support forums andmethods for exchanging technicalinformation on EHTS.
LETTERS/MANUSCRIPTSLetters to the editor and manuscriptsfor publication should be sent to: TheCooling Technology Institute, PO Box73383, Houston, TX 77273.
SUBSCRIPTIONSThe CTI Journal is published inJanuary and June. Complimentarysubscriptions mailed to individuals inthe USA. Library subscriptions $20/yr.Subscriptions mailed to individualsoutside the USA are $30/yr.
CHANGE OF ADDRESSRequest must be received atsubscription office eight weeks beforeeffective date. Send both old and newaddresses for the change. You mayfax your change to 281.537.1721 oremail: [email protected].
PUBLICATION DISCLAIMERCTI has compiled this publicationwith care, but CTI has not Investi-gated, and CTI expressly disclaimsany duty to investigate, any product,service process, procedure, design,or the like that may be describedherein. The appearance of anytechnical data, editorial material, oradvertisement in this publicationdoes not constitute endorsement,warranty, or guarantee by CTI of anyproduct, service process, procedure,design, or the like. CTI does notwarranty that the information in thispublication is free of errors, and CTIdoes not necessarily agree with anystatement or opinion in thispublication. The entire risk of the useof any information in this publicationis assumed by the user. Copyright2006 by the CTI Journal. All rightsreserved.
ContentsFeature Articles8 Pressure Recovery Effects in Air-Cooled Installations
Henk Van Der Spek16 Lightning Protection For Cooling Towers
James F. Blake, Jr. and Bill Howard24 Evaluation to the Use of Mine Drainage To Supplement
Cooling WaterDr. A. Harriram and J.G. Nieuwenhuis
30 Finally, an Alternative to AzolesEric C. Ward, Al L. Foster, and Dane E. Glaser
46 Bacterial Resistance To Biocides In Recirculating CoolingWater SystemsDr. Chris L. Wiatr
60 Atmospheric Emissions From Evaporative CoolingTowersWayne Micheletti
Special Sections70 CTI Licensed Testing Agencies72 CTI ToolKit74 Cooling Towers Certified by CTI Under STD-201
Departments02 Meeting Calendar04 View From the Tower06 Editor�s Corner
See page 21
See page 10
See page 54

CTI Journal, Vol. 27, No. 12
CTI JournalThe Official Publication of The Cooling Technology Institute
Vol. 27 No.1 Winter 2006
Journal CommitteePaul Lindahl, Editor-in-ChiefArt Brunn, Sr. EditorVirginia Manser, Managing Editor/Adv. ManagerDonna Jones, Administrative AssistantGraphics by Sarita Graphics
Board of DirectorsJames (Jim) L. Baker, PresidentSteve Chaloupka, President ElectBill Howard, Vice PresidentRich Altice, SecretaryDennis (Denny) P. Shea, TreasurerTom Bugler, DirectorRaul Castillo, DirectorJames Kanuth, DirectorKen Kozelski, DirectorTerry Ogburn, DirectorGlenn Rees, Director
Address all communications to:Virginia A. Manser, CTI AdministratorCooling Technology InstitutePO Box 73383Houston, Texas 77273281.583.4087281.537.1721 (Fax)
Internet Address: http://www.cti.org
E-mail: [email protected]
FUTURE MEETING DATESCommittee AnnualWorkshop Conference
July 9-12, 2006 February 5-8, 2006Sheraton Sand Key Resort Wyndham Greenspoint
Clearwater, FL Houston, TX
July 8-11, 2007 February 4-7, 2007The Westin La Cantera Omni Corpus Christi Hotel
San Antonio, TX Corpus Christi, TX
REDWOOD
DOUGLAS FIR24 Hour Service on Your Lumber and Plywood Requirements
COMPLETE FABRICATION AND TREATINGSERVICE FROM OUR OPELOUSAS, LA PLANT
GAIENNIE LUMBERCOMPANY
BOX 1240 � OPELOUSAS, LA 70571-1240800-326-4050 � 337-948-3067 � 337-948-3069 (FAX)
Member
CTI Journal, Vol. 27, No. 1 3

CTI Journal, Vol. 27, No. 14
View From The Tower
Jim BakerPresident
It is hard to believe that my two years as President ofCTI is coming to an end. When I undertook this re-sponsibility, I was a bit apprehensive as exactly whatwe most needed to accomplish in the next two years.Well, I can assure you that help came from every direc-tion in making those decisions. With much counselfrom my old colleagues and friends, I established somegoals and set out to accomplish them. As has beenmentioned many times, change is inevitable and willoccur. Let�s reflect on some of the changes and ac-complishments that have taken place.Coming from an old Owner/Operator background, I
formance and technology, and Water Treatment andalso three separate types of members; Owner/Opera-tors, Suppliers, and Manufacturers. With a matrixsuch as this, the task at hand appears almost impos-sible. Through much hard work with the CTI Staffand the Program Committee, two drastic changes havebeen implemented. First, we now provide concur-rent technical papers so that everyone can find some-thing of interest. And second, you will see for thefirst time this coming meeting table top displays inthe Hospitality Suite. This request did come fromthe Owner/Operator Council. Glenn Reese has taken
wanted very badly to get this group more involved. With the helpof numerous Owners and Board Members, the Owner/OperatorCouncil was formed. The council now provides an avenue foreducation, exchange of information, electronic communication, andmost importantly a voice to the Committee Chairs and Board ofDirectors on their actual interests. Jennifer Cunningham leadsthat Council and is doing an excellent job.We have forever attempted to put together the perfect AnnualConference format. Our goal was to provide a program that waseducational for all cooling tower related disciplines continuouslyfor three days. This may sound easy except you are dealing withthree committees; Engineering Standards and Maintenance, Per-
the lead on these changes and has also done a wonderful job.The Certification Program, since it�s present implementation in theearly 1990�s, has been one of the true backbones of the CTI. TomWeast has been the Administrator and Test Engineer since thatimplementation. Just in case Tom does actually retire some day, wehave felt a need to find a potential replacement. Those wheels arein motion and we should have an alternate plan in the near future.We certainly want Tom to stay in his present role as long as pos-sible, but it is our responsibility to make sure that the CertificationProgram is never interrupted. We will accomplish that goal.Anytime you start a new job or position; wise counsel is of theutmost importance. One group that I have found to always provide
me with sound advise is the Past President�s Coun-sel. I believe that this Counsel has so many years ofexperience that the Board of Directors as well as thePresident should seek their view on any importantissues. We have expanded the Counsel to includeseven past presidents, four standing members andthree most recent past presidents that rotate on andoff. Our hope is that all areas of CTI lean on them foradvice.Last but not least I would like to brag a bit on the CTIStaff. The staff keeps this organization runningsmoothly, which I did not really appreciate until Ihad seen it first hand. We have implemented a Per-formance Evaluation Program for the staff. The ob-vious problem we had was that most people do noteven know what it takes to run the CTI Office. Thisprogram will allow the CTI employees to share theiraccomplishments and help the Board of Directorshave a better understanding of the organization. Itshould work for the overall good of the organization.These are a few of the milestone�s we have reachedover the past two years. What is great about thisorganization, is that people from all facets of the in-dustry work together. There is much more to be ac-complished. Your next President, Mr. SteveChaloupka, is up for the task. Please support him asyou have supported me. Thank you so much forallowing me to serve you. We will look forward toseeing all of you in Houston this coming February.
Jim Baker,CTI President

CTI Journal, Vol. 27, No. 1 5
CTI Journal, Vol. 27, No. 16
Editor�s Corner
Paul LindahlEditor-In-Chief
Dear Journal Readers,
Some changes are happening at CTI in responseto feedback from the Owner/Operator Council,chaired by Jennifer Cunningham of Air Liquide.One of the changes is the inclusion of a table-top display session during one of the eveningreceptions at the upcoming Annual Conferencein Houston. As the long time attendees of CTIwill know, the policy against advertising duringCTI meetings has prevented this sort of com-pany information sharing in the past. While thispolicy has been a positive thing for creating anatmosphere of technical progress for the industry, it has leftowner/operators without access to information about what thevarious vendors in our industry have to offer during the meet-ings.The Owner/Operator Council specifically asked for this type ofvenue to enable easy access for these members of CTI to ven-dor information. It is hoped that inclusion of this type of �trade
show� format will help to attract more attendance atthe Annual Conference by Owner/Operators. TheCTI Board of Directors has made the policy andbylaws changes to enable this �mini� trade show.I would like to encourage Owner/Operators, whetherCTI members or not, to attend the upcoming An-nual Meeting, and participate in the table top dis-play session as well as the technical papers, educa-tion seminars and technical committee activities thatare a part of the Cooling Technology Institute�sAnnual Conference format.The Annual Conference program is available onwww.cti.org, please take a look and sign up today!
Respectfully,Paul LindahlCTI Journal Editor

CTI Journal, Vol. 27, No. 1 7

CTI Journal, Vol. 27, No. 18
IntroductionPressure recovery is an effect that occurs in gas and liquid flows. Itconcerns the conversion from the velocity of the fluid into pres-sure under ideal, frictionless conditions. This also happens in theinverse direction; pressure is converted into velocity in a fluidflow. All these phenomena are based on ideal conditions. In fact,they are the consequence of one of the most fundamental physicallaws; the law for the conservation of energy. In an air-cooled instal-lation, the velocity of the air varies many times. This means there ishigh potential for these conversion effects. However, they havehardly been recognized until now. This study aims to discuss theconversion effects in air-cooled installations and its influence onthe performance of such installations with axial flow fans. Finally, aremarkable relationship between pressure recovery and the designof an axial flow fan is presented.
Law of BernoulliThe Swiss scientist Daniel Bernoulli (1700-1782), was first to ob-serve and define the law of the conservation of energy for a flowingfluid. Daniel Bernoulli was born in Groningen, The Netherlands,and later he became a professor at the University of Basel, Switzer-land. His famous work, Hydrodynamica, was published in 1738 inLatin and included this principle. Daniel Bernoulli is the nephew ofJacob Bernoulli who became famous because of his contribution tothe mathematics of statistics.The beauty of Daniel Bernoulli�s definition is its simplicity. He haslimited his expression to frictionless fluid flows and to fluid flowswithout compression; so-called ideal flows. In that situation, en-ergy can only convert from pressure into velocity and the inverse.It is like the exchange from the potential energy of a body when itfalls down due to gravity and the inverse; its deceleration when itgoes vertically up, like for instance, a ball. The mathematical ex-pression of the law of Bernoulli is:
Ideal conditions: [1]
Where: pst = static pressureρ = air densityv = air velocityC = constant value
Consequently, for non ideal conditions it becomes:
For a practical example, the effects are illustrated in figure 1 where afluid flows through a ducting with a varying cross-section.As one goes from cross-section 2 to section 3 in Figure 1, a part ofthe pressure recovery is missed due to the instantaneous transmis-sion, which generates swirls. Now the conditions are not ideal, and
the conversion from velocity to pres-sure occurs partially, or not. In thatcase, the energy is wasted into heat.Generally, the velocity will always fol-low the principle of continuity. Itmeans that every change of flow sec-tion will mean an inverse proportionalchange of velocity.However, what the pressure does, de-pends on the situation. An increasingvelocity due to a smaller flow sectionmeans decreasing pressure at ideallevels, and more pressure reductionfor less than ideal conditions. A de-
Pressure Recovery Effects inAir-Cooled Installations
D. Bernouilli1700-1782
creasing velocity due to a bigger flow section means an increasingpressure for ideal conditions and less or even nothing for non-idealconditions. Therefore for every pressure and velocity level, theideal conversion potential exists. If it occurs, it depends on theconditions.
Figure1: Fluid flow through various cross sections
Pressure recovery device: DiffuserAlthough pressure recovery is a principle that has been known forcenturies, up until now it has had a limited recognition and applica-tion in air-cooled installations. The best-known application is thediffuser or fan stack above an induced draft-cooling fan. The effectof the diffuser is that it is able to generate a part of the requiredpressure drop from the kinetic energy in the airflow out of the fan.Otherwise, this energy would be lost.The design of the diffuser is based on model studies as shown in[1]. This has resulted in a tight definition of the so-called diffuserangle and length. Generally, an efficiency of 75% is supposed. Inpractice, this efficiency is realized in an installation by the use of adiffuser, or fan stack, with a cone angle of 6°-8.5° (Figure 2). Thepressure recovery ∆pdiff is then calculated as follows:∆pdiff = 0.75*0.5*ρ(v1
2-v02)
by:Henk Van Der Spek, Howden Cooling Fans
Henk Van Der Spek

CTI Journal, Vol. 27, No. 1 9
CTI Journal, Vol. 27, No. 110
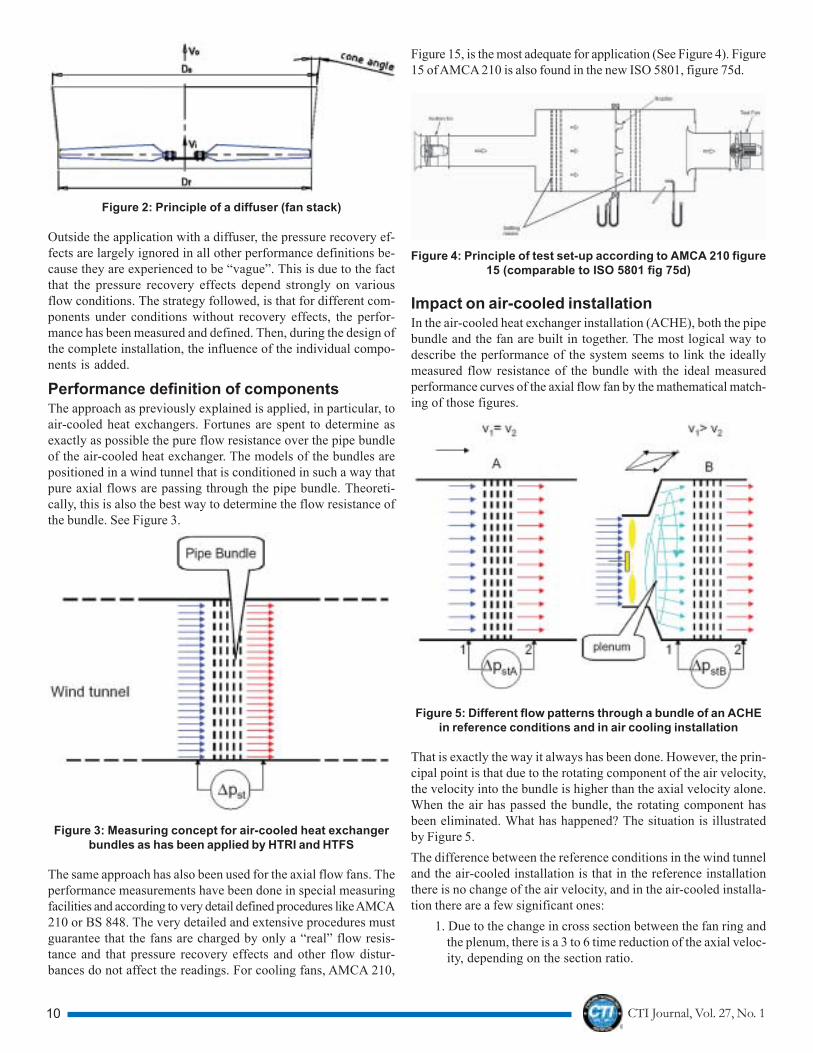
Figure 2: Principle of a diffuser (fan stack)
Outside the application with a diffuser, the pressure recovery ef-fects are largely ignored in all other performance definitions be-cause they are experienced to be �vague�. This is due to the factthat the pressure recovery effects depend strongly on variousflow conditions. The strategy followed, is that for different com-ponents under conditions without recovery effects, the perfor-mance has been measured and defined. Then, during the design ofthe complete installation, the influence of the individual compo-nents is added.
Performance definition of componentsThe approach as previously explained is applied, in particular, toair-cooled heat exchangers. Fortunes are spent to determine asexactly as possible the pure flow resistance over the pipe bundleof the air-cooled heat exchanger. The models of the bundles arepositioned in a wind tunnel that is conditioned in such a way thatpure axial flows are passing through the pipe bundle. Theoreti-cally, this is also the best way to determine the flow resistance ofthe bundle. See Figure 3.
Figure 3: Measuring concept for air-cooled heat exchangerbundles as has been applied by HTRI and HTFS
The same approach has also been used for the axial flow fans. Theperformance measurements have been done in special measuringfacilities and according to very detail defined procedures like AMCA210 or BS 848. The very detailed and extensive procedures mustguarantee that the fans are charged by only a �real� flow resis-tance and that pressure recovery effects and other flow distur-bances do not affect the readings. For cooling fans, AMCA 210,
Figure 15, is the most adequate for application (See Figure 4). Figure15 of AMCA 210 is also found in the new ISO 5801, figure 75d.
Figure 4: Principle of test set-up according to AMCA 210 figure15 (comparable to ISO 5801 fig 75d)
Impact on air-cooled installationIn the air-cooled heat exchanger installation (ACHE), both the pipebundle and the fan are built in together. The most logical way todescribe the performance of the system seems to link the ideallymeasured flow resistance of the bundle with the ideal measuredperformance curves of the axial flow fan by the mathematical match-ing of those figures.
Figure 5: Different flow patterns through a bundle of an ACHEin reference conditions and in air cooling installation
That is exactly the way it always has been done. However, the prin-cipal point is that due to the rotating component of the air velocity,the velocity into the bundle is higher than the axial velocity alone.When the air has passed the bundle, the rotating component hasbeen eliminated. What has happened? The situation is illustratedby Figure 5.The difference between the reference conditions in the wind tunneland the air-cooled installation is that in the reference installationthere is no change of the air velocity, and in the air-cooled installa-tion there are a few significant ones:
1. Due to the change in cross section between the fan ring andthe plenum, there is a 3 to 6 time reduction of the axial veloc-ity, depending on the section ratio.

CTI Journal, Vol. 27, No. 1 11

CTI Journal, Vol. 27, No. 112
2. The fan is adding a rotational component to the air velocity.3. The bundle eliminates the rotating component out of the air
velocity.This means that there are a few real velocity changes. It must besaid, these are under less ideal conditions like those in a diffuser.Therefore, ignoring any pressure recovery effect is not a realisticapproach. These effects are definitely present and it will be obvi-ous by the value of the pressure drop (∆ρ12) over the bundle. Tomake it more complicated, the rotating component of the air willgenerate an additional flow resistance for the air that moves throughthe bundle. For the reference condition in the wind tunnel, thevalue of ∆ρ12 corresponds with the �real� flow resistance of thebundle. However, in the air-cooled installation with an axial flowfan, ∆ρ12 is the integral result of the following effects of on oneside:
· the �real� flow resistance of the bundle like in the referenceinstallation
and on the other side:· the pressure drop increase by the rotational velocity compo-
nent· the pressure drop reduction due to a decelerating air flow in
the plenum and the bundleThe value ∆ρ12 indicates which of these effects dominates.(Figure5) If the design of the plenum is adequate and the measured pres-sure drop ∆ρstB is less than the �isolated� pressure drop ∆ρstA thenthe pressure recovery dominates. Alternatively, if the plenum sizeis inadequate and the measured ∆ρstB is greater than the pressuredrop ∆ρstA, then the flow resistance effect dominates.
Figure 6: There is hardly a pressure recovery effect when theplenum is ruled out in an ACHE
It is important that �these effects� are acknowledged in the designof air-cooled installations in order to reap their benefits. Due to thesensitivity or balance of these effects, it is easy to overlook them.But also �hidden � applications of the recovery effect have beendone. This means fan selections have been made that exceed theAMCA performance of the fan. In an installation with a plenum, aconical shape and a minimum height of one third of the fan diam-eter, the balance for ∆ρst will be positive. In the extreme, oppositesituation, by elongating the fan ring towards the bundle, the pres-sure recovery effect of the plenum is totally lost. In this case, whenthe airflow must be the same, there will be a multiple pressure rise
due to the incremental flow resistance by the rotation of the flowand the restricted flow area. (Figure 6).
Consequences for the design of an ACHEAs a rule of thumb, for a correctly designed ACHE, the pressurerecovery effect will dominate the negative aspects as previouslyexplained. This means that for a forced draft installation, the match-ing of the axial flow fan to the required duty point allows a reduc-tion of 10 to even 30 percent of the pressure drop over the bundle,depending on the plenum configuration. This is true if the value ofthat pressure drop is derived from an �ideal� wind tunnel reading. Itcannot be emphasized enough that this is only allowed if the per-formance characteristics of the fan are really determined accordingto a qualified standard like AMCA 210.
Pressure recovery potential dependents onfan designIn addition to the system configuration influence, intensive re-search has demonstrated that the fan design itself is also an impor-tant influence factor on the recovery potential of an installation.This is observed for two comparable fan types: A and B. The fansare technically comparable since both fans have an equal diameter,an equal number of blades, and the same blade width. However,their designs differ in tip design, in aerofoil, in twist, and in othertapering. For both fans, the performance curves have been estab-lished in an installation that is built according to AMCA 210. Oneintersection point of the flow/pressure curves of the two fans hasbeen analyzed in further detail. The curves are for identical bladepitch angles (See Figure 8, monitoring point).
Figure 8: Dimensionless pressure (CP) flow (Cf) curve of FanA and Fan B. O = monitoring point (Cp = Drst/(0.5 x r x vt
2)and Cf = Q/(0.25 x p x Df
2 x vt))The interference point of the two curves implies that at that pointthe average fan axial velocity and the average static pressure ac-cording to the AMCA definitions are equal. However, it turns outthat, in spite of this similarity, the velocity profiles of the two fansdiffer. This results in a different power balance between the twofans. The power balance results from:
1. the input shaft power2. the effective AMCA power3. the kinetic power output4. the power loss
(See Figure 9)
CTI Journal, Vol. 27, No. 1 13

CTI Journal, Vol. 27, No. 114
Figure 9. Power balance of two different fan designs
The shaft power and the effective AMCA power are standard pa-rameters of the fan performance test. The kinetic output power isderived by measuring the dynamic pressures, downstream of thefan, with a pitot tube at regular radial stations. From that data, thekinetic power level of the air flow has been calculated for everyradial station as follows:Nkin-rad = Qrad × ρdyn [2]
Where:Nkin-rad = kinetic power level [W]Qrad = air flow in radial section [m3/s]ρdyn = dynamic pressure [Pa]
The total kinetic power level Nkin-tot is calculated then from theaddition of the contribution of the radial sections. It was found thatin spite of the comparative geometric features of the fans, and theequal duty point, there is a difference of almost 20 percent in kineticpower output level (down stream) between fan A and fan B. This isin spite of a difference in fan efficiency of only 3 percent. Thisevidence is found to be the explanation for the 10 percent lowerpower consumption of fan A in an air-cooled heat exchanger. It is adirect benefit of the better pressure recovery.
Conclusions1. The conversion of air speed into pressure and the inverse is
an ongoing process in an aircooled installation.2. This can no longer be ignored in performance definitions of
air-cooled installations .For instance, one needs to avoidthat confusing fan selections are made that exceed the AMCAperformance of the fan.
3. The level of conversion depends on the construction of theair-cooled installation. An adequate plenum enhances thefavorable effects of the pressure recovery.
4. An optimal conversion results directly into power consump-tion savings.
5. The design of the axial flow fan in an air-cooled installation is an important param-eter also with respect to pressure recoveryeffects.
6. Fans with the highest kinetic output powerhave the best recovery potential and thatcan result in power savings.
References[1] Handbook of Hydraulic Resistance, 3rd
Edition, I.E. Idelchik, Begell House[2] ANSI/AMCA 210,[3] ANSI/ASHRAE 51-1985[4] British Standard 848

CTI Journal, Vol. 27, No. 1 15

CTI Journal, Vol. 27, No. 116
IntroductionSince the invention of the lightning rod by Benjamin Franklin in the1700�s, lightning protection has been installed on practically everyconceivable structure known to man. From homes to high rises,sailing ships and space shuttle launch sites, cathedrals to start-of-the-art sports stadiums, these systems have proven beneficial inprotecting life and property from the destructive effects of light-ning. So, too, have these systems been effective in protectingcooling towers.Although there are other types of lightning protection �systems�manufactured and installed around the world, for the purpose ofsimplification, this paper will be limited to the discussion of sys-tems installed under the National Fire Protection Association�s�Standard for Installation of Lightning Protection Systems� 780and components manufactured under Underwriters Laboratories�Lightning Protection Components� UL96 standard.While the lightning protection industry has kept abreast of emerg-ing construction materials and methods for the most part, applica-tion of this technology specific to cooling towers has not. Therecently completed build out of combined cycle/co-generation en-ergy plants also included the construction of many cooling towers,a fair amount of which had lightning protection systems installedon them. The last three years of this activity showed a markedincrease in the number of warranty and service calls for these sys-tems.After a number of inspections by, and inquiries to this author, itbecame apparent that a number of problems existed. Many sys-tems were falling into disrepair at a rate far above what is consid-ered the industry norm, some were incomplete, a number were in-stalled incorrectly, or a combination thereof. The most commonissues were: air terminals (lightning rods) and other associatedcomponents were coming loose structures or themselves; oxida-tion and corrosion was taking place at an accelerated rate; appurte-nances were added to the structure but not incorporated into thelightning protection system; and installation techniques of equip-ment did not comply with the national standards.The cause of these issues fall into three basic categories.1. Environment.2. Post-Construction Appurtenances.3. Improper/Incomplete Installation.
EnvironmentThe physical dynamics associated with cooling towers presentissues not typically addressed in the design or component selec-tion of lightning protection systems. Constant vibration, harmo-nies, wet environment and water treating chemical additives all
contribute to the deg-radation of a systemover time, with varyingdegrees. It should benoted that the majorityof lightning protectionsystems installed oncooling towers utilizecopper and bronze com-
Lightning Protection For CoolingTowersby:James F. Blake, Jr., American Lightning ProtectionSystems, Inc.Bill Howard, Cooling Tower Depot
ponents. Although they are extremely durable they are, nonethe-less, semi-soft because they are annealed during manufacturing.Vibration is, by and large, the greatest contributor to the break-down of a lightning protection system. Most lightning protectionfittings have threads and utilize threaded hardware and fasteners,and the constant vibration will loosen these connections. Further,as time passes, vibration increases when fan blades come out ofpitch or when drive shafts and gear boxes become unbalanced.Ergo, the lightning protection system will fall further into disrepair.Harmonics is a problematical by-product of the rotational appara-tus on the tower. One example of damage from harmonics is thebreaking of air terminals at the hubs of their bases, which are in-stalled at (or near) the tops of fan stacks. Base hubs themselvessuffer this problem as well (although to a lesser extent), and occa-sionally fasteners break or unscrew from the stack wall.Lightning protection systems on cooling towers are, for the mostpart, installed in an exposed manner. Generally, conductors andcomponents are attached to handrails and stacks, with conductorscoursed in plenums and down exterior structural columns.As stated earlier, lightning protection components are extremelydurable. They are manufactured to be such due to their use in atypical outdoor environment, and case last for decades. Obvi-ously, a cooling tower is not a typical environment as there areareas that stay wet almost constantly. This constant moisture ac-celerates oxidation and corrosion on conductors and fittings, ulti-mately increasing the systems� resistance, and resulting in higherimpedance of current flow for transferring lightning energy toground. And when mixed with airborne contaminates or pollutantssuch as those present around petrochemical plants or refineries,the problem is exacerbated.Appendant to the moisture issue are chemicals associated withwater treatment. As with any unprotected metal, acids or alkalineswill accelerate oxidation and corrosion, ultimately breaking downthe metal over time. These chemicals normally adhere to lightningcomponents while in a soluble state, but in a dry state they mayalso have detrimental effects.A few of the examples of oxidation and corrosion due to wet and/orchemical environments are: greening and/or blackening of conduc-tors or components; the appearance of melting of conductors; ac-cumulation of white, powdery substance on fittings and hardware.
James F. Blake Bill Howard
CTI Journal, Vol. 27, No. 1 17
CTI Journal, Vol. 27, No. 118
Solutions to the aforementioned issues are many, but basically arecomposed of:
1. Selecting the proper components at the time of system de-sign.
2. Adding additional supports for strength.3. Installing special fasteners in areas subject to vibration or
harmonics.4. Upgrading and/or changing components the fastener hard-
ware.5. Protecting components through the use of special platings,
coatings, and/or coverings.6. Semi-annual inspection of the lightning protection system.
Post-Constructive AppurtenancesAs with fire protection, davits (hoists) and the like, lightning pro-tection is normally part of the contract awarded to the tower erec-tor. Typically, the system supplied covers the tower structure fromtop down to the basin wall. However, there are some items notcontracted to the erector which are installed after the tower is com-plete.Items such as lighting (rail or structural mounted), cable trays, CCTVcameras and antennas are atypical of post-erection appurtenancesand, depending on their location, could be subject to direct strikefrom lightning or a side flash during current discharge. Many ofthese items are not addressed after their installation. These itemscan have significant impact on the effectiveness of the lightningprotection system�s performance, and if not addressed, could leadto damage of equipment or destruction of the tower itself.Oftentimes the Owner or their duly appointed representative willprovide a grounding system (also known as ground �loop�, �grid�or �ring�). This system is installed around the basin of the tower,and the lightning protection system is required to be intercon-nected to it. Historically, this grounding system is not installed bythe time the lightning protection system has been completed, sothe installer is directed to leave a length of cable, a �pigtail�, forinterconnection by others to said grounding system at a later time.Although a logical approach to an apparently simple matter, thissituation has proven more often than not to be impractical. Whenmaking the interconnections the responsible party uses electricalindustry components, which (except for exothermic welding) donot comply with the lightning protection standards. Also, conduc-tors are coursed incorrectly and are not fitted with protection frommechanical hazards.In some instances the grounding system provider will stub up pig-tails beforehand. But because the lightning protection design wasnot sent to the provider, they are located incorrectly. When thisoccurs, they should be abandoned with new pigtails installed ac-cordingly. In practice, however, the improperly located pigtails arespliced with more cable and coursed over long distances that con-tain improper and/or multiple bends to the lightning pigtail. Thisresulting increase in lead length and bends will increase impedanceof the lightning protection system.
NFPA states surge suppressions (lightning arresters) shall be installed onincoming electrical or telecommunications service entrances and on radioand television (and other antenna lead-ins). Given the proper information,the lightning protection contractor can provide them. However, the electri-cal and telecom systems are normally furnished under a contract separatefrom the cooling tower provider. Therefore the lightning protection supplierspecifically notes (or should note) that they are required but are excludedfrom their scope work.Most Owner/Operators become aware of lightning issue after motor wind-ing burn, bearings seize or control panel wiring melts, usually occurring upon top of the tower. And while there may be surge devices installed, they are(per NFPA) located at the incoming entrances which are usually below and/or far away from the tower itself, and protect only the line (incoming) side ofthe equipment. Since the motors and control boxes are high up on the towerand on the load side of the equipment, they are subject to induced and/orconducted current and are left unprotected. Therefore, the addition of surgesuppression/arresting devices at these locations will assure that the poten-tial for damage is reduced, if not eliminated.The overall solution to these issues is for better communication between allresponsible parties by sharing information beforehand and coordinatingoverlapping tasks as the project develops. Simply put, project managersshould gather as much information possible prior to design. On-site inspec-tion authorities should be informed as to what the system requires, advisedof any potential issues concerning the impact of power construction trades,and lastly, performs a final review/audit of the lightning protection systemupon completion.
Improper/Incomplete InstallationLightning protection is a specialized field, both in design and installation,and it is possible to purchase a design and materials for a structure Al-though it may seem that installing a system appears to be relatively simple,nothing could be farther from the truth.Over the years, erectors, electricians, even general contractors, have at-tempted to install these systems, and the results have been less than ad-equate at best.The list of installation code violations are too numerous to mention here, butthe most common issues are: missing and improperly spaced air terminals;illegal cable bends; lack of bonding; and the use of non Underwriters Labo-ratories approved components.It should be understood that installing a lightning protection system is notfor the novice, especially considering the potential consequences when it isinstalled incorrectly. The solution, then, is that the installation of lightningprotection should be accomplished by qualified craftsmen who possess thenecessary knowledge, experience, and skill to install them. It should also beinspected by an independent third-party to assure compliance with the na-tional codes governing them.
SummaryLightning protection systems for cooling towers are necessary to protectthe structure, equipment and personnel from the destructive effects of light-ning. Many of these systems, past and present, suffer from environmental,design, and/or installation issues that need to be corrected. If left unre-solved, these issues could lead to further damage, loss of equipment, loss ofrevenue, or even worse, loss of human life.

CTI Journal, Vol. 27, No. 1 19

CTI Journal, Vol. 27, No. 120
Figure 1- Conductor Issues: Loose, upwardpath, & unsupported.
Figure 4 - Conductor exhibiting extreme corrosiondue to chemical entrained water.
Figure 3 - Conductor bends less than 8-inch radius.
Figure 2 - Chemically entrained, constantly wetenvironment corroding conductor.

CTI Journal, Vol. 27, No. 1 21
Figure 5 - Fan stack flange vibrating againstair terminal, elongating hole.
Figure 8 - Stanchions: Near air terminal vibrating loose,far air terminal missing.
Figure 7 - Stairway lacks protection.
Figure 6 - Air terminal (through flange) missingdue to vibration.

CTI Journal, Vol. 27, No. 122
Figure 9 - Both conductor and fastener loop are cutdue to vibration.
Figure 12 - Air terminal less than the required 24 inchesabove handrail.
Figure 11 - Fastener cut, cable repaired usingunapproved fitting.
Figure 10 - Conductor cut at toe board due to vibration.

CTI Journal, Vol. 27, No. 1 23
CTI Journal, Vol. 27, No. 124
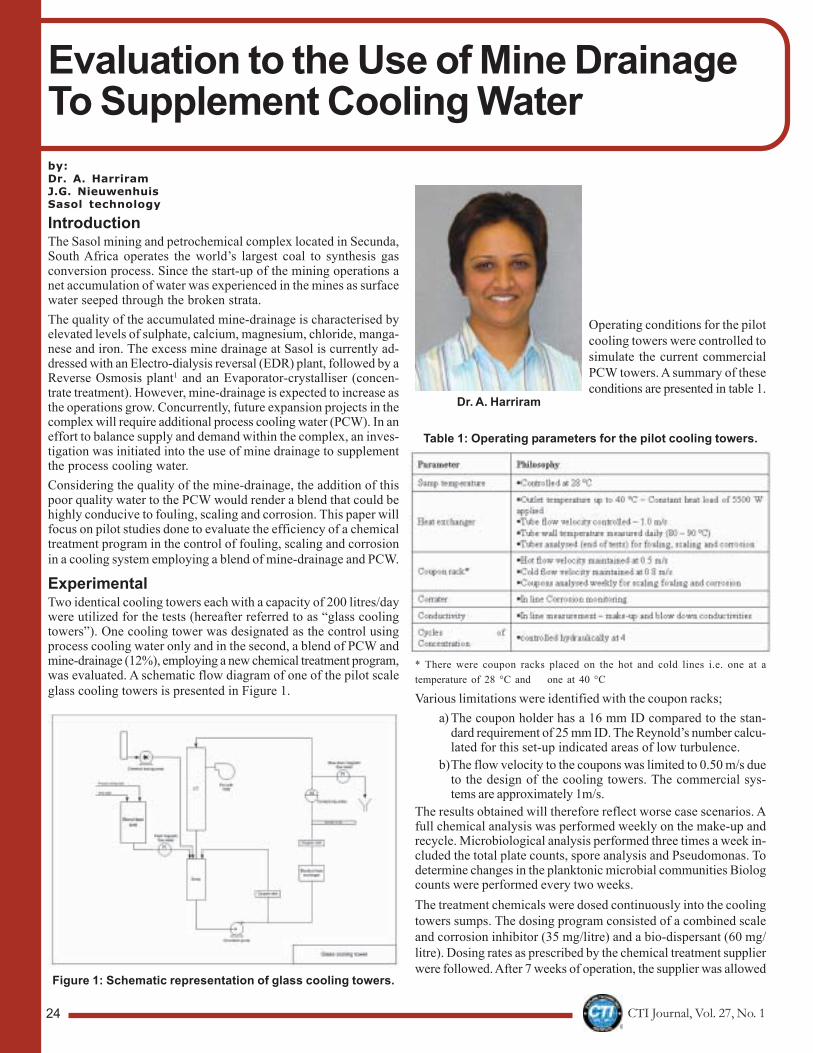
IntroductionThe Sasol mining and petrochemical complex located in Secunda,South Africa operates the world�s largest coal to synthesis gasconversion process. Since the start-up of the mining operations anet accumulation of water was experienced in the mines as surfacewater seeped through the broken strata.The quality of the accumulated mine-drainage is characterised byelevated levels of sulphate, calcium, magnesium, chloride, manga-nese and iron. The excess mine drainage at Sasol is currently ad-dressed with an Electro-dialysis reversal (EDR) plant, followed by aReverse Osmosis plant1 and an Evaporator-crystalliser (concen-trate treatment). However, mine-drainage is expected to increase asthe operations grow. Concurrently, future expansion projects in thecomplex will require additional process cooling water (PCW). In aneffort to balance supply and demand within the complex, an inves-tigation was initiated into the use of mine drainage to supplementthe process cooling water.Considering the quality of the mine-drainage, the addition of thispoor quality water to the PCW would render a blend that could behighly conducive to fouling, scaling and corrosion. This paper willfocus on pilot studies done to evaluate the efficiency of a chemicaltreatment program in the control of fouling, scaling and corrosionin a cooling system employing a blend of mine-drainage and PCW.
ExperimentalTwo identical cooling towers each with a capacity of 200 litres/daywere utilized for the tests (hereafter referred to as �glass coolingtowers�). One cooling tower was designated as the control usingprocess cooling water only and in the second, a blend of PCW andmine-drainage (12%), employing a new chemical treatment program,was evaluated. A schematic flow diagram of one of the pilot scaleglass cooling towers is presented in Figure 1.
Figure 1: Schematic representation of glass cooling towers.
Operating conditions for the pilotcooling towers were controlled tosimulate the current commercialPCW towers. A summary of theseconditions are presented in table 1.
Evaluation to the Use of Mine DrainageTo Supplement Cooling Waterby:Dr. A. HarriramJ.G. NieuwenhuisSasol technology
Table 1: Operating parameters for the pilot cooling towers.
* There were coupon racks placed on the hot and cold lines i.e. one at atemperature of 28 °C and one at 40 °C
Various limitations were identified with the coupon racks;a) The coupon holder has a 16 mm ID compared to the stan-
dard requirement of 25 mm ID. The Reynold�s number calcu-lated for this set-up indicated areas of low turbulence.
b)The flow velocity to the coupons was limited to 0.50 m/s dueto the design of the cooling towers. The commercial sys-tems are approximately 1m/s.
The results obtained will therefore reflect worse case scenarios. Afull chemical analysis was performed weekly on the make-up andrecycle. Microbiological analysis performed three times a week in-cluded the total plate counts, spore analysis and Pseudomonas. Todetermine changes in the planktonic microbial communities Biologcounts were performed every two weeks.The treatment chemicals were dosed continuously into the coolingtowers sumps. The dosing program consisted of a combined scaleand corrosion inhibitor (35 mg/litre) and a bio-dispersant (60 mg/litre). Dosing rates as prescribed by the chemical treatment supplierwere followed. After 7 weeks of operation, the supplier was allowed
Dr. A. Harriram

CTI Journal, Vol. 27, No. 1 25

CTI Journal, Vol. 27, No. 126
to optimize the program for a further eight weeks.The major concerns to a cooling system with poor quality water arechemically induced corrosion as well as a reduction in heat transferefficiencies due to scaling and/or fouling. These parameters wereclosely monitored with the coupons, tubes, and Corraters. Thecomparative results are presented.
Results and DiscussionThe operating parameters were maintained within specificationsand the pilot plants were stable during the test period. The qualityof the CW (no mine water) and blend used during this study ispresented in table 2. The calculated (theoretical) values provide anindication of the chemistry expected after 4 cycles.
Table 2: Water quality data
i) CorrosionThe corrosion rates determined from the coupons and Corraters arepresented in Figures 2 to 4. Sasol standards for corrosion on thecoupons are classified as <0.25 mmY: optimum, 0.25-0.5 mmY: ac-ceptable and > 0.5 mmY: unacceptable. The Corrater limit is < 0.15mmY for corrosion and <0.5 for imbalance.
Figure 2: A comparison of corrosion on the coupons.
Figure 3: Corrosion rates recorded by in-line Corraters.
Figure 4: Imbalance recorded on the Corraters.
The new dosing program proved effective in maintaining low cor-rosion rates even with the high concentrations of chlorides,sulphates and dissolved solids in the mine-drainage system. Thesespecies are reported to sustain corrosion by preventing the forma-tion of the passivation layer which normally forms on clean metalsurfaces2. The corrosion rate from the in-line Corraters showedsimilar trends to the coupon results with the blend system perform-ing better than the control. The imbalance readings3 (also recordedon the Corraters) indicated that the control tower had pitting on thecoupons.The pits were visible with a stereo light microscope. The image isshown in Figure 5.
Figure 5: Pits present on the coupon from the hot side of thepilot plant operating with the control program

CTI Journal, Vol. 27, No. 1 27
CTI Journal, Vol. 27, No. 128
Further investigations conducted revealed the presence of acidproducing bacteria. These bacteria dissolve the passive oxide filmfrom the metal surface and accelerate the cathodic reaction in acorrosion cell. Although the mine-drainage system had conditionsconducive to pitting (e.g. high sulphate and sufficient nutrients),no pitting was observed. In addition the Larson-Skold index ap-plied to the system also predicted severe corrosion. It was there-fore evident that the proposed corrosion inhibitor was effective inmaintaining low corrosion rates in the blend towers.
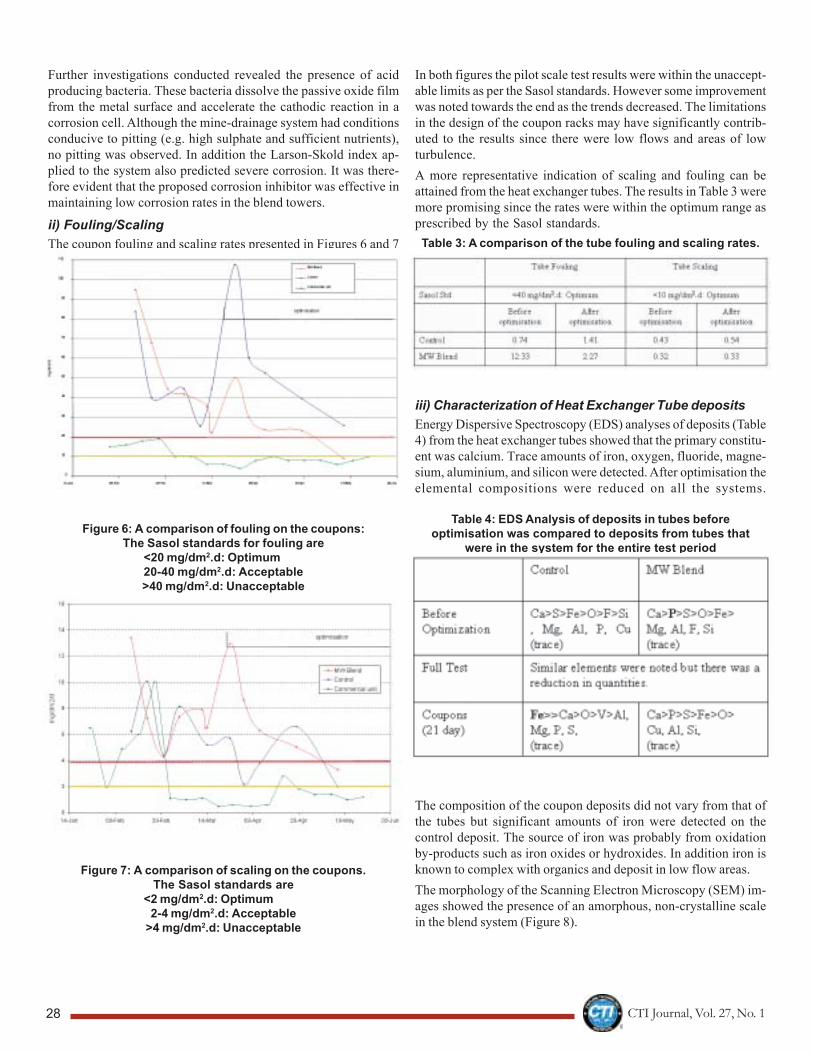
ii) Fouling/ScalingThe coupon fouling and scaling rates presented in Figures 6 and 7respectively showed poor correlation to the commercial units.
Figure 6: A comparison of fouling on the coupons:The Sasol standards for fouling are
<20 mg/dm2.d: Optimum20-40 mg/dm2.d: Acceptable>40 mg/dm2.d: Unacceptable
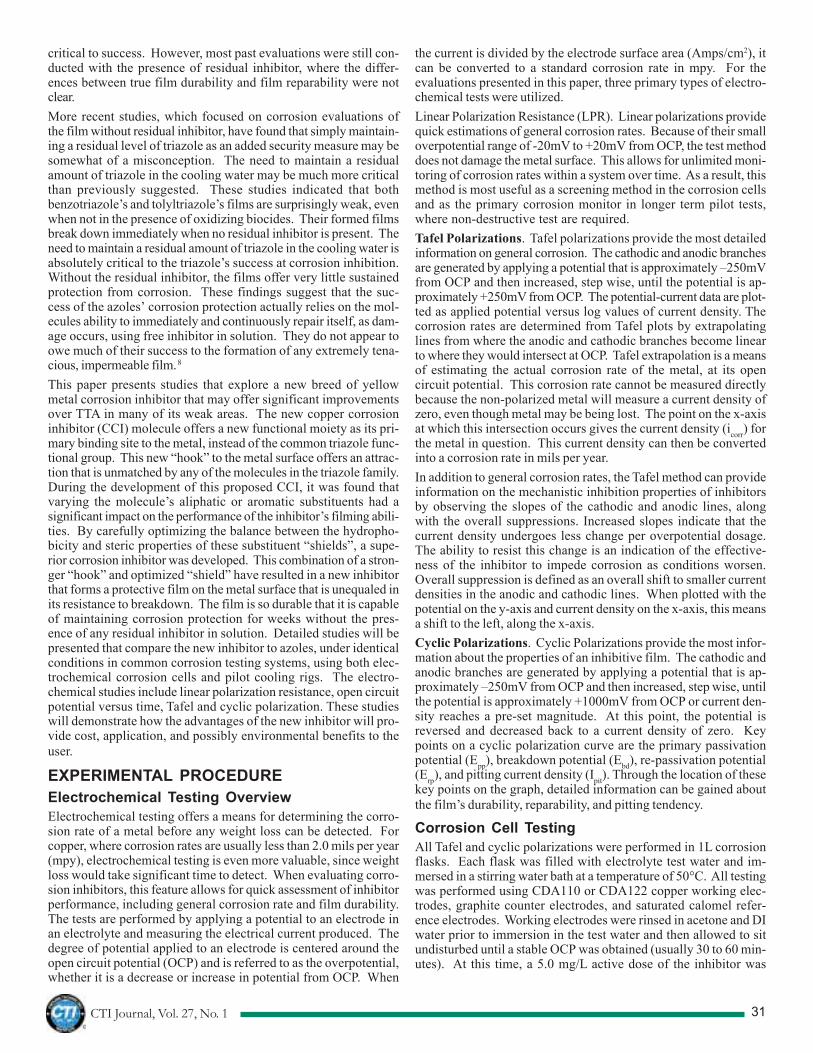
Figure 7: A comparison of scaling on the coupons.The Sasol standards are
<2 mg/dm2.d: Optimum2-4 mg/dm2.d: Acceptable
>4 mg/dm2.d: Unacceptable
In both figures the pilot scale test results were within the unaccept-able limits as per the Sasol standards. However some improvementwas noted towards the end as the trends decreased. The limitationsin the design of the coupon racks may have significantly contrib-uted to the results since there were low flows and areas of lowturbulence.A more representative indication of scaling and fouling can beattained from the heat exchanger tubes. The results in Table 3 weremore promising since the rates were within the optimum range asprescribed by the Sasol standards.Table 3: A comparison of the tube fouling and scaling rates.
iii) Characterization of Heat Exchanger Tube depositsEnergy Dispersive Spectroscopy (EDS) analyses of deposits (Table4) from the heat exchanger tubes showed that the primary constitu-ent was calcium. Trace amounts of iron, oxygen, fluoride, magne-sium, aluminium, and silicon were detected. After optimisation theelemental compositions were reduced on all the systems.
Table 4: EDS Analysis of deposits in tubes beforeoptimisation was compared to deposits from tubes that
were in the system for the entire test period(i.e. before and after optimisation).
The composition of the coupon deposits did not vary from that ofthe tubes but significant amounts of iron were detected on thecontrol deposit. The source of iron was probably from oxidationby-products such as iron oxides or hydroxides. In addition iron isknown to complex with organics and deposit in low flow areas.The morphology of the Scanning Electron Microscopy (SEM) im-ages showed the presence of an amorphous, non-crystalline scalein the blend system (Figure 8).

CTI Journal, Vol. 27, No. 1 29
Figure 8: SEM Image of deposit from blend system.
In both systems the crystal structure was probably distorted andtherefore the scale did not adhere to the tube walls. In addition toscale distortion, ions of a similar size to calcium, such as magne-sium and manganese, compete for attachment to the carbonates(common ion effect). This hindered scale initiation and subsequentformation. Sulphate is also known to compete with carbonate forattachment to calcium.4 In addition the organics in the system mayalso act as nucleating sites for precipitation. The Langlier, Ryznarand Puckorius saturation indices only predicted a calcium carbon-ate scale dissolving environment. However the formation of cal-cium sulphates, silicates and calcium fluorides could not be deter-mined.
ConclusionThe utilization of mine water to supplement the cooling water
proved to be a viable option with the new chemical dosing pro-gram. Scaling, fouling and corrosion on heat transfer surfaces weremaintained within Sasol�s required specifications. In addition thepreliminary cost estimations indicated that the new program mayalso be more cost effective than the current dosing program utilisedon the commercial scale units. However the high concentration ofsulphate and chloride in the recirculation water may contribute toconcrete corrosion on the commercial systems. This may beminimised if the commercial systems are coated with specialisedproducts designed for concrete protection. However it is not apractical solution due to the losses in production that will be in-curred during a shut-down of this magnitude.The mine water drainage volumes still remain a threat for the future.Therefore test work will now be conducted to incorporate a pre-treatment option which will remove sulphates, chlorides, calciumand magnesium. The removal of these problematic componentswill expand the scope of use for mine water as is (not in blends) inthe cooling systems. In addition, based on the effluent quality afterpre-treatment, the water could be utilized in other areas in the com-plex which will consequently reduce the water requirements fromSouth Africa�s scarce resources.
References1. Nieuwenhuis J.G et al, Sasol�s Experience in the Desalina-
tion and Re-use of Acid mine drainage and Ash water, Mem-brane Technology in Water & Wastewater Treatment, RoyalSociety of Chemistry, 2000, p211
2. Lowenthal R.E., Morrison I. and Wentzel M.C, Water Sci-ence & Tech. � Control of Corrosion and Aggression in Drink-ing Water Systems�, Vol. 49, No 2, 2004.
3. Corrater Operation Manual, Rohrback Cosasco Systems.4. Drew Principles of Water Treatment, Drew Industrial Divi-
sion, New Jersey, 1994.

CTI Journal, Vol. 27, No. 130
by:Eric C. Ward, Al L. Foster, and Dane E. GlaserAlco Chemical
ABSTRACTBenzotriazole and its derivatives have been the dominant yellowmetal corrosion inhibitors used in industrial cooling water for thelast thirty years. By far, the most popular of these derivatives hasbeen 4-5 methyl benzotriazole, or tolyltriazole. Despite the triazolesdominance, however, they do have weaknesses. Previous studieshave shown that the thin tolyltriazole film can be easily penetratedby oxidizing biocides, such as chlorine. These tests found that,while the tolyltriazole film can be very resistant to breakdown inaqueous environments, the thinness of the film does not result in aforgiving barrier when breakdown occurs. The user must assurethat there is residual azole inhibitor present to repair the damage.More recent tests have demonstrated that this need to maintain aresidual amount of azole may be much more critical than previouslysuggested. These tests found that both benzotriazole�s andtolyltriazole�s films are surprisingly weak, even when not in thepresence of oxidizing biocides. Their formed films break downimmediately when no residual inhibitor is present. These findingsdemonstrated that the success of the azoles� corrosion protectionrelies solely on the immediate repair of damaged film by free inhibi-tor in the water, not in the formation of a tenacious, hydrophobicfilm.This paper presents studies that explore a new breed of yellowmetal corrosion inhibitor that offers revolutionary improvementsover the triazoles in a number of areas. This new inhibitor forms aprotective film on the metal surface that is unequaled in its resis-tance to breakdown. The film is so durable that it is capable ofmaintaining corrosion protection for weeks without the presenceof any residual inhibitor in solution - a feat that azoles are incapableof achieving. Detailed studies will be presented that compare thenew inhibitor to triazoles, demonstrating how the advantages ofthe new inhibitor will provide cost, environmental, and applicationbenefits to the user.Keywords: benzotriazole, tolyltriazole, copper corrosion inhibi-tors, electrochemical testing, linear polarization resistance, Tafelpolarizations, cyclic polarizations.
INTRODUCTIONCopper corrosion inhibitors are widely considered a staple ingredi-ent in most water treatment formulations. These inhibitors are de-signed to protect against corrosion of the copper alloy surfacesfound within industrial cooling systems. In addition, these inhibi-tors can protect against the galvanic corrosion of ferrous metalsurfaces, by preventing the deposition of copper onto the ferrousmetal. The accelerated corrosion of these surfaces can have detri-mental effects on the structural integrity and operation of the cool-ing system. The most common copper corrosion inhibitors usedtoday are benzotriazole (BTA) and tolyltriazole (TTA), with TTAbeing the overwhelming industry favorite.Both BTA and TTA are believed to utilize their triazole functional
group as their binding site to the metal,resulting in a protective film on the cop-per surface. Spectroscopic analyseshave shown that the film formed is a 1:1molar complex of Cu(I) and triazole. Thiscomplex is thought to stabilize Cu(I),preventing the copper from oxidizingfurther, and thus, preventing the anodicreaction. The retardation of the ca-thodic reaction is believed to be accom-plished by the hydrophobic backboneof the formed film, which inhibits the
Finally, an Alternative to Azoles
transport of hydrated, electronically active species to the metalsurface.1 The film formed by TTA is widely considered to be moreresistant to breakdown in aqueous environments, due to its thin,more hydrophobic backbone. In contrast, the BTA backbone isless hydrophobic and more easily penetrated. However, the multi-layered BTA film has been found to act as a buffer against completebreakdown, while the thin TTA film is not nearly as forgiving whenbreakdown occurs.1
One of the most frequently claimed weaknesses of the triazoles hasbeen their susceptibility to degradation from halogenated biocides.This degradation is believed to affect both the formed triazole filmand the residual inhibitor in solution, which has the potential toconsume all of the added biocide. However, studies have differedon the degree of this degradation, ranging from severely detrimen-tal2,3 to mildly insignificant.1,4 Some studies have found the TTAfilm to be more resistant to attack from low levels of free chlorinethan the BTA film.1,6 Longer exposure times and higher concentra-tions of free chlorine were found to damage the film when no re-sidual inhibitor was present.6,7 To overcome this weakness, mostwater treatment experts recommend keeping a residual amount oftriazole present in the water to repair any damaged areas of the film.It has also been advised to use a scheduled intermittent feed ofinhibitor that occurs just prior to and also during any halogenaddition.7. For some, these practices have been successful. Still,others feel there is some room for improvement. Many of the morerecent attempts made at developing viable alternatives to TTA havefocused solely on this weakness to attack from halogenated bio-cides. These alternatives have consisted primarily of other triazolederivatives, with larger substituents that offer a more hydrophobicbackbone and better resistance to halogenated biocide attack. Mostof these studies have primarily focused on the degradation of theresidual inhibitor in solution, with very little discussion of the ac-tual film�s susceptibility.It has become common practice in most traditional cooling watertreatment programs to always maintain a constant residual of triazolein the cooling water of around 2.5 mg/L active product. This prac-tice has been utilized for many years, with much success. However,the most common reason for keeping a residual in the water, whetherin combination with halogenated biocides or not, has been to offerand additional level of security, in case of possible film breakdown.Many studies have concluded that the triazoles form a tenacious,hydrophobic film that offers corrosion protection for the metal,suggesting that a residual amount of triazole in the water is not
Eric C. Ward
CTI Journal, Vol. 27, No. 1 31
critical to success. However, most past evaluations were still con-ducted with the presence of residual inhibitor, where the differ-ences between true film durability and film reparability were notclear.More recent studies, which focused on corrosion evaluations ofthe film without residual inhibitor, have found that simply maintain-ing a residual level of triazole as an added security measure may besomewhat of a misconception. The need to maintain a residualamount of triazole in the cooling water may be much more criticalthan previously suggested. These studies indicated that bothbenzotriazole�s and tolyltriazole�s films are surprisingly weak, evenwhen not in the presence of oxidizing biocides. Their formed filmsbreak down immediately when no residual inhibitor is present. Theneed to maintain a residual amount of triazole in the cooling water isabsolutely critical to the triazole�s success at corrosion inhibition.Without the residual inhibitor, the films offer very little sustainedprotection from corrosion. These findings suggest that the suc-cess of the azoles� corrosion protection actually relies on the mol-ecules ability to immediately and continuously repair itself, as dam-age occurs, using free inhibitor in solution. They do not appear toowe much of their success to the formation of any extremely tena-cious, impermeable film. 8
This paper presents studies that explore a new breed of yellowmetal corrosion inhibitor that may offer significant improvementsover TTA in many of its weak areas. The new copper corrosioninhibitor (CCI) molecule offers a new functional moiety as its pri-mary binding site to the metal, instead of the common triazole func-tional group. This new �hook� to the metal surface offers an attrac-tion that is unmatched by any of the molecules in the triazole family.During the development of this proposed CCI, it was found thatvarying the molecule�s aliphatic or aromatic substituents had asignificant impact on the performance of the inhibitor�s filming abili-ties. By carefully optimizing the balance between the hydropho-bicity and steric properties of these substituent �shields�, a supe-rior corrosion inhibitor was developed. This combination of a stron-ger �hook� and optimized �shield� have resulted in a new inhibitorthat forms a protective film on the metal surface that is unequaled inits resistance to breakdown. The film is so durable that it is capableof maintaining corrosion protection for weeks without the pres-ence of any residual inhibitor in solution. Detailed studies will bepresented that compare the new inhibitor to azoles, under identicalconditions in common corrosion testing systems, using both elec-trochemical corrosion cells and pilot cooling rigs. The electro-chemical studies include linear polarization resistance, open circuitpotential versus time, Tafel and cyclic polarization. These studieswill demonstrate how the advantages of the new inhibitor will pro-vide cost, application, and possibly environmental benefits to theuser.
EXPERIMENTAL PROCEDUREElectrochemical Testing OverviewElectrochemical testing offers a means for determining the corro-sion rate of a metal before any weight loss can be detected. Forcopper, where corrosion rates are usually less than 2.0 mils per year(mpy), electrochemical testing is even more valuable, since weightloss would take significant time to detect. When evaluating corro-sion inhibitors, this feature allows for quick assessment of inhibitorperformance, including general corrosion rate and film durability.The tests are performed by applying a potential to an electrode inan electrolyte and measuring the electrical current produced. Thedegree of potential applied to an electrode is centered around theopen circuit potential (OCP) and is referred to as the overpotential,whether it is a decrease or increase in potential from OCP. When
the current is divided by the electrode surface area (Amps/cm2), itcan be converted to a standard corrosion rate in mpy. For theevaluations presented in this paper, three primary types of electro-chemical tests were utilized.Linear Polarization Resistance (LPR). Linear polarizations providequick estimations of general corrosion rates. Because of their smalloverpotential range of -20mV to +20mV from OCP, the test methoddoes not damage the metal surface. This allows for unlimited moni-toring of corrosion rates within a system over time. As a result, thismethod is most useful as a screening method in the corrosion cellsand as the primary corrosion monitor in longer term pilot tests,where non-destructive test are required.Tafel Polarizations. Tafel polarizations provide the most detailedinformation on general corrosion. The cathodic and anodic branchesare generated by applying a potential that is approximately �250mVfrom OCP and then increased, step wise, until the potential is ap-proximately +250mV from OCP. The potential-current data are plot-ted as applied potential versus log values of current density. Thecorrosion rates are determined from Tafel plots by extrapolatinglines from where the anodic and cathodic branches become linearto where they would intersect at OCP. Tafel extrapolation is a meansof estimating the actual corrosion rate of the metal, at its opencircuit potential. This corrosion rate cannot be measured directlybecause the non-polarized metal will measure a current density ofzero, even though metal may be being lost. The point on the x-axisat which this intersection occurs gives the current density (icorr) forthe metal in question. This current density can then be convertedinto a corrosion rate in mils per year.In addition to general corrosion rates, the Tafel method can provideinformation on the mechanistic inhibition properties of inhibitorsby observing the slopes of the cathodic and anodic lines, alongwith the overall suppressions. Increased slopes indicate that thecurrent density undergoes less change per overpotential dosage.The ability to resist this change is an indication of the effective-ness of the inhibitor to impede corrosion as conditions worsen.Overall suppression is defined as an overall shift to smaller currentdensities in the anodic and cathodic lines. When plotted with thepotential on the y-axis and current density on the x-axis, this meansa shift to the left, along the x-axis.Cyclic Polarizations. Cyclic Polarizations provide the most infor-mation about the properties of an inhibitive film. The cathodic andanodic branches are generated by applying a potential that is ap-proximately �250mV from OCP and then increased, step wise, untilthe potential is approximately +1000mV from OCP or current den-sity reaches a pre-set magnitude. At this point, the potential isreversed and decreased back to a current density of zero. Keypoints on a cyclic polarization curve are the primary passivationpotential (Epp), breakdown potential (Ebd), re-passivation potential(Erp), and pitting current density (Ipit). Through the location of thesekey points on the graph, detailed information can be gained aboutthe film�s durability, reparability, and pitting tendency.
Corrosion Cell TestingAll Tafel and cyclic polarizations were performed in 1L corrosionflasks. Each flask was filled with electrolyte test water and im-mersed in a stirring water bath at a temperature of 50°C. All testingwas performed using CDA110 or CDA122 copper working elec-trodes, graphite counter electrodes, and saturated calomel refer-ence electrodes. Working electrodes were rinsed in acetone and DIwater prior to immersion in the test water and then allowed to situndisturbed until a stable OCP was obtained (usually 30 to 60 min-utes). At this time, a 5.0 mg/L active dose of the inhibitor was
CTI Journal, Vol. 27, No. 132
added to the electrolyte test water. Electrochemical measurementswere made using a Princeton Applied Research Model 263APotentiostat/Galvanostat.The electrolyte test water chosen was one that resembled typicalcooling water conditions. The water contained 400 mg/L Ca and160 mg/L Mg (both as CaCO3), 396 mg/L chloride, 400 mg/L MAlkalinity, 400 mg/L sulfate (as CaCO3), and 383 mg/L Na. A typicalwater treatment formulation was added to achieve 3 mg/L PBTC, 10mg/L calcium carbonate control polymer, 7.5 mg/L orthophosphate,and 10 mg/L calcium phosphate control polymer. The pH of thewater was 8.95-9.05. Air was bubbled into the system to saturatethe water with oxygen.
Pilot System TestingThe pilot systems provided for a more realistic system for evalua-tion of inhibitors. Each unit is a 25L non-evaporatory cooling sys-tem, with heat exchange rack, corrosion rack, and chilled condenser.The supplied heat flux to the heat exchangers can be adjusted viasupplied wattage. The system contains a treatment, hardness, andalkalinity feed, along with blow-down capabilities, that allows forincreasing cycles of concentration. The operating parameters cho-sen for this testing were a flow velocity of 1.0 m/sec, bulk watertemperature of 40°C, and heat flux of 16,000 BTU/ft2/hr. Heat ex-change rods were constructed of CDA122 and admiralty brass cop-per alloys. These heat exchange surfaces were closely monitored,visibly, throughout all testing for signs of both general and local-ized corrosion. A linear polarization resistance probe, with CDA110copper electrodes, was used as the method for estimating generalcorrosion rates on inhibitors throughout all pilot testing. Once astable corrosion rate was obtained for each untreated solution, theinhibitor was then dosed into the system. The same cooling watermatrix used in the electrochemical testing was chosen for pilot sys-tem testing.
RESULTS AND DISCUSSIONIn the following sections, evidence will be presented that will helpdemonstrate how the new CCI molecule may offer a new applica-tion option that is not typically possible with the triazole molecules.This new option is the ability of the user to periodically slug dosethe inhibitor into the cooling water, without the need to maintain aresidual level of inhibitor in the water for film repair. Slug dosingmay offer numerous advantages to the user that could be preferredover the typical approach currently used with triazoles. The seriesof steps taken to identify the CCI molecule�s potential for this alter-native application method will be discussed.
Molecular Modeling Studies � Indications of aStrong Molecular Attraction to the MetalTo better understand the performance mechanism for our new in-hibitor molecule, we enlisted the aid of molecular modeling. Basedon our initial screening studies, we believed that the contributionsto inhibition from steric factors were significant. The modelingstudies were designed to examine this theory by predicting theinhibitor-surface interactions that lead to optimal molecular bind-ing at the copper surface. The studies would seek to compare theenergy-minimized binding configurations for our new inhibitor andthe triazole inhibitors, by considering the binding sites, geometry,and distance of interaction. These configurations would then beused to study the lateral interaction between the inhibitor mol-ecules as they approach the metal surface. Using the lowest en-ergy configurations and optimized coverage, a total adsorptionenergy would then be calculated for each molecule on the metalsurface. The copper surface binding energies of these configura-
tions were computed using DMol, a high quality quantum mechan-ics computer program (available from Accelrys, San Diego, CA).These calculations employed an ab initio, local density functional(LDF) method with a double numeric polarization (DNP) basis setand a Becke-Perdew (BP) functional. The two families of modeledspecies, CCI and triazole, differed only in hydrophobic substitu-ents remote from their binding functionalities. Based on both com-putational and experimental results, we hoped to draw conclusionsabout the electronic and steric nature of copper surface bindingand corrosion inhibition.The series of studies modeled the approach of selected inhibitorsto a two-layer copper atom cluster of sixteen atoms. Three poten-tial binding sites on the copper were selected: 1) over a top layercopper atom, 2) over a bottom layer copper atom, and 3) over acopper interstitial site. These three sites are illustrated in Figure 1.Three angles of approach, or configuration types, for the inhibitorwere also selected: Flat, where the plane of the molecule is parallelto the copper surface; Up, where the molecule is perpendicular tothe copper surface with the primary binding functionalities point-ing down; and S, where the molecule is perpendicular to the coppersurface with only one of the binding functionalities pointing downtoward the surface. The angles of approach relative to the coppersurface are illustrated in Figure 2. The UP-2 configuration of BTAand TTA refer to a perpendicular orientation with two nitrogenatoms pointing down. Within each molecular configuration type,multiple variations were possible due to the skewing and twistingof the non-binding substituent groups. However, the modelingprogram was able to determine the lowest energy configurationwithin each of the three types of approach and predict the orienta-tion of interaction with the copper surface. Table I summarizes theresults of the configuration modeling study of BTA, TTA, di-me-thyl-CCI, and di-propyl-CCI. Three key conclusions can be drawnfrom the molecular modeling studies.
1. BTA, TTA, and the new CCI species all exhibited reasonablystrong binding energies in generally UP configurations. Thisspatial orientation allowed the binding functionalities of eachmolecule best access to the copper surface atoms. At thesame time, the UP configurations point the relatively hydro-phobic portions of these molecules toward water.
2. All molecules showed very weak binding energies in theFLAT configuration.
3. Remote substitution had very little effect on binding ener-gies. Hence BTA and TTA showed very similar bindingenergies. The same is true for di-methyl CCI and di-propylCCI. This was perhaps the most significant finding from themodeling studies. If the electronic aspects of binding arerelatively equivalent for molecules within a structural series,then one may reasonably attribute performance differencesto steric effects. For instance, it is well accepted that theenhanced performance of TTA over BTA is due to the greatersteric shielding afforded by the methyl group.
Using the lowest energy configurations and optimized coveragedetermined from the configuration studies, another molecular mod-eling study was performed that would closely evaluate the lateralinteraction between the inhibitor molecules as they approach themetal surface. Based on this interaction, a total adsorption energywould then be calculated for each molecule onto the metal surface.Table 2 summarizes the results of the calculated adsorption ener-gies, in kJ/mole, for BTA, TTA, t-butyl benzotriazole, di-methyl-CCI, and di-propyl-CCI. The more negative the number, then thestronger the attraction. Several key conclusions can be drawn fromthe molecular modeling studies.

CTI Journal, Vol. 27, No. 1 33

CTI Journal, Vol. 27, No. 134
1. The adsorption energies for the CCI inhibitors are tremen-dously stronger than those of the triazole family. This in-creased attraction indicates that the CCI functionality mayoffer a much better �hook� for attaching to the metal surfacethan the triazole functionality.
2. The slight improvement in adsorption strength of TTA overBTA may indicate that electron donating groups can en-hance adsorption.
3. The much larger, bulky substituents weaken the adsorptionenergies by slowing the rate of molecular packing onto themetal surface. This weakening is most noticeable for di-propyl CCI and t-butyl benzotriazole. The t-butylbenzotriazole is widely claimed to form a more durable filmthan TTA, due to its more hydrophobic backbone. How-ever, it is also known that t-butyl benzotriazole takes a longeramount of time to form its film on the metal surface than TTAor BTA. It appears that the weaker adsorbances calculatedfor the inhibitors with larger substituents may be a betterindicator of the time needed for film formation than the ac-tual ability of the film to eventually prevent corrosion.
4. The calculations only accounted for the steric hindrance ofinitial adsorption onto the metal. The benefit from a morehydrophobic backbone on the formed films, from the largersubstituents, could not be considered in the calculations.
The molecular modeling studies served as a useful prelude to fur-ther testing and provided a better understanding of the electronicand steric mechanisms controlling each molecule�s interaction withthe metal surface. The studies indicated that the CCI functionalitymay offer a drastic improvement over triazoles by providing a bet-ter �hook� to attach the molecule to the metal surface. It was highlypossible that even larger, more hydrophobic substituents wouldoffer more efficient corrosion inhibitors, if this group did not be-come so large as to sterically prevent the film from forming or theinhibitor from remaining water-soluble. It appeared that by findingthe right balance between hydrophobicity and steric hindrance,the �shield� of the inhibitor could be modified to provide the bestyellow metal corrosion inhibitor possible.
Inhibitor Performance � Demonstrations of FilmDurability and ResistanceCyclic Polarizations with and without Residual Inhibitor. Thepurpose of these evaluations was to indicate any noticeable differ-ences in film durability between the formed films of the CCI andtriazole molecules. Here, the di-benzyl CCI molecule was comparedto both TTA and BTA, along with an untreated solution. By testingboth with and without the presence of any residual inhibitor forrepair, we were able to truly evaluate the formed existing films abil-ity to protect against corrosion. The working copper electrodeswere first placed into the corrosion cell, filled with the cooling towermatrix, and allowed to sit undisturbed for approximately one hour.At that time, a 5.0 mg/L dosage of active inhibitor was added to thewater. The electrodes then sat, undisturbed, overnight to allow forcomplete formation of the protective films and electrode stabiliza-tion. For the tests with inhibitor present, the electrodes were sim-ply polarized in their existing corrosion cell on the following day.For the test without residual inhibitor present, the electrodes wereremoved from their existing corrosion cells the following day, rinsedwith DI water, and placed in a separate corrosion cell that was filledwith the cooling tower water matrix, without residual inhibitor. Thefilmed electrodes were then allowed to sit one hour, to allow theOCP to stabilize, before polarizations were performed
The resulting cyclic polarization graphs, with residual inhibitorpresent, can be seen in Figure 3. All three inhibitors clearly showmore suppression in current density than the untreated solution,which indicates a much more noticeable Ebd around 200mV. Thecyclic polarization plot of the CCI treated electrode indicated a filmstability comparable to the triazoles, falling somewhere betweenthe performance of BTA and TTA. The CCI film maintained loweranodic current densities than BTA in its passive region, along witha comparable passive range (between OCP and the breakdown po-tential (Ebd)), to both triazoles. These results are an indication thatthe CCI molecule may provide a film whose protection is compa-rable to the triazole molecules, when both have residual inhibitorpresent to repair damaged film. However, when no residual inhibi-tor is present, the CCI molecule�s film clearly differentiates itself asa superior barrier to protect against corrosion, when compared tothe triazole films.The resulting cyclic polarization graphs, without residual inhibitorpresent, can be seen in Figure 4. A much more noticeable shift tohigher current densities can be seen with the TTA and BTA curves,along with a much more noticeable Ebd around 200mV. In fact, boththe triazoles� curves mirror the curve of the untreated solution,indicating that neither film was able to offer any measurable protec-tion against corrosion. In contrast, di-benzyl CCI displayed muchlower current densities throughout its anodic scan, with no notice-able decrease in its Ebd. These findings indicate that the CCI mol-ecule forms a much more durable film than the triazoles and may notneed residual inhibitor continuously present to protect against bothgeneral and localized corrosion.Tafel Polarizations without Residual Inhibitor. To more accuratelydetermine the general corrosion rates of the filmed electrodes, withno residual inhibitor present, Tafel polarizations and extrapolationswere performed. The electrodes were pre-filmed and tested in theexact same manner as the cyclic polarization graphs made in Figure4, without residual inhibitor. Figure 5 shows the Tafel plots of theleading inhibitors, along with Tolyltriazole (TTA) and an untreatedsolution. Note that the plots indicate a similar suppression of theanodic current, between three inhibitors: Di-benzyl, Di-isobutyl,and Di-propyl CCI. However, there was a more significant separa-tion between the cathodic curves, with di-isobutyl CCI displayingslightly better suppression of the cathodic reaction, followed bydi-benzyl CCI and finally di-propyl CCI. The differences in thesuppression of the cathodic reactions are believed to primarily bethe result of the variations in hydrophobicity of the shielding sub-stituents, i.e. the more hydrophobic the backbone of the film, themore that film can resist penetration and attack from electrochemi-cally active species in the cooling water. Note that all three sub-stituents suppressed both the reactions better than TTA, whichwas shifted much more to the right, similar to the untreated solu-tion. To determine the actual corrosion rates, Tafel extrapolationwas performed by the computer software on each graph. The re-sulting calculated corrosion rates, in mpy, are listed in Table 3.Note that without residual inhibitor present to repair damage, theperformance of TTA declined dramatically, while the CCI films con-tinue to successfully impede both the anodic and cathodic corro-sion reactions.Pilot Testing via Slug Dosing, without Maintained Residual In-hibitor. These evaluations were conducted to determine if theindications of film durability found with electrochemical testingcould be translated to the more realistic pilot testing systems. Thedi-benzyl CCI and TTA films were evaluated for four weeks with noresidual inhibitor present in the cooling water to repair damagedfilm. An untreated system was also evaluated for comparison.

CTI Journal, Vol. 27, No. 1 35

CTI Journal, Vol. 27, No. 136
Copper alloy CDA-122 rods and admiralty brass CDA-443 heatexchange tubes were added to the pilot systems for visual observa-tions throughout the duration of the test. LPR probes, with copperalloy CDA-110 electrodes, were used to continuously monitor thegeneral corrosion rates. By testing the inhibitors� films directly onheat exchange surfaces over time, with an actual flow of coolingwater across the surface, we hoped to better demonstrate the supe-riority of the CCI film, along with the inability of the TTA film tocontinue to protect in the absence of residual inhibitor.All testing was performed in the complex cooling water, with aninitial slug dose of 5.0 mg/L residual inhibitor. The systems werethen flushed to remove the residual inhibitor. To make the watermore aggressive to the films, a 0.20 mg/L free chlorine feed wasstarted on the twelfth day of testing. A plot of free chlorine concen-trations throughout the test is shown in Figure 6. The free chlorineconcentrations were carried up to approximately 0.15 mg/L withinfour days and then slowly increased to 0.20 mg/L by the end of thetest. The LPR probes were unable to detect corrosion rates untilthe free chlorine feed was started. At this time, the corrosion ratesbegan to increase for both the untreated and TTA treated systems.These rates throughout testing can be seen in Figure 7. Note thatthe TTA treated system reached a higher corrosion rate of 0.30 mpymore quickly than the untreated system. The di-benzyl CCI treatedsystem maintained lower corrosion rates throughout testing, neverreaching higher than 0.10 mpy. The differences in corrosion rateswere further supported by ICP analysis of the cooling water forsoluble copper concentrations. These concentrations can be seenin Figure 8. Note that the di-benzyl CCI treated system maintainedlower soluble copper concentrations throughout testing; indicat-ing that its more impeded copper corrosion reactions were result-ing in less soluble copper in the cooling water.The visual observations made of the heat exchange tubes through-out testing were even more dramatic than the measured corrosionrates. Both the untreated and TTA treated systems began to showvisible signs of corrosion on both the admiralty brass and CDA-122 heat exchangers as soon as the free chlorine concentrationsreached 0.10 mg/L. These signs of corrosion began as spotty dis-coloration of the metal surfaces, which gradually became more wide-spread, resulting in a complete discoloration of the metal surfacefrom the original copper metal surface to a completely grey surface.Photographs of the three heat exchange tubes were taken after thetest. These pictures can be seen in Figure 9. The di-benzyl CCItreated system never developed any corrosion deposition or dis-coloration on the metal surface. The heat exchangers continued tolook as good as the day they were installed into the system.Performance at Protecting Against Mild Steel Corrosion. Duringa repeat of the described test above, C1010 electrodes were addedto monitor the general corrosion rates of mild steel for two pilotsystems treated with di-benzyl and di-propyl CCI, along with anuntreated pilot system. The results indicated that the new CCImolecule may also offer some protection of mild steel. These re-sults can be seen in Figure 10. Note that while the corrosion ratesof the untreated solution climbed to above 11.0 mpy, both the CCImolecules were able to maintain much lower corrosion rates ofaround 3.1 mpy. This performance is an indication that the new CCImolecule may offer further protection of the mild steel surfaceswithin the cooling system. However, many of the commerciallyavailable mild steel corrosion inhibitors available today exhibit muchbetter performances toward mild steel, easily maintaining corrosionrates at less than 2.0 mpy. There was also an indication that the CCIfilms formed on the mild steel surfaces may not be as resistant tobreakdown as the films formed on copper alloy surfaces. Judging
from these findings, the new CCI molecule is likely not a viablealternative for common mild steel corrosion prevention programs.However, the moderate protection of mild steel afforded by the CCImolecule will provide an added benefit gained, when treating cop-per alloy surfaces with the inhibitor.Performance in the Presence of Halogenated Biocides. Recallfrom previous pilot studies8 that the free CCI molecule in solutionwas found to be unstable in the presence of high concentrations ofoxidizing biocides. When a five mg/L feed of either sodium hy-pochlorite or 1, 3-dibromo-5,5-dimethylhydantoin was added to thecooling water, both the biocide and CCI molecule were consumeddue to their reaction with each other. In addition, the CCI molecule�sformed film was not able to maintain corrosion protection at theseaccelerated levels of biocide. This attack is explained by the factthat the CCI molecule is a strong reducing agent, which is notstable in the presence of most oxidizing agents. As a result, the CCImolecule is not recommended for treatment programs utilizing ac-celerated feeds of oxidizing biocide. The triazole inhibitors appearto still be the best option for these conditions, as long as a residuallevel of inhibitor is maintained at all times. However, many watertreatment programs do not maintain such accelerated levels of oxi-dizing biocide, mainly due to mild steel corrosion and phosphonateinstability concerns. For these programs, the chosen biocide appli-cation is usually either a constant, low-level feed of oxidizing bio-cide or a non-oxidizing biocide feed. For either of these two appli-cations, the new CCI molecule appears to be a viable option as atriazole replacement. This claim was demonstrated in the previoussection, where the CCI film was successful at maintaining perfor-mance in the presence of a constant, 0.20 mg/L feed of free chlorine.To further explore the ability of the CCI film to resist breakdown inthe presence of low concentrations of oxidizing biocides, a pilottest was conducted to determine the maximum level of free chlorineallowed, before the CCI film indicated signs of breakdown. Thesetests were conducted with the simple cooling tower water, usinglinear polarization resistance corrosion measurements. In thesetests, the inhibitors were allowed to form their protective films witha 5mg/L active dosage for 16 hours. After that time, the inhibitorwas flushed from the system and a 0.5 mg/L free chlorine feed wasstarted. The resulting corrosion rates were plotted versus the mea-sured free chlorine in Figure 11. The results indicated that the TTAfilm failed as an inhibitor once free chlorine levels reached around0.1 mg/L, allowing corrosion rates to reach 0.5 mpy or higher. Thedi-benzyl CCI film maintained much lower corrosion rates with higherlevels of free chlorine. The corrosion rates for the di-benzyl CCIfilms did not begin to increase until free chlorine concentrationsreached 0.2-0.3 mg/L. Even at this point, the rate of increase wasmuch slower than with the TTA film. Corrosion rates did not reachunacceptable levels until the free chlorine concentrations climbedabove 0.3-0.4 mg/L.Once the free chlorine levels reached over 0.5 mg/L, the hypochlo-rite feeds were stopped to allow free chlorine levels to degrade toless than 0.1 mg/L. The purpose of this was to determine if corro-sion rates would drop back to the levels prior to hypochlorite addi-tion, which would indicate the remaining intactness of the protec-tive film. The TTA film continued to maintain an unacceptablecorrosion rate of 0.4 mpy with less than 0.1 mg/L free chlorine. Thisindicated potential breakdown of the film instead of penetrationattack. The CCI film�s corrosion rates dropped to 0.1 mpy with lessthan 0.1 mg/L free chlorine, indicating that the film may have re-mained more intact. These results indicate that the select CCI mol-ecules may offer more corrosion protection in systems where acontinuous chlorine feed is in operation, since these levels aregenerally around 0.2 mg/L free chlorine.

CTI Journal, Vol. 27, No. 1 37
CTI Journal, Vol. 27, No. 138
A New, Simpler Application in the FieldThe majority of water treatment programs using triazoles are carriedout by formulating the inhibitor, along with many of the other treat-ment additives, into one formulation. This practice can cause someconcern when using triazole inhibitors, due to the formulation in-stability of the product, coupled with the need to constantly main-tain a residual amount of inhibitor in the water. Additionally, test-ing for triazole in the water is a cumbersome task; therefore mostexperts rely on a tracer added to the formulation as an indicator ofhow much residual inhibitor is present in the cooling water. Muchfaith is placed in the belief that the triazole has remained stable inthe formulation and is therefore present in the cooling water at theconcentrations expected from the tracer concentration. As a resultof these concerns, some water treatment experts recommend feed-ing triazoles separately. This practice offers more control of re-sidual concentrations and inhibitor stability; although the majoritystill chooses to feed triazole as part of their formulation.The new CCI molecule offers much more freedom in water treat-ment, with a new, reliable application choice. CCI has the uniqueability to be slug dosed into the water every two, three, or even fourweeks. There is no need for additional sophisticated feeding equip-ment. The formed CCI protective film on the metal surface has theability to protect the metal from corrosion for weeks, without thepresence of a residual inhibitor. This remarkable achievement canoffer an enormous level of comfort to the user, by knowing the filmalone will protect the metal, without the concern of whether there isenough residual inhibitor present to maintain corrosion control.Other benefits of slug dosing and not keeping a residual level ofinhibitor in the cooling water include�Formulate at Neutral pH Values. The ability to slug dose the CCImolecule and remove the yellow metal inhibitor from the formula-tion will allow many formulations to be prepared at neutral pH val-ues. Due to the triazole�s traditional formulation instability, currentwater treatment formulations must be maintained at either very lowor very high values. This restriction not only can create an incon-venient hassle to the formulator, it can also pose a serious safetyconcern, as it requires the handling of concentrated acids or bases.In addition, there are generally additional shipping costs and regu-lations for the transport of substances considered to be corrosive.Most common water treatment formulations meet this corrosivedesignation because of the pH needed to keep triazole in solution.Polymer Detection without Interference. For many polymer de-tection methods, the triazole molecule positively interferes withconcentration measurements. The ability to operate without re-sidual inhibitor will allow for the most accurate polymer detection,ensuring that all treatment feeds are accurate and failure is pre-vented.Lessened Environmental Impact. Over time, as the cycle of blow-down repeats, the ability to not maintain residual inhibitor will re-sult in the discharge of less inhibitor to the environment.
CONCLUSIONSFrom the tests conducted so far, the following conclusions may bedrawn about the potential of the new CCI molecule as a replace-ment for the triazole inhibitors:
1. For general corrosion inhibition, with residual inhibitorpresent, the new CCI molecules gave comparable perfor-mances to the triazole molecules.
2. When the inhibitive films were evaluated in the absence ofinhibitor, the CCI films were extremely durable and did notindicate the need to maintain a residual concentration. In
contrast, the TTA film was found to easily break down, re-sulting in unacceptable corrosion rates and emphasizing thecrucial need to maintain residual in order to maintain perfor-mance.
3. The strength of the CCI film offers the user the ability to slugdose the inhibitor into the cooling water every few weeks,without needing to maintain a residual supply of inhibitor torepair damaged film. This type of treatment program mayoffer the user several advantages over traditional treatments,including a more convenient, more secure, less expensive,and more environmentally friendly yellow metal corrosioninhibitor.
4. When tested with residual inhibitor present, the residualCCI molecules were susceptible to degradation by high con-centrations of oxidizing biocides. For systems utilizing ac-celerated oxidizing biocide feeds, the CCI molecule is notrecommended.
5. In the presence of low levels of oxidizing biocide (0.2-0.4 mg/L), the CCI films displayed a greater resistance to attack thanthe TTA film, when tested without residual inhibitor. If thebiocide feed is paused to allow the CCI molecule to form itsprotective film, then the film has the tenacity to resist attackfrom the low level biocide feed for several weeks. In addi-tion, the CCI molecule is an ideal inhibitor for programs uti-lizing a non-oxidizing biocide treatment.
6. The overall evaluations of the new inhibitors show verypromising results; however, further testing of user applica-bility and field trials is needed to confirm the potential of theCCI molecule as a viable replacement for triazole inhibitors.
ACKNOWLEDGEMENTSThe authors would like to thank Dr. Solomon H. Jacobson, SteveRogers, and Luis Barbosa for their advanced molecular modelingstudies.
REFERENCES1. O. Hollander, R.C. May, �The Chemistry of Azole Copper
Corrosion Inhibitors in Cooling Water,� Corrosion: p. 39-44,January, 1985.
2. T.C. Breske, �The Destruction of Tolyltriazole Inhibitor byChlorination of Cooling Water,� Corrosion: p. 51-52, August,1984.
3. G.D. Hansen, J.N. Biber, �The Effect of Chlorine on the Ab-sorption on and the Inhibition of the Triazoles on Copper,�Corrosion 83: No. 282, April 1983.
4. R.P. Carr, M.J. Holden, �The Performance of Tolyltriazole inthe Presence of Sodium Hypochlorite under Simulated FieldConditions,� Corrosion 83: No. 283, April 1983.
5. D. Vanderpool, M. Killoran, R. Sergent, �Improving the Cor-rosion Inhibitor Efficiency of Tolyltriazole in the Presence ofChlorine and Bromine,� Corrosion 87: No. 157, March 1987.
6. R. Holm, D. Berg, F. Lu, D. Johnson, J. Eickmans, D. Holtkamp,A. Benninghoven, �The Impact of Chlorine on Tolyltriazoleand Butylbenzotriazole Corrosion Inhibitor Films on Cop-per,� International Water Conference: No. IWC-92-40, 1992.
7. F. Lu, N. M. Rao, B. Yang, J.E. Hoots, R.S. Budrys, �Effect ofHalogenation on Yellow Metal Corrosion: Inhibition byTriazoles,� Corrosion: p. 430, June 1994.
8. E.C. Ward, A.L. Foster, I.C. Weidner, D.E. Glaser, �Lookingfor an Alternative Yellow Metal Corrosion Inhibitor,� Corro-sion 2004: No. 04079, April 2004.

CTI Journal, Vol. 27, No. 1 39

CTI Journal, Vol. 27, No. 140
Figure 1. Molecular modeling Study - Potential CopperBinding Sites
Figure 2. Molecular Modeling Study � MolecularConfiguration Types
Table I. Lowest Energy Configurations andBinding Energies for
Table 2. Total Adsorption Energies for Corrosion Inhibitors(kJ/mole)
Figure 3. Cyclic Polarization Plots of Inhibitors with 5mg/LResidual Inhibitor
Figure 4. Cyclic Polarization Plots of Inhibitors withoutResidual Inhibitor
Figure 5. Tafel Plots of Inhibitors without Residual Inhibitor

CTI Journal, Vol. 27, No. 1 41

CTI Journal, Vol. 27, No. 142

CTI Journal, Vol. 27, No. 1 43

CTI Journal, Vol. 27, No. 144
Table 3. Tafel Extrapolated Corrosion Rates from Figure 3
Figure 6. Free Chlorine Concentrationsthroughout Testing
Figure 7. General Corrosion Rates throughout Testing
Figure 8. Soluble Copper Concentrationsthroughout Testing
Figure 9. Copper CDA-122 Heat Exchange Tube afterTesting
Figure 10. General Mild Steel Corrosion Ratesthroughout Testing
Figure 11. General Copper (CDA-110) Corrosion Rates perFree Chlorine Concentration

CTI Journal, Vol. 27, No. 1 45
CTI Journal, Vol. 27, No. 146
ABSTRACTBacteria are everywhere in the cooling water system environment.Controlling bacterial populations in the bulk water and on coolingsystem surfaces is necessary to maintain and operate the coolingsystem properly. Control of microorganisms in the field depends onthe successful application of antimicrobial agents. However, bacte-rial resistance to biocides is inevitable and irreversible, a naturalconsequence of bacterial adaptation to exposure to antimicrobials.This paper presents mechanisms of bacterial resistance to biocides,strategies of overcoming resistant cell populations, and a support-ive case history using biocides successfully against resistant bac-teria.
INTRODUCTIONA variety of detrimental and sometime injurious microorganismscan be found in industrial water systems such as cooling towers,airwashers, and HVAC systems. In these systems it is not unusualto find in the bulk water large populations of aerobic bacteria suchas Pseudomonas, Aeromonas, Klebsiella, Enterobacter,Acinetobacter, and Bacillus species. Occasionally Legionella isdetected in the bulk water of cooling towers and airwashers. Insome cases Pseudomonas species is mistaken for Legionellapneumophila in the laboratory [11]. Of 77.5% of the misidentifiedspecies, 60% are Pseudomonas aeruginosa, 10% are Pseudomo-nas fluorescens, and 7.5% are Pseudomonas putida, leading tofalse conclusions [12], errors in judgment in application treatmentsof the causative agent of biofilm build-ups, lack of proper treat-ments of reseeding of biofilms after postchlorination treatment pe-riods, and errors in treatment choices of recirculating water sys-tems. Moreover, in some cases plant personnel become ill withsymptoms resembling those of legionellosis but are not due toLegionella pneumophila. Rather, the symptoms may be inducedby a different bacterium, exposure to which is not documented wellin the literature [26,27]. One microorganism that contributes to dis-ease is Pseudomonas aeruginosa. This pathogen has been identi-fied as the fourth leading cause of nosocomial infections [5,16],and antibiotic therapy of P. aeruginosa infections has been diffi-cult because of the intrinsic resistance of the bacterium to mostfamilies of antimicrobial agents [10]. Pseudomonas aeruginosa pro-duces a repertoire of virulence factors such as alginate, extracellu-lar proteases including various alkaline protease, elastases, pilases,a rhamnolipid surfactant, and an assortment of siderophores in-cluding pyoverdin [17,20]. These factors play a role in bacterialmetabolism and growth, as well as complex virulence factors suchas adherence to host cells and tissues, biofilm formation, twitching,swarming, and swimming motilities. Presumably all the virulencefactors contribute to bacterial fitness and adaptation during an
infection.Pseudomonas aeruginosa isthe species which is quite re-sistant to antimicrobials. Forexample Diagram 1, entitledResistance Levels, lists thetypes of microorganismsfound in water systems that arenaturally resistant to antimi-crobials, and it includesPseudomonas aeruginosa. Atthe top of the list are microor-ganisms that are the most re-sistant to biocides in coolingwater systems. Their resis-
tance is due to their bacterial structures, such as bacterial sporesthat are impenetrable to nonoxidizing biocides because of the na-ture of the thick protective spore coats. Filamentous bacteria, con-taminants that enter a system typically via incoming freshwater, arealso difficult to eradicate due to the protective sheath that sur-rounds the entire cell. The sheaths make the filamentous bacteriarecalcitrant to biocidal treatments. Among the vegetative bacteria,Pseudomonas aeruginosa, in particular, is one of the most resis-tant gram-negative microorganisms. It can become resistant by avariety of mechanisms. These are discussed below.Since Pseudomonas aeruginosa strains are nutritionally quite ver-satile, they are found frequently in cooling water systems. In fact,Pseudomonas aeruginosa is usually found in almost all coolingwater systems. Pseudomonas sp., have been detected also inairwasher, reverse osmosis [8], and drinking water systems [18].They are also found in swimming pools and spas.P. aeruginosa is also important in terms of infections. In fact, it isthe most important human pathogen in the genus Pseudomonaswith respect to the numbers and the types of infections caused andto their associated morbidity and mortality [23]. Pseudomonasaeruginosa is a major cause of opportunistic infections currentlyaccounting for up to 20% of these infections [1,13,21,24]. It is re-sponsible for otitis externa and is frequently observed amonghealthy people as �swimmers� ear.� In addition, P. aeruginosa causescorneal ulcers, keratitis, meningitis, urinary tract infections, en-docarditis, periodontitis, chronic prostatitis, and osteomyelitis.Pseudomonads can be involved in pathogenesis, especially in in-dividuals who are either suffering from a primary infection or areimmunocompromised. It is well known that Pseudomonasaeruginosa establishes pathogenic biofilms in lungs of patientswith cystic fibrosis. Generally, hospital-acquired infections in pa-tients using venous or urinary catheters are preceded by the forma-tion of the biofilm on the interior wall of the catheter. Organismswithin these biofilms are more resistant to antibiotics than indi-vidual (planktonic) bacteria. The case is similar in heat exchange
Bacterial Resistance To Biocides InRecirculating Cooling Water Systemsby:DR. CHRIS L. WIATRBUCKMAN LABORATORIES, INC
DR. CHRIS L. WIATR
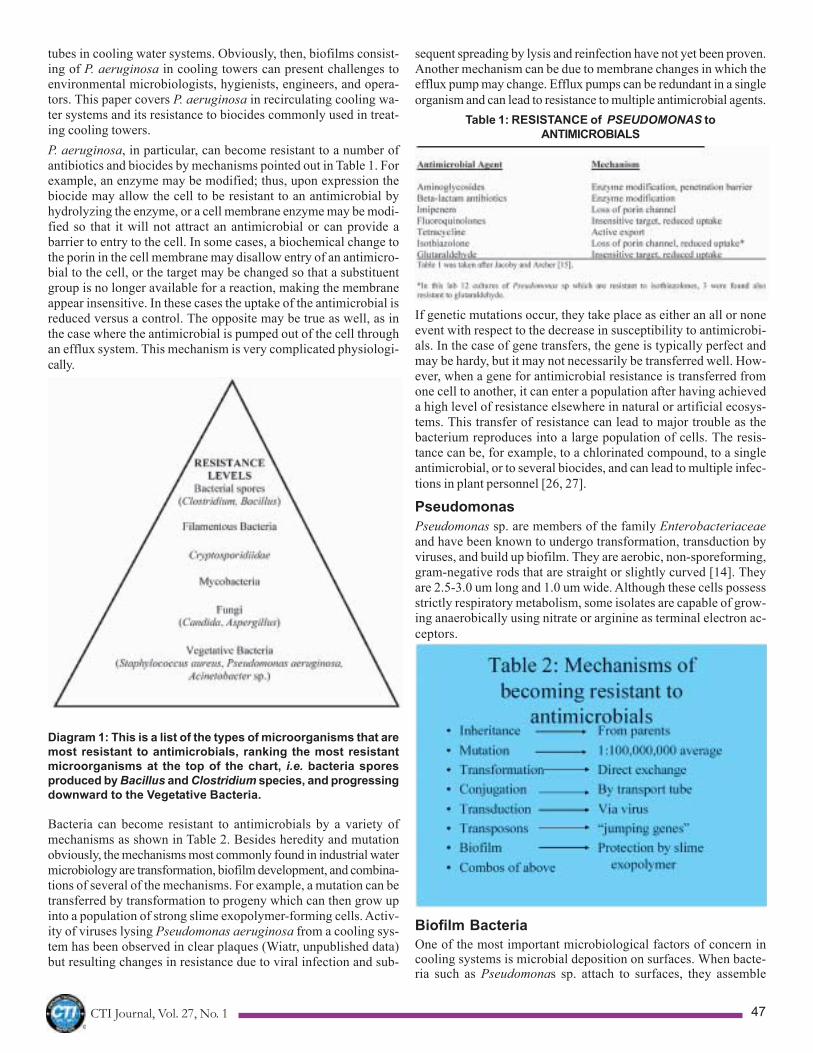
CTI Journal, Vol. 27, No. 1 47
tubes in cooling water systems. Obviously, then, biofilms consist-ing of P. aeruginosa in cooling towers can present challenges toenvironmental microbiologists, hygienists, engineers, and opera-tors. This paper covers P. aeruginosa in recirculating cooling wa-ter systems and its resistance to biocides commonly used in treat-ing cooling towers.P. aeruginosa, in particular, can become resistant to a number ofantibiotics and biocides by mechanisms pointed out in Table 1. Forexample, an enzyme may be modified; thus, upon expression thebiocide may allow the cell to be resistant to an antimicrobial byhydrolyzing the enzyme, or a cell membrane enzyme may be modi-fied so that it will not attract an antimicrobial or can provide abarrier to entry to the cell. In some cases, a biochemical change tothe porin in the cell membrane may disallow entry of an antimicro-bial to the cell, or the target may be changed so that a substituentgroup is no longer available for a reaction, making the membraneappear insensitive. In these cases the uptake of the antimicrobial isreduced versus a control. The opposite may be true as well, as inthe case where the antimicrobial is pumped out of the cell throughan efflux system. This mechanism is very complicated physiologi-cally.
Diagram 1: This is a list of the types of microorganisms that aremost resistant to antimicrobials, ranking the most resistantmicroorganisms at the top of the chart, i.e. bacteria sporesproduced by Bacillus and Clostridium species, and progressingdownward to the Vegetative Bacteria.
Bacteria can become resistant to antimicrobials by a variety ofmechanisms as shown in Table 2. Besides heredity and mutationobviously, the mechanisms most commonly found in industrial watermicrobiology are transformation, biofilm development, and combina-tions of several of the mechanisms. For example, a mutation can betransferred by transformation to progeny which can then grow upinto a population of strong slime exopolymer-forming cells. Activ-ity of viruses lysing Pseudomonas aeruginosa from a cooling sys-tem has been observed in clear plaques (Wiatr, unpublished data)but resulting changes in resistance due to viral infection and sub-
sequent spreading by lysis and reinfection have not yet been proven.Another mechanism can be due to membrane changes in which theefflux pump may change. Efflux pumps can be redundant in a singleorganism and can lead to resistance to multiple antimicrobial agents.
Table 1: RESISTANCE of PSEUDOMONAS toANTIMICROBIALS
If genetic mutations occur, they take place as either an all or noneevent with respect to the decrease in susceptibility to antimicrobi-als. In the case of gene transfers, the gene is typically perfect andmay be hardy, but it may not necessarily be transferred well. How-ever, when a gene for antimicrobial resistance is transferred fromone cell to another, it can enter a population after having achieveda high level of resistance elsewhere in natural or artificial ecosys-tems. This transfer of resistance can lead to major trouble as thebacterium reproduces into a large population of cells. The resis-tance can be, for example, to a chlorinated compound, to a singleantimicrobial, or to several biocides, and can lead to multiple infec-tions in plant personnel [26, 27].
PseudomonasPseudomonas sp. are members of the family Enterobacteriaceaeand have been known to undergo transformation, transduction byviruses, and build up biofilm. They are aerobic, non-sporeforming,gram-negative rods that are straight or slightly curved [14]. Theyare 2.5-3.0 um long and 1.0 um wide. Although these cells possessstrictly respiratory metabolism, some isolates are capable of grow-ing anaerobically using nitrate or arginine as terminal electron ac-ceptors.
Biofilm BacteriaOne of the most important microbiological factors of concern incooling systems is microbial deposition on surfaces. When bacte-ria such as Pseudomonas sp. attach to surfaces, they assemble
CTI Journal, Vol. 27, No. 148
into communities called biofilm. Some cells express genes whichdirect the synthesis of slime exopolymer. This process results in aphenotype which one observes as mucoid colonies in a Petri dishor slime masses on cooling tower, airwasher, or drinking water sur-faces. The growth of biofilms is determined by nutritional and envi-ronmental conditions in the system as well as other factors men-tioned below. Of the biofilms we have observed in cooling systems,the slime exopolymer consists of approximately 70-80% carbohy-drate and 20-30% protein (Wiatr, unpublished data).The genus of a bacterium which can grow very well into a biofilm isPseudomonas. In biofilms this bacterium is an opportunistic patho-gen which can, in the right circumstances, lead to human healthproblems. In terms of cooling water treatment, both can also indi-rectly lead to corrosion problems by metabolizing nitrogen-basedcorrosion inhibitors and releasing gaseous compounds. In coolingsystems Pseudomonas can reduce nitrite to N2, resulting in loss ofcorrosion inhibitor(s). Wild type Pseudomonas aeruginosa cellstypically start growing in a monolayer of cells, then over time growup in stacks. Both bacterial slime exopolysacharide and flagella areinvolved in the initial attachment. Once attached firmly to the sur-face (substratum), the cells secrete extracellular mucopolysaccha-ride, which can form a tenacious three-dimensional matrix. As de-velopment of the cells continue and type IV pili grow out, the cellsstack up within 8 h. Nonmotile mutants essentially cannot do this[22]. Growth continues over several days, but on the practical scalethe biofilm is evident as a fine or thin layer in 48 h, and as a fluffierfilm starting in 72 h, and growing thick in 96 h.Growth of bacteria in biofilm is favored over growth in the plank-tonic stage, resulting in the development of layers of bacterial cellsin deposits. This process is positively regulated by compoundssuch as homoserine lactone and other cell-signaling compoundsthat induce the bacteria to grow up in abbreviated �towers,� and inolder scale-up cultures or in field problems mushroom shapes canbe observed. At this stage the biofilms are mature communities andare very difficult to remove. Fluid transport through these biofilmstructures facilitates contact with microbial enzymes and promotesrapid chemical turnover and loss of corrosion protection. The en-zymes Pseudomonas sp. produces can be involved in rapid turn-over of several chemical compounds. Thus, the presence of thesebacteria growing in a biofilm community can lead to a loss of chemi-cal protection and result in corrosion problems. On occasion, growthof Pseudomonas sp. in the field can result in the incidence of dis-ease [26, 29].
Field SiteThe field test site was a steel mill in the midwestern United States.The mill brought in iron sections, which they melted down, andused the molten iron to cast steel products. The cooling towerreferred to as Cooling Tower 4, for this study, was a mechanical-draft crossflow tower. This cooling tower cooled water for heatexchangers and air compressors. The makeup water was mill water,which originated in the Ohio River. The fill was polyvinylchloride,but some wood was in the tower. Characteristics of Cooling Tower4 included exposure to sunlight and to warm, oxygenated waters.The plant did not chemically clean the cooling tower surfaces. Cool-ing water was sampled from Cooling Tower 4 and biofilm sampleswere collected from a heat exchanger. Treatment consisted of bleachthat was fed until a free residual halogen (typically 0.2 ppm as freeCl2) was reached.Controlling bacterial populations in the bulk water and on cooling
system surfaces is necessary to maintain and operate the coolingsystem properly. Control of microorganisms in the field depends onthe successful application of antimicrobial agents. Without properselection and application of the antimicrobials to a recirculatingcooling water system, bacteria and microbial slime masses build upand reduce heat transfer, retard fluid flow, collect further deposi-tion of inorganic and organic materials, as well as encourageunderdeposit corrosion.Problems of biofilms were observed in the mill of the case study,such as decreased fluid flow, loss of heat transfer, and increasedmicrobially influenced corrosion. The mill attempted to control theproblem by increasing the chlorine, but that failed. Then they useda nonoxidizing biocide, with the hope that the problem would goaway. This did not happen. The nonoxidizing biocide was slugdosed at 50 ppm product (1.50% combination of isothiazolonestwice per week), and was later increased to 80-100 ppm with little orno observable decrease in the planktonic population, based onboth dipslides and adenosine triphosphate [ATP] testing. The milldid not understand what was occurring and asked for assistance insolving the problem.This paper describes what was uncovered during the investigationof the cooling system, includes the identification of the bacterialcells involved in the actual problem, and shows the results of labo-ratory and field studies used to solve the problem. The paper alsodescribes laboratory work covering the determination of bacterialresistance as the cause of the failure for the biocides to perform andoutlines several mechanisms of bacterial resistance to antimicro-bial. Finally, strategies of overcoming resistant cell populations areprovided based on a supportive case history wherein the biocideswere tested and then successfully applied against resistant bacte-ria.
MATERIALS AND METHODSMicroorganisms. Standard pure cultures were made from singlecolony isolates of Pseudomonas aeruginosa ATCC 15442 as wellas Pseudomonas sp. isolated from biofilm sampled from the coolingtower surfaces.Media and Chemicals. Bacteria were propagated in dilute trypticsoy broth (TSB) and were enumerated on tryptone glucose beefextract agar (TGE) supplied by Difco (Detroit, MI). Additional in-gredients such as salts and anhydrous dextrose used to supple-ment TSB were from J.T. Baker (Phillipsburg, NJ). Antibiotics werefrom Sigma Chemical Co. (St. Louis, MO). Heterotrophic plate countdata obtained in the challenge study represent triplicate measure-ments of two independent experiments.For field studies, 1 liter samples of cooling water were drawn andthe microorganisms were cultured based on 0.5, 1.0 or 10 mlsubsamples. 2.0 x 0.5 ml of the sample was inoculated onto Levineeosine methylene blue medium and MacConkey medium, whichwere used for the enumeration of gram negative enteric bacteria.Pseudomonas isolation agar (PIA) supplemented with carbenicillin(200 ug/ml) was used to enumerate pseudomonads. Additional an-tibiotics were used at the following concentrations (ug/ml as indi-cated in parentheses): for Pseudomonas aeruginosa carbenicillin(250), gentamycin (10), and/or HgCl2 (10); for Pseudomonasfluorescens gentamycin (10). The media were incubated at 35 + 1 C,for 48 h., except for PIA which was incubated at 30 + 1C. for 48 h.Total coliform testing was conducted by filtering 25 ml of coolingwater through a 0.45 um membrane filter. The membrane filter wasincubated on a pad containing MF coliform medium for 24 h. Fecal

CTI Journal, Vol. 27, No. 1 49
coliforms were determined similarly on a membrane filter incubatedon a pad soaked with 1.8 ml Millipore fecal coliform medium, for 24h at 44.5 C. Blue colonies were counted as fecal coliforms. All othertests for aerobic and facultative anaerobic bacteria involved incu-bation for 48 h. at 35 C, then 24 h at 24 C. Sulfate-reducing bacteriawere grown in modified Postgate�s medium as described in refer-ence [28]. Clostridium, yeast, and mold were determined as previ-ously described [28].Isolation and Biochemical Testing. The dominant gram negativebacteria isolated from MacConkey medium were transferred totrypticase soy agar (TSA). Fifteen colonies were suspended in0.85% sterile saline and identified by the API 20E method. Thismethod involves the determination of the biochemical profiles basedon an inoculation of miniature cupules containing dehydrated sub-strates in a plasticized strip. The inoculum (McFarland 0.5 ml) andincubation were standard, and color changes were read visually.Reagents were added to some of the cupules prior to reading. Be-sides the API 20E method, predominant colonies were tested for 2-ketogluconate production from glucose by using filter sterilizedHaynes broth containing 4% potassium gluconate. At variouspoints in incubation time, 1 ml samples were drawn and tested withequal volumes of Benedict�s solution as in reference 25. In addi-tion, the organisms were restreaked on TSA and were allowed togrow for 24-48 h at 28 C for identification by gas chromatography.Gas Chromatography. Pseudomonas species was identified by gaschromatography using Microbial Identification System (MIS) soft-ware. Approximately 40 mg of grown microbial cells was harvestedand the fatty acid methyl esters from these cells were extracted byorganic solvents. The final extract was transferred to a vial for GCanalysis. The resulting chromatogram of each fatty acid methylester profile was compared with a reference library in the MIS,yielding a printout of the most probable identification of the organ-ism. The software has a dendrogram function that further allowedcomparison of the isolates in the database to each other.Biocides. The oxidizing biocide was NaOCl, which was introducedfrom a 12.5% concentration. The nonoxidizing biocides consistedof 50% 1,5-pentanedial, 20% 2,2-dibromoproprionamide, 1.15% 5-chloro-2-methyl-4-isothiazolin-3-one+0.35% 2-methyl-4-isothiazolin-3-one, 60% polyquat or poly[oxy-ethylene(dimethyleneiminio)ethyl-ene(dimethyliminio)ethylenedichloride], and a combination of the isothiazolones above andpolyquat. The concentrations of actives used in the study are givenin the figures in the Results section below.
RESULTSThe types of microbes that were found in the planktonic phase inCooling Tower 4 are listed in Table 3 below. The aerobic bacteria inthe cooling water of Tower 4 were approximately 2 X 10E8 CFU/ml.The Enterobacter count was 600 organisms/ml, and the Escheri-chia coli averaged at 10 CFU/ml. The Pseudomonas sp. wereenumerated at 3.3 X 10E3 CFU/ml. The levels of Pseudomonas sp.and pigmented bacteria in Tower 4 were approximately 2 log10greater than in other cooling towers on site. Only a small number ofsulfate-reducing bacteria (SRB) were found. No clostridia were de-tected. Yeast did not grow on tartrate-acidified PDA, but a fewmolds did. [These were Penicillium species, which are henceforthignored in this report, but after the trial, were monitored for effec-tive treatment with methylene bisthiocyanate (MTC) and 2-(thiocyanomethylthio)-benzothiazole (TCMTB) later (data notshown).]
Under the phase-contrast microscope neither Gallionella norSphaerotilus was found. A few protozoa in Tower 4 bulk watersubsamples were found and a few nonfilamentous algae were alsoobserved, but not in quantities which would indicate a problem.
Table 3: COMPOSITION OF MICROBES FOUND INCOOLING TOWER 4a
Since the total aerobic plate counts of Cooling Tower 4 were 2 X10E8 initially, we examined the cooling system and asepticallysampled biofilm from the cold well, tower fill, and deck surfacesusing a 3.5 cm X 10 cm template. In some sections of the decksurface the biofilm had considerable cyanobacteria (blue-green al-gae), making an accurate count of heterotrophic bacteria impracti-cal. However, the bacteria from the tower fill of Cooling Tower 4gave us a healthy community of cells to work with, based on a totalaerobic bacterial count of 3 X 10E9, and the cold well had an aerobicbacterial count of 5 X 10E8 CFU/ml. Moreover, the bacteria from thebiofilm samples in Tower 4 were isolated on antibiotic-containingblood agar plates and MacConkey agar. The Pseudomonas specieswere enumerated on PIA supplemented with carbenicillin (200 ug/ml) and selected off Petri dishes containing carbenicillin andgentamycin. Gentamycin alone was used in PIA to select Pseudomo-nas fluorescens, but only three colonies grew on this medium at the10E-2 dilution, representing only 300 CFU/ml. The tower fill surfacehad Pseudomonas species that were 5.48 log10 higher than thecounts in the cooling water, and the yellow pigmented bacterialcounts there were approximately 1.37 log10 higher than those in thecooling water.From the cooling tower biofilm the Pseudomonas sp. were isolatedand were stained as typical gram-negative cells, were measured as3.0 um long, 1.0 um wide, and were found motile due to polar fla-gella. Standard lab testing also found that these cells grew aerobi-cally in standard broths. The pseudomonads grew well on glucoseoxidatively and converted nitrate to nitrogen gas. They were oxi-dase positive and catalase positive. They were nutritionally quiteversatile; for example, they also grew on MacConkey agar, appear-ing as lactose nonfermenters. Their growth was optimal between 31and 35 C. They grew at 41 C, but not at 4 C.From the results of the initial standard microbiological testing, itseemed that a high level of pseudomonads were present in theculture taken from the bulk water and tower surfaces (described

CTI Journal, Vol. 27, No. 150
below). These needed to be identified under controlled laboratoryconditions. Cultures that yielded either blue-green or yellow colo-nies that were oxidase positive were considered presumptive forPseudomonas species and were tested further. Bacterial colonieswere replated on MacConkey agar in duplicate. Identification wasmade biochemically and analytically. The predominant colonies weresubjected to API20E biochemical testing for identification and formore information on the physiology and biochemistry of the bacte-ria isolated, the results of which are given in Table 4. Fifteen colo-nies were selected from MacConkey�s agar and were tested, andeach colony gave the pattern characteristic of and were, therefore,confirmed biochemically as Pseudomonas. All 15 colonies werealso confirmed as Pseudomonas aeruginosa by replating on TSAand conducting MIS-gas chromatography. Five of these were mu-coids. In addition to these results, the Pseudomonas aeruginosaisolates were found positive for pyocyanin, positive for lipase, andproduced 2-ketogluconate in Haynes broth and potassium glucon-ate. Therefore, the results are quite clear that the major slime-form-ing bacterium was Pseudomonas aeruginosa.Samples from the cold well were analyzed also for numerous bacte-ria and fungi after the tower was treated chemically. The sampleswere collected 4 h after the Cooling Tower 4 bleach treatment (NaOCl)ended, and the free residual was measured as 0.2 ppm (as Cl2). Asthe data indicate in Table 5, the heterotrophic bacterial count oraerobic bacterial count was measured at almost a million, or 930,000CFU, and a pseudomonad count of 89,000 CFU/ml in a sample drawn24 h. post treatment with 70 ppm nonoxidizing biocide (1.05 ppmactive isothiazolones). These results represent a log10 increase inpseudomonads and an aerobic bacteria count which was observedto remain virtually unchanged. The aerobic plate counts of theplanktonic bacteria in the bulk water (Table 3) typically were run-ning in the millions. The decrease to 930,000 CFU represented onlya 0.333 log10 decrease, which is not significant. (The change fromtwo million to one million approximately is taken as no change.) Inaddition, the Pseudomonas count data did not indicate a signifi-cant log10 decrease, but rather an increase which was also < 1 logchange. Neither the mucoids nor Enterobacter changed signifi-cantly, but the Escherichia coli level dropped > 1 log10. The yellowpigmented bacteria population was decreased >2 log10 (from 4.2 X10E3 to less than 4.0 X E1). No anaerobic bacteria were detectedafter dosing with a combination of chlorine and isothiazolones.Fungi were not detected and thus were of no concern. The promi-nent gram-negative bacterium was found to be Pseudomonasaeruginosa (Table 5). In addition, other gram negative bacteriawere found but were not listed in the table because they were notfound as prominent colonies in the water samples. These werePseudomonas fluorescens, and Pseudomonas sp. Gram positiveaerobic bacterial species were primarily Bacillus sp. and Strepto-coccus sp., neither of which in this case formed slime exopolymer.Five mucoids were selected off MacConkey medium, plated onTSA and identified by MIS-GC. All were found to be Pseudomonasaeruginosa.
Table 4: MICROBIOLOGICAL AND BIOCHEMICAL TESTING FORTHE IDENTIFICATION OF ENTEROBACTERIACEAE a
Table 4: The results of the microbiological and biochemical tests on15 colonies originally selected off MacConkey agar are listed aboveas either positive or negative. The pattern of the results found fromthe colonies indicated identification as Pseudomonas.
Table 5: COMPOSITION OF MICROBES FOUND IN BULK WATERFROM TOWER 4 � AFTER TREATMENTa
Based on the results, the treatment approach used did not decreaseor control P. aeruginosa, which had the capability to grow a slimeexopolymer. In some cases the slime polymer was overproduced, as

CTI Journal, Vol. 27, No. 1 51

CTI Journal, Vol. 27, No. 152
indicated by the mucoid phenotype on several types of media. Todiscover the best approach for predicting performance of antimi-crobials against these microorganisms, several nonoxidizing bio-cides were tested against a laboratory strain of Pseudomonasaeruginosa, then a wild type Pseudomonas aeruginosa from thebiofilm, and finally the best program was tested in the mill coolingsystem. In cases of strong exopolymer producers, key approacheswould be to try several of the well known biocides that are recog-nized for their capability to kill microbes and to remove biofilm,such as DBNPA, glutaraldehyde, polyquat, isothiazolones; and totry the use of synergistic biocides.An explanation of the effects of a synergistic combination of bio-cides is given in Figure 1. This figure illustrates a comparison of thekill rate of single treatments of methylene bisthiocyanate (MTC)and 2-(thiocyanomethylthiocyanobenzylthiazole) (TCMTB) and acombination of the two, called MECT, versus a mixed culture ofbacteria. The results in Figure 1 indicate that when 4.5 ppm active ofTCMTB is applied to a laboratory culture of bacteria, only 18% ofthe population is killed in 2 h., 60% in 5 h., and 80% at 8 h., notimproving beyond that percent kill. When 1.5 ppm of MTC activeingredient is used, 78% of the population is killed in 2 h., and 8 h. isrequired to achieve a 98% kill. However, when these two biocidesare combined at only 1.0 ppm total active (which is far less than the6.0 ppm total active of the combination or 3.0 ppm, which would behalf of the combination total), 100% kill is observed in 2 h., and thatkill was sustained throughout the 12 h. timecourse.The combination of MTC and TCMTB was much more effectivebecause these biocides are synergistic, meaning the combinationat a low dose was much more effective than the addition of the twobiocides at a higher dose. Synergism is the interaction in which thetotal effect is greater than the sum of the individual effects. Somecombinations of biocides have a greater synergism than others. Inthis paper the MECT shown in Figure 1 and the effect of combina-tions shown particularly in Figures 2c and 2d and 3 are the resultsof strong synergistic combinations.The following experiments were done using biocides that are com-mon in heavy industry to control bacteria and biofilm as well as asynergistic blend of biocides. The purposes of the experimentswere (a) to test the biocide currently used in the mill cooling towersfor its effects, increasing the dose to determine whether there wasbacterial resistance or only tolerance, (b) test other biocides toidentify a single nonoxidizing biocide which would be the bestantimicrobial agent in killing the problematic bacteria in the coolingwater, and if a single biocide could not be found to control themicrobial problem, then (c) to discover the synergistic combination
which would perform well both in the laboratory and in the field.First, the dose of the nonoxidizing biocide treatment in place wasincreased to determine whether the biocide would cause a bacterialkill. This treatment was actually a blend of isothiazolones that wasraised to 200 ppm dosage (as product; 3.00 ppm total activeisothiazolones). Based on data of several nonoxidizing biocides,this dose was known to decrease the level of the laboratory grownPseudomonas aeruginosa strain in 3 h. (See Figure 2a, Nonoxidiz-ing Biocide C.). However, the 200 ppm dose was ineffective in thecooling water of Tower 4. A significant effect was not observedover time. The reason for failure of the nonoxidizing biocides in thefield can be understood from the laboratory studies conducted(Figures 2a-2d).The results in Figures 2a and 2b indicate that the nonoxidizingbiocides A, D, and E performed well against the laboratory strainPseudomonas aeruginosa. In fact biocides B and C at higher dos-ages performed well at 3 h. At 7 h., biocides A and E killed the bestat all concentrations while biocides B, C, and D at their higherdosages killed well versus growth in the negative control (Figure2b). By the 7 h. sampling time point, some growback was starting tooccur for biocide D, which does happen with this biocide due to itslack of persistence. Overall, the laboratory strain P. aeruginosawas not resistant to any of these nonoxidizing biocides. All of thebiocides killed the laboratory strain, as expected. The results inFigure 2c and 2d, however, indicate that most biocides tested didnot kill the wild type Pseudomonas sp. At 3 h. only nonoxidizing-biocide E at the highest dose provided a significant kill, which wasslightly greater than a one log10 kill. Figure 2d indicates that alldosages of nonoxidizing biocide E gave a kill at 7 h. That is, thelowest dose gave nearly a 1 log kill, the second and third dosagesgave >2 log kill, while the highest dose provided a 4 log kill. Noneof the other nonoxidizing biocides affected the wild typepseudomonad. Additional work was done to rule out tolerance tothe biocides. For example, the concentration of isothiazolones wasincreased 5 and 10 times the dosages shown in Figure 2, but thesehigh levels had no effect on the cells. If the cells adapted to theisothiazolone concentration typically used and tolerated theisothiazolone chemistries, the higher dosages would have killedthe bacterial cells from the field isolates. This did not occur. Thehigh dosages were resisted by the bacterial cells, and these bacte-ria were truly resistant to this antimicrobial.The results in Figures 2a-2d were used to test whether Biocide Ewould solve the problem of the slime forming bacterium, namelyPseudomonas aeruginosa, in the field. This was done in the cool-ing tower at the steel mill, the parameters of which are given inTable 6. The recirculating cooling tower description was also givenin the introduction above.
Figure 1: The kill rate of single treatments of methylenebisthiocyanate (MTC) at 1.5 ppm, 2-
(thiocyanomethylthiocyanobenzylthiazole (TCMTB) at 4.5ppm, and a combination called MECT at 1.0 ppm active
ingredient(s) versus a mixed culture of bacteria
CTI Journal, Vol. 27, No. 1 53
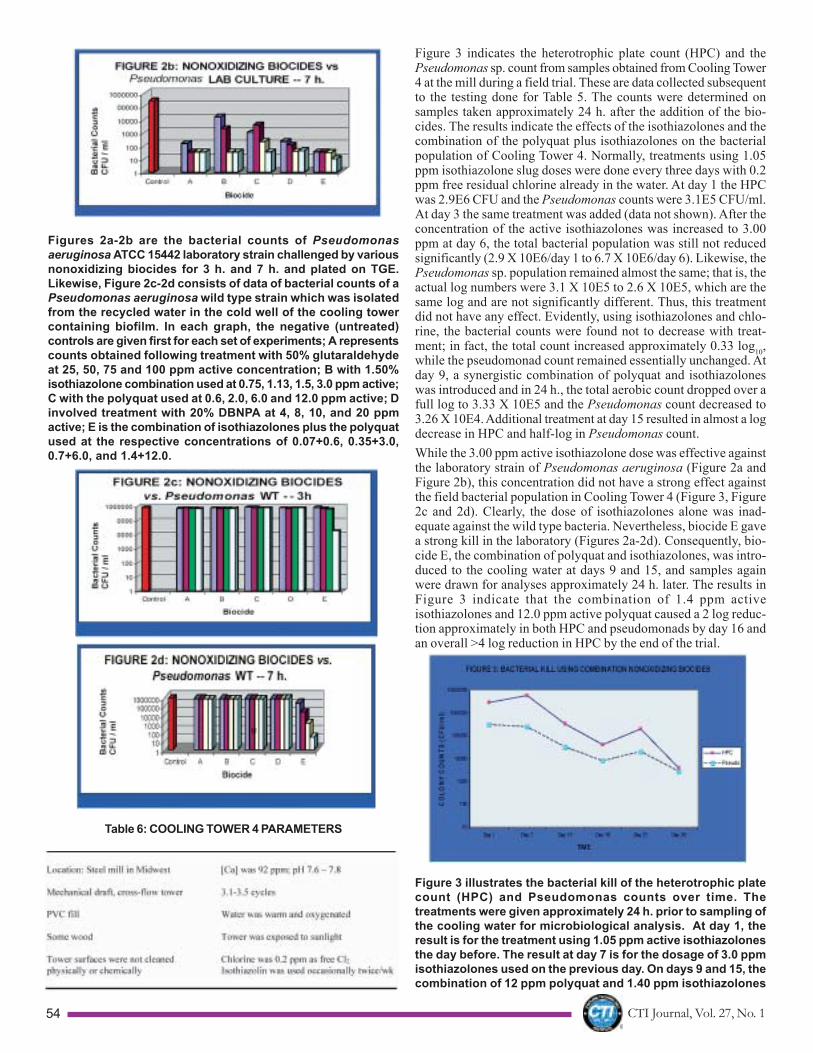
CTI Journal, Vol. 27, No. 154
Figures 2a-2b are the bacterial counts of Pseudomonasaeruginosa ATCC 15442 laboratory strain challenged by variousnonoxidizing biocides for 3 h. and 7 h. and plated on TGE.Likewise, Figure 2c-2d consists of data of bacterial counts of aPseudomonas aeruginosa wild type strain which was isolatedfrom the recycled water in the cold well of the cooling towercontaining biofilm. In each graph, the negative (untreated)controls are given first for each set of experiments; A representscounts obtained following treatment with 50% glutaraldehydeat 25, 50, 75 and 100 ppm active concentration; B with 1.50%isothiazolone combination used at 0.75, 1.13, 1.5, 3.0 ppm active;C with the polyquat used at 0.6, 2.0, 6.0 and 12.0 ppm active; Dinvolved treatment with 20% DBNPA at 4, 8, 10, and 20 ppmactive; E is the combination of isothiazolones plus the polyquatused at the respective concentrations of 0.07+0.6, 0.35+3.0,0.7+6.0, and 1.4+12.0.
Table 6: COOLING TOWER 4 PARAMETERS
Figure 3 indicates the heterotrophic plate count (HPC) and thePseudomonas sp. count from samples obtained from Cooling Tower4 at the mill during a field trial. These are data collected subsequentto the testing done for Table 5. The counts were determined onsamples taken approximately 24 h. after the addition of the bio-cides. The results indicate the effects of the isothiazolones and thecombination of the polyquat plus isothiazolones on the bacterialpopulation of Cooling Tower 4. Normally, treatments using 1.05ppm isothiazolone slug doses were done every three days with 0.2ppm free residual chlorine already in the water. At day 1 the HPCwas 2.9E6 CFU and the Pseudomonas counts were 3.1E5 CFU/ml.At day 3 the same treatment was added (data not shown). After theconcentration of the active isothiazolones was increased to 3.00ppm at day 6, the total bacterial population was still not reducedsignificantly (2.9 X 10E6/day 1 to 6.7 X 10E6/day 6). Likewise, thePseudomonas sp. population remained almost the same; that is, theactual log numbers were 3.1 X 10E5 to 2.6 X 10E5, which are thesame log and are not significantly different. Thus, this treatmentdid not have any effect. Evidently, using isothiazolones and chlo-rine, the bacterial counts were found not to decrease with treat-ment; in fact, the total count increased approximately 0.33 log10,while the pseudomonad count remained essentially unchanged. Atday 9, a synergistic combination of polyquat and isothiazoloneswas introduced and in 24 h., the total aerobic count dropped over afull log to 3.33 X 10E5 and the Pseudomonas count decreased to3.26 X 10E4. Additional treatment at day 15 resulted in almost a logdecrease in HPC and half-log in Pseudomonas count.While the 3.00 ppm active isothiazolone dose was effective againstthe laboratory strain of Pseudomonas aeruginosa (Figure 2a andFigure 2b), this concentration did not have a strong effect againstthe field bacterial population in Cooling Tower 4 (Figure 3, Figure2c and 2d). Clearly, the dose of isothiazolones alone was inad-equate against the wild type bacteria. Nevertheless, biocide E gavea strong kill in the laboratory (Figures 2a-2d). Consequently, bio-cide E, the combination of polyquat and isothiazolones, was intro-duced to the cooling water at days 9 and 15, and samples againwere drawn for analyses approximately 24 h. later. The results inFigure 3 indicate that the combination of 1.4 ppm activeisothiazolones and 12.0 ppm active polyquat caused a 2 log reduc-tion approximately in both HPC and pseudomonads by day 16 andan overall >4 log reduction in HPC by the end of the trial.
Figure 3 illustrates the bacterial kill of the heterotrophic platecount (HPC) and Pseudomonas counts over time. Thetreatments were given approximately 24 h. prior to sampling ofthe cooling water for microbiological analysis. At day 1, theresult is for the treatment using 1.05 ppm active isothiazolonesthe day before. The result at day 7 is for the dosage of 3.0 ppmisothiazolones used on the previous day. On days 9 and 15, thecombination of 12 ppm polyquat and 1.40 ppm isothiazolones

CTI Journal, Vol. 27, No. 1 55

CTI Journal, Vol. 27, No. 156
was applied. At days 23, and 26.5, the mill returned to thetreatment using 3.00 isothiazolones, and the result is given asthe data point at 27 days. At day 29, the combination of 12 ppmpolyquat and 1.4 ppm isothiazolones was dosed. Nononoxidizing biocide treatment was dosed at day 30.
After the combination polyquat+isothiazolones was fed, the treat-ment resulted in a 2 log drop in HPC and approximately one logdecrease in Pseudomonas counts. Note that we performed the clas-sical experiment for the mill by returning to their previous program,using 3.00 ppm active isothiazolones on two separate days (days23 and 26.5). As a result, the total bacterial count rose almost a log,while the Pseudomonas count increased nearly the same (Figure 3,day 27). The return to isothiazolone chemistry as the sole nonoxi-dizing biocide failed even though chlorine was present at 0.25 ppm(as free residual Cl2) at this time point. After seeing those results,the mill personnel wanted to return to the combination of polyquatplus isothiazolones. The combination resulted in a 2 log drop inHPC and approximately one log decrease in Pseudomonas counts.[ATP] test results (data not shown) gave the same pattern of in-creases and decreases with treatment over time. The ATP resultsallowed the mill to react more quickly to the challenges presentedby their cooling system in later months.
DISCUSSIONIn this study several biocides as well as a synergistic biocide com-bination were examined versus P. aeruginosa in the laboratory andthen applied to a problem case in the field. There, the mill felt thatchlorine and isothiazolone would solve their problem; however, thedata in Table 3 clearly indicate that the bacteria in Cooling Tower 4were not under control using the steel mill�s standard program ofchlorine and isothiazolone. After chlorine was increased, more slime-forming bacteria grew. When the isothiazolone concentration wasincreased in the laboratory (Figure 2c and 2d) and in the field (Fig-ure 3), the product allowed increases in Pseudomonas counts. Sev-eral single biocides failed, and only the polyquat+isothiazolonessynergistic combination succeeded both in the laboratory (Figure2 c and 2d) and in the field (Figure 3). In the field the classicalexperiment was done by shutting off the combination biocide andrestarting the isothiazolone chemistry alone; subsequently theisothiazolone-resistant bacteria again began to flourish. Afterwards,when the polyquat and isothiazolone combination was returned tothe cooling water, the synergistic combination demonstrated suc-cess; success in dropping the counts to only 3.99E4 and 2.76E3quickly demonstrated proof of the successful program. Since thetotal heterotrophic bacteria were at a level lower than the initiallevel, the combination, being a successful and appropriate biocidalproduct for this system, easily reduced the HPC and Pseudomonaspopulations quickly.It is worth discussing the original problem where the mill supervi-sion believed that they could gain control of the bacteria and bac-terial slime development by accelerating the chlorine dosage, butchlorination alone did not solve the problem. This practice was notsuccessful. In fact, it was demonstrated almost 30 years ago thatlow level chlorination does not prevent attachment of the surviv-ing viable cells and subsequent biofilm accumulation [2]. Increas-ing the chlorine level makes the biofilm rougher, thereby increasingthe roughness on the tube surface [4]. Chlorination preferentiallyremoves the extracellular polymeric substance (EPS), not the biofilmcells. (HOBr and other halogenated oxidizers do the same.) Thesurvivors are effective EPS producers [19]. Thus, increasing chlori-nation leads to an increase in EPS. In the field study, based onstandard microbiological and biochemical testing, the microorgan-isms were found to be the cause of the problem of slime in the
cooling system and the species was Pseudomonas sp. which ex-pressed the mucoid phenotype (Table 3 and Table 5). Pseudomo-nas sp. in the biofilm would have to be controlled with a nonoxidiz-ing biocide and the oxidizer would be used to help knock down theplanktonic bacteria in the bulk water.Unfortunately, single nonoxidizers that were normally effectiveagainst Pseudomonas (Figure 2a and 2b) were not effective againstthe field isolate that caused the slime problem in the cooling system(Figure 2c and Figure 2d). In the case study, the isothiazoloneswere ineffective, most likely because they were added at a lowconcentration, enabling the bacteria to become resistant over time.Then increasing doses of isothiazolones were also ineffective (Fig-ure 2c and 2d). It is also interesting that in the laboratory studysingle doses of both isothiazolones and glutaraldehyde were effec-tive against laboratory strains of Pseudomonas aeruginosa ATCC15442, but were not effective against the wild type Pseudomonasstrain found in Cooling Tower 4. In the writer�s laboratory twelvestrains of Pseudomonas and closely related Burkholderia sp. in aculture collection are resistant to isothiazolones, and three are alsoresistant to glutaraldehyde. The resistance occurs at the outer mem-brane level where both isothiazolones and glutaraldehyde attack.Isothiazolones at low levels are actively transported [6]. It is wellknown that glutaraldehyde attacks the outer membrane of the celland reacts with the amino groups within the membrane proteins.One of the mechanisms of reaction of isothiazolone chemistry withthe bacterial cell is also membrane transport dependent. A mutationin a transport protein could account for lack of transport across themembrane.The synergistic biocide employed in this study performs by a dif-ferent set of reactions. This biocide consists of a combination ofnonoxidizing biocides in a proprietary water soluble formulation.One of the actives is a polyionene which acts as a cationic surface-active detergent. The polyionene dissociates in water to give apositively charged polyquat cation and a negatively charged chlo-ride ion; then the polyquat activity makes the cell membranes andthe cell wall of a bacterium positively charged. The cations neutral-ize the negative surface charges of the bacterial cell, and the sur-face becomes positively charged because of the absorption of thecations. One of the other ingredients consists of two isothiazolin-3-ones, which in combination with the polyionene serve as a syner-gistic biocidal product [26]. With the polyquat attacking and neu-tralizing the translocation proteins within the cell membrane, theisothiazolones can penetrate the cell and perform an electrophilicattack on accessible, critical sulfhydryl groups, forming anisothiazolone-protein disulfide bond. Other reactions cause forma-tion of free radicals that cause further damage [3,7]. Eventually thecells accumulate more damage than they can repair and die.In previous studies, [26,27,29] the combination of polyquat andisothiazolones was found synergistic versus other bacteria. Thebiocide combination is formulated in a proprietary composition.
CONCLUSIONS1. Pseudomonas aeruginosa was found to grow up in the cooling
tower with Pseudomonas fluorescens and other Pseudomonasspecies.
2. An appropriate biocide program was required to maintain incheck the biocide resistant bacteria, particularly Pseudomonasspecies.
3. Chlorinating alone was insufficient, and increases in chlorina-tion led to an increase in slime-forming bacterial development.
4. A nonoxidizing biocide, such as isothiazolones at sublethaldosage, even in the presence of free residual chlorine, wasproven to be inadequate at controlling wild type bacteria in the

CTI Journal, Vol. 27, No. 1 57
CTI Journal, Vol. 27, No. 158
cooling system over time.5. A combination of nonoxidizing biocides (WSKT-10) proved to
provide the best control of the wild type microorganisms, in-cluding Pseudomonas, in the cooling tower vs. bleach alone orbleach plus one nonoxidizing biocide.
6. Reduction in planktonic bacterial count does not necessarilyindicate reduction in bacteria at surfaces in a cooling system.Bacterial resistance levels are often >3 orders of magnitudethan those displayed by planktonic bacteria of the same strain.
7. Problematic microorganisms may reside in biofilms on systemsurfaces.
The presence of EPS on cooling tower surfaces, the appearance ofatypical color surfaces, or pigmented bacteria, and atypical differ-ences between past and present performance of a cooling systemmay indicate problems caused by microbial deposition. Duringweekly inspections it is important to observe the appearance of thedeposition, since bacteria can grow up into biofilms in a short time.If found early and treated with an appropriate and effective biocideprogram, the microbial deposits are more easily controlled, andproblems caused by them can be reduced or eliminated. Whenthere is less control of the situation, one finds that the biofilmpopulations will grow more uncontrolled, leading to major prob-lems with the cooling systems and possibly even the health of theworkers [20,24,26,27,29]. The frequency of Pseudomonas, in par-ticular, in causing these problems is a subject of a different study.
REFERENCES1. Bodey, G.P., R. Bolivar, V. Fainstein, and L. Jadeja (1983) Infec-
tion caused by Pseudomonas aeruginosa. Rev. Infect. Dis.5:279-313
2. Bongers, L. H. and D.T. Burton (1977) Bromine chloride�analternative to chlorine for fouling control in condenser coolingsystems. Final Report, U.S. Environmental Protection Agency,EPA-600/7-77-053, Washington
3. Chapman, J. S. and M. A. Diehl (1995)Methylchloroisothiazolone-induced growth inhibition and le-thality in Escherichia coli. J. Appl. Microbiol. 78: 134-141
4. Characklis, W.G (1990) Microbial biofouling control in Biofilms,ed. by W.G. Characklis and K.C. Marshall. New York: John Wiley& Sons.
5. Daniels, C., C. Griffiths, B. Cowles, and J. Lam (2002) Pseudomo-nas aeruginosa O-antigen chain length is determined beforeligation to lipid A core. Environ. Microbiol. 4: 883-897
6. Diehl, M. A. and J. S. Chapman (1995) Biocide transport/asso-ciation in Pseudomonas species. In Abstracts of the AnnualMeeting of the Amer. Soc. for Microbiology. (Washington, DC),K90
7. Dimonte, D., G. Bellomo, H. Thor, P. Nicotera, and S. Orrhenius(1984) Menadione-induced cytotoxicity is associated with pro-tein thiol oxidation and alteration in intracellular calcium ho-meostasis. Archives of Biochem. and Biophys. 235: 343-350
8. Dudley, L. Y. and N. S. J. Christopher (1999) Practical experi-ences of biofouling in reverse osmosis systems, in Biofilms inthe Aquatic Environment, ed. by C. W. Keevil, A. Godfree, D.Holt, and C. Dow. Cambridge, UK, 103
9. Haker, J and James Kaper (2000) Pathogenicity islands and theevolution of microbes. Annu. Rev. Microbiol. 54. Annual Re-views, Palo Alto, CA., 653
10. Hancock, R. E. W. (1988) Resistance mechanisms in Pseudomo-nas aeruginosa and other nonfermentative gram-negative bac-teria. Clin. Infec. Dis. 1: S93-S99
11. Harrison, T.G. and A.G. Taylor (1988) Demonstration oflegionellae in clinical specimens. In A Laboratory Manual forLegionella. Ed. By T.G. Harrison and A.G. Taylor, New York:
John Wiley and Sons, pp. 109-110, 12712. Harrison, T.G. and A.G. Taylor (1988) Diagnosis of legionnaires�
disease by antibody levels. In A Laboratory Manual forLegionella. Ed. by T.G. Harrison and A.G. Taylor, New York:John Wiley and Sons, pp. 127-128, 133, 135
13. Homma, J. Y. and M. Matsuura (1991) Enhancement of nonspe-cific resistance against microbial infections with special refer-ence to Pseudomonas aeruginosa infection by chemically syn-thesized lipid A-subunit analogs. Antibiot. Chemother. 44: 203-208
14. Holt, J. G., N. R. Kreig, P. H. A. Sneath, J. T. Staley, and S. T.Williams (1994) Bergey�s Manual of Systematic Bacteriology,9th ed., pp. 93-94, 151-168. The Williams * Wilkins Co., Balti-more, MD
15. Jacoby, G.A. and G. L. Archer (1991) New mechanisms of bacte-rial resistance to antimicrobial agents. N. Engl. J. Med. 324:601-612
16. Jarvis, W.R. and W.J. Martone (1992) Predominant pathogensin hospital infections. J. Antimicrob. Chermother. 29:S19-S24
17. Lamont, I. L., P. A. Beare, U. Ochsner, A.I. Vasil, and M. L. Vasil(2002) Siderophore-mediated signaling regulates virulence fac-tor production in Pseudomonas aeruginosa. Proc. Natl. Acad.Sci. USA 99: 7072-8088
18. Makerness, C. W., J. S. Colbroune, P. L. J. Dennis, T. Rachwal,and C. W. Keevil (1999) Formation and control of coliformbiofilms in drinking water distribution systems, in MicrobialBiofilms: Formation and Control. ed. by S. P. Denyer, S. P.Gorman, and M. Susman, London, UK, 225
19. McFeters, G.A. and A. K. Camper (1985) Enumeration of indica-tor bacteria exposed to chlorine. Adv. Appl. Microbiol. 29: 177-193
20. Meyer, J. M., A. Neely, A. Stintzi, C. Georges, I.A. Holder (1996)Pyoverdin is essential for virulence of Pseudomonasaeruginosa. Infect. Immun. 64: 518-523
21. Neu, H. C. (1983) The role of Pseudomonas aeruginosa in in-fections. J. Antimicrob. Chemother. 2(suppl B):1-13
22. O�Toole, G. and R. Kolter (1998) Flagellar and twitching motilityare necessary for Pseudomonas aeruginosa biofilm develop-ment. Molecular Microbiology. 30:295-304
23. Pollack, M (2000) Pseudomonas aeruginosa, p. 1980-2003. InG. L. Mandell, J. E. Bennett, and R. Dolin (ed.), Principles andPractice of Infectious Diseases, 5th ed. Churchill Livingstone,Inc. New York, NY
24. Rhame, F.S (1980) The ecology and epidemiology of Pseudomo-nas aeruginosa. In L.D. Sabath, ed. Pseudomonas aeruginosa:The organism, diseases it causes, and their treatment. (HansHuber, Bern, Switzerland)
25. Smibert, R. M. and N. R. Krieg (1981) General Characterization,in P. Gerharhardt (ed.) Manual of Methods for General Bacteri-ology. Washington, D.C.: American Society for Microbiology.p. 419
26. Wiatr, C. L. (2002) Detection and eradication of a non-legionellalpathogen in a recirculating water system. In Abstracts of theAmer. Soc. for Microbiology Annual Meeting, (Salt Lake City,UT), Q-132
27. Wiatr, C. L. (2002) Detection and eradication of a non-legionellalpathogen in a cooling water system. The Analyst. Associationof Water Technologies, IX: 38-48
28. Wiatr, C. L. and O. X. Fedyniak (1991) Development of an obli-gate anaerobe specific biocide. J. Industrial Microbiol. 7:7-14
29. Wiatr, C. L. (2004) Bacterial resistance to antimicrobials in arecirculating water system. In Abstracts of the Industrial Mi-crobiology & Biotechnology Conference, (Anaheim, CA), P-5,p.88

CTI Journal, Vol. 27, No. 1 59

CTI Journal, Vol. 27, No. 160
byWayne MichelettiWayne C. Micheletti, Inc.
IntroductionEvaporative cooling systems are common elements in many indus-trial processes, ranging from manufacturing to power productionto refining. They are also important components in most of theHVAC systems used by large commercial, institutional and residen-tial buildings. In all of these applications, the cooling tower acts asa heat rejection device primarily by evaporating a portion of therecirculated cooling water to the surrounding atmosphere. Promot-ing evaporation by maximizing the air-water interface and maintain-ing clean heat transfer surfaces through proper water treatment aremajor objectives in the design and operation of these systems.And since evaporative cooling towers can use large amounts ofwater, discussions of potential environmental issues usually focuson water intake or wastewater discharge concerns.However, atmospheric emissions can also be important consider-ations that influence evaporative cooling tower design and opera-tion. But because cooling towers are not typically thought of as�air pollution sources�, many people may not fully understandwhich environmental regulations are relevant, which substancespotentially may be identified as �pollutants�, how emission ratesare determined, and what control measures may be required. Thispaper discusses each of these issues in a general, but comprehen-sive manner so that cooling tower designers, owners and operatorsare better informed when making site-specific environmental evalu-ations and decisions.
Relevant Environmental RegulationsIn the United States, atmospheric emissions from all stationarysources are generally regulated under the Clean Air Act (CAA) andthe umbrella of subsequent Clean Air Act Amendments (CAAA).The U.S. Environmental Protection Agency (USEPA) has the au-thority for developing, implementing and enforcing these regula-tions. In many instances, the USEPA has delegated the responsi-bility for day-to-day implementation and enforcement of the regu-lations to corresponding state, regional and tribal agencies.When the CAA was initially signed into law, the USEPA concen-trated on improving or maintaining air quality by establishing ambi-ent air standards for six criteria pollutants: carbon monoxide, lead,nitrogen oxides, ozone, particulate matter, and sulfur dioxide. Indoing so, the Agency created two types of National Ambient AirQuality Standards (NAAQS). Primary standards set limits to pro-tect public health, including the health of sensitive populations,such as asthmatics, children, and the elderly. Secondary standardsset limits to protect public welfare, including protection againstdecreased visibility and damage to animals, crops, vegetation andbuildings. The current primary and secondary NAAQS are summa-rized in Table 1.While NAAQS are not emissions limitations on sources, they usu-ally result in such limits being placed on source operations as partof a control strategy to achieve or maintain an ambient standard.Emissions standards are essentially limits on the amounts of crite-
ria pollutants that can be emittedby a point source. State or local airregulatory agencies often define apoint source based on the emissionof a threshold amount of a givenpollutant, as shown in Table 2.These agency definitions can vary(e.g., many states have lower emis-sion thresholds), but point sourcesare typically large manufacturing orproduction plants and will mostlikely include all three types of emis-sions (process, fugitive and fugi-tive process). Within a given pointsource, there may be multiple emis-
Atmospheric Emissions FromEvaporative Cooling Towers
sion points. This term should not be confused with point source,which is a regulatory distinction from area and mobile sources.Emission point refers to a single stack, vent or other discrete loca-tion of pollutant release (such as a cooling tower). Even thoughemissions limits are established for a point source, some state orlocal air regulatory agencies may require permit holders to inven-tory and report emissions from individual emission points as partof a point source permit.Emission standards can be set in several different ways. The moststraightforward emission standard is a simple limitation on the massof a pollutant per unit time (e.g., pounds of pollutant per hour).Emission concentration standards limit the mass emissions of apollutant per volume of air (e.g., grams per standard dry cubic meter).And, emission reduction standards limit the amount of current emis-sions relative to the amount of emissions before application of apollution control measure (e.g., 50% reduction).For two of the criteria pollutants (ozone and particulate matter),setting emission limits involves some special considerations.Ozone�s critical role in the severity of photochemical smog hasbeen recognized for years, placing it among the original six criteriapollutants. However, very little ozone is directly produced or re-leased by human activities. For the most part, ozone is generatedby the reaction of nitrogen oxides with hydrocarbons in the sun-light. Therefore, the NAAQS for ozone are usually translated intoemission limits for nitrogen oxides and volatile organic compounds(VOCs), two other pollutants that are directly influenced by humanactivities. With certain exceptions, VOCs include any carbon com-pound that participates in atmospheric photochemical reactions.Some of the exceptions include carbon monoxide, carbon dioxide,methane, ethane and other organic compounds that have negli-gible photochemical reactivity. Hence, VOCs should not be con-fused with a broader class of chemicals referred to as Total OrganicCompounds (TOCs) that do include methane, ethane, and severalother less photochemically-reactive substances and particulates.The NAAQS for particulate matter have evolved with time, mean-ing that corresponding emissions limits have as well. According tothe USEPA, particulate matter is the generic term for a broad classof chemically and physically diverse substances that exist as dis-crete particles (liquid droplets or solids over a wide range of sizes).Particles may be emitted directly or formed in the atmosphere. The
Wayne Micheletti

CTI Journal, Vol. 27, No. 1 61

CTI Journal, Vol. 27, No. 162
original NAAQS focused on particles with a nominal size of 25 to 45micrometers (¼m), referred to as Total Suspended Particles (TSP).In 1987, the NAAQS were revised to focus on particles with a meanaerodynamic diameter less than or equal to 10 ¼m (PM10). In 1997,the USEPA further revised the revised NAAQS by: a) retaining thePM10 values for the purpose of regulating emissions of coarse-fraction particles, and b) developing new standards for fine-frac-tion particles with a mean aerodynamic diameter less than or equalto 2.5 ¼m (PM2.5). By definition, then, any particulate matter with amean aerodynamic diameter greater than 10 ¼m would not be clas-sified as either PM10 or PM2.5, so that the emission of such particu-late matter would not be subject to either the PM10 or PM2.5 NAAQS.In addition to the original six criteria pollutants, Section 112(b) ofthe 1990 Clean Air Act Amendments listed 189 hazardous air pollut-ants (HAPs) of concern. These pollutants are generally emitted insmaller quantities than criteria pollutants, but may be reasonablyanticipated to cause cancer, developmental effects, reproductivedysfunctions, neurological disorders, inheritable gene mutationsor other chronically or acutely toxic effects in humans. HAPs in-clude some relatively common substances (such as asbestos andchlorine), as well as numerous less common substances (such as1,2-dibromo-3-chloropropane).Unlike the criteria pollutants, HAPs have no ambient air qualitystandards. Instead, the USEPA has established two different setsof limits known collectively as the National Emissions Standardsfor Hazardous Air Pollutants (NESHAP). The first set consists oftwenty-two emissions standards promulgated prior to the 1990CAAA. These standards may be pollutant specific (e.g., vinylchloride), source-category specific (e.g., benzene waste operations)or both pollutant and source-category specific (e.g., inorganic ar-senic emissions from glass manufacturing plants). The second set(promulgated under Section 112(d) of the 1990 CAAA) is known asMaximum Achievable Control Technology (MACT) Standards andis based on the best demonstrated control technologies or prac-tices in similar sources. MACT Standards are source categoryspecific and each standard covers all the HAPs emitted by thatcategory. NESHAP was the regulatory authority used by the USEPAto ban the use of chromium as a corrosion inhibitor in cooling watersystems.Aside from the Clean Air Act and subsequent amendments, whichdirectly limit atmospheric emissions from stationary sources, otherstatutes or regulatory guidance may �indirectly influence� the needfor improved emissions control or estimation. In the case of cool-ing towers, this type of indirect influence can be related to safetyand health concerns (due to the possible presence of pathogens)or to potential toxics releases.The pathogenic microorganisms that might be emitted from a cool-ing tower can be categorized into three broad groups: bacteria,parasites and viruses. In the case of cooling towers, undoubtedlythe most well known pathogens are the multiple species of bacteriacollectively known as Legionella. These bacteria tend to thrive atthe range of water temperatures frequently found in many coolingsystems. Hence, workers or other persons in the vicinity of a cool-ing tower may be exposed to drift, may inhale aerosols containingthe Legionella bacteria, and may become infected with the illness.Unfortunately, the ubiquitous nature of Legionella makes it diffi-cult to control entirely. Under the Safe Drinking Water Act (SDWA),the USEPA has established a Maximum Contaminant Level Goal(MCLG) of zero in potable water to reduce public exposure in show-ers, whirlpools and spas.3 However, specific Legionella control ineither industrial or HVAC cooling towers is not presently regulatedby federal or state agencies. Nonetheless, many organizations(including the American Society of Heating, Refrigerating and Air
Conditioning Engineers, the Association of Water Technologies,and the Cooling Technology Institute) have provided guidance onthe design, location and operation of cooling towers to reduce thepotential atmospheric emission of Legionella bacteria.The increasing use of treated municipal effluent (often referred toas reclaimed water) as makeup to cooling towers may also intro-duce pathogens that might be emitted in the drift. But regulationson this type of use for reclaimed water have been slow in develop-ing even though regulations for other reclaimed water uses (espe-cially agricultural and recreational irrigation) are more widely es-tablished. In general, the USEPA has allowed water reclamation fornonpotable water use to proceed without proposing any regula-tory standards. Similarly, few states have set any emission stan-dards or limits. In 1992, five states regulated the general industrialuse of reclaimed water: Hawaii, Nevada, Oregon, Texas and Utah;only one of these states (Hawaii) specifically regulated reclaimedwater use in cooling towers.4 Twelve years later, in 2004, ninestates regulated the industrial use of reclaimed water: California,Florida, Hawaii, New Jersey, North Carolina, Oregon, Texas, Utahand Washington. With the exception of New Jersey, each of thesestates had specific regulations for reclaimed water use in coolingtowers.5 However, most of these state regulations focus primarilyon the quality of reclaimed water used for cooling system makeuprather than on emissions from the cooling tower. But some stateregulations have established setback requirements that limit theminimum distance from the cooling tower to the property line, pre-sumably to address concerns from drift deposition.Another relevant environmental regulation is the Emergency Plan-ning and Community Right-to-Know Act (EPCRA). Under Section113 of EPCRA, the USEPA has compiled the Toxics Release Inven-tory (TRI), a publicly available database that contains informationon specific toxic chemical releases and other waste managementactivities obtained from facilities that meet established thresholdsfor manufacturing, processing or �otherwise use� of any of morethan 600 chemicals and chemical categories. Since 1987, the TRIdatabase has been updated annually by the USEPA using informa-tion submitted by manufacturing facilities.Although EPCRA does not establish pollutant emission limits, itdoes require that emissions be measured or estimated each year.Even when the total annual release (including atmospheric emis-sions) of a specific toxic chemical does not exceed the thresholdthat would require reporting for the TRI database, EPCRA doesrequire a manufacturing facility to archive measurement data andestimation calculations to demonstrate that reporting was unnec-essary. Consequently, atmospheric emissions from cooling towersthat are not regulated by permits may still need to be evaluated forTRI reporting purposes.Potential PollutantsCooling towers can have three types of atmospheric emissions:water vapor (produced by the evaporation of cooling water in con-tact with air passing through the tower), drift (liquid droplets en-trained in the exit plume from the tower) and volatile compounds(substances stripped from the cooling water by the air passingthrough the tower). Since water vapor is simply the gaseous formof H2O, this emission is not considered objectionable from a poten-tial pollutant perspective. However, depending upon atmosphericconditions and prevailing winds, the water vapor in a cooling towerplume can produce undesirable fogging or icing on nearby road-ways or structures that may be problematic.On the other hand, drift is not pure water, but is assumed to havethe same composition as the cooling water passing through thetower. As such, drift will contain any impurities that may be presentin the cooling water, making it a potential source of at least onecriteria pollutant � particulate matter. In the case of cooling tower

CTI Journal, Vol. 27, No. 1 63

CTI Journal, Vol. 27, No. 164
drift, environmental regulators have not been concerned so muchwith the number or actual size of the liquid droplets as with thesalts that might precipitate from the dissolved solids in the dropletsif the water evaporates. Depending upon site-specific industrialoperations, the drift may also contain one or more of the Section113 EPCRA compounds that must be considered when reporting ordocumenting annual emissions for the TRI database.Certain VOCs (a precursor to ozone, which is a criteria pollutant) orHAPs (defined under NESHAP) may be stripped from the coolingwater and exhausted in the cooling tower plume. For example, theUSEPA has identified cooling towers in petroleum refineries as apotential source of VOCs (primarily hydrocarbons); blast furnacewastewater cooling towers in integrated iron and steel plants as apotential source of hydrogen cyanide (HCN); and cooling towersin coke production and byproduct processing as a potential sourceof benzene. Site-specific process operations will determine theintroduction of these pollutants into the cooling water, as well asthe potential emissions from the cooling tower.
Determining Emissions RatesAtmospheric emissions from cooling towers can be either mea-sured directly or calculated by material balance and/or an emissionfactor. When measured directly, the actual pollutant of concern ismeasured at or near the point of emission, usually the top of the fanstack for mechanical-draft towers. To account for variations acrossthe exit plume and obtain meaningful results, multiple samples aretypically collected at representative locations in the cross-sectionof the plume. Consequently, accurate field measurements of emis-sions in cooling tower plumes are complex, time-consuming andcostly.Several methods for directly measuring cooling tower drift havebeen used over the past twenty years. An isokinetic method codi-fied by the Cooling Technology Institute as CTI ACT-140 is fre-quently used in estimating particulate emissions and seems to havefound some acceptance with regulatory authorities. The techniquedraws a portion of the cooling tower outlet air at the fan stack exitplane into a collection apparatus (glass bead pack followed by abackup filter) at the same speed and direction as the local velocityin the cooling tower. The tube holding the glass beads is heated sothat drift striking the beads will evaporate and deposit any dis-solved solids. After a given test period, the solids collected on theglass beads and the backup filter are recovered by an acid washand ultra-pure water rinses. The recovered solids are then ana-lyzed for certain tracer elements (such as calcium, magnesium orsodium) that are likely to be present in the cooling water at concen-trations high enough to enable a reliable calculation of the amountof liquid drift passed through the collection apparatus. An excel-lent summary of this drift measurement technique and the associ-ated calculations can be found in the technical literature.6
Keeping in mind that CTI ATC-140 was originally developed as ameans of assessing compliance with cooling tower manufacturers�drift guarantees, it�s application as a tool for estimating potentialpollutant emissions or determining compliance with environmentalpermits has certain limitations.1. First, the method does not determine the size distribution of the
drift droplets (which, in the case of particulate matter, can beimportant).
2. Second, the method cannot determine the size distribution ofthe particulate matter that is formed when the liquid phase ofthe drift droplet evaporates. This is critical because particulateemissions are regulated according to mean aerodynamic diam-eter and emissions limits only apply to particles with diametersless than or equal to 10 ¼m.
3. Third, the method cannot confirm the presence (or absence) ofpotential pollutants that do not precipitate or are not trappedin the collection apparatus when the liquid phase of the driftdroplet evaporates (notably volatile and semi-volatile com-pounds such as hydrocarbons). However, at least one state(Texas) has suggested that a technique proposed in 1981 mayhave merit for determining VOC emissions from cooling tow-ers.7, 8
Even so, CTI ATC-140 provides extremely valuable data on thetotal amount of cooling tower drift, which is important for calculat-ing meaningful estimates of atmospheric emissions.In the absence of direct measurement of a specific pollutant, anemission rate can be estimated by completing a material balancearound a cooling tower or by applying emission factors derivedfrom measurements and calculations made for similar cooling tow-ers. Of these two approaches, a site-specific material balance isusually preferable because it will more closely reflect the actualdesign and operating conditions of a given tower and should pro-vide a more accurate emission estimate. However, cooling towersmay not be adequately instrumented and owner/operators maynot have the resources for the sample collection and analysesnecessary to obtain the data for a comprehensive material balance.Therefore, pollutant emission rates are most frequently estimatedby using the simpler and more generic approach of emission fac-tors.Emission factors are numeric values that relate the release of givenpollutant (such as particulate matter) from a given emission point(such as a cooling tower) to a given operating parameter (such asthe recirculating water flow). As such, they provide a single com-posite value derived by correlating multiple source data obtainedfrom emission points that are categorically the same, but may bedesigned or operated in widely different ways. The concept ofemission factors was conceived by the California Air ResourcesBoard and, subsequently, was accepted and promoted by theUSEPA. To date, a number of emission factors have been devel-oped for cooling towers, as shown in Table 3.Although emission factors are intended to be representative, theirreliability is inherently influenced by: a) the quantity and qualityof the underlying database, and b) any associated assumptions.As one indication of reliability, the USEPA will often assign a rat-ing to a published emission factor, ranging from A (Excellent) to E(Poor). Use of emission factors that have been assigned lowerratings can produce emission estimates that are unreasonably high,causing a cooling tower owner/operator to make unnecessarychanges in order to comply with emission limits. Using the currentUSEPA emission factor to estimate particulate matter emission ratesis a good example.The USEPA emission factor for total liquid drift from a mechanical-draft cooling tower is 1.7 lb/103 gal of recirculating flow. Thisemission factor assumes a drift rate of 0.02 percent of the recircu-lating flow. Typical designs for new cooling towers specify driftrates between 0.0005 and 0.002 percent of the recirculating flow(one to two orders of magnitude lower than assumed by the USEPA).Even though the drift rate will vary from tower to tower due to drifteliminator installation and condition, and will tend to increase overthe lifetime of a tower due to drift eliminator deterioration, the as-sumption inherent in the USEPA emission factor is still likely tooverstate the actual amount of cooling tower drift.The USEPA emission factor for particulate matter (PM10) is alsolikely to overstate actual emissions because it is based, in part, onan overstated drift emission factor, as well as two other assump-tions. The first assumption is that the recirculating water has a

CTI Journal, Vol. 27, No. 1 65

CTI Journal, Vol. 27, No. 166
total dissolved solids (TDS) concentration of 11,500 ppm. Thesecond assumption is that all of the total dissolved solids con-tained in the drift droplets will precipitate to form particulate matterhaving a mean aerodynamic diameter less than or equal to 10 ¼m(PM10).The first assumption will automatically overstate total particulatematter emissions for cooling systems in which the recirculatingwater TDS concentration is less than 11,500 ppm because a lowerTDS means less salt to precipitate in the drift droplet. But this biascan be corrected by making an adjustment based on the ratio of theactual TDS concentration and the assumed TDS concentration.For instance, if the actual TDS concentration is 8,000 ppm, then theparticulate matter emission factor should be reduced to 0.014 lb/103
gal of recirculating flow. If this revised emission factor is furtheradjusted in a similar manner to reflect the actual drift rate (as guar-anteed by the tower manufacturer or as demonstrated with a fieldtest) relative to the assumed drift rate, it should be possible toreduce the value even more. For the lower TDS recirculating waterjust described, if the actual drift rate is 0.002 percent of the recircu-lating flow, a more meaningful particulate matter emission factorwould be 0.0014 lb/103 gal of recirculating flow. Hence, a coolingtower with these design and operating characteristics would havean estimated particulate matter emission rate almost fourteen timeslower than predicted by the current USEPA emission factor.The second assumption has an equally profound effect in over-stating particulate matter emissions. In the absence of field data toindicate otherwise, the USEPA has stated:�a conservatively high [Agency�s italics] PM10 emission factor canbe obtained by (a) multiplying the total liquid drift factor by thetotal dissolved solids (TDS) fraction in the circulating water, and(b) assuming that, once the water evaporates, all remaining par-ticles are within the PM10 range.�Even though the USEPA describes this method for estimating par-ticulate matter emissions as conservatively high, it has still becomethe de facto means for establishing PM10 (and, more recently, PM2.5)permit limits. But calculations based on drift droplet size distribu-tion data suggest that most of the particulate matter formed by theprecipitation of total dissolved solids when the drift liquid evapo-rates will have a mean aerodynamic diameter larger than or equal to10 ¼m.6, 13 As such, this particulate matter would not be regulatedaccording to current PM10 or PM2.5 NAAQS.Using the drift droplet size spectrum shown in Figure 1 and assum-ing a particulate matter density of 2.36 gm/cm3, the variations inparticulate matter diameter for different recirculating water TDSconcentrations can be calculated. The total amount of particulatematter that would have diameters less than 10 ¼m or 2.5 ¼m canalso be calculated, as well as a corresponding emission factor. Theresults of these calculations are shown in Tables 4 and 5.These results, clearly demonstrate the following:
· As the recirculating water TDS concentration increases, themaximum size (diameter) of a drift droplet capable of produc-ing small particulate matter will decrease. Essentially, higheramounts of dissolved solids in the recirculating water willproduce larger salt precipitates, so at greater TDS levelssmaller drift droplets will create larger particles.
· As the recirculating water TDS concentration increases, theamount of small particulate matter formed as a percentage ofthe total particulate matter formed will decrease. Again,higher amounts of dissolved solids in the recirculating wa-ter will produce larger salt precipitates.
· As the recirculating water TDS concentration decreases,the small particulate matter emission factor decreases. Even
though the percentage amount of small particulate matterformed in cooling systems with low TDS recirculating wateris greater than in cooling systems with high TDS recirculat-ing water, the total amount of dissolved solids available inthe drift is so much less that the overall amount of smallparticulate matter produced and the associated emission fac-tor are lower.
· Most importantly, the calculated PM10 and PM2.5 emissionfactors shown in Tables 4 and 5 are at least an order ofmagnitude less than the small particulate emissions thatwould be calculated using the USEPA�s conservatively highmethod. And even when the current USEPA particulate emis-sion factor is adjusted for changes in drift rate and recircu-lating water TDS concentration, the calculated PM10 andPM2.5 emission factors shown in Tables 4 and 5 are still no-ticeably less (see Figure 2). The fatal flaw in the USEPA�smethod is the assumption that all of the total dissolved sol-ids in the drift become PM10 (or PM2.5) particulate matter.
Environmental regulators continue to rely on the USEPA�s methodfor estimating PM10 and PM2.5 emissions, and cooling tower suppli-ers and owner/operators continue to accept the results when mak-ing design and operating decisions, even though there are techni-cally sound reasons to believe this approach grossly overstatesthe actual small particulate matter emissions. In many ways, thisillustrates one of the greatest dangers in using any generic emis-sion factor � the quality of the underlying data and assumptionsused to generate the emission factor are rarely understood or ad-justed to more accurately represent actual site-specific conditions.
Emissions Control MeasuresAtmospheric emissions from cooling towers can be controlled intwo ways: 1) reduce the amount of drift (thereby reducing theamounts of any potential pollutants that may be present in theliquid drift droplets), and 2) reduce the concentrations of any po-tential pollutants in the recirculating water (consequently reducingthe amounts of these components that might be discharged withthe drift or volatilized in the cooling tower).Drift reduction can be accomplished by properly installing andmaintaining high-efficiency drift eliminators. Although the USEPAparticulate matter emission factor is based on a drift rate of 0.02%of the recirculating water flow, much lower drift rates on the orderof 0.0005% � 0.002% can be achieved. Care should also be taken toavoid overloading drift eliminators. Overloading can occur whenthe drift eliminators are installed too close to the water distributionsystem or when leaks in the distribution lines or a broken nozzleintroduce too much water in a given region.Quality control of the recirculating cooling water is essentially amatter of operations and good housekeeping. By operating at lowcycles of concentration, constituents present in the makeup wateror blown into the cooling tower will be purged from the systemmore readily. Aside from switching to a higher-quality (lower TDS)makeup water, this offers the best means for limiting the concentra-tion of total dissolved solids in the drift and the particulate matteremissions from the tower. In situations with limited water resources,operation at higher cycles of concentration with makeup and/orsidestream water treatment has been suggested.14 But the increasedcapital and operating expenses of these options would require care-ful technical and economic analyses to fully evaluate the site-spe-cific suitability.Good housekeeping involves consistent and proper treatment ofthe recirculating water (such as biocide addition to control microor-ganisms), as well as regular and adequate monitoring to detect andrepair process equipment leaks that might introduce potential pol-
CTI Journal, Vol. 27, No. 1 67

CTI Journal, Vol. 27, No. 168
lutants (such as hydrocarbons). Unfortunately, good housekeep-ing is rarely appreciated as an emissions control measure until apermit violation is identified and is frequently postponed in thepursuit of production targets.
ConclusionsAtmospheric emissions from cooling towers are becoming an in-creasingly important factor in the design and operation of indus-trial and commercial cooling systems. A number of environmentalregulations may limit the emission of a variety of constituents,including particulate matter, volatile organic compounds and haz-ardous air pollutants. Directly measuring these atmospheric emis-sions is complex, time-consuming and costly. Therefore, genericemission factors based on certain cooling system characteristics orprocess operating conditions are commonly used to determine com-pliance with emission limits. However, estimates made using emis-sion factors may not accurately predict actual emissions if the un-derlying data are limited or poor quality, or if the basic assumptionsdo not reflect site-specific conditions. The current USEPA emis-sion factor for determining small particulate matter emissions fromcooling towers is a good example of a �conservatively high� methodthat will generate overstated results. The most common measuresfor controlling atmospheric emissions from cooling towers includethe proper installation and maintenance of high-efficiency drift elimi-nators and good control of the recirculating water quality. How-ever, implementing any measure to reduce the emission of a spe-cific pollutant should be based on a reliable determination of the
actual existing emission rate and the anticipated emission rate re-duction. Otherwise, an owner/operator may agree to environmen-tal permit limits or undertake cooling tower design or operatingchanges that could be unnecessary and expensive.
References1. U.S. Environmental Protection Agency web page http://
www.epa.gov/air/criteria.html.2. U.S. Environmental Protection Agency. Handbook for Criteria
Pollutant Inventory Development: A Beginner�s Guide for Pointand Area Sources, EPA-454/R-99-037, Office of Air Quality Plan-ning and Standards, Research Triangle Park, NC (September1999).
3. U.S. Environmental Protection Agency. Legionella: DrinkingWater Fact Sheet, Office of Water (September 2002).
4. U.S. Environmental Protection Agency and U.S. Agency forInternational Development. Guidelines for Water Reuse, EPA/625/R-92/004, Office of Water, Washington, DC (September1992).
5. U.S. Environmental Protection Agency and U.S. Agency forInternational Development. Guidelines for Water Reuse, EPA/625/R-04/108, Office of Water, Washington, DC (September2004).
6. Hennon, K.W., and D.E. Wheeler. �Cooling Tower EmissionsTesting Using the Cooling Technology Institute Test Code �CTI ATC-140�, CTI Journal, Vol. 25, No. 1, pp. 22-28.
7. Vernon, W.D., et.al. �A Device for Measuring Volatile Organic-Carbon Emissions from Cooling-Tower Wa-ter�, Journal of the Air Pollution ControlAssociation, Vol. 31, No. 12 (December 1981),pp. 1280-1282.
8. Texas Natural Resource Conservation Com-mittee. Air Quality Permit Technical Guidancefor Chemical Sources: Cooling Towers, DraftRG-108, Air Permits Division, Austin, TX (Feb-ruary 2001).
9. U.S. Environmental Protection Agency. Com-pilation of Air Pollutant Emission Factors (AP-42, 5th Edition, Vol. 1), Section 13.4 � Wet Cool-ing Towers (January 1995).
10. U.S. Environmental Protection Agency. Com-pilation of Air Pollutant Emission Factors (AP-42, 5th Edition, Vol. 1), Section 5.1 � PetroleumRefining (January 1995).
11. U.S. Environmental Protection Agency. Na-tional Emission Standards for Hazardous AirPollutants (NESHAP) for Integrated Iron andSteel Plants � Background Information for Pro-posed Standards, Final Report, EPA-453/R-01-005, Section 3 (January 2001).
12. Pacific Environmental Services, Inc. Back-ground Report for AP-42 Section 12.2 � CokeProduction, prepared for the U.S. Environmen-tal Protection Agency OAQPS/TSD/EIB, Re-search Triangle Park, NC.
13. Reisman, J. and G. Frisbie. �Calculating Real-istic PM10 Emissions from Cooling Towers�,Environmental Progress, Vol. 21, No. 2 (July2002), pp. 127-130.
14. Baines, S. �How A Power Plant Air Permit CanImpact the Cooling Tower Circulating WaterTreatment System Design�, Presented at the63rd Annual International Water Conference,Pittsburgh, PA (October 20-24, 2002).
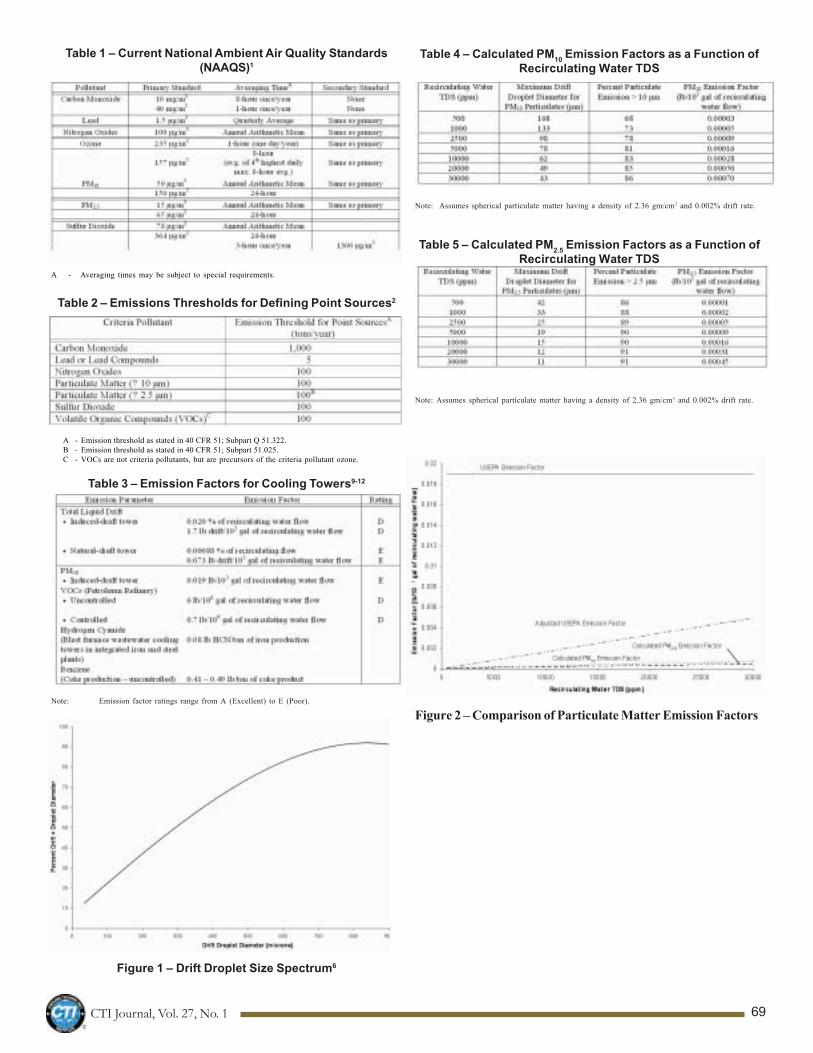
CTI Journal, Vol. 27, No. 1 69
Figure 2 � Comparison of Particulate Matter Emission Factors
Table 1 � Current National Ambient Air Quality Standards(NAAQS)1
A - Averaging times may be subject to special requirements.
Table 2 � Emissions Thresholds for Defining Point Sources2
A - Emission threshold as stated in 40 CFR 51; Subpart Q 51.322.B - Emission threshold as stated in 40 CFR 51; Subpart 51.025.C - VOCs are not criteria pollutants, but are precursors of the criteria pollutant ozone.
Table 3 � Emission Factors for Cooling Towers9-12
Note: Emission factor ratings range from A (Excellent) to E (Poor).
Figure 1 � Drift Droplet Size Spectrum6
Table 4 � Calculated PM10 Emission Factors as a Function ofRecirculating Water TDS
Note: Assumes spherical particulate matter having a density of 2.36 gm/cm3 and 0.002% drift rate.
Table 5 � Calculated PM2.5 Emission Factors as a Function ofRecirculating Water TDS
Note: Assumes spherical particulate matter having a density of 2.36 gm/cm3 and 0.002% drift rate.

CTI Journal, Vol. 27, No. 170
CTI Journal, Vol. 27, No. 1 71

CTI Journal, Vol. 27, No. 172

CTI Journal, Vol. 27, No. 1 73

CTI Journal, Vol. 27, No. 174
As stated in its open-ing paragraph, CTIStandard 201... �setsforth a programwhereby the CoolingTechnology Institutewill certify that allmodels of a line ofwater cooling towersoffered for sale by aspecific Manufac-turer will performthermally in accor-dance with the
Baltimore Aircoil Company, Inc. FXV Closed Circuit Cooling Tower Line of
CTI Certified Cooling TowersCTI Certification Validation Number 98-11-09Models with One Air Inlet Side and One Coil
FXV-L421GM FXV-L432HM FXV-L443JM FXV-L641KM FXV-LQ640KM FXV-L663KM
FXV-L421 FXV-L432 FXV-L443 FXV-L641 FXV-LQ640 FXV-L663
FXV-421 FXV-432 FXV-443 FXV-641MM FXV-Q640MM FXV-663MM
FXV-421KM FXV-432LM FXV-443MM FXV-641 FXV-Q640 FXV-663
FXV-641OM FXV-Q640OM FXV-663OM
FXV-L422GM FXV-L433HM FXV-L444JM
FXV-L422 FXV-L433 FXV-L444KM FXV-L642KM FXV-LQ641KM FXV-L664KM
FXV-422 FXV-433 FXV-L444 FXV-L642 FXV-LQ641LM FXV-L664LM
FXV-422KM FXV-433-LM FXV-444 FXV-642MM FXV-LQ641 FXV-L664
FXV-642 FXV-Q641-NM FXV-664NM
FXV-L423GM FXV-L434HM FXV-LQ440JM FXV-642OM FXV-Q641 FXV-664
FXV-L423 FXV-L434JM FXV-LQ440
FXV-423 FXV-L434 FXV-Q440 FXV-L643KM FXV-L661KM FXV-LQ660KM
FXV-423KM FXV-434 FXV-Q440MM FXV-L643 FXV-L661 FXV-LQ660
FXV-643MM FXV-661MM FXV-Q660MM
FXV-L424GM FXV-L441JM FXV-LQ441JM FXV-643 FXV-661 FXV-Q660
FXV-L424HM FXV-L441 FXV-LQ441KM FXV-643OM FXV-661OM FXV-Q660OM
FXV-L424 FXV-441 FXV-LQ441
FXV-424 FXV-441MM FXV-Q441 FXV-L644KM FXV-L662KM FXV-LQ661KM
FXV-L644LM FXV-L662 FXV-LQ661LM
FXV-L431HM FXV-L442JM FXV-L644 FXV-662MM FXV-LQ661
FXV-L431 FXV-L442 FXV-644NM FXV-662 FXV-Q661NM
FXV-431 FXV-442 FXV-644 FXV-662OM FXV-Q661
FXV-431LM FXV-442MM
Models with Two Air Inlet Sides and Two CoilsFXV-288-31M FXV-288-41M FXV-288-1QM FXV-364-31N FXV-364-41N FXV-364-1QN
FXV-288-31N FXV-288-41N FXV-288-1QN FXV-364-31O FXV-364-41O FXV-364-1QO
FXV-288-31O FXV-288-41O FXV-288-1QO FXV-364-31P FXV-364-41P FXV-364-1QP
FXV-288-31P FXV-288-41P FXV-288-1QP FXV-364-31Q FXV-364-41Q FXV-364-1QQ
FXV-288-31Q FXV-288-41Q FXV-288-1QQ FXV-364-31R FXV-364-41R FXV-364-1QR
FXV-288-31R FXV-288-41R FXV-288-1QR FXV-364-31S FXV-364-41S FXV-364-1QS
FXV Closed Circuit Cooling TowersOptional Accessories and Constructions � Certification Status
Construction Options Suffix CTICertified Capacity Adjustment (Note 1) Required
Cleanable Tube Coil A Yes Note 2
Heavy Duty Coil S Yes Note 2
Low Sound Fan Q Yes Note 3
Internal Access Package none Yes Note 4
Not CTI Certified X No Note 5
Note:
1. Typically no suffix is used for an accessory or modification that does not affectcapacity.
2. Construction does not affect thermal capacity, but does increase Process FluidPressure Drop as noted in BAC Selection Software.
3. Low Sound fans on models with Two Air Inlet Side and Two coils incur a capac-ity reduction of 2% relative to the same model with a standard fan.
4. Internal Access Package on the models with One Air Inlet Side and One Coilincur a capacity reduction of 1.8%, depending on the model and operating con-ditions. Refer to BAC Selection Software to determine the effect on a specificmodel at a specific operating condition.
5. This suffix is affixed to model numbers of units that are not CTI Certified, dueeither to application or product accessories or modifications to the tower.
6. The CTI thermal performance certification applies only to units with water as theprocess fluid.
Cooling Towers Certified by CTI Under STD-201
Manufacturer�s published ratings...� By the purchase of a �certified� model,the User has assurance that the tower will perform as specified, provided thatits circulating water is no more than acceptably contaminated-and that its airsupply is ample and unobstructed. Either that model, or one of its closedesign family members, will have been thoroughly tested by the single CTI-licensed testing agency for Certification and found to perform as claimed bythe Manufacturer.
CTI Certification under STD-201 is limited to thermal operating conditionswith entering wet bulb temperatures between 12.8°C and 32.2°C (55°F to90°F), a maximum process fluid temperature of 51.7°C (125°F), a coolingrange of 2.2°C (4°F) or greater, and a cooling approach of 2.8°C (5°F) orgreater. The manufacturer may set more restrictive limits if desired orpublish less restrictive limits if the CTI limits are clearly defined and notedin the publication.
Following is a list of cooling tower models currently certified under STD-201. They are part of product lines offered by Baltimore Aircoil Company,Inc.; Delta Cooling Towers, Inc.; Evapco, Inc.; Fabrica Mexicana De Torres,S.A.; GEA Polacel; Imeco, div of York International; Ltd; Kyung In Machin-ery Company, Ltd.; Liang Chi Industry Company, Ltd.; Mesan Cooling Tower,Ltd; Ryowo (Holding) Company, Ltd; SPX Cooling Technologies; TowerTech, Inc; The Trane Company and Zhejiang Jinling Refrigeration Engi-neering Company who are committed to the manufacture and installation offull-performance towers. In competition with each other, these manufac-turers benefit from knowing that they each achieve their published perfor-mance capability. They are, therefore, free to distinguish themselves throughdesign excellence and concern for the User�s operational safety and conve-nience.
Those Manufacturers who have not yet chosen to certify their product linesare invited to do so at the earliest opportunity. Contact Virginia A. Manser,Cooling Technology Institute, PO Box 73383, Houston, TX 77273 forfurther information.
Baltimore Aircoil Company, Inc.FXT Line of CTI Certified Cooling Towers
CTI Certification Validation Number 92-11-01
FXT-6 FXT-26-CM FXT-58-EM FXT-160-HMFXT-7.5 FXT-26 FXT-58-FM FXT-160FXT-7.5-CM FXT-30 FXT-58 FXT-175
FXT-33 FXT-68 FXT-200FXT-11FXT-11-CM FXT-38 FXT-74-FM FXT-216-JMFXT-11-DM FXT-42 FXT-74 FXT-216
FXT-47 FXT-87 FXT-250FXT-16 FXT-47-HM FXT-99 FXT-268FXT-16-CMFXT-20 FXT-115-GMFXT-20-EM FXT-115
FXT-130FXT-142
1. Multiple cell models of the single cell models above are also available but notlisted.
2. Towers which include the suffix �X� added to the models above (e.g. FXT-11X)are not CTI Certified, due either to application, product accessories or modifica-tions.

CTI Journal, Vol. 27, No. 1 75
Baltimore Aircoil Company, Inc.Series V Closed Circuit Cooling TowerLine of CTI Certified Cooling Towers
VF1 Models, CTI Certification Validation Number 00-11-10
VF1-009-12E VF1-036-21J VF1-096-12N VF1-192-12N VF1-144-12P VF1-288-11PVF1-009-12F VF1-036-21K VF1-096-12O VF1-192-12O VF1-144-12Q VF1-288-11QVF1-009-12G VF1-036-21L VF1-096-12P VF1-192-12P VF1-144-12R VF1-288-11RVF1-009-22E VF1-036-22J VF1-096-21O VF1-192-21O VF1-144-21P VF1-288-12PVF1-009-22F VF1-036-22K VF1-096-21P VF1-192-21P VF1-144-21Q VF1-288-12QVF1-009-22G VF1-036-22L VF1-096-21Q VF1-192-21Q VF1-144-21R VF1-288-12RVF1-009-32E VF1-036-31J VF1-096-22O VF1-192-22O VF1-144-22P VF1-288-21PVF1-009-32F VF1-036-31K VF1-096-22P VF1-192-22P VF1-144-22Q VF1-288-21QVF1-009-32G VF1-036-31L VF1-096-22Q VF1-192-22Q VF1-144-22R VF1-288-21RVF1-009-42E VF1-036-32J VF1-096-31O VF1-192-31O VF1-144-31P VF1-288-22PVF1-009-42F VF1-036-32K VF1-096-31P VF1-192-31P VF1-144-31Q VF1-288-22QVF1-009-42G VF1-036-32L VF1-096-31Q VF1-192-31Q VF1-144-31R VF1-288-22R
VF1-036-41J VF1-096-32O VF1-192-32O VF1-144-32P VF1-288-31PVF1-018-02G VF1-036-41K VF1-096-32P VF1-192-32P VF1-144-32Q VF1-288-31QVF1-018-02H VF1-036-41L VF1-096-32Q VF1-192-32Q VF1-144-32R VF1-288-31RVF1-018-12F VF1-036-42J VF1-096-41O VF1-192-41O VF1-144-41P VF1-288-32PVF1-018-12G VF1-036-42K VF1-096-41P VF1-192-41P VF1-144-41Q VF1-288-32QVF1-018-12H VF1-036-42L VF1-096-41Q VF1-192-41Q VF1-144-41R VF1-288-32RVF1-018-22G VF1-036-51J VF1-096-42O VF1-192-42O VF1-144-42P VF1-288-41PVF1-018-22H VF1-036-51K VF1-096-42P VF1-192-42P VF1-144-42Q VF1-288-41QVF1-018-22J VF1-036-51L VF1-096-42Q VF1-192-42Q VF1-144-42R VF1-288-41RVF1-018-32G VF1-096-51P VF1-192-51P VF1-144-51P VF1-288-42PVF1-018-32H VF1-048-21L VF1-096-51Q VF1-192-51Q VF1-144-51Q VF1-288-42QVF1-018-32J VF1-048-21M VF1-144-51R VF1-288-42RVF1-018-42G VF1-048-22L VF1-144N-21P VF1-288N-21P VF1-288-51PVF1-018-42H VF1-048-22M VF1-144N-21Q VF1-288N-21Q VF1-216-21N VF1-288-51QVF1-018-42J VF1-048-31M VF1-144N-21R VF1-288N-21R VF1-216-21O VF1-288-51R
VF1-048-31N VF1-144N-22P VF1-288N-22P VF1-216-21PVF1-027-21H VF1-048-32M VF1-144N-22Q VF1-288N-22Q VF1-216-22N VF1-432-21NVF1-027-21J VF1-048-32N VF1-144N-22R VF1-288N-22R VF1-216-22O VF1-432-21OVF1-027-21K VF1-048-41M VF1-144N-31P VF1-288N-31P VF1-216-22P VF1-432-21PVF1-027-22H VF1-048-41N VF1-144N-31Q VF1-288N-31Q VF1-216-31N VF1-432-22NVF1-027-22J VF1-048-42M VF1-144N-31R VF1-288N-31R VF1-216-31O VF1-432-22OVF1-027-22K VF1-048-42N VF1-144N-32P VF1-288N-32P VF1-216-31P VF1-432-22PVF1-027-31H VF1-048-51M VF1-144N-32Q VF1-288N-32Q VF1-216-41O VF1-432-31NVF1-027-31J VF1-048-51N VF1-144N-32R VF1-288N-32R VF1-216-41P VF1-432-31OVF1-027-31K VF1-144N-41P VF1-288N-41P VF1-216-41Q VF1-432-31PVF1-027-32H VF1-072-21M VF1-144N-41Q VF1-288N-41Q VF1-216-51O VF1-432-41OVF1-027-32J VF1-072-21N VF1-144N-41R VF1-288N-41R VF1-216-51P VF1-432-41PVF1-027-32K VF1-072-21O VF1-144N-51P VF1-288N-51P VF1-216-51Q VF1-432-41QVF1-027-41H VF1-072-22M VF1-144N-51Q VF1-288N-51Q VF1-432-51OVF1-027-41J VF1-072-22N VF1-144N-51R VF1-288N-51R VF1-432-51PVF1-027-41K VF1-072-22O VF1-432-51QVF1-027-42H VF1-072-31MVF1-027-42J VF1-072-31NVF1-027-42K VF1-072-31OVF1-027-51H VF1-072-32MVF1-027-51J VF1-072-32NVF1-027-51K VF1-072-32OVF1-027-52H VF1-072-41MVF1-027-52J VF1-072-41NVF1-027-52K VF1-072-41O
VF1-072-51NVF1-072-51O
Baltimore Aircoil Company, Inc.Series V Closed Circuit Cooling TowerLine of CTI Certified Cooling Towers
VF1 Models, CTI Certification Validation Number 00-11-10Revised November 2002
Option Suffix CTI Capacity Adjustment(Note 1) Certified Required
Capacity Control Dampers D Yes YesTapered Discharge Hood R Yes YesPositive Closure Damper Hood -Tapered H Yes YesPositive Closure Damper Hood - Straight W Yes NoDischarge Sound Attenuation Z Yes YesCleanable Tube Coil A Yes See Note 2Cleanable Header Coil none Yes NoHeavy Duty Coil S Yes See Note 2ASME Code Coil none Yes See Note 3Unit not CTI Certified (Note 4 & 5) X No
Note:1. Typically no suffix is used for an accessory or modification that does not affect
capacity.2. Construction does not affect thermal capacity, but does increase Process Fluid
Pressure Drop as noted in Selection Software.3. ASME Code construction per se does not affect capacity or pressure drop, but
often Heavy Duty Coil construction is specified as well which does affectpressure drop.
4. This suffix is affixed to model numbers of units that are not CTI Certified, dueeither to application or product accessories or modifications.
5. The CTI thermal performance certification applies only to units with water asthe process fluid.
Baltimore Aircoil Company, Inc.Series V Closed Circuit Cooling TowerLine of CTI Certified Cooling Towers
VFL Models, CTI Certification Validation Number 00-11-10
VFL-012-02F VFL-036-12K VFL-048-12K VFL-072-21M VFL-096-21NVFL-012-02G VFL-036-12L VFL-048-12L VFL-072-21N VFL-096-21OVFL-012-02H VFL-036-12M VFL-048-12M VFL-072-21O VFL-096-21PVFL-012-12F VFL-036-21J VFL-048-21K VFL-072-21P VFL-096-22NVFL-012-12G VFL-036-21K VFL-048-21L VFL-072-22M VFL-096-22OVFL-012-12H VFL-036-21L VFL-048-21M VFL-072-22N VFL-096-22PVFL-012-22F VFL-036-21M VFL-048-22K VFL-072-22O VFL-096-31NVFL-012-22G VFL-036-22J VFL-048-22L VFL-072-22P VFL-096-31OVFL-012-22H VFL-036-22K VFL-048-22M VFL-072-31N VFL-096-31PVFL-012-32F VFL-036-22L VFL-048-31K VFL-072-31O VFL-096-32NVFL-012-32G VFL-036-22M VFL-048-31L VFL-072-31P VFL-096-32OVFL-012-32H VFL-036-31K VFL-048-31M VFL-072-32N VFL-096-32P
VFL-036-31L VFL-048-32K VFL-072-32O VFL-096-41NVFL-024-12H VFL-036-31M VFL-048-32L VFL-072-32P VFL-096-41OVFL-024-22H VFL-036-32K VFL-048-32M VFL-072-41N VFL-096-41PVFL-024-22J VFL-036-32L VFL-048-41L VFL-072-41O VFL-096-42NVFL-024-32H VFL-036-32M VFL-048-41M VFL-072-41P VFL-096-42OVFL-024-32J VFL-036-41K VFL-048-42L VFL-072-42N VFL-096-42P
VFL-036-41M VFL-048-42M VFL-072-42O VFL-096-51NVFL-036-42K VFL-072-42P VFL-096-51OVFL-036-42L VFL-096-51PVFL-036-42M VFL-096-52N
VFL-096-52OVFL-096-52P
Baltimore Aircoil Company, Inc.Series V Closed Circuit Cooling Tower Line of
CTI Certified Cooling TowersVFL Models, CTI Certification Validation Number 00-11-10
Option Suffix CTI Capacity Adjustment(Note 1) Certified Required
Capacity Control Dampers D Yes YesTapered Discharge Hood R Yes YesPositive Closure Damper Hood -Tapered H Yes YesPositive Closure Damper Hood - Straight W Yes NoDischarge Sound Attenuation Z Yes YesCleanable Tube Coil A Yes See Note 2Cleanable Header Coil none Yes NoHeavy Duty Coil S Yes See Note 2ASME Code Coil none Yes See Note 3Unit not CTI Certified (Note 4 & 5) X No
Note:1. Typically no suffix is used for an accessory or modification that does not affect
capacity.2. Construction does not affect thermal capacity, but does increase Process Fluid
Pressure Drop as noted in Selection Software.3. ASME Code construction per se does not affect capacity or pressure drop, but
often Heavy Duty Coil construction is specified as well which does affect pres-sure drop.
4. This suffix is affixed to model numbers of units that are not CTI Certified, dueeither to application or product accessories or modifications.
5. The CTI thermal performance certification applies only to units with water as theprocess fluid.

CTI Journal, Vol. 27, No. 176
Baltimore Aircoil Company, Inc.Series V Open Cooling Tower Line of
CTI Certified Cooling TowersVTL Models, CTI Certification Validation Number 92-11-03
VTL-016-DM VTL-051-G VTL-103-JM VTL-227-LMVTL-016-E VTL-059-H VTL-103-K VTL-227-MMVTL-021-F VTL-066-J VTL-116-L VTL-227-NMVTL-021-GM VTL-072-K VTL-126-M VTL-227-O
VTL-027-EM VTL-079-GM VTL-137-JM VTL-245-MMVTL-027-F VTL-079-HM VTL-137-KM VTL-245-NMVTL-030-G VTL-079-JM VTL-137-LM VTL-245-OMVTL-034-H VTL-079-K VTL-137-M VTL-245-P
VTL-039-EM VTL-082-HM VTL-152-LM VTL-272-MMVTL-039-FM VTL-082-JM VTL-152-M VTL-272-NMVTL-039-GM VTL-082-K VTL-152-NM VTL-272-OMVTL-039-H VTL-092-L VTL-152-OM VTL-272-P
VTL-045-FM VTL-095-HM VTL-171-LVTL-045-GM VTL-095-JM VTL-185-MVTL-045-H VTL-095-K VTL-198-NVTL-045-JM VTL-095-LM VTL-209-O
VTL-095-MMFootnotes:
1. Towers which include the suffix �D� added to the models above (e.g. VTL-126-MD) are furnished with capacity control dampers and the certified capacity is98.5% of the published value.
2. Towers which include the suffix �X� added to the models above (e.g. VTL-079-GMX) are not CTI certified due either to application, product accessories ormodification.
Baltimore Aircoil Company, Inc.Series V Open Cooling Tower Line of
CTI Certified Cooling TowersVT0 Models, CTI Certification Validation Number 92-11-02
VT0-12-E VT0-32-H VT0-78-JM VT0-132-LVT0-14-F VT0-41-J VT0-78-K VT0-145-MVT0-19-G VT0-41-KM VT0-88-L VT0-155-NVT0-19-HM VT0-155-OM
VT0-52-HM VT0-102-KMVT0-24-EM VT0-52-J VT0-102-L VT0-166-LMVT0-24-FM VT0-57-K VT0-102-MM VT0-166-MMVT0-24-G VT0-166-NVT0-28-H VT0-65-J VT0-107-KM VT0-176-O
VT0-75-K VT0-107-LVT0-75-LM VT0-116-M
Footnotes:1. Towers which include the suffix �D� added to the models above (e.g. VT0-12-
ED) are furnished with capacity control dampers and the certified capacity is98.5% of the published value.
2. Towers which include the suffix �X� added to the models above (e.g. VT0-19GX)are not CTI certified due either to application, product accessories or modifica-tion.
Baltimore Aircoil Company, Inc.Series V Open Cooling Tower Line of
CTI Certified Cooling TowersVT1 Models, CTI Certification Validation Number 92-11-04
VT1-N209-KM VT1-N301-MM VT1-275-LM VT1-416-LMVT1-N209-LM VT1-N301-NM VT1-275-MM VT1-416-MMVT1-N209-MM VT1-N301-OM VT1-275-NM VT1-416-NMVT1-N209-NM VT1-N301-PM VT1-275-OM VT1-416-OVT1-N209-OM VT1-N301-Q VT1-275-P VT1-416-PMVT1-N209-P VT1-N301-RM VT1-275-QMVT1-N209-QM VT1-N301-SM VT1-275-RM VT1-478-LM
VT1-478-MMVT1-N220-KM VT1-N325-MM VT1-307-LM VT1-478-NVT1-N220-LM VT1-N325-NM VT1-307-MM VT1-507-OVT1-N220-MM VT1-N325-OM VT1-307-NM VT1-507-PMVT1-N220-NM VT1-N325-P VT1-307-O VT1-507-QMVT1-N220-O VT1-N346-Q VT1-340-P
VT1-N240-P VT1-N346-RM VT1-340-QM VT1-560-LMVT1-N240-QM VT1-N346-SM VT1-340-RM VT1-560-MM
VT1-560-NMVT1-N255-KM VT1-N370-MM VT1-375-LM VT1-560-OVT1-N255-LM VT1-N370-NM VT1-375-MM VT1-600-PVT1-N255-MM VT1-N370-OM VT1-375-NM VT1-600-QMVT1-N255-NM VT1-N370-PM VT1-375-OMVT1-N255-OM VT1-N370-Q VT1-375-PVT1-N255-P VT1-N395-R VT1-400-Q
VT1-N395-SM VT1-415-RVT1-415-SM
Footnotes:1. Multiple cell models of the single cell models above are also available but not
listed.2. Towers which include the suffix �D� added to the models above (e.g. VT1-307-
OD) are furnished with capacity control dampers and the certified capacity is98.5% of the published value.
3. Towers which include the suffix �X� added to the models above (e.g. VT1-N301-QX) are not CTI certified due either to application, product accessories or modi-fication.
Baltimore Aircoil Company, Inc.Series 1500 Line of
CTI Certified Cooling TowersCTI Certification Validation Number 98-11-08
15146-HM 15162-HM 15200-JM 15214-JM 15296-KM 15310-KM15146 15162 15200 15214 15296 1531015160 15177 15277 15245 15325 1534015176 15201 15250 15270 15350 15365
15219 15282 15368 1538515425
Multiple cell models of the single cell models above are also available but not listed.
Series 1500 Optional Accessories and Constructions- Certification Status
Option CTI Suffix Certified Capacity AdjustmentRequired
Low sound fan Q Yes Yes, Note 1Non-Standard Motor Size M Note 2 Yes, Note 2
Non-CTI Certified X No No, Note 3
Footnotes:1. Low sound fans on Series 1500 Cooling Towers incur a capacity reduction of 3%
relative to the same unit with a standard fan.2. Units with non-standard motor sizes are certified only if they are listed in the
Data of Record.3. This suffix is affixed to model numbers of units that are not CTI Certified, due
either to application, product accessories or modifications.
Baltimore Aircoil Company, Inc.Series 3000A Series Line of
CTI Certified Cooling TowersCTI Certification Validation Number 92-11-06
3240A-JM 3455A-KM 3552A-LM 3728A-NM 3583A-MM3240A 3455A-LM 3552A-MM 3728A-OM 3583A3272A 3455A-MM 3552A-NM 3728A 3618A3299A 3455A 3552A 3781A 3676A
3482A 3604A 3828A 3725A3333A-JM 3527A 3648A 3752A3333A-KM 3672A 3872A-OM3333A-LM 3473A-KM 3872A-PM 31132A-PM3333A 3473A-LM 3872A 31132A-QM3358A 3473A-MM 3923A 31132A-RM3379A 3473A 3970A 31132A
3501A 3990A3412A-JM 31213A-QM3412A-KM 3985A-PM 31213A-RM3412A-LM 3985A-QM 31213A3412A-MM 3985A 31301A3412A 31056A 31328A3436A

CTI Journal, Vol. 27, No. 1 77
Series 3000A Optional Accessories and Constructions - Certification Status
Option CTI Suffix Certified Capacity AdjustmentRequired
Additional Drift Eliminator Set E Yes Yes, Note 1
Low Sound Fan Q Yes Yes, Note 2
Non-Standard Motor Size M Note 3 Yes, Note 3
Velocity Recovery Stack V Yes Yes, Note 4
Not-CTI Certified X No No, Note 5
Note:1. Adding an additional drift eliminator set beyond what is included in the stan-
dard model design incurs a 2% capacity reduction relative to the standard unit.2. Low sound fans on Series 3000A Cooling Towers incur a capacity reduction of
3% relative to the same model with a standard fan.3. Units with non-standard motor sizes are certified only if they are listed in the
Data of Record.4. Velocity recovery fan stacks increase the capacity of a tower by 3 to 6%, depend-
ing upon the model and operating conditions. Refer to BAC Selection Softwareto determine the effect on a specific model at a specific operating condition.
5. This suffix is affixed to model numbers of units that are not CTI Certified, dueeither to application, product accessories or modifications to the tower.
Delta Cooling Towers, Inc.TM Series of CTI Certified Cooling Towers
CTI Certification Validation Number 02-24-01
TM105319 TM205319 TM305319 TM405319 TM505319 TM605319TM175319 TM275319 TM375319 TM475319 TM575319 TM675319TM110319 TM210319 TM310319 TM410319 TM510319 TM610319TM115319 TM215319 TM315319 TM415319 TM515319 TM615319
TM105419 TM205419 TM305419 TM405419 TM505419 TM605419TM175419 TM275419 TM375419 TM475419 TM575419 TM675419TM110419 TM210419 TM310419 TM410419 TM510419 TM610419TM115419 TM215419 TM315419 TM415419 TM515419 TM615419
TM105312 TM205312 TM305312 TM405312 TM505312 TM605312TM175312 TM275312 TM375312 TM475312 TM575312 TM675312TM110312 TM210312 TM310312 TM410312 TM510312 TM610312TM115312 TM215312 TM315312 TM415312 TM515312 TM615312
TM105412 TM205412 TM305412 TM405412 TM505412 TM605412TM175412 TM275412 TM375412 TM475412 TM575412 TM675412TM110412 TM210412 TM310412 TM410412 TM510412 TM610412TM115412 TM215412 TM315412 TM415412 TM515412 TM615412
Evapco, Inc.AT Line of CTI Certified Cooling Towers
CTI Certification Validation Number 99-13-01
AT SeriesAT, USS, REP, UT
18-49 28-428 19-111 29-024 112-314 212-036 312-260 424-036 228-012418-59 28-528 19-211 29-124 112-414 212-136 312-360 424-136 228-022418-69 28-628 19-311 29-224 112-514 212-236 312-460 424-236 228-032418-79 28-728 19-411 29-324 112-614 212-436 312-560 424-336 228-042418-89 28-828 19-511 29-424 112-714 212-536 312-660 424-436 228-052418-99 28-928 19-611 29-524 112-814 212-636 312-760 424-536 228-0624
19-711 29-624 112-914 212-736 312-860 424-636 228-072418-511 38-236 19-811 29-724 212-836 312-960 424-736 228-082418-611 38-336 19-911 29-824 112-018 212-936 424-836 228-092418-711 38-436 29-924 112-118 224-018 424-93618-811 38-536 19-412 112-218 312-036 224-118 428-014818-911 38-636 19-512 29-228 112-318 312-136 224-218 114-0124 428-0248
38-736 19-612 29-328 112-418 312-236 224-318 114-0224 428-034818-312 38-836 19-712 29-428 112-518 312-336 224-418 114-0324 428-044818-412 38-936 19-812 29-528 112-618 312-436 224-518 114-0424 428-054818-512 19-912 29-628 112-718 312-536 224-618 114-0524 428-064818-612 38-442 29-728 112-818 312-636 224-718 114-0624 428-074818-712 38-542 19-114 29-828 112-918 312-736 224-818 114-0724 428-084818-812 38-642 19-214 29-928 312-836 224-918 114-0824 428-094818-912 38-742 19-314 112-520 312-936 114-0924 428-1048
38-842 19-414 39-336 112-620 224-720 114-1024 428-114818-214 38-942 19-514 39-436 112-720 312-042 224-820 114-1124 428-124818-314 19-614 39-536 112-820 312-142 224-920 114-1224
18-414 19-56 19-714 39-636 112-920 312-242 217-11118-514 19-66 19-814 39-736 312-342 424-024 214-0148 217-21118-614 19-76 19-914 39-836 212-024 312-442 424-124 214-0248 217-31118-714 19-86 39-936 212-124 312-542 424-224 214-0348 217-41118-814 19-96 29-318 212-224 312-642 424-324 214-0448 217-51118-914 29-418 39-242 212-324 312-742 424-424 214-0548 217-611
19-28 29-518 39-342 212-424 312-842 424-524 214-0648 217-71128-518 19-38 29-618 39-442 212-524 312-942 424-624 214-0748 217-81128-618 19-48 29-718 39-542 212-624 424-724 214-0848 217-91128-718 19-58 29-818 39-642 212-724 312-054 424-824 214-094828-818 19-68 29-918 39-742 212-824 312-154 424-924 214-1048 217-41228-918 19-78 39-842 212-924 312-254 214-1148 217-512
19-88 29-121 39-942 312-354 424-028 217-61228-521 19-98 29-221 212-128 312-454 424-128 314-0172 217-71228-621 29-321 112-012 212-228 312-554 424-228 314-0272 217-81228-721 19-59 29-421 112-112 212-328 312-654 424-328 314-0372 217-91228-821 19-69 29-521 112-212 212-428 312-754 424-428 314-047228-921 19-79 29-621 112-312 212-528 312-854 424-528 314-0572 217-214
19-89 29-721 112-412 212-628 312-954 424-628 314-0672 217-31428-524 19-99 29-831 112-512 212-728 424-728 314-0772 217-41428-624 29-921 112-612 212-828 424-828 314-0872 217-51428-724 112-712 212-928 424-928 314-0972 217-61428-824 112-812 314-1072 217-71428-924 112-912 314-1172 217-814
314-1272 217-914
Footnotes:1. AT, USS, UT and REP are prefixes to be added to the basic numeric model
designations listed above to indicate the tower construction materials,generic configuration or options.
· AT is used for units with standard galvanized materials and fabricationmethods.
· USS is used to indicate units with stainless steel materials for corrosionresistance.
· UT is used to indicate units with super low sound fans.
· REP is used to indicate units with water inlet on the end rather than theside.
2. Certification includes units with optional gear drive in place of standard beltdrive.
3. Certification includes use of side, end, or bottom water inlet configuration.4. Certification includes use of optional water silencers.5. Certification includes use of optional external platforms/ladders for access.6. Certification includes an optional supplier for fans on standard models or
optional super low sound fans.
Evapco, Inc.AT Line of CTI Certified Cooling Towers
CTI Certification Validation Number 99-13-01AT Series Models
UBT
8-56B 8-012B 8-318B 8-324B 12-212B 12-324B 12-236B3 24-218B 24-524B8-66B 8-112B 8-418B 8-424B 12-312B 12-424B 12-336B3 24-318B 24-624B8-76B 8-212B 8-518B 8-524B 12-412B 12-524B 12-436B3 24-418B 24-724B8-86B 8-312B 8-618B 8-624B 12-512B 12-624B 12-536B3 24-518B 24-824B8-96B 8-412B 8-718B 8-724B 12-612B 12-724B 12-636B3 24-618B 24-924B
8-512B 8-818B 8-824B 12-712B 12-824B 12-736B3 24-718B8-29B 8-612B 8-918B 8-924B 12-812B 12-924B 12-836B3 24-818B 24-336B8-39B 8-712B 12-912B 12-936B3 24-918B 24-436B8-49B 8-812B 8-536B 12-136B 24-536B8-59B 8-912B 8-636B 12-218B 12-236B 12-454B 24-636B8-69B 8-736B 12-318B 12-336B 12-554B 24-736B8-79B 8-836B 12-418B 12-436B 12-654B 24-836B8-89B 8-936B 12-518B 12-536B 12-754B 24-936B8-99B 12-618B 12-636B 12-854B
12-718B 12-736B 12-954B12-818B 12-836B12-918B 12-936B
Footnotes:1. UBT is the prefix to be added to the basic numeric model designations listed
above to indicate units with alternate fabrication methods for seismic resistance.2. Certification includes units with optional gear drive in place of standard belt
drive.3. Certification includes use of side, end, or bottom water inlet configuration.4. Certification includes use of optional water silencers.5. Certification includes use of optional external platforms/ladders for access.6. Certification includes an optional supplier for fans on standard models or op-
tional super low sound fans.

CTI Journal, Vol. 27, No. 178
Evapco, Inc.ESW Line of CTI Certified Closed Circuit Coolers
CTI Certification Validation Number 05-13-05ESW Series Models
ESW 72-23H ESW 96-23H ESW 142-23H ESW 77-23H ESW 102-23H ESW 153-23H ESW 144-23I ESW 216-23J
ESW 72-23I ESW 96-23I ESW 142-23I ESW 77-23I ESW 102-23I ESW 153-23I ESW 144-23J ESW 216-23K
ESW 72-23J ESW 96-24H ESW 142-23J ESW 77-23J ESW 102-24H ESW 153-23J ESW 144-23K ESW 216-23L
ESW 72-24H ESW 96-24I ESW 142-24H ESW 77-24H ESW 102-24I ESW 153-24H ESW 144-24I ESW 216-23M
ESW 72-24I ESW 96-24H ESW 142-24I ESW 77-24I ESW 102-25H ESW 153-24I ESW 144-24J ESW 216-24J
ESW 72-24J ESW 96-25I ESW 142-24J ESW 77-24J ESW 102-25I ESW 153-24J ESW 144-24K ESW 216-24K
ESW 72-25H ESW 96-26H ESW 142-25H ESW 77-25H ESW 102-26H ESW 153-25H ESW 144-25I ESW 216-24L
ESW 72-25I ESW 96-26I ESW 142-25I ESW 77-25I ESW 1-2-26I ESW 153-25I ESW 144-25J ESW 216-24M
ESW 72-25J ESW 142-25J ESW 77-25J ESW 153-25J ESW 144-25K ESW 216-25J
ESW 72-26H ESW 96-33H ESW 142-26H ESW 77-26H ESW 102-33H ESW 153-26H ESW 144-26I ESW 216-25K
ESW 72-26I ESW 96-33I ESW 142-26I ESW 77-26I ESW 102-33I ESW 153-26I ESW 144-26J ESW 216-25L
ESW 72-26J ESW 96-33J ESW 142-26J ESW 77-26J ESW 102-33J ESW 153-26J ESW 144-26K ESW 216-25M
ESW 96-34H ESW 102-34H ESW 216-26J
ESW 72-33H ESW 96-34I ESW 142-33H ESW 77-33H ESW 102-34I ESW 153-33H ESW 144-33I ESW 216-26K
ESW 72-33I ESW 96-34J ESW 142-33I ESW 77-33I ESW 102-34J ESW 153-33I ESW 144-33J ESW 216-26L
ESW 72-33J ESW 96-35H ESW 142-eeJ ESW 77-33J ESW 102-35H ESW 153-33J ESW 144-33K ESW 216-26M
ESW 72-34H ESW 96-35I ESW 142-34H ESW 77-34H ESW 102-35I ESW 153-34H ESW 144-33L
ESW 72-34I ESW 96-35J ESW 142-34I ESW 77-34I ESW 102-35J ESW 153-34I ESW 144-34I ESW 216-33K
ESW 72-34J ESW 96-36H ESW 142-34J ESW 77-34J ESW 102-36H ESW 153-34J ESW 144-34J ESW 216-33L
ESW 72-35H ESW 96-36I ESW 142-35H ESW 77-35H ESW 102-36I ESW 153-35H ESW 144-34K ESW 216-33M
ESW 72-35I ESW 96-36J ESW 142-35I ESW 77-35I ESW 102-36J ESW 153-35I ESW 144-34L ESW 216-34K
ESW 72-35J ESW 142-35J ESW 77-35J ESW 153-35J ESW 144-35I ESW 216-34L
ESW 72-36H ESW 96-43I ESW 142-36H ESW 77-36H ESW 102-43I ESW 153-36H ESW 144-35J ESW 216-34M
ESW 96-43J ESW 142-36I ESW 77-36I ESW 102-43J ESW 153-36I ESW 144-35K ESW 216-35K
ESW 72-36I ESW 96-44I ESW 142-36J ESW 77-36J ESW 102-44I ESW 153-36J ESW 144-35L ESW 216-35L
ESW 72-36J ESW 96-44J ESW 102-44J ESW 144-36I ESW 216-35M
ESW 72-43I ESW 96-45I ESW 142-43I ESW 77-43I ESW 102-45I ESW 153-43I ESW 144-36J ESW 216-36K
ESW 72-43J ESW 96-45J ESW 142-43J ESW 77-43J ESW 102-45J ESW 153-43J ESW 144-36K ESW 216-36L
ESW 72-44I ESW 96-46I ESW 142-43K ESW 77-44I ESW 102-46I ESW 153-43K ESW 144-36L ESW 216-36M
ESW 72-44J ESW 96-46J ESW 142-44I ESW 77-44J ESW 102-46J ESW 153-44I
ESW 72-45I ESW 142-44J ESW 77-45I ESW 153-44J ESW 144-43J ESW 216-43K
ESW 72-45J ESW 142-44K ESW 77-45J ESW 153-44K ESW 144-43K ESW 216-43L
ESW 72-46I ESW 142-45I ESW 77-46I ESW 153-45I ESW 144-43L ESW 216-43M
ESW 72-46J ESW 142-45J ESW 77-46J ESW 153-45J ESW 144-44J ESW 216-43N
ESW 142-45K ESW 153-45K ESW 144-44K ESW 216-44K
ESW 142-26I ESW 153-46I ESW 144-44L ESW 216-44L
ESW 142-46J ESW 153-46J ESW 144-45J ESW 216-44M
ESW 142-46K ESW 153-46K ESW 144-45K ESW 215-44N
ESW 144-45L ESW 216-45K
ESW 144-46J ESW 216-45L
ESW 144-46K ESW 216-45M
ESW 144-46L ESW 216-45N
ESW 216-46K
ESW 216-46L
ESW 216-46M
ESW 216-46NFootnotes:
1. Certification includes units with optional High Flow Header Connections for betterprocess fluid distribution at higher flows.
2. Certification includes units with optional gear drive in place of standard belt drive3. Certification includes use of optional external platforms/ladders for access.4. Certification includes an optional supplier for fans on standard models or optional super low
sound fans.
Evapco, Inc.LPT Line of CTI Certified Cooling Towers
CTI Certification Validation Number 05-13-04LPT Series Basic Models
LPT 316 LPT 516 LPT 519 LPT 5112 LPT 819 LPT 8112LPT 326 LPT 526 LPT 529 LPT 5212 LPT 829 LPT 8212LPT 336 LPT 536 LPT 539 LPT 5312 LPT 839 LPT 8312LPT 346 LPT 546 LPT 549 LPT 5412 LPT 849 LPT 8412LPT 356 LPT 556 LPT 559 LPT 5512 LPT 859 LPT 8512LPT 366 LPT 566 LPT 569 LPT 5612 LPT 869 LPT 8612
LPT 576 LPT 5712 LPT 879 LPT 8712LPT 586 LPT 8812LPT 596
Footnotes:1. The following suffixes ( I, D, H, F, L, U, LI, LD, LH and LF ) are to be added to the
basic numeric model designations listed above to indicate the tower configura-tion options that are also included in the CTI Certification.
· I = Intake sound attenuation
· D = Discharge sound attenuation
· H = Tapered Discharge Hood
· F = Full sound attenuation
· L = One motor size smaller
· U = Two motor sizes smaller
· LI = Intake sound attenuation + One motor size smaller
· LD= Discharge sound attenuation + One motor size smaller
· LH = Tapered Discharge Hood + One motor size smaller
· LF =Full sound attenuation + One motor size smaller
2. The optional tower configurations are unique in capacity. Selection softwareshould be consulted for appropriate ratings of the tower configuration.
Evapco, Inc.LSTB Line of CTI Certified Cooling Towers
CTI Certification Validation Number 05-13-04LSTB Series Basic Models
LSTB 5112 LSTB 8P112 LSTB 8P124 LSTB 10112 LSTB 10124LSTB 5212 LSTB 8P212 LSTB 8P224 LSTB 10212 LSTB 10224LSTB 5312 LSTB 8P312 LSTB 8P324 LSTB 10312 LSTB 10324LSTB 5412 LSTB 8P412 LSTB 8P424 LSTB 10412 LSTB 10424LSTB5512 LSTB 8P512 LSTB 8P524 LSTB 10512 LSTB 10524
LSTB 10612
LSTB 5118 LSTB 8P118 LSTB 8P136 LSTB 10118 LSTB 10136LSTB 5218 LSTB 8P218 LSTB 8P236 LSTB 10218 LSTB 10236LSTB 5318 LSTB 8P318 LSTB 8P336 LSTB 10318 LSTB 10336LSTB 5418 LSTB 8P418 LSTB 8P436 LSTB 10418 LSTB 10436LSTB 5518 LSTB 8P518 LSTB 8P536 LSTB 10518 LSTB 10536LSTB 5618 LSTB 8P618 LSTB 10618 LSTB 10636LSTB 5718 LSTB 10718
Footnotes:1. The following suffixes ( I, D, H, F, L, U, LI, LD, LH and LF ) are to be added to
the basic numeric model designations listed above to indicate the towerconfiguration options that are also included in the CTI Certification.
· I = Intake sound attenuation
· D = Discharge sound attenuation
· H = Tapered Discharge Hood
· F = Full sound attenuation
· L = One motor size smaller
· U = Two motor sizes smaller
· LI = Intake sound attenuation + One motor size smaller
· LD = Discharge sound attenuation + One motor size smaller
· LH = Tapered Discharge Hood + One motor size smaller
· LF = Full sound attenuation + One motor size smaller2. The optional tower configurations are unique in capacity. Selection software
should be consulted for appropriate ratings of the tower configuration.
Fabrica Mexicana De Torres, S.A.Reymsa Cooling Towers
GHR Line of CTI Certified Cooling TowersCTI Certification Validation Number 00-22-02
GHRFG Series GHRFG Series GHRFG Series GHRFG Series(Molded Fiberglass (Galvanized Steel (Stainless Steel (Galvanized SteelStructure/Casing) (Structure & Casing) Structure & Casing) Structure &
Fiberglass Casing)
GHRFG-303115 GHRGS-303115 GHRSS-303115 GHRFS-303115GHRFG-303102 GHRGS-303102 GHRSS-303102 GHRFS-303102GHRFG-404103 GHRGS-404103 GHRSS-404103 GHRFS-404103GHRFG-404105 GHRGS-404105 GHRSS-404105 GHRFS-404105GHRFG-505103 GHRGS-505103 GHRSS-505103 GHRFS-505103GHRFG-505105 GHRGS-505105 GHRSS-505105 GHRFS-505105GHRFG-5555105 GHRGS-5555105 GHRSS-5555105 GHRFS-5555105GHRFG-5555175 GHRGS-5555175 GHRSS-5555175 GHRFS-5555175GHRFG-606105 GHRGS-606105 GHRSS-606105 GHRFS-606105GHRFG-606175 GHRGS-606175 GHRSS-606175 GHRFS-606175GHRFG-707175 GHRGS-707175 GHRSS-707175 GHRFS-707175

CTI Journal, Vol. 27, No. 1 79
GHRFG-707110 GHRGS-707110 GHRSS-707110 GHRFS-707115GHRFG-708175 GHRGS-708175 GHRSS-708175 GHRFS-708175GHRFG-708110 GHRGS-708110 GHRSS-708110 GHRFS-708110GHRFG-708115 GHRGS-708115 GHRSS-708115 GHRFS-708115GHRFG-709175 GHRGS-709175 GHRSS-709175 GHRFS-709175GHRFG-709110 GHRGS-709110 GHRSS-709110 GHRFS-709110GHRFG-709115 GHRGS-709115 GHRSS-709115 GHRFS-709115GHRFG-808175 GHRGS-808175 GHRSS-808175 GHRFS-808175GHRFG-808110 GHRGS-808110 GHRSS-808110 GHRFS-808110GHRFG-808115 GHRGS-808115 GHRSS-808115 GHRFS-808115GHRFG-809175 GHRGS-809175 GHRSS-809175 GHRFS-809175GHRFG-809110 GHRGS-809110 GHRSS-809110 GHRFS-809110GHRFG-809115 GHRGS-809115 GHRSS-809115 GHRFS-809115GHRFG-810110 GHRGS-810110 GHRSS-810110 GHRFS-810110GHRFG-810115 GHRGS-810115 GHRSS-810115 GHRFS-810115GHRFG-810120 GHRGS-810120 GHRSS-810120 GHRFS-810120GHRFG-811115 GHRGS-811115 GHRSS-811115 GHRFS-811115GHRFG-811120 GHRGS-811120 GHRSS-811120 GHRFS-811120GHRFG-812115 GHRGS-812115 GHRSS-812115 GHRFS-812115GHRFG-812120 GHRGS-812120 GHRSS-812120 GHRFS-812120GHRFG-812125 GHRGS-812125 GHRSS-812125 GHRFS-812125GHRFG-714275 GHRGS-714275 GHRSS-714275 GHRFS-714275GHRFG-714210 GHRGS-714210 GHRSS-714210 GHRFS-714210GHRFG-816275 GHRGS-816275 GHRSS-816275 GHRFS-816275GHRFG-816210 GHRGS-816210 GHRSS-816210 GHRFS-816210GHRFG-816215 GHRGS-816215 GHRSS-816215 GHRFS-816215GHRFG-1414475 GHRGS-1414475 GHRSS-1414475 GHRFS-1414475GHRFG-1414410 GHRGS-1414410 GHRSS-1414410 GHRFS-1414410GHRFG-1616475 GHRGS-1616475 GHRSS-1616475 GHRFS-1616475GHRFG-1616410 GHRGS-1616410 GHRSS-1616410 GHRFS-1616410GHRFG-1616415 GHRGS-1616415 GHRSS-1616415 GHRFS-1616415
Fabrica Mexicana De Torres, S.A.Reymsa Cooling Towers
HR Line of CTI Certified Cooling TowersCTI Certification Validation Number 04-22-03
HRFG-303115 HRFG-707175 HRFG-808175 HRFG-714275 HRFG-1414475HRFG-303102 HRFG-707110 HRFG-808110 HRFG-714210 HRFG-1414410
HRFG-808115HRFG-404103 HRFG-708175 HRFG-816275 HRFG-1616475HRFG-404105 HRFG-708110 HRFG-809175 HRFG-816210 HRFG-1616410
HRFG-708116 HRFG-809110 HRFG-816215 HRFG-1616415HRFG-505103 HRFG-809115HRFG-505105 HRFG-709175
HRFG-709110 HRFG-810110HRFG-606105 HRFG-709115 HRFG-810115HRFG-606175 HRFG-810120
HRFG-811115HRFG-811120
HRFG-812115HRFG-812120HRFG-812125
GEA Polacel CR Series LineCMDR Models of CTI Certified Cooling TowersCTI Certification Validation Number 04-25-01
CMDR12 135-DL-60 CMDR12 300-DL-60 CMDR19 135-DL-90 CMDR19 300-DL-90CMDR12 135-DM-60 CMDR12 300-DM-60 CMDR19 135-DM-90 CMDR19 300-DM-90CMDR12 135-DH-60 CMDR12 300-DH-60 CMDR19 135-DH-90 CMDR19 300-DH-90CMDR12 135-DL-90 CMDR12 300-DL-90 CMDR19 135-DH-120 CMDR19 300-DL-120CMDR12 135-DM-90 CMDR12 300-DM-90 CMDR19 135-DM-120 CMDR19 300-DM-120CMDR12 135-DH-90 CMDR12 300-DH-90 CMDR19 135-DH-120 CMDR19 300-DH-120CMDR12 135-DL-120 CMDR12 300-DL-120 CMDR19 135-DL-150 CMDR19 300-DL-150CMDR12 135-DM-120 CMDR12 300-DM-120 CMDR19 135-DM-150 CMDR19 300-DM-150CMDR12 135-DH-120 CMDR12 300-DH-120 CMDR19 135-DH-150 CMDR19 300-DH-150
CMDR12 160-DL-60 CMDR12 380-DL-60 CMDR19 160-DL-90 CMDR19 380-DL-90CMDR12 160-DM-60 CMDR12 380-DM-60 CMDR19 160-DM-90 CMDR19 380-DM-90CMDR12 160-DH-60 CMDR12 380-DH-60 CMDR19 160-DH-90 CMDR19 380-DH-90CMDR12 160-DL-90 CMDR12 380-DL-90 CMDR19 160-DH-120 CMDR19 380-DL-120CMDR12 160-DM-90 CMDR12 380-DM-90 CMDR19 160-DM-120 CMDR19 380-DM-120CMDR12 160-DH-90 CMDR12 380-DH-90 CMDR19 160-DH-120 CMDR19 380-DH-120CMDR12 160-DL-120 CMDR12 380-DL-120 CMDR19 160-DL-150 CMDR19 380-DL-150CMDR12 160-DM-120 CMDR12 380-DM-120 CMDR19 160-DM-150 CMDR19 380-DM-150CMDR12 160-DH-120 CMDR12 380-DH-120 CMDR19 160-DH-150 CMDR19 380-DH-150
CMDR12 180-DL-60 CMDR12 460-DL-60 CMDR19 180-DL-90 CMDR19 460-DL-90CMDR12 180-DM-60 CMDR12 460-DM-60 CMDR19 180-DM-90 CMDR19 460-DM-90CMDR12 180-DH-60 CMDR12 460-DH-60 CMDR19 180-DH-90 CMDR19 460-DH-90CMDR12 180-DL-90 CMDR12 460-DL-90 CMDR19 180-DH-120 CMDR19 460-DL-120CMDR12 180-DM-90 CMDR12 460-DM-90 CMDR19 180-DM-120 CMDR19 460-DM-120CMDR12 180-DH-90 CMDR12 460-DH-90 CMDR19 180-DH-120 CMDR19 460-DH-120CMDR12 180-DL-120 CMDR12 460-DL-120 CMDR19 180-DL-150 CMDR19 460-DL-150CMDR12 180-DM-120 CMDR12 460-DM-120 CMDR19 180-DM-150 CMDR19 460-DM-150CMDR12 180-DH-120 CMDR12 460-DH-120 CMDR19 180-DH-150 CMDR19 460-DH-150
CMDR12 210-DL-60 CMDR12 540-DL-60 CMDR19 210-DL-90 CMDR19 540-DL-90CMDR12 210-DM-60 CMDR12 540-DM-60 CMDR19 210-DM-90 CMDR19 540-DM-90CMDR12 210-DH-60 CMDR12 540-DH-60 CMDR19 210-DH-90 CMDR19 540-DH-90CMDR12 210-DL-90 CMDR12 540-DL-90 CMDR19 210-DH-120 CMDR19 540-DL-120CMDR12 210-DM-90 CMDR12 540-DM-90 CMDR19 210-DM-120 CMDR19 540-DM-120CMDR12 210-DH-90 CMDR12 540-DH-90 CMDR19 210-DH-120 CMDR19 540-DH-120CMDR12 210-DL-120 CMDR12 540-DL-120 CMDR19 210-DL-150 CMDR19 540-DL-150CMDR12 210-DM-120 CMDR12 540-DM-120 CMDR19 210-DM-150 CMDR19 540-DM-150CMDR12 210-DH-120 CMDR12 540-DH-120 CMDR19 210-DH-150 CMDR19 540-DH-150
CMDR12 240-DL-60 CMDR12 630-DL-60 CMDR19 240-DL-90 CMDR19 630-DL-90CMDR12 240-DM-60 CMDR12 630-DM-60 CMDR19 240-DM-90 CMDR19 630-DM-90CMDR12 240-DH-60 CMDR12 630-DH-60 CMDR19 240-DH-90 CMDR19 630-DH-90CMDR12 240-DL-90 CMDR12 630-DL-90 CMDR19 240-DH-120 CMDR19 630-DL-120CMDR12 240-DM-90 CMDR12 630-DM-90 CMDR19 240-DM-120 CMDR19 630-DM-120CMDR12 240-DH-90 CMDR12 630-DH-90 CMDR19 240-DH-120 CMDR19 630-DH-120CMDR12 240-DL-120 CMDR12 630-DL-120 CMDR19 240-DL-150 CMDR19 630-DL-150CMDR12 240-DM-120 CMDR12 630-DM-120 CMDR19 240-DM-150 CMDR19 630-DM-150CMDR12 240-DH-120 CMDR12 630-DH-120 CMDR19 240-DH-150 CMDR19 630-DH-150
Footnotes:1. The basic model numbers above are for 50 hz fan motors and the suffix U is added
for 60 hz fan motor applications. For example, CMDR19 630-DH-150 is for 50hz and CMDR19 630-DH-150U is for 60 hz.
2. The suffix �PS1 through �PS10 is added to the basic model numbers to indicatethe nozzle size required for the application flow rate.
3. The cold water basin configuration is indicated by either suffix /2 for no coldwater basin, the suffix /3 for a GRP basin with HDGS sub-frame, or the suffix /4for a GRP basin only.
GEA Polacel CR Series LineCMC Models of CTI Certified Cooling TowersCTI Certification Validation Number 04-25-01
CMC1-DL-60 CMC9-DL-60 CMC2.9-DL-60 CMC3.9-DL-60CMC1-DL-90 CMC9-DL-90 CMC2.9-DL-90 CMC3.9-DL-90CMC1-DM-60 CMC9-DM-60 CMC2.9-DM-60 CMC3.9-DM-60CMC1-DM-90 CMC9-DM-90 CMC2.9-DM-90 CMC3.9-DM-90CMC1-DH-60 CMC9-DH-60 CMC2.9-DH-60 CMC3.9-DH-60CMC1-DH-90 CMC9-DH-90 CMC2.9-DH-90 CMC3.9-DH-90
CMC2-DL-60 CMC12-DL-60 CMC2.12-DL-60 CMC3.12-DL-60CMC2-DL-90 CMC12-DL-90 CMC2.12-DL-90 CMC3.12-DL-90CMC2-DM-60 CMC12-DM-60 CMC2.12-DM-60 CMC3.12-DM-60CMC2-DM-90 CMC12-DM-90 CMC2.12-DM-90 CMC3.12-DM-90CMC2-DH-60 CMC12-DH-60 CMC2.12-DH-60 CMC3.12-DH-60CMC2-DH-90 CMC12-DH-90 CMC2.12-DH-90 CMC3.12-DH-90
CMC4-DL-60 CMC16-DL-60 CMC2.16-DL-60 CMC3.16-DL-60CMC4-DL-90 CMC16-DL-90 CMC2.16-DL-90 CMC3.16-DL-90CMC4-DM-60 CMC16-DM-60 CMC2.16-DM-60 CMC3.16-DM-60CMC4-DM-90 CMC16-DM-90 CMC2.16-DM-90 CMC3.16-DM-90CMC4-DH-60 CMC16-DH-60 CMC2.16-DH-60 CMC3.16-DH-60CMC4-DH-90 CMC16-DH-90 CMC2.16-DH-90 CMC3.16-DH-90
CMC6-DL-60CMC6-DL-90CMC6-DM-60CMC6-DM-90CMC6-DH-60CMC6-DH-90
Footnotes:1. The basic model numbers above are for 50 hz fan motors and the suffix U is added
for 60 hz fan motor applications. For example, CMDR19 630-DH-150 is for 50hz and CMDR19 630-DH-150U is for 60 hz.
2. The suffix �PS1 through �PS10 is added to the basic model numbers to indicatethe nozzle size required for the application flow rate.
3. The cold water basin configuration is indicated by either suffix /2 for no coldwater basin, the suffix /3 for a GRP basin with HDGS sub-frame, or the suffix /4for a GRP basin only.
GEA Polacel XR Series LineXE/XL/XT Models of CTI Certified Cooling Towers
CTI Certification Validation Number 04-25-02
XE2.120-VL XL2.320-VVL-235_60 XT2.240-VL-135 XT2.480-VL-135 XT2.720-VL-135XE2.120-L XL2.320-VL-235_60 XT2.240-L-135 XT2.480-L-135 XT2.720-L-135XE2.120-M XL2.320-L-235_60 XT2.240-M-135 XT2-480-M-135 XT2.720-M-135XE2.120-H XL2.320-M-235_60
XL2.320-VVL-235_90 XT2.240-VL-185 XT2.480-VL-185 XT2.720-VL-185XL2.320-VL-235_90 XT2.240-L-185 XT2.480-L-185 XT2.720-L-185XL2.320-L-235_90 XT2.240-M-185 XT2-480-M-185 XT2.720-M-185XL2.320-M-235_90
XL4.440-VVL-235_90 XT2.240-VL-235 XT2.480-VL-235 XT2.720-VL-235XL4.440-VL-235_90 XT2.240-L-235 XT2.480-L-235 XT2.720-L-235XL4.440-L-235_90 XT2.240-M-235 XT2-480-M-235 XT2.720-M-235XL4.440-M-235_90

CTI Journal, Vol. 27, No. 180
XL4.520-VVL-235_90XL4.520-VL-235_90XL4.520-L-235_90XL4.520-M-235_90
Footnotes:1. The basic model numbers above are for 50 hz fan motors and the suffix U is added
for 60 hz fan motor applications. For example, XE2.120-VL is for 50 hz andXE2.120-VLU is for 60 hz.
2. The cold water basin configuration is indicated by either suffix /2 for no coldwater basin, the suffix /3 for a GRP basin with HDGS sub-frame, or the suffix /4for a GRP basin only.
Imeco, div of York InternationalIMC Line of CTI Certified Cooling Towers
CTI Certification Validation Number 05-21-01
IMC 806-080-1-3 IMC 812-205-1-15 IMC 1212-265-1-15 IMC 1218-840-2-20IMC 806-100-1-5 IMC 812.200-1-10 IMC 1212-290-1-20 IMC 1218-910-2-25IMC 806-110-1-7.5 IMC 812-245-1-20 IMC 1212-305-1-25 IMC 1218-960-2-30IMC 806-112-1-5 IMC 812-246-1-15 IMC 1212-325-1-30 IMC 1218-1085-2-25IMC 806-125-1-10 IMC 812-260-1-20 IMC 1212-345-1-20 IMC 1218-1150-2-30IMC 806-115-1-5 IMC 812-247-1-10 IMC 1212-360-1-25 IMC 1218-1255-2-40IMC 806-130-1-7.5 IMC 812.273.1-15 IMC 1212-438-1-25 IMC 1218-1250-2-30IMC 806-136-1-7.5 IMC 812.280.1-15 IMC 1212-457-1-30 IMC 1218-1342-2-40IMC 806-145-1-10 IMC 812-297-1-20 IMC 1218-1427-2-50IMC 806-155-1-15 IMC 812-317-1-25 IMC 1212-580-2-20
IMC 1212-610-2-25 IMC 1218-1370-3-25IMC 809-140-1-7.5 IMC 809-310-2-10 IMC 1212-685-2-20 IMC 1218-1445-3-30IMC 809-156-1-10 IMC 809-300-2-7.5 IMC 1212-720-2-25 IMC 1218-1730-3-30IMC 809-170-1-10 IMC 809-340-2-10 IMC 1212-760-2-30 IMC 1218-1885-3-40IMC 809-190-1-15 IMC 809-380-2-15 IMC 1212-870-2-25 IMC 1218-2000-3-40IMC 809-180-1-10 IMC 809-360-2-10 IMC 1212-927-2-30 IMC 1218-2127-3-50IMC 809-206-1-15 IMC 809-447-2-20IMC 809-217-1-15 IMC 809-467-2-20 IMC 1218-460-1-25 IMC 1218-1750-4-25IMC 809-234-1-20 IMC 1218-485-1-30 IMC 1218-1955-4-20
IMC 812-440-2-20 IMC 1218-545-1-25 IMC 1218-2100-4-25IMC 812-405-2-10 IMC 1218-580-1-30 IMC 1218-2215-4-30IMC 812-430-2-10 IMC 1218-630-1-40 IMC 1218-2410-4-40IMC 812-520-2-20 IMC 1218-627-1-30 IMC 1218-2587-4-40IMC 812-590-2-20 IMC 1218-677-1-40 IMC 1218-2750-4-50IMC 812-600-2-20 IMC 1218-717-1-50IMC 812-632-2-25
KIMCO (Kyung In Machinery Company, Ltd.)EnduraCool Line of CTI Certified Cooling Towers
CTI Certification Validation Number 93-18-01
EX Seriesa EC Seriesa EX Seriesa EC Seriesa(SI � Metric Units) (IP � English Units) (SI � Metric Units) (IP � English Units)
Standard Fans Standard Fans Low Noise Fans Low Noise Fans
EX-80KLb EC-65 EX-80KLSb EC-65LEX-100KLb EC-80 EX-100KLSb EC-80LEX-125KLb EC-100 EX-112.5KLSb EC-90L
EX-125KLSb EC-100LEX-150KLb EC-120EX-175KLb EC-140 EX-150KLSb EC-120L
EX-175KLSb EC-140LEX-200KLb EC-160
EX-200KLSb EC-160LEX-225KLb EC-180EX-250KLb EC-200 MEX-250KLS EC-200L
MEX-300KLS EC-240LMEX-300 EC-240MEX-350 EC-280 MEX-350KLS EC-280L
MEX-400 EC-320 MEX-400KLS EC-320LMEX-500 EC-400
a EX Series models are manufactured and distributed by KIMCO.b EC Series models are manufactured by KIMCO and distributed in North America
by Great Lakes Fluid/Air, Inc. (GLFA) with equivalent dimensions and thermalratings.
Multiple cell models of the single cell models above are also available but not listed.
KIMCO (Kyung In Machinery Company, Ltd.)CKL Line of CTI Certified Closed Circuit Cooling Towers
CTI Certification Validation Number 05-18-02
CKL-60 CKL-125 CKL-200CKL-80 CKL-150 CKL-250
CKL-100 CKL-175 CKL-300
Liang Chi Industry Company, Ltd.LC Line of CTI Certified Cooling Towers
CTI Certification Validation Number 96-20-01
LC-125 LC-200LC-150 LC-225LC-175 LC-250
Multiple cell models of the single cell models above are also available but not listed.
Mesan Cooling Tower, LtdMXR Series Line of CTI Certified Cooling TowersCTI Certification Validation Number 04-26-01(RI)
MXR-L Series MXRI-L Series MXR-SL Series MXRI-SL SeriesStandard Low Noise Standard Low Noise Super Low Noise Super Low Noise
(FRP casing & (FRP casing & (FRP casing & (FRP casing &HDG steel structure) HDG steel structure) HDG steel structure) HDG steel structure)
MXR-80L MXRI-80L MXR-80SL MXRI-80SLMXR-100L MXRI-100L MXR-100SL MXRI-100SLMXR-125L MXRI-125L MXR-125SL MXRI-125SLMXR-150L MXRI-150L MXR-150SL MXRI-150SLMXR-175L MXRI-175L MXR-175SL MXRI-175SLMXR-200L MXRI-200L MXR-200SL MXRI-200SLMXR-225L MXRI-225L MXR-225SL MXRI-225SLMXR-250L MXRI-250L MXR-250SL MXRI-250SLMXR-300L MXRI-300L MXR-300SL MXRI-300SLMXR-350L MXRI-350L MXR-350SL MXRI-350SLMXR-400L MXRI-400L MXR-400SL MXRI-400SLMXR-500L MXRI-500L MXR-500SL MXRI-500SLMXR-600L MXRI-600L MXR-600SL MXRI-600SLMXR-700L MXRI-700L MXR-700SL MXRI-700SL
Footnotes:1. Model numbers listed above are for standard construction of FRP (Fiberglass
Reinforced Plastic) casing and HDG (Hot Dipped Galvanized) steel structure.Certified models with optional SS (Stainless Steel) casing and structure are alsoavailable but not listed.
· For FRP casing with SS structure add the suffix �S, for example MXR-80L-S.
· For SS casing with SS structure add the suffix �SC, for example MXRI-700SL- SC.
2. Certification includes units with optional gear drive in place of standard beltdrive.
3. Multiple cell models of the single cell models above are also available but notlisted.
Mesan Cooling Tower, LtdMCR Series Line of CTI Certified Cooling Towers
CTI Certification Validation Number 05-26-02
MCR Series MCRI-L Series MCR-SL Series MCRI-SL SeriesStandard Low Noise Standard Low Noise Super Low Noise Super Low Noise
(FRP casing & (FRP casing & (FRP casing & (FRP casing &HDG steel structure) HDG steel structure) HDG steel structure) HDG steel structure)
MCR-80L MCRI-80L MCR-80SL MCRI-80SLMCR-100L MCRI-100L MCR-100SL MCRI-100SLMCR-125L MCRI-125L MCR-125SL MCRI-125SLMCR-150L MCRI-150L MCR-150SL MCRI-150SLMCR-175L MCRI-175L MCR-175SL MCRI-175SLMCR-200L MCRI-200L MCR-200SL MCRI-200SLMCR-225L MCRI-225L MCR-225SL MCRI-225SLMCR-250L MCRI-250L MCR-250SL MCRI-250SLMCR-300L MCRI-300L MCR-300SL MCRI-300SLMCR-350L MCRI-350L MCR-350SL MCRI-350SLMCR-400L MCRI-400L MCR-400SL MCRI-400SLMCR-500L MCRI-500L MCR-500SL MCRI-500SLMCR-600L MCRI-600L MCR-600SL MCRI-600SLMCR-700L MCRI-700L MCR-700SL MCRI-700SL

CTI Journal, Vol. 27, No. 1 81
Footnotes:1. Model numbers listed above are for standard construction of FRP (Fiberglass
Reinforced Plastic) casing and HDG (Hot Dipped Galvanized) steel structure.Certified models with optional SS (Stainless Steel) casing and structure are alsoavailable but not listed.· For FRP casing with SS structure add the suffix �S, for example MCR-80L-S.· For SS casing with SS structure add the suffix �SC, for example MCRI-700SL-SC.
2. Certification includes units with optional gear drive in place of standard beltdrive.
Ryowo (Holding) Company, LtdFWS Series Line of CTI Certified Cooling Towers
CTI Certification Validation Number 04-27-01
FWS-94-3.7 FWS-127-5.5 FWS-169-7.5FWS-94-5.5 FWS-127-7.5 FWS-169-11FWS-94-7.5 FWS-127-11 FWS-169-15
Footnotes:1. Suffixes -GI, -SS, -AS, -AG are added to the basic model numbers listed above to
indicate the tower construction materials or options :-GI for FRP casing, FRP basin and HDG structural members and hardware.-SS for FRP casing, FRP basin and stainless steel structural members and hard-ware.-AS for stainless steel casing, basin, structural members and hardware.-AG for HDG casing, basin, structural members and hardware.
2. Suffixes /E and /L are added to the basic model numbers to indicate optionalparts :/E is for additional drift eliminator installed to the basic models (reduces capac-ity ~2%)./L is for additional louver installed in front of air inlet face.
3. Certification includes units with optional gear drive in place of standard beltdrive.
4. Certification includes use of optional handrail and/or optional caged ladders.5. Multiple cell models of the single cell models above are also available but not
listed.
Ryowo (Holding) Company, LtdFRS Series Line of CTI Certified Cooling Towers
CTI Certification Validation Number 05-27-03
FRS-80-2.2 FRS-100-4 FRS-150-5.5 FRS250-11 FRS350-15FRS-80-4 FRS-100-5.5 FRS-150-7.5 FRS-250-15 FRS-350-18.5FRS-80-5.5 FRS-100-7.5 FRS-150-11 FRS-250-18.5 FRS-350-22
Footnotes:1. Suffixes -GI, -SS, -AS, -AG are added to the basic model numbers listed above to
indicate the tower construction materials or options :-GI for FRP casing, FRP basin and HDG Structural members and hardware.-SS for FRP casing, FRP basin and stainless steel structural members and hard-ware.-AS for stainless steel casing, basin, structural members and hardware.-AG for HDG casing, basin, structural members and hardware.
2. Suffix /E is added to the basic model numbers to indicate optional parts :/E is for additional drift eliminator installed to the basic models (reduces capac-ity ~20%).
3. Certification includes units with optional gear drive in place of standard beltdrive.
4. Certification includes use of optional handrail and/or optional caged ladders.
Ryowo (Holding) Company, LtdFXS Series Line of CTI Certified Cooling Towers
CTI Certification Validation Number 05-27-02
FXS-200 FXS-300 FXS-400 FXS-500FXS-250 FXS-350 FXS-450 FXS-550
Footnotes:1. Suffixes -GI, -SS, -AS, -AG are added to the basic model numbers listed above to
indicate the tower construction materials or options :-GI for FRP casing, FRP basin and HDG structural members and hardware.-SS for FRP casing, FRP basin and stainless steel structural members and hard-ware.-AS for stainless steel casing, basin, structural members and hardware.-AG for HDG casing, basin, structural members and hardware.
2. Certification includes units with optional gear drive in place of standard beltdrive.
3. Certification includes use of optional handrail and/or optional caged ladders.
SPX Cooling TechnologiesProduct Branding: Marley
Aquatower Line of CTI Certified Cooling TowersCTI Certification Validation Number 01-14-05
Series 4900(Metal Structure)
490A 492A 493A 494A 495A 496A490B 492B 493B 494B 495B 496B
494C
SPX Cooling TechnologiesProduct Branding: Marley
NC Line of CTI Certified Cooling TowersCTI Certification Validation Number 92-14-01
Standard Models (NC Class 8300 Series)
NC8301C NC8303E NC8305D NC8307E NC8310C NC8312CNC8301D NC8303F NC8305E NC8307F NC8310D NC8312DNC8301E NC8303G MC8305F MC8307G NC8310E NC8312ENC8301F NC8303H NC8305G NC8307H NC8310F NC8312F
NC8305H NC8307J NC8310G NC8312GNC8305J NC8307K NC8310H NC8312HNC8305K NC8307M NC8310J NC8312J
NC8310K NC8312KNC8312NNC8312R
NC8302D NC8304D NC8306D NC8309C NC8311CNC8302E NC8304E NC8306E NC8309D NC8311DNC8302F NC8304F NC8306F NC8309E NC8311ENC8302G NC8304G NC8306G NC8309F NC8311F
NC8304H NC8306H NC8309G NC8311GNC8306J NC8309H NC8311HNC8306K NC8309J NC8311J
NC8309K NC8311KNC8311N
Multiple cell models of the single cell models above are also available but not listed.Low Noise Models (NC Class 8300 Series)
NC8301AL NC8303AL NC8305AL NC8307AL NC8310AL NC8312ALNC8301BL NC8303BL NC8305BL NC8307BL NC8310BL NC8312BLNC8301CL NC8303CL NC8305CL NC8307CL NC8310CL NC8312CLNC8301DL NC8303DL NC8305DL NC8307DL NC8310DL NC8312DLNC8301EL NC8303EL NC8305EL NC8307EL NC8310EL NC8312EL
NC8303FL NC8305FL NC8307FL NC8310FL NC8312FLNC8305GL NC8307GL NC8310GL NC8312GLNC8305HL NC8307HL NC8310HL NC8312HLNC8305JL NC8307JL NC8310JL NC8312JLNC8305KL NC8310KL NC8312KL
NC8302AL NC8304AL NC8306AL NC8309AL NC8311ALNC8302BL NC8304BL NC8306BL NC8309BL NC8311BLNC8302CL NC8304CL NC8306CL NC8309CL NC8311CLNC8302DL NC8304DL NC8306DL NC8309DL NC8311DLNC8302EL NC8304EL NC8306EL NC8309EL NC8311ELNC8302FL NC8304FL NC8306FL NC8309FL NC8311FL
NC8304GL NC8306GL NC8309GL NC8311GLNC8304HL NC8306HL NC8309HL NC8311HL
NC8306JL NC8309JL NC8311JLNC8309KL NC8311KL
Multiple cell models of the single cell models above are also available but not listed.
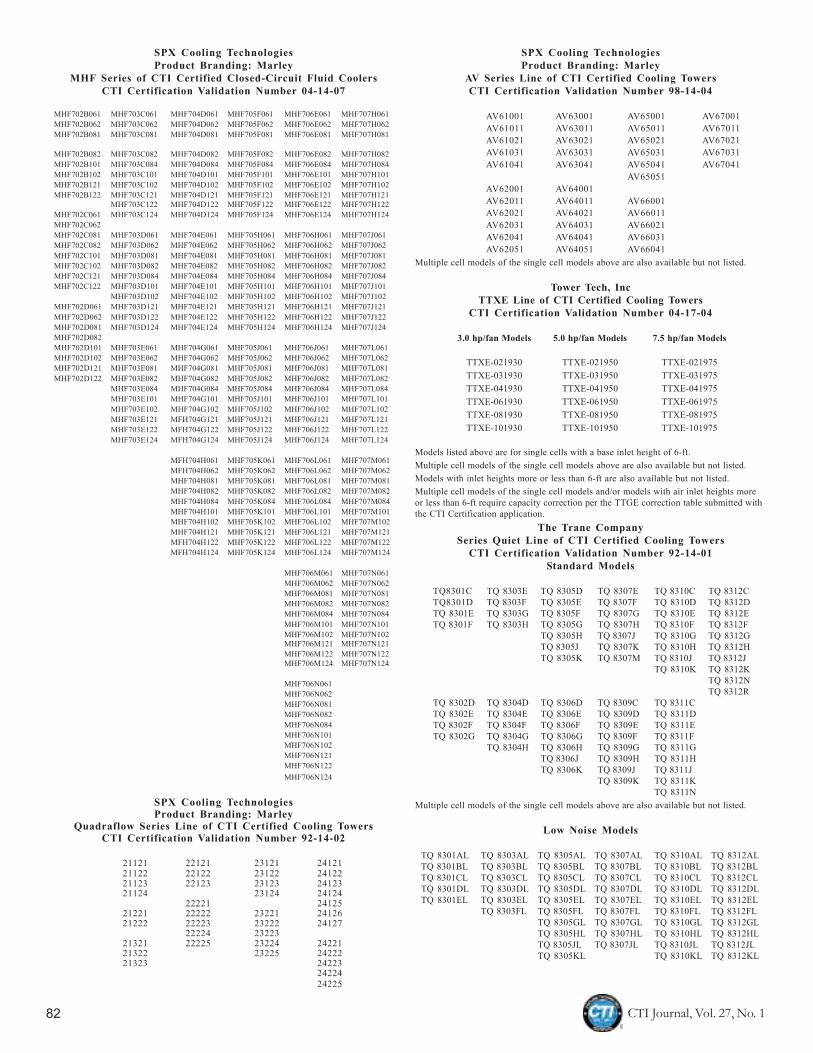
CTI Journal, Vol. 27, No. 182
SPX Cooling TechnologiesProduct Branding: Marley
MHF Series of CTI Certified Closed-Circuit Fluid CoolersCTI Certification Validation Number 04-14-07
MHF702B061 MHF703C061 MHF704D061 MHF705F061 MHF706E061 MHF707H061MHF702B062 MHF703C062 MHF704D062 MHF705F062 MHF706E062 MHF707H062MHF702B081 MHF703C081 MHF704D081 MHF705F081 MHF706E081 MHF707H081
MHF702B082 MHF703C082 MHF704D082 MHF705F082 MHF706E082 MHF707H082MHF702B101 MHF703C084 MHF704D084 MHF705F084 MHF706E084 MHF707H084MHF702B102 MHF703C101 MHF704D101 MHF705F101 MHF706E101 MHF707H101MHF702B121 MHF703C102 MHF704D102 MHF705F102 MHF706E102 MHF707H102MHF702B122 MHF703C121 MHF704D121 MHF705F121 MHF706E121 MHF707H121
MHF703C122 MHF704D122 MHF705F122 MHF706E122 MHF707H122MHF702C061 MHF703C124 MHF704D124 MHF705F124 MHF706E124 MHF707H124MHF702C062MHF702C081 MHF703D061 MHF704E061 MHF705H061 MHF706H061 MHF707J061MHF702C082 MHF703D062 MHF704E062 MHF705H062 MHF706H062 MHF707J062MHF702C101 MHF703D081 MHF704E081 MHF705H081 MHF706H081 MHF707J081MHF702C102 MHF703D082 MHF704E082 MHF705H082 MHF706H082 MHF707J082MHF702C121 MHF703D084 MHF704E084 MHF705H084 MHF706H084 MHF707J084MHF702C122 MHF703D101 MHF704E101 MHF705H101 MHF706H101 MHF707J101
MHF703D102 MHF704E102 MHF705H102 MHF706H102 MHF707J102MHF702D061 MHF703D121 MHF704E121 MHF705H121 MHF706H121 MHF707J121MHF702D062 MHF703D122 MHF704E122 MHF705H122 MHF706H122 MHF707J122MHF702D081 MHF703D124 MHF704E124 MHF705H124 MHF706H124 MHF707J124MHF702D082MHF702D101 MHF703E061 MHF704G061 MHF705J061 MHF706J061 MHF707L061MHF702D102 MHF703E062 MHF704G062 MHF705J062 MHF706J062 MHF707L062MHF702D121 MHF703E081 MHF704G081 MHF705J081 MHF706J081 MHF707L081MHF702D122 MHF703E082 MHF704G082 MHF705J082 MHF706J082 MHF707L082
MHF703E084 MHF704G084 MHF705J084 MHF706J084 MHF707L084MHF703E101 MHF704G101 MHF705J101 MHF706J101 MHF707L101MHF703E102 MHF704G102 MHF705J102 MHF706J102 MHF707L102MHF703E121 MFH704G121 MHF705J121 MHF706J121 MHF707L121MHF703E122 MFH704G122 MHF705J122 MHF706J122 MHF707L122MHF703E124 MFH704G124 MHF705J124 MHF706J124 MHF707L124
MFH704H061 MHF705K061 MHF706L061 MHF707M061MFH704H062 MHF705K062 MHF706L062 MHF707M062MHF704H081 MHF705K081 MHF706L081 MHF707M081MHF704H082 MHF705K082 MHF706L082 MHF707M082MHF704H084 MHF705K084 MHF706L084 MHF707M084MHF704H101 MHF705K101 MHF706L101 MHF707M101MHF704H102 MHF705K102 MHF706L102 MHF707M102MHF704H121 MHF705K121 MHF706L121 MHF707M121MFH704H122 MHF705K122 MHF706L122 MHF707M122MFH704H124 MHF705K124 MHF706L124 MHF707M124
MHF706M061 MHF707N061MHF706M062 MHF707N062MHF706M081 MHF707N081MHF706M082 MHF707N082MHF706M084 MHF707N084MHF706M101 MHF707N101MHF706M102 MHF707N102MHF706M121 MHF707N121MHF706M122 MHF707N122MHF706M124 MHF707N124
MHF706N061MHF706N062MHF706N081MHF706N082MHF706N084MHF706N101MHF706N102MHF706N121MHF706N122MHF706N124
SPX Cooling TechnologiesProduct Branding: Marley
Quadraflow Series Line of CTI Certified Cooling TowersCTI Certification Validation Number 92-14-02
21121 22121 23121 2412121122 22122 23122 2412221123 22123 23123 2412321124 23124 24124
22221 2412521221 22222 23221 2412621222 22223 23222 24127
22224 2322321321 22225 23224 2422121322 23225 2422221323 24223
2422424225
SPX Cooling TechnologiesProduct Branding: Marley
AV Series Line of CTI Certified Cooling TowersCTI Certification Validation Number 98-14-04
AV61001 AV63001 AV65001 AV67001AV61011 AV63011 AV65011 AV67011AV61021 AV63021 AV65021 AV67021AV61031 AV63031 AV65031 AV67031AV61041 AV63041 AV65041 AV67041
AV65051AV62001 AV64001AV62011 AV64011 AV66001AV62021 AV64021 AV66011AV62031 AV64031 AV66021AV62041 AV64041 AV66031AV62051 AV64051 AV66041
Multiple cell models of the single cell models above are also available but not listed.
Tower Tech, IncTTXE Line of CTI Certified Cooling Towers
CTI Certification Validation Number 04-17-04
3.0 hp/fan Models 5.0 hp/fan Models 7.5 hp/fan Models
TTXE-021930 TTXE-021950 TTXE-021975TTXE-031930 TTXE-031950 TTXE-031975TTXE-041930 TTXE-041950 TTXE-041975TTXE-061930 TTXE-061950 TTXE-061975TTXE-081930 TTXE-081950 TTXE-081975TTXE-101930 TTXE-101950 TTXE-101975
Models listed above are for single cells with a base inlet height of 6-ft.Multiple cell models of the single cell models above are also available but not listed.Models with inlet heights more or less than 6-ft are also available but not listed.Multiple cell models of the single cell models and/or models with air inlet heights moreor less than 6-ft require capacity correction per the TTGE correction table submitted withthe CTI Certification application.
The Trane CompanySeries Quiet Line of CTI Certified Cooling Towers
CTI Certification Validation Number 92-14-01Standard Models
TQ8301C TQ 8303E TQ 8305D TQ 8307E TQ 8310C TQ 8312CTQ8301D TQ 8303F TQ 8305E TQ 8307F TQ 8310D TQ 8312DTQ 8301E TQ 8303G TQ 8305F TQ 8307G TQ 8310E TQ 8312ETQ 8301F TQ 8303H TQ 8305G TQ 8307H TQ 8310F TQ 8312F
TQ 8305H TQ 8307J TQ 8310G TQ 8312GTQ 8305J TQ 8307K TQ 8310H TQ 8312HTQ 8305K TQ 8307M TQ 8310J TQ 8312J
TQ 8310K TQ 8312KTQ 8312NTQ 8312R
TQ 8302D TQ 8304D TQ 8306D TQ 8309C TQ 8311CTQ 8302E TQ 8304E TQ 8306E TQ 8309D TQ 8311DTQ 8302F TQ 8304F TQ 8306F TQ 8309E TQ 8311ETQ 8302G TQ 8304G TQ 8306G TQ 8309F TQ 8311F
TQ 8304H TQ 8306H TQ 8309G TQ 8311GTQ 8306J TQ 8309H TQ 8311HTQ 8306K TQ 8309J TQ 8311J
TQ 8309K TQ 8311KTQ 8311N
Multiple cell models of the single cell models above are also available but not listed.
Low Noise Models
TQ 8301AL TQ 8303AL TQ 8305AL TQ 8307AL TQ 8310AL TQ 8312ALTQ 8301BL TQ 8303BL TQ 8305BL TQ 8307BL TQ 8310BL TQ 8312BLTQ 8301CL TQ 8303CL TQ 8305CL TQ 8307CL TQ 8310CL TQ 8312CLTQ 8301DL TQ 8303DL TQ 8305DL TQ 8307DL TQ 8310DL TQ 8312DLTQ 8301EL TQ 8303EL TQ 8305EL TQ 8307EL TQ 8310EL TQ 8312EL
TQ 8303FL TQ 8305FL TQ 8307FL TQ 8310FL TQ 8312FLTQ 8305GL TQ 8307GL TQ 8310GL TQ 8312GLTQ 8305HL TQ 8307HL TQ 8310HL TQ 8312HLTQ 8305JL TQ 8307JL TQ 8310JL TQ 8312JLTQ 8305KL TQ 8310KL TQ 8312KL

CTI Journal, Vol. 27, No. 1 83
TQ 8302AL TQ 8304AL TQ 8306AL TQ 8309AL TQ 8311ALTQ 8302BL TQ 8304BL TQ 8306BL TQ 8309BL TQ 8311BLTQ 8302CL TQ 8304CL TQ 8306CL TQ 8309CL TQ 8311CLTQ 8302DL TQ 8304DL TQ 8306DL TQ 8309DL TQ 8311DLTQ 8302EL TQ 8304EL TQ 8306EL TQ 8309EL TQ 8311ELTQ 8302FL TQ 8304FL TQ 8306FL TQ 8309FL TQ 8311FL
TQ 8304GL TQ 8306GL TQ 8309GL TQ 8311GLTQ 8304HL TQ 8306HL TQ 8309HL TQ 8311HL
TQ 8306JL TQ 8309JL TQ 8311JLTQ 8309KL TQ 8311KL
Multiple cell models of the single cell models above are also available but not listed
Zhejiang Jinling Refrigeration Engineering Company, LtdJNT Series Line of CTI Certified Cooling Towers
CTI Certification Validation Number 05-28-01
Standard Fan Standard Fan Low Noise FanStandard Stack Extended Stack Standard Stack
JNT-80 JNT-80S JNT-70ULJNT-100 JNT-100S JNT-80UL
JNT-125 JNT-125S JNT-100ULJNT-150 JNT-150S JNT-125UL
JNT-175 JNT-175S JNT-150ULJNT-200 JNT-200S JNT-175UL
JNT-225 JNT-225S JNT-200ULJNT-250 JNT-250S JNT-225UL
Footnotes:1. Certification includes tower construction materials
indicated by the suffixes �B, -E, and �S which are added tobasic model numbers above.· B is for FRP casing, FRP basin and HDG Mainframe and
hardware.· E is for FRP casing, FRP basin and Stainless steel
mainframe and hardware.· S is for stainless steel casing, basin, mainframe and
hardware.2. The basic model numbers above are for 50hz fanmotor and
the suffix/F is added for 60hz motor applications. Forexample, JNT-100S-B is for 50hz motor, JNT-100S-B/F isfor 60hz motor.
3. Certification includes use of side, end, or bottom waterinlet configuration.
4. Certification includes units with optional gear drive inplace of standard belt drive.
5. Certification includes use of optional handrail and/orladder cage.
6. Multiple cell models of the single cell models above arealso available but not listed.

CTI Journal, Vol. 27, No. 184
Albemarle 9Aggreko Cooling Tower Services 42, 43AHR Expo 71Amarillo Chittom AirFlo 3Amarillo Gear Company IBCAmcot Cooling Tower Corporation 15American Cooling Tower, Inc. 23, 37AMSA, Inc. 13, 33Bailsco Blades & Castings, Inc. 29Baltimore Aircoil OBCBedford Reinforced Plastics 39Bettle Plastics, LLC 25Brentwood Industries, Inc. 17ChemTreat, Inc. 11Cooling Tower Resources, Inc. 65CTI Certified Towers under STD-201 74 - 83CTI License Test Agencies 70CTI ToolKit 72, 73Dynamic Fabricators, LLC 7Gaiennie Lumber Company 2Goodway 83Hewitech 6Howden Cooling Fans 5Hudson Products Corporation 45Industrial Cooling Tower 68,IFCKIMCO 63Mid-South Chemical Company, Inc. 19Midwest Towers, Inc. 51Multi-Wing America, Inc. 61Myron L Company 4Neri srl 67Paharpur Cooling Towers Ltd. 57C.E. Shepherd Company, L.P. 59Spraying Services, Inc. 53SPX Cooling Technologies 27Strongwell 55Swan Secure Products, Inc. 14Towe Engineering, Inc. 41Tower Performance, Inc. 84Water Quality Association 35
Index of Advertisers