wide supply range, micropower, rail-to-rail...
TRANSCRIPT

Wide Supply Range, Micropower,Rail-to-Rail Instrumentation Amplifier
Data Sheet AD8420
Rev. 0 Information furnished by Analog Devices is believed to be accurate and reliable. However, no responsibility is assumed by Analog Devices for its use, nor for any infringements of patents or other rights of third parties that may result from its use. Specifications subject to change without notice. No license is granted by implication or otherwise under any patent or patent rights of Analog Devices. Trademarks and registered trademarks are the property of their respective owners.
One Technology Way, P.O. Box 9106, Norwood, MA 02062-9106, U.S.A.Tel: 781.329.4700 www.analog.com Fax: 781.461.3113 ©2012 Analog Devices, Inc. All rights reserved.
FEATURES Maximum supply current: 80 μA Minimum CMRR: 100 dB Drives heavy capacitive loads: ~700 pF Rail-to-rail output Input voltage range goes below ground Gain set with 2 external resistors
Can achieve low gain drift at any gain Very wide power supply range
Single supply: 2.7 V to 36 V Dual supply: ±2.7 V to ±18 V
Bandwidth (G = 100): 2.5 kHz Input voltage noise: 55 nV/√Hz High dc precision
Maximum offset voltage: 125 μV Maximum offset drift: 1 μV/°C
Maximum differential input voltage: ±1 V 8-lead MSOP package
APPLICATIONS Bridge amplifiers Pressure measurement Medical instrumentation Portable data acquisition Multichannel systems
PIN CONFIGURATION
NC 1
+IN 2
–IN 3
–VS 4
VOUT8
FB7
REF6
+VS5
AD8420
TOP VIEW(Not to Scale)
+–
–+
0994
5-00
1
Figure 1.
Table 1. Instrumentation Amplifiers by Category1
General Purpose Zero Drift
Military Grade
Low Power
Digital Gain
AD8221, AD8222 AD8231 AD620 AD8420 AD8250 AD8220, AD8224 AD8290 AD621 AD8235,
AD8236 AD8251
AD8226, AD8227 AD8293 AD524 AD627 AD8253 AD8228 AD8553 AD526 AD8226,
AD8227 AD8231
AD8295, AD8224 AD8556 AD624 AD623 AD8557 AD8223 1 See www.analog.com for the latest instrumentation amplifiers.
GENERAL DESCRIPTION
The AD8420 is a low cost, micropower, wide supply range, instrumentation amplifier with a rail-to-rail output and a novel architecture that allows for extremely flexible design. It is optimized to amplify small differential voltages in the presence of large common-mode signals.
The AD8420 is based on an indirect current feedback architecture that gives it an excellent input common-mode range. Unlike conventional instrumentation amplifiers, the AD8420 can easily amplify signals at or even slightly below ground without requiring dual supplies. The AD8420 has rail-to-rail output, and the output voltage swing is completely independent of the input common-mode voltage.
Single-supply operation, micropower current consumption, and rail-to-rail output swing make the AD8420 ideal for battery-powered applications. Its rail-to-rail output stage maximizes dynamic range when operating from low supply voltages. Dual-supply operation (±15 V) and low power consumption make the AD8420 ideal for a wide variety of applications in medical or industrial instrumentation.
The AD8420 is available in an 8-lead MSOP package. Performance is specified over the full temperature range of −40°C to +85°C, and the part is operational from −40°C to +125°C.

AD8420 Data Sheet
Rev. 0 | Page 2 of 28
TABLE OF CONTENTS Features .............................................................................................. 1
Applications....................................................................................... 1
Pin Configuration............................................................................. 1
General Description ......................................................................... 1
Revision History ............................................................................... 2
Specifications..................................................................................... 3
Absolute Maximum Ratings............................................................ 7
Thermal Resistance ...................................................................... 7
ESD Caution.................................................................................. 7
Pin Configuration and Function Descriptions............................. 8
Typical Performance Characteristics ............................................. 9
Theory of Operation ...................................................................... 19
Architecture................................................................................. 19
Setting the Gain .......................................................................... 19
Gain Accuracy ............................................................................ 20
Input Voltage Range................................................................... 20
Input Protection ......................................................................... 20
Layout .......................................................................................... 21
Driving the Reference Pin......................................................... 21
Input Bias Current Return Path ............................................... 22
Radio Frequency Interference (RFI)........................................ 22
Output Buffering ........................................................................ 23
Applications Information .............................................................. 24
AD8420 in Electrocardiography (ECG).................................. 24
Classic Bridge Circuit ................................................................ 25
4 mA to 20 mA Single-Supply Receiver .................................. 25
Outline Dimensions ....................................................................... 26
Ordering Guide .......................................................................... 26
REVISION HISTORY 3/12—Revision 0: Initial Version

Data Sheet AD8420
Rev. 0 | Page 3 of 28
SPECIFICATIONS +VS = +5 V, −VS = 0 V, VREF = 0 V, V+IN = 0 V, V−IN = 0 V, TA = 25°C, G = 1 to 1000, RL = 20 kΩ, specifications referred to input, unless otherwise noted. All Table 2 limits are valid from VS = 3 V to VS = ±5 V, unless otherwise specified.
Table 2. Parameter Test Conditions/Comments Min Typ Max Unit COMMON-MODE REJECTION RATIO (CMRR) VCM = 0 V to 2.7 V
CMRR DC to 60 Hz 100 dB CMRR at 1 kHz 100 dB
NOISE Voltage Noise
Spectral Density f = 1 kHz, VDIFF ≤ 100 mV 55 nV/√Hz Peak to Peak f = 0.1 Hz to 10 Hz, VDIFF ≤ 100 mV 1.5 μV p-p
Current Noise Spectral Density f = 1 kHz 80 fA/√Hz Peak to Peak f = 0.1 Hz to 10 Hz 3 pA p-p
VOLTAGE OFFSET
Offset VS = 3 V to VS = 5 V 125 μV VS = ±5 V 150 μV Average Temperature Coefficient TA = −40°C to +85°C 1 μV/°C Offset RTI vs. Supply (PSR) VS = 2.7 V to 5 V 86 dB
INPUTS Valid for REF and FB pair, as well as +IN and −IN
Input Bias Current1 TA = +25°C 20 27 nA TA = +85°C 24 nA TA = −40°C 30 nA Average Temperature Coefficient TA = −40°C to +85°C 30 pA/°C
Input Offset Current TA = +25°C 1 nA TA = +85°C 1 nA TA = −40°C 1 nA
Average Temperature Coefficient TA = −40°C to +85°C 0.5 pA/°C Input Impedance
Differential 130||2 MΩ||pF Common Mode 1000||2 MΩ||pF
Differential Input Operating Voltage TA = –40°C to +85°C −1 +1 V Input Operating Voltage (+IN, −IN, REF, or FB) TA = +25°C −VS − 0.15 +VS − 2.2 V TA = +85°C −VS − 0.05 +VS − 1.8 V TA = –40°C −VS − 0.2 +VS − 2.7 V
DYNAMIC RESPONSE Small Signal −3 dB Bandwidth
G = 1 250 kHz G = 10 25 kHz G = 100 2.5 kHz G =1000 0.25 kHz
Settling Time 0.01% VS = ±5 V G = 1 −1 V to +1 V output step 3 μs G = 10 −4.5 V to +4.5 V output step 130 μs G = 100 −4.5 V to +4.5 V output step 1 ms
Slew Rate 1 V/μs

AD8420 Data Sheet
Rev. 0 | Page 4 of 28
Parameter Test Conditions/Comments Min Typ Max Unit GAIN2 G = 1 + (R2/R1)
Gain Range 1 1000 V/V Gain Error
G = 1 VOUT = 0.1 V to 1.1 V, VREF = 0.1 V 0.02 % G = 10 to 1000 VOUT = 0.2 V to 4.8 V 0.05 0.1 %
Gain vs. Temperature TA = −40°C to +85°C 10 ppm/°C OUTPUT
Output Swing VS = 5 V, RL = 10 kΩ to midsupply VS = ±5 V, RL = 20 kΩ to ground
TA = +25°C −VS + 0.1 +VS − 0.15 V TA = +85°C −VS + 0.1 +VS − 0.2 V TA = −40°C −VS + 0.1 +VS − 0.15 V
Short-Circuit Current 10 mA POWER SUPPLY
Operating Range Single-supply operation3 2.7 36 V Quiescent Current VS = 5 V TA = +25°C 55 70 80 μA TA = +85°C 95 μA TA = −40°C 65 μA
TEMPERATURE RANGE Specified −40 +85 °C Operational4 −40 +125 °C
1 The input stage uses PNP transistors; therefore, input bias current always flows out of the part. 2 For G > 1, errors from External Resistor R1 and External Resistor R2 should be considered in addition to these specifications, including error from FB pin bias current. 3 Minimum supply voltage indicated for V+IN, V−IN, and VREF = 0 V. 4 See the Typical Performance Characteristics section for operation between 85°C and 125°C.

Data Sheet AD8420
Rev. 0 | Page 5 of 28
+VS = +15 V, −VS = −15 V, VREF = 0 V, TA = 25°C, G = 1 to 1000, RL = 20 kΩ, specifications referred to input, unless otherwise noted.
Table 3. Parameter Test Conditions/Comments Min Typ Max Unit COMMON-MODE REJECTION RATIO (CMRR) VCM = −10 V to +10 V
CMRR DC to 60 Hz 100 dB CMRR at 1 kHz 100 dB
NOISE
Voltage Noise Spectral Density f = 1 kHz, VDIFF ≤ 100 mV 55 nV/√Hz Peak to Peak f = 0.1 Hz to 10 Hz, VDIFF ≤ 100 mV 1.5 μV p-p
Current Noise Spectral Density f = 1 kHz 80 fA/√Hz Peak to Peak f = 0.1 Hz to 10 Hz 3 pA p-p
VOLTAGE OFFSET Offset VS = ±15 V1 250 μV Average Temperature Coefficient TA = −40°C to +85°C 1 μV/°C Offset RTI vs. Supply (PSR) VS = ±15 V 100 dB
INPUTS Valid for REF and FB pair, as well as +IN and −IN
Input Bias Current2 TA = +25°C 20 27 nA TA = +85°C 24 nA TA = −40°C 30 nA Average Temperature Coefficient TA = −40°C to +85°C 30 pA/°C
Input Offset Current TA = +25°C 1 nA TA = +85°C 1 nA TA = −40°C 1 nA
Average Temperature Coefficient TA = −40°C to +85°C 0.5 pA/°C Input Impedance
Differential 130||3 MΩ||pF Common Mode 1000||3 MΩ||pF
Differential Input Operating Voltage TA = −40°C to +85°C −1 1 V Input Operating Voltage (+IN, −IN, REF, or FB) TA = +25°C −VS − 0.15 +VS − 2.2 V TA = +85°C −VS − 0.05 +VS − 1.8 V TA = −40°C −VS − 0.2 +VS − 2.7 V
DYNAMIC RESPONSE Small Signal −3 dB Bandwidth
G = 1 250 kHz G = 10 25 kHz G = 100 2.5 kHz G =1000 0.25 kHz
Settling Time 0.01% G = 1 −1 V to +1 V output step 3 μs G = 10 −5 V to +5 V output step 130 μs G = 100 −5 V to +5 V output step 1 ms
Slew Rate 1 V/μs GAIN3 G = 1 + (R2/R1)
Gain Range 1 1000 V/V Gain Error
G = 1 VOUT = ±1 V 0.02 % G = 10 to 1000 VOUT = ±10 V 0.05 0.1 %
Gain vs. Temperature TA = −40°C to +85°C 10 ppm/°C

AD8420 Data Sheet
Rev. 0 | Page 6 of 28
Parameter Test Conditions/Comments Min Typ Max Unit OUTPUT
Output Swing RL = 20 kΩ to Ground TA = +25°C −VS + 0.13 +VS − 0.2 V TA = +85°C −VS + 0.15 +VS − 0.23 V TA = –40°C −VS + 0.11 +VS − 0.16 V
Short-Circuit Current 10 mA POWER SUPPLY
Operating Range Dual-supply operation4 ±2.7 ±18 V Quiescent Current VS = ±15 V TA = +25°C 70 85 100 μA TA = +85°C 120 μA TA = −40°C 90 μA
TEMPERATURE RANGE Specified −40 +85 °C Operational5 −40 +125 °C
1 See the section for the offset voltage vs. supply. Typical Performance Characteristics2 The input stage uses PNP transistors; therefore, input bias current always flows out of the part. 3 For G > 1, errors from External Resistor R1 and External Resistor R2 should be considered in addition to these specifications, including error from FB pin bias current. 4 Minimum positive supply voltage indicated for V+IN, V−IN, and VREF = 0 V. With V+IN, V−IN, and VREF = −VS, minimum supply is ±1.35 V. 5 See the Typical Performance Characteristics section for operation between 85°C and 125°C.

Data Sheet AD8420
Rev. 0 | Page 7 of 28
ABSOLUTE MAXIMUM RATINGS Table 4. Parameter Rating Supply Voltage ±18 V Output Short-Circuit Current Indefinite Maximum Voltage at −IN or +IN −VS + 40 V Minimum Voltage at −IN or +IN −VS − 0.5 V Maximum Voltage at REF or FB +VS + 0.5 V Minimum Voltage at REF or FB −VS − 0.5 V Storage Temperature Range −65°C to +150°C ESD
Human Body Model 2.5 kV Charge Device Model 1.5 kV Machine Model 0.1 kV
Stresses above those listed under Absolute Maximum Ratings may cause permanent damage to the device. This is a stress rating only; functional operation of the device at these or any other conditions above those indicated in the operational section of this specification is not implied. Exposure to absolute maximum rating conditions for extended periods may affect device reliability.
THERMAL RESISTANCE θJA is specified for a device in free air.
Table 5. Package θJA Unit 8-Lead MSOP, 4-Layer JEDEC Board 135 °C/W
ESD CAUTION

AD8420 Data Sheet
Rev. 0 | Page 8 of 28
PIN CONFIGURATION AND FUNCTION DESCRIPTIONS
NC 1
+IN 2
–IN 3
–VS 4
VOUT8
FB7
REF6
+VS5
AD8420
TOP VIEW(Not to Scale)
+–
–+
0994
5-00
2
Figure 2. Pin Configuration
Table 6. Pin Function Descriptions Pin No. Mnemonic Description 1 NC This pin is not connected internally. For best CMRR vs. frequency and leakage performance, connect this pin to
negative supply. 2 +IN Positive Input. 3 −IN Negative Input 4 −VS Negative Supply. 5 +VS Positive Supply. 6 REF Reference Input. 7 FB Feedback Input. 8 VOUT Output.

Data Sheet AD8420
Rev. 0 | Page 9 of 28
TYPICAL PERFORMANCE CHARACTERISTICS T = 25°C, +VS = 5 V, RL = 20 kΩ, unless otherwise noted.
700
600
500
400
300
200
100
0–150 –100 –50 0 50 100 150
NU
MB
ER O
F H
ITS
VOS (µV)
MEAN: –34.8195SD: 31.3406
0994
5-00
3
Figure 3. Typical Distribution of Input Offset Voltage
700
600
500
400
300
200
100
0252423222120
NU
MB
ER O
F H
ITS
POSITIVE BIAS CURRENT (nA)
MEAN: 22.6643SD: 0.6058
0994
5-00
4
Figure 4. Typical Distribution of Input Bias Current
1200
1000
800
600
400
200
0–0.9 –0.6 –0.3 0 0.3 0.6 0.9
NU
MB
ER O
F H
ITS
OFFSET CURRENT (nA)
MEAN: 0.000646761SD: 0.111551
0994
5-00
5
Figure 5. Typical Distribution of Input Offset Current
700
600
500
400
300
200
100
01086420
NU
MB
ER O
F H
ITS
CMRR, ±15V (µV/V) 0994
5-00
8
MEAN: 4.63764SD: 1.09498
Figure 6. Typical Distribution of CMRR
NU
MB
ER O
F H
ITS
gm2 POSITIVE BIAS CURRENT (nA)
0994
5-00
6
700
600
500
400
300
200
100
0252423222120
MEAN: 22.706SD: 0.615728
Figure 7. Typical Distribution of REF, FB Bias Current
1200
1000
800
600
400
200
0–0.9 –0.6 –0.3 0 0.3 0.6 0.9
NU
MB
ER O
F H
ITS
gm2 OFFSET CURRENT (nA) 0994
5-00
7
MEAN: 0.00144205SD: 0.112088
Figure 8. Typical Distribution of REF, FB Offset Current

AD8420 Data Sheet
Rev. 0 | Page 10 of 28
3.0
2.5
2.0
1.5
1.0
0.5
0
0.5
0.4
0.3
0.2
0.1
0
–0.1–5 0 5 10 15 20 25 30 35 40
OU
TPU
T VO
LTA
GE
(V)
INPU
T C
UR
REN
T (m
A)
INPUT VOLTAGE (V)
VS = +5VG = 1
VOUT
IIN
0994
5-30
9
Figure 9. Input Overvoltage Performance, G = 1
3
2
1
0
–1
–2
–3
0.6
0.4
0.2
0
–0.2
–0.4
–0.6–20 –15 –10 –5 0 5 10 15 20 25
OU
TPU
T VO
LTA
GE
(V)
INPU
T C
UR
REN
T (m
A)
INPUT VOLTAGE (V)
VS = ±15VG = 1 VOUT
IIN
0994
5-31
0
Figure 10. Input Overvoltage Performance, G = 1, VS = ±15 V
6
5
4
3
2
1
0
0.5
0.4
0.3
0.2
0.1
0
–0.1–5 0 5 10 15 20 25 30 35 40
OU
TPU
T VO
LTA
GE
(V)
INPU
T C
UR
REN
T (m
A)
INPUT VOLTAGE (V)
VS = 5VG = 100
VOUT
IIN
0994
5-31
1
Figure 11. Input Overvoltage Performance, G = 100
15
10
5
0
–5
–10
–15
0.6
0.4
0.2
0
–0.2
–0.4
–0.6–20 –15 –10 –5 0 5 10 15 20 25
OU
TPU
T VO
LTA
GE
(V)
INPU
T C
UR
REN
T (m
A)
INPUT VOLTAGE (V)
VS = ±15VG = 100
VOUT IIN
0994
5-31
2
Figure 12. Input Overvoltage Performance, G = 100, VS = ±15 V
15
10
5
0
–5
–10
–20
–15
–1.2 –1.0 –0.8 –0.6 –0.4 –0.2 0 0.2 0.4 0.6 0.8 1.0 1.2
INPU
T C
OM
MO
N-M
OD
E VO
LTA
GE
(V)
OUTPUT VOLTAGE (V)
0.0V, +12.8V
0.0V, –15.1V
–1.0V, +12.3V
–1.0V, –14.6V +1.0V, –14.6V
+1.0V, +12.3V
0994
5-31
3
Figure 13. Input Common-Mode Voltage vs. Output Voltage,
G = 1, VS = ±15 V
3.0
2.5
2.0
1.5
1.0
0.5
–0.5
0
–0.2 0 0.2 0.4 0.6 0.8 1.0 1.2
INPU
T C
OM
MO
N-M
OD
E VO
LTA
GE
(V)
OUTPUT VOLTAGE (V)
+4mV, +2.8V
+4mV, –0.1V
+1.0V, +0.4V
+1.0V, +2.3V
0994
5-31
4
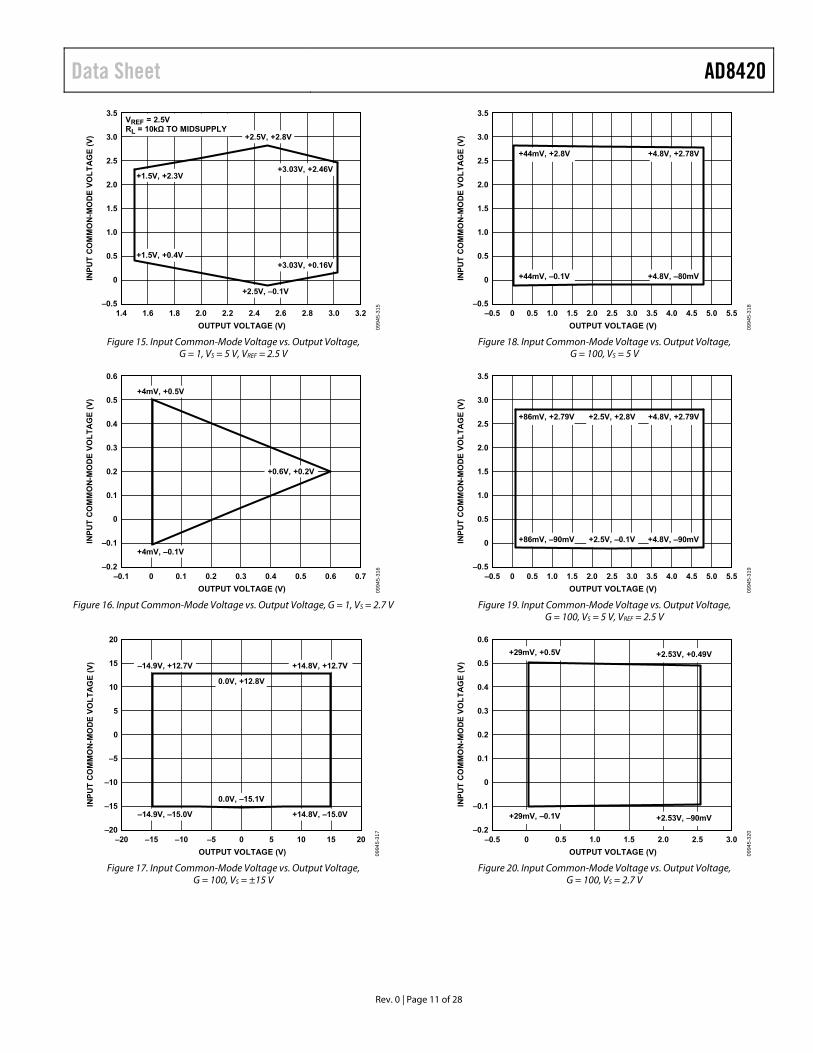
Figure 14. Input Common-Mode Voltage vs. Output Voltage, G = 1, VS = 5 V
Data Sheet AD8420
Rev. 0 | Page 11 of 28
3.5
3.0
2.5
2.0
1.5
1.0
0.5
0
–0.51.4 3.23.02.82.62.42.22.01.81.6
INPU
T C
OM
MO
N-M
OD
E VO
LTA
GE
(V)
OUTPUT VOLTAGE (V)
VREF = 2.5VRL = 10kΩ TO MIDSUPPLY
+2.5V, –0.1V
+3.03V, +0.16V
+3.03V, +2.46V
+2.5V, +2.8V
+1.5V, +0.4V
+1.5V, +2.3V
0994
5-31
5
Figure 15. Input Common-Mode Voltage vs. Output Voltage,
G = 1, VS = 5 V, VREF = 2.5 V
0.6
0.5
0.4
0.3
0.2
0.1
0
–0.1
–0.2–0.1 0.70.60.50.40.30.20.10
INPU
T C
OM
MO
N-M
OD
E VO
LTA
GE
(V)
OUTPUT VOLTAGE (V)
+4mV, +0.5V
+4mV, –0.1V
+0.6V, +0.2V
0994
5-31
6
Figure 16. Input Common-Mode Voltage vs. Output Voltage, G = 1, VS = 2.7 V
20
15
10
5
0
–5
–10
–15
–20–20 20151050–5–10–15
INPU
T C
OM
MO
N-M
OD
E VO
LTA
GE
(V)
OUTPUT VOLTAGE (V)
–14.9V, +12.7V
–14.9V, –15.0V
0.0V, –15.1V
0.0V, +12.8V
+14.8V, +12.7V
+14.8V, –15.0V
0994
5-31
7
Figure 17. Input Common-Mode Voltage vs. Output Voltage,
G = 100, VS = ±15 V
3.5
3.0
2.5
2.0
1.5
1.0
0.5
0
–0.5–0.5 5.55.04.53.52.5 4.03.02.01.51.00 0.5
INPU
T C
OM
MO
N-M
OD
E VO
LTA
GE
(V)
OUTPUT VOLTAGE (V)
+44mV, +2.8V
+44mV, –0.1V
+4.8V, +2.78V
+4.8V, –80mV
0994
5-31
8
Figure 18. Input Common-Mode Voltage vs. Output Voltage,
G = 100, VS = 5 V
3.5
3.0
2.5
2.0
1.5
1.0
0.5
0
–0.5–0.5 5.55.04.53.52.5 4.03.02.01.51.00 0.5
INPU
T C
OM
MO
N-M
OD
E VO
LTA
GE
(V)
OUTPUT VOLTAGE (V)
+86mV, +2.79V
+86mV, –90mV
+2.5V, +2.8V
+2.5V, –0.1V
+4.8V, +2.79V
+4.8V, –90mV
0994
5-31
9
Figure 19. Input Common-Mode Voltage vs. Output Voltage,
G = 100, VS = 5 V, VREF = 2.5 V
0.6
0.5
0.4
0.3
0.2
0.1
0
–0.1
–0.2–0.5 3.02.52.01.51.00 0.5
INPU
T C
OM
MO
N-M
OD
E VO
LTA
GE
(V)
OUTPUT VOLTAGE (V)
+29mV, +0.5V
+29mV, –0.1V
+2.53V, +0.49V
+2.53V, –90mV
0994
5-32
0
Figure 20. Input Common-Mode Voltage vs. Output Voltage,
G = 100, VS = 2.7 V

AD8420 Data Sheet
Rev. 0 | Page 12 of 28
40
35
30
25
20
15
10
5–2.0 0 3.02.52.01.51.00.5
INPU
T B
IAS
CU
RR
ENT
(nA
)
COMMON-MODE VOLTAGE (V) 0994
5-01
9
+2.7V
IBIAS (+IN)IBIAS (–IN)
–0.2V
Figure 21. Input Bias Current vs. Common-Mode Voltage
400
–400
–300
–200
–100
0
100
200
300
–2.0 –1.5 –1.0 –0.5 0 0.5 1.0 1.5 2.0
INPU
T B
IAS
CU
RR
ENT
(nA
)
DIFFERENTIAL INPUT VOLTAGE (V) 0994
5-02
0
IBIAS (+IN)
IBIAS (–IN)
SPECIFIEDPERFORMANCE RANGE
Figure 22. Input Bias Current vs. Differential Input Voltage, VS = ±15
100
0
20
40
60
80
0.1 1 10 100 1k 10k 100k
PSR
R (d
B)
FREQUENCY (Hz)
GAIN = 1000
BANDWIDTHLIMIT
GAIN = 100
GAIN = 10
GAIN = 1
0994
5-50
0
Figure 23. PSRR vs. Frequency on 5 V Supply
120
0
20
40
60
80
100
0.1 1 10 100 1k 10k 100k
POSI
TIVE
PSR
R (d
B)
FREQUENCY (Hz)
GAIN = 1000
BANDWIDTHLIMIT
GAIN = 100
GAIN = 10
GAIN = 1
0994
5-32
3
VS = ±15V
Figure 24. Positive PSRR vs. Frequency, RTI, VS = ±15 V
120
0
20
40
60
80
100
0.1 1 10 100 1k 10k 100k
NEG
ATI
VE P
SRR
(dB
)
FREQUENCY (Hz)
GAIN = 1000GAIN = 100
GAIN = 10
GAIN = 1
0994
5-32
4
BANDWIDTHLIMIT
VS = ±15V
Figure 25. Negative PSRR vs. Frequency, RTI, VS = ±15 V
70
–30
–20
–10
0
10
20
30
40
50
60
1 10 100 1k 10k 100k 1M
GA
IN (d
B)
FREQUENCY (Hz) 0994
5-02
3
VS = ±15VGAIN = 1000
GAIN = 100
GAIN = 10
GAIN = 1
Figure 26. Gain vs. Frequency

Data Sheet AD8420
Rev. 0 | Page 13 of 28
70
–30
–20
–10
0
10
20
30
40
50
60
1 10 100 1k 10k 100k 1M
GA
IN (d
B)
FREQUENCY (Hz) 0994
5-02
4
VS = 2.7VGAIN = 1000
GAIN = 100
GAIN = 10
GAIN = 1
Figure 27. Gain vs. Frequency, 2.7 V Single Supply
140
120
0
20
40
60
80
100
0.1 1 10 100 1k 10k 100k
CM
RR
(dB
)
FREQUENCY (Hz)
GAIN = 1000
GAIN = 100
GAIN = 10
GAIN = 1
0994
5-32
7BANDWIDTH
LIMITVS = ±15V
Figure 28. CMRR vs. Frequency, RTI, VS = ±15 V
140
120
0
20
40
60
80
100
0.1 1 10 100 1k 10k 100k
CM
RR
(dB
)
FREQUENCY (Hz)
GAIN = 1000
GAIN = 100
GAIN = 10GAIN = 1
0994
5-32
8
VS = ±15V
Figure 29. CMRR vs. Frequency, RTI, 1 kΩ Source Imbalance, VS = ±15 V
120
0
20
40
60
80
100
0 10.90.80.70.60.50.40.30.20.1
CM
RR
(dB
)
DIFFERENTIAL INPUT VOLTAGE (V).0
VS = ±15VVCM = ±10V
0994
5-32
9
Figure 30. CMRR vs. Differential Input Voltage
–40 –25 –10 5 20 35 50 65 80 95 110 125
SUPP
LY C
UR
REN
T (µ
A)
TEMPERATURE (°C) 0994
5-02
720
30
40
50
60
70
80
90
100
110
120VS = 5V
Figure 31. Supply Current vs. Temperature, VS = +5 V
30
0
250
200
150
100
50
0
–50
5
10
15
20
25
–40 1251109580655035205–10–25
BIA
S C
UR
REN
T (n
A)
OFF
SET
CU
RR
ENT
(pA
)
TEMPERATURE (°C)
OFFSET CURRENT
–IN BIAS CURRENT
+IN BIAS CURRENT
0994
5-33
1
Figure 32. Input Bias Current and Input Offset Current vs. Temperature
AD8420 Data Sheet
Rev. 0 | Page 14 of 28
30
0
200
150
100
50
0
–50
–100
5
10
15
20
25
–40 1251109580655035205–10–25
BIA
S C
UR
REN
T (n
A)
OFF
SET
CU
RR
ENT
(pA
)
TEMPERATURE (°C)
OFFSET CURRENT
–IN BIAS CURRENT
+IN BIAS CURRENT
0994
5-33
2
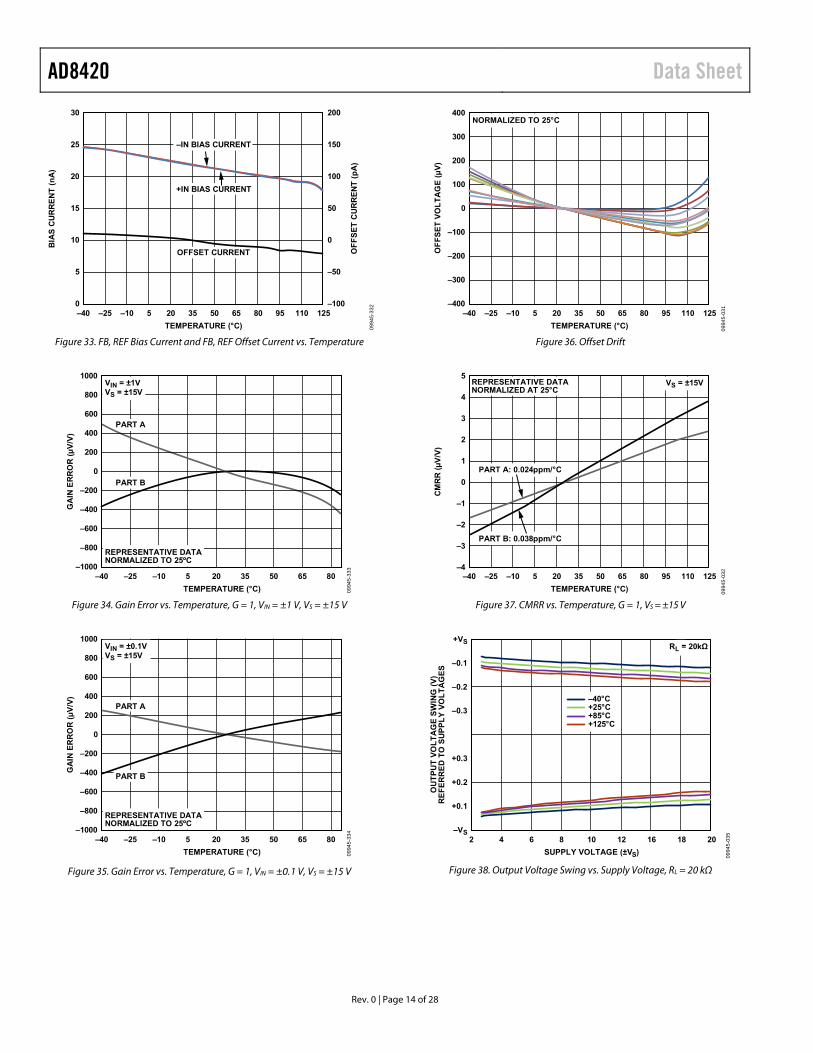
Figure 33. FB, REF Bias Current and FB, REF Offset Current vs. Temperature
1000
–1000
–800
–600
–400
–200
0
200
400
600
800
–40 80655035205–10–25
GA
IN E
RR
OR
(µV/
V)
TEMPERATURE (°C)
PART A
VIN = ±1VVS = ±15V
PART B
0994
5-33
3
REPRESENTATIVE DATANORMALIZED TO 25ºC
Figure 34. Gain Error vs. Temperature, G = 1, VIN = ±1 V, VS = ±15 V
1000
–1000
–800
–600
–400
–200
0
200
400
600
800
–40 80655035205–10–25
GA
IN E
RR
OR
(µV/
V)
TEMPERATURE (°C)
PART A
VIN = ±0.1VVS = ±15V
PART B
0994
5-33
4
REPRESENTATIVE DATANORMALIZED TO 25ºC
Figure 35. Gain Error vs. Temperature, G = 1, VIN = ±0.1 V, VS = ±15 V
400
–400
–300
–200
–100
0
100
200
300
–40 –25 –10 5 20 35 50 65 80 95 110 125
OFF
SET
VOLT
AG
E (µ
V)
TEMPERATURE (°C) 0994
5-03
1
NORMALIZED TO 25°C
Figure 36. Offset Drift
–40 –25 –10 5 20 35 50 65 80 95 110 125
CM
RR
(µV/
V)
TEMPERATURE (°C) 0994
5-03
2–4
5
4
3
2
1
0
–1
–2
–3
PART A: 0.024ppm/°C
PART B: 0.038ppm/°C
REPRESENTATIVE DATANORMALIZED AT 25°C
VS = ±15V
Figure 37. CMRR vs. Temperature, G = 1, VS = ±15 V
+VS
–VS
+0.3
+0.2
+0.1
–0.3
–0.2
–0.1
2 218161210864
OU
TPU
T VO
LTA
GE
SWIN
G (V
)R
EFER
RED
TO
SU
PPLY
VO
LTA
GES
SUPPLY VOLTAGE (±VS)0
–40°C+25°C+85°C+125°C
RL = 20kΩ
0994
5-03
5
Figure 38. Output Voltage Swing vs. Supply Voltage, RL = 20 kΩ

Data Sheet AD8420
Rev. 0 | Page 15 of 28
+VS
–VS
+0.6
+0.8
+0.4
+0.2
–0.6
–0.8
–0.4
–0.2
1k 10k 100k 1M
OU
TPU
T VO
LTA
GE
SWIN
G (V
)R
EFER
RED
TO
SU
PPLY
VO
LTA
GES
LOAD RESISTANCE (Ω)
0994
5-33
8
–40°C+25°C+85°C+125°C
VS = 5VVREF = 2.5V
Figure 39. Output Voltage Swing vs. Load Resistance, VS = 5 V
+VS
–VS
+0.6
+0.8
+0.4
+0.2
–0.6
–0.8
–0.4
–0.2
0.1 1
OU
TPU
T VO
LTA
GE
SWIN
G (V
)R
EFER
RED
TO
SU
PPLY
VO
LTA
GES
OUTPUT CURRENT (mA)
0994
5-50
1
–40°C+25°C+85°C+125°C
VS = 5VVREF = 2.5V
Figure 40. Output Voltage Swing vs. Load Resistance, VS = 5 V
15
10
5
0
–5
–10
–151k 10k 100k 1M
OU
TPU
T VO
LTA
GE
SWIN
G (V
)
LOAD RESISTANCE (Ω)
–40°C+25°C+85°C+125°C
0994
5-33
9
Figure 41. Output Voltage Swing vs. Load Resistance, VS = ±15 V
+VS
–VS
–0.2
–0.4
–0.6
–0.8
+0.8
+0.6
+0.4
+0.2
0.1 1
OU
TPU
T VO
LTA
GE
SWIN
G (V
)R
EFER
RED
TO
SU
PPLY
VO
LTA
GES
OUTPUT CURRENT (mA)
–40°C+25°C+85°C+125°C
0994
5-34
0
Figure 42. Output Voltage Swing vs. Output Current, VS = ±15
1k
2k
100
200.1 1 10 100 1k 10k 100k
NO
ISE
(nV/
Hz)
FREQUENCY (Hz) 0994
5-04
2
GAIN = 100
GAIN = 10
GAIN = 1
Figure 43. Voltage Noise Spectral Density vs. Frequency, RTI
0994
5-04
3
0.4µV/DIV 1s/DIV
Figure 44. 0.1 Hz to 10 Hz RTI Voltage Noise, G = 1

AD8420 Data Sheet
Rev. 0 | Page 16 of 28
1k
100
101 10 100 100k10k1k
NO
ISE
(fA/
Hz)
FREQUENCY (Hz) 0994
5-34
8
Figure 45. Current Noise Spectral Density vs. Frequency
0994
5-14
7
1.5pA/DIV 1s/DIV
Figure 46. 0.1 Hz to 10 Hz Current Noise
30
0
3
6
9
12
15
18
21
24
27
1 10 100 1k 10k 100k 1M
OU
TPU
T VO
LTA
GE
(V p
-p)
FREQUENCY (Hz) 0994
5-14
8
VS = ±15V, G = 15V/V
VS = +5V, G = 5V/V
Figure 47. Large Signal Frequency Response
0.02%/DIV
1V/DIV
20µs/DIV
VS = ±5V
1.78µs TO 0.1%3.31µs TO 0.01%
0994
5-14
9
Figure 48. Large Signal Pulse Response and Settling Time, G = 1
0.02%/DIV
4.5V/DIV
200µs/DIV
VS = ±5V
67µs TO 0.1%138µs TO 0.01%
0994
5-15
0
Figure 49. Large Signal Pulse Response and Settling Time, G = 10
0.02%/DIV
4.5V/DIV
20ms/DIV
VS = ±5V
600ms TO 0.1%1.04ms TO 0.01%
0994
5-15
1
Figure 50. Large Signal Pulse Response and Settling Time, G = 100

Data Sheet AD8420
Rev. 0 | Page 17 of 28
0994
5-05
1
20mV/DIV 4µs/DIV
Figure 51. Small Signal Pulse Response, G = 1, RL = 20 kΩ, CL = 100 pF
0994
5-05
2
20mV/DIV 20µs/DIV
Figure 52. Small Signal Pulse Response, G = 10, RL = 20 kΩ, CL = 100 pF
0994
5-05
3
20mV/DIV 200µs/DIV
Figure 53. Small Signal Pulse Response, G = 100, RL = 20 kΩ, CL = 100 pF
0994
5-05
4
20mV/DIV 2ms/DIV
Figure 54. Small Signal Pulse Response, G = 1000, RL = 20 kΩ, CL = 100 pF
0994
5-05
5
20mV/DIV 5µs/DIV
NO LOAD220pF470pF780pF
Figure 55. Small Signal Response with Various Capacitive Loads, G = 1, RL = ∞
0 43530252015105
SUPP
LY C
UR
REN
T (µ
A)
SUPPLY VOLTAGE (V) 0994
5-05
750
90
85
80
75
70
65
60
55
0
Figure 56. Supply Current vs. Supply Voltage

AD8420 Data Sheet
Rev. 0 | Page 18 of 28
60 332282420161284
OFF
SET
VOLT
AG
E (µ
V)
SUPPLY VOLTAGE (V) 0994
5-50
2–200
–180
–160
–140
–120
–100
–80
–60
–40
–20
90TESTED WITH DUAL SUPPLIESCENTERED AT 0V
Figure 57. Offset Voltage vs. Supply Voltage

Data Sheet AD8420
Rev. 0 | Page 19 of 28
THEORY OF OPERATION
+IN
–IN
gm1
I2I1
I3
+
–+VS
–VS
+VS
–VS
+VS
–VS
R2
R1
VOUT
FB
REF
AD8420
0994
5-05
8
gm2
ESDPROTECTION
A+
–
Vb
ESDPROTECTION
Figure 58. Simplified Schematic
ARCHITECTURE The AD8420 is based on an indirect current feedback topology consisting of three amplifiers: two matched transconductance amplifiers that convert voltage to current and one integrator amplifier that converts current to voltage.
For the AD8420, assume that all initial voltages and currents are zero until a positive differential voltage is applied between the inputs, +IN and −IN. Transconductance Amplifier gm1 converts this input voltage into a current, I1. Because the voltage across gm2 is initially zero, I2 is zero and I3 equals I1.
I3 is integrated to the output, making the output voltage, VOUT, increase. This voltage continues to increase until the same differ-ential input voltage across the inputs of gm1 is replicated across the inputs of gm2, generating a current (I2) equal to I1. This reduces the Difference Current I3 to zero so that the output remains at a stable voltage. The gain in the configuration shown in Figure 58 is set by R2 and R1.
In traditional instrumentation amplifiers, the input common-mode voltage can limit the available output swing, typically depicted in a hexagon plot. Because the AD8420 converts the input differential signals to current, this limit does not apply. This is particularly important when amplifying a signal with a common-mode voltage near one of the supply rails.
To improve robustness and ease of use, the AD8420 includes overvoltage protection on its inputs. This protection scheme allows wide differential input voltages without damaging the part.
SETTING THE GAIN The transfer function of the AD8420 is
VOUT = G(V+IN − V−IN) + VREF
where:
R1R2G +=1
Table 7. Suggested Resistors for Various Gains, 1% Resistors R1 (kΩ) R2 (kΩ) Gain None Short 1.00 49.9 49.9 2.00 20 80.6 5.03 10 90.9 10.09 5 95.3 20.06 2 97.6 49.8 1 100 101 1 200 201 1 499 500 1 1000 1001
While the ratio of R2 to R1 sets the gain, the designer determines the absolute value of the resistors. Larger values reduce power consumption and output loading; smaller values limit the FB input bias current and offset current error. For best output swing and distortion performance, keep (R1 + R2) || RL ≥ 20 kΩ.
A method that allows large value feedback resistors while limiting FB bias current error is to place a resistor of value R1 || R2 in series with the REF terminal, as shown in Figure 59. At higher gains, this resistor can simply be the same value as R1.
AD8420
+IN
–IN REF
FB
VOUT
G = 1 + R2R1
IB+
IB–
VREF
R1 R2R1||R2
+
–
IBR
IBF
0994
5-05
9
Figure 59. Cancelling Out Error from FB Input Bias Current

AD8420 Data Sheet
Rev. 0 | Page 20 of 28
GAIN ACCURACY Unlike most instrumentation amplifiers, the relative match of the two gain setting resistors determines the gain accuracy of the AD8420 rather than a single resistor. For example, if two resistors have exactly the same absolute error, there is no error in gain. Conversely, two 1% resistors can cause approximately 2% maximum gain error at high gains. Temperature coefficient mismatch of the gain setting resistors increases the gain drift of the instrumentation amplifier circuit. Because these external resistors do not have to match any on-chip resistors, resistors with good TC tracking can achieve excellent gain drift.
When the differential voltage at the inputs approaches the differential input limit, the diodes start to conduct, limiting the voltage seen by the inputs. This can look like increased gain error at large differential inputs. Performance of the AD8420 is specified for ±1 V differential from −40°C to +85°C. However, at higher temperatures, the reduced forward voltage of the diodes limits the differential input to a smaller voltage. Figure 60 tracks 1% error across the operating temperature range to show the effect of temperature on the input limit.
–40 –25 –10 5 20 35 50 65 80 95 110 125
MA
XIM
UM
INPU
T VO
LTA
GE
(1%
ER
RO
R)
TEMPERATURE (°C) 0994
5-50
30
2.0
1.8
1.6
1.4
1.2
1.0
0.8
0.6
0.4
0.2
POSITIVE VOLTAGE
NEGATIVE VOLTAGE VS = ±15V
Figure 60. Differential Input Limit vs. Temperature
INPUT VOLTAGE RANGE The allowed input range of the AD8420 is much simpler than traditional architectures. For the transfer function of the AD8420 to be valid, the input voltage should follow two rules:
• Keep the differential input voltage within ±1 V. • Keep the voltage on the +IN, −IN, REF, and FB pins in the
specified input voltage range.
Because the output swing is completely independent of the input common-mode voltage, there are no hexagonal figures or complicated formulas to follow, and no limitation for the output swing the amplifier has for input signals with changing common mode.
INPUT PROTECTION The current into the AD8420 inputs is limited internally. This ensures that the diodes that limit the differential voltage seen by the internal amplifier do not draw excessive current when they turn on. The part can handle large differential input voltages, regardless of the amount of gain applied, without damage. As a result, the AD8420 inputs are protected from voltages beyond the positive rail. If voltages beyond the negative rail are expected, external protection must be used.
Keep all of the AD8420 terminals within the voltage range specified in the Absolute Maximum Ratings section. All terminals of the AD8420 are protected against ESD.
Input Voltages Beyond the Rails For applications that require protection beyond the negative rail, one option is to use an external resistor in series with each input to limit current during overload conditions. In this case, size the resistors to limit the current into the AD8420 to 6 mA.
RPROTECT ≥ (Negative Supply − VIN)/6 mA
Although the AD8420 inputs must still be kept within the −VS + 40 V limitation, the I × R drop across the protection resistor increases the protection on the positive side to approximately
(40 V + Negative Supply) + 300 μA × RPROTECT
An alternate protection method is to place diodes at the AD8420 inputs to limit voltage and resistors in series with the inputs to limit the current into these diodes. To keep input bias current at a minimum for normal operation, use low leakage diode clamps, such as the BAV199. The AD8420 also combines well with TVS diodes, such as the PTVSxS1UR.
SIMPLE METHOD ALTERNATE METHOD
AD8420
RPROTECT
RPROTECT
RPROTECT
RPROTECT
VIN++
–
VIN–
VIN+
VIN–+
–
+VS
AD8420
–VS
+VS
–VS
+VS
–VS
+VS
–VS
I+
–
+
–
0994
5-16
0
Figure 61. Protection for Voltages Beyond the Rails
Large Differential Input Voltage
The AD8420 is able to handle large differential input voltage without damage to the part. Refer to Figure 9, Figure 10, Figure 11, and Figure 12 for overvoltage performance. The AD8420 differential voltage is internally limited with diodes to ±1 V. If this limit is exceeded, the diodes start to conduct and draw current, as shown in Figure 22. This current is limited internally to a value that is safe for the AD8420, but if the input current cannot be tolerated in the system, place resistors in series with each input with the following value:
⎟⎟⎠
⎞⎜⎜⎝
⎛ −≥
MAX
DIFFPROTECT I
VR
V121

Data Sheet AD8420
Rev. 0 | Page 21 of 28
Reference LAYOUT The output voltage of the AD8420 is developed with respect to the potential on the reference terminal. Take care to tie REF to the appropriate local ground. The differential voltage at the inputs is reproduced between the REF and FB pins; therefore, it is important to set VREF so that the voltage at FB does not exceed the input range.
Common-Mode Rejection Ratio over Frequency
Poor layout can cause some of the common-mode signal to be converted to a differential signal before reaching the in-amp. This conversion can occur when the path to the positive input pin has a different frequency response than the path to the negative input pin. For best CMRR vs. frequency performance, the input source impedance and capacitance of each path should be closely matched. This includes connecting Pin 1 to −VS, which matches the parasitic capacitance and the leakage between the inputs and adjacent pins. Place additional source resistance in the input path (for example, for input protection) close to the in-amp inputs to minimize their interaction with the parasitic capacitance from the printed circuit board (PCB) traces.
DRIVING THE REFERENCE PIN Traditional instrumentation amplifier architectures require the reference pin to be driven with a low impedance source. In these architectures, impedance at the reference pin degrades both CMRR and gain accuracy. With the AD8420 architecture, resistance at the reference pin has no effect on CMRR.
AD8420
+IN
–IN REF
FB
VOUT
G = 1 +R2 + RREF
R1 VREF
R1 R2RREF
0994
5-06
2
Power Supplies
Use a stable dc voltage to power the instrumentation amplifier. Noise on the supply pins can adversely affect performance. For more information, see the PSRR performance curves in Figure 24 and Figure 25.
Place a 0.1 μF capacitor as close as possible to each supply pin. As shown in Figure 62, a 10 μF tantalum capacitor can be used farther away from the part. This capacitor, which is intended to be effective at low frequencies, can usually be shared by other precision integrated circuits. Keep the traces between these integrated circuits short to minimize interaction of the trace parasitic inductance with the shared capacitor.
Figure 63. Calculating Gain with Reference Resistance
Resistance at the reference pin does affect the gain of the AD8420, but if this resistance is constant, the gain setting resistors can be adjusted to compensate. For example, the AD8420 can be driven with a voltage divider as shown in Figure 64.
R1 R2
AD8420
+VS
+IN
–IN
0.1µF 10µF
0.1µF 10µF
–VS
VOUT
0994
5-06
0
AD8420
+IN
–IN REF
FB
VOUT
G = 1 +R2 + R3||R4
R1
R1 R2
R3
R4
VS
0994
5-06
3
Figure 64. Using Resistor Divider to Set Reference Voltage
Figure 62. Supply Decoupling, REF, and Output Referred to Local Ground

AD8420 Data Sheet
Rev. 0 | Page 22 of 28
CAPACITIVELY COUPLED
+VS
C
R
R
C
–VS
AD84201fHIGH-PASS = 2πRC
THERMOCOUPLE
+VS
–VS
10MΩ
AD8420
TRANSFORMER
+VS
–VS
AD8420
CORRECT
VOUT
VOUT
THERMOCOUPLE
+VS
–VS
AD8420
CAPACITIVELY COUPLED
+VS
C
C
–VS
AD8420
TRANSFORMER
+VS
–VS
AD8420
INCORRECT
VOUT
VOUT
VOUT VOUT
0994
5-06
1
Figure 65. Creating an IBIAS Path
INPUT BIAS CURRENT RETURN PATH The input bias current of the AD8420 must have a return path to ground. When the source, such as a thermocouple, cannot provide a return current path, create one, as shown in Figure 65.
RADIO FREQUENCY INTERFERENCE (RFI) All instrumentation amplifiers can rectify high frequency out-of-band signals. Once rectified, these signals appear as dc offset errors at the output. High frequency signals can be filtered with a low-pass RC network placed at the input of the instrumentation amplifier, as shown in Figure 66. The filter limits the input signal bandwidth according to the following relationship:
)2(π21
CDDIFF CCR
uencyFilterFreq+
=
CCM RC
uencyFilterFreqπ2
1=
where CD ≥ 10 C
VOUT
R1 R2
+IN
+VS
–VS
CC330pF
5%
CC330pF
5%
10µF
10µF
CD3300pF
0.1µF
0.1µF
R20kΩ1%
R20kΩ1%
AD8420–IN
0994
5-06
4
Figure 66. Suggested RFI Suppression Filter
CD affects the differential signal and CC affects the common-mode signal. Values of R and CC are chosen to minimize out of band RFI at the expense of reduced signal bandwidth. Mismatch between the R × CC at the positive input and the R × CC at the negative input degrades the CMRR of the AD8420. By using a value of CD that is at least one magnitude larger than CC, the effect of the mismatch is reduced and performance is improved. C.
Data Sheet AD8420
Rev. 0 | Page 23 of 28
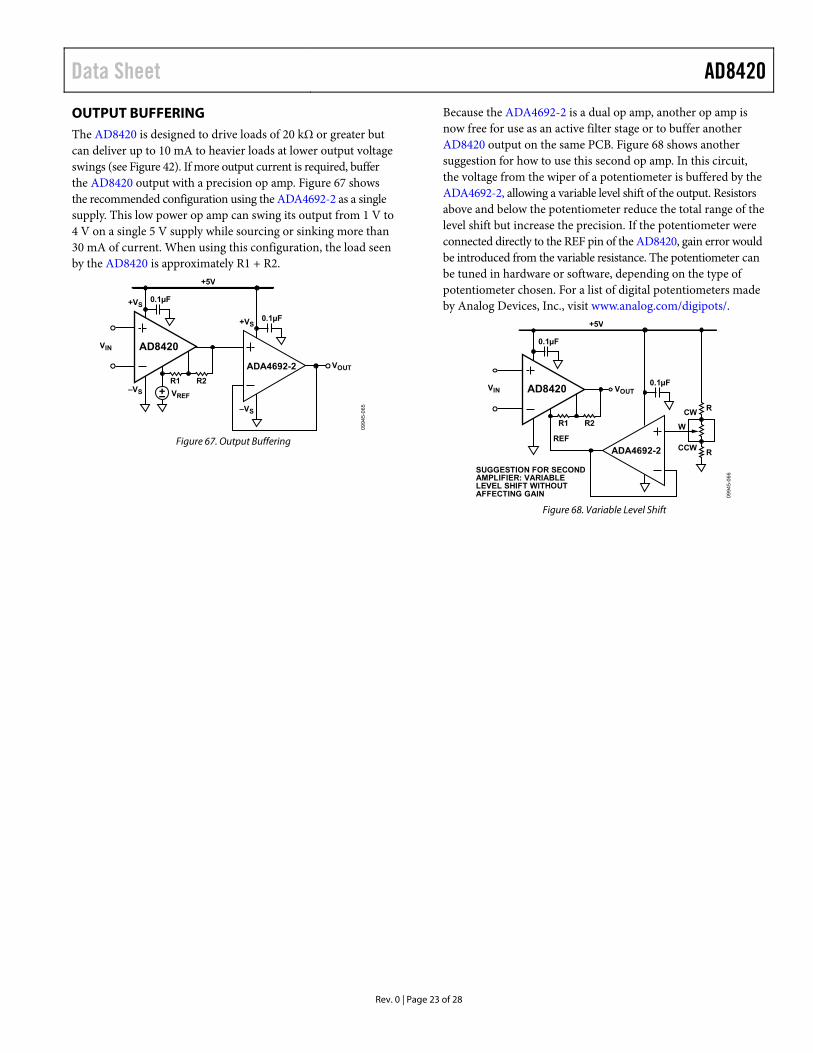
OUTPUT BUFFERING The AD8420 is designed to drive loads of 20 kΩ or greater but can deliver up to 10 mA to heavier loads at lower output voltage swings (see Figure 42). If more output current is required, buffer the AD8420 output with a precision op amp. Figure 67 shows the recommended configuration using the ADA4692-2 as a single supply. This low power op amp can swing its output from 1 V to 4 V on a single 5 V supply while sourcing or sinking more than 30 mA of current. When using this configuration, the load seen by the AD8420 is approximately R1 + R2.
R1 R2
+5V
–VS
+VS
–VS
+VS
0.1µF
VOUT
0.1µF
ADA4692-2
VIN AD8420
VREF
0994
5-06
5
Figure 67. Output Buffering
Because the ADA4692-2 is a dual op amp, another op amp is now free for use as an active filter stage or to buffer another AD8420 output on the same PCB. Figure 68 shows another suggestion for how to use this second op amp. In this circuit, the voltage from the wiper of a potentiometer is buffered by the ADA4692-2, allowing a variable level shift of the output. Resistors above and below the potentiometer reduce the total range of the level shift but increase the precision. If the potentiometer were connected directly to the REF pin of the AD8420, gain error would be introduced from the variable resistance. The potentiometer can be tuned in hardware or software, depending on the type of potentiometer chosen. For a list of digital potentiometers made by Analog Devices, Inc., visit www.analog.com/digipots/.
R1 R2
+5V
0.1µF
VOUT0.1µF
ADA4692-2
VIN AD8420
REF
R
R
CW
W
CCW
SUGGESTION FOR SECONDAMPLIFIER: VARIABLELEVEL SHIFT WITHOUTAFFECTING GAIN 09
945-
066
Figure 68. Variable Level Shift

AD8420 Data Sheet
Rev. 0 | Page 24 of 28
APPLICATIONS INFORMATION AD8420 IN ELECTROCARDIOGRAPHY (ECG) A high-pass filter is commonly used in ECG signal conditioning circuitry to remove electrode offset and motion artifacts. To avoid degrading the input impedance and CMRR of the system, this filtering is typically implemented after the instrumentation amplifier, which limits the gain that can be applied with the instrumentation amplifier.
With a 3-op-amp instrumentation amplifier, gain is applied in the first stage. Because of this, the electrode offset is gained and then must be removed afterward with a high-pass filter. In the AD8420
architecture, the offset can be accounted for in the input stage by unbalancing the transconductance amplifier at the REF and FB pins. In the steady state, the offset at the input is not gained to the output, and higher frequency signals can be gained and passed through. Using the AD8420 in this way, the offset tolerance is nearly the differential input range of the part (±1 V).
Figure 69 shows an ECG front end that applies a gain of 100 to the signal while rejecting dc and high frequencies. This circuit combines the AD8420 with the AD8657, which is a low power, low cost, dual, precision CMOS op amp.
–5V8200pF
10MΩ
INSTRUMENTATIONAMPLIFIER
G = +100
AD8420
+5V
–5V
+5V
3.3μF
A B
C
0994
5-07
2
402kΩ
200pF
200pF
2000pF
100kΩ
100kΩ
+5V
–5V
AD8657-2AD8657-1
REF
FB 100kΩ
1kΩ
200kΩ
200kΩ
0.015μF
THREE-POLE LPF,BESSEL RESPONSE
FC = 50Hz
INTEGRATOR PROVIDESHIGH-PASS POLE AT 0.5Hz
110kΩ
0.022μF500kΩ
Figure 69. AD8420 in an ECG Front End

Data Sheet AD8420
Rev. 0 | Page 25 of 28
CLASSIC BRIDGE CIRCUIT Figure 70 shows the AD8420 configured to amplify the signal from a classic resistive bridge. This circuit works in dual-supply mode or single-supply mode. Typically, the same voltage that powers the instrumentation amplifier excites the bridge. Connecting the bottom of the bridge to the negative supply of the instrumentation amplifier sets up an input common-mode voltage that is located midway between the supply voltages. The voltage on the REF pin can be varied to suit the application. For example, the REF pin is tied to the VREF pin of an analog-to-digital converter (ADC) whose input range is (VREF ± VIN). With an available output swing on the AD8420 of (−VS + 100 mV) to (+VS − 150 mV), the maximum programmable gain is simply this output range divided by the input range.
+VS
–VS
0.1µF
0.1µF
VOUT
VREF
VDIFF AD8420
0994
5-06
9
Figure 70. Classic Bridge Circuit
4 mA TO 20 mA SINGLE-SUPPLY RECEIVER The 80 μA maximum supply current, input range that goes below ground, and low drift characteristics make the AD8420 a very good candidate for use in a 4 mA to 20 mA loop. Figure 71 shows how a signal from a 4 mA to 20 mA transducer can be interfaced to the AD8420. The signal from a 4 mA to 20 mA transducer is single-ended, which initially suggests the need for a simple shunt resistor to ground to convert the current to a voltage. However, any line resistance in the return path (to the transducer) adds a current-dependent offset error; therefore, the current must be sensed differentially.
In this example, a 5 Ω shunt resistor generates a differential voltage at the inputs of the AD8420 between 20 mV (for 4 mA in) and 100 mV (for 20 mA in) with a very low common-mode value. With the gain resistors shown, the AD8420 amplifies the 100 mV input voltage by a factor of 40 to 4.0 V.
0994
5-07
3AD627LINE
IMPEDANCE 4mA TO 20mA 5Ω4mA TO 20mATRANSDUCER
R2 = 97.6kΩR1 = 2.49kΩ
0.1µF
5V
AD8420
R2R1
G = 40
POWERSUPPLY
+ –+
–
0.8V TO 4.0V
Figure 71. 4 mA to 20 mA Receiver Circuit

AD8420 Data Sheet
Rev. 0 | Page 26 of 28
OUTLINE DIMENSIONS
COMPLIANT TO JEDEC STANDARDS MO-187-AA
6°0°
0.800.550.40
4
8
1
5
0.65 BSC
0.400.25
1.10 MAX
3.203.002.80
COPLANARITY0.10
0.230.09
3.203.002.80
5.154.904.65
PIN 1IDENTIFIER
15° MAX0.950.850.75
0.150.05
10-0
7-20
09-B
Figure 72. 8-Lead Mini Small Outline Package [MSOP]
(RM-8) Dimensions shown in millimeters
ORDERING GUIDE
Model1 Temperature Range Package Description PackageOption Branding
AD8420ARMZ −40°C to +85°C 8-Lead Mini Small Outline Package [MSOP], Tube RM-8 Y3Y AD8420ARMZ-R7 −40°C to +85°C 8-Lead Mini Small Outline Package [MSOP], 7-Inch Tape and Reel RM-8 Y3Y AD8420ARMZ-RL −40°C to +85°C 8-Lead Mini Small Outline Package [MSOP], 13-Inch Tape and Reel RM-8 Y3Y 1 Z = RoHS Compliant Part.

Data Sheet AD8420
Rev. 0 | Page 27 of 28
NOTES

AD8420 Data Sheet
Rev. 0 | Page 28 of 28
NOTES
©2012 Analog Devices, Inc. All rights reserved. Trademarks and registered trademarks are the property of their respective owners. D09945-0-3/12(0)