why use pdf graphs for reports? - amazon web services use pdf graphs for reports? roger yanda...
TRANSCRIPT

'
&
$
%
Why use PDF graphsfor reports?
Roger Yanda
mobile: 719-321-4188Colorado Springs, CO
January 2, 2011v 1.0.0

Why use PDF? CONTENTS January 2, 2011
Contents
1 PDF vector graphics vs. Jpeg images 3
1.1 PDF vector graphics -> no loss of quality on Zoom . . . . . . . . . . . . . 3
1.2 Jpeg images -> loss of graph quality on Zoom . . . . . . . . . . . . . . . . 10
A Revision History 15
PDF Capabilitiesv 1.0.0
1 of 15 Roger [email protected]
mobile: 719-321-4188

Why use PDF? LIST OF FIGURES January 2, 2011
List of Figures
1.1 Right Click on a figure for Marquee Zoom . . . . . . . . . . . . . . . . . . 3
1.2 Try Marquee Zoom on this PDF graphic . . . . . . . . . . . . . . . . . . . 4
1.3 Marquee Zoom #1 on the bottom graph . . . . . . . . . . . . . . . . . . . 5
1.4 Resulting view of the Zoom #1 . . . . . . . . . . . . . . . . . . . . . . . . 5
1.5 Marquee Zoom #2 portion of the graph . . . . . . . . . . . . . . . . . . . . 6
1.6 Marquee Zoom #2 results . . . . . . . . . . . . . . . . . . . . . . . . . . . 7
1.7 Marquee Zoom #3 selection . . . . . . . . . . . . . . . . . . . . . . . . . . 8
1.8 Marquee Zoom 3 results . . . . . . . . . . . . . . . . . . . . . . . . . . . . 9
1.9 Excel Jpeg image . . . . . . . . . . . . . . . . . . . . . . . . . . . . . . . . 10
1.10 Right Click for Marquee Zoom . . . . . . . . . . . . . . . . . . . . . . . . 11
1.11 Marquee Zoom #1 on Jpeg image . . . . . . . . . . . . . . . . . . . . . . . 12
1.12 Marquee Zoom #1 on Jpeg image results . . . . . . . . . . . . . . . . . . . 12
1.13 Marquee Zoom #2 on Jpeg image . . . . . . . . . . . . . . . . . . . . . . . 13
1.14 Marquee Zoom #2 Results on Jpeg image . . . . . . . . . . . . . . . . . . 13
PDF Capabilitiesv 1.0.0
2 of 15 Roger [email protected]
mobile: 719-321-4188

Why use PDF? Chapter 1. PDF vector graphics vs. Jpeg images January 2, 2011
Chapter 1
PDF vector graphics vs. Jpeg images
1.1 PDF vector graphics -> no loss of quality on Zoom
In Adobe Reader, right click for ”Marquee Zoom”
Figure 1.1: Right Click on a figure for Marquee Zoom
PDF Capabilitiesv 1.0.0
3 of 15 Roger [email protected]
mobile: 719-321-4188

Why use PDF? Chapter 1. PDF vector graphics vs. Jpeg images January 2, 2011
To test this out yourself, try marquee zoomon figure: 1.2
Figure 1.2: Try Marquee Zoom on this PDF graphic
OSName metric n mean min 1stQ median 3rdQ maxHP‐UX GBL_CPU_TOTAL_UTIL 2174 71.56 45.82 53.63 77.45 79.18 99.99HP‐UX GBL_CPU_TOTAL_UTIL 2304 61.47 19.26 45.48 53.5 74.27 100HP‐UX GBL_CPU_TOTAL_UTIL 2304 61.38 54.84 55.27 55.745 57.84 99.9HP‐UX GBL_CPU_TOTAL_UTIL 2208 59.99 9.17 39.34 53.765 83.54 100NT GBL_CPU_TOTAL_UTIL 2303 41.61 0.4 38.88 40.72 45.74 77.21HP‐UX GBL_CPU_TOTAL_UTIL 2304 41.51 2.1 23.485 40.445 56.87 99.83HP‐UX GBL_CPU_TOTAL_UTIL 2304 41.18 19.45 22.76 24.585 68.65 98.87HP‐UX GBL_CPU_TOTAL_UTIL 2304 33.54 6.42 22.23 32.4 41.8 94.82HP‐UX GBL_CPU_TOTAL_UTIL 2304 31.39 3.1 3.73 4.14 99.99 100NT GBL_CPU_TOTAL_UTIL 2304 28.88 0.88 3.84 38.67 39.95 92.93NT GBL_CPU_TOTAL_UTIL 2304 28.49 4.66 14.92 26.335 39.725 83.04NT GBL_CPU_TOTAL_UTIL 2304 25.93 2.28 6.185 12.61 47.015 86.71NT GBL_CPU_TOTAL_UTIL 2304 24.72 16.39 23.29 24.91 26.175 47.48NT GBL_CPU_TOTAL_UTIL 2304 23.32 2.18 15.965 19.96 26.855 85.34NT GBL_CPU_TOTAL_UTIL 2304 20.08 1.07 7.135 16.7 24.235 106.47NT GBL_CPU_TOTAL_UTIL 2304 18.06 0.54 7.305 15.87 24.88 92.76NT GBL_CPU_TOTAL_UTIL 2304 15.94 2.98 8.57 15.735 20.455 61.85HP‐UX GBL_CPU_TOTAL_UTIL 2304 14.98 1.42 6.27 11.75 19.72 72HP‐UX GBL_CPU_TOTAL_UTIL 2304 13.66 4.87 5.58 6.115 15.66 80.61NT GBL_CPU_TOTAL_UTIL 2304 12.25 0.21 2.315 8.785 19.445 71.74HP‐UX GBL_CPU_TOTAL_UTIL 2304 12.22 3 4.77 10.785 12.91 78.98NT GBL_CPU_TOTAL_UTIL 2304 12.05 5.01 9.1 11.425 13.705 63.02NT GBL_CPU_TOTAL_UTIL 2304 11.98 9.22 10.19 10.775 11.735 29.37HP‐UX GBL_CPU_TOTAL_UTIL 2304 11.88 2.09 7.735 10.575 15.125 53.62NT GBL_CPU_TOTAL_UTIL 2304 11.34 4.41 4.86 5.84 18.42 58.68HP‐UX GBL_CPU_TOTAL_UTIL 2304 11.25 3.41 4.6 5.335 7.085 100NT GBL_CPU_TOTAL_UTIL 2304 11.18 0.22 1.925 7.435 17.73 67.67NT GBL_CPU_TOTAL_UTIL 2304 11.05 0.73 6.7 8.77 13.495 55.13
0
10
20
30
40
50
60
70
80
1 5 9 13 17 21 25 29 33 37 41 45 49 53 57 61 65 69 73 77 81 85 89
mean
mean
0
20
40
60
80
100
120
1 5 9 13 17 2125 29 33 37 41 45 49 53 5761 65 69 73 77 81 85 89
max
3rdQ
mean
median
1stQ
min
NT GBL_CPU_TOTAL_UTIL 2302 10.79 0.68 3.62 8.415 14.67 76.96HP‐UX GBL_CPU_TOTAL_UTIL 2304 10.63 4.1 6.48 8.945 11.565 66.53NT GBL_CPU_TOTAL_UTIL 2304 10.55 7.54 8.44 9.29 9.97 56.55HP‐UX GBL_CPU_TOTAL_UTIL 2304 9.95 0.54 1.4 2.885 8.39 99.99HP‐UX GBL_CPU_TOTAL_UTIL 2301 9.89 7.63 8.07 8.34 8.78 74.84HP‐UX GBL_CPU_TOTAL_UTIL 2304 9.28 1.25 2.3 5.505 11.15 59.63NT GBL_CPU_TOTAL_UTIL 2304 9.21 0.24 1.62 6.21 14.585 55.04NT GBL_CPU_TOTAL_UTIL 2304 9.16 0.17 2.565 5.445 11.44 64.66HP‐UX GBL_CPU_TOTAL_UTIL 2304 8.75 2.3 3.78 5.05 8.28 56.8
0
10
20
30
40
50
60
70
80
1 5 9 13 17 21 25 29 33 37 41 45 49 53 57 61 65 69 73 77 81 85 89
mean
mean
0
20
40
60
80
100
120
1 5 9 13 17 2125 29 33 37 41 45 49 53 5761 65 69 73 77 81 85 89
max
3rdQ
mean
median
1stQ
min
Subsequent Marquee Zooms of 1.2 give the following images.
PDF Capabilitiesv 1.0.0
4 of 15 Roger [email protected]
mobile: 719-321-4188

Why use PDF? Chapter 1. PDF vector graphics vs. Jpeg images January 2, 2011
Figure 1.3: Marquee Zoom #1 on the bottom graph
Figure 1.4: Resulting view of the Zoom #1
PDF Capabilitiesv 1.0.0
5 of 15 Roger [email protected]
mobile: 719-321-4188

Why use PDF? Chapter 1. PDF vector graphics vs. Jpeg images January 2, 2011
Figure 1.5: Marquee Zoom #2 portion of the graph
PDF Capabilitiesv 1.0.0
6 of 15 Roger [email protected]
mobile: 719-321-4188

Why use PDF? Chapter 1. PDF vector graphics vs. Jpeg images January 2, 2011
Figure 1.6: Marquee Zoom #2 results
PDF Capabilitiesv 1.0.0
7 of 15 Roger [email protected]
mobile: 719-321-4188

Why use PDF? Chapter 1. PDF vector graphics vs. Jpeg images January 2, 2011
Figure 1.7: Marquee Zoom #3 selection
PDF Capabilitiesv 1.0.0
8 of 15 Roger [email protected]
mobile: 719-321-4188

Why use PDF? Chapter 1. PDF vector graphics vs. Jpeg images January 2, 2011
Figure 1.8: Marquee Zoom 3 results
PDF Capabilitiesv 1.0.0
9 of 15 Roger [email protected]
mobile: 719-321-4188
Why use PDF? Chapter 1. PDF vector graphics vs. Jpeg images January 2, 2011
1.2 Jpeg images -> loss of graph quality on Zoom
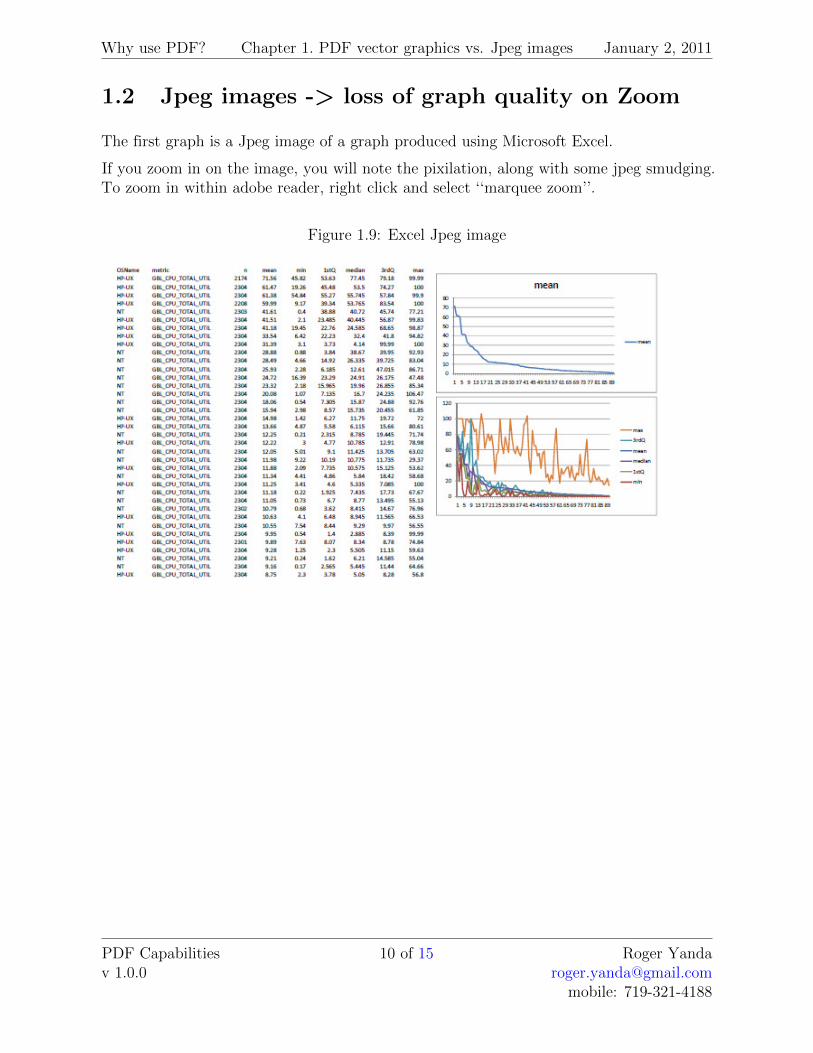
The first graph is a Jpeg image of a graph produced using Microsoft Excel.
If you zoom in on the image, you will note the pixilation, along with some jpeg smudging.To zoom in within adobe reader, right click and select ‘‘marquee zoom’’.
Figure 1.9: Excel Jpeg image
PDF Capabilitiesv 1.0.0
10 of 15 Roger [email protected]
mobile: 719-321-4188

Why use PDF? Chapter 1. PDF vector graphics vs. Jpeg images January 2, 2011
Figure 1.10: Right Click for Marquee Zoom
PDF Capabilitiesv 1.0.0
11 of 15 Roger [email protected]
mobile: 719-321-4188

Why use PDF? Chapter 1. PDF vector graphics vs. Jpeg images January 2, 2011
Figure 1.11: Marquee Zoom #1 on Jpeg image
Figure 1.12: Marquee Zoom #1 on Jpeg image results
PDF Capabilitiesv 1.0.0
12 of 15 Roger [email protected]
mobile: 719-321-4188

Why use PDF? Chapter 1. PDF vector graphics vs. Jpeg images January 2, 2011
Figure 1.13: Marquee Zoom #2 on Jpeg image
Figure 1.14: Marquee Zoom #2 Results on Jpeg image
PDF Capabilitiesv 1.0.0
13 of 15 Roger [email protected]
mobile: 719-321-4188

Why use PDF? Chapter 1. PDF vector graphics vs. Jpeg images January 2, 2011
The result is a very pixilated view of the graph. The PDF vector graphics solve this problemnicely.
PDF Capabilitiesv 1.0.0
14 of 15 Roger [email protected]
mobile: 719-321-4188

Why use PDF? Appendix A. Revision History January 2, 2011
Appendix A
Revision History
2011-01-02 v1.0.0 Initial release, Roger Yanda
PDF Capabilitiesv 1.0.0
15 of 15 Roger [email protected]
mobile: 719-321-4188