why do states adopt renewable portfolio standards?: …webuser.bus.umich.edu/tplyon/pdf/published...
TRANSCRIPT

131
Why Do States Adopt Renewable Portfolio Standards?: An Empirical Investigation
Thomas P. Lyon* and Haitao Yin**
Renewable portfolio standards (RPSs) for electricity generation are politically popular in many U.S. states although economic analysis suggests they are not first-best policies. We present an empirical analysis of the political and economic factors that drive state governments to adopt an RPS, and the factors that lead to the inclusion of in-state requirements given the adoption of an RPS. Although advocates claim an RPS will stimulate job growth, we find that states with high unemployment rates are slower to adopt an RPS. Local environmental conditions and preferences have no significant effect on the timing of adoption. Overall, RPS adoption seems to be driven more by political ideology and private interests than by local environmental and employment benefits, raising questions as to when environmental federalism serves the public interest.
1. IntRoDuctIon
The last decade witnessed widespread adoption by U.S. state governments of Renewable Portfolio Standards (RPSs) as a policy tool for promoting renewable electricity generation. An RPS ensures that a minimum amount of renewable energy (for example, wind, solar, biomass, and geothermal energy) is included in the state’s portfolio of electric generating resources, and—by increasing the required amount over time—the RPS can put the electricity industry on a path toward increasing sustainability.
The Energy Journal, Vol. 31, No. 3. Copyright ©2010 by the IAEE. All rights reserved.
* Dow Chemical Professor of Sustainable Science, Technology and Commerce, and Director, Erb Institute for Global Sustainable Enterprise, Stephen M. Ross School of Business and School of Natural Resources and Environment, University of Michigan. E-mail address: [email protected].
** Corresponding author. Assistant Professor, Antai College of Economics and Management, Shanghai Jiao Tong University; Faculty Affiliate, Erb Institute for Global Sustainable Enterprise, University of Michigan. Address: Building 10 Room 207, 535 Fahua Zhen Road, Shanghai, China, 200052. Tel: +86 15021862901; Fax: +86 21 52302519. E-mail address: [email protected].
132 / The Energy Journal
This new policy tool has been initiated by state governments in the absence of guiding federal regulations. The first RPS dates back to 1983, when Iowa passed the Alternative Energy Production law (revised in 1991) requiring its two investor-owned utilities—Mid-American and Interstate Power and Light—to contract for a combined total of 105 megawatts (MW) of generation from renewable energy resources. The policy became increasingly popular in the late 1990s. By the end of 2007, 29 states and the District of Columbia had created RPS programs.
Although state RPS policies are now a principal form of support for renewable energy projects, and more states are considering an RPS as concern about global warming grows, scholars have questioned the effectiveness and efficiency of this policy in reducing sulfur and carbon emissions. Michaels (2007, p.1) argues that “The actual record of state implementations [of RPS] has been largely symbolic. Only one state with a binding RPS requirement is currently in compliance with its own program.” Kniefel’s (2007) empirical analysis finds an RPS has little impact unless it is based on capacity, as opposed to generation. Palmer and Burtraw (2005) find a federal RPS would displace costly but relatively clean natural gas to a much greater extent than cheaper and dirtier coal, an environmentally perverse result that would not occur under a carbon tax or a cap-and-trade policy. Fischer and Newell (2008) find that an RPS is roughly twice as costly as an emissions price as a way to reduce greenhouse gas emissions, and is also inferior to a cap-and-trade program. Furthermore, some states restrict the locations from which firms can procure their renewable energy, further raising the inefficiency of an RPS.
In light of the foregoing concerns, it is unclear whether an RPS produces positive net economic value or not. Thus, it is puzzling that state governments have moved suddenly towards this policy. As Engel and Orbach (2008) point out, the policy appears to address global issues of sustainability and climate change more than localized pollution concerns, and hence is not an obvious state issue. Bushnell, Peterman, and Wolfram (2007) argue that such local initiatives have limited impact due to a leakage or reshuffling problem and suggest they are “largely symbolic unless they facilitate change beyond their local regions.” Michaels (2007, p. 1) goes further and argues that RPSs are “best viewed as special interest legislation for wind-driven generators, rather than rational responses to climate change and fossil-fuel powerplant emissions.”
This paper offers an empirical analysis of the factors that lead state governments to take environmental initiatives to tackle a problem that is global in nature, and to do so with an approach that is more costly than necessary. Understanding these political motivations in environmental policymaking is critical to finding the right allocation of powers between federal and state governments. In his survey on environmental federalism, Oates (2001) points out that economic theory calls for centralized policymaking for global public goods like climate change, because decentralized policy will lead to a “race to the
Why Do States Adopt Renewable Portfolio Standards? / 133
bottom.” Yet RPS adoption appears to be a case of a “race to the top,” suggesting that—contrary to received theory—decentralization may be desirable.
Rabe (2004) offers fascinating case studies of the growing role of the U.S. states in addressing climate change. He identifies a host of factors that appear to motivate states to adopt RPSs, including policy entrepreneurs supportive of the policy and a desire to wring economic development benefits from an RPS. Our paper is complementary to Rabe’s work, offering a quantitative analysis that allows us to test the generality of some of the factors identified by Rabe. Huang, Alavalapati, Carter, and Langholtz (2007) provide a cross-sectional analysis of state adoption of RPSs, and find that Democratic party legislative dominance is the most significant explanatory variable. However, cross-sectional analysis ignores information on adoption dynamics, and cannot employ time-varying explanatory variables. Utilizing a duration model and panel data, this paper avoids these caveats. We also include a wider range of critical explanatory variables, including renewable potential, organized renewable interests, and state electricity market characteristics.
In addition to the question of why states adopt RPSs in the first place, there are interesting questions regarding the structure of different states’ policies. One important difference across states lies in the tradability of Renewable Energy Credits (RECs). A REC is a certificate of proof that one kWh of electricity has been generated by a renewable-energy source. An RPS typically requires all electricity generators (or electricity retailers, depending on policy design) to demonstrate, by surrendering RECs, that they have provided an amount of renewable energy generation equivalent to the mandated percentage of their total annual kWh sales. Generators are typically allowed to decide for themselves whether to invest in renewable energy projects and generate their own RECs, or simply to purchase RECs from others.
The tradable REC system is meant to create incentives for generators to find the cheapest way possible to meet regulatory requirements. However, some states have imposed restrictions, called in-state requirements, on the system. They either disallow REC trading, require that a certain percentage of RECs must be purchased from within the state, or give extra credit to in-state renewable generation. These restrictions attempt to localize the economic and environmental benefits from RPS programs but risk a higher electricity price by foregoing the opportunity to use cheaper renewable resources from outside of the state; they may also risk running afoul of the U.S. Constitution’s Commerce Clause, which reserves to Congress the power to regulate commerce between the states. In this research, we study not only what drives states to adopt RPSs, but also what factors lead them to impose in-state requirements. This is particularly relevant considering the growing interest in creating a national market for RECs.
The rest of the paper proceeds as follows. In section two, we provide a theoretical discussion of the factors that may have an impact on the adoption and design of RPSs, and discuss the data we use to measure these factors. Section three presents our empirical model, and our findings regarding the relative importance
134 / The Energy Journal
of different factors in shaping a state’s decision of when to adopt an RPS. Section four explores the question of what factors influence the state decision regarding whether to include some sort of in-state requirement. Section five concludes the paper with a summary of the major findings.
2. DEtERmInAntS of RPS ADoPtIon AnD DESIgn
In this section we explore three alternative political economy theories of regulation and their explanations for the adoption and design of RPSs.1 The first posits that regulations are adopted to address market failures and serve the public interest (Joskow and Noll 1981). The second posits that regulations are instead adopted at the behest of the regulated, and structured to maximize their benefits (Stigler 1971). The third theory posits that ideology drives political and regulatory decisions (Kalt and Zupan 1984, Levitt 1996). We address each of these in turn below. As we proceed, we highlight a series of numbered research hypotheses, identifying those that apply to in-state requirements with an “a” after the number.
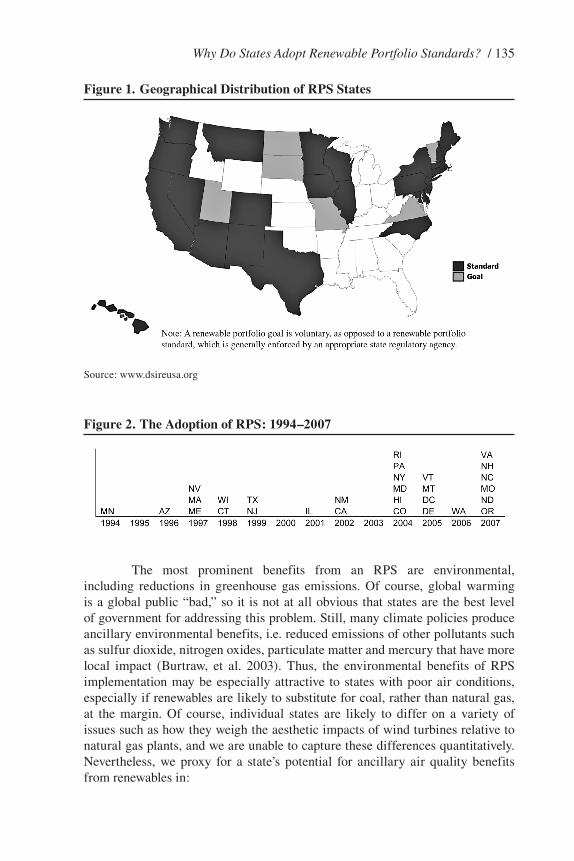
Before developing our hypotheses, we briefly present some additional background information on RPS adoption in the U.S. Figure 1 shows all the states that had an RPS as of 2007, and Figure 2 demonstrates the spread of RPSs over the last decade.
As mentioned earlier, some states include in their RPS programs certain additional restrictions on what type of supplies, or what geographic locations, are eligible to be counted in the RPS requirements. Table 1 summarizes the various in-state requirements.
2.1 Public Interest theory of Regulation
The public interest theory of regulation argues that regulation results from the need to protect the public from the negative impacts of market failures, such as pollution.2 Without government regulation, firms have no incentive to account for the external costs they impose on society when making production decisions. In essence, the public interest theory views the government as a benevolent welfare maximizer who balances the costs and benefits of regulations, so this theory predicts that RPS adoption is more likely in states where the benefits are high and the costs are low.
1. The literature on regulation is enormous, and includes branches focused on describing the economic effects of regulation (Averch and Johnson 1962, Joskow and Rose 1988, Crew 1999, Gilbert and Kahn 1996, Newbery 2000), and on designing optimal regulatory institutions (Laffont and Tirole 1993, Armstrong, Cowan, and Vickers 1994). Here, we are interested in the positive political economy of regulation, which develops and tests theories explaining the origins of regulation (Posner 1974, Peltzman 1976, Becker 1983, Peltzman, Levine, and Noll 1989, Lyon 2007).
2. Joskow and Noll (1981) provide perhaps the clearest exposition of the so-called “normative as positive” theory of regulation, although Posner (1974) also provides a good description of this perspective.
Why Do States Adopt Renewable Portfolio Standards? / 135
The most prominent benefits from an RPS are environmental, including reductions in greenhouse gas emissions. Of course, global warming is a global public “bad,” so it is not at all obvious that states are the best level of government for addressing this problem. Still, many climate policies produce ancillary environmental benefits, i.e. reduced emissions of other pollutants such as sulfur dioxide, nitrogen oxides, particulate matter and mercury that have more local impact (Burtraw, et al. 2003). Thus, the environmental benefits of RPS implementation may be especially attractive to states with poor air conditions, especially if renewables are likely to substitute for coal, rather than natural gas, at the margin. Of course, individual states are likely to differ on a variety of issues such as how they weigh the aesthetic impacts of wind turbines relative to natural gas plants, and we are unable to capture these differences quantitatively. Nevertheless, we proxy for a state’s potential for ancillary air quality benefits from renewables in:
figure 1. geographical Distribution of RPS States
Source: www.dsireusa.org
figure 2. the Adoption of RPS: 1994–2007

136 / The Energy Journal
Hypothesis 1: States with poor air conditions are more likely to adopt an RPS.
We construct a non-attainment index of local air conditions using information from the Environmental Protection Agency (EPA).3 Areas of the country where air pollution levels persistently exceed the national ambient air quality standards for any of the 8 criteria air pollutants are designated “non-attainment.” (We use six criteria here because two pollutants, 8-hour Ozone and PM-2.5, were not used by EPA until 2004 and 2005 respectively, and including them would bias our results.) Let POP
ij denote the population (in 2000) in state i
living in areas where air pollution exceeds national ambient air quality standard for pollutant j. The nonattainment index is
6
Σj=1
POPij
/POPi, where POP
i is the
population in state i in 2000. The index thus measures human exposure to the six criteria air pollutants in each state. Because an area may be in “non-attainment” status multiple times due to different air pollutants, this index may be greater
3. http://www.epa.gov/air/oaqps/greenbk/index.html
table 1. States with In-State RequirementsState In-State Requirements
Arizona Extra credit for in-state renewable generation (1.5 times).
California Do not allow credit trading.
Colorado Extra credit for in-state renewable generation (1.25 times).
Delaware Extra credit for in-state renewable generation (1.5 times for wind turbines sited in Delaware).
Hawaii Do not allow credit trading.
Illinois Do not allow credit trading.
Minnesota Only in-state generation can be used for compliance.
Missouri The PSC is authorized to create a weighted scale to encourage certain renewable-energy resources and/or instate generation.
Montana Utilities must purchase RECs from community renewable-energy projects that total at least 75 MW in nameplate capacity.
Nevada Out-of-state generation is only eligible provided that it is tied to a dedicated transmission or distribution line that connects with a facility or system owned, operated or controlled by an in-state provider of electric service.
New York 2% of total incremental RPS requirement (7.71%) is set aside for the Customer-Sited Tier.
North Carolina Utilities are allowed to use unbundled RECs from out-of-state renewable energy facilities to meet up to 25% of the portfolio standard.
Texas Output of the facility must be readily capable of being physically metered and verified in Texas by the program administrator.
Vermont Do not allow credit trading.
Virginia Electricity must be generated or purchased in Virginia or in the interconnection region of the regional transmission entity.
Wisconsin Only in-state generation can be used for compliance.

Why Do States Adopt Renewable Portfolio Standards? / 137
than one. We also consider the possibility that states may view their own air pollutant emissions from electricity generation as an indicator of environmental performance for their electricity industry. From the Energy Information Administration (EIA),4 we obtained data on air pollutant emissions, namely CO
2,
SO2 and NO
x emission in tons from the electric power industry for each state for
the years 1994 to 2007. In addition to environmental benefits, an RPS is often said to be
economically beneficial. In discussing the adoption of RPSs, Rabe (2006) wrote “one of the biggest factors…has been a commonly held perception that promotion of renewable energy through an RPS is in the economic interest of an individual state and thereby compatible with the predominant state goal of promoting economic development.” The most important perceived economic benefit is job creation, which “has fostered discussion in many state capitals about an anticipated ‘job multiplier’ effect of renewable as opposed to conventional sources” (Rabe 2006, pp. 6-7). For example, in Michigan’s debate on an RPS, Environment Michigan’s Report Energizing Michigan’s Economy claimed that the New Energy Future scenario, which eliminates growth in electricity demand through energy efficiency and generates 25 percent of electricity sales from renewable sources by 2025, would create 88,000 more person-years of employment through 2020 than business as usual (Madsen, Telleen-Lawton, and Shriberg 2007). We make no judgment about whether such projections are correct or not, but we are very interested in whether state policymakers vote as if they believed such assertions. If they do, then states with high unemployment rates should be quicker to adopt an RPS. Thus we test
Hypothesis 2: States with high unemployment rates are more likely to adopt an RPS.
Our data on unemployment rates are from the U.S. Department of Labor Local Area Unemployment Statistics (LAUS)5 program, which produces annual unemployment data for each state.
As mentioned in the Introduction, some states impose in-state requirements in an attempt to keep the environmental and economic benefits of an RPS within the state. These requirements can have a big impact on how firms choose to meet an RPS requirement. For example, after the Connecticut Department of Public Utility Control held that existing Maine biomass plants and new gas pipeline expansion turbines qualify as Class I renewable resources, Connecticut electricity generators decided to purchase RECs from Maine; as a result Connecticut Class I REC prices plummeted by $30/MWh (Wiser 2006). This means Connecticut will forego a significant portion of any localized environmental and job creation benefits associated with its RPS, but it can meet its RPS requirement at lower costs. We expect that states with worse air conditions
4. http://www.eia.doe.gov/cneaf/electricity/epa/epat5p1.html.5. http://www.bls.gov/lau/#publications
138 / The Energy Journal
and higher unemployment rates may have stronger incentives to include in-state requirements. Formally, we have:
Hypothesis 1a: States with poor air conditions are more likely to impose an in-state requirement.
Hypothesis 2a: States with high unemployment rates are more likely to impose an in-state requirement.
2.2 Private Interest theory of Regulation
The public interest theory of regulation began to be challenged systematically in the early 1970s. In his seminal article, Stigler (1971, p.3) argued that “regulation is acquired by the industry and is designed and operated primarily for its benefit.” Peltzman (1976) and Becker (1983) generalized and extended Stigler’s arguments, showing that regulations can be viewed as the products of competition between different interest groups, rather than as the result of capture by a single group.
Advocates for an RPS include at least three types of groups. One is citizens concerned with greenhouse gas emissions and global climate change. A second is renewable energy developers, and a third is farmers who stand to benefit from leasing their land to renewable energy developers. We test the influence of each of these groups.
Hypothesis 3: States with stronger environmental concerns from their citizens are more likely to adopt an RPS.
Following previous studies (e.g., Kalt and Zupan 1984, Maxwell,
Lyon, and Hackett 2000), we use the average League of Conservation Voters (LCV) scores of Senators and Representatives in each state to proxy for the environmental preference of the citizens in the state. Each year, the LCV selects key environmental issues with the help of a panel of the main U.S. environmental groups. The organization then creates an index by counting the number of times each representative or senator in Congress votes favorably for the “environmental agenda” (e.g., tropical forest conservation or fighting global climate change). The index ranges from 0 to 100, with 100 representing a record of voting with the environmental agenda in all cases.
A second relevant interest group is renewable energy producers. Indeed Rabe (2006, p. 6) argues that “one increasingly sees formal representation in the state legislative process from renewable energy developers who have established a foothold in the state and are eager to expand their role through RPS expansion. In numerous states, such organizations are far more visible and influential in RPS deliberations than conventional environmental advocacy groups.” We capture the influence of such groups in two ways: 1) measuring the existing extent of renewable generation in the state, and 2) assessing the presence of an organized

Why Do States Adopt Renewable Portfolio Standards? / 139
renewable energy lobby in the state. We elaborate on the measures we use in the following paragraphs.
Existing renewable electricity generators have an interest in securing or increasing their market share through an RPS. Thus, we include the percentage of renewable generation capability (not including hydroelectric sources) in the previous year in our regression analyses. The EIA provides data on generating capacity at the generator level and we use it to obtain state-level information.6
The private interest theory of regulation argues that the impact of interest groups depends not only on their stakes in a given regulation, but also on how well the groups are organized (Olson 1965). In this paper, we use the presence of a staffed ASES (American Solar Energy Society) chapter as the indicator for well-organized renewable interests. In spite of the “solar” label, most staffed ASES chapters have broader interests in renewable energy. For example, the chapter in Colorado is the Colorado Renewable Energy Society and the one in Ohio is Green Energy Ohio. As of 2007, 19 states have staffed state chapters or are included in a staffed regional chapter, among which only Solar Oregon is a solely solar-driven organization. Therefore, we treat this variable as a proxy for well-organized renewable interests in general, not only for solar energy.
Hypothesis 4: States with a larger renewable energy industry are more likely to adopt an RPS.
Hypothesis 5: States with well-organized renewable interests are more likely to adopt an RPS.
A third group that would benefit from an RPS is farmers. In many states, farmers face economic difficulties due to increasing global agricultural competition, and have few alternative economic opportunities. Leasing land to wind farm developers offers farmers an easy way to supplement their farming income. Various groups, such as Windustry, have been created to help farmers attract wind investments. According to David Benson, a Windustry Board Member, “Wind is homegrown energy that we can harvest right along side our corn or soybeans or other crops. Farm-based energy is one of the few bright spots on the rural landscape and growing the market for it can only benefit rural communities.”7 In our regressions, we use the percentage of counties in each state more than half of whose land areas are used for farming or ranching to capture the influence of farmers. Data on farm and ranch land areas are obtained from the Census of Agriculture.8
Hypothesis 6: States with a larger farmer interest are more likely to adopt an RPS.
6. http://www.eia.doe.gov/cneaf/electricity/page/eia860.html7. See http://www.windustry.org/about-windustry/about-windustry. We thank Howard Learner for
pointing out the importance of the farm lobby in RPS policymaking.8. http://www.agcensus.usda.gov/
140 / The Energy Journal
Fossil fuel-based electricity generation and fossil fuel producers stand to lose from an RPS. However, different fossil fuels will be affected differently by an RPS. In particular, Palmer and Burtraw (2005) show that an RPS tends to displace natural gas rather than coal. Therefore, states whose electricity industry relies heavily on natural gas may have a greater hurdle to overcome in adopting an RPS. We include the percentage of electricity generated from natural gas to capture this. For fossil fuel producers, we include both oil and natural gas industry and coal industry employment per 1000 residents in the analyses.9 These two variables enter the regressions in their log forms to correct for their skewness. We hypothesize
Hypothesis 7: States whose electricity industry relies heavily on natural gas are less likely to adopt an RPS.
Hypothesis 8: States with a large oil and natural gas industry or a large coal industry are less likely to adopt an RPS.
Concerning in-state requirements, citizens with stronger environmental preferences may not be a major factor since they may desire environmental improvement not only at a local level but also a national level. The in-state renewable energy industry presumably supports an in-state requirement, especially if it is in its infancy and believes it needs help to reach a critical mass. Therefore, we hypothesize that states with smaller existing capacity of renewable electricity generation are more likely to impose an in-state requirement. Although framed as part of the private interest theory of regulation, this hypothesis could also be seen as part of the public interest theory of regulation, as state lawmakers may wish to use RPS as a tool to develop their underdeveloped renewable energy resources, especially when these resources are rich. Formally, we have
Hypothesis 4a: States with smaller existing capacities of renewable electricity generation are more likely to impose an in-state requirement.
The private interest theory of regulation also predicts that states with larger farmer interests, a smaller percentage of natural gas electricity generation, and a smaller fossil fuel industry will have less opposition to in-state requirements. Thus we have.
Hypothesis 6a: States with a larger farmer interest are more likely to impose an in-state requirement.
Hypothesis 7a: States whose electricity industry relies heavily on natural gas are less likely to impose an in-state requirement.
Hypothesis 8a: States with a smaller fossil fuel industry are more likely to impose an in-state requirement.
9. These data come from the 2002 Economic Census, at http://www.census.gov/
Why Do States Adopt Renewable Portfolio Standards? / 141
2.3 theory of Ideology
After the private interest theory of regulation had dominated the economic analysis of regulation for a decade, scholars began to argue that it is not just material interests that drive regulatory policy, but also the personal preferences of political actors, who typically view their own ideologies as altruistic expressions of a concern with the public interest (Kalt and Zupan, 1984; Levitt 1996). In fact, Levitt (1996) found that Senators’ idiosyncratic preferences were the most important determinant of senator voting by a wide margin, garnering between 50 and 70 percent of the overall weight.
It has been widely noted that Republicans and Democrats have very different ideological preferences. Poole and Rosenthal (1984) demonstrated that Democrats and Republicans representing the same state (therefore controlling for constituent preference) exhibit very different patterns of voting behavior. Conventional wisdom holds that Democrats are more favorable to environmental legislation, and indeed the national average LCV score of Democrats (85 for the Senate and 86 for the House) is much higher than for Republicans (8 for the Senate and 10 for the House). Therefore, we have
Hypothesis 9: States with more state legislature seats occupied by Democrats are more likely to adopt an RPS.
Data on the party composition of state legislatures were kindly provided by the National Conference of State Legislatures (NCSL). To further control for the role of ideology, we also include a dummy variable indicating Republican governorship.
With regard to the imposition of in-state requirements, we expect the percentage of congressional seats occupied by Democrats to be positively correlated with the inclusion of in-state requirements, because Republicans are more likely to prefer a market-based approach with minimal regulatory interference.
Hypothesis 9a: States with more state legislature seats occupied by Democrats are more likely to impose an in-state requirement.
In addition to the explanatory variables discussed above, we also include the following control variables in our analysis, since they potentially have an impact on a state’s decision regarding RPS adoption and design.
Renewable Energy Potential: Regardless of regulatory theory, the likelihood a state adopts an RPS should be a function of the availability of renewable energy in that state. Based on the work of Elliott and Schwartz (1993), we classified states into three categories (1-3) based on their wind energy
142 / The Energy Journal
potential, with category 1 the lowest wind potential and 3 the highest.10 Similarly, solar potential was evaluated on a 1-3 scale based on the Solar Atlas provided by the National Renewable Energy Laboratory (NREL)11 . For biomass, Milbrandt (2005) estimates the total biomass resources available (in thousand tons per year) in each state and thus provides a continuous measure. We expect that states with greater renewable potential are more likely to adopt an RPS.
Electricity Price: It is important to control for average electricity prices in each state, even though it is not clear how they affect the adoption and design of an RPS. On one hand, high electricity prices may reflect the need for the state to seek out alternative energy sources and ensure long-term energy supply, implying such states would be more likely to adopt an RPS. On the other hand, it may be more difficult to pass on the extra costs of shifting to renewable energy to customers when electricity prices are already high. Data on electricity price are obtained from the Energy Information Administration12.
Regulatory Restructuring: Over the past fifteen years, the U.S. electricity industry underwent substantial changes, known as “restructuring,” to move away from highly regulated markets with cost-based pricing and towards competitive markets. A restructured electricity market is arguably more compatible with RPS policy, for two main reasons. First, restructuring reduces a regulator’s scope of control and its ability to shape environmental policy indirectly through standard regulatory tools; as a result, it may prefer an additional policy instrument to influence environmental dimensions of generation decisions. Second, most RPS policies include REC trading as an integral part, and aim to encourage the development of independent renewable power producers, features that comport with the emphasis on competition in restructuring efforts. However, in-state-requirements might be adopted more easily in a regulated market, as they go against the spirit of competition displayed in a restructured market. As of 2007, twenty-four states and the District of Columbia had either enacted enabling legislation or issued a regulatory order to implement restructuring13. To control for restructuring, we include a dummy variable equal to 1 if the electricity market is restructured and 0 otherwise.
State Income: The transition to renewable energy may cause an increase in electricity prices. States with higher incomes will be more capable of affording the increased price, and therefore are presumably more likely to adopt an RPS. To account for this, we include the median income for 4-person families14 in each state from 1994 to 2007 in the analyses.
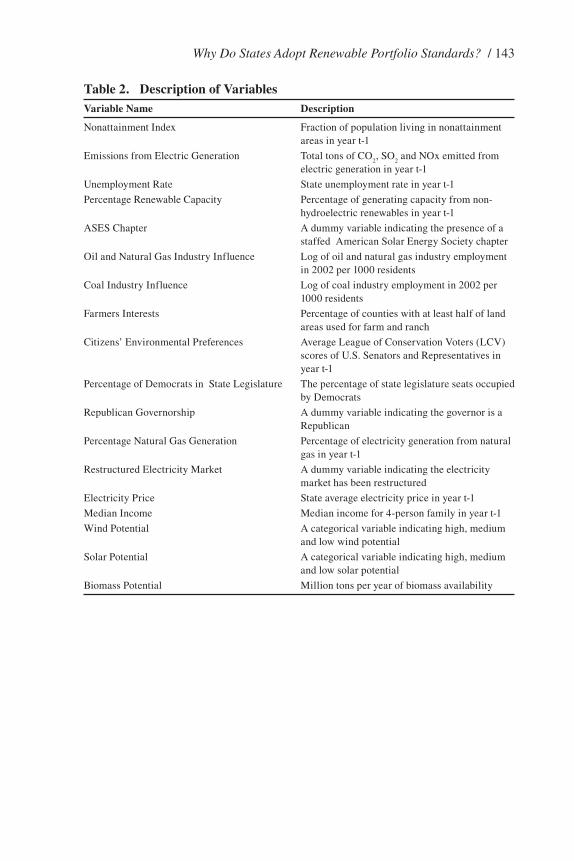
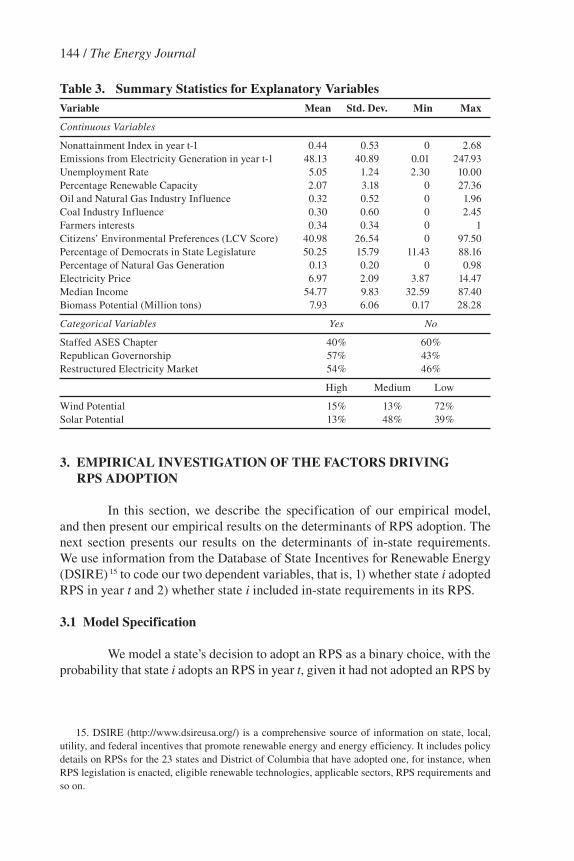
We summarize the variables we use in Table 2, and present summary statistics in Table 3.
10. Elliott and Schwartz (1993) calculate wind electricity potential in each state as a percentage of the state’s 1990 total electricity consumption. For states with a percentage above 10%, we code them as having high potential and code as low potential those states with less than 1%.
11. http://www.nrel.gov/gis/solar.html12. http://www.eia.doe.gov/cneaf/electricity/epa/epat7p4.html13. http://www.eia.doe.gov/cneaf/electricity/chg_str/restructure.pdf14. http://www.census.gov/hhes/www/income/4person.html
Why Do States Adopt Renewable Portfolio Standards? / 143
table 2. Description of Variables Variable name Description
Nonattainment Index Fraction of population living in nonattainment areas in year t-1
Emissions from Electric Generation Total tons of CO2, SO
2 and NOx emitted from
electric generation in year t-1
Unemployment Rate State unemployment rate in year t-1
Percentage Renewable Capacity Percentage of generating capacity from non-hydroelectric renewables in year t-1
ASES Chapter A dummy variable indicating the presence of a staffed American Solar Energy Society chapter
Oil and Natural Gas Industry Influence Log of oil and natural gas industry employment in 2002 per 1000 residents
Coal Industry Influence Log of coal industry employment in 2002 per 1000 residents
Farmers Interests Percentage of counties with at least half of land areas used for farm and ranch
Citizens’ Environmental Preferences Average League of Conservation Voters (LCV) scores of U.S. Senators and Representatives in year t-1
Percentage of Democrats in State Legislature The percentage of state legislature seats occupied by Democrats
Republican Governorship A dummy variable indicating the governor is a Republican
Percentage Natural Gas Generation Percentage of electricity generation from natural gas in year t-1
Restructured Electricity Market A dummy variable indicating the electricity market has been restructured
Electricity Price State average electricity price in year t-1
Median Income Median income for 4-person family in year t-1
Wind Potential A categorical variable indicating high, medium and low wind potential
Solar Potential A categorical variable indicating high, medium and low solar potential
Biomass Potential Million tons per year of biomass availability
144 / The Energy Journal
3. EmPIRIcAl InVEStIgAtIon of tHE fActoRS DRIVIng RPS ADoPtIon
In this section, we describe the specification of our empirical model, and then present our empirical results on the determinants of RPS adoption. The next section presents our results on the determinants of in-state requirements. We use information from the Database of State Incentives for Renewable Energy (DSIRE) 15 to code our two dependent variables, that is, 1) whether state i adopted RPS in year t and 2) whether state i included in-state requirements in its RPS.
3.1 model Specification
We model a state’s decision to adopt an RPS as a binary choice, with the probability that state i adopts an RPS in year t, given it had not adopted an RPS by
15. DSIRE (http://www.dsireusa.org/) is a comprehensive source of information on state, local, utility, and federal incentives that promote renewable energy and energy efficiency. It includes policy details on RPSs for the 23 states and District of Columbia that have adopted one, for instance, when RPS legislation is enacted, eligible renewable technologies, applicable sectors, RPS requirements and so on.
table 3. Summary Statistics for Explanatory VariablesVariable mean Std. Dev. min max
Continuous Variables
Nonattainment Index in year t-1 0.44 0.53 0 2.68 Emissions from Electricity Generation in year t-1 48.13 40.89 0.01 247.93 Unemployment Rate 5.05 1.24 2.30 10.00 Percentage Renewable Capacity 2.07 3.18 0 27.36 Oil and Natural Gas Industry Influence 0.32 0.52 0 1.96 Coal Industry Influence 0.30 0.60 0 2.45 Farmers interests 0.34 0.34 0 1 Citizens’ Environmental Preferences (LCV Score) 40.98 26.54 0 97.50 Percentage of Democrats in State Legislature 50.25 15.79 11.43 88.16 Percentage of Natural Gas Generation 0.13 0.20 0 0.98 Electricity Price 6.97 2.09 3.87 14.47 Median Income 54.77 9.83 32.59 87.40 Biomass Potential (Million tons) 7.93 6.06 0.17 28.28
Categorical Variables Yes No
Staffed ASES Chapter 40% 60% Republican Governorship 57% 43% Restructured Electricity Market 54% 46%
High Medium Low
Wind Potential 15% 13% 72% Solar Potential 13% 48% 39%

Why Do States Adopt Renewable Portfolio Standards? / 145
year t-1, being a function of various political, economic and technical variables.16 For the purpose of estimation, the relevant states in a given year are those that had not adopted an RPS at the beginning of the year. Once a state adopts an RPS, it is no longer in the sample. We did not include Iowa, the District of Columbia, Nebraska, Colorado or Washington in the analysis for the following reasons. Iowa passed its RPS in 1983, well before the period we are studying; we drop Iowa from our analysis because some of our key independent variables (such as non-attainment status) were not collected during the early 1980s. Nebraska’s legislature is nonpartisan, and therefore the party composition variable is not available. The District of Columbia does not have information on several variables of interest, such as renewable electricity generation, and party composition in the legislature (since it has no legislature). Finally, Colorado and Washington’s RPSs came out of “direct democracy” rather than legislative politics. Indeed, the legislative process blocked enactment, leading to a ballot proposition. The resulting adoption process does not square with our theoretical discussions that focus on a representative process. Including these states does not change the major findings.17 The final database is composed of 519 state/year observations.
Because the time of adoption is intrinsically discrete (year by year), the commonly used proportional odds model is appropriate (Kiefer 1988). The proportional odds model assumes that the relative odds that state i adopts an RPS in year t, given it did not adopt an RPS in previous years, are summarized by an expression of the form:
where P(t,Xit) is the conditional probability for state i to adopt RPS in year t, given
it did not adopt RPS in previous years, Xit is a vector of explanatory variables,
and P0(t) is the baseline conditional probability of RPS adoption when X
it = 0.
The relative odds of making a transition at year t are given by the product of two components: (a) a relative odds level that is common to all individuals, and (b) an individual-specific scaling factor. It follows that
16. In this regard, our approach is very similar to that of Knittel (2006). See Kiefer (1988) for a detailed discussion on economic duration data and hazard functions.
17. Including Colorado and Washington does not change the major findings we present in this paper. Including Nebraska and leaving out the party composition variable does not change the major findings we present in this paper except that 1) LCV score gains significance in the adoption decision. This is because LCV score is correlated with the percentage of Democrats in the state legislature; 2) The percentage of natural gas electricity generation loses its significance in the analysis of the adoption decision.
146 / The Energy Journal
where gt = logit(P
0(t)).
The foregoing structure can be estimated using a standard logistic estimation. In this paper, the baseline conditional probability of RPS adoption g
t is specified as a quadratic function of survival time t. We tried different
specifications and the major findings do not depend on assumptions about the baseline conditional probability.
3.2 Empirical findings
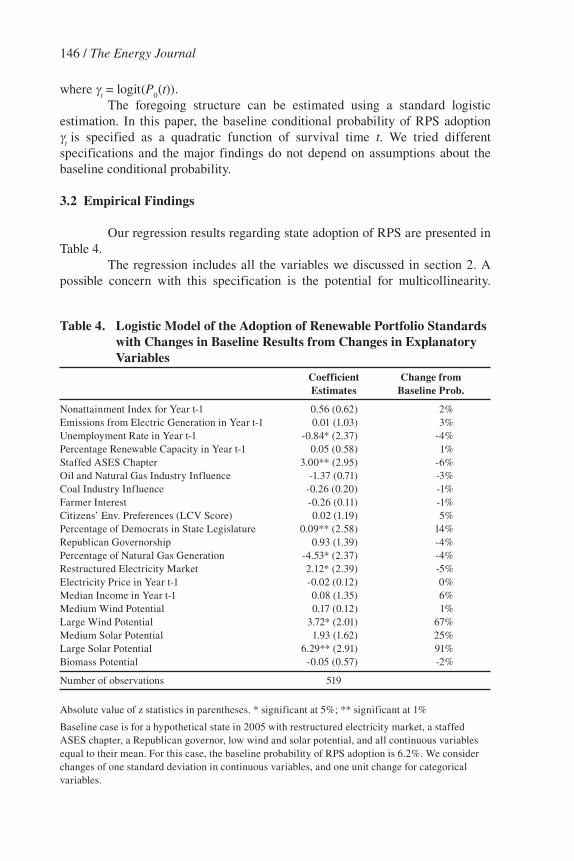
Our regression results regarding state adoption of RPS are presented in Table 4.
The regression includes all the variables we discussed in section 2. A possible concern with this specification is the potential for multicollinearity.
table 4. logistic model of the Adoption of Renewable Portfolio Standards with changes in Baseline Results from changes in Explanatory Variables
coefficient change from Estimates Baseline Prob.
Nonattainment Index for Year t-1 0.56 (0.62) 2% Emissions from Electric Generation in Year t-1 0.01 (1.03) 3% Unemployment Rate in Year t-1 -0.84* (2.37) -4% Percentage Renewable Capacity in Year t-1 0.05 (0.58) 1% Staffed ASES Chapter 3.00** (2.95) -6% Oil and Natural Gas Industry Influence -1.37 (0.71) -3% Coal Industry Influence -0.26 (0.20) -1% Farmer Interest -0.26 (0.11) -1% Citizens’ Env. Preferences (LCV Score) 0.02 (1.19) 5% Percentage of Democrats in State Legislature 0.09** (2.58) 14% Republican Governorship 0.93 (1.39) -4% Percentage of Natural Gas Generation -4.53* (2.37) -4% Restructured Electricity Market 2.12* (2.39) -5% Electricity Price in Year t-1 -0.02 (0.12) 0% Median Income in Year t-1 0.08 (1.35) 6% Medium Wind Potential 0.17 (0.12) 1% Large Wind Potential 3.72* (2.01) 67% Medium Solar Potential 1.93 (1.62) 25% Large Solar Potential 6.29** (2.91) 91% Biomass Potential -0.05 (0.57) -2%
Number of observations 519
Absolute value of z statistics in parentheses. * significant at 5%; ** significant at 1%
Baseline case is for a hypothetical state in 2005 with restructured electricity market, a staffed ASES chapter, a Republican governor, low wind and solar potential, and all continuous variables equal to their mean. For this case, the baseline probability of RPS adoption is 6.2%. We consider changes of one standard deviation in continuous variables, and one unit change for categorical variables.

Why Do States Adopt Renewable Portfolio Standards? / 147
Some of the variables, although theoretically distinct, may be empirically correlated with each other. For example, the LCV Score, which reflects the environmental preference of state constituents, might be highly correlated with the percentage of Democrats in state legislatures. We tested for multicollinearity, and no variables have a tolerance score below the alert level of 0.2 suggested by Studenmund (2005). Therefore, we proceed with our analysis without worrying about multicollinearity.
Column 1 of Table 4 reports the estimated coefficients along with the absolute value of z statistics in parentheses. The results from a logistic regression are difficult to interpret because the dependent variable is modeled as a nonlinear function of independent variables. To facilitate the interpretation of our regression results, we examine how a change in each covariate would affect a hypothetical state in terms of the probability of adopting an RPS in the baseline year of 2005 (Column 2, Table 4). The hypothetical state is assumed to have a restructured electricity market, a staffed ASES chapter, a Republican governor, low wind and solar potential, and all continuous variables equal to their mean. For this state, in the baseline year 2005, the probability of RPS adoption is 6.2%. To illustrate the interpretation of the results we report, consider the coefficient for a restructured market, which is positive and significant. More specifically, the odds ratio for a state with a restructured electricity market to adopt an RPS is more than 8 times [exp(2.12)] that for a state with a regulated market. For our hypothetical case, if its electricity market had not been restructured, its probability of adopting an RPS in 2005 would decrease by 5%.18
Variables suggested by the public interest theory do not perform as we have hypothesized. Neither of the environmental variables—the non-attainment index and air pollutant emissions from electricity industry—achieves statistical significance, although the coefficients are in the expected direction. This suggests that improving local air conditions, at least insofar as this concern is captured by non-attainment on criteria air pollutants, is not a primary motivation for adopting an RPS, a finding that is inconsistent with research hypothesis 1.
Inconsistent with research hypothesis 2, we find that states with higher unemployment rates are less likely to adopt an RPS. The odds ratio for adopting an RPS decreases by 65% if the unemployment rate increases by one standard deviation (1.24%), all else equal. For our hypothetical baseline state, if its unemployment rate increased by one standard deviation, its probability of adopting an RPS in 2005 would decrease by 4%. This finding runs contrary to Rabe’s insights from his case studies (2006). A possible explanation is that when a state proposes an RPS, the supporters in the legislature use job creation arguments as a selling point, and exaggerate the “job multiplier” effect. Our analysis suggests that state-level job creation is not a driving force for RPS adoption. On the contrary,
18. Among the twenty-two states that have restructured their market, seventeen of them have adopted RPS. In contrast, among the 24 states with regulated electricity market, only nine of them have adopted RPS. These nine states include Arizona, which adopted an RPS before restructuring, and California, which adopted an RPS while its restructuring law was pending.
148 / The Energy Journal
states with higher unemployment rates may be preoccupied with the task of stimulating economic growth, and have little interest in considering an RPS – a fundamentally environmental policy tool that stands to increase electricity prices (Palmer and Burtraw, 2005).
Now let us look at the research hypotheses stemming from the private interest theory. Table 4 shows that neither state citizens’ environmental preferences (hypothesis 3), existing renewable capacity (hypothesis 4), farmer interests (hypothesis 6) nor fossil fuel producers (hypothesis 8) have a significant impact on a state’s decision to adopt an RPS. The private interest variables that do appear to play a significant role are organized renewable energy interests, who directly benefit from an RPS, and natural gas power producers, who directly lose from an RPS. Consistent with the private interest theory of regulation (hypothesis 5), states with well-organized renewable interests are more likely to adopt an RPS. More specifically, the presence of a staffed ASES chapter is associated with a 19-fold increase in the odds for the adoption of an RPS. For our hypothetical baseline state, if it did not have a staffed ASES chapter, its probability of adopting an RPS in 2005 would decrease by 6%. These results suggest that well-organized renewable electricity developers can effectively move a state towards adopting an RPS, consistent with the findings reported by Rabe (2006) and Michaels (2007).
Our results also suggest that natural gas power producers can effectively slow down a state’s progress towards adopting an RPS. Specifically, the odds ratio for adopting an RPS decreases by nearly 60% if the percentage of natural gas electricity generation increases by one standard deviation (20%), all else equal. For our hypothetical baseline state, a one standard deviation (20%) increase in the percentage of natural gas used for electricity generation would cause its probability of adopting an RPS in 2005 to fall by 4%.
Consistent with the ideological theory of regulation, and hypothesis 9, the percentage of Democrats in the state legislature is an important factor driving RPS adoption. The odds ratio for adopting an RPS increases by just over 3 times if the percentage of Democrats in the state legislature increases by one standard deviation (15.79%). For our hypothetical baseline case, this would raise the likelihood of adopting an RPS by 14% in 2005 if the state had not adopted one before. This suggests that Democrats, who normally have stronger environmental preferences, are significantly more favorable towards RPSs than Republicans. However, partisan politics at the governor’s level does not seem to play a significant role. The dummy variable indicating a Republican governor has an estimated coefficient not significantly different from zero. Among the 29 states (including DC) that passed an RPS after 1993, half of them (15 states) are under Republican governorship and half of them (14 states) are not.
We turn now to our control variables. We find that a restructured electricity market significantly speeds a state’s adoption of an RPS; for the baseline state, restructuring increases the odds of adoption by approximately a factor of 8. In addition, wind and solar potential both exhibit strong impacts on the state decision to adopt an RPS. Although the probability for states with low wind
Why Do States Adopt Renewable Portfolio Standards? / 149
potential to adopt an RPS is not significantly different from those with medium wind potential, states with high wind potential are significantly more likely to adopt an RPS than those states with low wind potential. More specifically, the odds ratio for adopting an RPS for a state with large wind potential is about 40 times [exp(3.72)] higher than one with small wind potential. The estimates also show that states with high solar potential are more likely to adopt an RPS compared to those with medium solar potential. For our hypothetical baseline case, the probability of adopting an RPS would rise to approximately 73% in 2005 when wind potential is “high” as opposed to “low”, and approximately 97% in 2005 when solar potential is “high” as opposed to “low”. These findings provide strong evidence that states with high renewable potential are more likely to adopt an RPS. At the same time, it is premature to conclude that renewable potential has a decisive impact on a state’s decision to adopt an RPS because the estimated standard error is quite high for these variables, suggesting that the dummy variable coding might cause loss of information which prevents precise estimation. Biomass potential does not have a strong impact on the adoption of RPS, which suggests that typical RPSs target wind and solar more so than biomass. Our final control variables, average electricity price in each state and median income, although they enter with expected signs, are not statistically significant.
4. DRIVERS of In-StAtE-REquIREmEntS
We turn now to exploring the factors that lead states to impose in-state requirements when they adopt an RPS.
4.1 model Description
As we probe further into state decisions regarding the design features of an RPS, we must account statistically for the fact that states have multiple policy alternatives, e.g. they can choose either no RPS, an RPS with in-state-requirements, or an RPS without in-state-requirements. Multinomial probit models and multinomial logit models are the two commonly-used approaches to modeling decision problems with more than two alternatives. The multinomial logit model is computationally cheaper but relies on the assumption of the independence of irrelevant alternatives (IIA) (Hausman and Wise 1978, Wooldridge 2002). We perform both a Hausman test and a Small-Hsiao test of the IIA assumption. The Hausman test does not reject IIA, but the Small-Hsiao test does. Thus, to be conservative, we use the multinomial probit model. This model assumes that disturbances are distributed according to a multivariate normal distribution, which allows for a very flexible pattern of correlations across disturbances (Alvarez and Nagler 1994, Hausman and Wise 1978).
In terms of the model’s structure, let Vit0
, Vit1
and Vit2
denote state i’s latent utility in year t if it chooses no RPS, an RPS with in-state-requirements
150 / The Energy Journal
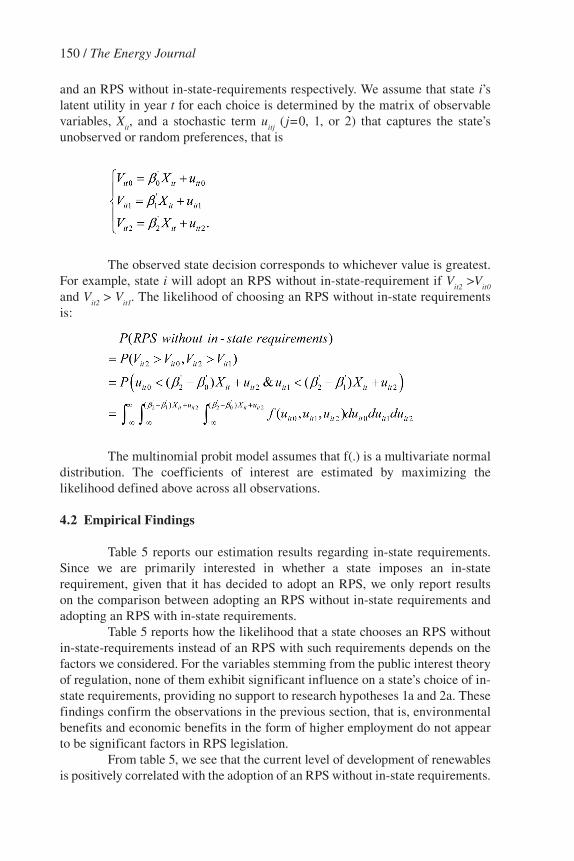
and an RPS without in-state-requirements respectively. We assume that state i’s latent utility in year t for each choice is determined by the matrix of observable variables, X
it, and a stochastic term u
itj ( j=0, 1, or 2) that captures the state’s
unobserved or random preferences, that is
The observed state decision corresponds to whichever value is greatest. For example, state i will adopt an RPS without in-state-requirement if V
it2 >V
it0
and Vit2
> Vit1
. The likelihood of choosing an RPS without in-state requirements is:
The multinomial probit model assumes that f(.) is a multivariate normal distribution. The coefficients of interest are estimated by maximizing the likelihood defined above across all observations.
4.2 Empirical findings
Table 5 reports our estimation results regarding in-state requirements. Since we are primarily interested in whether a state imposes an in-state requirement, given that it has decided to adopt an RPS, we only report results on the comparison between adopting an RPS without in-state requirements and adopting an RPS with in-state requirements.
Table 5 reports how the likelihood that a state chooses an RPS without in-state-requirements instead of an RPS with such requirements depends on the factors we considered. For the variables stemming from the public interest theory of regulation, none of them exhibit significant influence on a state’s choice of in-state requirements, providing no support to research hypotheses 1a and 2a. These findings confirm the observations in the previous section, that is, environmental benefits and economic benefits in the form of higher employment do not appear to be significant factors in RPS legislation.
From table 5, we see that the current level of development of renewables is positively correlated with the adoption of an RPS without in-state requirements.

Why Do States Adopt Renewable Portfolio Standards? / 151
For our hypothetical state, the relative likelihood of omitting an in-state requirement is 0.57, calculated as the estimated probability of adopting an RPS without in-state requirements divided by the probability of adopting an RPS with an in-state requirement. Column 2 of Table 5 reports how this relative likelihood changes as each covariate changes. Our estimation suggests that with a one standard deviation increase of existing renewable capacity (3.18%), the relative likelihood of adopting an RPS without an in-state requirement as opposed to one with such a requirement, would increase by a factor of 39.48. These results suggest that states with small existing capacity for renewable electricity generation are concerned that under an RPS electricity producers would turn to out-of-state renewable sources, and therefore these states are more likely to impose an in-state requirement. Thus, research hypothesis 4a is supported.
table 5. multinomial Probit for RPS Without vs. With In-State Requirements
Change from Coefficient Baseline Relative Estimates Likelihood
Nonattainment Index for Year t-1 -0.29 (0.19) 0.75 Emissions from Electric Generation in Year t-1 0.00 (0.01) 1.04 Unemployment Rate in Year t-1 0.86 (1.61) 10.99 Percentage Renewable Capacity in Year t-1 0.53** (2.59) 39.48 Staffed ASES Chapter 1.60 (0.88) 0.01 Oil and Natural Gas Industry Influence 5.37 (1.38) 406.87 Coal Industry Influence 1.97 (0.77) 12.81 Farmer Interests 1.92 (0.36) 3.83 Citizens’ Env. Preferences (LCV Score) 0.04 (1.20) 5.94 Percentage of Democrats in State Legislature -0.04 (0.75) 0.36 Republican Governorship 0.52 (0.50) 0.29 Percentage of Natural Gas Generation 3.11 (0.65) 3.99 Restructured Electricity Market 4.33* (2.26) 0.00 Electricity Price in Year t-1 -0.24 (0.86) 0.41 Median Income in Year t-1 0.13 (1.50) 11.44 Medium Wind Potential -3.00 (0.95) 0.00 Large Wind Potential -0.91 (0.28) 0.40 Medium Solar Potential 3.60 (1.43) 2126.73 Large Solar Potential 0.25 (0.06) 1.70 Biomass Potential -0.30 (1.60) 0.02
Number of Observations 519
Absolute value of z statistics in parentheses. * significant at 5%; ** significant at 1%
Baseline case is for a hypothetical state in 2005 with restructured electricity market, a staffed ASES chapter, a Republican governor, low wind and solar potential and all continuous variables equal to their mean. For this case, the baseline relative likelihood of adopting an RPS without in-state-requirement vs. an RPS with in-state-requirement is 0.57. We consider changes of one standard deviation in continuous variables, and one unit change for categorical variables.
152 / The Energy Journal
Table 5 shows that states with greater fossil fuel production, either oil and natural gas or coal, are not significantly more likely to adopt an RPS free of in-state requirements. Although the estimated impact of the oil and natural gas industry appears to be very large, it is important to realize that this impact is not statistically significant since the standard error on this variable is almost as large as the coefficient itself. The data on fossil fuel industry employment do not change significantly over time and take on value zero in many states, which prevents a precise estimate of the impacts of these variables. The same comments apply to variables measuring wind and solar potentials.
Another variable with a significant impact on a state’s decision regarding an in-state requirement is whether the electricity market is restructured. Taking the hypothetical state, if its electricity market had not been restructured, the choice would swing significantly towards favoring in-state requirements. Indeed, all nine RPSs adopted by states with regulated electricity markets imposed some in-state requirements, while among the seventeen RPSs adopted by states with restructured electricity markets, only 7 of them imposed in-state requirements.
6. concluDIng REmARkS
We have presented a quantitative empirical analysis of the factors leading states to adopt RPS policies. Our results show that the adoption of an RPS is more likely in states with strong renewable potential, a restructured electricity market, a small share of natural gas in the electricity fuel mix, strong Democratic presence in the state legislature, and organized renewable energy interests. Surprisingly, our study suggests that neither local environmental benefits nor economic benefits of job creation seem to be driving forces for RPS adoption, although they are often widely touted in the legislative process. We do not address the question of whether an RPS can actually deliver the environmental and job benefits some supporters have claimed. What our study does clearly show is that states with worse air quality and higher unemployment generally do not show stronger interest in adopting an RPS. Concerning in-state requirements, we find that states with little existing renewable electricity generation are more likely to impose some sort of in-state requirement, as are states that have not restructured their electricity markets. Presumably they impose such requirements because they are concerned that otherwise electricity producers will turn to well-developed out-of-state renewable sources to comply with RPS requirements.
Our findings raise interesting questions about the role of environmental federalism in the United States. As Rabe (2004) points out, political “gridlock” at the federal level has meant that throughout the last decade of the 20th century and the first decade of the 21st, climate policy initiatives have primarily emerged from the so-called laboratory of the states, with the RPS the most prominent policy tool used. Michaels (2007) argues that these policies are essentially special interest legislation for wind-driven generators. Our quantitative analysis yields a more nuanced view: private interests do indeed play an important role in driving RPS
Why Do States Adopt Renewable Portfolio Standards? / 153
legislation, but renewable energy potential and partisan politics are even more important. The importance of renewable potential is comforting, and means that economic costs and benefits are not entirely absent from RPS politics.
The importance of political ideology in RPS legislation is open to interpretation. For years, Democrats have been much more likely than Republicans to believe that global warming is occurring, is due to anthropogenic causes, and constitutes a serious threat (Dunlap and McCright 2008). Thus, Democratic legislators might argue that they passed state RPSs to serve the global public interest, and that it is simply a happy coincidence that they were able to garner generous media coverage (Engel and Orbach 2008) and help important state industries in the process. Others might retort that these legislators failed to serve the needs of their constituents, and instead indulged their own personal beliefs by passing costly RPS legislation without regard to local environmental considerations, citizens’ environmental preferences or local employment needs.
Regardless of how one interprets the role of ideology, the flurry of RPS legislation in recent years strongly suggests that decentralized environmental policymaking can create a race to the top instead of the bottom. However, as Vajjhala, Paul, Sweeney, and Palmer (2008) show, an efficient renewable energy policy would likely involve transmission of massive amounts of renewable power from one region to another, a goal frustrated by in-state requirements. Thus, it is not enough for state environmental policies to encourage a race to the top; they need to achieve policy coordination as well. Whether the RPS policies enacted by the U.S. states produce net economic value from the perspective of the nation as a whole will depend upon whether RPSs actually deliver the renewable power they promise, at what cost, and whether the U.S. is able to integrate this patchwork of policies—especially those with in-state requirements—into a coherent whole.
AcknoWlEDgmEntS
We would like to thank four anonymous referees for very helpful suggestions that substantially improved this paper. We would also like to thank Barry Rabe, Howard Learner, and seminar participants at the Erb Institute Colloquium at the University of Michigan, the 2007 Association of Public Policy Analysis and Management Conference, the Searle Center at Northwestern University, and the Rutgers University Center for Research in Regulated Industries for helpful comments.
REfEREncES
Alvarez, R. Michael and Jonathan Nagler. (1994). “Correlated Disturbances in Discrete Choice Models: A Comparison of Multinomial Probit Models and Logit Models.” Document available online at: http://polmeth.wustl.edu/workingpapers.php?text=discrete-choice&searchkeywords=T&order=dateposted.
Armstrong, Mark, Simon Cowan, and John Vickers. (1994). Regulatory Reform, Economic Analysis and British Experience. Cambridge, MA: The MIT Press.
154 / The Energy Journal
Averch, Harvey and Leland Johnson. (1962). “Behaviour of the Firm under Regulatory Constraint.” American Economic Review, 52(5): 1052-1069.
Becker, Gary. (1983). “A Theory of Competition Among Pressure Groups for Political Influence.” Quarterly Journal of Economics, 98(3): 371-400.
Burtraw, Dallas , Alan Krupnick, Karen Palmer, Anthony Paul, Michael Toman, and Cary Bloyd. (2003). “Ancillary benefits of reduced air pollution in the US from moderate greenhouse gas mitigation policies in the electricity sector.” Journal of Environmental Economics and Management, 45(3): 650-673.
Bushnell, James, Carla Peterman, and Catherine Wolfram. (2007). “Local Solutions to Global Problems: Policy Choice and Regulatory Jurisdiction.” Document available online at: http://www.nber.org/papers/w13472.
Crew, Michael A. (1999). Regulation under Increasing Competition. Boston, MA: Kluwer Academic Publishers.
Dunlap, Riley E. and Aaron M. McCright. (2008). “A Widening Gap: Republican and Democratic Views on Climate Change.” Environment, 50(September/October): 26-35.
Elliott, D. L. and M. N. Schwartz. (1993). “Wind energy potential in the United States.” Richland, WA: Pacific Northwest Laboratory. Document available online at: http://www.osti.gov/energycitations/servlets/purl/10189966-jo0aEC/native/10189966.pdf.
Engel, Kirsten H. and Barak Y. Orbach. (2008). “Micro-Motives for State and Local Climate Change Initiatives.” Harvard Law & Policy Review, 2: 119-137.
Fischer, Carolyn and Richard G. Newell. (2008). “Environmental and Technology Policies for Climate Mitigation.” Journal of Environmental Economics and Management, 55: 142-162.
Gilbert, Richard J. and Edward P. Kahn eds. (1996). International Comparisons of Electricity Regulation. Cambridge, UK: Cambridge University Press.
Hausman, Jerry A. and David A. Wise. (1978). “A Conditional Probit Model for Qualitative Choice: Discrete Decisions Recognizing Independence and Heterogeneous Preferences.” Econometrica, 46(2): 403-426.
Huang, M.-Y., J. R. R. Alavalapati, D. Carter, and Matthew H. Langholtz. (2007). “Is the Choice of Renewable Portfolio Standards Random?” Energy Policy, 35(11): 5571–5575.
Joskow, Paul and Roger Noll. (1981). “Regulation in Theory and Practice: An Overview,” in Gary Fromm ed, Studies in Public Regulation. Cambridge, MA: The MIT Press, pp. 1 - 65.
Joskow, Paul and Nancy Rose. (1988). “The Effects of Economic Regulation,” in Richard Schmalensee and Robert Willig eds, Handbook of Industrial Organization. Amsterdam: North-Holland.
Kalt, Joseph P. and Mark A. Zupan. (1984). “Capture and Ideology in the Economic Theory of Politics.” American Economic Review, 74(3): 279-300.
Kiefer, Nicholas M. (1988). “Economic Duration Data and Hazard Functions.” Journal of Economic Literature, 26(2): 646-679.
Kneifel, Joshua. (2007). “Effects of State Government Policies on Electricity Capacity from Non-Hydropower Renewable Sources.” Document available online at: http://www.cba.ufl.edu/purc/purcdocs/papers/0616_Kneifel_Effects_of_State.pdf.
Knittel, Christopher R. (2006). “The Adoption of State Electricity Regulation: The Role of Interest Groups.” The Journal of Industrial Economics, 54(2): 201-222.
Laffont, Jean-Jacques and Jean Tirole. ( 1993). A Theory of Incentives in Procurement and Regulation. Cambridge, MA: The MIT Press.
Levitt, Steven D. (1996). “How Do Senators Vote? Disentangling the Role of Voter Preferences, Party Affiliation, and Senator Ideology.” American Economic Review, 86(3): 425-441.
Lyon, Thomas P. ed. (2007). The Political Economy of Regulation. Cheltenham, UK: Edward Elgar Press.
Madsen, Travis, Timothy Telleen-Lawton, and Mike Shriberg. (2007). “Energizing Michigan’s Economy: Creating Jobs and Reducing Pollution with Energy Efficiency and Renewable Electric Power.” Document available online at: http://www.environmentmichigan.org/reports/energy/energy-program-reports/energizing-michigans-economy.
Why Do States Adopt Renewable Portfolio Standards? / 155
Maxwell, John W., Thomas P. Lyon, and Steven C. Hackett. (2000). “Self-Regulation and Social Welfare: The Political Economy of Corporate Environmentalism.” Journal of Law & Economics, 43(2): 583-618.
Michaels, Robert J. (2007). “Intermittent Currents: The Failure of Renewable Electricity Requirements.” Document available online at: http://papers.ssrn.com/sol3/papers.cfm?abstract_id=1026318.
Milbrandt, Anelia. (2005). A Geographic Perspective on the Current Biomass Resource Availability in the United States. Golden, CO: National Renewable Energy Laboratory.
Newbery, David M. (2000). Privatisation, Restructuring, and Regulation of Network Utilities. Cambridge, MA: The MIT Press.
Oates, Wallace. (2001). “A Reconsideration of Environmental Federalism.” Resources for the Future Discussion Paper 01-54.
Olson, Mancur J. (1965). The Logic of Collective Action. Cambridge: Harvard University Press.Palmer, Karen and Dallas Burtraw. (2005). “Cost-effectiveness of renewable electricity policies.”
Energy Economics, 27(6): 873–894.Peltzman, S. (1976). “Toward a More General Theory of Regulation.” Journal of Law and Economics,
19(2): 211-240.Peltzman, Sam, Michael E. Levine, and Roger G. Noll. (1989). “The Economic Theory of Regulation
after a Decade of Deregulation.” Brookings Papers on Economic Activity. Microeconomics, Special issue: 1-59.
Poole, Keith T. and Howard Rosenthal. (1984). “The Polarization of American Politics.” Journal of Politics, 46(4): 1061-1079.
Posner, Richard A. (1974). “Theories of Economic Regulation.” Bell Journal of Economics and Management Science, 5(2): 335-358.
Rabe, Barry G. (2004). Statehouse and Greenhouse: The Emerging Politics of American Climate Change Policy. Washington, D.C.: Brookings Institution Press.
Rabe, Barry G. (2006). “Race to the Top: The Expanding Role of U.S. State Renewable Portfolio Standards.” Pew Center on Global Climate Change. Document available online at: http://www.www.pewclimate.org/docUploads/RPSReportFinal.pdf.
Stigler, George J. (1971). “The Theory of Economic Regulation.” Bell Journal of Economics and Management Science, 2(1): 3-21.
Studenmund, A. H. (2005). Using Econometrics: A Practical Guide. Boston: Addison-Wesley Pearson.
Vajjhala, Shalini, Anthony Paul, Richard Sweeney, and Karen Palmer. (2008). “Green Corridors: Linking Interregional Transmission Expansion and Renewable Energy Policies.” Resources for the Future Discussion Paper DP-08-06.
Wiser, Ryan. (2006). “State RPS Policies: Experiences and Lessons Learned.” Document available online at: http://www.oregon.gov/ENERGY/RENEW/docs/Wiser_Oregon_RPS_May_2006.ppt.
Wooldridge, Jeffrey. (2002). Econometric Analysis of Cross Section and Panel Data. Cambridge, MA: The MIT Press.

156 / The Energy Journal