the b.e. journal of economic analysis & policywebuser.bus.umich.edu/tplyon//pdf/published...
TRANSCRIPT

The B.E. Journal of EconomicAnalysis & Policy
ContributionsVolume 11, Issue 1 2011 Article 50
When Does Institutional Investor ActivismIncrease Shareholder Value?: The Carbon
Disclosure Project
Eun-Hee Kim∗ Thomas Lyon†
∗George Washington University, [email protected]†University of Michigan, Ann Arbor, [email protected]
Recommended CitationEun-Hee Kim and Thomas Lyon (2011) “When Does Institutional Investor Activism IncreaseShareholder Value?: The Carbon Disclosure Project,” The B.E. Journal of Economic Analysis &Policy: Vol. 11: Iss. 1 (Contributions), Article 50.Available at: http://www.bepress.com/bejeap/vol11/iss1/art50
Copyright c©2011 The Berkeley Electronic Press. All rights reserved.

When Does Institutional Investor ActivismIncrease Shareholder Value?: The Carbon
Disclosure Project∗
Eun-Hee Kim and Thomas Lyon
Abstract
This paper presents the first empirical test of the financial impacts of institutional investor ac-tivism towards climate change. Specifically, we study the conditions under which share prices areincreased for the Financial Times (FT) Global 500 companies due to participation in the CarbonDisclosure Project (CDP), a consortium of institutional investors with $57 trillion in assets. Wefind no systematic evidence that participation, in and of itself, increased shareholder value. How-ever, by making use of Russia’s ratification of the Kyoto Protocol, which caused the Protocol to gointo effect, we find that companies’ CDP participation increased shareholder value when the like-lihood of climate change regulation rose. We estimate the total increase in shareholder value fromCDP participation at $8.6 billion, about 86% of the size of the carbon market in 2005. Our findingssuggest that institutional investor activism towards climate change can increase shareholder valuewhen the external business environment becomes more climate conscious.
KEYWORDS: institutional investor activism, Kyoto Protocol, Carbon Disclosure Project
∗We would like to thank Hewson Baltzell and Doug Morrow at Innovest (now part of RiskMet-rics) for facilitating our access to the CDP data, and Don Fullerton, an anonymous referee, AndyHoffman, Keith Brouhle, Mark Cohen, and participants in the Business Economics workshop atthe University of Michigan, the American Economic Association meetings and the 2010 WorldCongress of Environmental and Resource Economists for helpful comments.

1. Introduction The Carbon Disclosure Project (CDP) is a consortium of over 300 institutional investors with over $57 trillion in assets in 2008, including Barclays Group, California Public Employees’ Retirement System (CalPERS), Goldman Sachs, Merrill Lynch, Morgan Stanley, and UBS, among others. Since 2002, the CDP has asked the world’s 500 largest companies every year to disclose their greenhouse gas (GHG) emissions, risks, opportunities, and management strategies. Some companies participate in the CDP, while others do not. The CDP publicly discloses company responses on its website, presumably in the hope that publicized information will affect investment behavior.
Despite the financial clout of the CDP investors, it is unclear whether CDP disclosure is material. The CDP is somewhat different from typical institutional investor activism. Institutional investor activism often interferes with management decisions with the intention of increasing shareholder value. For example, CalPERS annually announces the so-called focus list, a list of poorly performing firms, aiming to improve their stock performance and corporate governance through active engagement with management. The majority of prior studies find a “CalPERS effect,” that is, positive abnormal stock returns of firms included in the focus list around the day of its announcement.1 Positive shocks suggest that these types of activism create shareholder value. The CDP, however, does not actively interfere with management decisions. Instead, it simply encourages disclosure of environmental performance. A natural question is then exactly what the CDP accomplishes with its monitoring function. Does a firm’s CDP participation affect shareholder value?
We empirically examine the circumstances under which participation in the CDP affects shareholder value.2 Our analysis is grounded in the economic theory of voluntary disclosure (Milgrom, 1981; Verrecchia 1983), which shows that firms only choose to disclose voluntarily if they have “good news” to report. This implies that CDP participants are doing a better job of managing greenhouse gas emissions than comparable non-participants. Our interest, however, is not in companies’ environmental management per se, but rather in the extent to which investors respond to environmental disclosure. For this purpose, we test a series of three empirical research hypotheses. We begin by testing the basic hypothesis 1 For a recent example, see Barber (2006). 2 We inquire into the conditions under which institutional investor activism pays, rather than simply into whether it does pay or not. One of the important questions the empirical literature on corporate environmental strategy seeks to answer is whether going “green” pays or not, but the evidence is mixed (Margolis and Walsh, 2003). Perhaps this is because the question is simply too broad. Instead of asking whether going green pays, researchers have begun to ask under what circumstances going green pays (King and Lenox, 2001). The same point seems to apply to institutional investor activism.
1
Kim and Lyon: The Carbon Disclosure Project and Shareholder Value
Published by The Berkeley Electronic Press, 2011

that firms’ CDP participation had a direct impact on stock prices. We evaluate this by testing the impact of CDP participation for each of the first four cycles of CDP disclosure, and also exploring whether the first instance of CDP participation for each participant had greater impact than subsequent participation.
We then explore two situation-specific hypotheses by making use of Russia’s ratification of the Kyoto Protocol on October 22, 2004, which caused the Protocol to go into effect in all the nations that had ratified it. Russia’s ratification presumably increased the threat of carbon regulation for greenhouse-gas intensive firms, so our second hypothesis is that CDP participation was particularly valuable for firms in greenhouse-gas intensive industries. Our third hypothesis has to do with the political factors influencing where Russia’s ratification would have the greatest impact. Because countries that were Kyoto signatories had already begun requiring firms to prepare for climate regulation, we argue that Russia’s ratification had greater impact in the U.S. and other non-signatory nations. Thus, our third hypothesis is that CDP participation was especially valuable for firms in greenhouse-gas industries that were headquartered in the U.S. and other non-Kyoto countries.
The remainder of the paper is organized as follows. Section 2 describes the CDP. Section 3 surveys the relevant literature and lays out our research hypotheses. Section 4 describes methods, and section 5 describes our data. Section 6 reports results and section 7 concludes.
2. The Carbon Disclosure Project
Investors have expressed concerns over the financial risks to which companies might be exposed due to their greenhouse gas emissions.3 Two types of potential financial risks are present. One is the direct effect of climate change via changes in weather patterns and rising sea levels. The other is the effect of regulation, such as abatement and liability costs. In 2002, institutional investors started to address these concerns collectively via the CDP. Each year, the CDP asks the world’s 500 largest companies (the FT Global 500)4 to disclose their greenhouse gas emissions, risks, opportunities, and management strategies by answering the CDP questionnaire.5
3 See, for example, the Wall Street Journal, “Moving the Market: Investors Urge Large Companies to Disclose Data on Emissions,” 02/02/05. 4 The information requests have historically been sent to the FT Global 500, but in 2006 the CDP expanded and in 2007 the information request was sent to 2,400 companies globally. www.cdproject.net. 5 The CDP questionnaire itself has evolved since 2002. The CDP4 questionnaire includes the following: 1) General: How does climate change represent commercial risks and/or opportunities for your company? 2) Regulation: What are the financial and strategic impacts on your company of existing regulation and proposed future regulation? 3) Physical risks: How are your operations
2
The B.E. Journal of Economic Analysis & Policy, Vol. 11 [2011], Iss. 1 (Contributions), Art. 50
http://www.bepress.com/bejeap/vol11/iss1/art50

Company responses to the CDP questionnaire are made publicly available on the CDP website. The results from the first cycle of the project (CDP1), which was endorsed by 35 institutional investors with $4.5 trillion in assets, were made available on February 17th 2003. Of the FT Global 500 companies, 71% responded and 45% answered the questionnaire in full. Since then, both the number of institutional investors who endorsed the CDP project and the response rate have steadily increased over time.6 By the fourth cycle of the project (CDP4), the number of endorsers had increased to 225 institutional investors with more than $31 trillion in assets. The CDP4 results were made available on September 18th 2006. Of the FT Global 500 companies, 91% responded and 72% answered the questionnaire in full.
Our reading of the questionnaire responses indicates that greenhouse-gas intensive firms typically provide more extensive answers to questions than do other firms. An example is presented in the Appendix for Question 2, “Regulation: What are the financial and strategic impacts on your company of existing regulation and proposed future regulation?” It is difficult to assess the extent to which firms engage in strategic selective disclosure of information to the CDP, 7 but there is some evidence that selective disclosure is becoming less common over time. As mentioned above, in the first cycle of the CDP, 26% of the FT Global 500 provided incomplete responses to the questionnaire, but this percentage had fallen to 19% by the fourth cycle. Of course, even if firms answer all questions, it is very difficult to ascertain whether they left out any relevant information. Furthermore, to the best of our knowledge firms’ responses are not
affected by extreme weather events, changes in weather patterns, etc.? What actions are you taking to adapt to these risks, and what are the associated financial implications? 4) Innovation: What technologies, products, processes or services has your company developed, or is developing, in response to climate change? 5) Responsibility: Who at board level has specific responsibility for climate change related issues and who manages your company's climate change strategies? 6) Emissions: What is the quantity of annual emissions of the six main GHG’s produced by your owned and controlled facilities? 7) Products and services: What are your estimated emissions associated with use and disposal of your products and services, and supply chain? 8) Emissions reduction: What is your firm’s emissions reduction strategy? 9) Emissions trading: What is your firm’s strategy for, and expected cost/profit from, trading in the EU Emissions Trading Scheme? 10) Energy costs: What are the total costs of your energy consumption, e.g. fossil fuels and electric power? Please quantify the potential impact on profitability from changes in energy prices and consumption. http://www.cdproject.net/questionnaire.asp. 6 The CDP2 request was endorsed by 95 institutional investors with $10 trillion in assets. Of the FT500, 86% responded, 60% in full. The results were disclosed on May 19th 2004. The CDP3 request was endorsed by 155 institutional investors with more than $21 trillion in assets; 89% of firms responded and 71% answered in full. The results were disclosed on September 14th 2005. 7 See Kim and Lyon (2011) for an analysis of selective disclosure by firms reporting to the US Department of Energy’s Voluntary Greenhouse Gas Registry.
3
Kim and Lyon: The Carbon Disclosure Project and Shareholder Value
Published by The Berkeley Electronic Press, 2011

verified by any independent party. Thus, as described in more detail below, our empirical strategy focuses simply on whether or not firms responded to the CDP.
3. Literature Review and Research Hypotheses
In this section we review the existing literature on environmental disclosures and shareholder value, and use that literature, plus research from international political economy, to frame a series of research hypotheses.
The literature on environmental disclosures makes a clear distinction between mandatory and voluntary disclosure. Most of the empirical literature has focused on mandatory disclosure programs (Konar and Cohen, 1994; Hamilton, 1995; Gupta and Goldar, 2005; Beatty and Shimshack, 2009; Delmas, Montes, and Shimshack, 2010). The general conclusions from this work are that poor performers are punished by financial markets, and take action to improve their environmental performance; good performers typically receive no financial reward and make no significant changes to environmental performance. Voluntary disclosure has received less empirical attention, perhaps because of severe self-selection problems when analyzing data; most of this work is in the accounting literature and aims to explain the extent of attention to environmental matters in corporate annual reports, corporate social responsibility reports, and 10Ks (Patten, 1991; Patten, 2002; Clarkson et al., 2008). Little is known about the extent to which voluntary disclosures directly affect financial performance.
A key difference between mandatory and voluntary disclosure is that voluntary disclosure introduces “selection effects” in the sense that firms can choose whether or not to disclose. One might expect that firms are more likely to disclose information if they have positive information to report. Indeed, this is exactly what the theoretical literature on voluntary disclosure shows: a manager only discloses information voluntarily when the firm has “good news,” that is, when it performs better than market expectations (Milgrom, 1981; Verrecchia, 1983). In our context, firms’ voluntary participation in the CDP is good news indicating superior environmental performance, and is expected to positively affect their stock prices around the date of CDP disclosure relative to those of non-participants.8 That is, we expect that CDP participation is associated with higher share prices. Thus, we have a simple and general initial hypothesis drawn from the theoretical literature on disclosure:
8 A failure to disclose is not necessarily evidence of “bad news” if disclosure is costly (Verecchia, 1983) or if there is a chance that the discloser simply does not possess the information yet (Shin, 2003). Nevertheless, the theoretical literature makes the robust prediction that disclosers are perceived more favorably than non-disclosers and hence should receive higher share prices.
4
The B.E. Journal of Economic Analysis & Policy, Vol. 11 [2011], Iss. 1 (Contributions), Art. 50
http://www.bepress.com/bejeap/vol11/iss1/art50

Hypothesis 1A: CDP participants experienced increased share prices relative to other firms. In addition, we note that the vast majority of firms continue to participate in the CDP in the years after their initial participation, so there may be relatively little news in a firm’s decision to continue participation over time. Thus, we consider a variant of Hypothesis 1 focused solely on firms choosing to participate for the first time: Hypothesis 1B: First-time CDP participants experienced increased share prices relative to other firms. As mentioned above, disclosure is a voluntary decision that is presumably contingent upon a firm’s environmental performance. Hence, testing for the direct impact of disclosure is biased towards finding a positive effect, due to the endogeneity of the participation decision. If we do find a positive effect, it is not due simply to the act of participation per se, but may be due to the firm’s underlying good environmental performance, which is communicated to investors via CDP participation. However, if we do not find a positive effect, this is a refutation of the fundamental implication of voluntary disclosure behavior. Although we attempt to address selection issue by controlling for firm-specific variables, because of data incompleteness issues that we describe later in the Method section, we are not able to fully address this issue. Endogeneity bias would be a problem if we were testing the hypothesis that participation causes higher returns, but that is not really the question here. We simply test for a correlation between participation and returns, which could be due to causation, endogenous selection, or some other reason.
Beyond the direct effect of disclosure, it is also of interest to examine whether CDP participation may have an indirect impact on shareholder value by mediating the impact of external shocks. Indeed, the empirical literature suggests that investors view firms with more extensive prior disclosures as better prepared for possible future environmental regulations (Blacconiere & Patten, 1994; Blacconiere & Northcut, 1997; Patten & Nance, 1998; Freedman and Patten, 2004).9 Rationality-based stock valuation models suggest that a firm’s stock price 9 Prior empirical studies on the effect of environmental information disclosure consistently find that at times of regulatory threat, environmental disclosure paid off. Blacconiere & Patten (1994) find that chemical firms with more extensive environmental disclosures in their financial report prior to Union Carbide’s 1984 chemical leak in Bhopal, India, experienced a less negative stock market reaction than firms with less extensive prior disclosures. Blacconiere & Northcut (1997) find that chemical firms with more extensive environmental disclosures had a less negative share price reaction after the Superfund Amendments and Reauthorization Act of 1986. Patten & Nance (1998) find that petroleum firms with less extensive environmental disclosures faced more
5
Kim and Lyon: The Carbon Disclosure Project and Shareholder Value
Published by The Berkeley Electronic Press, 2011

is the present value of expected cash flows, discounted at the appropriate rate of return. A regulatory threat has a potentially negative influence on a firm’s expected cash flows because it may increase expected future regulatory costs; firms may have to incur higher compliance costs, penalties, or liability costs (Bowen et al., 1983; Hill and Schneeweis, 1983; Blacconiere & Patten, 1994; Freedman and Patten, 2004). In turn, a decrease in a firm’s expected future cash flows lowers the firm’s stock price. Hence, firms that are better prepared to cope with environmental regulations may be perceived more favorably by investors when the threat of regulation increases. The following paragraphs explain how this idea can be tested in the context of the CDP.
One event that was likely to indicate an increased regulatory threat was Russia’s ratification of the Kyoto Protocol on October 22, 2004. Russia’s ratification had significant effects on implementation of the Kyoto Protocol, the key piece of international climate change regulation. For the Protocol to go into force in all the nations that had ratified it, the Protocol needed to be ratified by at least 55 countries that accounted for at least 55% of global GHG emissions. That threshold was met when Russia ratified the Protocol on October 22, 2004. Thus, it is natural for us to explore whether, upon Russia’s ratification, CDP participation affected stock prices.10 Of course, selection might still be a problem, even with
negative stock price reactions in the wake of the Exxon Valdez oil spill. The oil spill triggered substantial increase in gasoline prices. The unexpected price increase was interpreted as good news for petroleum companies leading to positive abnormal returns (Pattern and Nance, 1998). Freedman and Patten (2004) find that toxic emitters with less extensive environmental disclosures suffered more negative reactions upon the unexpected proposal by President Bush in 1989 for revisions to the Clean Air Act. 10 One might be concerned that Russia’s ratification did not constitute a true “event,” because all relevant information had leaked out previously. Indeed, the uncertainties inherent in predicting Russian political behavior were illustrated well in early 2002, when newspapers reported on a series of events that increased the likelihood that Russia would ratify the Protocol. In April 2002, Putin announced that Russia soon would move forward on the Kyoto Protocol, leading many observers to expect that Russia would ratify in time for the World Summit on Sustainable Development in Johannesburg in September 2002 (Henry and Sundstrom 2007). The Johannesburg Summit came and went, however, without Russian ratification of the Kyoto Protocol. In late 2004, there was again a series of articles suggesting a higher likelihood of Russia’s ratification of the Kyoto Protocol, but doubts remained once again. On September 29, 2004, the New York Times reported that “In Moscow, a hitherto skeptical Russian government has set in motion legislative action that could lead to Russia's approval of the Kyoto agreement.” On September 30, 2004, the Financial Times reported that “Russia will ‘within weeks’ ratify the Kyoto protocol on global climate change… After the protocol, which secured Mr. Putin's backing in May, is passed by the cabinet, it will move to the Kremlin-dominated Duma for ratification.” The following day the same paper reported that “It is too early to celebrate” even though “the Russian government yesterday approved the Kyoto protocol to combat global warming and sent it to the Duma for the formal ratification that is the key to bringing this seven-year-old international treaty into effect.” These stories suggest parallels with sporting events or electoral politics:
6
The B.E. Journal of Economic Analysis & Policy, Vol. 11 [2011], Iss. 1 (Contributions), Art. 50
http://www.bepress.com/bejeap/vol11/iss1/art50

the exogenous shock of Russia’s ratification. Endogenous selection means that some unobserved variable is helping to determine who participated in the CDP and who did not, and this might also be helping to determine investors’ response upon Russia’s ratification. If CDP participation is purely voluntary, this might be a big problem since the voluntary disclosure theory suggests that clean firms choose to participate in the CDP and investors might reward clean firms. If CDP participation is not purely voluntary (due to pressure from large institutional investors), however, this problem might be small because not only clean but dirty firms also participate in the CDP. As will be explained in the Data section, we try to address selection issues by controlling for firm-specific variables to the extent possible. Just how CDP participation affected shareholder value depends upon how Russia’s ratification affected regulatory threats. This is a more subtle matter than it may appear at first glance. Two questions are especially important. First, how were firms in greenhouse-gas intensive industries expected to fare under regulation? Second, did Russia’s ratification increase regulatory threats more in countries that had already ratified Kyoto or in countries that had not ratified it? We discuss each in turn.
The impact of Russia’s ratification would naturally be expected to have a greater impact on firms in greenhouse-gas intensive industries such as energy, ferrous metals, mineral, and pulp and paper.11 This impact was mediated, however, by investors’ expectations regarding the implementation of carbon regulations, and in particular the extent to which countries were expected to protect incumbent firms against the costs of carbon regulations. Even though firms could expect an increase in costs under climate regulation, if nations were expected to protect incumbents---perhaps by “grandfathering” them into a cap-and-trade system through the allocation of “free” permits---then even CDP non-participants might experience no negative abnormal returns upon Russia’s ratification of the Kyoto Protocol. Indeed, Burtraw and Palmer (2008) show that for the electricity sector, if all permits are given away for free to producers, the industry would stand to gain a remarkable $65 billion in profits from carbon regulation! A more conservative allocation strategy would be to allocate just enough free allowances to protect the firms hardest hit by regulation; doing so would require well under 100% of permits, but would still leave very substantial rents to firms that are better prepared for regulation. Regardless of how allowances are allocated under whether the Yankees are picked to beat the Phillies in the World Series, or Dewey is picked to beat Truman for the U.S. Presidency, the final outcome remains news. Clearly one could choose to focus on other events leading up to Russian ratification, such as Putin’s endorsement of Kyoto, or the Russian government’s approval of it. Nevertheless, because it was the Duma’s ultimate ratification that sealed the deal, we have chosen to focus on this event. By looking at this final step in the process, we have if anything biased the empirical analysis against finding any significant effects of ratification. 11 Refer to footnotes in Table 3 for a complete list of industries included in our sample.
7
Kim and Lyon: The Carbon Disclosure Project and Shareholder Value
Published by The Berkeley Electronic Press, 2011
future climate regulations, we hypothesize that investors will treat CDP participants in greenhouse-gas industries more favorably than other firms.
Hypothesis 2: CDP participants in GHG industries in all countries experienced greater cumulative abnormal returns upon Russia’s ratification of the Kyoto Protocol than other firms.
With regard to where Kyoto’s ratification was likely to have more impact, we consider two different possibilities regarding the effects of ratification on the regulatory pressures faced by firms. Under the first view, which emphasizes regulatory constraints, the emphasis is on the fact that the Kyoto Protocol did not become binding---even for nations that had already ratified---until Russia ratified it on October 22, 2004. Prior to this date, firms in ratifying countries might have rationally delayed preparing for climate regulation, reasoning that a dollar spent tomorrow is cheaper than a dollar spent today. However, in reality, even before Russia made its decision firms in Kyoto-signatory nations were under pressure to take substantial action to prepare for eventual ratification.12
The alternative view emphasizes international pressure, and derives from the literature on international institutions, which discusses how such institutions can affect domestic policy through various channels even in the absence of legal obligations (Keohane, et al., 1993; Cortell and Davis, 1996; Bernstein, 2002; Martin and Simmons, 2005; Simmons and Hopkins, 2005). The mechanism involved is that international institutions embody international norms and thus exert pressure on recalcitrant nations. This view suggests that at the time of Russian ratification, CDP participation was more likely to affect stock prices in countries that had not previously ratified the Kyoto Protocol. Indeed, the Wall Street Journal described how Russia’s ratification increased the regulatory pressure in the US.13 For firms in the US and other non-ratifying nations, it seems plausible that Russia’s ratification increased the probability of domestic regulatory action of climate change. Because firms in countries that had already ratified Kyoto were under pressure to prepare for carbon constraints prior to Russia’s ratification, we expect the international pressure perspective to be more important than the regulatory constraint perspective.
12 For instance, the European Union Emission Trading Scheme (EU ETS) was designed to comply with the Kyoto Protocol. Although the EU ETS officially started operation in January 2005, it was designed well before Russia’s ratification on October 22, 2004. The EU ETS is based on Directive 2003/87/EC, which entered into force in 2003. For a supporting perspective, see Bernstein (2002), which provides an interesting case study of how the Kyoto Protocol shaped the domestic climate change policy of Kyoto signatory Canada before Russia’s ratification. 13 The Wall Street Journal, “As Kyoto Protocol Comes Alive, So Do Pollution-Permit Markets --- Funds Handling Trades For Emissions Credits Gain While Russia Sets Pact,” November 8, 2004.
8
The B.E. Journal of Economic Analysis & Policy, Vol. 11 [2011], Iss. 1 (Contributions), Art. 50
http://www.bepress.com/bejeap/vol11/iss1/art50
The foregoing discussion positions us for our final hypothesis. Assuming that (a) investors viewed CDP participants as better prepared for regulation than non-participants, (b) GHG industries were more affected by regulation, and (c) Russia’s ratification was more relevant for non-Kyoto countries, we have:
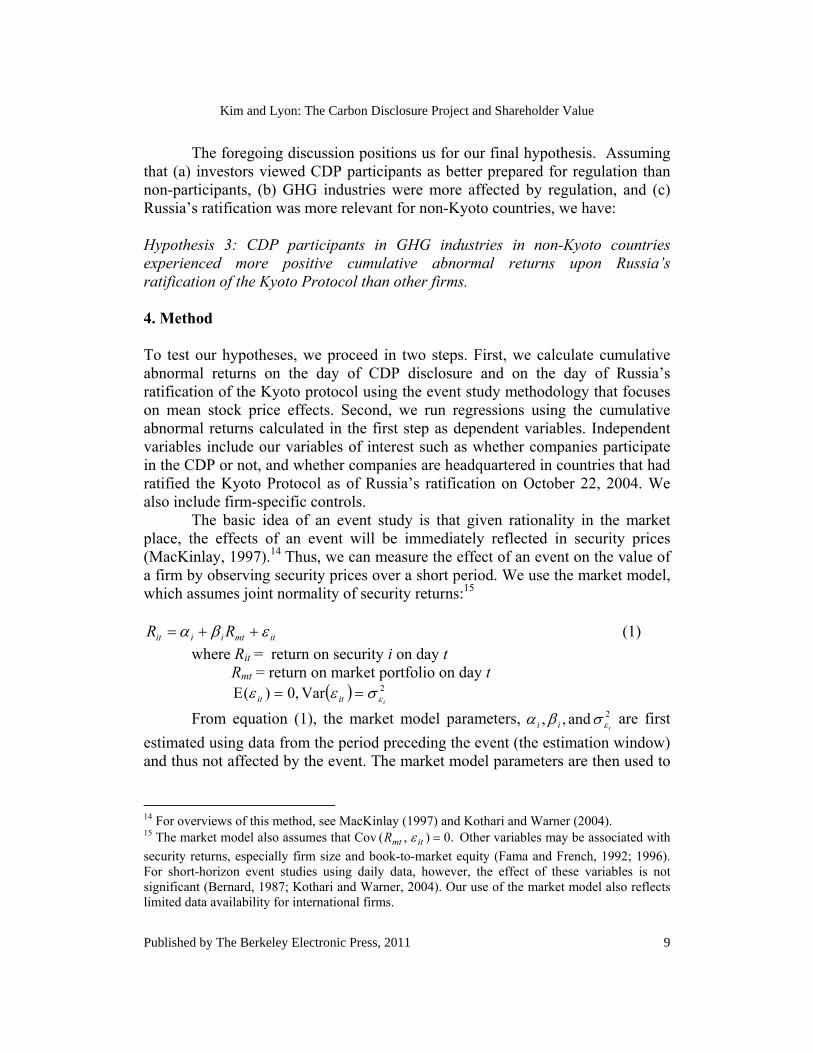
Hypothesis 3: CDP participants in GHG industries in non-Kyoto countries experienced more positive cumulative abnormal returns upon Russia’s ratification of the Kyoto Protocol than other firms. 4. Method To test our hypotheses, we proceed in two steps. First, we calculate cumulative abnormal returns on the day of CDP disclosure and on the day of Russia’s ratification of the Kyoto protocol using the event study methodology that focuses on mean stock price effects. Second, we run regressions using the cumulative abnormal returns calculated in the first step as dependent variables. Independent variables include our variables of interest such as whether companies participate in the CDP or not, and whether companies are headquartered in countries that had ratified the Kyoto Protocol as of Russia’s ratification on October 22, 2004. We also include firm-specific controls. The basic idea of an event study is that given rationality in the market place, the effects of an event will be immediately reflected in security prices (MacKinlay, 1997).14 Thus, we can measure the effect of an event on the value of a firm by observing security prices over a short period. We use the market model, which assumes joint normality of security returns:15
itmtiiit RR (1)
where Rit = return on security i on day t Rmt = return on market portfolio on day t 2Var,0)(
iitit
From equation (1), the market model parameters, 2and,,iii are first
estimated using data from the period preceding the event (the estimation window) and thus not affected by the event. The market model parameters are then used to
14 For overviews of this method, see MacKinlay (1997) and Kothari and Warner (2004). 15 The market model also assumes that Cov .0),( itmtR Other variables may be associated with
security returns, especially firm size and book-to-market equity (Fama and French, 1992; 1996). For short-horizon event studies using daily data, however, the effect of these variables is not significant (Bernard, 1987; Kothari and Warner, 2004). Our use of the market model also reflects limited data availability for international firms.
9
Kim and Lyon: The Carbon Disclosure Project and Shareholder Value
Published by The Berkeley Electronic Press, 2011

calculate abnormal returns during an event window. 16 As shown in equation (2) the abnormal return is calculated by subtracting the normal return from the actual ex post return of the security during the event window.
)ˆˆ( mtiiitit RRAR (2)
where ARit = abnormal return on security i on day t Our estimation window is 250 trading days long. It commences 256
trading days before the event, and ends six trading days before the event. We consider event windows ranging from 2 days (the day of the event and the following day) to 5 days in length (two days before the event to two days after the event). We choose the large estimation window to minimize out-of-sample bias. Out-of-sample bias can arise since the event study methodology applies the estimated results from estimation window to event window. Abnormal returns are essentially calculated on an out-of-sample basis. Thus, any difference between in-sample (event window) and out-of-sample (estimation window) periods should be taken into account (Collins and Dent, 1984). With the large estimation window, however, the increase in variance over the event window due to sampling error in
ii and becomes negligible as the sampling error of the parameters vanishes
(MacKinlay, 1997). Under this circumstance, the variance of the abnormal returns over the event window can be approximated by the variance of the error term in equation (4), i.e., 2Var
iitAR , as shown in MacKinlay (1997).
To examine the effect of an event, it is important to allow for the possibility of information leakage during pre-event periods and for adjustment periods following the event. Thus, the abnormal returns to be studied should be aggregated over multiple days. We use multiple event windows, which include both pre-event and post-event periods, in order to ensure the robustness of our results. As mentioned above, they range from a two-day window (0,1) to a five-day window (-2,2). For an event window running from date t1 to date tT, cumulative abnormal returns for firm i are
11
( , , )T
i T itt
CAR t t AR
(3)
16 The market model differs from the Capital Asset Pricing Model (CAPM), which is based on an equilibrium theory where the expected return of a given asset is determined by its covariance with the market portfolio ( ,)( itftmtiiftit RRRR where Rft is the risk-free rate, and i is
expected to be zero). The use of the CAPM is common in event studies of the 1970s. However, deviations from the CAPM have been discovered, implying that the validity of the restrictions imposed by the CAPM is questionable. Because this potential can be avoided at little cost by using the market model, the use of the CAPM has almost ceased (MacKinlay, 1997).
10
The B.E. Journal of Economic Analysis & Policy, Vol. 11 [2011], Iss. 1 (Contributions), Art. 50
http://www.bepress.com/bejeap/vol11/iss1/art50

The cumulative abnormal returns calculated as described above, however, do not take into account differences in firm or industry characteristics. Thus, we treat the cumulative abnormal returns as dependent variables in ordinary least square regressions. Independent variables include the status of CDP disclosure, along with firm, industry, and country-related variables that we describe in more detail below. 5. Data We make use of companies’ responses to the first four cycles of the CDP, CDP1 through CDP4. We obtained the CDP response data from Innovest, a company specializing in identifying non-traditional sources of risk and value potential for investors. The data include the FT Global 500 companies in 2006, the year for their CDP4 response. The data also include the company responses to the CDP1, CDP2 and CDP3 requests.
For our event study analysis, we re-categorize the CDP response categories. The CDP places corporate responses into five categories: Questionnaire Forthcoming (QF), Answered Questionnaire (AQ), Provided Information (IN), Declined to Participate (DP), and No Response (NR).17 We combine the five categories into two categories based on the similarity of responses. CDP participants include companies in the QF or AQ categories; CDP non-participants include companies in the DP or NR categories.18 We do not include the IN category in either of our two categories, because the IN category seems quite distinct either from the CDP participant group or the CDP non-participant group, and because the IN category is so broad as to be difficult to interpret. Table 1 shows the number of companies in each response category in our sample.
17 QF = Questionnaire Forthcoming, which means a company has confirmed that it does intend to answer the CDP questions. AQ = Answered Questionnaire, which means a company has answered the questions as they are set out in the CDP documents. IN = Provided Information, which means a company has responded by providing an Environment / CSR / Annual report or a web link to such a report. It could also be a more detailed email or letter that provides some information but does not actually answer the questions as they are set out in the CDP documents. DP = Declined to Participate, which means a company has responded saying that they will not be answering the CDP questions. NR = No Response, which means a company has not responded at all. http://www.cdproject.net/faq.asp. 18 By treating firms in the QF category as participants, we are taking them at their word if they said the questionnaire was forthcoming from them. Otherwise, they could have simply made no response, or declined to participate.
11
Kim and Lyon: The Carbon Disclosure Project and Shareholder Value
Published by The Berkeley Electronic Press, 2011

Table 1. Number of Companies in CDP Response Categories in our Samplea
Responseb CDP1 CDP2 CDP3 CDP4
QF 0 17 0 27
AQ 185 244 319 345
DP 62 54 41 43
NR 83 48 44 40
IN 32 23 34 44
NAc 137 114 62 1 a We obtained the CDP response data from Innovest, a company specializing in identifying non-traditional sources of risk and value potential for investors. The data includes the FT Global 500 companies in 2006, the year for their CDP4 response. bRefer to footnote 17 for details on the definition of each response. c NA: Not Available, or Not in FT Global 500.
Data for our first step of the event study are collected as following. To
construct the global benchmark, we use the Morgan Stanley Capital Investments (MSCI) World Total Returns Index.19 This index is the most widely used index for daily event studies involving global companies. The index consists of 24 developed market country indices; most of the companies in our sample are located in these countries. Country indices consist of every listed security in the country. Because of the large market capitalization of the global 500 firms we study, it is possible they are large enough in the aggregate to affect the performance of the market index we use. 20 Nevertheless, the World Total Returns Index is the most inclusive index available, and any index based on smaller-cap stocks is unlikely to be representative of the performance of the Global 500. Hence we feel the index we have used is the best available choice. We obtain the firm-specific daily return index from Thomson Datastream.21
19 The MSCI total return index values are used with permission of Wharton Research Data Services (WRDS). Global benchmark returns on day t are set equal to (RIt/RIt-1)-1, where RIt is the return index on day t. 20 As of 2009, the total market cap of the global 500 companies was USD 15,617 billion (FT Global 500 2009, FT.com). The total market cap of all publicly traded companies in the world was about $40 trillion in 2008 (Wikipedia). As a rough estimate, then, about 40 percent of the index we used is composed of the FT Global 500 companies. 21 Using the firm-specific daily return index, with permission of Datastream, we construct the firm-specific daily return values as follows, where ex-date refers to the first day of the ex-dividend period (the period of time between the announcement of the dividend and the payment). If t ≠ ex-date of the dividend payment Dt, , then Rt = (Pt/Pt-1) – 1, where Pt = adjusted closing price on date t, where Pt-1 = adjusted closing price on previous day, and Dt = dividend payment associated with
12
The B.E. Journal of Economic Analysis & Policy, Vol. 11 [2011], Iss. 1 (Contributions), Art. 50
http://www.bepress.com/bejeap/vol11/iss1/art50
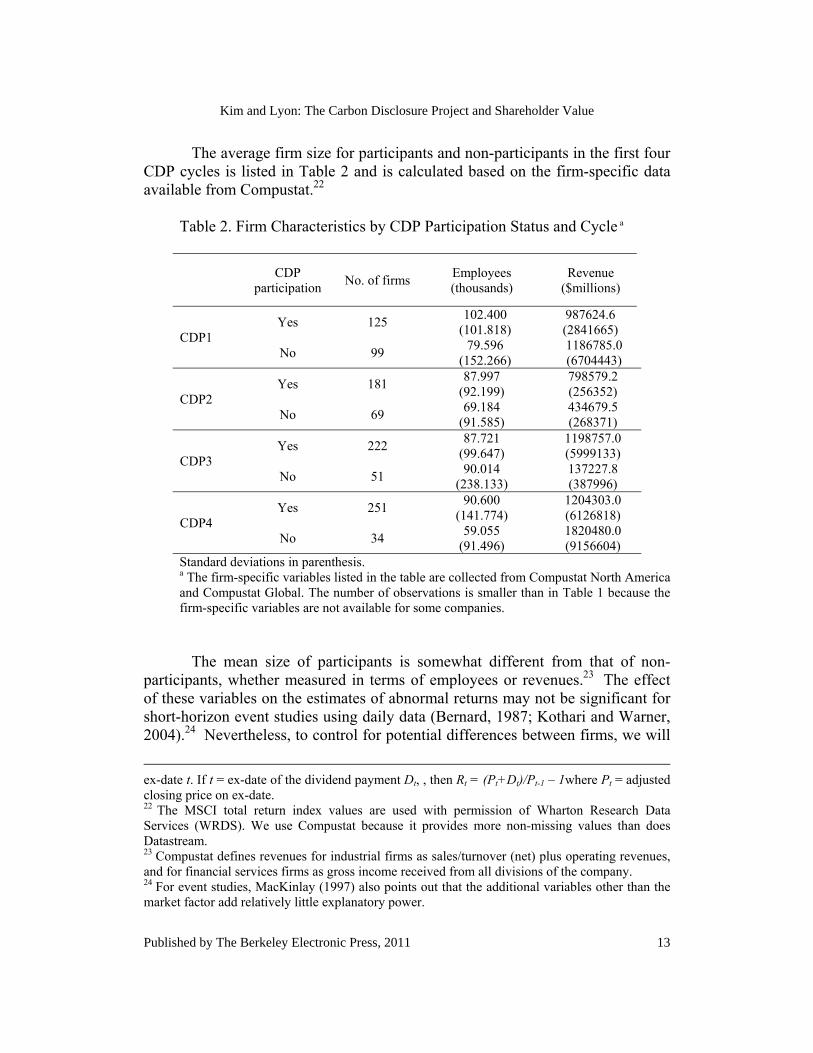
The average firm size for participants and non-participants in the first four CDP cycles is listed in Table 2 and is calculated based on the firm-specific data available from Compustat.22
Table 2. Firm Characteristics by CDP Participation Status and Cycle a
CDP participation
No. of firms Employees (thousands)
Revenue ($millions)
CDP1 Yes 125
102.400 (101.818)
987624.6 (2841665)
No 99 79.596
(152.266) 1186785.0 (6704443)
CDP2 Yes 181
87.997 (92.199)
798579.2 (256352)
No 69 69.184
(91.585) 434679.5 (268371)
CDP3 Yes 222
87.721 (99.647)
1198757.0 (5999133)
No 51 90.014
(238.133) 137227.8 (387996)
CDP4 Yes 251
90.600 (141.774)
1204303.0 (6126818)
No 34 59.055
(91.496) 1820480.0 (9156604)
Standard deviations in parenthesis. a The firm-specific variables listed in the table are collected from Compustat North America and Compustat Global. The number of observations is smaller than in Table 1 because the firm-specific variables are not available for some companies.
The mean size of participants is somewhat different from that of non-
participants, whether measured in terms of employees or revenues.23 The effect of these variables on the estimates of abnormal returns may not be significant for short-horizon event studies using daily data (Bernard, 1987; Kothari and Warner, 2004).24 Nevertheless, to control for potential differences between firms, we will
ex-date t. If t = ex-date of the dividend payment Dt, , then Rt = (Pt+Dt)/Pt-1 – 1where Pt = adjusted closing price on ex-date. 22 The MSCI total return index values are used with permission of Wharton Research Data Services (WRDS). We use Compustat because it provides more non-missing values than does Datastream. 23 Compustat defines revenues for industrial firms as sales/turnover (net) plus operating revenues, and for financial services firms as gross income received from all divisions of the company. 24 For event studies, MacKinlay (1997) also points out that the additional variables other than the market factor add relatively little explanatory power.
13
Kim and Lyon: The Carbon Disclosure Project and Shareholder Value
Published by The Berkeley Electronic Press, 2011

include these firm-specific size variables in our ordinary least-squares regressions. Other firm-specific variables, such as profitability, carbon emissions, and international exposure, might also be relevant, but these data are highly incomplete for both Compustat Global and Datastream.
Table 3 summarizes information on Kyoto ratification status, including which countries had ratified, the number of firms in ratifying countries and non-ratifiers, and the number of firms in GHG industries for ratifiers and non-ratifiers.25 We categorize firms by whether they are in greenhouse-gas intensive industries (which we refer to as “GHG industry” firms), taking as our basis how firms are treated under the EU ETS. The Yes category includes companies in energy, production and processing of ferrous metals, mineral, and pulp and paper industries. The No category includes all other industries (European Environmental Agency 2006, p.43).26 6. Results The results of our empirical analysis are presented in Tables 4-8.27 We begin with estimates of the direct effect of CDP participation on shareholder value, and then turn to the indirect effect on shareholder value of CDP participation when an exogenous shock occurs.
25 The number of firms shown in Table 3 differs from the number of firms in Table 5 and Table 8 because incompleteness of firm-specific data reduced our sample size. 26Note that our sample covers diverse industries including Advertising, Aerospace & Defense, Air Freight & Couriers, Automobiles, Banks, Biotechnology, Broadcasting & Cable TV, Computers & Peripherals, Diversified Financials, Electric Power Companies, Food Products, Health Care Providers & Services, Hotels, Restaurants & Leisure, Insurance, Integrated Oil & Gas, Internet Software & Services, Metals & Mining, Movies & Entertainment, Paper & Forest Products, Pharmaceuticals, Publishing, Real Estate Management & Development, Semiconductor Equipment & Products, Steel, Surface Transport, Textiles, Apparel & Luxury Goods, Wireless Telecommunication Services. 27 Some sub-samples in our dataset may periodically experience significant abnormal returns for reasons other than CDP participation or Russia’s ratification of Kyoto. For example, greenhouse-gas intensive industries headquartered in the US are primarily in the energy industry, either electric utilities or oil and gas firms. A positive or negative shock to global oil prices will likely cause all of these firms to experience correlated abnormal returns, as might any event that changes the likelihood of climate change regulation, such as election results that change control of the House of Representatives from Democrat to Republican. We have conducted falsification tests to explore--whether the sample experienced abnormal shocks one week, two weeks or three weeks prior to the event (Beatty and Shimshack, 2010)--but cannot rule out the possibility that during some periods greenhouse-gas intensive industries in the US experienced abnormal returns that differ from those of the market as a whole. Because we focus on such a sub-set of firms, however, there is no way to avoid this possibility. The fact that other events cause shocks to energy-intensive firms does not seem to negate the fact that the events we consider also cause shocks to these firms.
14
The B.E. Journal of Economic Analysis & Policy, Vol. 11 [2011], Iss. 1 (Contributions), Art. 50
http://www.bepress.com/bejeap/vol11/iss1/art50

Table 3. Kyoto Ratification Status, 2004a
CDP2 sample Firms in countries that had ratified Kyoto as of Oct 22, 2004
Firms in countries that had not ratified Kyoto as of Oct 22, 2004
Number of firms 358 183 175
GHG Industry Yes – 60 No – 298
Yes – 37 No – 146
Yes – 23 No – 152
Countries represented Australia – 5 Belgium – 4 Brazil – 2 Canada – 16 Denmark – 3 Finland – 1 France – 21 Germany – 13 Hong Kong – 8 India – 2 Ireland – 3 Italy – 9 Japan – 35 Mexico – 2 Netherlands – 8 Norway – 2 Russia – 3 Saudi Arabia – 5 Singapore – 2 South Africa – 1 South Korea – 2 Spain – 8 Sweden – 6 Switzerland – 7 Taiwan – 2 UK – 27 US – 161
Belgium – 4 Brazil – 2 Canada – 16 Denmark – 3 Finland – 1 France – 21 Germany – 13 Hong Kong – 8 India – 2 Ireland – 3 Italy – 9 Japan – 35 Mexico – 2 Netherlands – 8 Norway – 2 Russia – 3 South Africa – 1 South Korea – 2 Spain – 8 Sweden – 6 Switzerland – 7 UK – 27
Australia – 5 Saudi Arabia – 5 Singapore – 2 Taiwan – 2 US – 161
a Kyoto ratification status indicates whether the country had already ratified the Kyoto Protocol when Russia ratified Kyoto on Oct 22, 2004.
15
Kim and Lyon: The Carbon Disclosure Project and Shareholder Value
Published by The Berkeley Electronic Press, 2011

6.1 Direct Effects of Firms’ CDP Participation Decisions
The direct effects of each CDP disclosure are shown in Tables 4-7, covering CDP1 through CDP4, respectively. In each table, we take as our dependent variable the cumulative abnormal returns experienced by a firm during our event window. To check the robustness of our results, we use four different event windows that range from 2 days to 5 days in length. Our key independent variables are CDP participation and whether the firm’s primary line of business is greenhouse-gas intensive, which we include separately as well as through a multiplicative interaction term; in addition, we include firm-specific control variables. We also include a dummy variable indicating first-time participation to explore whether this was more informative to investors than subsequent participation.28
Table 4. CDP1 Disclosure
5-day
Window 3-day
Window 2-day
Window 3-day
Window
VARIABLES CAR(-2,2) CAR(-1,1) CAR(0,1) CAR(0,2)
Employee -1.37E-05 -5.32E-06 -1.81e-05** -2.37e-05**
(1.44E-05) (8.85E-06) (7.51E-06) (1.13E-05)
Revenue 9.74E-10 -2.57E-10 -7.26E-11 6.06E-10
(6.25E-10) (6.33E-10) (4.91E-10) (6.51E-10)
GHG Industry 0.0172* -0.0149*** -0.00457 0.00584
(0.00992) (0.00559) (0.00451) (0.00395)
CDP1 participation 0.00226 -0.000129 0.000512 0.00136
(0.00499) (0.00376) (0.0032) (0.00382)
CDP1× GHG Industry -0.0280** 0.00871 0.00601 -0.00826
(0.0128) (0.00703) (0.0067) (0.00707)
Constant -0.00394 0.0118*** 0.00397** -0.00183
(0.00342) (0.0024) (0.00187) (0.00257)
Observations 224 224 224 224
R2 0.022 0.017 0.015 0.017
F 1.717 1.791 1.391 1.456
Robust standard errors in parentheses
*** p<0.01, ** p<0.05, * p<0.1
28 A small number of firms dropped out of the CDP after initial participation, and we tested whether dropping out affected cumulative abnormal returns, but found no evidence of a significant impact.
16
The B.E. Journal of Economic Analysis & Policy, Vol. 11 [2011], Iss. 1 (Contributions), Art. 50
http://www.bepress.com/bejeap/vol11/iss1/art50

Table 5. CDP2 Disclosure
5-day Window
3-day Window
2-day Window
3-day Window
VARIABLES CAR(-2,2) CAR(-1,1) CAR(0,1) CAR(0,2)
Employee -2.93E-06 -6.90E-06 -8.73E-06 -1.88E-05
(1.73E-05) (1.43E-05) (1.04E-05) (1.32E-05)
Revenue 3.59e-09*** 2.41e-09*** 1.56e-09** 4.51e-09***
(1.00E-09) (8.10E-10) (6.50E-10) (1.17E-09)
GHG Industry -0.0122 0.0134 0.0178* 0.014
(0.0101) (0.0178) (0.00979) (0.0139)
CDP2 participation 0.00606 0.0029 0.00620** 0.00362
(0.00509) (0.00408) (0.00276) (0.00398)
CDP2× GHG Industry 0.0107 -0.0187 -0.0171 -0.0111
(0.0119) (0.019) (0.0104) (0.0148)
First time participation1 0.00135 0.00331 0.00257 0.00221
(0.0049) (0.00466) (0.00295) (0.00392)
Constant -0.0134*** -0.00246 -0.00783*** -0.00737**
(0.00468) (0.00341) (0.0022) (0.00321)
Observations 250 250 250 250
R2 0.095 0.058 0.093 0.173
F 3.465 2.262 3.268 4.142 1 63 out of 250 firms are first time participants Robust standard errors in parentheses. *** p<0.01, ** p<0.05, * p<0.1
Our results in Tables 4 - 7 consistently fail to find a significant direct
impact of CDP participation on cumulative abnormal returns, regardless of whether a firm is in a GHG-intensive industry or not. Furthermore, first-time participation is no more significant than subsequent participation. Thus, our evidence is consistent with the idea that Hypothesis 1A and Hypothesis 1B do not hold.
Given the robust nature of the predictions that come from voluntary disclosure theory, our results are surprising. Firms have the opportunity to select into participation based on their belief that they have “good news” to report. This endogenous self-selection biases our tests in favor of finding a significant and positive effect. Yet despite this bias, we find no significant effects.
17
Kim and Lyon: The Carbon Disclosure Project and Shareholder Value
Published by The Berkeley Electronic Press, 2011
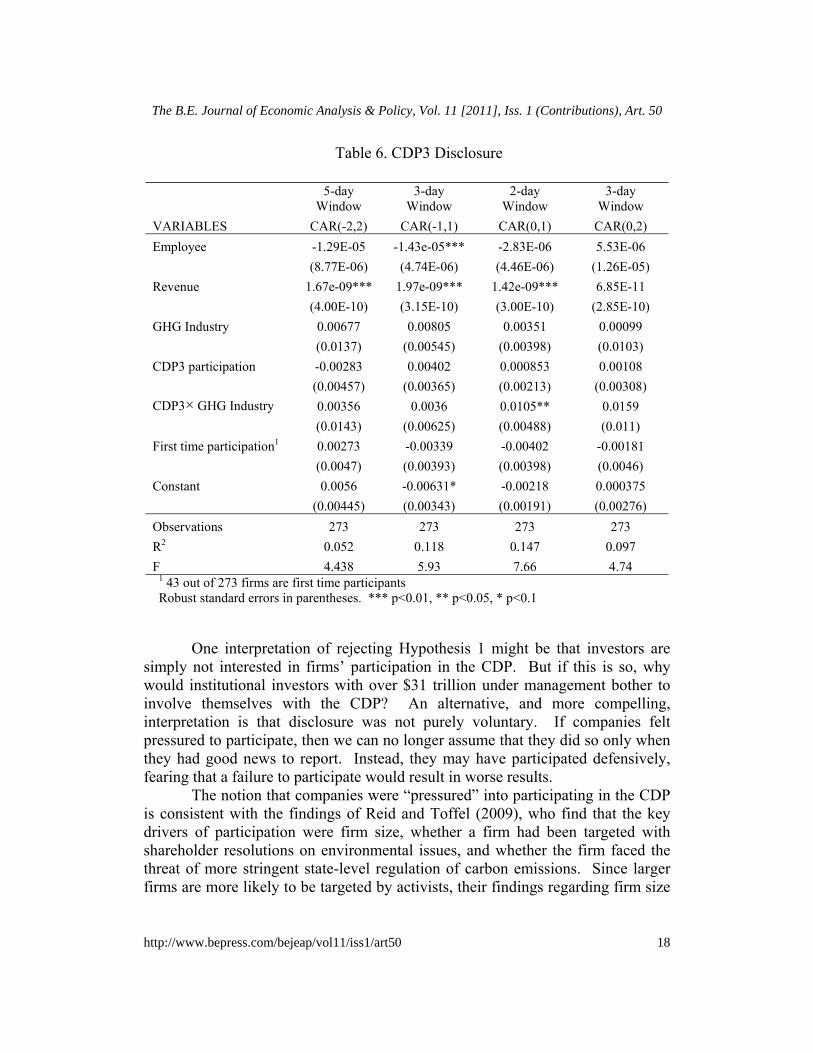
Table 6. CDP3 Disclosure
5-day Window
3-day Window
2-day Window
3-day Window
VARIABLES CAR(-2,2) CAR(-1,1) CAR(0,1) CAR(0,2)
Employee -1.29E-05 -1.43e-05*** -2.83E-06 5.53E-06
(8.77E-06) (4.74E-06) (4.46E-06) (1.26E-05)
Revenue 1.67e-09*** 1.97e-09*** 1.42e-09*** 6.85E-11
(4.00E-10) (3.15E-10) (3.00E-10) (2.85E-10)
GHG Industry 0.00677 0.00805 0.00351 0.00099
(0.0137) (0.00545) (0.00398) (0.0103)
CDP3 participation -0.00283 0.00402 0.000853 0.00108
(0.00457) (0.00365) (0.00213) (0.00308)
CDP3× GHG Industry 0.00356 0.0036 0.0105** 0.0159
(0.0143) (0.00625) (0.00488) (0.011)
First time participation1 0.00273 -0.00339 -0.00402 -0.00181
(0.0047) (0.00393) (0.00398) (0.0046)
Constant 0.0056 -0.00631* -0.00218 0.000375
(0.00445) (0.00343) (0.00191) (0.00276)
Observations 273 273 273 273
R2 0.052 0.118 0.147 0.097
F 4.438 5.93 7.66 4.74 1 43 out of 273 firms are first time participants Robust standard errors in parentheses. *** p<0.01, ** p<0.05, * p<0.1
One interpretation of rejecting Hypothesis 1 might be that investors are simply not interested in firms’ participation in the CDP. But if this is so, why would institutional investors with over $31 trillion under management bother to involve themselves with the CDP? An alternative, and more compelling, interpretation is that disclosure was not purely voluntary. If companies felt pressured to participate, then we can no longer assume that they did so only when they had good news to report. Instead, they may have participated defensively, fearing that a failure to participate would result in worse results.
The notion that companies were “pressured” into participating in the CDP is consistent with the findings of Reid and Toffel (2009), who find that the key drivers of participation were firm size, whether a firm had been targeted with shareholder resolutions on environmental issues, and whether the firm faced the threat of more stringent state-level regulation of carbon emissions. Since larger firms are more likely to be targeted by activists, their findings regarding firm size
18
The B.E. Journal of Economic Analysis & Policy, Vol. 11 [2011], Iss. 1 (Contributions), Art. 50
http://www.bepress.com/bejeap/vol11/iss1/art50

are also consistent with the notion that external pressure, not financial benefits, explains decisions to participate in the CDP. 29
Table 7. CDP4 Disclosure
5-day Window
3-day Window
2-day Window
3-day Window
VARIABLES CAR(-2,2) CAR(-1,1) CAR(0,1) CAR(0,2)
Employee -1.98E-06 -1.02E-05 1.02E-06 9.42E-06
(1.14E-05) (1.16E-05) (5.11E-06) (6.41E-06)
Revenue -1.35e-09** -1.25e-09** -4.49E-10 -2.26e-09***
(6.50E-10) (5.91E-10) (4.03E-10) (5.81E-10)
GHG Industry -0.0202* 0.0136 0.0114* -0.0144*
(0.0109) (0.00829) (0.00602) (0.00837)
CDP4 participation 0.00149 6.84E-06 8.26E-05 -0.00151
(0.00472) (0.00366) (0.00261) (0.00323)
CDP4× GHG Industry -0.00544 -0.0150* -0.0074 0.00211
(0.012) (0.009) (0.0066) (0.00906)
First time participation1 0.00101 -0.000194 0.00129 7.54E-05
(0.0048) (0.00298) (0.00246) (0.00382)
Constant -0.000881 -0.000793 -0.00461** 0.00109
(0.00409) (0.00304) (0.00213) (0.00264)
Observations 285 285 285 285
R2 0.117 0.031 0.025 0.118
F 6.001 1.45 1.314 7.774 1 33 out of 285 firms are first time participants Robust standard errors in parentheses. *** p<0.01, ** p<0.05, * p<0.1
Our results take a completely different approach than Reid and Toffel
(2009), focusing on how investors responded to CDP participation, rather than what motivated firms to participate. Nevertheless, both analyses imply that external pressure was essential to inducing firms to participate.
29 Sinclair-Desgagne and Gozlan (2003) develop a theory of environmental disclosure along these lines, though it aims to capture the influence of environmental groups that can threaten a boycott of a company’s product, rather than the influence of investors that can shift capital away from the target company.
19
Kim and Lyon: The Carbon Disclosure Project and Shareholder Value
Published by The Berkeley Electronic Press, 2011

6.2 Effects of Russia’s Ratification of the Kyoto Protocol We turn now to Hypotheses 2 and 3, which explore the effects of prior disclosure with a shock to the business environment. Specifically, the effects of Russia’s ratification of Kyoto on stock prices are examined in Table 8. As independent variables we include dummy variables for whether the firm had participated in CDP2, whether or not a firm is in a greenhouse-gas intensive industry, 30 and whether the firm is headquartered in a country that had already ratified the Kyoto Protocol. We also include firm-specific controls.31
Hypothesis 2 predicts that when Russia ratified Kyoto, CDP2 participation was more valuable for firms in GHG-intensive industries than for other firms. We test this hypothesis using an interaction variable multiplying CDP participation and whether the firm was in a GHG-intensive industry. We find no significant impact of this interaction term across the various event windows we study, so our evidence is consistent with the conclusion that there was no systematic advantage of CDP participation for firms in GHG-intensive industries.Hypothesis 3 further refines the foregoing hypothesis, arguing that it only applies in countries where Russia’s ratification resulted in an increased regulatory threat, and that these countries were in fact the ones that had not ratified the Kyoto Protocol. In terms of the theoretical rationale presented in section 3, this is equivalent to arguing that Russia’s ratification of Kyoto had a greater impact through increasing the international pressure on the US and other non-ratifiers than it did through inducing more stringent implementation of the commitments made by Kyoto ratifiers. We test this hypothesis using a triple interaction term between three dummy variables, that is, CDP Participant×GHG-Intensive Industry×non-Kyoto country. In Table 8 the coefficient on this interaction term is consistently positive and significant across our alternative event windows, with a value ranging from .0116 to .0168. This implies these firms experienced cumulative abnormal returns roughly .014% higher than other firms. Thus, CDP participation created positive shareholder value for firms faced with a greater regulatory threat, embodied here in the threat that the US and other non-ratifiers might impose carbon regulations on GHG-intensive industries. Our results indicate that investors perceived CDP participants as better prepared for such regulation, and rewarded them financially.
30 GHG industry indicates whether a firm is in the GHG emitting industries, especially those covered by the EU ETS. The Yes category includes companies in energy, production and processing of ferrous metals, mineral, and pulp and paper industries. The No category includes all other industries. (European Environmental Agency (2006), p.43). 31 We also tried categorizing firms based on whether they were in an Energy Industry (electric utilities, oil and gas, or coke ovens), but the results were very similar to the ones obtained using the GHG-intensive category, so they are not reported here.
20
The B.E. Journal of Economic Analysis & Policy, Vol. 11 [2011], Iss. 1 (Contributions), Art. 50
http://www.bepress.com/bejeap/vol11/iss1/art50

6.3 Valuing the Effect of CDP Participation at the Time of Russia’s Ratification
The impact of CDP participation with a shock to the external business environment is our most striking finding. Upon Russia’s Kyoto ratification, firms’ participation in the CDP increased stock prices in a significant and sustained fashion (if the firms were in GHG-intensive industries in the U.S. or other countries that had not yet ratified the Kyoto Protocol). This suggests that for these firms, Russia’s official ratification of the Kyoto Protocol signaled a shift in the likelihood of future climate change regulation. Under this circumstance, CDP participants appeared to be viewed as better prepared for the exogenous change.
We estimate the total increase in shareholder value upon Russia’s Ratification for CDP participants in GHG emitting industries located in the U.S. and other countries that had not ratified Kyoto. To obtain the most conservative estimate, we focus on the smallest coefficient obtained in Table 8, which was .0116. The total value created for this set of firms, relative to the rest of the market, is about $8.6 billion. This number is calculated as 0.0116 × $43,705.49 million× 17, where $43.7 billion is the mean market cap for our sample firms in countries that had not ratified Kyoto, and 17 is the number of firms in GHG emitting industries located in countries that had not ratified Kyoto.32 This is about 86% of the size of the carbon market in 2005.33 This is a surprisingly large value, and indicates that the informational content of disclosure can be extremely important during periods when markets are exposed to exogenous shocks. Indeed, as noted earlier in this section, the direct impacts of disclosure were insignificant; our results suggest it is only the indirect impacts that accrue during shocks that produce value to investors.
These findings can be understood within the theory of corporate governance offered by Tirole (2001), who shows how passive monitoring of firm performance, i.e., monitoring without interfering with management, might increase the rate of return for investors. The basic idea is that stock prices are affected by various events beyond a manager’s control, so there may exist a signal that provides more accurate information about managerial performance than does the firm’s stock price. Acquiring the signal allows investors to increase the “pledgeable income” from the firm, that is, the residual available to investors after the manager’s incentive compatibility constraint has been satisfied. From this perspective, the CDP allowed investors to exercise better control over managers who may have been shirking their duty to prepare for the risks of climate change.
32 The market capitalization data is from Datastream. It is used with the permission of Wharton Research Data Services. 33 State and Trends of the Carbon Market 2006, The World Bank, 2006.
21
Kim and Lyon: The Carbon Disclosure Project and Shareholder Value
Published by The Berkeley Electronic Press, 2011

Table 8. Russia’s Ratification of the Kyoto Protocol
5-day Window
3-day Window
2-day Window
3-day Window
VARIABLES CAR(-2,2) CAR(-1,1) CAR(0,1) CAR(0,2)
Employee -1.89E-05 -1.68E-05 -9.91E-06 -3.69E-06
(1.51E-05) (1.31E-05) (1.09E-05) (1.34E-05)
Revenue -3.72E-10 1.74e-09** 1.69e-09*** 5.87E-10
(6.24E-10) (6.83E-10) (5.36E-10) (4.82E-10)
GHG Industry 0.0138 0.00618 0.0102 0.00565
(0.0113) (0.00858) (0.00629) (0.00848)
CDP2 participation -0.00441 -0.00123 -0.00438 -0.0115*
(0.00666) (0.00469) (0.00416) (0.00587)
Non-Kyoto 0.0125*** -0.00602 -0.00738*** 0.00433
(0.00438) (0.00388) (0.00282) (0.00313)
CDP2×GHG Industry -3.85E-05 0.00699 -0.00262 0.00104
(0.0125) (0.00934) (0.00698) (0.00922)
CDP2×GHG×Non-Kyoto 0.0168** 0.0116** 0.0150*** 0.0164**
(0.00774) (0.00576) (0.00493) (0.00676)
Constant 0.00146 -0.0116** -0.00930** 0.00474
(0.00688) (0.0048) (0.00439) (0.00622)
Observations 250 250 250 250
R-squared 0.107 0.1 0.119 0.076
F 11.39 11.22 10.38 4.977
Robust standard errors in parentheses
*** p<0.01, ** p<0.05, * p<0.1 7. Conclusions
In this paper, we have studied when institutional investor activism towards climate change might increase shareholder value, making use of data from the Carbon Disclosure Project. We have three main findings. First, we find no systematic evidence that CDP participation, in and of itself, directly increased share prices. This suggests that participation was not entirely voluntary, but was the result of pressure from shareholders, regulators, and the institutional investors involved in the CDP. Second, we find that CDP participants were treated better by investors when exogenous events caused the likelihood of climate change regulation to rise. We identify this effect using Russia’s ratification of the Kyoto Protocol on October 22, 2004, which caused the Protocol to go into effect in all
22
The B.E. Journal of Economic Analysis & Policy, Vol. 11 [2011], Iss. 1 (Contributions), Art. 50
http://www.bepress.com/bejeap/vol11/iss1/art50

the nations that had ratified it. Our results imply that Russia’s ratification increased the pressure on the U.S. (and other countries that had not yet ratified Kyoto) to take action on climate change. Accordingly, firms in such countries saw the probability of a regulatory response to climate change rise. Investors apparently viewed CDP participants as better prepared to cope with climate regulations, and rewarded them with better financial results. Third, we use our regression coefficients to estimate the total value created by the CDP’s information disclosures at $8.6 billion, about 86% of the size of the carbon market in 2005.
Our findings demonstrate that institutional investor activism toward climate change can increase shareholder value when the external business environment becomes more climate conscious. This effect is particularly notable since the activism we study was passive in nature and did not involve any interference in managerial decisions.
Appendix: Sample CDP Responses
As described in footnote 5, the CDP poses 10 essay questions to firms, in addition to asking them for data on carbon emissions. Firms classified as being in greenhouse-gas intensive industries typically provide longer and more detailed answers. For example, below are the answers to CDP question 2 given by ABB Limited (not classified as greenhouse-gas intensive) and American Electric Power (greenhouse-gas intensive), respectively. 2) Regulation: What are the financial and strategic impacts on your company of existing regulation and proposed future regulation? ABB Limited: “As our type of industry is not covered by the European Trading Scheme (ETS), the direct financial impact on ABB is limited. We develop and put on the market energy efficient products and systems and therefore see the ETS (and other similar schemes) as strategically important for us (e.g. components for wind power, HVDC power lines, drives etc.).” American Electric Power: “GHG emissions are not currently regulated in the US, the only country in which AEP operates. However, there could be risks to the company in how governments respond to the threat of climate change. The risk would depend upon the speed and depth of emissions reductions and the diversity of government-allowed compliance measures. Some public policy responses, such as those that force the premature retirement of existing capital stock, could be quite punitive and damaging to the company. A more measured, flexible
23
Kim and Lyon: The Carbon Disclosure Project and Shareholder Value
Published by The Berkeley Electronic Press, 2011

response would recognize it is a global problem that can only be effectively addressed over a century timeframe through the development and global deployment of revolutionary new generating technologies that are much more efficient and less carbon intensive than the current energy technologies. This approach would not only avoid costly and unjustified mitigation policies, but also provide companies like AEP with an opportunity to profit from the technology development and diffusion effort.
AEP’s strategic response to these potential future opportunities and risks has been to actively prepare for the possibility of mandatory GHG emission reductions. We are doing so by analyzing the impacts of GHG emission reduction regimes and various strategic responses we may take to achieve the reduction targets on specified timetables.
AEP has prepared a report entitled, “An Assessment of AEP’s Actions to Mitigate the Economic Impacts of Emissions Policies”, available at www.AEP.com/Environmental . This assessment was conducted at the request of a group of shareholders who requested an evaluation of the actions that American Electric Power is taking to mitigate the economic impact of increasing regulatory requirements, competitive pressures, and public expectations to significantly reduce carbon dioxide and other emissions.
A subcommittee of independent directors of the Policy Committee of the AEP Board of Directors prepared this report in response to this shareholder proposal. This subcommittee evaluated the actions the company has taken and is taking to address emissions of carbon dioxide and other air emissions; assessed the technologies available to the company for reducing these emissions; and reviewed analyses of the costs of several control scenarios.
The Board of Directors affirmed that the subcommittee’s assessment of AEP’s actions over the last decade constitute a solid foundation for the company’s future efforts to address the intersection between environmental policy and business opportunities. The assessment identifies the central challenge the company faces as being that of making decisions about large investments in long-lived assets in a setting of uncertain public policy and rapidly evolving technology. The authors conclude by recommending forceful and serious advocacy of public policies supporting highly efficient control programs; proactive leadership in technology development and operation; discipline in capital allocation decisions; openness to partnerships in technology and policy; and continued transparency of action as being essential elements of the path ahead for AEP.”
24
The B.E. Journal of Economic Analysis & Policy, Vol. 11 [2011], Iss. 1 (Contributions), Art. 50
http://www.bepress.com/bejeap/vol11/iss1/art50

Barber, B. M., “Monitoring the Monitor: Evaluating CalPERS’Activism,” working paper, Graduate School of Management, University of California at Davis, (2006).
Beatty, T. and Shimshack, J. P., “The Impact of Climate Change Information: New Evidence from the Stock Market,” The B.E. Journal of Economic Analysis & Policy: Vol. 10: Iss. 1 (Contributions), Article 105, (2010).
Bernard, V. L., “Cross-Sectional Dependence and Problems in Inference in Market-Based Accounting Research,” Journal of Accounting Research, 25, 1-48 (1987).
Bernstein, S., “International Institutions and the Framing of Domestic Policies: The Kyoto Protocol and Canada’s Response to Climate Change,” Policy Sciences, 35, 203-236 (2002).
Blacconiere, W. G. and Patten, D. M., “Environmental Disclosures, Regulatory Costs, and Changes in Firm Value,” Journal of Accounting and Economics, 18, 357-377 (1994).
Blacconiere, W. G. and Northcut, W. D., “Environmental Information and Market Reactions to Environmental Legislation,” Journal of Accounting, Auditing and Finance, 12, 149-178 (1997).
Bowen, R. M., Castanias, R. P. and Daley, L. A., “Intra-Industry Effects of the Accident at Three Mile Island,” Journal of Financial and Quantitative Analysis, 18, 87-111 (1983).
Burtraw, D. and Palmer, K., “Compensation Rules for Climate Policy in the Electricity Sector,” Journal of Policy Analysis and Management, 27, 819–847 (2008).
Clarkson, P. M. Li, Y., Richardson, G. D., and Vasvari, F. P., “Revisiting the Relation Between Environmental Performance and Environmental Disclosure: An Empirical Analysis,” Accounting, Organizations and Society, 33, 303-327 (2008).
Collins, D. W. and Dent, W. T., “A Comparison of Alternative Testing Methodologies Used in Capital Market Research,” Journal of Accounting Research, 22, 48-84 (1984).
Cortell, A. P. and Davis, J. W., “How Do International Institutions Matter? The Domestic Impact of International Rules and Norms,” International Studies Quarterly, 40, 451-478 (1996).
Cowan, A. R., Eventus 8.0 User’s Guide, Standard Edition 1.0 (2006). Delmas, M., Montes-Sancho, M., and Shimshack, J., “Mandatory Information
Disclosure in the Electricity Industry,” Economic Inquiry 48, 483-498 (2010).
References
25
Kim and Lyon: The Carbon Disclosure Project and Shareholder Value
Published by The Berkeley Electronic Press, 2011

Fama, E. F. and French, K. R., “The Cross-Section of Expected Stock Returns,” Journal of Finance, 47, 427-465 (1992).
Financial Times, “Russia to Ratify Kyoto in Weeks,” September 30, (2004). Financial Times. “Kyoto Survives: But Don't Break Out the Champagne on
Climate Change,” October 1, p. 20 (2004). Freedman, M. and Patten, D. M., “Evidence on the Pernicious Effect of Financial
Report Environmental Disclosure,” Accounting Forum, 28, 27-41 (2004). Gupta, S. and Goldar, B., “Do stock markets penalize environment-unfriendly
behavior? Evidence from India,” Ecological Economics, 52, 81–95 (2005). Hamilton, J. T., “Pollution as News: Media and Stock Market Reactions to the
Toxics Release Inventory Data,” Journal of Environmental Economics and Management, 28, 98-113 (1995).
Henry, L. A. and Sundstrom, L. M., “Russia and the Kyoto Protocol: Seeking an Alignment of Interests and Image,” Global Environmental Politics, 7, 47-69. (2007).
Hill, J. and Schneeweis, T., “The Effect of Three Mile Island on Electric Utility Stock Prices: A Note,” Journal of Finance, 38, 1285-1292 (1983).
Joskow, P., and Schmalensee, R., “The Political Economy of Market-Based Environmental Policy: The US Acid Rain Program,” Journal of Law and Economics, 41, 81-135 (1998).
Keohane, R. O., Hass, P. M., and Levy, M. A., “The Effectiveness of International Environmental Institutions,” in P. M. Hass, R. O. Keohane and M. A. Levy, eds., Institutions for the Earth, The MIT Press, Cambridge & London (1993).
Khanna, M., Quimio, W.R.H. and Bojilova, D., “Toxic Release Information: A Policy Tool for Environmental Protection,” Journal of Environmental Economics and Management, 36, 243-266 (1998).
Kim, E-H and Lyon, T.P., “Strategic Environmental Disclosure: Evidence from the DOE’s Voluntary Greenhouse Gas Registry,” Journal of Environmental Economics and Management, 61(3), 311-326 (2011).
King, A. and Lenox, M., “Does it Really Pay to be Green?,” Journal of Industrial Ecology, 5, 105-116 (2001).
Konar, S. and Cohen, M. A., “Information as Regulation: The Effect of Community Right to Know Laws on Toxic Emissions,” Journal of Environmental Economics and Management, 32, 109-124 (1997).
Kothari, S. P. and Warner, J. B., “Econometrics of Event studies,” in B. Espen Eckbo, Ed., Handbook of Empirical Corporate Finance, Elsevier-North-Holland (2006).
European Environmental Agency, Application of the emissions trading directive by EU Member States, EEA Technical Report, Copenhagen, Denmark (2006).
26
The B.E. Journal of Economic Analysis & Policy, Vol. 11 [2011], Iss. 1 (Contributions), Art. 50
http://www.bepress.com/bejeap/vol11/iss1/art50

Margolis, J. D. and Walsh, J. P., “Misery Loves Companies: Rethinking Social Initiatives by Business,” Administrative Science Quarterly, 48, 268-305 (2003).
Martin, L. L. and Simmons, B. A., “Theories and Empirical Studies of International Institutions,” International Organization, 52, 729-757 (1998).
Milgrom, P., "Good News and Bad News: Representation Theorems and Applications," The Bell Journal of Economics, 12, 380–91 (1981).
New York Times, “Warnings on Warming,” September 29, 2004. Patell, J. M., “Corporate Forecasts of Earnings Per Share and Stock Price
Behavior: Empirical Test,” Journal of Accounting Research, 14, 246-276 (1976).
Patten, D. M., “Exposure, Legitimacy, and Social Disclosure,” Journal of Accounting and Public Policy, 10, 297-308 (1991).
Patten, D. M., “The Relation between Environmental Performance and Environmental Disclosure: A Research Note,” Accounting, Organizations, and Society, 27, 763-773 (2002).
Patten, D. M. and Nance, J. R., “Regulatory Cost Effects in a Good News Environment: The Intra-industry Reaction to the Alaskan Oil Spill,” Journal of Accounting and Public Policy, 17, 409-429 (1998).
Shin, H. S., “Disclosures and Asset Returns,” Econometrica, 71, 105-133 (2003). Sijm, J., Neuhoff, K. and Chen, Y., “CO2 cost pass-through and windfall profits
in the power sector,” Climate Policy, 6, 49-72 (2006). Simmons, B. A. and Hopkins, D. J., “The Constraining Power of International
Treaties: Theory and Methods,” American Political Science Review, 99, 623-631 (2005).
Sinclair-Desgagne, B., and Gozlan, E., “A Theory of Environmental Risk Disclosure,” Journal of Environmental Economics and Management, 45, 377-393 (2003).
Tirole, J., “Corporate Governance,” Econometrica, 69, 1-35 (2001). Verrecchia, R. E., “Discretionary Disclosure,” Journal of Accounting and
Economics, 5, 179-194 (1983). Verrecchia, R. E., “Essays on Disclosure,” Journal of Accounting and Economics,
32, 97-180 (2001). Wall Street Journal, “Moving the Market: Investors Urge Large Companies to
Disclose Data on Emissions,” February 2 (2005). Wall Street Journal, “As Kyoto Protocol Comes Alive, So Do Pollution-Permit
Markets --- Funds Handling Trades For Emissions Credits Gain While Russia Sets Pact,” November 8 (2004).
MacKinlay, A. C., “Event Studies in Economics and Finance,” Journal of Economic Literature, 35, 13-39 (1997).
27
Kim and Lyon: The Carbon Disclosure Project and Shareholder Value
Published by The Berkeley Electronic Press, 2011