whole-basin, mass-balance approach for identifying...
TRANSCRIPT

ORIGINAL PAPER
Whole-basin, mass-balance approach for identifying criticalphosphorus-loading thresholds in shallow lakes
William F. Kenney • Thomas J. Whitmore •
David G. Buck • Mark Brenner • Jason H. Curtis •
Jian J. Di • Patricia L. Kenney • Claire L. Schelske
Received: 7 February 2013 / Accepted: 11 February 2014
� Springer Science+Business Media Dordrecht 2014
Abstract Lake Lochloosa, Florida (USA) recently
underwent a shift from macrophyte to phytoplankton
dominance, offering us the opportunity to use a
whole-basin, mass-balance approach to investigate
the influence of phosphorus loading on ecosystem
change in a shallow, sub-tropical lake. We analyzed
total phosphorus (TP) sedimentation in the basin to
improve our understanding of the forcing factor
responsible for the recent shift to phytoplankton
dominance. We measured 210Pb activity, organic
matter (OM), organic carbon (OC) and TP in short
sediment cores from 20 locations to develop a
comprehensive, whole-basin estimate of recent mass
sedimentation rates (MSR) for bulk sediment, OM,
OC and TP. The whole-basin sedimentation models
provided insights into historic lake processes that
were not evident from the limited, historic water
quality data. We used Akaike’s Information Criteria
to differentiate statistically between constant MSR
and exponentially increasing MSR. An eightfold,
exponential increase in TP accumulation over the
past century provided evidence for the critical role of
increased P loading as a forcing factor in the recent
shift to phytoplankton dominance. Model results
show increased TP retention and decreased TP
residence time were in-lake responses to increased
TP loading and the shift from macrophyte to
phytoplankton dominance in Lake Lochloosa. Com-
parison of TP loading with TP retention and historic,
diatom-inferred limnetic TP concentrations identified
the TP loading threshold that was exceeded to trigger
the shift to phytoplankton dominance.
Keywords Phosphorus sedimentation �Phosphorus loading � Phosporus retention �Phosphorus residence time � Shallow lakes �Alternative stable states � Phytoplankton
dominance � Phosphorus loading threshold
W. F. Kenney (&) � M. Brenner
Land Use and Environmental Change Institute, University
of Florida, Gainesville, FL 32611, USA
e-mail: [email protected]
T. J. Whitmore
Department of Biological Sciences, University of South
Florida St. Petersburg, St. Petersburg, FL, USA
D. G. Buck
Biodiversity Research Institute, 652 Main Street, Gorham,
ME 04038, USA
M. Brenner � J. H. Curtis � C. L. Schelske
Department of Geological Sciences, University of Florida,
Gainesville, FL 32611, USA
J. J. Di
St. Johns River Water Management District, 4049 Reid
Street, PO Box 1429, Palatka, FL 32178, USA
P. L. Kenney
Department of History, University of North Florida,
Jacksonville, FL 32224, USA
123
J Paleolimnol
DOI 10.1007/s10933-014-9771-9
Introduction
In the past 20 years, numerous limnological and
paleolimnological studies have focused on the struc-
ture, function and environmental history of shallow
lakes. Shallow lakes represent a majority of lakes
globally (Downing et al. 2006) and predominate in
Florida, USA. The alternative stable states model
(Scheffer et al. 1993) describes the functioning of
shallow lakes as a contrast between periods of lesser
external phosphorus (P) loading when macrophytes
dominate and periods of increased external P loading
that result in a shift to phytoplankton dominance.
Numerous modern examples of phytoplankton-dom-
inated (Jeppesen et al. 2003) and macrophyte-domi-
nated shallow lakes (Zimmer et al. 2009) exist, and
historic shifts between these stable states are evident
from sediment core data (Kenney et al. 2002; Sayer
et al. 2010).
We collected multiple sediment cores and applied
a whole-basin, mass-balance approach (Engstrom
and Rose 2013) to shallow, sub-tropical Lake
Lochloosa, Florida, USA (Fig. 1) to gain insights
into factors that drove a recent increase in phyto-
plankton abundance and a decrease in macrophyte
coverage in the lake. From 1980 to 2009, Chl
a concentrations increased from 25 to 92 lg L-1
(Huber et al. 1982; Florida Lakewatch 2009). At the
same time, areal and volumetric macrophyte cover-
age decreased dramatically (Lakewatch 2004). A
recent study showed surface sediments (0–4 cm) in
Lake Lochloosa had 1.5 mg g-1 total P (TP),
roughly double the concentrations found in deeper
sediments (Brenner et al. 2009). We suspected that
comprehensive analysis of TP sedimentation rates in
the lake could improve our understanding about the
forcing factor(s) responsible for the recent change in
the primary producer community in this shallow
lake.
Because of the potential for wind-induced mixing
of deposits in shallow lakes, the ability of sediments in
such water bodies to preserve an accurate record of
past environmental conditions has been questioned
(Schottler and Engstrom 2006; Engstrom et al. 2006).
In a recent study of shallow lakes in Florida, 210Pb-
dated cores revealed orderly deposition of sediments
over the past 100 years (Kenney et al. 2010). Heggen
et al. (2012) suggested that study of a single core might
be sufficient to evaluate microfossil sedimentation in
small lakes, whereas Rippey et al. (2008) concluded
that five to ten cores are needed to estimate whole-
basin sediment accumulation. Because wind-stressed
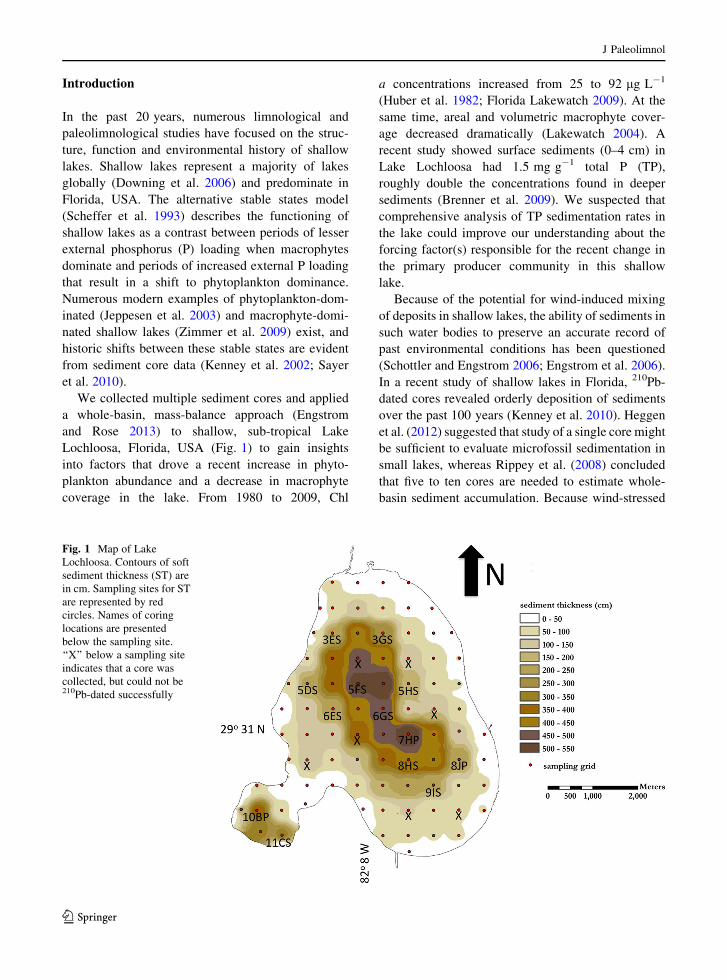
Fig. 1 Map of Lake
Lochloosa. Contours of soft
sediment thickness (ST) are
in cm. Sampling sites for ST
are represented by red
circles. Names of coring
locations are presented
below the sampling site.
‘‘X’’ below a sampling site
indicates that a core was
collected, but could not be210Pb-dated successfully
J Paleolimnol
123

shallow lakes of Florida can display highly variable
sediment distribution (Whitmore et al. 1996a), we
attempted to 210Pb-date sediment cores from 20
locations in Lake Lochloosa, with the goal of
estimating recent, whole-basin accumulation for bulk
sediment, organic matter (OM), organic carbon (OC)
and TP. We hypothesized that P loading and the TP
sedimentation rate (TP-MSR) increased over the past
century, and that a whole-basin mass-balance assess-
ment would reveal the TP loading threshold was
exceeded, which triggered the shift to phytoplankton
dominance.
Site description
Lake Lochloosa is a relatively large (*22.9 km2),
shallow (zmax = *3 m) water body in north central
Florida, USA (29�3103800N, 82�802600W, Fig. 1) (Flor-
ida Lakewatch 1996). The water body has no significant
overland inflows, but water leaves the lake via Cross
Creek and flows southwest into Orange Lake. European
settlement in the area began after 1880, following
completion of a railroad that connected the Florida
cities of Jacksonville and Tampa (Glisson 1993). Early
reports indicated that macrophyte coverage limited
seine-haul fishing to 10 small areas (\2 ha) of the lake
(Glisson 1993). Recent limnological data show that the
lake is eutrophic. For samples collected between 1993
and 2009, mean values for measured water quality
variables were: total phosphorus = 68 lg L-1, total
nitrogen = 2,234 lg L-1, Chl a = 92 lg L-1, and
Secchi disk depth = 55 cm) (Florida Lakewatch
2009). In the early 1980s, Huber et al. (1982) reported
mean nutrient concentrations in Lake Lochloosa
(TP = 53.8 lg L-1, TN = 1,902 lg L-1) that were
similar to current concentrations, but a lower mean Chl
a value (24.5 lg L-1) and greater Secchi disk depth
(82 cm) (Florida Lakewatch 2009). Currently the lake
is phytoplankton-dominated. Between 1991 and 2003,
the area covered by aquatic vegetation decreased from
70 to 6 %, with a corresponding decrease in percent
volume filled with macrophytes, from 22 to 0.7 %
(Lakewatch 2004). These observations are consistent
with sediment core data that showed recent sediments
had lower OC to total nitrogen ratios than deeper
sediments (Brenner et al. 2009). These data indicate
increased phytoplankton productivity relative to mac-
rophytes in the last 30 years.
Materials and methods
We measured water depth and soft sediment thickness
(ST) at 85 locations that were evenly spaced through-
out the lake to approximate equal-area representation.
We measured water depth by lowering a submersible
camera to the sediment/water interface and recording
the length of cable deployed. We forced rigid, marked
metal rods into the sediment to an impenetrable contact
and recorded the depth from the water surface. Soft ST
was estimated as the difference between the depth to
the impenetrable contact and the water depth. We used
the ST data to identify 20 coring locations where there
had been sufficient sediment accumulation to likely
yield reliable 210Pb chronologies (Fig. 1).
Twenty sediment/water interface cores were col-
lected with a piston corer (Fisher et al. 1992). Cores
were extruded vertically and sectioned at 4-cm
intervals in the field. Samples were stored in low-
density polyethylene cups in ice chests for transport to
the laboratory. Sediment sections were frozen, freeze-
dried and ground to a fine powder in the laboratory
before analyses. OM content was determined by
weight loss on ignition (LOI) after combustion at
550 �C for 2 h. Organic C was measured with a Carlo
Erba NA1500 CNS elemental analyzer (Verardo et al.
1990). TP was measured according to Schelske et al.
(1986). Sediment bulk density (g dry cm-3 wet) was
determined from the proportion of dry matter in wet
sediment and proportions of inorganic and OM in dry
sediment, using the equation of Binford (1990).
Because they are used in the estimation of past P
export from the lake, historic limnetic TP concentra-
tions are a critical component to the whole-basin,
mass-balance approach (Engstrom and Rose 2013).
We assessed historic limnetic TP concentrations with
a diatom-based transfer function. To obtain diatom-
based, historic limnetic total P inferences (DI-TP), we
used a previously compiled calibration data set
(Riedinger-Whitmore et al. 2005). Exploratory anal-
yses were performed using CANOCO version 4.5 (ter
Braak and Smilauer 2002). Analyses were performed
on 144 species that represented at least 3 % of the
assemblage in one sample. Using square-root-trans-
formed species percentages, DCA showed a first-axis
gradient length of 4.4, justifying modal methods for
the transfer function. Past DI-TP values for core LOO-
8JP were obtained by weighted averaging with
classical de-shrinking in C2 (Juggins 2007),
J Paleolimnol
123
(r2 = 0.89, RMSE = 0.173 for log10TP, n = 73
P-limited lakes).
Sediment cores were dated by 210Pb. Radiometric
measurements (210Pb and 226Ra) were made using low-
background gamma counting with well-type intrinsic
germanium detectors (Appleby et al. 1986; Schelske
et al. 1994). Sediment ages were calculated using the
constant rate of supply (CRS) model (Appleby and
Oldield 1983; Oldfield and Appleby 1984). Age errors
were propagated using first-order approximations and
calculated according to Binford (1990).
To obtain continuous output from age-depth chro-
nologies, we modeled Bulk-MSR, OM-MSR, OC-
MSR and TP-MSR using 210Pb dates from cores with
reliable chronologies and a calculated date of 1900 or
older. The benefit of modeling MSR as a function of
sediment age was that it provided continuous data that
could be summed across cores, each year, to estimate
whole-basin sedimentation from 1900 to 2006. For
each core, we compared an exponential model
(MSR = e(aDate ? b), k = 2) to a constant-sedimenta-
tion-rate model (MSR = C, k = 1) using a log-like-
lihood approach and Akaike’s Information Criteria
(AIC) analysis (Brett and Benjamin 2008; Akaike
1974). Parameters (k) for the exponential model and
the constant-sedimentation-rate model were deter-
mined by optimizing the sum of the log-likelihood
(LL) for each model with the Solver function
of Microsoft Excel. We used the metric DAIC
that combines the cumulative likelihood and
number of parameters to evaluate the competing
models, where DAIC = (2kConstant-2LLConstant) -
(2kExponential-2LLExponential). To be conservative, we
accepted the constant-sedimentation-rate model for
cores with DAIC B 14. If DAIC [ 14, we accepted the
exponential model. Whole-basin sedimentation mod-
els were constructed by summation of model year
output for each 210Pb-dated core (n = 13) and the error
terms for each year of the lake-wide models were
calculated as
ryear;whole�basin ¼ffiffiffiffiffiffiffiffiffiffiffiffiffiffiffiffiffiffiffiffiffiffiffiffiffiffiffiffiffiffiffiffiffiffiffiffiffiffiffiffiffi
ðn� 1Þðryear;13 coresÞ2q
Results
We established reliable chronologies, with dates of
1900 or older, for 13 of the 20 cores we attempted to
date using 210Pb (Fig. 2). All 13 cores with reliable
chronologies were collected at locations with at least
1.85 m of ST, but two cores collected at locations with
C1.85 m of ST could not be dated reliably. Thus, we
established reliable 210Pb chronologies for 86.7 % of
the 15 cores collected from locations with at least
1.85 m of ST. In the lake-wide study of ST, 28 of 84
locations (33.3 %) had ST [ 1.85 m. From these data
we deduced that the 13 cores with reliable chronol-
ogies represented 28.9 % or 6.62 km2 of the lake
bottom. This area contains *55 % of the soft
sediment volume. Because we did not determine
complete density profiles for every location, we could
not calculate the proportion of sediment mass repre-
sented by these 210Pb-datable locations. Given the
expected sediment compaction in deeper deposits
from locations with greater ST, however, we assume
this area represents much more than 55 % of the total
soft sediment mass.
For Lake Lochloosa, the whole-basin models
indicate that Bulk-MSR, OM-MSR, OC-MSR and
TP-MSR increased exponentially from 1900 to 2006
(Fig. 3). Estimates for modern (2006) sedimentation
rates were at least four times greater than estimates for
historic sedimentation rates ca. 1900. MSR and OC-
MSR increased *fourfold from 1900 to 2006, OM-
MSR increased *fivefold over the same period and
TP-MSR increased *eightfold over the 210Pb-datable
portion of the cores.
Scaling the whole-basin sedimentation models to
the area represented by the datable cores (6.62 km2)
yielded annual whole-basin sedimentation estimates
with 95 % confidence intervals for each year from
1900 to 2006. Bulk sedimentation increased exponen-
tially from 610 ± 190 MT a-1 in 1900 to 2,400 ± 765
MT a-1 in 2006. OM sedimentation increased expo-
nentially from 280 ± 124 MT a-1 in 1900 to
1,500 ± 516 MT a-1 in 2006. OC sedimentation
increased exponentially from 170 ± 57 MT a-1 in
1900 to 720 ± 263 MT a-1. Total phosphorus sedi-
mentation increased exponentially from 0.50 ± 0.20
MT a-1 in 1900 to 4.1 ± 1.3 MT a-1 in 2006.
Of the 52 location-specific MSR models (i.e. 13
locations 9 4 variables), the constant MSR model
was most parsimonious (i.e. DAIC B 14) for only
eight models at four locations. Somewhat random
observed sedimentation resulted in the constant MSR
models being the most parsimonious at these locations
(e.g. 8JP, Fig. 4). At location 8JP, constant sedimen-
tation over time was most parsimonious for all four
J Paleolimnol
123

variables (Bulk-MSR, OM-MSR, OC-MSR and TP-
MSR). At location 9IS, constant sedimentation over
time was most parsimonious for Bulk-MSR and OC-
MSR. At location 8HS, the constant-sedimentation-
rate model was most parsimonious for OC-MSR. At
location 11CS, the constant-sedimentation-rate model
was most parsimonious for OM-MSR. In all other
location-specific MSR models, the exponential mod-
els were most parsimonious (e.g. 3ES, Fig. 5). The
location-specific TP-MSR models for only two cores,
5FS and 7HP, closely resemble the 13-core average,
but even these cores fall outside the 95 % confidence
interval of the 13-core average (Fig. 6). More often,
individual location-specific models (e.g. 6GS and 9IS)
fall far outside the 95 % confidence interval of the
13-core average.
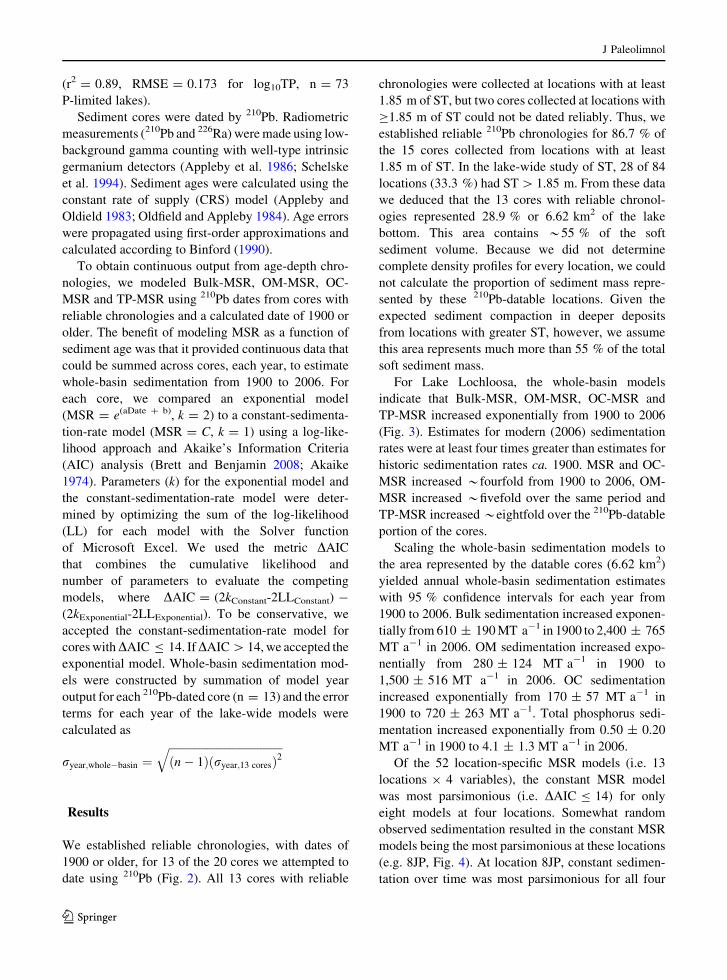
For the whole-basin models (Bulk, OM, OC, TP),
observed and predicted MSR were significantly corre-
lated (Figs. 7, p \ 0.0001, n = 182). A few outlier
samples in each model have strong influence on whole-
basin model performance as measured by R2
(R2 = 0.25–0.36). Removing only nine outliers
Fig. 2 210Pb (thick line) and 226Ra (thin line) activities (dpm g-1) plotted against depth (cm) for the 13 study cores. Samples represent
4-cm core intervals
J Paleolimnol
123

(\5 %) from each model improved model performance,
as measured by R2, substantially (n = 173, R2 =
0.7–0.8). This comparison demonstrates the influence
of outliers on R2, identifies a shortcoming of the use of R2
for parameter optimization or model selection, and
reinforces the superiority of the LL approach for
parameter optimization and AIC analysis for model
selection.
Diatom-based limnetic total P inferences
RDA with forward selection showed three signifi-
cant environmental variables, and these had signif-
icant correlation with the first ordination axis:
log10TP (r = 0.85), pH (r = 0.61), and specific
conductance (r = 0.51). The ratio of the eigenvalue
of the first axis (k1) of an RDA constrained only by
Fig. 3 Whole-basin
sedimentation models for
bulk mass sedimentation
rate (Bulk-MSR), organic
matter, organic carbon and
total phosphorus. The mean
(dark line) and 95 %
confidence intervals (thin
lines) are plotted against210Pb-modeled dates
Fig. 4 Bulk sediment, organic matter (OM), organic carbon (OC) and total phosphorus (TP) mass sedimentation models for site 8JP.
Measured data (closed circles) and modeled data (dark line) are plotted against 210Pb-modeled dates
J Paleolimnol
123

log10TP to the eigenvalue of the first unconstrained
axis (k2) was 0.70, indicating that factors other than
log10TP can strongly influence diatom variation
across this training set. k2/k2 with pH as the only
constraining variable was 0.42, demonstrating
weaker influence.
We were conscious of the need to avoid applying a
DI-TP model with undue influence from secondary
variables (Juggins 2013; Juggins et al. 2013). Despite
apparent potential for pH and specific conductance to
influence TP reconstructions using this calibration set,
we believe that DI-TP inferences for Lake Lochloosa
are reasonably reliable for the following reasons.
Water quality varies widely in the calibration set
because of diverse geological conditions, but water-
quality variation in Lake Lochloosa is substantially
narrower. Summary autecological data for diatom
assemblages in the LOO-8JP core showed that pH and
salinity were largely unchanged over time, but hype-
reutrophic diatoms increased (Fig. 8a–c), which
Fig. 5 Bulk sediment, organic matter (OM), organic carbon (OC) and total phosphorus (TP) mass sedimentation models for site 3ES.
Measured data (closed circles) and modeled data (dark line) are plotted against 210Pb-modeled dates
Fig. 6 Location-specific TP-MSR models plotted against the
13-core average TP-MSR model. The 13-core average TP-MSR
model (thick line), 95 % confidence intervals (dotted lines) and
location-specific TP-MSR models (open diamonds) are plotted
against 210Pb-modeled dates
J Paleolimnol
123
supports increased DI-TP inferences. Baseline infer-
ences of *40 lg L-1 TP are consistent with modern
conditions in relatively undisturbed lakes in the
vicinity (median = 40 lg L-1; Griffith et al. 1997),
and with the mean baseline value of 42.9 lg L-1
obtained from our paleolimnological studies of seven
Fig. 7 Comparisons of observed and predicted mass sedimen-
tation rates (MSR) for the four whole-basin models. Observed
and predicted total phosphorus (TP)-MSR were significantly
correlated (p \ 0.0001, R2 = 0.36, n = 182). When only 9
outliers were removed, R2 for observed and predicted TP-MSR
improved considerably (R2 = 0.81, n = 173). Observed and
predicted bulk sediment-MSR were significantly correlated
(p \ 0.0001, R2 = 0.25, n = 182). When 9 outliers were
removed, R2 for observed and predicted bulk sediment-MSR
improved considerably (R2 = 0.70, n = 173). Observed and
predicted organic matter (OM)-MSR were significantly corre-
lated (p \ 0.0001, R2 = 0.28, n = 182). When 9 outliers were
removed, R2 for observed and predicted OM-MSR improved
considerably (R2 = 0.71, n = 173). Observed and predicted
organic carbon (OC)-MSR were significantly correlated
(p \ 0.0001, R2 = 0.30, n = 182). When 9 outliers were
removed, R2 for observed and predicted OC-MSR improved
considerably (R2 = 0.72, n = 173)
J Paleolimnol
123

other nearby lakes (unpublished data). The modern
inference of 67.2 lg L-1 is consistent with the mean
measured limnetic TP value of 67.4 lg L-1 reported
near the time of our study, and with the overall mean of
67.6 lg L-1 for the period from 1993 to 2011 (Florida
Lakewatch 2013).
Diatom-based limnetic TP inferences for core
LOO-8JP (Fig. 8d) indicated recent P enrichment of
the water column. Baseline, diatom-inferred TP values
in Lake Lochloosa were in the low range of eutrophic
conditions (*40 lg L-1). Limnetic TP inferences
were stable until the mid-twentieth century, but
increased after the 1950s, up to *70 lg L-1 at the
time of our study.
Discussion
The whole-basin sedimentation model provided
insights into historic lake functioning that were not
evident from limited, archived water quality data. This
is clear in the comparison of historic limnetic TP and
TP-MSR. Although water-column TP shows little
change over the past 35 years, TP-MSR increased
eightfold from 1900 to 2006. This eightfold, expo-
nential increase in TP-MSR over the past century
provides evidence for the role of increased P loading in
the recent shift to phytoplankton dominance in Lake
Lochloosa. The exponential increases in OM-MSR
and OC-MSR are also indicative of increased primary
Fig. 8 Summary autecological data and limnetic total P
inferences for diatom assemblages in core LOO-8JP. Auteco-
logical preference percentages were calculated following
methods presented in Whitmore et al. (1996b). a Salinity
preferences of diatoms. b pH preferences. c Trophic-state
preferences. d Diatom-inferred limnetic total p values
J Paleolimnol
123

production associated with the recent shift to phyto-
plankton dominance.
A trend of exponentially increasing TP-MSR was
evident in 12 of the 13 cores in this study. Comparing
TP-MSR from individual cores to the 13-core average
TP-MSR, it is apparent that analysis of only one or a
few cores in Lake Lochloosa would yield misleading
results for whole-basin MSR (Fig. 6). This study thus
validates the additional effort necessary to carry out an
investigation of multiple cores for whole-basin sedi-
mentation analysis (Rippey et al. 2008). Only two
cores, 5FS and 7HP, closely resemble the 13-core
average, but even these cores fall outside the 95 %
confidence interval of the 13-core average. More
often, individual cores (e.g. 6GS and 9IS) fall far
outside the 95 % confidence interval of the 13-core
average. For instance, core 8HS accurately estimated
modern sedimentation, but yielded an over-estimate of
the relative increase in TP-MSR over time.
Data from core 8JP showed constant TP-MSR over
time, and had our study focused on core 8JP alone, the
TP-MSR data would not have corroborated the
diatom-based historic limnetic TP inferences. These
limited TP-MSR data suggest no change in TP
sedimentation coincident with the shift from macro-
phyte to phytoplankton dominance. Thus, insufficient
data can lead to erroneous explanations for what
triggered the observed shift to phytoplankton
dominance.
We used whole-basin MSR models to identify the
cause for a shift between stable states. The AIC
approach allowed us to statistically differentiate
between constant MSR and exponentially increasing
MSR. Thus, we objectively verified the exponential
increases in TP loading using historic estimates of TP-
MSR. Using a LL approach to optimize parameters
and AIC to evaluate model performance minimized
the influence of outlier samples common in environ-
mental data. In this case, it prevented overestimation
of MSR, resulting from short-term episodes of rapid
sedimentation. The MSR models were useful in
providing continuous data for past sedimentation
rates, but they should not be used to predict future
sedimentation in the lake.
If TP loading continues to increase, future whole-
basin sedimentation is probably best described by a
sigmoid function, with an earlier period of exponential
increase over time, followed by a later period when
MSR approaches a maximum value asymptotically.
Our exponential function represents the earlier com-
ponent of the sigmoid curve. Because we did not
observe the maximum sedimentation rates possible,
we cannot model our data to fit a sigmoid function. To
assume that whole-basin MSR will continue to
increase exponentially is incorrect.
A recent hydrologic study of Lake Lochloosa (Lin
2011) provided data that allowed comparisons of TP
loading, TP retention and TP residence time between
1905 and 2006 (Table 1). Because the Lochloosa
basin is currently 84 % forests and wetlands and there
is no evidence for recent hydrologic modifications, we
assumed that the lake’s hydrologic budget remained
relatively stable over the past century. Given these
assumptions, we can deduce from our data that TP
retention in the system increased over twofold from
1905 to 2006. Current TP loading is *6.2 MT a-1
and recent TP sedimentation is *4 MT a-1, indicat-
ing a 0.65 TP retention coefficient in the lake. If
historic TP loading were *1.8 MT a-1 and historic
TP sedimentation were *0.6 MT a-1, then historic
TP retention coefficient for the lake was only *0.30.
Our modern estimate for TP retention (0.65) is similar
to values for other shallow Florida lakes (Fig. 9a)
determined by an alternative, watershed-modeling
approach (Fulton et al. 2004; Fulton and Smith 2008).
In a time during which TP storage in the water
column and TP sedimentation increased, a simple
mass balance calculation for Lake Lochloosa shows
decreased TP residence time in the water column.
Currently, the residence time for TP in the water
column is *0.5 a. Historically, the residence time for
TP in the water column might have been 1 a or longer,
especially if TP in macrophytes is considered part of
the water-column storage (Canfield et al. 1983).
Longer residence times for TP in the water column
of macrophyte-dominated systems may result from the
greater role that macrophytes and associated epiphytes
play in P burial in Florida lakes (Brenner et al. 2006).
Although it is apparent from our study that the shift
from macrophyte dominance to phytoplankton dom-
inance resulted in an increase in TP retention and a
decrease in TP residence time for Lake Lochloosa, one
remaining question is ‘‘what was the contribution of
senescing macrophytes to TP sedimentation?’’ Can-
field et al. (1983) estimated the TP content of
macrophytes in Lake Lochloosa to be equivalent to
93 lg L-1. If, historically, 25 % of the volume of
Lake Lochloosa were inhabited by macrophytes, then
J Paleolimnol
123

the total inventory of TP in macrophytes would be 1.1
MT or 0.34 modern water-column equivalents. If the
lake were 100 % occupied by macrophytes, then the
total inventory of TP in macrophytes would be 4.4 MT
or 1.4 modern water-column equivalents. Our study
estimates that 210Pb-datable sediments (1900–2006)
contain 175 MT of TP or *55 modern water-column
equivalents. These data indicate that total senescence
of macrophytes in Lake Lochloosa and complete
sedimentation of the TP contained in those macro-
phytes could only account for 1–3 % of the TP stored
in 210Pb-datable sediments.
In this study, the absence of a ‘‘step-wise’’ increase
in TP-MSR or TP loading complicated the identifica-
tion of a P threshold (Scheffer et al. 1993) associated
with the shift to phytoplankton dominance. In a study
of 72 shallow lakes in Minnesota, USA, Zimmer et al.
(2009) found upper thresholds for the clear-water state
of 22 lg L-1 Chl a, and 62 lg L-1 TP. Despite their
identification of water-quality thresholds, Zimmer
et al. (2009) recommended that lake managers focus
on improving resilience of clear regimes in shallow
lakes by reducing nutrient loading.
Our study helps to identify the TP loading threshold
that can trigger a shift from a macrophyte-dominated
state to a phytoplankton-dominated state. Because
TP:Chl a ratios vary both across lakes and within lakes
over time (e.g. in Lake Lochloosa TP:Chl a ranged
from 0.5 to 2.0), determination of a loading threshold
rather than a water-quality threshold could help avoid
possible errors associated with the natural variability
between TP and Chl a. Quantification of a water-
quality threshold for alternative stable states in
shallow lakes is further complicated by the role of
dissolved OM in light attenuation. Schelske et al.
(2010) showed that dissolved color attenuates light at
roughly one-third the rate of Chl a when comparing
the effects of color, in Pt units, to Chl a in lg L-1. This
relationship between color and light attenuation
helped quantify the influence of dissolved color on
the development of phytoplankton dominance in Lake
Apopka, FL, USA (Schelske et al. 2010). Applying
this relationship to Lake Lochloosa, the modern color
value (90 Pt units) attenuates light comparable to a Chl
a concentration of 30 lg L-1.
Because of limited modern data for water quality
and macrophyte coverage, Lake Lochloosa represents
a challenge for identifying the exact timing of the shift
to phytoplankton dominance. Furthermore, using
environmental response variables such as macrophyte
Table 1 Limnological characteristics in terms of total phosphorus (TP) for Lake Lochloosa calculated for years 1905–2006 (Lin
2011 and this study)
Pb-210 Sedimentation Diatom inferred Water column Export Loading Retention TP Residence Time
Date TP (MT/a) TP (ug/L) TP (MT) TP (MT/a) TP (MT/a) TP a
2006 4.1 67 3.2 2.2 6.2 0.65 0.5
2004 3.9 74 3.6 2.4 6.3 0.62 0.6
1998 3.4 68 3.3 2.2 5.6 0.61 0.6
1992 3.0 57 2.7 1.9 4.8 0.61 0.6
1982 2.4 54 2.6 1.8 4.1 0.57 0.6
1972 1.9 44 2.1 1.4 3.3 0.57 0.6
1964 1.6 34 1.7 1.1 2.7 0.59 0.6
1957 1.4 33 1.6 1.1 2.5 0.57 0.6
1947 1.2 35 1.7 1.1 2.3 0.50 0.7
1940 1.0 37 1.8 1.2 2.2 0.46 0.8
1931 0.9 34 1.6 1.1 2.0 0.44 0.8
1925 0.8 36 1.7 1.2 1.9 0.40 0.9
1924 0.8 38 1.8 1.2 2.0 0.38 0.9
1919 0.7 39 1.9 1.3 2.0 0.35 1.0
1909 0.6 39 1.9 1.3 1.8 0.32 1.0
1905 0.6 39 1.9 1.3 1.8 0.30 1.0
For these calculations, lake surface area (22.9 km2, mean depth (2.1 m) and water export (1.4 m a-1) were assumed to be constant
J Paleolimnol
123

coverage or Chl a might identify loading rates long
after the triggering threshold was crossed, especially
in Lake Lochloosa, where loading increased through-
out the recent sediment record. A plot of TP retention
and historic DI-TP versus TP loading (Fig. 10),
however, identifies the TP-loading threshold that
was crossed to trigger the shift to phytoplankton
dominance in Lake Lochloosa.
In Lake Lochloosa, initial increases in TP loading
resulted in increased TP retention in the system, but
did not increase the limnetic TP concentration until the
maximum observed TP retention (*0.65) was asymp-
totically approached ca. 1964. After 1964, increased
TP loading resulted in increased limnetic TP concen-
trations. From this comparison, we deduce that the
critical TP loading threshold was crossed ca. 1964.
The whole-basin, mass-balance analysis for Lake
Lochloosa shows that estimated TP loading was
2.7 MT a-1 in 1964, or about 1.5-fold greater than
TP loading in 1905. This threshold is equivalent to
44 % of modern TP loading (6.2 MT a-1). Our
modern estimate for the TP-loading threshold
(2.7 MT a-1 or 0.12 MT km-2 a-1) in Lake Loch-
loosa is similar to values for other shallow Florida
lakes (Fig. 9b), determined by an alternative,
watershed-modeling approach (Fulton and Smith
2008).
If the goal of lake managers is to re-establish the
macrophyte-dominated state in Lake Lochloosa, it
would be advisable to target a TP loading rate below
the threshold rate of 2.7 MT a-1. This is because of
increased storage of TP in recent sediments, which
may cause internal P loading to be greater now
(Søndergaard et al. 2001) than it was when the
triggering threshold was first exceeded in 1964.
Secondly, maintaining the stable state of the lake at
the ‘‘threshold TP-loading rate’’ would be subject to
the unpredictable nature of stochastic, biotic or
physical triggers (Scheffer and Carpenter 2003).
Using a 1983 estimate for total atmospheric TP
deposition in Gainesville, Florida (Brezonik et al.
1983) near Lake Lochloosa, we calculated that
roughly half of the threshold TP loading rate
(2.7 MT a-1) is supplied directly to the lake via
Fig. 9 a Hydraulic detention time (excludes evaporation)
versus phosphorus retention coefficient for seven lakes in the
upper Ocklawaha River Basin and Lake Lochloosa. b Hydraulic
detention time (excludes evaporation) versus phosphorus-
loading threshold for seven lakes in the upper Ocklawaha River
Basin and Lake Lochloosa. Ocklawaha River Basin data from
Fulton et al. (2004) and Fulton and Smith (2008). Lake
Lochloosa hydrologic data from Lin (2011)
Fig. 10 Using a whole-basin, mass-balance approach to
identify the phosphorus-loading threshold in shallow, subtrop-
ical Lake Lochloosa, Florida. A time-sequence (1900–2006) of
diatom-inferred limnetic total phosphorus (DI-TP) and phos-
phorus retention (sedimentation/loading) are plotted against
phosphorus loading (MT a-1) for the lake. Selected 210Pb-dates
(1905, 1964, 1981, 2006) are presented. The phosphorus-
loading threshold that triggered the shift to phytoplankton
dominance was 2.7 MT a-1 and that threshold was exceeded
after ca. 1964
J Paleolimnol
123

atmospheric deposition. Furthermore, atmospheric
deposition to the 228-km2 drainage basin is
13 MT a-1, about five-fold greater than the threshold
rate. Atmospheric TP deposition may be even greater
now than it was 30 years ago. Given the inherent
difficulty of managing atmospheric deposition and
light attenuation by dissolved OM, re-establishment of
the macrophyte-dominated state in Lake Lochloosa
might prove to be difficult.
Conclusions
Our whole-basin sedimentation analysis of Lake
Lochloosa, provided insights into historic lake pro-
cesses that were not evident from the limited archive
of water quality data. Because of variable sedimenta-
tion among coring sites in the lake, analysis of only
one or a few cores from Lake Lochloosa might have
led to misleading conclusions, so the additional effort
necessary to develop a whole-basin sedimentation
model was justified. The whole-basin mass balance
approach provided an effective means to identify the
trigger for ecosystem change. We calculated a greater
than three-fold increase in TP loading over the past
century from an eight-fold increase in TP sedimenta-
tion and a two-fold increase in water column TP and
TP export. The TP-loading increase triggered a shift
from macrophyte to phytoplankton dominance, caus-
ing an increase in TP retention and a decrease in TP
residence time in the lake. Comparison of TP loading
with TP retention and historic, diatom-inferred lim-
netic TP concentrations identified the TP loading
threshold that was exceeded, which triggered the shift
from macrophyte to phytoplankton dominance.
Acknowledgments Although the research described in this
article was funded, in part, by St. Johns River Water
Management District of Florida, it has not been subjected to
agency review and therefore does not necessarily reflect the
views of the agency, and no official endorsement should be
inferred. The Land Use and Environmental Change Institute at
the University of Florida provided funding for this project.
References
Akaike H (1974) A look at the statistical model identification.
IEEE Trans Autom Control 19:716–723
Appleby PG, Oldield F (1983) The assessment of 210Pb data
from sites with varying sediment accumulation rates.
Hydrobiologia 103:29–35
Appleby PG, Nolan PJ, Gifford DW, Godfrey MJ, Oldfield F,
Anderson NJ, Battarbee RW (1986) 210Pb dating by low
background gamma counting. Hydrobiol 143:21–27
Binford MW (1990) Calculation and uncertainty of 210Pb dates
for PIRLA project sediment cores. J Paleolimnol 3:
253–267
Brenner M, Hodell DA, Leyden BW, Curtis JH, Kenney WF, Gu
B, Newman JM (2006) Mechanisms for organic matter and
phosphorus burial in sediments of a shallow, subtropical,
macrophyte-dominated lake. J Paleolimnol 35:129–148
Brenner M, Curtis JH, Whitmore TJ, Zimmerman A, Kenney
WF, Reidinger-Whitmore M (2009) Sediment accumula-
tion rate and past water quality in Lochloosa Lake. Final
report for the St. Johns River Water Management District
278 p
Brett MT, Benjamin MM (2008) A review and reassessment of
the lake phosphorus retention and nutrient loading concept.
Freshw Biol 53:194–211
Brezonik PL, Hendry CD, Edgerton ES, Schulze R, Crisman TL
(1983) Acidity, nutrients and minerals in atmospheric
precipitation over Florida: deposition patterns, mecha-
nisms and ecological effects. EPA-600/S3-83-004 U.S.
EPA Corvallis, OR. NTIS document PB 83-165 837
Canfield DE, Langeland KA, Maceina MJ, Haller WT, Shir-
eman JV, Jones JR (1983) Trophic state classification of
lakes with aquatic macrophytes. Can J Fish Aquat Sci
40:1713–1718
Downing JA, Prairie YT, Cole JJ, Duarte CM, Tranvik LJ,
Striegel RG, McDowell WH, Kortelainen P, Caraco NF,
Melack JM, Middelburg JJ (2006) The global abundance
and size distribution of lakes, ponds and impoundments.
Limnol Oceanogr 51:2388–2397
Engstrom DR, Schottler SP, Leavitt PR, Havens KE (2006) A
reevaluation of the cultural eutrophication of Lake Oke-
echobee using multiproxy sediment records. Ecol Appl
16:1194–1206
Engstrom DR, Rose NL (2013) A whole-basin, mass-balance
approach to paleolimnology. J Paleolimnol 49:333–347
Fisher MM, Brenner M, Reddy KR (1992) A simple, inexpen-
sive piston corer for collecting undisturbed sediment/water
interface profiles. J Paleolimnol 7:157–161
Fulton RS III, Schulter C, Kelelr TA, Nagid S, Godwin W,
Smith D, Clapp D, Karama A, Richmond J (2004) Pollutant
load reduction goals for seven major lakes in the upper
Ocklawaha river basin. St Johns River Water Management
District 125 p. http://www.sjrwmd.com/technicalreports/
pdfs/TP/SJ2004-5.pdf
Fulton RS III, Smith D (2008) Development of phosphorus load
reduction goals for seven lakes in the upper Ocklawaha
river basin, Florida. Lake Res Manage 24:139–154
Glisson JT (1993) The Creek. University of Florida Press,
Gainesville 283 p
Griffith G, Canfield D, Horsburgh C, Omernik J (1997) Lake
regions of Florida. U.S. Environmental Protection Agency
EPA/R-97-127, Corvallis, OR. 88 p
Heggen MP, Birks HH, Heiri O, Grytnes J-A, Birks HJB (2012)
Are fossil assemblages in a single core from a small lake
J Paleolimnol
123

representative of total deposition of mite, chironomid, and
plant macrofossil remains? J Paleolimnol 48:669–691
Huber WC, Brezonik PL, Heany JP, Dickinson RE, Preston SD,
Dwornik DS, DeMaio MA (1982) A classification of
Florida lakes. Final report to the Florida Department of
Environmental Regulation, Report ENV-05-82-1, Talla-
hassee, Florida. v. 1–2 547 p
Jeppesen E, Jensen JP, Søndergaard M, Hansen KJ, Møller PH,
Rasmussen HU, Norby V, Larsen SE (2003) Does resus-
pension prevent a shift to a clear state in shallow lakes during
reoligotrophication? Limnol Oceanogr 48:1913–1919
Juggins S (2007) C2 Version 1.5 User Guide. Software for
ecological and palaeoecological data analysis and visual-
isation. Newcastle University, Newcastle Upon Tyne, UK.
73 p
Juggins S (2013) Quantitative reconstructions in paleolimnol-
ogy: new paradigm or sick science? Quat Sci Rev 64:20–32
Juggins S, Anderson NJ, Hobbs JMR, Heathcote AJ (2013)
Reconstructing epilimnetic total phosphorus using dia-
toms: statistical and ecological constraints. J Paleolimnol
49:373–390
Kenney WF, Schelske CL, Waters MN, Brenner M (2002)
Sediment records of phosphorus driven shifts to phyto-
plankton dominance in shallow Florida Lakes. J Paleolim-
nol 27:367–377
Kenney WF, Brenner M, Curtis JH, Schelske CL (2010) Iden-
tifying sources of organic matter in sediments of shallow
lakes using multiple geochemical variables. J Paleolimnol
44:1039–1052
Lakewatch Florida (1996) Florida Lakewatch Data (1986-1996)
Department of Fisheries and Aquatic Sciences. University
of Florida, Gainesville
Lakewatch F (2004). http://lakewatch.ifas.ufl.edu/data2004.htm
Lakewatch F (2009). http://lakewatch.ifas.ufl.edu/data2005.htm
Lakewatch F (2013). http://lakewatch.ifas.ufl.edu/Lakewatch_
County_Data.HTM
Lin Z (2011) Estimating water budgets and vertical leakages for
karst lakes in North-central Florida (United States) via
hydrological modeling. JAWRA 1–16. doi: 10.1111/j.
1752-1688.2010.00513.x
Oldfield F, Appleby PG (1984) Empirical testing of 210Pb-dating
models for lake sediments. In: Haworth EY, Lund WG
(eds) Lake sediments and environmental history. Univer-
sity of Minnesota Press, Minneapolis, pp 93–124
Riedinger-Whitmore MA, Whitmore TJ, Brenner M, Moore A,
Smoak JM, Curtis JH, Schelske CL (2005) Cyanobacterial
proliferation is a recent response to eutrophication in many
Florida lakes: a paleolimnological assessment. Lake Res
Manage 21:423–435
Rippey B, Anderson NJ, Renberg I, Korsman T (2008) The
accuracy of methods used to estimate the whole-lake
accumulation rate of organic carbon, major cations, phos-
phorus and heavy metals in sediment. J Paleolimnol
39:83–99
Sayer CD, Burgess A, Kari K, Davidson TA, Peglar S, Handong
Y, Rose N (2010) Long-term dynamics of submerged
macrophytes and algae in a small and shallow, eutrophic
lake: implications for the stability of macrophyte domi-
nance. Freshw Biol 55:565–583
Scheffer M, Carpenter SR (2003) Catastrophic regime shifts in
ecosystems: linking theory to observation. Tree 18:
648–656
Scheffer M, Hosper SH, Meijer M-L, Moss B, Jeppesen E
(1993) Alternative equilibria in shallow lakes. Tree 8:
275–279
Schelske CL, Conley DJ, Stoermer EF, Newberry TL, Campbell
CD (1986) Biogenic silica and phosphorus accumulation in
sediments as indices of eutrophication in the Laurentian
Great Lakes. Hydrobiologia 143:79–86
Schelske CL, Peplow A, Brenner M, Spencer CN (1994) Low-
background gamma counting: applications for 210Pb dating
of sediments. J Paleolimnol 10:115–128
Schelske CL, Lowe EF, Kenney WF, Battoe LE, Brenner M,
Coveney MF (2010) How anthropogenic darkening of
Lake Apopka induced benthic light limitation and forced
the shift from macrophyte to phytoplankton dominance.
Limnol Oceanogr 55:1201–1212
Schottler SP, Engstrom DR (2006) A chronological assessment
of Lake Okeechobee (Florida) sediments using multiple
dating markers. J Paleolimnol 36:19–36
Søndergaard M, Jensen JP, Jeppesen E (2001) Retention and
internal loading of phosphorus in shallow, eutrophic lakes.
Sci World 1:427–442
ter Braak CJF, Smilauer P (2002) CANOCO reference manual
and CanoDraw for Windows user’s guide. Software for
canonical community ordination (version 4.5), Micro-
computer Power, Ithica, NY, USA. 500 p
Verardo DJ, Froelich PN, McIntyre A (1990) Determination of
organic carbon and nitrogen in marine sediments using the
Carlo Erba NA-1500 Analyzer. Deep Sea Res 37:157–165
Whitmore TJ, Brenner M, Schelske CL (1996a) Highly variable
sediment distribution in shallow, wind-stressed lakes: a
case for sediment mapping surveys in paleolimnological
studies. J Paleolimnol 15:207–221
Whitmore TJ, Brenner M, Curtis JH, Dahlin BH, Leyden B
(1996b) Holocene climatic and human influences on lakes
of the Yucatan Peninsula, Mexico: an interdisciplinary,
palaeolimnological approach. Holocene 6:273–287
Zimmer KD, Hanson MA, Herwig BR, Konsti ML (2009)
Thresholds and stability of alternative regimes in shallow
Prairie-Parkland lakes of central North America. Ecosyst
12:843–852
J Paleolimnol
123