who votes? voter turnout in new york city · voter turnout in new york city ... demographic...
TRANSCRIPT

Voter Turnout in New York CityA Report of the New York City Campaign Finance BoardJune 11, 2012
Voter Assistance Advisory Committee

Voter engagement is a significant and persistent challenge in New York City. In recent years, voter turnout in the city has been historically low: in the 2009 general election for mayor, fewer than one in five New Yorkers of voting age cast a ballot (18.4 percent). In the November 2010 federal midterm and New York state election, turnout in the city was significantly lower (28 percent) than in the rest of the state (53 percent) and nationally (46 percent). Even among other large urban areas, New York consistently ranks lower in voter turnout. A greater portion of registered voters cast ballots in Los Angeles, Chicago, and Philadelphia during the 2008 presidential and 2010 Congressional elections.
Pursuant to a City Charter amendment approved by referendum in November 2010, the New York City Campaign Finance Board is charged with encouraging and facilitating voting by all eligible New York City residents. The Board and staff are assisted in this role by the Voter Assistance Advisory Committee (VAAC). Specifically, under New York City Charter §1054 (b) (2), the Board must identify groups of city residents “who are underrepresented among those registered to vote and those voting,” and recommend strategies to increase voting among these groups.
To focus its efforts in carrying out this mandate, the Board determined to identify those groups by studying voter turnout across New York City in recent elections. Last fall, the Board commissioned a team of graduate students from New York University’s Robert F. Wagner School of Public Service to develop a profile of New York City’s nonvoting population. The students, who were participating in the school’s Capstone program, performed a demographic analysis of voter history rolls from the Board of Elections, looking at the 2008 and 2009 elections against data from the U.S. Census Bureau’s 2006 –2010 American Community Survey (ACS) Five-Year Estimates. They matched ACS data by census tract with turnout rates to identify demographic factors that may contribute to low voter participation across the city.
The key demographic factors that appear to negatively influence turnout are: gender, age, mobility, educational attainment, and citizenship.
Across the city, census tracts with low voter turnout had certain characteristics in common:
• A higher proportion of men• A higher proportion of young adults • Higher residential turnover• Lower educational attainment• A higher proportion of naturalized citizens (as opposed to citizens born in the U.S.)
Based on their findings, the report recommends structural changes that would make it easier for New York City residents to register and vote. These proposals include no excuse absentee voting, allowing Election Day registration, and redesigning the ballot to make it clearer, simpler, and easier to understand.
The report provided by the Capstone team is a significant achievement in understanding the problem of low voter turnout in New York City. The work, however, is just beginning. The Board hopes this report will make a useful contribution towards indentifying new ways to engage voters in New York City. Through the Board’s voter assistance work under the “NYC Votes!” banner, the findings in this report will be translated into programs intended to meet its Charter mandate to seek increased voting among underrepresented populations. The Board hopes to use this report as a basis for further research and analysis as it develops specific strategies for increasing voter registration and turnout for this historic election year and beyond.
WHO VOTES? Voter Turnout in New York City – June 11, 2012

Voter Turnout in New York City: Who Does Not
Vote and What Can Be Done?
New Analysis of the 2008 Presidential and 2009 Mayoral Elections
in NYC to Inform Voter Outreach Strategies for 2012 and 2013
A Capstone Report for the New York City Campaign Finance Board
May, 2012
Capstone Team Members: Rachel Bardin, Marvin Francois, Christine Fulton, Jeremy
Levkoff, Katelyn Mikuliak, Melissa Stevenson
2
CONTENTS
Acknowledgements Executive Summary Introduction Prior Research Age Education Gender Income Race and Ethnic Minorities Residential Mobility Group Membership Findings: Voter Turnout in New York City Consistent Findings in 2008 and 2009 Mixed Findings Characteristics of Low Voting Tracts Recommendations Structural Reforms Areas of Further Research Conclusion Appendix A: Data Sources Appendix B: Statistical Methods Appendix C: Community Based Organization (CBO) Survey Appendix D: Descriptive Statistics Appendix E: Full Regression Results Appendix F: Community District Profiles Appendix G: Limitations
Endnotes

3
ACKNOWLEDGMENTS
We are very grateful to those who guided us throughout the Capstone process. Our Campaign Finance Board liaison, Eric Friedman, provided valuable feedback that contributed greatly to the content and organization of the final report. We are also grateful to Stuart Osnow, who generously offered his time to discuss the scope of our project and connect us to voter outreach organizations. We would like to thank the members of community-based organizations who provided insightful responses to our survey questions about voter turnout. Their understanding of the obstacles and opportunities for increasing turnout helped us develop our recommendations. This report could not have been possible without the guidance and support of the faculty at NYU Robert F. Wagner School of Public Service. Professor Daniel Smith assisted us in the development of our regression model and Professor Tod Mijanovich helped us consider several ways to present the data and interpret our findings. And of course, we could not have completed this report without the counsel and wisdom of our Capstone advisor, Professor Charles Brecher. He supported and guided us from day one, and helped make this process as stress-free as possible, which was no simple feat. One might say we even enjoyed it. We hope you enjoy the final product.
4
EXECUTIVE SUMMARY
In this report we attempt to identify who does not vote in New York City and recommend ways the Campaign Finance Board (CFB) can increase voter turnout. We analyzed voter turnout by census tract in the 2008 and 2009 elections using Board of Elections voter history rolls and demographic data from the 2010 American Community Survey 5-Year Estimates. To supplement this analysis in developing our recommendations, we conducted research of common outreach strategies and structural reforms and obtained feedback from community-based organizations via an online survey. We found that in both 2008 and 2009, populations that negatively influenced turnout in a given census tract included men, younger adults (age 18 to 29), individuals with low educational attainment, mobile residents, naturalized citizens, married couples, and government workers. The impact of race was mixed: while a larger black population in a census tract consistently increased turnout, when we took into account the other factors mentioned above, we found mixed results for the impact of the Latino and Asian populations in the two elections. This suggests that variables other than race, such as education, mobility, age, and gender, should be emphasized in outreach efforts. To increase voter turnout, we recommend that the CFB continue and enhance its use of social media as a launch pad for civic engagement. The CFB should serve as a hub to streamline all stakeholders, from community-based organizations to the actual voters. We further recommend that the CFB advocate for three key structural reforms in New York: no-excuse absentee voting, election-day registration, and simplifying the ballot.

5
INTRODUCTION
In November 2010, the Campaign Finance Board (CFB) expanded its mission to include a new Voter Assistance Unit, responsible for identifying under-registered segments of the city's population and enabling eligible residents to register and vote.1 With the 2012 presidential and 2013 mayoral elections on the horizon, the CFB is preparing to launch a robust citywide voter assistance effort to increase voter turnout. The CFB’s preliminary analysis for its 2010-2011 Voter Assistance Annual Report highlighted the need to improve voter participation. The 2009 mayoral election in New York City yielded the lowest turnout since 1969 with only 29% of the 4.1 million registered voters casting a ballot.2 As exhibited in the chart below, turnout was again historically low in the November 2010 midterm elections, especially compared to the nation and the rest of New York State.
Source: U.S. Census Bureau, Current Population Survey and NYC turnout data from Board of Elections
This extremely low turnout in New York City suggests that election results may be biased toward the interests of a relative few.3 Inequitable citizen participation has important implications for the electorate.4 Voters can influence the decisions that allocate public resources and affect policies that govern their lives while those who do not are at a disadvantage. Additionally, the more a community is involved in local elections, the greater the chance that the candidates will listen to its issues.5
Our team’s Capstone project is intended to help the CFB address the problem of low voter turnout in New York City by identifying non-voting populations and recommending ways to bring them to the polls. In this report, we first present the main findings from our review of prior research on the characteristics associated with voting. Then, we discuss the results from our statistical analysis of turnout in the 2008 and 2009 general elections in New York City. Finally, we recommend strategies for increasing voter turnout among the targeted populations based on our research, empirical results, and a Community Based Organization (CBO) Survey, which we
1,367
4,379
95,987
4,969
8,194
210,800
0% 10% 20% 30% 40% 50% 60% 70% 80% 90% 100%
NYC
NYS (Excluding NYC)
US
Voter Turnout Among Eligible Citizens, 2010 (in thousands)
Voter Turnout
Total Eligible Citizen Population

6
disseminated to 30 organizations that work to increase turnout in New York City. Our efforts focus on both the general eligible voting population and underrepresented groups, as identified in our analysis, to ensure that the interests of all New Yorkers are heard in the next election cycle and beyond.
PRIOR RESEARCH
Below we summarize highlights from the existing research, which we used to identify relevant characteristics for our regression models of New York City voter turnout. In sum, prior research indicated that age, education, gender, income, race, ethnicity, and residential mobility are commonly associated with turnout, but complications occur when these variables interact. For example, some research shows that age, gender, and education are more important factors than race. At the end of this section, we briefly highlight some non-demographic factors that have been associated with turnout that the CFB may find useful to inform outreach.
Age
Adults under the age of 30 are less likely to vote than older adults. This has been demonstrated in a Project Vote study of the 2008 election, which found voters age 18 to 29 were underrepresented in the electorate compared to their composition of eligible voting population.6 The same report also found that younger individuals are less likely to be registered than their older counterparts. The Center for Information and Research on Civic Learning and Engagement (CIRCLE) argues that low voter participation among youth is in part attributable to the failure of political campaigns to target young citizens, not wishing to waste their resources.7 As a result, young people either do not feel their vote makes a difference or simply do not consider it a priority.8 However, a study presented by Young Voter Strategies of 36 precincts in Ohio, Iowa, Colorado, Connecticut, and Michigan in the 2006 elections found turnout more than doubled where nonpartisan get-out-the-vote (GOTV) campaigns actively turned out the youth vote.9
Education
High educational attainment is strongly associated with propensity to vote.10 Moreover,
educational attainment can mitigate the negative association between youth and voting. Eligible voters with a bachelor’s degree have been shown to vote at a higher rate than the national average of younger voters and high school graduates have voted at higher rates than those with less than a high school degree.11 However, some researchers suggest that this association appears because those with more education also have higher average incomes, which allows them the time to vote.12
Gender
Although some research dismisses the effect of gender on voter participation, others cite
greater turnout among women in recent elections. Survey results from the 2006 Pew Research

7
Report of voters nationwide found little difference in the proportion of men and women who report being “regular” voters.13 However, the Center for American Women and Politics of Rutgers University showed that the proportion of women voters has been larger than the proportion of men voters in presidential elections since 1980 and in non-presidential national elections since 1986.14
Income
Lower income people turn out less than those with higher incomes. The Project Vote study of the 2008 presidential election found that 16% of voters were from low-income households (defined as $25,000 or less), while 20% of the adult citizen population was low-income.15 Other studies have also observed this trend. However, an analysis of the 2000 presidential election by Andrew Beveridge found that there was no direct relationship between “economic distress” of an area and non-voting among eligible voters.16 The association between income and voting may actually reflect the association between education and voting, identified in some research.17
Race and Ethnic Minorities
Ethnic and racial minorities have lower voter turnout rates than the white population. A Pew Research Report from 2006 found that in the U.S., 37% of whites were regular voters compared to only 31% of blacks and 24% of Hispanics.18 Notably, Latino turnout has not increased in the past 20 years despite massive outreach efforts over this period.19 Attention to black and Latino turnout is particularly important in New York City because of the presence of large minority communities; the largest gains in registered voters have been among these subsets, particularly foreign-born populations.20
Some of the racial disparity in voting behavior may be attributable to non-race variables. Research indicates that the relationship between race and voting might reflect the strong negative correlations between non-whites and education and income.21 However, analysis of younger and more educated subgroups of both Latinos22 and blacks23 has shown that these variables are strongly associated with turnout and can mitigate the impact of race. In addition, black women under age 65 are more likely to vote than their male counterparts.24 This might partially be due to disproportionately high incarceration rates among young black males, who are 12% of the population, but 47% of the prison population.25 Additionally, black individuals who attend religious services are more likely to vote than those who do not.26
Naturalized citizens may be more likely to vote when minority candidates are on the ballot. This phenomenon was observed in the 2009 New York City election when Asian-American John C. Liu was a candidate for Comptroller. While 3% of the electorate was Asian in 2001, this share of voters jumped to 7% in 2009, according to exit polls.27 Research of naturalized citizens specifically, not just those of minority status, indicates that poor turnout may be attributable to a lack of campaign outreach.28

8
Residential Mobility
Those who change residences are less likely to vote than those who do not move, regardless
of demographic or attitudinal attributes.29
Some research credits this to the inconvenience of re-registering after changing addresses (residential mobility) while others suggest that the negative association stems from being uprooted from the social connections of a community caused low turnout (community mobility).30 A study from 2000 identified the inconvenience of re-registering as having a greater negative effect on voter turnout than the loss of community-based social connections.31
Group Membership
There also appears to be an association between group membership and voting.32 Some research also indicates that union members have higher odds of voting than the general population because they have mobilized their members to participate in and influence the electoral process.33 Regular voters are also more likely to be married and know many of their neighbors than those who vote less frequently or not at all.34
FINDINGS: VOTER TURNOUT IN NEW YORK CITY

9
The results of our analysis of voter turnout at the census tract level in New York City are shown below in Table 2. The numbers listed in the “Adjusted Impacts” columns can be interpreted as the percentage point increase in average voter turnout in that election year caused by a one unit or percentage point increase in the characteristic listed in that row, given all other variables or characteristics are equivalent. Our analysis found several key characteristics that effected average voter turnout in both election cycles:
o Gender
o Age
o Residential stability
o Educational attainment
o Naturalized citizenship
o Household family type
The Voter Assistance Unit should target its outreach efforts toward individuals between the ages of 18 and 29, males, individuals with only a high school education, U.S. citizens who were born abroad, and married households. In addition, neighborhoods with poor access to transportation or

10
with higher residential turnover would be strategic locations to focus registration and voter mobilization campaigns.
Table 1: Estimated Impacts of Demographic and Socioeconomic Characteristics on Average Turnout in a Census Tract
Independent Variable 2008 Adjusted Impacts 2009 Adjusted Impacts
Race and Ethnicity (18 and older): % Black 0.08* 0.03* % Asian -0.06* -0.01 % Hispanic or Latino 0.09* 0.01 % White non-Hispanic --- --- % Other --- ---
Gender: % Male citizens (18 and older) -0.21* -0.10* % Female citizens (18 and older) --- ---
Age: % 18-29 years -0.29* -0.17* % 30-64 years old --- --- % 65 years and older -0.17* 0.17*
Residential stability: % In same residence as 1 year ago 0.33* 0.26* % In different residence as 1 year ago --- ---
Educational Attainment (25 and older): % High school diploma or less -0.17* -0.12* % Some college or more --- ---
Primary language spoken at home: % Not English -0.07* 0.02 % English --- --- Naturalization (of all citizens 18 and older): % Naturalized -0.09* -0.10* % Native born --- ---
Employment sector: % Government workers -0.06* -0.07* % Private --- ----
Type of Household: % Single-female family -0.05 -0.09* % Single-male family -0.08 -0.09* % Married couple family -0.09* -0.07* % Nonfamily households --- ---
Mean travel time to work (minutes) 0.08* -0.17* Standard errors in parentheses *Variable has a significant effect on turnout (at the p<0.05); no star indicates no significant effect on turnout. Adjusted impacts in each column are beta coefficients from a multivariate regression controlling for all other covariates listed in that column. Dependent variable is the number of voters in the election as a percentage of the citizen population ages 18 and
older. Variables without numbers in the “Adjusted Impacts” columns were omitted because they are highly correlated with other variables in their category and cannot be included.

11
Consistent Findings in 2008 and 2009
Residential stability significantly affects voter participation in both types of elections. As the number of individuals in a tract who lived in the same residence in the previous year increased, average turnout increased in both 2008 and 2009. This suggests that people who have recently moved may either have barriers to voting in their new district or barriers to registering with their new address. Voter mobilization is needed in areas with high residential turnover that may be home to more transient populations, such as students and younger voters. Alternatively, identifying neighborhoods with high residential turnover may be a good place to focus education and registration. It is also important to remember that residents may be registered and voting in their former election districts, which would not be captured in our data. Lastly, New York could pass a law, similar to the Minnesota’s 2008 law, to automatically update voter registrations when individuals change their addresses to capture its transient population and make re-registration easier.35 As the percentage of men in a tract increased, voter participation decreased. As shown in Chart 3, the gender gap in voting was more apparent in the presidential election: the gap declined from seven percentage points in 2008 to two percentage points in 2009. Furthermore, the “gender gap” varied by age bracket (Chart 4). Women in both the 18 to 29 and 30 to 64 brackets voted at higher rates (as a percentage of voting age population) than their male peers in both elections; however, the gap reverses for those 65 and older, when men outvoted women.
Turnout is lower among citizens under age 30. Increases in the percent of adult citizens who are 18 to 29 years old decreased average turnout. Notably, the effect was present in both the presidential and local election, despite the reported increase in the percentage of 18-29 years olds that voted in the 2008 election compared to previous presidential elections.36 The negative association between voter turnout and voters age 18 to 29 in the both election years affirms the fact that voter outreach groups must make a greater effort to appeal to youth interests during both local and national elections.
47%
24%
40%
22%
0%
10%
20%
30%
40%
50%
2008 2009
New York City Voter Turnout
by Gender, 2008 - 2009
Women
Men

12
Less educated census tracts voted at lower rates than those that were more educated. As the percent of a tract with only a high school education increases, average turnout falls; however, this effect was more apparent in 2008 than in 2009. These findings support prior research that claims that education is a major factor in one’s propensity to vote. Household income was not included in our final analysis because income is very highly correlated with low educational attainment.* Including household income in the final model might have distorted the estimated effects of other characteristics. This complicates the interpretation of either variable’s effect on voter turnout. We chose to focus our analysis on the effect of education because we thought it presented more avenues to reach voters, such as through GED classes, public high school, and community colleges. The percent of citizens who are naturalized has a negative effect on voter turnout. The effect of large populations of naturalized citizens, as opposed to citizens born in the U.S., was of a similar magnitude in both 2008 and 2009. There are many possible explanations for lower turnout among naturalized citizens. The inconsistent findings in 2008 and 2009 with respect to the impact of speaking a foreign language suggest that there are more factors influencing turnout than language barriers. Perhaps naturalized citizens fail to vote because they do not feel connected to the American political system, which has implications for how mobilization campaigns should attempt to engage foreign-born populations.
* The correlation coefficient between percent high school education or less and household income was -0.74. An absolute correlation of 0.7 is considered high: Source: Jeremy Anglim. “Correlation, Multiple Regression and Logistic Regression.” University of Melbourne. 2007. http://web.psych.unimelb.edu.au/jkanglim/correlationandreggression.pdf
19%
42%
49%
4%
20%
38%
13%
35%
51%
4%
18%
41%
0%
10%
20%
30%
40%
50%
60%
18-29 30-64 65 plus 18-29 30-64 65 plus
2008 2009
Note: Turnout measured as a percentage of voting-age adults in each age bracket
New York City Voter Turnout by Age and Gender, 2008 - 2009
Women
Men

13
In both years, increases in nonfamily households had a positive effect on average turnout. Prior research has suggested that married people are more likely to vote than unmarried people are. Upon further investigation, tracts with larger percentages of nonfamily households are also correlated with more education (Bachelor’s degree or higher), while married families are not correlated with education. Since we included an education variable in our analysis, we controlled for its impact. Thus, education alone cannot account for the difference in turnout. This indicates that there may be other unmeasurable factors that are associated with non-family households and more education that could be unique to New York City which could also be related to higher levels of civic engagement and voter participation. There might be something unique about individuals in New York City who choose not marry or have children, but have also pursued higher education and are civically engaged. Alternatively, perhaps those who do not have children have more freedom and fewer obligations, making it easier for them to vote. The takeaway message for voter outreach appears to be that non-family households are more likely to vote than married households, so outreach should focus on the latter. Government workers unexpectedly had lower voter turnout. We theorized that government workers might have higher rates of civic engagement than other types of workers as well as often being unionized, which previous research has indicated is strongly correlated with higher voter turnout. However, the expected positive effect does not appear in either election.

14
Mixed Findings
Our findings were mixed regarding adults over 65 years old, race and ethnicity, whether English was the primary language spoken, and mean travel time to work. These discrepancies could be due to myriad of factors: the historic nomination of Barack Obama for president in 2008; the higher profile nature of all presidential elections and their national media coverage compared to lower-profile local mayoral elections; or differences between the two years in the amount and quality of election materials targeted at certain groups. Adults aged 65 and older actually had a negative effect on turnout in 2008. In contrast, they had a positive effect on turnout in 2009, as we expected based on prior research that indicated that elderly adults were more likely to vote than their younger peers. The negative relationship between the elderly population and voting in 2008 appears to be mostly due to a positive association between those ages 30-64 and voter turnout in 2008.* This does not mean that adults age 65 and older had lower turnout rates than adults 30 to 64; the results indicate that as the percent of a tract that is age 65 and above increases and percent that is 30 to 64 decreases, average turnout declined. Percent black had a positive effect on turnout in both years but was more visible in 2008. In 2008, tracts with larger black populations had higher average turnout even without controlling for the presence of socioeconomic factors. This means that areas that had higher percentages of black adults had higher turnout rates than tracts with fewer blacks, regardless of other factors like average educational attainment, gender makeup, or types of households. In fact, average turnout for tracts that were predominately black (more than 50% of the citizen adult population) was more than seven percentage points higher than tracts that were not predominately black. However, it would be impossible to generalize that predominantly black tracts vote significantly more in all presidential elections. While our final analysis indicates that the black adults have a positive impact on turnout in both election years, this is only apparent in the mayoral election when all other socioeconomic and demographic variables are taken into consideration. (The bivariate regression in Appendix E shows that in 2009, when we only consider the impact of percent black, this variable decreases turnout). Education appears to be a more important predictor of voter participation than race in 2009. A more complete study of the effect of race and ethnicity on voter turnout would need to compare turnouts in multiple elections years.
There is no consistent effect of Latino populations on voting. The observed lower turnout rates among Latinos appears to be largely due to the presence of other socioeconomic characteristics, such as education, naturalization status, and primary language spoken. These factors alone appear to be the cause of lower turnout among Latinos in 2008, as once you take into account other variables, increases in the percentage of a tract that are Latino lead to increases in voter participation. In 2009, when all other factors are equal, the Latino makeup of a tract has no effect on voter turnout. In both years, education and naturalization status are a larger predictor of turnout than Latino. * We tested a model that includes variables for 18-29 and 30-64 and omits 65 and older. For both 2008 and 2009, the effect of 30-64 on voter turnout is positive, but this number is much larger in 2008.

15
Increases in percent Asians led to declines in turnout in 2008, but there is no effect in 2009.
In the 2008 election, tracts with higher percentages of Asians had lower voter participation rates, even when all other factors (most notably language and naturalization status) were taken into account. However, in 2009, percent Asian had no impact on turnout in that election. As previously mentioned, the difference in the significance of Asian could be due to a number of factors, and does not necessarily mean that Asians had lower voter turnout in 2008 than 2009.
Language barriers only appear to depress turnout in 2008. As the percent of individuals who do not speak English at home increases, average turnout decreases in 2008 but is not affected in 2009. This implies that primarily using a language other than English in and of itself is not a deterrent to voting; perhaps instead, a lack of interest in or a poor understanding of the political system is the problem. It is also possible that because turnout was low across many subgroups in 2009, not speaking English as a primary language becomes less of a factor in explaining voter participation in or local elections. Again, this difference in significance could be due to numerous reasons; pre-election information could have been more available in languages other than English in 2009 than in 2008. We would thus still recommend that the CFB consider language barriers, both in the voting booth and in the receipt of materials before the election, in their voter outreach efforts.
We found contradictory effects of travel time on voting patterns. In 2008, voter turnout actually increased with increases in a tract’s average travel time to work. The negative impact of long commutes in 2009 suggests that outreach in local elections should extend to neighborhoods in the five boroughs that are relatively remote or have poor access to transportation. It also supports findings from prior studies of voter participation that many people do not vote because they lack the time to vote on Election Day. Some of the unexpected results may be attributable to the fact that 2008 was both a presidential election and higher profile than a typical presidential election, which led many subgroups that are typically underrepresented to vote. The excitement surrounding the 2008 election may have also lessened the propensity of individuals to use a “lack of time” as a reason not to vote.
Characteristics of Low Voting Tracts We isolated census tracts that we consider to be chronically low voting, defined as tracts with voter turnout rates in the lowest twentieth percentile in both the 2008 and 2009 elections. Table 2 shows the average composition of the chronically low voting tracts compared to all other tracts.

16
Table 2: Average Characteristics of Low Voting Tracts
Bottom 20th
Percentile Above 20th Percentile
Absolute Difference
(N=228) (N=1842)
% English not primary language 62.5 45.2 17.3
% Black 11.7 28.6 16.9
% Asian 23.4 11.2 12.2
% High school education maximum 58.3 47.3 11.0
% Naturalized citizens 41.6 31.4 10.2
% Bachelor's degree or above 22.1 31.4 9.3
% Hispanic or Latino 32.4 24.1 8.3
% Married family households 46.4 38.5 7.9
% Non-family households 27.9 35.5 7.6
Median household income (in thousands) 48.5 55.2 6.7
% White non-Hispanic 30.0 35.8 5.8
% Government workers 12.4 16.5 4.1
% 18-29 years old 27.4 24.3 3.1
% Female 52.0 54.7 2.7
% Male 48.0 45.3 2.7
% Same house as 1 year ago 86.8 89.4 2.6
% 65 and older 13.7 15.7 2.0
% 30-64 58.9 60.1 1.2
Chronically low voting tracts had higher percentages of people who: did not speak English as the primary language, did not have an education beyond high school, were Asian, were naturalized (rather than native-born) citizens, were in married-couple family households, were Hispanic or Latino, adults ages 18 to 29, and citizens who were men. Higher voting tracts had larger percentages of black adults, white non-Hispanic adults, people with Bachelor’s degrees, non-family households, government workers, and people in the same house as one year ago. These averages, however, do not take into account the simultaneous effect of other characteristics on voter turnout. For example, although low voting tracts were more Latino, they were also less educated, which is correlated with Latino (tracts that are more Latino also have higher percentages of people without college educations). The results of our team’s analysis described above indicate that educational attainment, rather than ethnicity, is a more important predictor of low levels of voter participation.
RECOMMENDATIONS
Based on our review of nationwide election practices, our CBO Survey, and the findings from our analysis of New York City turnout, we recommend a set of structural reforms for increasing turnout among the target groups of young adults ages 18-29, populations with low educational attainment, men, mobile residents, naturalized citizens, and married couple families. We also

17
include a discussion of contemporary reforms to increase voter turnout not recommended, as well as suggested areas for further research.
Structural Reform
This section highlights a number of reforms enacted in other jurisdictions, recommended in our CBO Survey, or found in prior research to improve voter turnout throughout the voting and election process.
No-Excuse Absentee Voting Eligible voters frequently cite inconvenience and inaccessibility as obstacles to voting. Surveys of registered voters conducted by the U.S Census Bureau found the most popular reason given for not voting is “No time off/too busy.”37 In the Voter Assistance Unit 2010 Post-Election Public Hearing, an issue raised during the public’s testimony was that senior citizens had difficulty accessing their poll sites and required additional transportation services.38 Several CBO Survey respondents indicated that community members often gave rigid work schedules and physically demanding jobs as reasons for not making it to the polls. Absentee voting, or mailing in ballots before Election Day, is one such convenient method of voting. There are two forms of no-excuse absentee voting: permanent and nonpermanent. With permanent voting, after one registers as a permanent absentee voter he or she will automatically receive the ballot in the mail for subsequent elections. Nonpermanent voters must reapply for an absentee ballot every election.39 In New York City, residents, who vote absentee, must be able to prove that they are unable to vote due to their occupation, business, studies, travel, imprisonment (other than a convicted felon), illness, disability and hospitalization or resident in a long term care facility.40 States across the country have implemented no-excuse absentee ballots to address low voter turnout: seven states* and Washington D.C. allow persons to request permanent absentee status without a reason.41 No-excuse absentee voting arguably reduces the burden of traditional poll site voting by giving voters the freedom to vote based on their schedule rather than visit a polling place during specific hours on Election Day.42 Research on no-excuse voting has been mixed. One study examined voter turnout at the state-level in presidential elections in 2000, 2004, and 2008. It found that permanent no-excuse absentee voting was associated with a higher probability of voter turnout. The results also suggested that permanent no-excuse voting will likely have a greater influence on mid-term elections as some voters who might not usually vote in these less prominent elections will automatically be sent a ballot, therefore increasing the likelihood that they will vote.43† Wolfinger and Hoffman found that nonpermanent absentee voting had a positive and statistically
* Arizona, California, Colorado, Hawaii, Montana, New Jersey, and Utah † This is reinforced by their results, which show that permanent no-excuse absentee voting has a positive and significant effect on turnout. The magnitude on these coefficients also increases in each subsequent election with an increase of .192 in 2000, .208 in 2004, and .378 in 2008; the effect of no-excuse absentee voting increases over time.

18
significant affect on voter turnout.44 Another study found that no-excuse absentee balloting increased voter turnout but only when it was coupled with additional voter outreach strategies.45 However, Leighley, and Nagler found inconsistent or small effects when using pooled Current Population Survey data across nine elections. One study used state-level panel data across multiple elections and found nonpermanent no-excuse absentee voting to have no effect on turnout.46 Two studies found that no-excuse absentee voting actually decreased turnout.4748 Though the empirical evidence is inconclusive, many of these studies were performed over a relatively small window of time and use varying methodologies. The more recent studies suggest that no-excuse absentee voting does have a positive impact on voter participation. A potential argument against no-excuse absentee voting is that it will allow for voting fraud and intimidation. However, New York law currently permits individuals other than the voter to apply for excuse absentee ballots and to pick up and submit these absentee ballot; accordingly, there are already safeguards in place to protect against such misconduct.49 There is also evidence that no-excuse voting and other early voting practices have resulted in more accurate electorate counts.50 Recommendation: Given New Yorkers perceived and actual difficulty making it to the polls on Election Day, instituting no-excuse absentee practices will enhance the likelihood of voting. In our statistical analysis of voting patterns in 2009, average travel time to work was significant and negatively associated with voter turnout. As average travel time increases by 10 minutes, voter turnout among eligible citizens on average decreases by 1.7 percentage points, all other factors being equal (Table 1).* Our analysis also found low turnout among families who have been in their current residences for less than a year. These negative correlations indicate that a more convenient voting method could increase voter turnout in New York City. Currently, the city permits non-permanent absentee voting only under a limited set of circumstances. To improve voter turnout rates, the CFB should offer permanent and nonpermanent no-excuse absentee ballots to New York City residents. With this added flexibility, we believe voting will be easier and therefore participation will increase. Election Day Registration According to the U.S. Census Bureau, over 35 million people changed residences in 2011 in the United States.51 Many of these individuals fail to register to vote before their states’ early registration deadlines, and cannot vote on Election Day. Respondents to our CBO Survey cited registration problems, specifically pre-registration deadlines, pre-registration forms, and overall difficulty in the registration process, as the principal reasons that eligible voters do not make it to the polls or have problems when they get there on Election Day. In the 2008 presidential election, three million Americans attempted to vote but were unable due to voter registration problems.52 * In 2008, travel time to work is positively associated with voter turnout in a census tract. We believe this positive association may speak to the fact that 2008 was a highly visible presidential election.

19
Election Day registration (EDR) remedies this by allowing eligible voters to register and vote on the same day at his or her designated polling place. 53 This is sometimes referred to as “permanent registration” when applied to individuals who have already registered through traditional means and need to update their address or name on their registration. Weiser and Norden argue that EDR will help people who have recently moved residences, young people, and others who may not be aware of the registration deadline.54 Eight states* currently allow this option for both new voters and re-registrants, while two others† allow new voters to register with early voting before the official Election Day. Additionally, eight states‡ permit already registered voters, who have moved but not officially changed their address, to vote on Election Day in some capacity.55 States employ three different methods of permanent registration: 1) voters who have moved within the state can vote from their new polling place; 2) voters who have moved within the state can vote a provisional ballot at their new polling place; or 3) voters who have moved within the state can vote with a regular ballot from their old address.56 Election Day registration has been in effect in some states for 40 years.57 States with EDR have historically had turnout rates that were 10 to 12 percentage points higher than states without.58 On average, these states had a 7% higher turnout rate than non-election day registration states.59 Despite the encouraging statistics that surround this structural reform, some argue that EDR opens the door to voting fraud and increases administration costs.60 In 2011, thirteen states introduced bills to either end Election Day registration, limit voter registration efforts, and/or limit other registration opportunities; however, it is noteworthy that advocates and critics of these legislative efforts have been split along partisan political lines.61 However, fraud can be mitigated by following certain protocols already adhered to by states with EDR or permanent registration. For example, districts in states with permanent registration can access the existing statewide registration database to confirm the individual is registered elsewhere in the state; in Florida and Delaware, poll workers processing change-of-address registrations contact the county supervisor-of-elections, who checks the database.62 Updates to the registration database can be made after Election Day, much in the same way as change-of-address registrations are processed in New York State before Election Day. To prevent “double voting”, or voting in both the old and new precinct, a record is created in the statewide database indicating that the voter in fact voted at the new polling place.63 The practice of submitting a provisional ballot at either the old or new site also prevents voter fraud, albeit adding an extra administrative cost. In New York, the current system of registration requires eligible voters to register with the Board Of Elections twenty-five days before Election Day to be eligible to vote.64 Election Day registration would eliminate the obstacle of advanced registration by allowing eligible voters to register and vote on the same day. Using data from the 2000 Current Population Survey, researchers at Demos estimated that implementation of Election Day registration in New York would increase turnout by the following: 12.3 percentage points among 18-to-25-year-olds; 9.8 percentage points among those with a grade school education or less; 11 percentage points
* Idaho, Iowa, Maine, Minnesota, Montana, New Hampshire, Wisconsin, and Wyoming. † North Carolina and Ohio ‡ Delaware, Florida, Oregon, Maryland, Ohio, Colorado, South Dakota, and Washington

20
among Latinos; 8.7 percentage points among African Americans; 10.1 percentage points among those who have lived at their current address for less than six months; and 12.2 percentage points among naturalized citizens.65
Recommendation: To improve voter turnout rates, the CFB should promote legislation to enable eligible New Yorkers to register on Election Day. This will lead to increased participation and turnout by making the voting process easier, specifically for those who have difficulty maintaining an up-to-date voter registration record, such as those who have moved since the last election. Other beneficiaries of this reform would include many of the underrepresented voters highlighted in our research, such as youth and historically franchised voters.66 Additionally, registration deadlines typically close within two weeks of the election, however this is the time span when individuals become the most interested in campaigns and therefore miss the opportunity to vote.67 Election Day registration is intended to improve accessibility in the voting process and thus civic participation. Simplify the Ballot According to the BOE, a frequent complaint among voters, civic groups, and elected officials regarding voting in the 2010 election related to the instructions on the paper ballots. BOE states that New York’s ballot has been described as cluttered and difficult to read, and an overly complicated ballot was named in the CBO Survey as being a hindrance to voting in NYC. In addition, an online voter survey done by the New York City Council immediately after the 2010 general election showed ballot design as the prevailing complaint at the polls.68 The difficulty and frustrations New Yorkers experienced with the ballot in 2010 will likely discourage future voting, both by those who experienced it and by the friends and family who were told of voter’s troubles. Since New York’s ballot design was written for the no longer operating mechanical level voting machines, the mandated instructions are out of date and confusing to use with the new electronic voting machines. The Brennan Center for Justice at NYU has found that poorly designed ballots and instructions disproportionately affect low-income voters, new voters, and elderly voters. 69 Complicated ballots lead to declines in turnout because of voter confusion and frustration, increased error rates, long lines at polling places and less confidence in the voting process70 – all factors in decreased voter turnout. In order to address this issue, the BOE recommended to the Governor and the State’s Legislature in 2011 to amend the State Election Law Section 7-106(5)(2) to clarify the instructions to voters on filling in the oval or square above or next to the candidate.* This amendment and more to help voters would be accomplished with “The Voter Friendly Ballot Act” of 2011 (A7492-A) a bill sponsored by Assembly Member Brian Kavanagh and supported by the NYU’s Brennan Center, the Usability Professionals Association, and AIGA, the Professional Association for Design. Recommendation: We recommend that the CFB support efforts to pass the Voter Friendly
* Details of this recommendation, along with a statement of support from the BOE, can be found at http://www.vote.nyc.ny.us/pdf/documents/boe/MessageToVoters/ElectionLaw2011Part1.pdf. This recommendation was put forth again in the 2012 Recommended Revisions in the New York State Election Law.

21
Ballot Act. The proposed changes of this act will lead to positive voting experience among residents and higher turnout. According to the bill’s justification,*the Voter Friendly Ballot Act will create a straightforward ballot, thus making voting easier, giving voters confidence and a positive feeling about voting. The Voter Friendly Ballot Act will create a straightforward ballot and increase turnout by making voting easier, giving voters confidence and a positive feeling about voting.
* This description is found in the legislative justification for A07492, as written by the New York State Assembly. A memo on the bill, including the justification, is available at http://assembly.state.ny.us/leg/?default_fld=&bn=A07492&term=2011&Memo=Y

22
Areas Of Further Research
The above recommendations reflect our empirical and qualitative research findings, but are not exhaustive. They could be further developed or supplemented with insight from more research. The CFB could further enhance its understand of voting and non-voting populations by analyzing multiple elections with panel data regressions analysis. Future research could also explore turnout amongst registered voters in particular. It may also be useful to perform cost-benefit analyses of the structural reforms.
23
CONCLUSION Our analyses of the 2008 and 2009 election results in New York City illustrate the factors that impact voter participation rates in New York City. The Voter Assistance Unit’s next steps should target individuals between the ages of 18 and 29, males, people with low educational attainment, U.S. citizens who were born abroad, and married households. Our analysis also highlighted the importance of voter registration and voter mobilization campaigns in neighborhoods with poor access to transportation or with higher residential turnover. By implementing our recommendations, the CFB will be able launch a robust citywide voter assistance strategy that effectively targets the underrepresented groups of the city’s population.

24
APPENDIX A: DATA SOURCES
This study analyzes voter history data and population characteristics aggregated from two sources. For the number of New York City voters in the 2008 and 2009 general elections, we used New York City’s Board of Elections’ (BOE) voter history rolls. For socioeconomic and demographic characteristics by census tract, we used the Census Bureau’s 2006-2010 American Community Survey (ACS) Five-Year Estimates. The BOE data came from two separate files. One file lists all past voters in a borough and includes an individual’s voter ID, address, last year voted, gender, and party affiliation. The other includes individual voter IDs and lists every year that individual voted in New York City. Our first step in creating the dataset for our analysis was to link these two files through the Voter ID number so we could connect addresses to turnout. Then, we linked voter turnout to the 2010 census tracts, the unit of analysis for this study. The 2006-2010 ACS data provides estimates of population characteristics for 2010 census tracts. The Census Bureau generates these estimates through household surveys that it conducts over the 60-month period from January 1 2006 through December 31 2010. The estimates are averages taken over this period of time as opposed to a snapshot of the population in any particular year.100 Since the BOE files only include information about gender, birth year, last year voted, and party affiliation, they lack the variables required to explore important demographic and socioeconomic associations with voter turnout. This required use the Census Bureau’s ACS 5-year estimates to analyze characteristics associated with voter turnout at the census tract level.
25
APPENDIX B: STATISTICAL METHODS
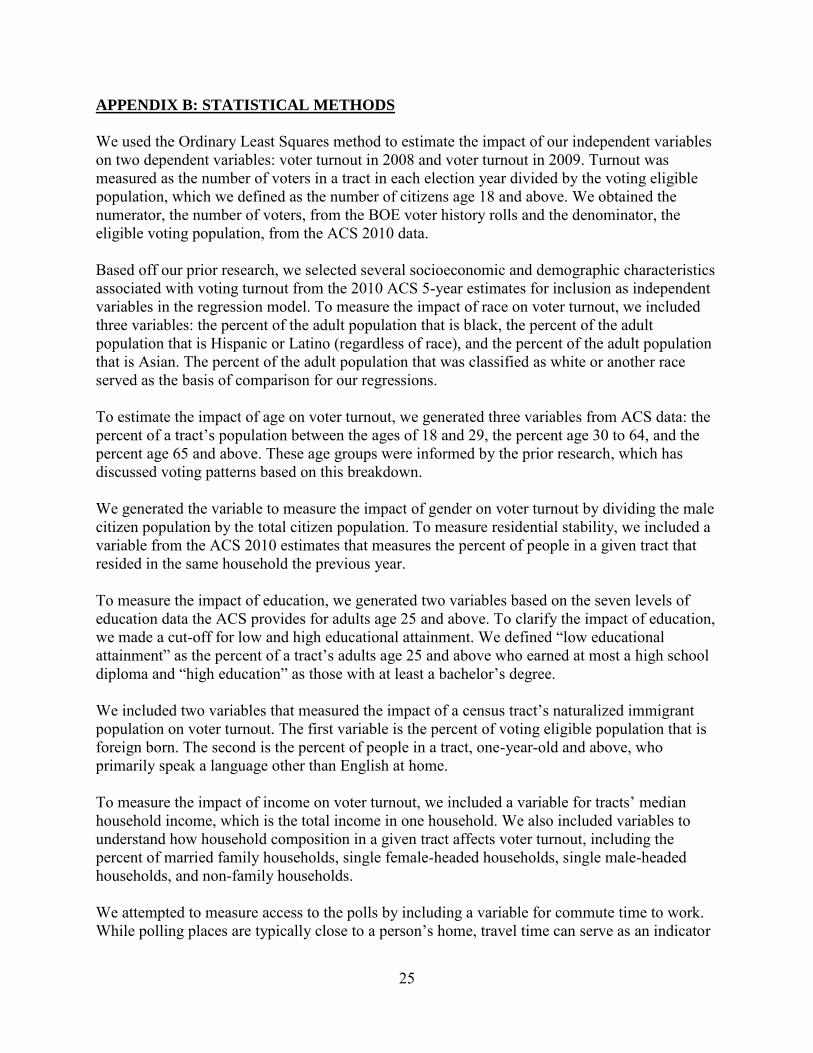
We used the Ordinary Least Squares method to estimate the impact of our independent variables on two dependent variables: voter turnout in 2008 and voter turnout in 2009. Turnout was measured as the number of voters in a tract in each election year divided by the voting eligible population, which we defined as the number of citizens age 18 and above. We obtained the numerator, the number of voters, from the BOE voter history rolls and the denominator, the eligible voting population, from the ACS 2010 data. Based off our prior research, we selected several socioeconomic and demographic characteristics associated with voting turnout from the 2010 ACS 5-year estimates for inclusion as independent variables in the regression model. To measure the impact of race on voter turnout, we included three variables: the percent of the adult population that is black, the percent of the adult population that is Hispanic or Latino (regardless of race), and the percent of the adult population that is Asian. The percent of the adult population that was classified as white or another race served as the basis of comparison for our regressions. To estimate the impact of age on voter turnout, we generated three variables from ACS data: the percent of a tract’s population between the ages of 18 and 29, the percent age 30 to 64, and the percent age 65 and above. These age groups were informed by the prior research, which has discussed voting patterns based on this breakdown. We generated the variable to measure the impact of gender on voter turnout by dividing the male citizen population by the total citizen population. To measure residential stability, we included a variable from the ACS 2010 estimates that measures the percent of people in a given tract that resided in the same household the previous year. To measure the impact of education, we generated two variables based on the seven levels of education data the ACS provides for adults age 25 and above. To clarify the impact of education, we made a cut-off for low and high educational attainment. We defined “low educational attainment” as the percent of a tract’s adults age 25 and above who earned at most a high school diploma and “high education” as those with at least a bachelor’s degree. We included two variables that measured the impact of a census tract’s naturalized immigrant population on voter turnout. The first variable is the percent of voting eligible population that is foreign born. The second is the percent of people in a tract, one-year-old and above, who primarily speak a language other than English at home. To measure the impact of income on voter turnout, we included a variable for tracts’ median household income, which is the total income in one household. We also included variables to understand how household composition in a given tract affects voter turnout, including the percent of married family households, single female-headed households, single male-headed households, and non-family households. We attempted to measure access to the polls by including a variable for commute time to work. While polling places are typically close to a person’s home, travel time can serve as an indicator

26
for lack of general access to services, perhaps even voter outreach efforts. The ACS includes a variable for a tract’s average travel time to work, measured in minutes. Finally, in an effort to measure the impact of civic engagement on voting, we included a variable that captured the government workers in a tract, which the ACS provides as a percentage of people age 16 an above.
Explanation of independent variables used in the regressions
Variable Description
% Black Percent of population age 18 and older who are black only % Asian Percent of population 18 and older who are Asian only % Hispanic or Latino Percent of population ages 18 and older who are Hispanic or Latino
% White, non-Hispanic Percent of population 18 and older who are non-Hispanic white
% Male Percent of citizens 18 and older who are male
% 18-29 years Percent of 18 and older who are between 18 and 29 years old
% 30-64 Percent of 18 and older who are between 30 and 64 years old
% 65 years and older Percent of 18 and older who are older than 65 years old
% Same residence 1 year ago Percent of population one year old that lived in the same house one year ago
% High school education or less Percent of population ages 25 and older with at most a high school diploma (includes less
than 9th grade, 9th-12th with no diploma, and high school diploma or equivalency)
% English not primary language Percent of population 5 years and older that speaks a language other than English as the primary language in the home
% Naturalized Percent of citizens 18 and older who have been naturalized Travel time to work Average travel time to work for population 16 years and older who work outside the
home
% Government workers Percent of the civilian population age 16 and older that works for the government
% Single-female families Percent of households that are families headed by a female, no husband present
% Single-male families Percent of households that are families headed by a male, no wife present
% Married families Percent of households that are married couple families
% Nonfamily households Percent of households in which no one is related

27
APPENDIX C: COMMUNITY BASED ORGANIZATION (CBO) SURVEY
A self-administered 13 open-ended question web-based Survey (see exhibit 1) was emailed to 30 New York-based non-profits to solicit feedback on voter turnout strategies in New York. The questionnaire was uploaded to a website and respondents were invited to respond to the questionnaire. With a response rate of 43%, the Survey allowed us to inform many of the forthcoming recommendations. That said, we do acknowledge that there may be weaknesses with this method of data collection such as the high incidence of bias (responses come from only those organizations that self selected or opted to take and submit the survey) and the relatively small sample size of 13. Therefore, the Survey results are used exclusively as generalizations in the context of our study.
28
APPENDIX D: DESCRIPTIVE STATISTICS
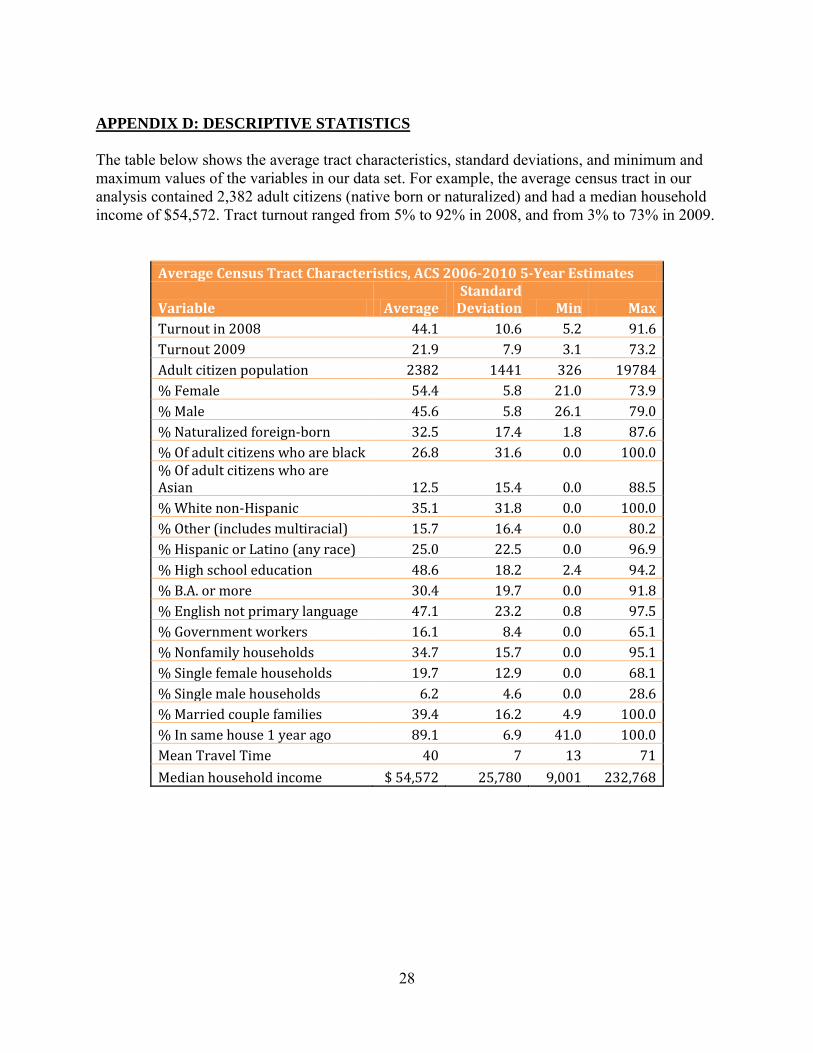
The table below shows the average tract characteristics, standard deviations, and minimum and maximum values of the variables in our data set. For example, the average census tract in our analysis contained 2,382 adult citizens (native born or naturalized) and had a median household income of $54,572. Tract turnout ranged from 5% to 92% in 2008, and from 3% to 73% in 2009.
Average Census Tract Characteristics, ACS 2006-2010 5-Year Estimates
Variable Average Standard
Deviation Min Max
Turnout in 2008 44.1 10.6 5.2 91.6
Turnout 2009 21.9 7.9 3.1 73.2
Adult citizen population 2382 1441 326 19784
% Female 54.4 5.8 21.0 73.9
% Male 45.6 5.8 26.1 79.0
% Naturalized foreign-born 32.5 17.4 1.8 87.6
% Of adult citizens who are black 26.8 31.6 0.0 100.0 % Of adult citizens who are Asian 12.5 15.4 0.0 88.5
% White non-Hispanic 35.1 31.8 0.0 100.0
% Other (includes multiracial) 15.7 16.4 0.0 80.2
% Hispanic or Latino (any race) 25.0 22.5 0.0 96.9
% High school education 48.6 18.2 2.4 94.2
% B.A. or more 30.4 19.7 0.0 91.8
% English not primary language 47.1 23.2 0.8 97.5
% Government workers 16.1 8.4 0.0 65.1
% Nonfamily households 34.7 15.7 0.0 95.1
% Single female households 19.7 12.9 0.0 68.1
% Single male households 6.2 4.6 0.0 28.6
% Married couple families 39.4 16.2 4.9 100.0
% In same house 1 year ago 89.1 6.9 41.0 100.0
Mean Travel Time 40 7 13 71
Median household income $ 54,572 25,780 9,001 232,768
29
APPENDIX E: FULL REGRESSION RESULTS
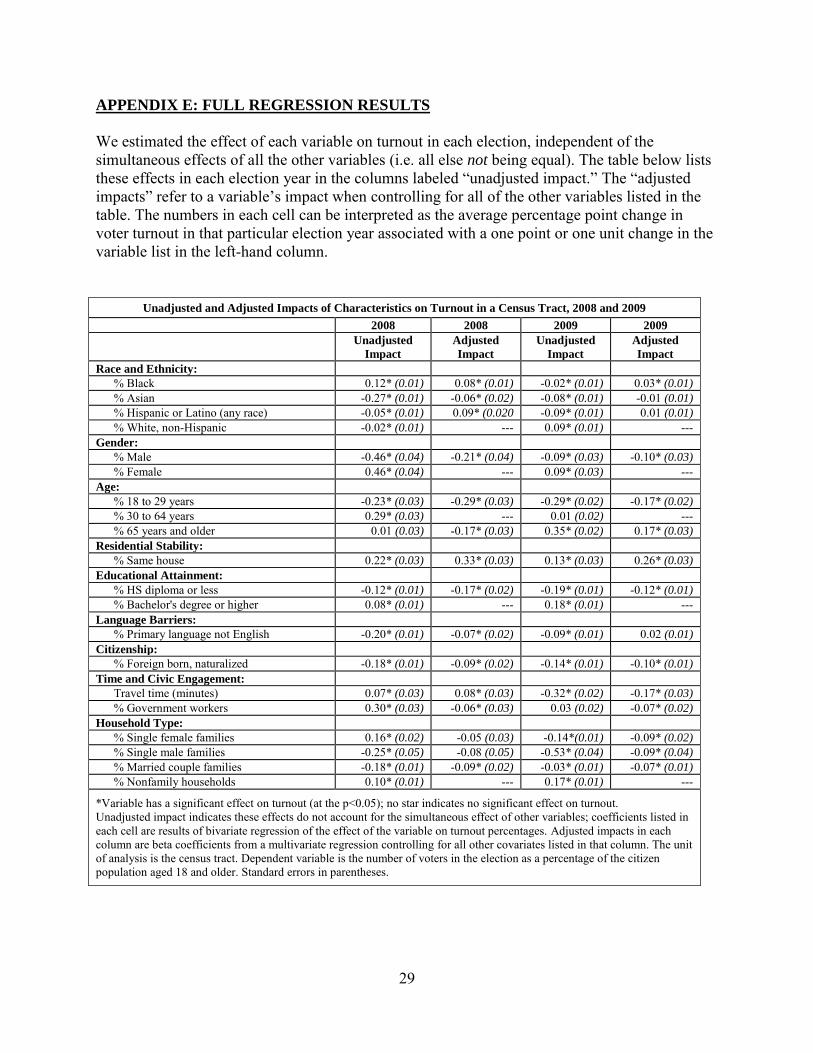
We estimated the effect of each variable on turnout in each election, independent of the simultaneous effects of all the other variables (i.e. all else not being equal). The table below lists these effects in each election year in the columns labeled “unadjusted impact.” The “adjusted impacts” refer to a variable’s impact when controlling for all of the other variables listed in the table. The numbers in each cell can be interpreted as the average percentage point change in voter turnout in that particular election year associated with a one point or one unit change in the variable list in the left-hand column.
Unadjusted and Adjusted Impacts of Characteristics on Turnout in a Census Tract, 2008 and 2009
2008 2008 2009 2009
Unadjusted
Impact
Adjusted
Impact
Unadjusted
Impact
Adjusted
Impact
Race and Ethnicity: % Black 0.12* (0.01) 0.08* (0.01) -0.02* (0.01) 0.03* (0.01)
% Asian -0.27* (0.01) -0.06* (0.02) -0.08* (0.01) -0.01 (0.01)
% Hispanic or Latino (any race) -0.05* (0.01) 0.09* (0.020 -0.09* (0.01) 0.01 (0.01)
% White, non-Hispanic -0.02* (0.01) --- 0.09* (0.01) --- Gender:
% Male -0.46* (0.04) -0.21* (0.04) -0.09* (0.03) -0.10* (0.03)
% Female 0.46* (0.04) --- 0.09* (0.03) --- Age:
% 18 to 29 years -0.23* (0.03) -0.29* (0.03) -0.29* (0.02) -0.17* (0.02)
% 30 to 64 years 0.29* (0.03) --- 0.01 (0.02) --- % 65 years and older 0.01 (0.03) -0.17* (0.03) 0.35* (0.02) 0.17* (0.03)
Residential Stability: % Same house 0.22* (0.03) 0.33* (0.03) 0.13* (0.03) 0.26* (0.03)
Educational Attainment: % HS diploma or less -0.12* (0.01) -0.17* (0.02) -0.19* (0.01) -0.12* (0.01)
% Bachelor's degree or higher 0.08* (0.01) --- 0.18* (0.01) --- Language Barriers:
% Primary language not English -0.20* (0.01) -0.07* (0.02) -0.09* (0.01) 0.02 (0.01)
Citizenship: % Foreign born, naturalized -0.18* (0.01) -0.09* (0.02) -0.14* (0.01) -0.10* (0.01)
Time and Civic Engagement: Travel time (minutes) 0.07* (0.03) 0.08* (0.03) -0.32* (0.02) -0.17* (0.03)
% Government workers 0.30* (0.03) -0.06* (0.03) 0.03 (0.02) -0.07* (0.02)
Household Type: % Single female families 0.16* (0.02) -0.05 (0.03) -0.14*(0.01) -0.09* (0.02)
% Single male families -0.25* (0.05) -0.08 (0.05) -0.53* (0.04) -0.09* (0.04)
% Married couple families -0.18* (0.01) -0.09* (0.02) -0.03* (0.01) -0.07* (0.01)
% Nonfamily households 0.10* (0.01) --- 0.17* (0.01) ---
*Variable has a significant effect on turnout (at the p<0.05); no star indicates no significant effect on turnout. Unadjusted impact indicates these effects do not account for the simultaneous effect of other variables; coefficients listed in each cell are results of bivariate regression of the effect of the variable on turnout percentages. Adjusted impacts in each column are beta coefficients from a multivariate regression controlling for all other covariates listed in that column. The unit of analysis is the census tract. Dependent variable is the number of voters in the election as a percentage of the citizen population aged 18 and older. Standard errors in parentheses.

30
APPENDIX F: COMMUNITY DISTRICT PROFILES
To support the CBO partnership recommendation, we identified the census tracts consistently in the bottom 10th percentile of voter turnout for both 2008 and 2009. We have highlighted these areas in the map below. We believe these census tracts that had consistently low voter turnout can be used as a guide for the CFB’s outreach strategies and serve as starting points for possible partnerships.
Since census tracts are a relatively small unit of analysis, this map overlays New York City’s community districts (CD) on the clusters of low voter turnout census tracts. By associating these low voter turnout areas with a CD, the CFB will not only be able to recruit the assistance of CBOs but also can enlist the help of the associated Community Board. We have created a few community district profiles that can be used to support efforts to increase civic engagement in these communities. We have highlighted Community Districts 1 and 2xvi in the Bronx as well as
xvi For New York City and its five boroughs, the ACS makes it possible to obtain an annual update of characteristics for each of 55 Census designated Public Use Microdata Areas (PUMA), which approximate NYC Community Districts. Bronx community districts 1 and 2 denote geographic area, PUMA 03710 of the Bronx, NY. Community District 1 is comprised of Mott Haven, Melrose and Port Morris. Community District 2 is Hunts Point and Longwood.

31
Community District 11 in Brooklyn to illustrate how their profiles and our target groups are related.
Many of the groups that negatively affect voter turnout are represented in these community districts. Most notably, the educational attainment level in Bronx CDs 1 and 2 is lower than New York City overall. In Bronx CDs 1 and 2, 51% of the population has a high school diploma or less while in New York City this subgroup comprises just 36% of the population. Moreover, 22% of the population for Bronx CDs 1 and 2 has only completed school up to 9th grade. Eight percent has a bachelor’s degree or higher, which is 26 percentage points lower than New York City. These characteristics strengthen the incentive to partner with local community organizations as the target groups indentified at the census tract level are represented at the community district level as well. Lastly, as noted previously, educational attainment and income are highly correlated. Though it is not included in our regression, it is important to observe that median household income in Bronx CDs 1 and 2 is $19,982, which is 64% lower than the city on the whole. Residential stability was found to have one of the biggest effects on voter turnout in 2008 and 2009. Though percentage of the population that lived in the same house one year ago is around 80% for Bronx CDs 1 and 2, 18.2% of the population lived in a different residence one year ago. This is almost 50% greater than New York City overall. This supports the importance of GOTV strategies that directly target these transient groups and reduce the apparent barriers to registering new addresses. In Bronx CDs 1 and 2, a large percentage of the population does not speak English as their primary language. This group comprises almost 70% of the two community districts, which is 27% greater than New York City overall. Since percent “not English speaking” is correlated with other factors that were controlled for in our analysis, this is likely an explanation for why this variable did not become significant in our regression. However, our research has shown that addressing language diversity among groups of different racial and ethnic backgrounds is also crucial when mobilizing voters. Studies have shown the use bilingual phone bank volunteers increased turnout by three percentage points and multi-language postcard reminder increased turnout by two percentage points.101 By understanding these language barriers, the CFB can effectively improve voter participation.

32
APPENDIX G: LIMITATIONS
This analysis was limited by the fact that we could not obtain individual-level data for the socioeconomic characteristics whose impact on voter turnout we attempted to study. We addressed this by using the smallest geographic area for which our variables of interest were available, the census tract. Still, interpreting associations between our independent variables and voter turnout for a geographic area instead of for an individual is more complicated and nuanced. In addition to the interpretation issue, the ACS 5-year socioeconomic estimates at the Census tract-level are subject to sampling error. The Census Bureau’s collection methods for these particular variables changed since the 2000 Census, which collected this household information on a long-form. In comparison, the ACS 5-year estimates are generated from a smaller sample size, meaning that the probability of error in making predictions about the population is higher. While about 1 in 6 households received the 2000 Census long form, only 1 in 8 households received the 5-year ACS estimates for 2010 and since not all of them returned the survey, data is only collected for about 1 in 11 households.102 As a result, some have found that the ACS 5-year estimates have margins of error that are 1.75 times as large as that of the Census.103 Moreover, the ACS 5-year estimates include some inaccuracies because they represent sample averages over a period, which can be problematic for areas that undergo change. It is likely that this introduced some error into our population estimates since some NYC neighborhoods have changed quite a bit over this period. The last year (2010) may be very different from the first year (2006) and the average over 5 years may not be an accurate picture of the population close to the election years (2008 and 2009). We were also limited to the variables that Census Bureau selected to measure. For instance, the survey did not ask about voter registration status, which would have been a useful dimension in our analysis. Other associations with voter turnout highlighted in the literature but excluded from ACS 5-year estimates included religion, union membership, and criminal history. Presence of a disability was mentioned in the literature and captured in the ACS data, but since the percentage in a given tract was so small, it did not make sense to include for this level of analysis.104
We lacked a variable to measure involvement in a religious institution, which the literature associated with voting.105 Some studies also found that the effect of voting in one election greatly increases the likelihood of voting in a subsequent election, and is stronger than education, age, and other leading demographic and socio-political predictors.106 However, we could not measure this impact. Finally, we lacked a variable to capture the effect of apathy, yet many citizens report they do not vote because they lack interest.107 There also may have been minor specification errors. We defined the population of eligible voters as all citizens age 18 and above in each Census tract although this includes those ineligible to vote due to incarceration or parole status. Finally, while the Board of Elections data is not sample data and thus lacks the probability error associated with the ACS estimates, it does have some non-sampling error due to inaccuracies. For example, according to the BOE data, some voters’ birthdates indicated they were at least 150 years old, suggesting there are some errors. Additionally, if we were unable to match an ID from a voter who voted in 2008 and/or 2009 with an address, we could not assign that voter a census

33
tract and thus they would not have been included in our voter totals. Despite the non-sampling error, this was our best source of official individual level data available.
Furthermore, the results of our regression analysis indicated that demographic and socioeconomic characteristics only predicted 39% of the variation in turnout rates across New York City. This supports our prior research that identifies many other reasons that are tied to lower voter participation that cannot be measured in this type of analysis. There are wide varieties of reasons documented in prior research regarding why Americans do not vote: lack of interest, a feeling that their vote does not matter, or a distrust of politics and politicians. It is important to keep these reasons in mind when creating recommendations for both structural changes to the elections system and Get Out the Vote efforts.

34
Endnotes
1 New York City Campaign Finance Board. “2010-2011 Voter Assistance Annual Report.” April 2011. http://www.nyccfb.info/PDF/var/2010-2011%20Voter%20Assistance%20Annual%20Report.pdf 2 New York City Board of Elections. “Annual Report 2010.” Accessed on April 20, 2012. http://www.vote.nyc.ny.us/pdf/documents/boe/AnnualReports/BOEAnnualReport10.pdf 3 Hess, Douglas. “Representational Bias in the 2006 Electorate.” September 2007. 4 Fitzgerald, Mary. “Greater Convenience but Not Greater Turnout: The Impact of Alternative Voting Methods on Electoral Participation in the United States.” American Politics Research. October 2005. 33:842-67. 5 “Benefits of Voting.” nonprofitvote.org. 2011. Web. 17 Feb. 2012 6 Hess, Douglas. And Jody Herman. “Representational Bias in the 2008 Electorate.” Project Voter. November 2009. http://projectvote.org/images/publications/Reports%20on%20the%20Electorate/Representational%20Bias%20in%20the%202008%20Electorate/Representational%20Bias%20in%20the%202008%20Electorate.pdf 7 Center for Information and Research on Civic Learning and Engagement. “Civic Engagement Among Registered Voters and Non-Registered Eligible Citizens.” October 17, 2010. http://www.civicyouth.org/civic-engagement-among-registered-voters-and-non-registered-eligible-citizens/ 8 Baptiste, Jessica. “Why Young People Don’t Vote.” The Ticker. September 24, 2004. from http://www.theticker.org/2.10633/why-young-people-don-t-vote-1.1417519#.TtRKSRywNwd 9 Young Voter Strategies. Press Release: Young Voter Turnout Up for the Second Major Election in a Row. November 8, 2006. Available at: http://jade.orchidsuites.net/eangel/clients/youngvoterstrategies-org/index.php?tg=articles&idx=More&topics=37&article=282 10 Stein, R., Leighley, J., and Owens, C. “Who Votes, Who Doesn’t, Why, and What Can Be Done? A Report to the Federal Commission on Electoral Reform.” June 10, 2005 http://www1.american.edu/ia/cfer/0630test/stein.pdf 11 Nover, A., Godsay, S., Kirby, E., Kawashima-Ginsberg, K. “Fact Sheet: Electoral Engagement and College Experience.” Center for Information and Research on Civic Learning and Engagement. 2010. http://www.civicyouth.org/PopUps/FactSheets/FS_08_Educ_Voting.pdf 12 Stein, 2005. 13 Pew Research. “Who Votes, Who Doesn't, and Why: Regular Voters, Intermittent Voters, and Those Who Don't.” 2006. http://www.people-press.org/2006/10/18/who-votes-who-doesnt-and-why/. 14 Center for American Women and Politics. “Gender Differences in Turnout.” Eagleton Institute of Politics, Rutgers University. 2011. http://www.cawp.rutgers.edu/fast_facts/voters/documents/genderdiff.pdf 15 Hess, D. & Herman, J, 2009. 16 Beveridge, Andrew. “New York City is a Non-Voting Town.” Gotham Gazette. August 2004. http://www.gothamgazette.com/article/demographics/20040811/5/1083. 17 Stein, 2005. 18 Pew Research, 2006. 19 DeSipio, L. “Latino Civic Political Participation.” National Academy of Sciences. 2006. http://www.ncbi.nlm.nih.gov/books/NBK19906/. 20 Gyory, B. “Minority Rules.” City and State. June 17, 2011 http://www.cityhallnews.com/2011/06/minority-rules/ 21 Stein, 2005. 22DeSipio, 2006. 23 Center for Information and Research on Civic Learning and Engagement.“The Youth Vote in 2010: Final Estimates Based on Census Data.” April 15, 2011. http://www.civicyouth.org/wp-content/uploads/2011/04/The-CPS-youth-vote-2010-FS-FINAL1.pdf. 24 Stein, 2005. 25 Stein, 2005. 26 Harris, F. (1994). Something Within: Religion as a Mobilizer of African-American Political Activism. Journal of Politics, 56(1), 42-68 27Roberts, S. “For First Time, Minority Vote was a Majority.” New York
Times. December 25, 2009. http://www.nytimes.com/2009/12/26/nyregion/26vote.html 28 Yakupitiyage, T. “Immigrant New Yorkers Mobilize to Get out the Vote and Demonstrate their Electoral Power.” New York Immigration Coalition. October 18, 2010. http://www.thenyic.org/node/260

35
29 Squire, Peverill, Raymond Wolfinger, and David Glass. “Residential Mobility and Voter Turnout.” American
Political Science Association. 1987. http://ir.uiowa.edu/cgi/viewcontent.cgi?article=1095&context=polisci_pubs&sei-redir=1&referer=http%3A%2F%2Fwww.google.com%2Furl%3Fsa%3Dt%26rct%3Dj%26q%3Dvoter%2520turnout%2520and%2520moving%26source%3Dweb%26cd%3D1%26ved%3D0CDYQFjAA%26url%3Dhttp%253A%252F%252Fir.uiowa.edu%252Fcgi%252Fviewcontent.cgi%253Farticle%253D1095%2526context%253Dpolisci_pubs%26ei%3Dl2KUT6_XJMe_6AHI7fGEBA%26usg%3DAFQjCNHxTKl1acd_SmS9O4ESIdjTcd1IpA%26sig2%3Dol1OFnAb58YWIPE7AdLYnQ#search=%22voter%20turnout%20moving%22 30 Highton, Benjamin. “Residential Mobility, Community Mobility, and Electoral Participation.” Political Behavior
22 (2000): 109-120 http://faculty.psdomain.ucdavis.edu/bhighton/pubs-and-papers/pubs-and-papers/2000_polbeh_mobility.pdf 31 Highton, 2000. 32 Center for Information and Research on Civic Learning and Engagement (CIRCLE). “Civic Engagement Among Registered Voters and Non-Registered Eligible Citizens.” October 17, 2011 http://www.civicyouth.org/civic-engagement-among-registered-voters-and-non-registered-eligible-citizens/ 33 Kerrissey, J. Schofer, E. “Union Membership and Political Participation in the United States.” University of California Irvine, Department of Sociology. 2010. http://worldpolity.files.wordpress.com/2010/05/kerrissey-schofer-unions-and-political-participation-5-11-10.pdf 34 Pew Research, 2006 35 Common Cause. “Voter Registration” Accessed April 26, 2012. <http://www.commoncause.org/site/pp.asp?c=dkLNK1MQIwG&b=4923169> 36 The Center for Information and Research on Civic Learning and Engagement. “Youth Voting.” 2010. Accessed on May 3, 2012. http://www.civicyouth.org/quick-facts/youth-voting/ 37 US Census Bureau. “Current Population Survey, November 2010 Voting And Registration Supplement File” November 2010. Web. 22. Mar. 2012 <http://www.census.gov/apsd/techdoc/cps/cpsnov10.pdf> 38 New York City Campaign Finance Board, April 2011. 39 Larooca, Roger and John S. Klemanski. “U.S. State Election Reform and Turnout in Presidential Elections.” State
Politics & Policy Quarterly. February 2011. 11: 76-101 40 Board of Elections in the City of New York. "Absentee Voting." Accessed March 22, 2012. http://vote.nyc.ny.us/absentee.html 41 The Pew Center on the States. “Early and Absentee Voting Policies.” Accessed March 22, 2012. 42 Larocca & Klemanski (2011) 43 Larocca & Klemanski (2011) 44 Wolfinger, Raymond E. and Jonathan Hoffman. “Registering and Voting with Motor Voter.” PS: Political
Science & Politics. March 2001. 34:85-92. 45 Oliver, J. Eric. “The Effects of Eligibility Restrictions and Party Activity on Absentee Voting and Overall Turnout”. American Journal of Political Science. May 1996. 40:498-513 46 Gronke, Paul, Eva Galanes-Rosenbaum, and Peter A. Miller. “Early Voting and Voting.” PS: Political Science &
Politics. October 2007. 40:639-45. 47 Gans, Curtis. “Making it Easier Doesn’t Work: No Excuse Absentee and Early Voting Hurt Voter Turnout; Create Other Problems.” Committee for the Study of American Electorate. September 2004. Press Release. Washington, DC: CSAE <http://www1.american.edu/ia/cfer/research/csae_09132004.pdf> 48 Fitzgerald, Mary. “Greater Convenience but Not Greater Turnout: The Impact of Alternative Voting Methods on Electoral Participation in the United States.” American Politics Research. October 2005. 33:842-67 49 Committee on Election Law. “Instituting No-Excuse Absentee Voting in New York”. New York City Bar. May 2010. http://www.nycbar.org/pdf/report/uploads/20071936-NoExcuseAbsenteeBallotReport.pdf 50 Gronke, 2007. 51 Carbo, Steven. “Testimony in Support of Same Day Registration in Connecticut, Steven Carbo.” Demos. March 1, 2012. http://www.demos.org/publication/testimony-support-same-day-registration-connecticut-steven-carbo 52 Weiser, Wendy R. and Lawrence Norden, “Voting Law Changes In 2012. Publications.” The Brennan Center. October 2011. Http://Brennan.3cdn.Net/92635ddafbc09e8d88_I3m6bjdeh.Pdf 53 Weiser. Brennan Center For Justice, “Modernizing Voter Registration: Momentum In The States” (2010), http://Www.Brennancenter.Org/Page/-/Democracy/Vrm%20state%20trends%20final.Pdf?Nocdn=1 54 Weiser and Norden, 2011. 55 Skaggs, Adam and Jonathan Blitzer. “Permanent Voter Registration.” Brennan Center for Justice. 2009.

36
56 Skaggs and Blitzer, 2009. 57 Weiser and Norden, 2011. 58 Carbo, 2012. 59 Demos. “Fact Sheet: Same Day Registration.” Accessed on May 3, 2012 http://www.demos.org/sites/default/files/publications/EDR_factsheet.pdf 60 Alvaraz, R. Michael; Nagler, Jonathan; and Catherine Wilson. “Making Voting Easier: Election Day Registration In New York.” Demos. (2004) http://www.demos.org/publication/edr-making-voting-easier-election-day-registration-new-york 61 Weiser and Norden, 2011. 62 Skaggs and Blitzer, 2009. 63 Skaggs and Blitzer, 2009. 64New York City Board of Elections. “New York State Voter Registration Form.” http://www.elections.ny.gov/nysboe/download/voting/voteform.pdf. 65 Alvaraz, Nagler, and Wilson, 2004 66 Demos. “Fact Sheet: Same Day Registration,” 2012. 67 SPUR. “Prop E – Election Day Voter Registration”. Accessed on April 26, 2012. http://www.spur.org/goodgovernment/ballotanalysis/Nov2010/prope 68 The Council of the City of New York Office of Communications Press Release. “City Council’s Online Voter Survey Shows Ballot Design as Prevailing complaint at the Polls” November 9, 2010. http://council.nyc.gov/html/releases/eday_voter_survey_11_9_10.shtml. 69 Kimball, David & Martha Kropf, “Ballot Design and Unrecorded Votes on Paper-Based Ballots” 69 PUBLIC OPINION QUARTERLY 522-526 (2005) http://poq.oxfordjournals.org/cgi/reprint/69/4/508.pdf; As sited in “Better Ballots” by Norden, Kimball Quesenbery and Chen. 70 Niemi, Richard G. and Paul S. Herrnson. “Ballot Design: How to Improve Life and the Ballot Box.” Spectrum: The Journal of State Government. Summer 2003. Volume: 76 Issue: 3 Page: 35 - 39 100 Census Bureau. “American Community Survey Multiyear Accuracy of the Data.” American Community Survey Office. Sept 2011. http://www.census.gov/acs/www/Downloads/data_documentation/Accuracy/MultiyearACSAccuracyofData2010.pdf 101 Wong, Janelle S. “Mobilizing Asian American Voters: A Field Experiment,” The ANNALS of the American
Academy of Political and Social Science, vol.601 no.1 (2005) pp.102-114 102 Missouri Census Data Center. “American Community Survey.” Last modified October 10, 2011. http://mcdc2.missouri.edu/pub/data/acs/Readme.shtml 103 Sacramento Area Council of Governments. “Update: American Community Survey.” U.S. Census Bureau. Accessed December 2011. http://www.sacog.org/demographics/census-workshops/docs/pdf/ACS%20PowerPoint.pdf slide 42 104 Schur, L., Schields, T. Kruse, D., & Schriner, K. “Enabling Democracy: Disability and Voter Turnout.” Political
Research Quarterly (2002) 55: 167-190 105 CIRCLE, 2011. 106 Gerber, A. Green, D., and Shachar, R. (July 2003). Voting May Be Habit-Forming: Evidence from a Randomized Field Experiment. American Journal of Political Science, (540 – 550). 107 Stein, 2005.