what’s happening? hot topics in equity compensation emily cervino, cep
TRANSCRIPT

What’s Happening?Hot Topics in Equity Compensation
Emily Cervino, CEP

2
What’s Happening in 2013?
Yikes! Potential Implications of 2013 Tax Changes
Pesky Parisians – Changes to French Qualified Awards
Performance Awards: Rewarding Performance or RSUs in Disguise?
Participant Perceptions Perking Up?
No Money Left on the Table
Back In Style: Employee Stock Purchase Plans Turning Heads Again
Revisiting Retirement
Tell It Like It Is: Plan Analytics for Management
Ownership Guidelines
FOR PLAN SPONSOR USE ONLY. NOT FOR PLAN PARTICIPANT DISTRIBUTION.

3
Yikes! 2013 Tax Changes
Effective January 1, 2013, changes in tax rates apply to income from stock option exercises, restricted stock and RSU vesting, non-qualified ESPP purchases, sales of stock, and dividends.
Top federal withholding rate on supplemental income rose to 39.6%. Supplemental income is subject to one of two flat rates that are linked to
income tax rates. For aggregate supplemental wage payments totaling up to $1 million
during the year, the rate is 25% (the rate of the third income tax bracket). For aggregate supplemental wage payments that exceed the level of $1
million in a calendar year, the rate is now 39.6% (the new rate of the highest income tax bracket).
Social Security rate returned to 6.2% up to $113,700 in 2013. Increased Medicare on compensation income for high-income taxpayers
from 1.45% to 2.35% Single > $200,000; Married > $250,000
Indexed the annual AMT income exemption amounts permanently for inflation
New tax legislation did not extend the refundable AMT credit that was available for the tax years 2007 through 2012.
FOR PLAN SPONSOR USE ONLY. NOT FOR PLAN PARTICIPANT DISTRIBUTION.

4
Yikes! More 2013 Tax Changes
New 3.8% Medicare surtax applies to investment income, such as capital gains from stock sales.
Capital gains tax rate that applies to the proceeds from a stock sale increased: To 20% for single filers with income > $400,000 and for married filers
with income > $450,000. (For taxpayers whose yearly income is below these thresholds, the top rate remains 15%.)
Tax rate on dividends increased: To 20% for single filers with income > $400,000 and for married joint
filers with income > $450,000.
FOR PLAN SPONSOR USE ONLY. NOT FOR PLAN PARTICIPANT DISTRIBUTION.

5
Looking Ahead - Potential Implications of 2013 Tax Changes
Taxes are up
Taxes are up on all W-2 income
What are the options?
Stock options offer the ability to time the year for recognizing income
Defer income into the future with RSUs and PSUs
Do ISOs help?
For people in the highest tax bracket, the tax advantages of ISOs compared to NQSOs have been slightly reduced
Continue to offer benefits of lower capital gains vs. income tax rates for qualified dispositions
FOR PLAN SPONSOR USE ONLY. NOT FOR PLAN PARTICIPANT DISTRIBUTION.

6
FOR PLAN SPONSOR USE ONLY. NOT FOR PLAN PARTICIPANT DISTRIBUTION.
*Source: 2012 Global Equity Incentives Survey, PWC and NASPP.
French Qualified Plans – Tax Withholding for French Non-Residents
As of April 1, 2011, participants who are in France during part of the service period, but leave prior to exercise/vest are subject to tax withholding
Qualified awards – Sale
Nonqualified awards – exercise/vest
Managing the withholding
Qualified awards – administrator and payroll
Nonqualified awards – administrator and payroll
39% of companies operate a qualified French free share plan*

7
Changes to French Qualified Awards
On the heels of the July 2012 increase in employer social taxes, French Constitutional Court issued a decision on December 29, 2012 on measures in the 2013 Finance Law: Cancelled some controversial provisions, e.g., proposed increase of social
contributions, which would have gone up from 10% to between 17.5% and 22.5%
Eliminated minimum four-year holding period requirement for “qualified” stock options granted on or after September 28, 2012
– No changes were made to tax and Social Security regime applicable to gains on stock options granted prior to September 28, 2012
– Does not impact holding period requirements for French-qualified RSUs
For “qualified” awards granted on or after September 28, 2012
– Gains realized at exercise or vesting are subject to progressive tax rates of up to 45% at the time of sale (no longer at flat rates)
– Employer is liable for employee and employer social charges when it fails to report gains on annual declaration
FOR PLAN SPONSOR USE ONLY. NOT FOR PLAN PARTICIPANT DISTRIBUTION.

8
Changes to French Qualified Awards –What do they really mean?
French-qualified award income subject to a maximum combined tax rate of approximately 61% (plus existing 3% or 4% surtax for high earners).
Alternative? The combined tax rate for non-qualified award income is 59%.
What companies are doing now: Reviewing and re-thinking French equity programs
Updating French sub-plan and option agreement to remove any references to holding period restrictions
Updating restrictions regarding holding periods
Updating any employee communications, e.g., tax supplements, to address new legislation
FOR PLAN SPONSOR USE ONLY. NOT FOR PLAN PARTICIPANT DISTRIBUTION.

9
Number of Employees<2.5K 2.5K–10K 10K–25K 25K–100K >100K
13 29 21 20 6
Market Capitalization<$1B $1B–$5B $5B–$10B $10B–$25B >$25B
15 28 18 15 10
% of Employees Receiving Performance Award
<1% 1%–5% 5%–10% 10%–15% >15%
47 32 6 3 1
Vesting Years1 year 2 years 3 years 4 years 5 years
18% 23% 51% 7% <1%
Performance Period Years1 year 2 years 3 years 4 years
32% 14% 44% 10%
Fidelity performance award data 89 clients Average participant size: 178
(Ranging from 2–2,439) Payouts over 5 years (’08–’12) 1-year to 3-year plans
Compared payouts to a company’s performance Benchmarked performance against
S&P 500 – focused on TSR & EPS Payout classification:
Payout above target considered high pay Payout below target low pay
Source: Fidelity Stock Plan Services Performance Plan Study, March 2012
Performance Awards: Rewarding Performance or RSUs in Disguise?
FOR PLAN SPONSOR USE ONLY. NOT FOR PLAN PARTICIPANT DISTRIBUTION.

10
Payouts aligned with TSR Performance
72% of the time
R² = 0.1596
0% 25% 50% 75% 100%
Pe
rfo
rma
nc
e S
ha
re P
ayo
ut
TSR Percentile Rank Relative to the S&P 500
TSR Performance Versus S&P 500 (n=106)
Max
Low Performance -High Pay (n= 19)
High Performance -Low Pay (n= 11)
High Performance -High Pay (n= 50)
Low Performance -Low Pay (n= 26)
Target
Performance Plans Align Pay with TSR Performance
Key Conclusions: Payouts are in directional alignment with Total Shareholder Return (TSR) relative to S&P 500 companies Outliers are mainly due to companies measuring performance on metrics other than TSR
Source: Fidelity Stock Plan Services Performance Plan Study, March 2012
Performance Awards: Rewarding Performance or RSUs in Disguise?
FOR PLAN SPONSOR USE ONLY. NOT FOR PLAN PARTICIPANT DISTRIBUTION.

11
R² = 0.2596
0% 25% 50% 75% 100%
Pe
rfo
rma
nc
e S
ha
re P
ayo
ut
EPS Growth Percentile Rank Relative to the S&P 500
EPS Growth Performance Versus S&P 500 (n=87)
Max
Target
Low Performance -High Pay (n= 14)
High Performance -Low Pay (n= 12)
High Performance -High Pay (n= 41)
Low Performance -Low Pay (n= 20)
Performance Plans Align Pay with EPS Growth
Key Conclusions: Payouts are in directional alignment with Earnings Per Share (EPS) growth relative to S&P 500 companies EPS has a stronger statistical correlation to performance compared to TSR, with fewer significant outliers
Payouts aligned with EPS Performance
70% of the time
Source: Fidelity Stock Plan Services Performance Plan Study, March 2012
Performance Awards: Rewarding Performance or RSUs in Disguise?
FOR PLAN SPONSOR USE ONLY. NOT FOR PLAN PARTICIPANT DISTRIBUTION.

12
R² = 0.3559
0% 25% 50% 75% 100%
Pe
rfo
rma
nc
e S
ha
re P
ayo
ut
EPS Growth Percentile Rank Relative to the S&P 500
EPS Growth Performance Versus S&P 500 - 3 Year Plans (n=41)
Max
Target
Low Performance -High Pay (n= 5)
High Performance -Low Pay (n= 7)
High Performance -High Pay (n= 18)
Low Performance -Low Pay (n= 11)
Performance Measurement Period: Implications of Short vs. Longer Term
Key Conclusions: Although there are challenges
with setting longer-term goals, 3-year plans have a stronger pay and performance relationship
Bucked expectation that 1-year performance periods would be better aligned due to goal setting
High Pay rewarded for High Performance
72% of the time
3-year plans have the strongest correlation
between pay and performance
Source: Fidelity Stock Plan Services Performance Plan Study, March 2012
FOR PLAN SPONSOR USE ONLY. NOT FOR PLAN PARTICIPANT DISTRIBUTION.
13
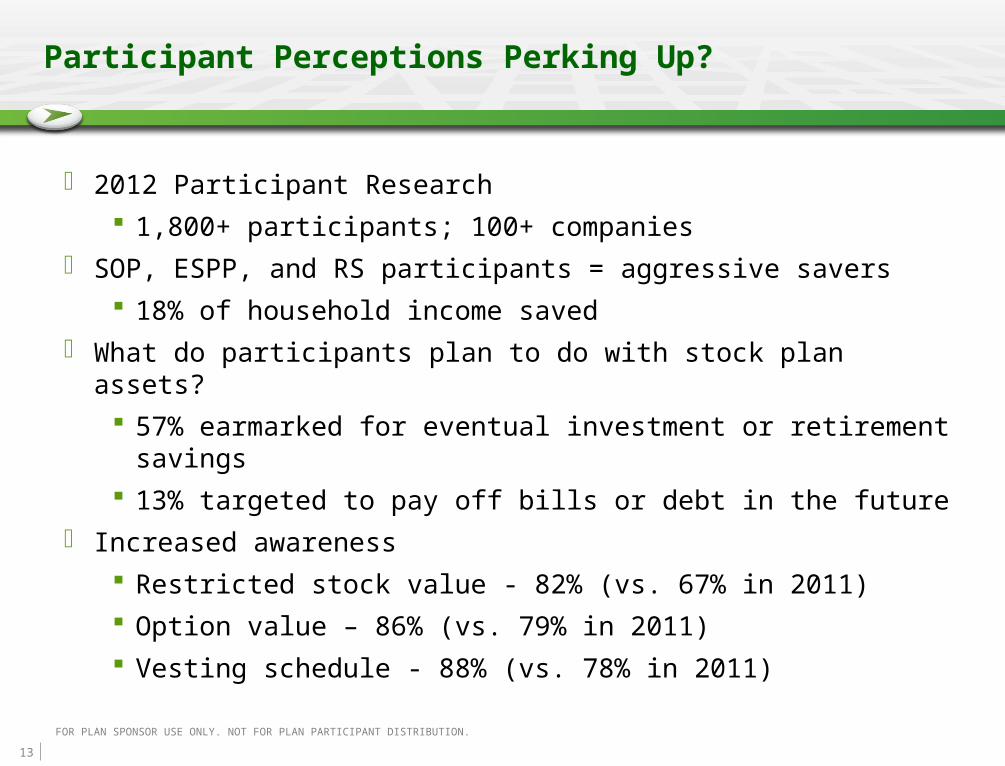
Participant Perceptions Perking Up?
2012 Participant Research
1,800+ participants; 100+ companies
SOP, ESPP, and RS participants = aggressive savers
18% of household income saved
What do participants plan to do with stock plan assets?
57% earmarked for eventual investment or retirement savings
13% targeted to pay off bills or debt in the future
Increased awareness
Restricted stock value - 82% (vs. 67% in 2011)
Option value – 86% (vs. 79% in 2011)
Vesting schedule - 88% (vs. 78% in 2011)
FOR PLAN SPONSOR USE ONLY. NOT FOR PLAN PARTICIPANT DISTRIBUTION.
14
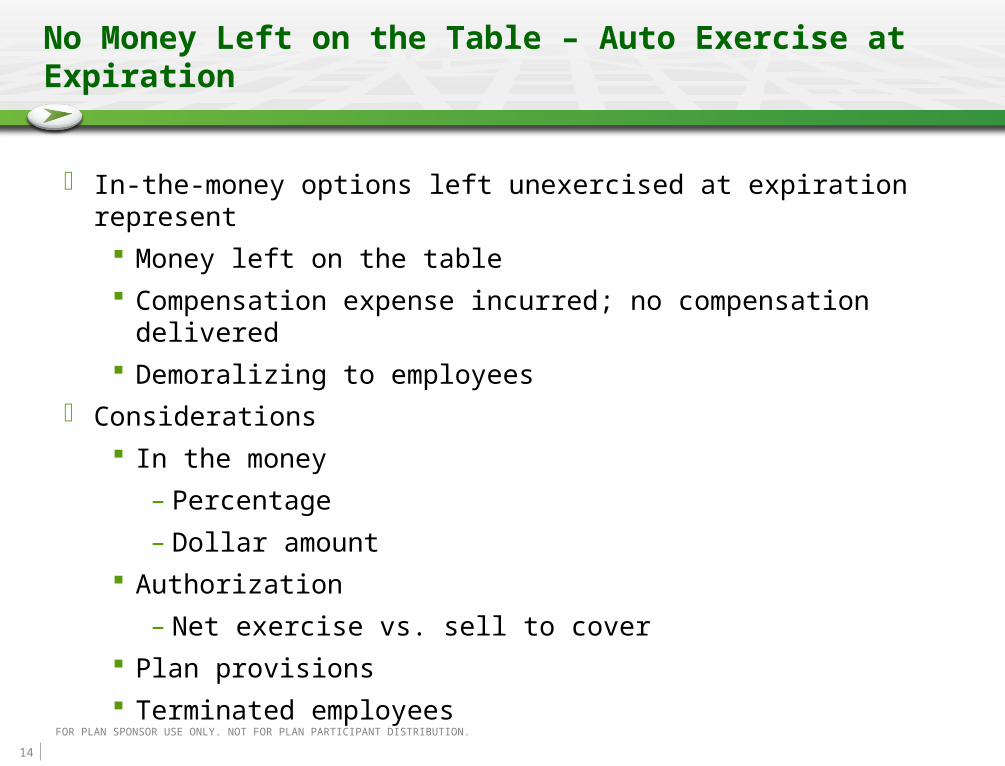
No Money Left on the Table – Auto Exercise at Expiration
In-the-money options left unexercised at expiration represent
Money left on the table
Compensation expense incurred; no compensation delivered
Demoralizing to employees
Considerations
In the money
– Percentage
– Dollar amount
Authorization
– Net exercise vs. sell to cover
Plan provisions
Terminated employees
FOR PLAN SPONSOR USE ONLY. NOT FOR PLAN PARTICIPANT DISTRIBUTION.

15
Back In Style: Employee Stock Purchase Plans Turning Heads Again
Despite the challenges imposed by FAS 123R/ASC 718, ESPPs are still an important component of many equity compensation plans.
ESPPs can help promote an ownership mentality across a broad base of employees at a relatively low cost.
Plan design changes, particularly those related to discount rates and look-back periods, often have a big impact on participation rates.
FOR PLAN SPONSOR USE ONLY. NOT FOR PLAN PARTICIPANT DISTRIBUTION.
16
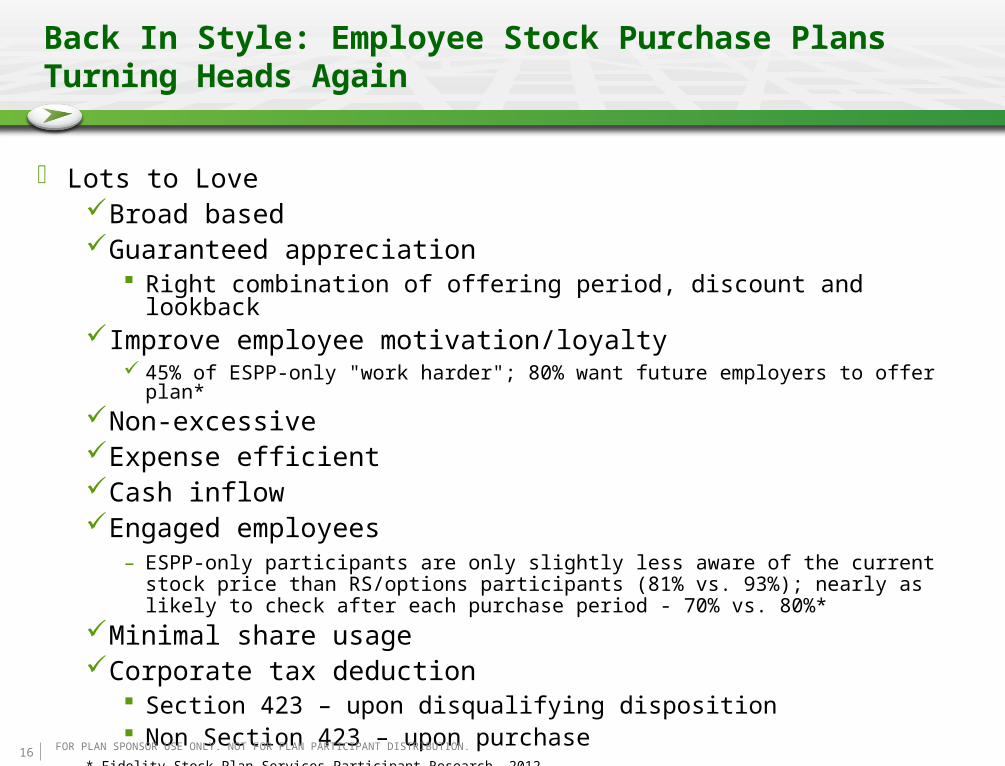
Back In Style: Employee Stock Purchase Plans Turning Heads Again
Lots to LoveBroad basedGuaranteed appreciation
Right combination of offering period, discount and lookbackImprove employee motivation/loyalty
45% of ESPP-only "work harder"; 80% want future employers to offer plan*Non-excessive Expense efficientCash inflowEngaged employees
– ESPP-only participants are only slightly less aware of the current stock price than RS/options participants (81% vs. 93%); nearly as likely to check after each purchase period - 70% vs. 80%*
Minimal share usageCorporate tax deduction
Section 423 – upon disqualifying disposition Non Section 423 – upon purchase
* Fidelity Stock Plan Services Participant Research, 2012
FOR PLAN SPONSOR USE ONLY. NOT FOR PLAN PARTICIPANT DISTRIBUTION.

17
Revisiting RetirementU.S. Tax: Retirement Eligibility
If plan/agreement contains provisions to accelerate (or continue) vesting at retirement
Participant “earns” the shares when they become retirement eligible
– Accelerates accrual of expense Grant date to retirement eligible date
– Taxation event! Retirement eligible date, OR
Grant date (if retirement eligible at the time of grant) Some companies have tried to avoid this tax treatment by inserting a
clause in the agreement– Acceleration / Continuation of vesting at discretion of board– Therefore receipt not “guaranteed” – Therefore no taxation event at time participant becomes retirement eligible
IRS representatives have asserted (off the record) that they would look at “facts & circumstances”
– Has anyone ever forfeited?– Is it just a “rubber stamp”?
FOR PLAN SPONSOR USE ONLY. NOT FOR PLAN PARTICIPANT DISTRIBUTION.

18
Revisiting RetirementU.S. Tax: Retirement Eligibility
1 Rule of administrative convenience allows FICA to be collected at any date (after vesting) during the year. Many companies “deem” FICA collected on 12/31 when often Social Security limit has already been met.
RSA RSU
FICA due at Retirement Eligible Date1
Yes Yes
Income Tax due at Retirement Eligible Date
Yes No
FOR PLAN SPONSOR USE ONLY. NOT FOR PLAN PARTICIPANT DISTRIBUTION.

19
Revisiting Retirement
* 2010 NASPP Stock Plan Design Survey
Options Restricted Performance
Normal
Retirement (n=465)
Early Retirement
(n=445)
Normal Retirement
(n=443)
Early Retirement
(n=465)
Normal Retirement
(n=318)
Early Retirement
(n=298)
Cos. % Cos. % Cos. % Cos. % Cos. % Cos. %
All (vested and unvested) forfeited
5 1% 208 47% – – – – – – – –
Unvested forfeited 214 46% 57 13% 208 47% 263 62% 101 32% 145 49%
Some unvested forfeited (vesting accelerates for the remaining unvested)
37 8% 61 14% 57 13% 47 11% – – – –
None forfeited (continue to vest normally)
80 17% 81 18% 61 14% 43 10% – – – –
Pro rata at end of performance
– – – – – – – – 109 34% 85 29%
Pro rata at time of termination
– – – – – – – – 25 8% 12 4%
Full payout at time of termination
– – – – – – – – 9 3% 1 0%
Full payout at end of performance
– – – – – – – – 42 13% 22 7%
Other 17 4% 17 4% 24 5% 21 5% 13 4% 11 4%
FOR PLAN SPONSOR USE ONLY. NOT FOR PLAN PARTICIPANT DISTRIBUTION.

20
Tell It Like It Is: Plan Analytics for Management Reporting vs Analytics - What’s the Difference?
Reporting translates data into information to show what is happening:
1. What happened? When did it happen?
2. How many? How often? Where?
3. Where exactly is the problem? How do I find the answers?
Analytics transforms data into insights to show why something is happening and what you can do about it:
1. Why is it happening? What opportunities am I missing?
2. What if these trends continue? How much is needed? When will it be needed?
3. What will happen next? How will it affect my business?
4. How do we do things better? What is the best decision for a complex problem?
FOR PLAN SPONSOR USE ONLY. NOT FOR PLAN PARTICIPANT DISTRIBUTION.

21
Tell It Like It Is: Plan Analytics for Management
What’s Interesting?Business Objectives
Visual reporting and analytics about plan trends and performance.
Account Certification % Plan Value Product Mix Exercise Activity ESPP Participation and Behaviors Performance Plans
FOR PLAN SPONSOR USE ONLY. NOT FOR PLAN PARTICIPANT DISTRIBUTION.
Screenshots are for illustrative purposes only.

22
Tell it Like it Is: Plan Analytics for Management
What’s InterestingBusiness Objective
Provides a snapshot of the key highlights relating to equity compensation plans. Focuses on metrics that are foundational pieces of information for strategic discussion around effectiveness of equity plans.
Participant counts by product Award and exercise trends ESPP purchase trends ESPP plan design and participation
benchmarking Customer and client service levels Participant interaction activity
FOR PLAN SPONSOR USE ONLY. NOT FOR PLAN PARTICIPANT DISTRIBUTION.
Screenshots are for illustrative purposes only.

23
Ownership Guidelines
Ownership Guidelines
2011 NASPP Stock Plan Administration Survey* indicates that ownership guidelines are hot, hot, hot!
– 73% of respondents have ownership guidelines, up from 54% in 2007
25% of companies that don’t currently have guidelines are considering implementing them
* NASPP 2011 Domestic Stock Plan Administration Survey (co-sponsored by Deloitte).
FOR PLAN SPONSOR USE ONLY. NOT FOR PLAN PARTICIPANT DISTRIBUTION.

24
Ownership Guidelines
Ownership Guidelines
Most frequently apply to CEO, CFO, and other named executive officers
– Rarely apply below executive level
Usually based on a multiple or perceantage of base salary
– Typically 5-6 times salary for CEO, 2-4 times salary for CFO and other NEOs
– Challenges with fluctuating stock price
* NASPP 2011 Domestic Stock Plan Administration Survey (co-sponsored by Deloitte).
FOR PLAN SPONSOR USE ONLY. NOT FOR PLAN PARTICIPANT DISTRIBUTION.

25
10b5-1 Plans: Making Headlines Again
Recent Wall Street Journal articles allege improper trading in company shares by executives due to shortcomings of Rule 10b5-1
Most of trades in question occurred during the five trading days before the companies released material information
AND
Were made under executive trading plans established pursuant to Rule 10b5-1
Federal prosecutors and securities regulators are taking a closer look into these allegations
Alleged shortcomings of 10b5-1 plans
Executives don’t have to file trading plans with any regulatory authority
Companies aren’t required to disclose the plan’s existence
FOR PLAN SPONSOR USE ONLY. NOT FOR PLAN PARTICIPANT DISTRIBUTION.

26
10b5-1 Plans: Making Headlines Again
Alleged shortcomings of 10b5-1 plans
Executives free to cancel or change plans without disclosure
No rule about how long plans must be in place before trading under plans can begin
How to minimize exposure and maximize compliance?
Periodically reevaluate policies regarding the use of Rule 10b5-1 trading plans to ensure they are up to date and in compliance with best practices, e.g., require that plans have a minimum duration of at least one year
Focus on compliance with the spirit of the law rather than on strict literal compliance with the letter of the law
FOR PLAN SPONSOR USE ONLY. NOT FOR PLAN PARTICIPANT DISTRIBUTION.

27
Questions and Contact
Emily Cervino, CEP
408 832 9080
Fidelity does not provide legal or tax advice and the information provided above is general in nature and should not be considered legal or tax advice. Consult with an attorney or tax professional regarding your specific legal or tax situation.
Fidelity Stock Plan Services, LLC 647764.1.0