what is asics?
TRANSCRIPT

ANNUAL REPORT 2018ANNUAL REPORT 2019
ASICS is an acronym of the Latin phrase “Anima Sana In Corpore Sano,” which translates as ‘a sound mind in a sound body’. This reflects our founder’s belief that sport and health bring benefits for not only our bodies, but also our mental wellbeing, as well as our culture and society as a whole. This core belief remains at the heart of our Founding Philosophy to this day.
ASICS ANNUAL REPORT 2019 01
Since its founding in 1949, the ASICS Group has been committed to nurturing the world’s youth through sports in order to contribute to society.
We are our customers’ lifetime partner.
WHAT IS ASICS?
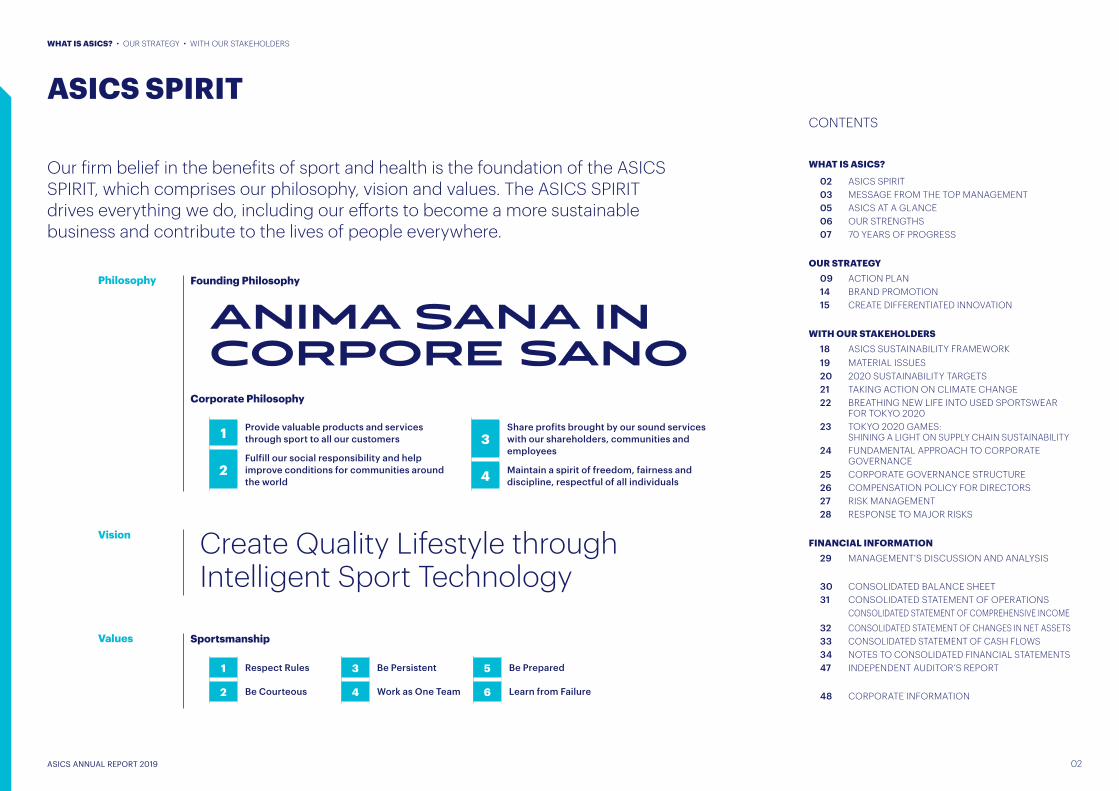
Our firm belief in the benefits of sport and health is the foundation of the ASICS SPIRIT, which comprises our philosophy, vision and values. The ASICS SPIRIT drives everything we do, including our efforts to become a more sustainable business and contribute to the lives of people everywhere.
Create Quality Lifestyle through Intelligent Sport Technology
1 Provide valuable products and services through sport to all our customers
2Fulfill our social responsibility and help improve conditions for communities around the world
3Share profits brought by our sound services with our shareholders, communities and employees
4 Maintain a spirit of freedom, fairness and discipline, respectful of all individuals
1 Respect Rules
2 Be Courteous
3 Be Persistent
4 Work as One Team
5 Be Prepared
6 Learn from Failure
ASICS ANNUAL REPORT 2019 02
ASICS SPIRIT
WHAT IS ASICS? • OUR STRATEGY • WITH OUR STAKEHOLDERS
CONTENTS
Philosophy
Vision
Values Sportsmanship
Founding Philosophy
ANIMA SANA IN CORPORE SANO
Corporate Philosophy
09 ACTION PLAN14 BRAND PROMOTION15 CREATE DIFFERENTIATED INNOVATION
OUR STRATEGY
18 ASICS SUSTAINABILITY FRAMEWORK19 MATERIAL ISSUES20 2020 SUSTAINABILITY TARGETS21 TAKING ACTION ON CLIMATE CHANGE22 BREATHING NEW LIFE INTO USED SPORTSWEAR
FOR TOKYO 202023 TOKYO 2020 GAMES:
SHINING A LIGHT ON SUPPLY CHAIN SUSTAINABILITY24 FUNDAMENTAL APPROACH TO CORPORATE
GOVERNANCE25 CORPORATE GOVERNANCE STRUCTURE26 COMPENSATION POLICY FOR DIRECTORS27 RISK MANAGEMENT28 RESPONSE TO MAJOR RISKS
WITH OUR STAKEHOLDERS
29 MANAGEMENT’S DISCUSSION AND ANALYSIS
30 CONSOLIDATED BALANCE SHEET31 CONSOLIDATED STATEMENT OF OPERATIONS
CONSOLIDATED STATEMENT OF COMPREHENSIVE INCOME32 CONSOLIDATED STATEMENT OF CHANGES IN NET ASSETS33 CONSOLIDATED STATEMENT OF CASH FLOWS34 NOTES TO CONSOLIDATED FINANCIAL STATEMENTS47 INDEPENDENT AUDITOR’S REPORT
48 CORPORATE INFORMATION
FINANCIAL INFORMATION
02 ASICS SPIRIT03 MESSAGE FROM THE TOP MANAGEMENT05 ASICS AT A GLANCE06 OUR STRENGTHS07 70 YEARS OF PROGRESS
WHAT IS ASICS?
ASICS ANNUAL REPORT 2019 03
WHAT IS ASICS? • OUR STRATEGY • WITH OUR STAKEHOLDERS
WHAT IS ASICS?Kihachiro Onitsuka founded ASICS in 1949 to nurture the youth of Japan through sports and contribute to the development of society. Today, 70 years later, that ideal remains engrained in ASICS, guiding our efforts to continuously develop innovative technologies, products and services that improve the quality of customers’ lives. Our vision is to “Create Quality Lifestyle through Intelligent Sport Technology.” Based on that vision, we have developed products that harness our accumulated expertise and technologies, winning the support of athletes worldwide and casual runners and underpinning our strong brand value today.
Going forward, we will continue to harness advanced technologies – developed through collaboration with athletes – to create products and services that make life healthier and more fun for people everywhere.
2019 HIGHLIGHTSIn FY2019, ended December 31, 2019, ASICS reported higher profits, despite a drop in sales. On a currency-neutral basis, sales increased year on year. Advertising expenses rose due to increased spending on strategic marketing. However, selling, general and administrative expenses declined, mainly reflecting cost savings from previously implemented business restructuring measures, which lifted operating income for the first time in five years.
In the Performance Running category, sales increased on a currency-neutral basis, while sales in the key US market rose for the first time in four years.
In 2019, we adopted a new management structure based around product categories, with a single executive tasked with overseeing all aspects of operations in each category – from product planning
and development right through to marketing and sales. That structure is gradually bedding down across the ASICS Group. We are also clarifying the respective roles of Head Office and sales companies to ensure the category-based management structure takes hold and supports the Group’s future growth.
OUR STRATEGY We plan to step up efforts in each of the following priority areas by targeting resources on growth fields and improving profitability.
MESSAGE FROM THE TOP MANAGEMENT
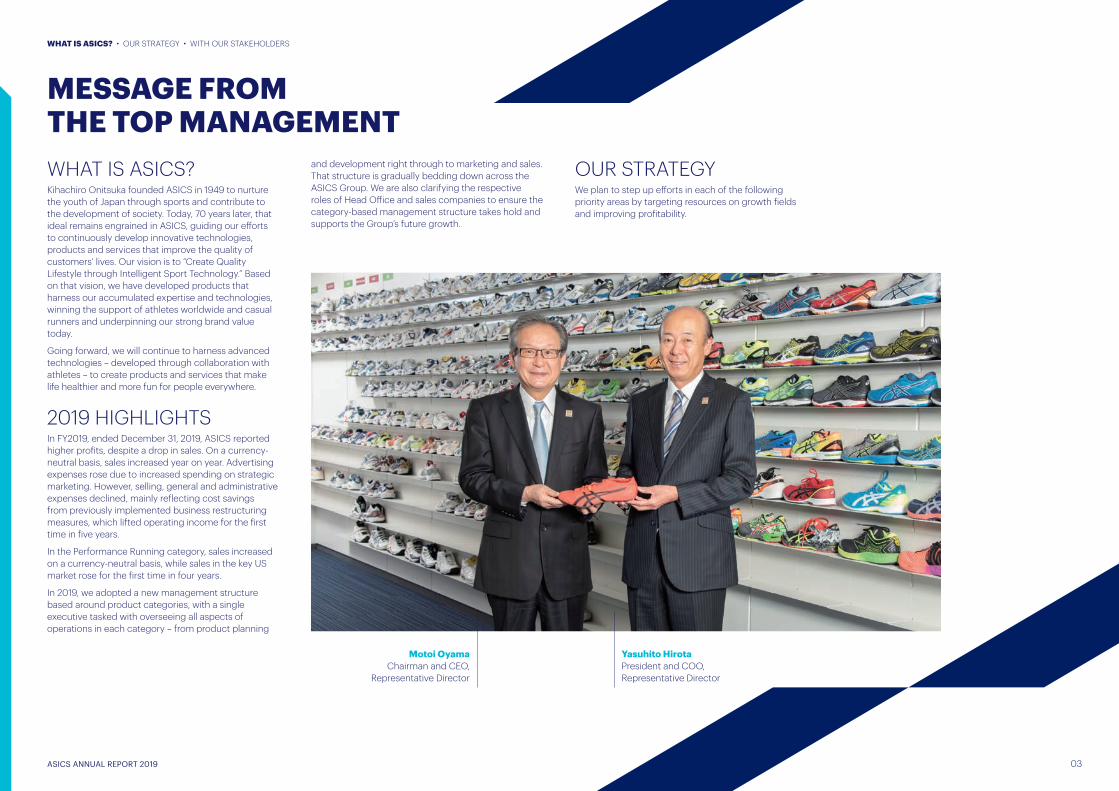
Yasuhito HirotaPresident and COO, Representative Director
Motoi Oyama Chairman and CEO,
Representative Director
ASICS ANNUAL REPORT 2019 04
WHAT IS ASICS? • OUR STRATEGY • WITH OUR STAKEHOLDERS
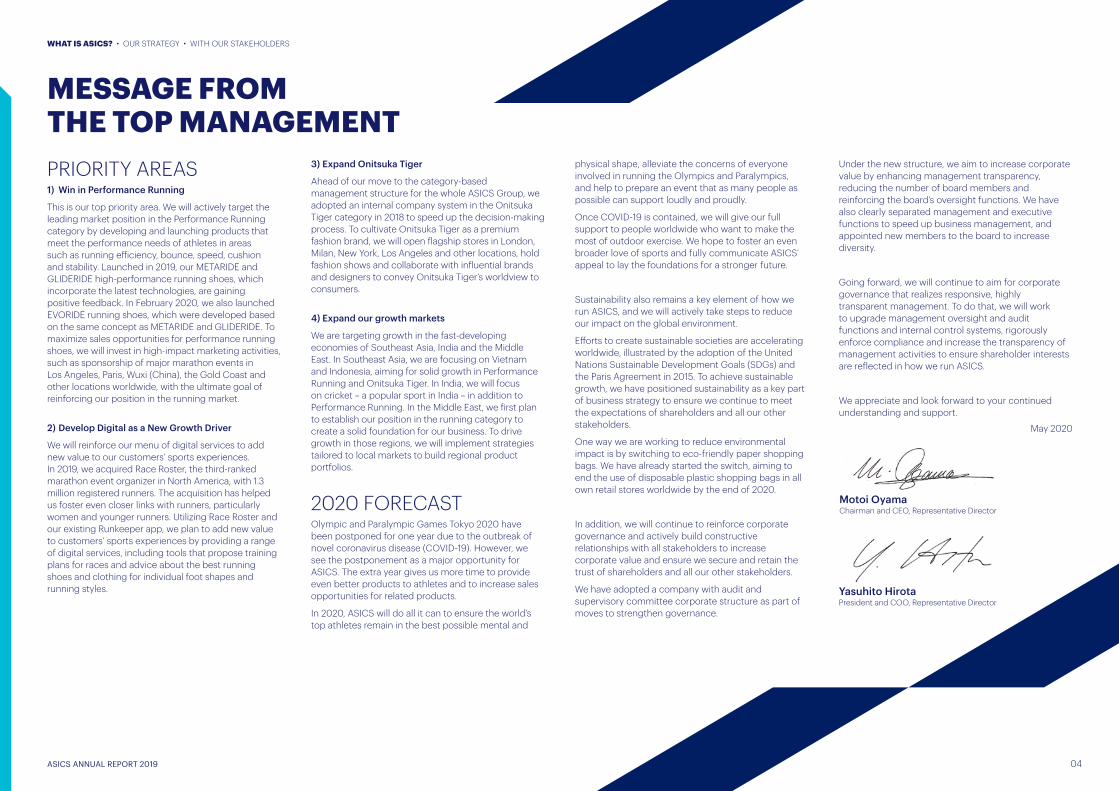
PRIORITY AREAS1) Win in Performance Running
This is our top priority area. We will actively target the leading market position in the Performance Running category by developing and launching products that meet the performance needs of athletes in areas such as running efficiency, bounce, speed, cushion and stability. Launched in 2019, our METARIDE and GLIDERIDE high-performance running shoes, which incorporate the latest technologies, are gaining positive feedback. In February 2020, we also launched EVORIDE running shoes, which were developed based on the same concept as METARIDE and GLIDERIDE. To maximize sales opportunities for performance running shoes, we will invest in high-impact marketing activities, such as sponsorship of major marathon events in Los Angeles, Paris, Wuxi (China), the Gold Coast and other locations worldwide, with the ultimate goal of reinforcing our position in the running market.
2) Develop Digital as a New Growth Driver
We will reinforce our menu of digital services to add new value to our customers’ sports experiences. In 2019, we acquired Race Roster, the third-ranked marathon event organizer in North America, with 1.3 million registered runners. The acquisition has helped us foster even closer links with runners, particularly women and younger runners. Utilizing Race Roster and our existing Runkeeper app, we plan to add new value to customers’ sports experiences by providing a range of digital services, including tools that propose training plans for races and advice about the best running shoes and clothing for individual foot shapes and running styles.
3) Expand Onitsuka Tiger
Ahead of our move to the category-based management structure for the whole ASICS Group, we adopted an internal company system in the Onitsuka Tiger category in 2018 to speed up the decision-making process. To cultivate Onitsuka Tiger as a premium fashion brand, we will open flagship stores in London, Milan, New York, Los Angeles and other locations, hold fashion shows and collaborate with influential brands and designers to convey Onitsuka Tiger’s worldview to consumers.
4) Expand our growth markets
We are targeting growth in the fast-developing economies of Southeast Asia, India and the Middle East. In Southeast Asia, we are focusing on Vietnam and Indonesia, aiming for solid growth in Performance Running and Onitsuka Tiger. In India, we will focus on cricket – a popular sport in India – in addition to Performance Running. In the Middle East, we first plan to establish our position in the running category to create a solid foundation for our business. To drive growth in those regions, we will implement strategies tailored to local markets to build regional product portfolios.
2020 FORECASTOlympic and Paralympic Games Tokyo 2020 have been postponed for one year due to the outbreak of novel coronavirus disease (COVID-19). However, we see the postponement as a major opportunity for ASICS. The extra year gives us more time to provide even better products to athletes and to increase sales opportunities for related products.
In 2020, ASICS will do all it can to ensure the world’s top athletes remain in the best possible mental and
physical shape, alleviate the concerns of everyone involved in running the Olympics and Paralympics, and help to prepare an event that as many people as possible can support loudly and proudly.
Once COVID-19 is contained, we will give our full support to people worldwide who want to make the most of outdoor exercise. We hope to foster an even broader love of sports and fully communicate ASICS’ appeal to lay the foundations for a stronger future.
Sustainability also remains a key element of how we run ASICS, and we will actively take steps to reduce our impact on the global environment.
Efforts to create sustainable societies are accelerating worldwide, illustrated by the adoption of the United Nations Sustainable Development Goals (SDGs) and the Paris Agreement in 2015. To achieve sustainable growth, we have positioned sustainability as a key part of business strategy to ensure we continue to meet the expectations of shareholders and all our other stakeholders.
One way we are working to reduce environmental impact is by switching to eco-friendly paper shopping bags. We have already started the switch, aiming to end the use of disposable plastic shopping bags in all own retail stores worldwide by the end of 2020.
In addition, we will continue to reinforce corporate governance and actively build constructive relationships with all stakeholders to increase corporate value and ensure we secure and retain the trust of shareholders and all our other stakeholders.
We have adopted a company with audit and supervisory committee corporate structure as part of moves to strengthen governance.
Under the new structure, we aim to increase corporate value by enhancing management transparency, reducing the number of board members and reinforcing the board’s oversight functions. We have also clearly separated management and executive functions to speed up business management, and appointed new members to the board to increase diversity.
Going forward, we will continue to aim for corporate governance that realizes responsive, highly transparent management. To do that, we will work to upgrade management oversight and audit functions and internal control systems, rigorously enforce compliance and increase the transparency of management activities to ensure shareholder interests are reflected in how we run ASICS.
We appreciate and look forward to your continued understanding and support.
MESSAGE FROM THE TOP MANAGEMENT
Chairman and CEO, Representative DirectorMotoi Oyama
President and COO, Representative DirectorYasuhito Hirota
May 2020

170.1Performance Running
47.0Others
41.7Core Performance Sports 34.2
Sports Style
39.2Apparel and
Equipment
45.5Onitsuka Tiger
Net sales by category(billions of yen)
ASICS AT A GLANCE
ASICS is one of the world’s top sports performance and lifestyle brands. We operate 60 companies in 33 countries. Our reach extends further through our supply chain business partners, sponsored events and connections to other stakeholders worldwide.
ASICS worldwide
9,039employees
60global businesses
33countries where we have businesses established
989retail stores
22sourcing countries
(as of December 31, 2019)FY2019
378.0net sales (billions of yen)
10.6operating income (billions of yen)
7.0net profit (billions of yen)
Find out morehttps://corp.asics.com/en/investor_relations
WHAT IS ASICS? • OUR STRATEGY • WITH OUR STAKEHOLDERS
ASICS ANNUAL REPORT 2019 05

WHAT IS ASICS? • OUR STRATEGY • WITH OUR STAKEHOLDERS
OUR STRENGTHS
Our strengths as a company lie in the enduring relationships we have built with all stakeholders — our shareholders, customers, business partners and employees — and the trust they have in our technology, products and brands, cultivated over many years in business fields centered on sports.
Founder Kihachiro Onitsuka engaged in product development with the belief that consumers would appreciate products with superior performance. He rose to the challenge, helping ASICS accumulate a wealth of technology and experience along the way. The ASICS Institute of Sport Science (ISS) was established in 1985, to develop products based on biomechanics and human-centric science. Our goal was to create unique, innovative products with high added value. That strong emphasis on technology lives on in the Company to this day.
We conduct various research and design activities covering materials development to structural design. We observe and analyze the movement of athletes and work with them to identify necessary improvements, resulting in products that outperform existing or competitor products. This is a recurring process that leads to incremental gains in product performance.
ASICS ANNUAL REPORT 2019 06
The ASICS brand, which is our corporate brand, has been providing innovative products and services based on human-centric science to help people move more and feel healthy in both body and mind.
The Onitsuka Tiger brand was used to market sports shoes until the Group’s three-way merger in 1977. The brand was revived in 2002 as a sports-inspired fashion brand.
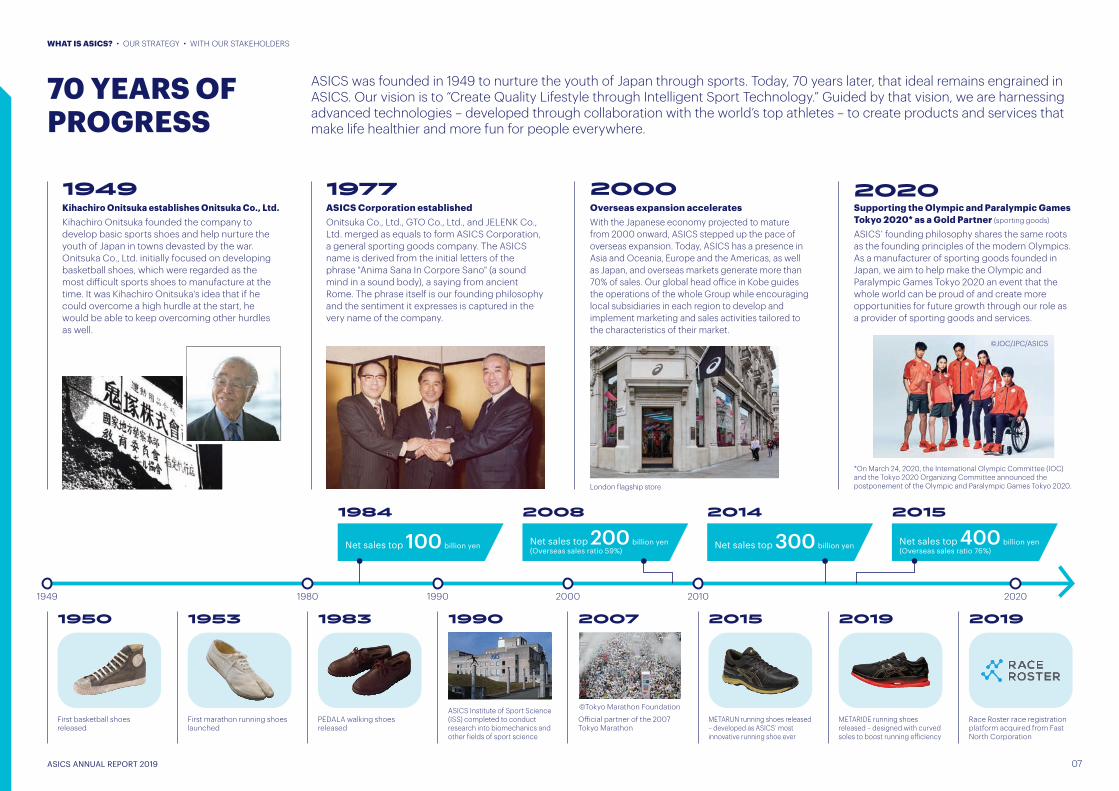
Kihachiro Onitsuka founded the company to develop basic sports shoes and help nurture the youth of Japan in towns devasted by the war. Onitsuka Co., Ltd. initially focused on developing basketball shoes, which were regarded as the most di�icult sports shoes to manufacture at the time. It was Kihachiro Onitsuka's idea that if he could overcome a high hurdle at the start, he would be able to keep overcoming other hurdles as well.
Onitsuka Co., Ltd., GTO Co., Ltd., and JELENK Co., Ltd. merged as equals to form ASICS Corporation, a general sporting goods company. The ASICS name is derived from the initial letters of the phrase "Anima Sana In Corpore Sano" (a sound mind in a sound body), a saying from ancient Rome. The phrase itself is our founding philosophy and the sentiment it expresses is captured in the very name of the company.
2000
With the Japanese economy projected to mature from 2000 onward, ASICS stepped up the pace of overseas expansion. Today, ASICS has a presence in Asia and Oceania, Europe and the Americas, as well as Japan, and overseas markets generate more than 70% of sales. Our global head o�ice in Kobe guides the operations of the whole Group while encouraging local subsidiaries in each region to develop and implement marketing and sales activities tailored to the characteristics of their market.
2020
ASICS’ founding philosophy shares the same roots as the founding principles of the modern Olympics. As a manufacturer of sporting goods founded in Japan, we aim to help make the Olympic and Paralympic Games Tokyo 2020 an event that the whole world can be proud of and create more opportunities for future growth through our role as a provider of sporting goods and services.
Supporting the Olympic and Paralympic Games Tokyo 2020* as a Gold Partner (sporting goods)
Overseas expansion accelerates
1977ASICS Corporation established
1949Kihachiro Onitsuka establishes Onitsuka Co., Ltd.
*On March 24, 2020, the International Olympic Committee (IOC) and the Tokyo 2020 Organizing Committee announced the postponement of the Olympic and Paralympic Games Tokyo 2020.
1949 1980 1990 2000 2010 2020
©JOC/JPC/ASICS
London flagship store
1984
Net sales top 100 billion yen
2008
Net sales top 200 billion yen(Overseas sales ratio 59%)
2014
Net sales top 300 billion yen
2015
Net sales top 400 billion yen(Overseas sales ratio 76%)
First basketball shoes released
1950
First marathon running shoes launched
1953
PEDALA walking shoes released
1983
ASICS Institute of Sport Science (ISS) completed to conduct research into biomechanics and other fields of sport science
1990
O�icial partner of the 2007 Tokyo Marathon
2007
METARUN running shoes released – developed as ASICS’ most innovative running shoe ever
2015
METARIDE running shoes released – designed with curved soles to boost running e�iciency
2019
Race Roster race registration platform acquired from Fast North Corporation
2019
©Tokyo Marathon Foundation
70 YEARS OF PROGRESS
ASICS was founded in 1949 to nurture the youth of Japan through sports. Today, 70 years later, that ideal remains engrained in ASICS. Our vision is to “Create Quality Lifestyle through Intelligent Sport Technology.” Guided by that vision, we are harnessing advanced technologies – developed through collaboration with the world’s top athletes – to create products and services that make life healthier and more fun for people everywhere.
WHAT IS ASICS? • OUR STRATEGY • WITH OUR STAKEHOLDERS
ASICS ANNUAL REPORT 2019 07
ASICS ANNUAL REPORT 2019 08
We will build a foundation for future growth by focusing resources on growth fields and improving profitability by execution of the Action Plan (set in August 2018) .
OUR STRATEGY
To ensure ASICS has a successful year in 2021, when the Olympic and Paralympic Games Tokyo 2020 is scheduled to be held, we will continue to develop our category-based management structure in 2020 and focus on implementing strategies in performance running, digital channels and other priority areas.
* On March 24, 2020, the International Olympic Committee (IOC) and the Tokyo 2020 Organizing Committee announced the postponement of the Olympic and Paralympic Games Tokyo 2020.
ASICS ANNUAL REPORT 2019 09
WHAT IS ASICS? • OUR STRATEGY • WITH OUR STAKEHOLDERS
ACTION PLAN
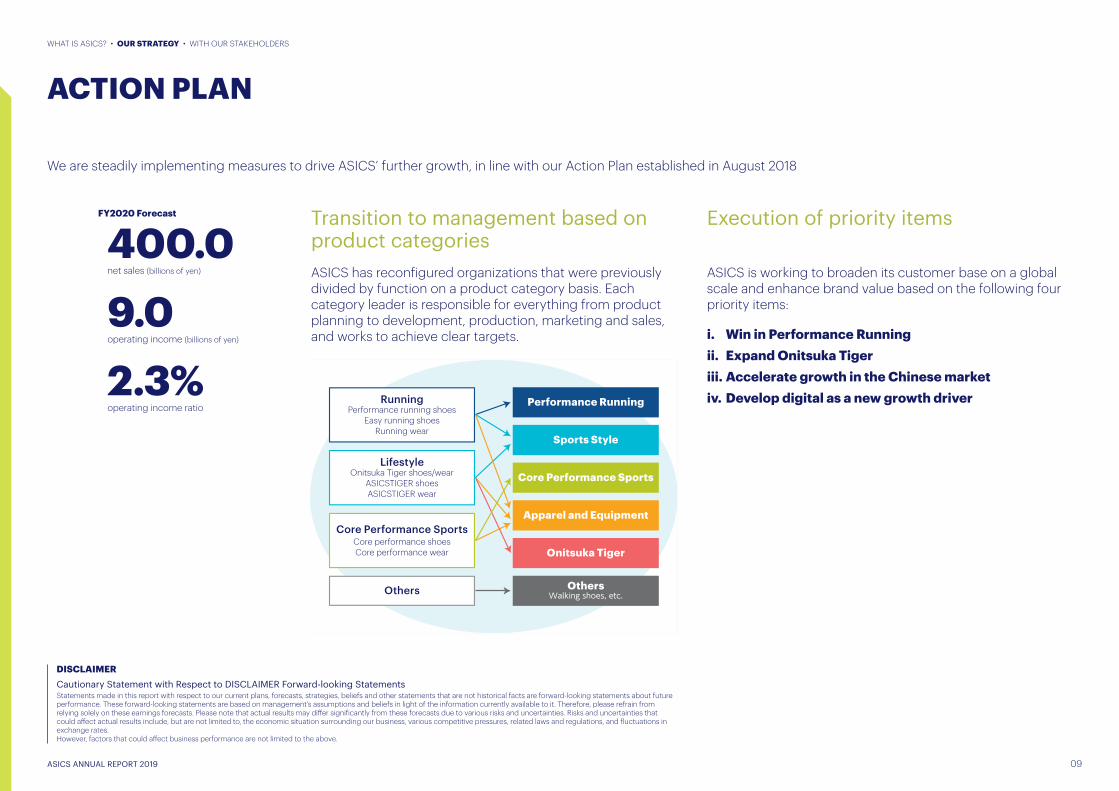
We are steadily implementing measures to drive ASICS’ further growth, in line with our Action Plan established in August 2018
Execution of priority itemsTransition to management based on product categories
FY2020 Forecast
400.0net sales (billions of yen)
9.0operating income (billions of yen)
2.3%operating income ratio
i. Win in Performance Running ii. Expand Onitsuka Tiger iii. Accelerate growth in the Chinese market iv. Develop digital as a new growth driver
ASICS is working to broaden its customer base on a global scale and enhance brand value based on the following four priority items:
ASICS has reconfigured organizations that were previously divided by function on a product category basis. Each category leader is responsible for everything from product planning to development, production, marketing and sales, and works to achieve clear targets.
Onitsuka Tiger
Apparel and Equipment
Core Performance Sports
Sports Style
Performance RunningPerformance running shoes
Easy running shoesRunning wear
Running
Others
Onitsuka Tiger shoes/wearASICSTIGER shoesASICSTIGER wear
Lifestyle
OthersWalking shoes, etc.
Core performance shoesCore performance wear
Core Performance Sports
Cautionary Statement with Respect to DISCLAIMER Forward-looking StatementsStatements made in this report with respect to our current plans, forecasts, strategies, beliefs and other statements that are not historical facts are forward-looking statements about future performance. These forward-looking statements are based on management's assumptions and beliefs in light of the information currently available to it. Therefore, please refrain from relying solely on these earnings forecasts. Please note that actual results may differ significantly from these forecasts due to various risks and uncertainties. Risks and uncertainties that could affect actual results include, but are not limited to, the economic situation surrounding our business, various competitive pressures, related laws and regulations, and fluctuations in exchange rates. However, factors that could affect business performance are not limited to the above.
DISCLAIMER
ASICS ANNUAL REPORT 2019 10
WHAT IS ASICS? • OUR STRATEGY • WITH OUR STAKEHOLDERS
ACTION PLAN
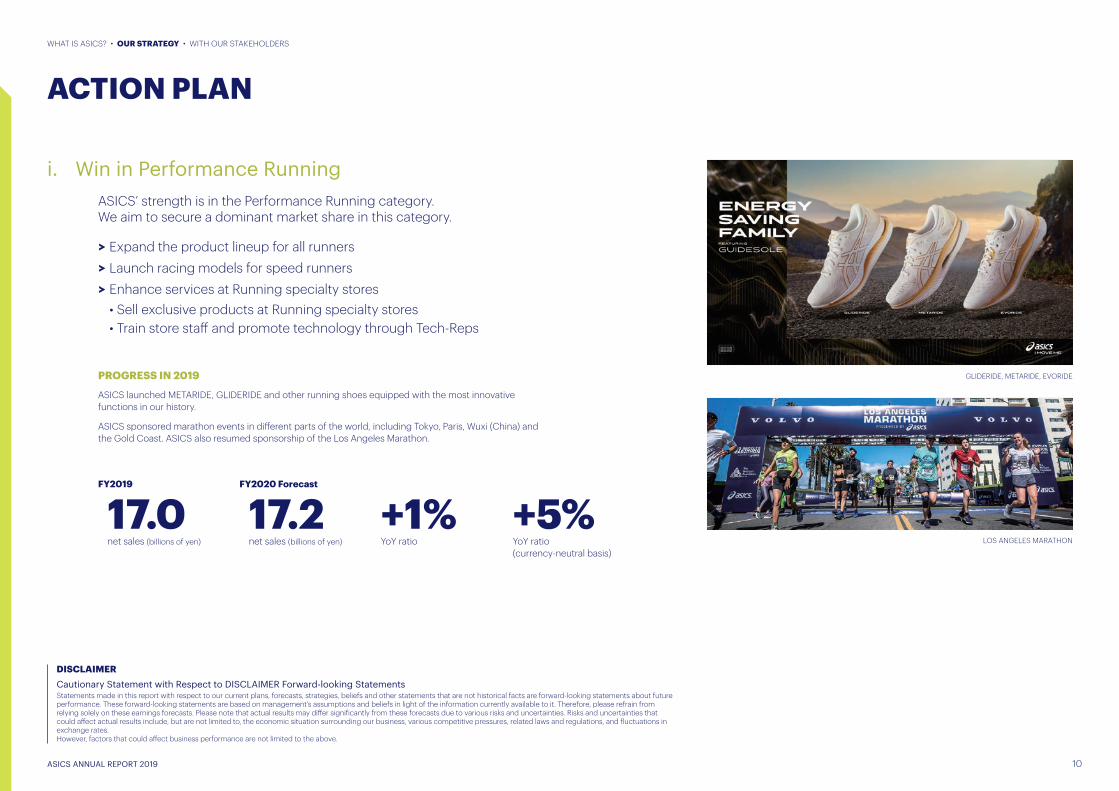
i. Win in Performance Running
PROGRESS IN 2019
ASICS launched METARIDE, GLIDERIDE and other running shoes equipped with the most innovative functions in our history.
ASICS sponsored marathon events in different parts of the world, including Tokyo, Paris, Wuxi (China) and the Gold Coast. ASICS also resumed sponsorship of the Los Angeles Marathon.
FY2019
17.0net sales (billions of yen)
FY2020 Forecast
17.2net sales (billions of yen)
+1%YoY ratio
+5%YoY ratio (currency-neutral basis)
� Expand the product lineup for all runners� Launch racing models for speed runners� Enhance services at Running specialty stores
ASICS’ strength is in the Performance Running category. We aim to secure a dominant market share in this category.
• Sell exclusive products at Running specialty stores• Train store staff and promote technology through Tech-Reps
GLIDERIDE, METARIDE, EVORIDE
LOS ANGELES MARATHON
Cautionary Statement with Respect to DISCLAIMER Forward-looking StatementsStatements made in this report with respect to our current plans, forecasts, strategies, beliefs and other statements that are not historical facts are forward-looking statements about future performance. These forward-looking statements are based on management's assumptions and beliefs in light of the information currently available to it. Therefore, please refrain from relying solely on these earnings forecasts. Please note that actual results may differ significantly from these forecasts due to various risks and uncertainties. Risks and uncertainties that could affect actual results include, but are not limited to, the economic situation surrounding our business, various competitive pressures, related laws and regulations, and fluctuations in exchange rates. However, factors that could affect business performance are not limited to the above.
DISCLAIMER
ASICS ANNUAL REPORT 2019 11
WHAT IS ASICS? • OUR STRATEGY • WITH OUR STAKEHOLDERS
ACTION PLAN
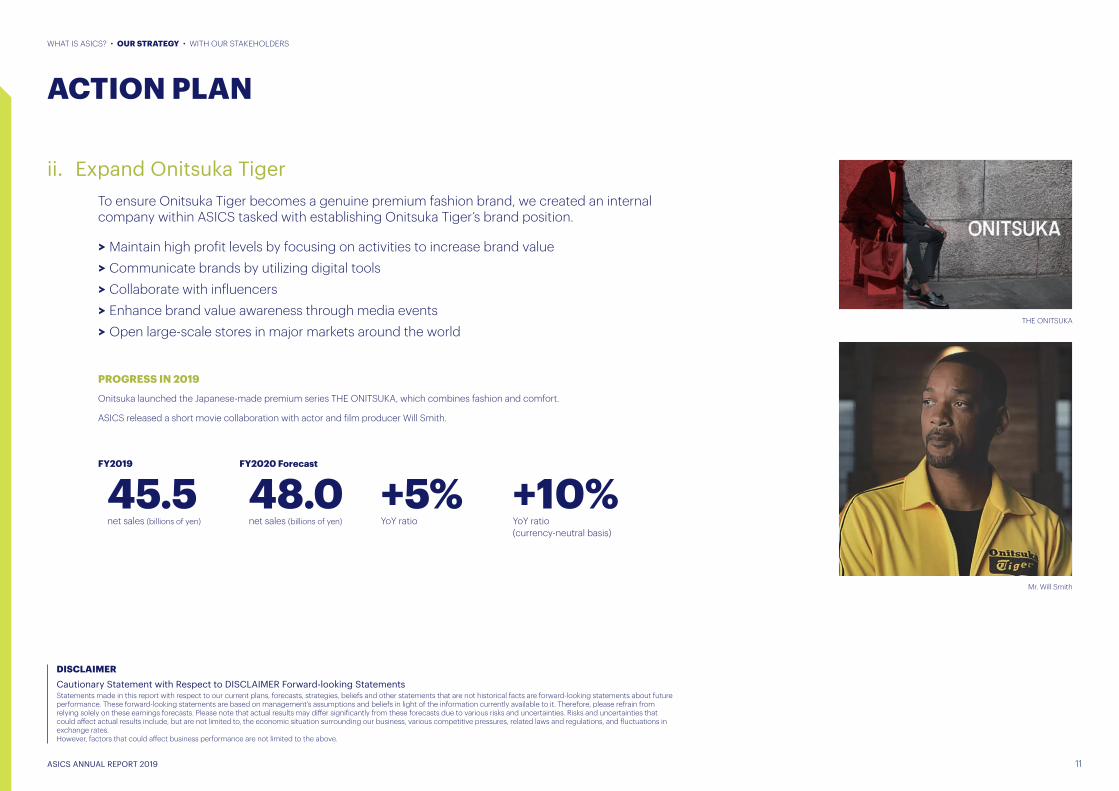
ii. Expand Onitsuka TigerTo ensure Onitsuka Tiger becomes a genuine premium fashion brand, we created an internal company within ASICS tasked with establishing Onitsuka Tiger’s brand position.
� Maintain high profit levels by focusing on activities to increase brand value� Communicate brands by utilizing digital tools� Collaborate with influencers� Enhance brand value awareness through media events� Open large-scale stores in major markets around the world
PROGRESS IN 2019
Onitsuka launched the Japanese-made premium series THE ONITSUKA, which combines fashion and comfort.
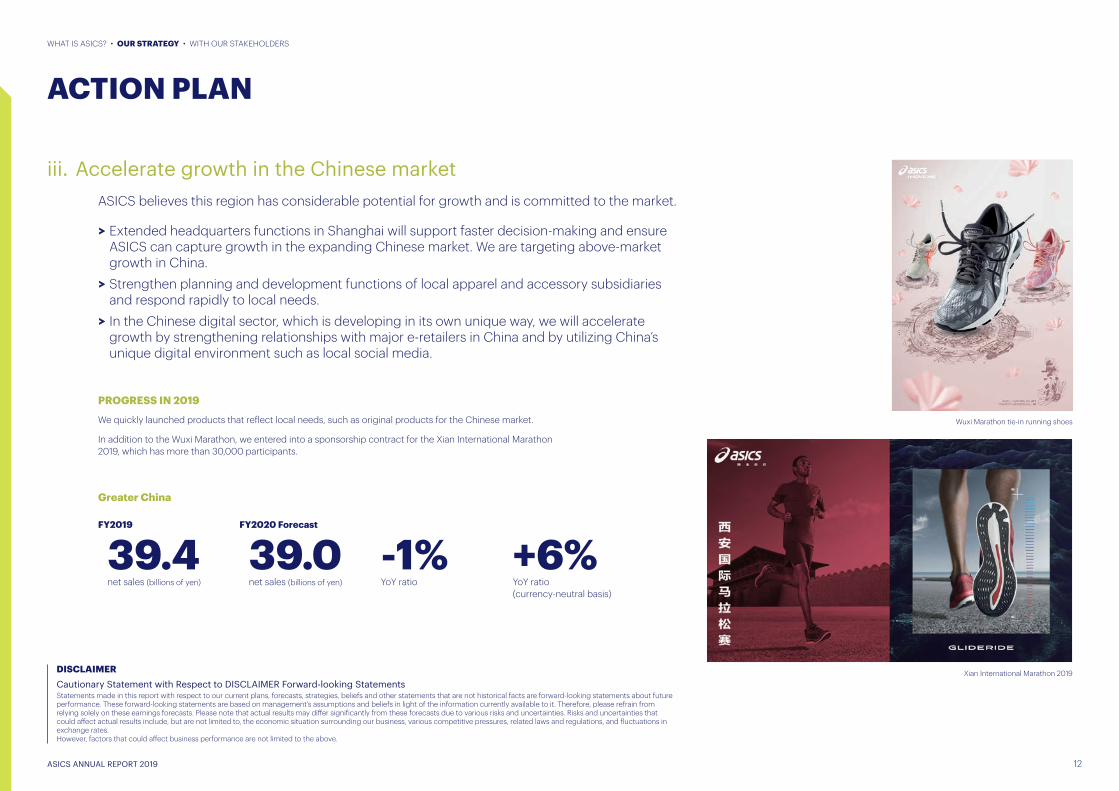
ASICS released a short movie collaboration with actor and film producer Will Smith.
FY2019
45.5net sales (billions of yen)
FY2020 Forecast
48.0net sales (billions of yen)
+5%YoY ratio
+10%YoY ratio (currency-neutral basis)
Cautionary Statement with Respect to DISCLAIMER Forward-looking StatementsStatements made in this report with respect to our current plans, forecasts, strategies, beliefs and other statements that are not historical facts are forward-looking statements about future performance. These forward-looking statements are based on management's assumptions and beliefs in light of the information currently available to it. Therefore, please refrain from relying solely on these earnings forecasts. Please note that actual results may differ significantly from these forecasts due to various risks and uncertainties. Risks and uncertainties that could affect actual results include, but are not limited to, the economic situation surrounding our business, various competitive pressures, related laws and regulations, and fluctuations in exchange rates. However, factors that could affect business performance are not limited to the above.
DISCLAIMER
Mr. Will Smith
THE ONITSUKA
ASICS ANNUAL REPORT 2019 12
WHAT IS ASICS? • OUR STRATEGY • WITH OUR STAKEHOLDERS
ACTION PLAN
iii. Accelerate growth in the Chinese marketASICS believes this region has considerable potential for growth and is committed to the market.
� Extended headquarters functions in Shanghai will support faster decision-making and ensure ASICS can capture growth in the expanding Chinese market. We are targeting above-market growth in China.
� Strengthen planning and development functions of local apparel and accessory subsidiaries and respond rapidly to local needs.
� In the Chinese digital sector, which is developing in its own unique way, we will accelerate growth by strengthening relationships with major e-retailers in China and by utilizing China’s unique digital environment such as local social media.
PROGRESS IN 2019
We quickly launched products that reflect local needs, such as original products for the Chinese market.
In addition to the Wuxi Marathon, we entered into a sponsorship contract for the Xian International Marathon 2019, which has more than 30,000 participants.
FY2019
39.4net sales (billions of yen)
FY2020 Forecast
39.0net sales (billions of yen)
-1%YoY ratio
+6%YoY ratio (currency-neutral basis)
Greater China
Wuxi Marathon tie-in running shoes
Xian International Marathon 2019 Cautionary Statement with Respect to DISCLAIMER Forward-looking StatementsStatements made in this report with respect to our current plans, forecasts, strategies, beliefs and other statements that are not historical facts are forward-looking statements about future performance. These forward-looking statements are based on management's assumptions and beliefs in light of the information currently available to it. Therefore, please refrain from relying solely on these earnings forecasts. Please note that actual results may differ significantly from these forecasts due to various risks and uncertainties. Risks and uncertainties that could affect actual results include, but are not limited to, the economic situation surrounding our business, various competitive pressures, related laws and regulations, and fluctuations in exchange rates. However, factors that could affect business performance are not limited to the above.
DISCLAIMER

ASICS ANNUAL REPORT 2019 13
WHAT IS ASICS? • OUR STRATEGY • WITH OUR STAKEHOLDERS
ACTION PLAN
iv. Develop digital as a new growth driverDigital is also an extremely important area for ASICS. We will grow our digital business by enhancing initiatives for products and sales channels, and also by strengthening services that use digital media and by maximizing the value of the customer experience.
� Grow e-commerce sales by focusing on customer needs� Enhance digital services to maximize customer value� Expand touch points with runners
PROGRESS IN 2019
ASICS acquired Race Roster, the third largest race registration platform in North America. We exhibited at CES 2020, the world’s largest technology exhibition, and announced the Running Science category. We will continue to focus on the new category to create new customer value by promoting a digital shift in products and services.
• Handled approximately 5,000 races in the U.S. during 2019• Many of the participating runners (approximately 1.3 million) are
women and young runners
Outline of “Race Roster” business
*Race Roster is third-ranked race event organizer in North America with 1.3 million registered runners, acquired by ASICS in 2019
Plan fornext race
Accolades Event Training
Crowdfunding
CoachingNutritionmanagement
Buymerchandise Registration
Event search /registration
Create a running ecosystem
� Utilize Race Roster
� Increase contact points with runners
CES 2020
WHAT IS ASICS? • OUR STRATEGY • WITH OUR STAKEHOLDERS
BRAND PROMOTION
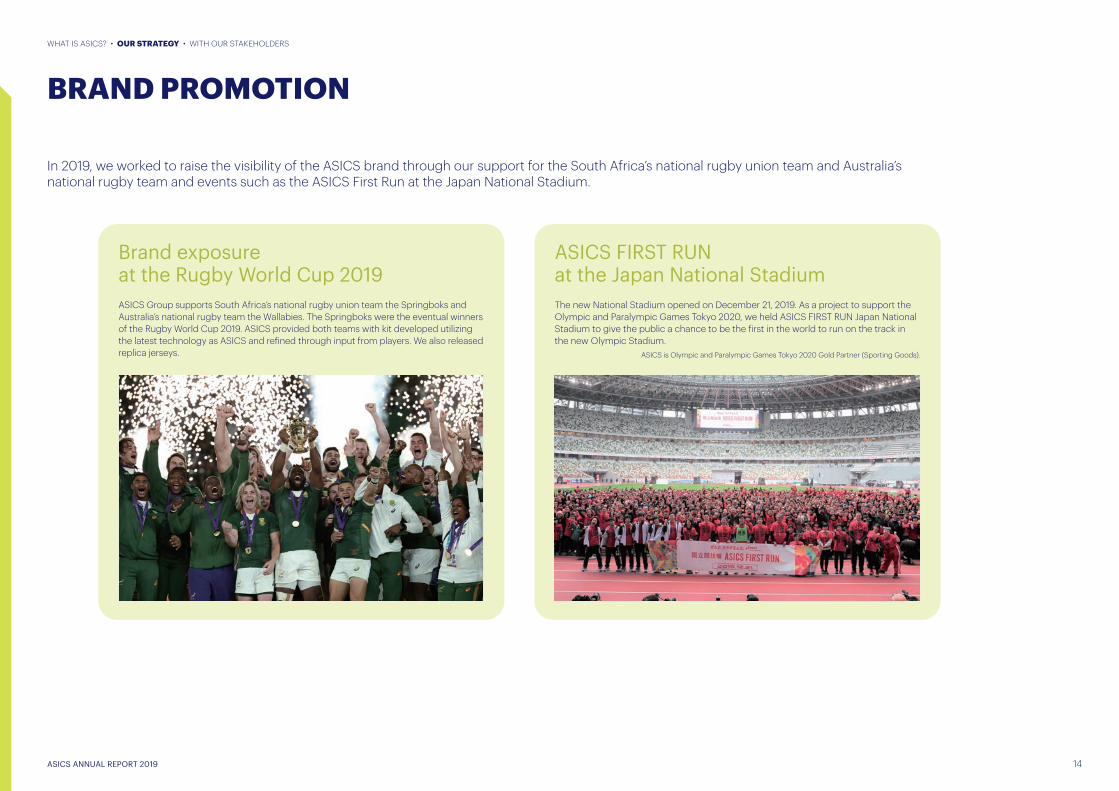
In 2019, we worked to raise the visibility of the ASICS brand through our support for the South Africa’s national rugby union team and Australia’s national rugby team and events such as the ASICS First Run at the Japan National Stadium.
The new National Stadium opened on December 21, 2019. As a project to support the Olympic and Paralympic Games Tokyo 2020, we held ASICS FIRST RUN Japan National Stadium to give the public a chance to be the first in the world to run on the track in the new Olympic Stadium.
ASICS FIRST RUN at the Japan National Stadium
Brand exposure at the Rugby World Cup 2019 ASICS Group supports South Africa’s national rugby union team the Springboks and Australia’s national rugby team the Wallabies. The Springboks were the eventual winners of the Rugby World Cup 2019. ASICS provided both teams with kit developed utilizing the latest technology as ASICS and refined through input from players. We also released replica jerseys. ASICS is Olympic and Paralympic Games Tokyo 2020 Gold Partner (Sporting Goods).
ASICS ANNUAL REPORT 2019 14
ASICS ANNUAL REPORT 2019 15
WHAT IS ASICS? • OUR STRATEGY • WITH OUR STAKEHOLDERS
CREATE DIFFERENTIATED INNOVATION
Create innovative products, services and processes that can drive exceptional changes in our customers’ lifestyles and experiences
ASICS Institute of Sport Science (ISS) plays a key role in the development of ASICS technologies, products and services. With a focus on “human-centric science,” the institute conducts research into materials and structures by analyzing human biomechanical characteristics. Research activities also cover the evaluation of production technology, products and materials, giving the institute insights into research from multiple perspectives.
At the same time, we work closely with other companies on innovative new technologies. Through our investment arm ASICS Ventures Corporation, we have invested in a number of startups.
At CES 2020 in Las Vegas, where ASICS exhibited for the first time, we showcased our prototype smart running shoes, which provide feedback to runners about changes in running gait and other metrics in real time.
HUMAN ATTRIBUTE RESEARCH ISS analyzes changes in form and load on the body during movement. This is different according to sport and gender.
MATERIALS RESEARCH The material research laboratory designs new resin, rubber and sponge materials used in ASICS footwear, helping to create even better shoes.
STRUCTURAL DESIGN RESEARCH Our researchers develop designs with the best fits for the human body using computer simulation that analyzes body reactions.
ANALYTICAL EVALUATION METHOD RESEARCH ISS conducts research to set baseline values and new evaluation methods to maintain and improve the quality of products and materials used in sports footwear, clothing and equipment.
PRODUCTION TECHNOLOGY RESEARCH While researching molding methods, ISS offers technical guidance for production plants in order to efficiently mass-produce the materials developed at ISS without compromising quality.
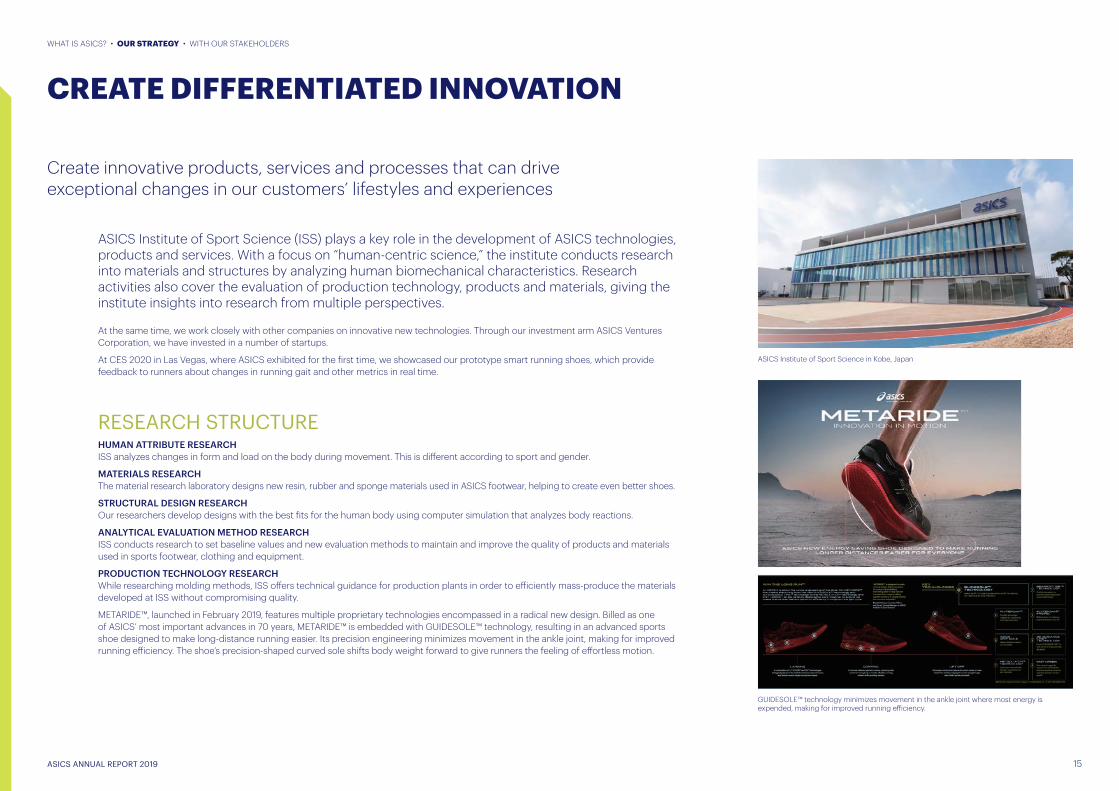
METARIDE™, launched in February 2019, features multiple proprietary technologies encompassed in a radical new design. Billed as one of ASICS’ most important advances in 70 years, METARIDE™ is embedded with GUIDESOLE™ technology, resulting in an advanced sports shoe designed to make long-distance running easier. Its precision engineering minimizes movement in the ankle joint, making for improved running efficiency. The shoe’s precision-shaped curved sole shifts body weight forward to give runners the feeling of effortless motion.
RESEARCH STRUCTURE
ASICS Institute of Sport Science in Kobe, Japan
GUIDESOLE™ technology minimizes movement in the ankle joint where most energy is expended, making for improved running efficiency.

ASICS ANNUAL REPORT 2019 16
WHAT IS ASICS? • OUR STRATEGY • WITH OUR STAKEHOLDERS
CREATE DIFFERENTIATED INNOVATION
TECHNOLOGY CREATION AND BRAND PROTECTION
Trademark and Design Patent Portfolio for Brand ProtectionOur principal ASICS and Onitsuka Tiger brands are protected by ASICS trademarks and vigilant in-house teams. Our core trademarks are promoted widely as symbols of ASICS’s identity, helping to differentiate our products and services from those of our competitors.
We strategically register trademarks in various territories around the world to protect our brands, as well as important product names and the key functions of those products.
We are also focused on building a design patent portfolio to efficiently protect our unique product designs. We aggressively exercise our rights to prevent third parties from imitating our unique designs, intentionally or unintentionally.
Brand Protection EffortsASICS and our industry in general is facing the issue of counterfeit products, which is becoming more serious as brands become more valuable. In particular, we are seeing an increase in counterfeit products with trademarks stolen by third parties in China, which is now one of the most serious issues faced by our industry. We call these products “third-generation counterfeits,” and we are committed to taking a tough stance against them.
We have been making every effort to tackle the issue, using various approaches to eliminate counterfeit products from the market. Working closely with authorities to raise awareness about the seriousness of the issue is an effective way of encouraging voluntary enforcement. We have proactively lobbied relevant authorities and stakeholders to bring their attention to third-generation counterfeits, which are difficult to tackle using conventional legal enforcement and are a threat to every brand owner. After a few years of work, our efforts are finally creating an environment that allows us to smoothly implement countermeasures against third-generation counterfeits based on close partnership with local authorities. In January 2018, one local authority in Beijing, China launched a large-scale enforcement campaign against stores selling third-generation counterfeits, and the campaign spread rapidly throughout the country. We have concurrently worked to reduce trademarks filed in bad-faith for third-generation counterfeits. A number of complaints against those applications have been made and our work has brought the issue to the attention of the authorities to improve their legal compliance. Our proactive efforts and successful outcomes have encouraged many other brand owners to take similar steps.
Building a Strategic Patent Portfolio to Support Technological DevelopmentMany ASICS patents are related to shoes – the Group's main products. We are building an effective patent portfolio in key markets where protection is required, such as the US, Europe, China and other territories of concern, as well as Japan. In 2018, we filed international patent applications for FLYTEFOAM™ LYTE, which we have positioned as a key technology to help realize sustainable societies. In early 2019, we initiated and started implementing a new patent strategy project based on advanced big-data analysis of patent and marketing information using state-of-the-art technologies (Intellectual Property Landscape). The goal is to help identify potential new technologies and build a differentiated patent portfolio that makes ASICS more competitive and effective in the global market.
ASICS puts great importance on intellectual property (IP) rights to mitigate the risk of infringing third-party rights, ensure the success and establishment of the advantageous and competitive position for Group businesses, and protect its brands.We aim to secure patent protection for our inventions at the earliest stages of research and development using advanced analytic methods. We also conduct damage limitation research to respect third-party rights and monitor and analyze technology trends to support the development of ASICS’ own strategies.In addition, we aggressively enforce ASICS' IP rights with unique and strategic approaches, aiming to reduce counterfeit products and increase ASICS brand value.
ASICS FLYTEFOAM™ formed using a polymer foam containing “cellulose nanofiber” has excellent shape-recovering properties that make for a long-lasting cushioning experience
X100 100µm

We aim to create value not only for our customers and shareholders, but also for the world around us in every aspect of our business.
WITH OURSTAKEHOLDERS
ASICS ANNUAL REPORT 2019 17
Sustainability is one of the main themes Olympic and Paralympic Games Tokyo 2020 will focus on. We are trying to enhance our effort toward sustainability as the Gold Partner of sporting goods category of Tokyo 2020.
ASICS ANNUAL REPORT 2019 18
WHAT IS ASICS? • OUR STRATEGY • WITH OUR STAKEHOLDERS
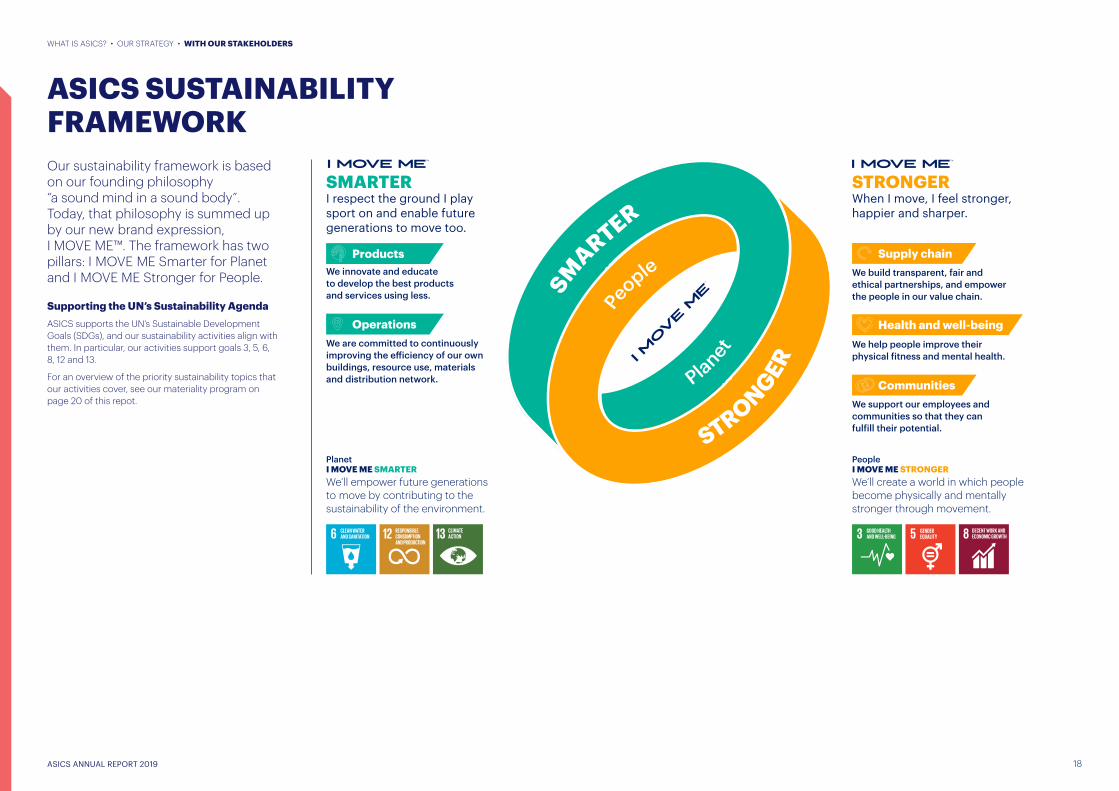
ASICS SUSTAINABILITY FRAMEWORKOur sustainability framework is based on our founding philosophy “a sound mind in a sound body”. Today, that philosophy is summed up by our new brand expression, I MOVE ME™. The framework has two pillars: I MOVE ME Smarter for Planet and I MOVE ME Stronger for People.
Supporting the UN’s Sustainability AgendaASICS supports the UN’s Sustainable Development Goals (SDGs), and our sustainability activities align with them. In particular, our activities support goals 3, 5, 6, 8, 12 and 13.
For an overview of the priority sustainability topics that our activities cover, see our materiality program on page 20 of this repot.
SMARTER
People
STRONGER
Planet
SMARTERI respect the ground I play sport on and enable future generations to move too.
ProductsWe innovate and educate to develop the best products and services using less.
OperationsWe are committed to continuously improving the efficiency of our own buildings, resource use, materials and distribution network.
STRONGERWhen I move, I feel stronger, happier and sharper.
Supply chainWe build transparent, fair and ethical partnerships, and empower the people in our value chain.
Health and well-beingWe help people improve their physical fitness and mental health.
CommunitiesWe support our employees and communities so that they can fulfill their potential.
People I MOVE ME STRONGER We’ll create a world in which people become physically and mentally stronger through movement.
Planet I MOVE ME SMARTERWe’ll empower future generations to move by contributing to the sustainability of the environment.

Materiality matrix
Hig
hIm
port
ance
to s
take
hold
ers
Low
Low HighStrategic importance to ASICS
Diversityand
inclusion
Physicalinactivity
Innovativeand e�icient
productdesign
Productsafety &quality
Materialand producttraceability
Energye�iciency and CO2
emissions
Ethicalworkplacestandards
Workplacehealth &safety
Resourcescarcity
Most material issues High priority issues Movement from last year’s position
Faircompensation
and performance
Corporategovernance
anddisclosure
Watere�iciencyand waterpollution
WHAT IS ASICS? • OUR STRATEGY • WITH OUR STAKEHOLDERS
MATERIAL ISSUES
ASICS ANNUAL REPORT 2019 19
The ASICS Group operates a continuous materiality program that identifies and evaluates the sustainability issues that are most relevant to our stakeholders and to our business.
This program has two main elements: our materiality matrix, which helps us prioritize sustainability issues, and our value chain analysis, which shows us where material issues occur in our value chain. Together, these elements help us focus on the issues and areas that matter most to our stakeholders and our business.
Materiality matrixOur materiality matrix maps out the sustainability issues identified by internal and external stakeholders according to their level of priority. The matrix is based on analysis of our consultations with stakeholders, international frameworks, our business priorities and our sustainability performance.
We update the matrix regularly to reflect changes in the priorities of our stakeholders and the strategic priorities of our company.
The materiality matrix opposite shows the 12 sustainability issues identified as most material to our business in 2019.
Looking ahead: a new approach to materiality2020 is the final year of our current five-year strategic plan. To prepare us for the next phase of our business strategy and sustainability strategy, our global sustainability team substantially updated our materiality matrix during the last quarter of 2019. The update involved qualitative interviews and quantitative surveys with both internal stakeholders such as employees and management, as well as external stakeholders including investors, NGOs, consumers, customers, suppliers and industry associations.
The updated materiality will be more focused and help us to create a new strategy as our business expands and explores new areas.

You can learn more about our 2020 sustainability targets and progress in our SUSTAINABILITY REPORT
http://corp.asics.com/en/csr/csr_reporting
WHAT IS ASICS? • OUR STRATEGY • WITH OUR STAKEHOLDERS
2020 SUSTAINABILITY TARGETS
The plan sets out a series of five-year sustainability targets, prioritizing six key areas:
1 Sustainability of products and services
2 Management of product chemical safety and traceability
3 Operational eco-efficiency and management systems
4Safe and ethical workplace standards and sustainable practices at Tier 1 and Tier 2 suppliers
5Sound governance and disclosure, organizational efficiency and developing an engaged workforce
6 Contributing to healthier communities through movement and sport
SMARTERLearn more
STRONGER Products
� Continue to assess footwear and apparel products with sustainability indicators and criteria aligning with the science-based targets and other product and material targets.1
� 10% reduction of CO2 emissions per item related to footwear manufacturing (Scope 3, 2015 baseline).
� 55% reduction of CO2 emissions per product manufactured from our supply chain2 by 2030 (Scope 3, 2015 baseline).
� Source 80% of the leather by volume we use for ASICS, ASICSTIGER and Onitsuka Tiger branded footwear from Leather Working Group (LWG) medal-rated suppliers.
� Source 100% more sustainable cotton for apparel and accessories by 2025.
� All Tier 1 supplier factories to meet ASICS C-Level or above.
� All Tier 1 strategic partner factories to meet ASICS B-Level or above, and self-report via Higg Facility Social Labor Module (Higg FSLM).
� All Tier 1 ASICS A- and B-level factories to be trained in self-governance on CSR in combination with ASICS and/or third-party verification.
� All nominated Tier 2 suppliers meet ASICS C-Level or above.
Supply Chain
� Establish global ASICS HR systems and work environment.
� Female managers appointed in all business divisions of ASICS Headquarters. Ratio of females in manager and senior positions >15%.
� Alignment on all global community engagement activities by end 2016.
Notes: 1 Aligned indicators with the SAC Higg Product Tools.2 Target scope is ‘purchased goods and services’ and ‘end-of-life
treatment of sold products’.3 Updated the target in 2019.4 Sites that are able to measure and report their waste.
Operations
� 5% absolute CO2 emissions reduction from direct operations (Scopes 1 & 2, 2015 baseline).
� 38% absolute CO2 emissions reduction from direct operations by 20303 (Scopes 1 & 2, 2015 baseline).
� 98% waste recovered or recycled at our direct operations.4
� Establish global ASICS Environmental Management System (including ISO 14001 at all key locations).
� 90% Tier 1 strategic partner factories improve their SAC Higg Facility Environmental Module (Higg FEM) Score compared to baseline.
� 90% of all nominated Tier 2 suppliers improve their SAC Higg FEM Score compared to baseline.
� 10% reduction of water and waste impact per item produced by Tier 1 footwear factories.
Communities
ASICS ANNUAL REPORT 2019 20

WHAT IS ASICS? • OUR STRATEGY • WITH OUR STAKEHOLDERS
TAKING ACTION ON CLIMATE CHANGE
ASICS ANNUAL REPORT 2019 21
The escalating climate crisis is the planet’s most urgent environmental challenge. Climate change is also a direct threat to our business, restricting our ability to move and take part in sport, as well as impacting production sites and logistical routes in our supply chain.
* Target scope is ‘purchased goods and services’ and ‘end-of-life treatment of sold products’.
CO2 emissions reduction targets for 2030
Scopes 1 and 2:
38%Reduction in absolute CO2 emissions
from our direct operations
Reduction in CO2 emissions from oursupply chain per product manufactured
(2015 baseline)
Scope 3:
55%(2015 baseline)*
Action 1
60%Or above boost
to the ratioof renewableenergy in our
business facilities
Action 2
30%Reduction to the amount
of energy our Tier 1supplier factories useto manufacture each
of our products
Action 3
100%Recycled polyesterto replace standardpolyester materialsin shoe uppers and
sportswear products
Sustainability is at the core of our business, and a shared responsibility at ASICS. It involves all company divisions and colleagues at every level.
Our Board of Directors oversees ASICS’s sustainability strategy, and is responsible for integrating and prioritizing sustainability in our corporate objectives. In 2019, we established a Sustainability Committee, chaired by ASICS President and COO, to report directly to the Board of Directors on sustainability risks and opportunities. The Committee’s responsibilities include reviewing our group-wide sustainability strategy, roadmap and action plan, as well as reporting on progress against our sustainability targets on a divisional level. The Sustainability Committee works alongside ASICS’ existing Risk Management Committee.
For our governance structure, see page 27.
We recognize that our industry contributes to the global greenhouse gases emissions that are causing climate change – for example, through the greenhouse gases produced by our manufacturing and distribution processes, and by the energy we use to power our stores and office buildings around the world. The materials we use to make our products can also contribute to our overall emissions. For example, polyester and polyurethane require energy for extraction, manufacturing and transportation. These materials are derived from fossil fuels, and release greenhouse gases when they are incinerated at the end of their life.
At ASICS, we’re determined to be part of global efforts to address climate change by driving down emissions both from our own operations and from our supply chain. To support this, ASICS has committed to setting science-based carbon reduction targets, in line with the goal of the Paris Agreement.
In 2018, ASICS became the first sporting goods company to have its science-based targets approved by the Science Based Targets initiative (SBTi). In 2019, we accelerated our action on climate change by supporting the Financial Stability Board’s Task Force on Climate-related Financial Disclosures (TCFD) and by committing to set 1.5°C science-based emissions reduction targets aligned with a net-zero future by 2050. Our new commitment is aligned with what the Intergovernmental Panel on Climate Change (IPCC)report indicates is necessary to limit the worst impacts of climate change.
We have also joined the UNFCCC’s Fashion for Global Climate Action initiative as a signatory to the Fashion Industry Charter for Climate Action. By signing the Charter, we demonstrate our commitment to ensuring the fashion sector is on the path to a low-carbon future.
We will continue to actively engage our supply chain partners, consumers and other stakeholders on these issues and work toward achieving our targets together.
Find out more about Science Based Targets initiative https://www.sciencebasedtargets.org
Find out more about TCFD https://www.fsb-tcfd.org/
Find out more about Fashion Industry Charter for Climate Action https://unfccc.int/climate-action/sectoral-engagement/fashion-for-global-climate-action

WHAT IS ASICS? • OUR STRATEGY • WITH OUR STAKEHOLDERS
BREATHING NEW LIFE INTO USED SPORTSWEAR FOR TOKYO 2020
ASICS ANNUAL REPORT 2019 22
ASICS, the only Olympic and Paralympic Games Tokyo 2020 Gold Partner in the sporting goods category, is to produce official sportswear made of recycled clothes donated from people across the country to the Tokyo 2020 Japan Olympic and Paralympic Team. Sustainability will be a major focus for Tokyo 2020 – and in 2019, ASICS launched a new project to help make the Games the most sustainable ever.
The ASICS REBORN WEAR PROJECT (ARWPJ) gives people across the country an exciting new way to support the Japan Olympic and Paralympic team, while shining a spotlight on sustainability. Through the project, people could donate used sportswear at around 250 locations throughout the country, such as ASICS stores, sports retailers, Tokyo 2020 Games partner offices and universities. The donated clothing will then be reborn as Podium Jacket, Podium Pants and footwear for the Tokyo 2020 Japan Olympic and Paralympic Teams, using advanced recycling technology. Altogether, the project gathered over four metric tons of clothing between January and May 2019. Used sports gear is often linked to treasured memories and stories – so the project gives donors a unique way to honor those memories, and feel emotionally connected to Tokyo 2020 Japan Team.
Through ARWPJ, ASICS is using the global stage of the Games to showcase how sporting goods companies can contribute to tackling climate change and building a sustainable society. The project highlights how a circular production model and new manufacturing techniques can reduce environmental impacts. This summer, ASICS plans to sell shoes made of recycled textile as a legacy of this project.
ARWPJ is just one example of how ASICS is helping to bring sustainability to the Games. The official uniforms we produced for Field Cast and City Cast are made with recycled polyester and bio-based material, while the shoes have been colored using a special dyeing process that reduces water use.
For more about ARWPJ https://www.asics.com/jp/ja-jp/tokyo2020/
rebornwear (Japanese Only)
Circular production process for the official sportswear.
©JOC/JPC/ASICS
*Tokyo 2020 Games have been postponed to 2021 due to COVID-19, and we will continue these initiatives to fulfill our responsibilities.

TOKYO 2020 GAMES: SHINING A LIGHT ON SUPPLY CHAIN SUSTAINABILITYOur commitment to upholding ethical standards in our supply chain supports the Tokyo 2020 vision.
Olympic and Paralympic Games Tokyo 2020 will highlight the importance of sustainability in all aspects of sport – and that includes the sporting industry’s supply chain. To support that aim, the Tokyo Organising Committee of the Olympic and Paralympic Games has introduced a sourcing code covering all products and services procured for the Games. As the only Olympic and Paralympic Games Tokyo 2020 Gold Partner in the sporting goods category, ASICS is committed to ensuring that every product we supply for the Games has been produced according to the code.
Manufacturing and distributing ASICS products involves a supply chain made up of thousands of people all over the world. At ASICS, we take our responsibility to those people very seriously. Through our Policy of Engagement (PoE), we seek to ensure fair business practices and continuously improve labor conditions across our supply chain. Our PoE is aligned with international standards such as ILO’s Fundamental Conventions and the Code of Conduct of the World Federation of the Sporting Goods Industry (WFSGI).
We regularly carry out social assessments of our suppliers to ensure our standards are upheld. These assessments are carried out with the support of independent third party stakeholders. For example, in 2014 we became the first Japanese company to join ILO’s Better Work (BW)/Better Factories Cambodia program, and we have been working closely with our suppliers in Vietnam, Cambodia, and Indonesia since then.
Tokyo 2020 Games are our biggest opportunity not only for our branding and business, but also promoting sustainability. Developing our sustainable and responsible supply chain will be a vital part of our Olympic legacy.
WHAT IS ASICS? • OUR STRATEGY • WITH OUR STAKEHOLDERS
ASICS ANNUAL REPORT 2019 23
Workers in our supply chain.
The official uniform for Field Cast of Tokyo 2020 Games
FUNDAMENTAL APPROACH TO CORPORATE GOVERNANCE
WHAT IS ASICS? • OUR STRATEGY • WITH OUR STAKEHOLDERS
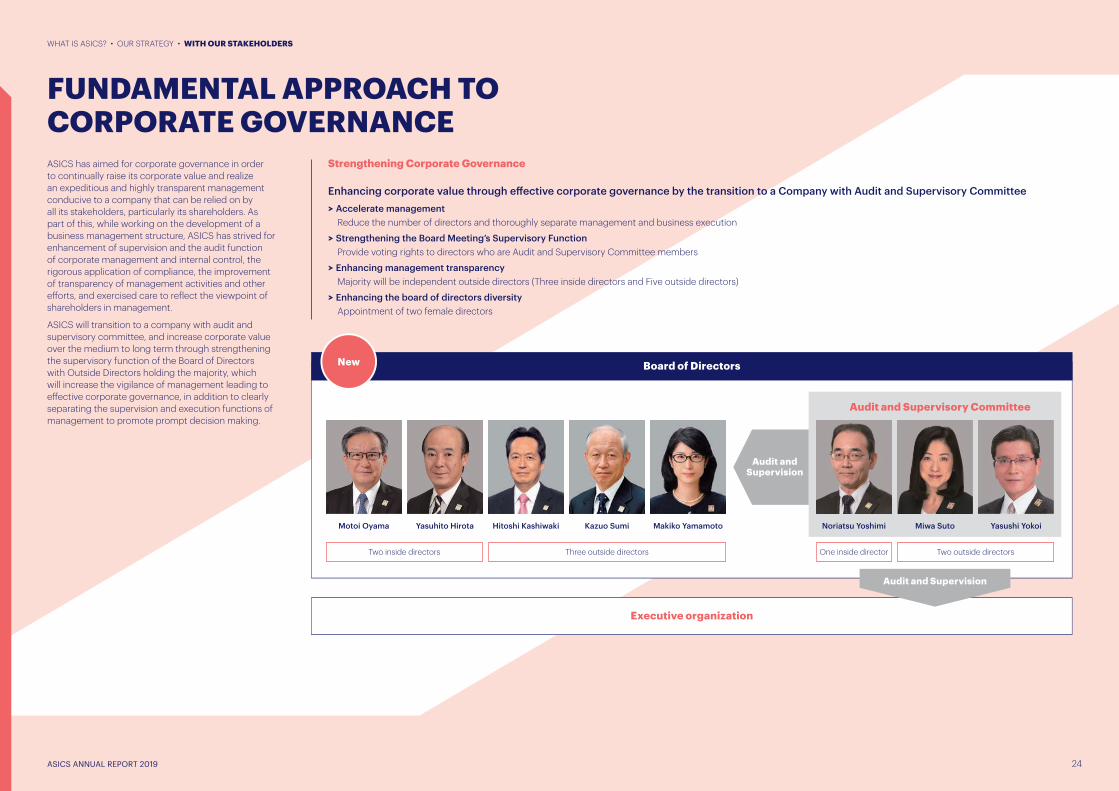
ASICS has aimed for corporate governance in order to continually raise its corporate value and realize an expeditious and highly transparent management conducive to a company that can be relied on by all its stakeholders, particularly its shareholders. As part of this, while working on the development of a business management structure, ASICS has strived for enhancement of supervision and the audit function of corporate management and internal control, the rigorous application of compliance, the improvement of transparency of management activities and other efforts, and exercised care to reflect the viewpoint of shareholders in management.
ASICS will transition to a company with audit and supervisory committee, and increase corporate value over the medium to long term through strengthening the supervisory function of the Board of Directors with Outside Directors holding the majority, which will increase the vigilance of management leading to effective corporate governance, in addition to clearly separating the supervision and execution functions of management to promote prompt decision making.
Strengthening Corporate Governance
Enhancing corporate value through effective corporate governance by the transition to a Company with Audit and Supervisory Committee� Accelerate management Reduce the number of directors and thoroughly separate management and business execution
� Strengthening the Board Meeting’s Supervisory Function Provide voting rights to directors who are Audit and Supervisory Committee members
� Enhancing management transparency Majority will be independent outside directors (Three inside directors and Five outside directors)
� Enhancing the board of directors diversity Appointment of two female directors
ASICS ANNUAL REPORT 2019 24
Noriatsu YoshimiMakiko YamamotoKazuo SumiHitoshi KashiwakiYasuhito HirotaMotoi Oyama Miwa Suto Yasushi Yokoi
Audit andSupervision
Board of Directors
Audit and Supervisory Committee
Audit and Supervision
New
Executive organization
One inside director Two outside directorsThree outside directorsTwo inside directors
CORPORATE GOVERNANCE STRUCTURE
Internal Audit O�ice
Internal Control Committee
Disclosure Committee
Information Security Committee
Compliance Committee
Risk Management Committee
Executive O�icers
Executive Board Meeting
President and COOExecutive Organization
Divisions and Group Companies
Sustainability Committee
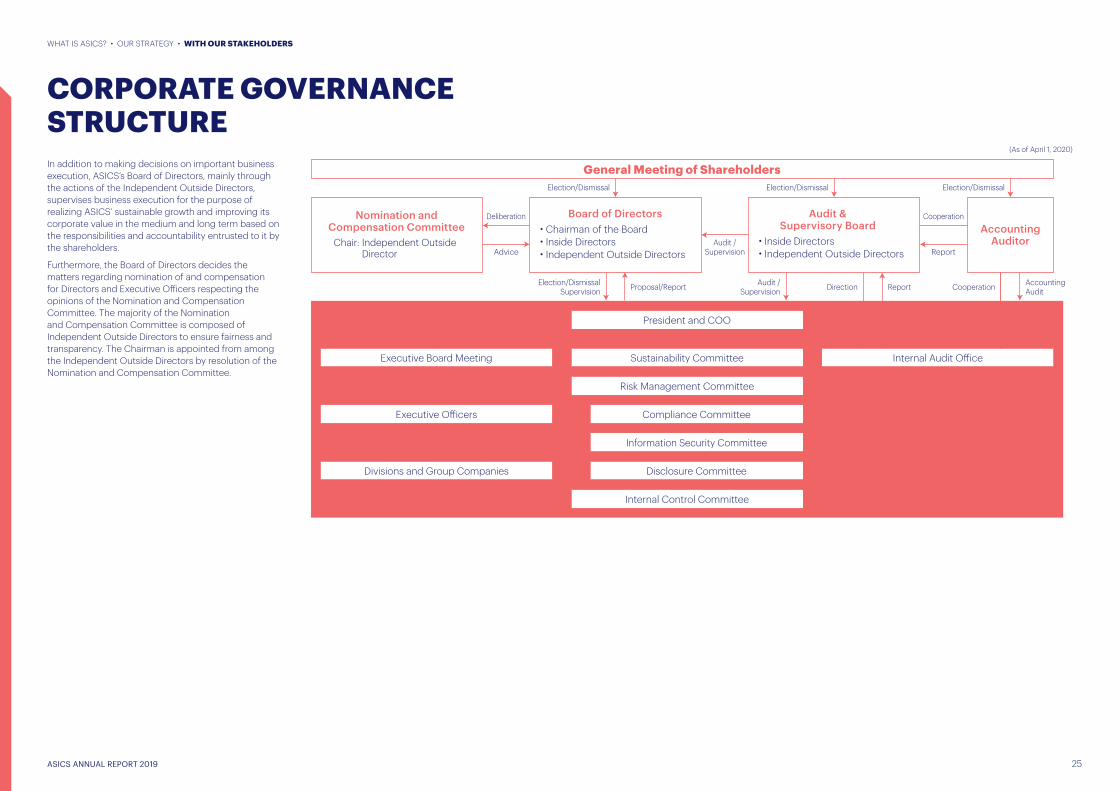
General Meeting of Shareholders
Board of Directors・ Chairman of the Board・ Inside Directors・ Independent Outside Directors
Audit &Supervisory Board
・ Inside Directors・ Independent Outside Directors
Chair: Independent Outside Director
Nomination andCompensation Committee Accounting
AuditorAudit /SupervisionAdvice
Deliberation
Report
Cooperation
Audit /Supervision CooperationDirectionProposal/ReportElection/Dismissal
SupervisionAccountingAudit
Election/DismissalElection/DismissalElection/Dismissal
Report
(As of April 1, 2020)
WHAT IS ASICS? • OUR STRATEGY • WITH OUR STAKEHOLDERS
ASICS ANNUAL REPORT 2019 25
In addition to making decisions on important business execution, ASICS’s Board of Directors, mainly through the actions of the Independent Outside Directors, supervises business execution for the purpose of realizing ASICS’ sustainable growth and improving its corporate value in the medium and long term based on the responsibilities and accountability entrusted to it by the shareholders.
Furthermore, the Board of Directors decides the matters regarding nomination of and compensation for Directors and Executive Officers respecting the opinions of the Nomination and Compensation Committee. The majority of the Nomination and Compensation Committee is composed of Independent Outside Directors to ensure fairness and transparency. The Chairman is appointed from among the Independent Outside Directors by resolution of the Nomination and Compensation Committee.
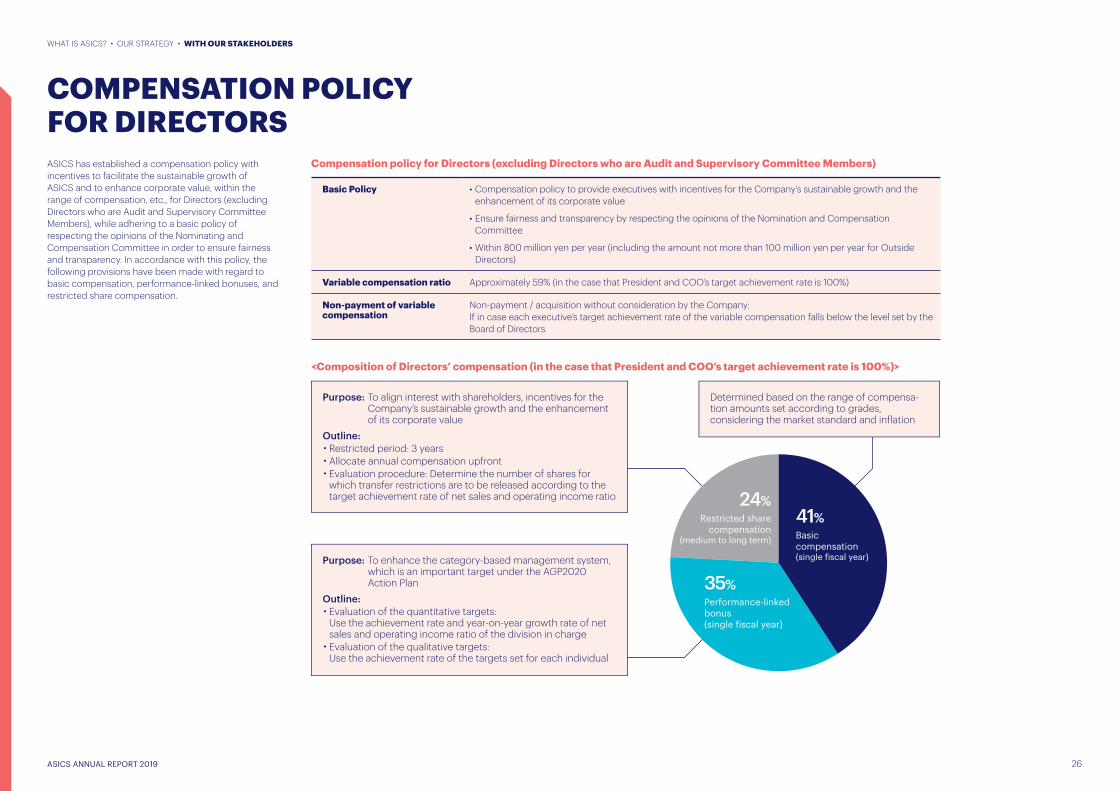
Basic Policy • Compensation policy to provide executives with incentives for the Company’s sustainable growth and the enhancement of its corporate value
• Ensure fairness and transparency by respecting the opinions of the Nomination and Compensation Committee
• Within 800 million yen per year (including the amount not more than 100 million yen per year for Outside Directors)
Variable compensation ratio Approximately 59% (in the case that President and COO’s target achievement rate is 100%)
Non-payment of variable compensation
Non-payment / acquisition without consideration by the Company: If in case each executive’s target achievement rate of the variable compensation falls below the level set by the Board of Directors
Compensation policy for Directors (excluding Directors who are Audit and Supervisory Committee Members)
COMPENSATION POLICY FOR DIRECTORSASICS has established a compensation policy with incentives to facilitate the sustainable growth of ASICS and to enhance corporate value, within the range of compensation, etc., for Directors (excluding Directors who are Audit and Supervisory Committee Members), while adhering to a basic policy of respecting the opinions of the Nominating and Compensation Committee in order to ensure fairness and transparency. In accordance with this policy, the following provisions have been made with regard to basic compensation, performance-linked bonuses, and restricted share compensation.
WHAT IS ASICS? • OUR STRATEGY • WITH OUR STAKEHOLDERS
ASICS ANNUAL REPORT 2019 26
Purpose: To align interest with shareholders, incentives for the Company’s sustainable growth and the enhancement of its corporate value
Outline:・ Restricted period: 3 years・ Allocate annual compensation upfront・ Evaluation procedure: Determine the number of shares for
which transfer restrictions are to be released according to the target achievement rate of net sales and operating income ratio
Purpose: To enhance the category-based management system, which is an important target under the AGP2020 Action Plan
Outline:・ Evaluation of the quantitative targets:
Use the achievement rate and year-on-year growth rate of net sales and operating income ratio of the division in charge・ Evaluation of the qualitative targets:
Use the achievement rate of the targets set for each individual
Determined based on the range of compensa-tion amounts set according to grades, considering the market standard and inflation
Basic compensation(single fiscal year)
41%
Performance-linked bonus(single fiscal year)
35%
Restricted sharecompensation
(medium to long term)
24%
<Composition of Directors’ compensation (in the case that President and COO’s target achievement rate is 100%)>
RISK MANAGEMENT
WHAT IS ASICS? • OUR STRATEGY • WITH OUR STAKEHOLDERS
ASICS ANNUAL REPORT 2019 27
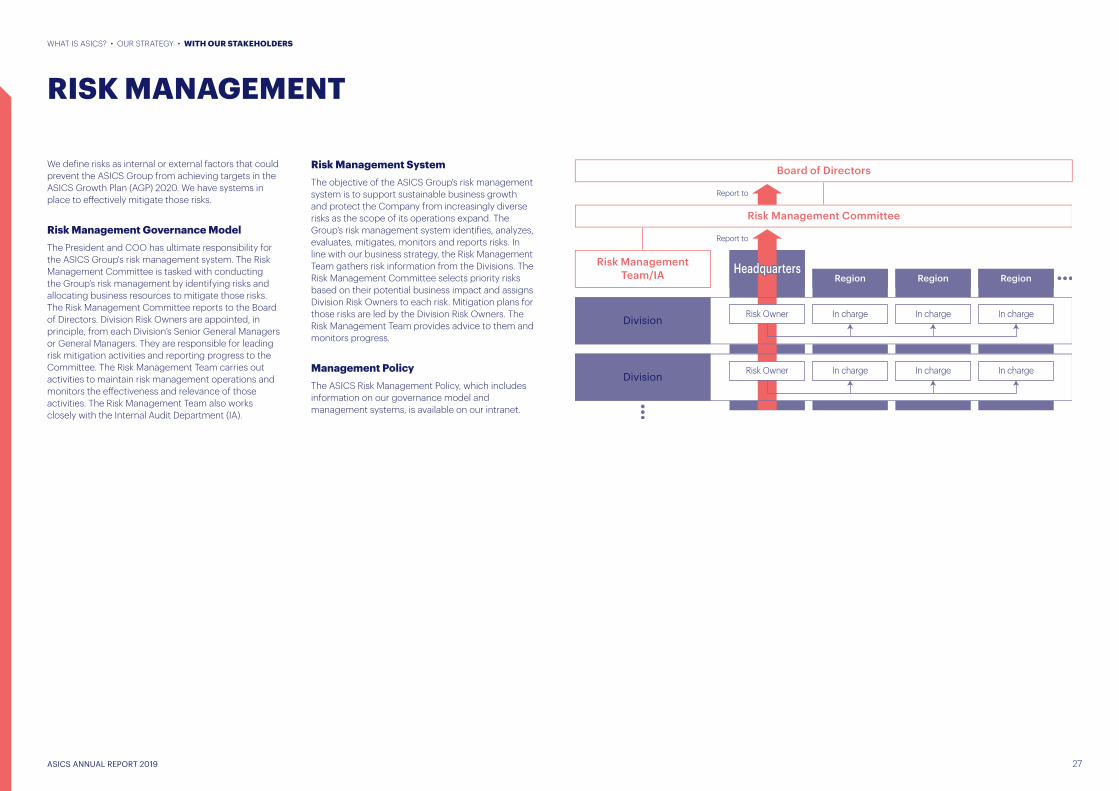
We define risks as internal or external factors that could prevent the ASICS Group from achieving targets in the ASICS Growth Plan (AGP) 2020. We have systems in place to effectively mitigate those risks.
Risk Management Governance ModelThe President and COO has ultimate responsibility for the ASICS Group's risk management system. The Risk Management Committee is tasked with conducting the Group’s risk management by identifying risks and allocating business resources to mitigate those risks. The Risk Management Committee reports to the Board of Directors. Division Risk Owners are appointed, in principle, from each Division’s Senior General Managers or General Managers. They are responsible for leading risk mitigation activities and reporting progress to the Committee. The Risk Management Team carries out activities to maintain risk management operations and monitors the effectiveness and relevance of those activities. The Risk Management Team also works closely with the Internal Audit Department (IA).
Risk Management SystemThe objective of the ASICS Group's risk management system is to support sustainable business growth and protect the Company from increasingly diverse risks as the scope of its operations expand. The Group’s risk management system identifies, analyzes, evaluates, mitigates, monitors and reports risks. In line with our business strategy, the Risk Management Team gathers risk information from the Divisions. The Risk Management Committee selects priority risks based on their potential business impact and assigns Division Risk Owners to each risk. Mitigation plans for those risks are led by the Division Risk Owners. The Risk Management Team provides advice to them and monitors progress.
Management PolicyThe ASICS Risk Management Policy, which includes information on our governance model and management systems, is available on our intranet.
In charge In charge In chargeRisk Owner
In charge In charge In chargeRisk Owner
Region
Division
Division
Region Region
Risk ManagementTeam/IA
Report to
Report to
Risk Management Committee
Board of Directors
Headquarters
RESPONSE TO MAJOR RISKS
WHAT IS ASICS? • OUR STRATEGY • WITH OUR STAKEHOLDERS
ASICS ANNUAL REPORT 2019 28
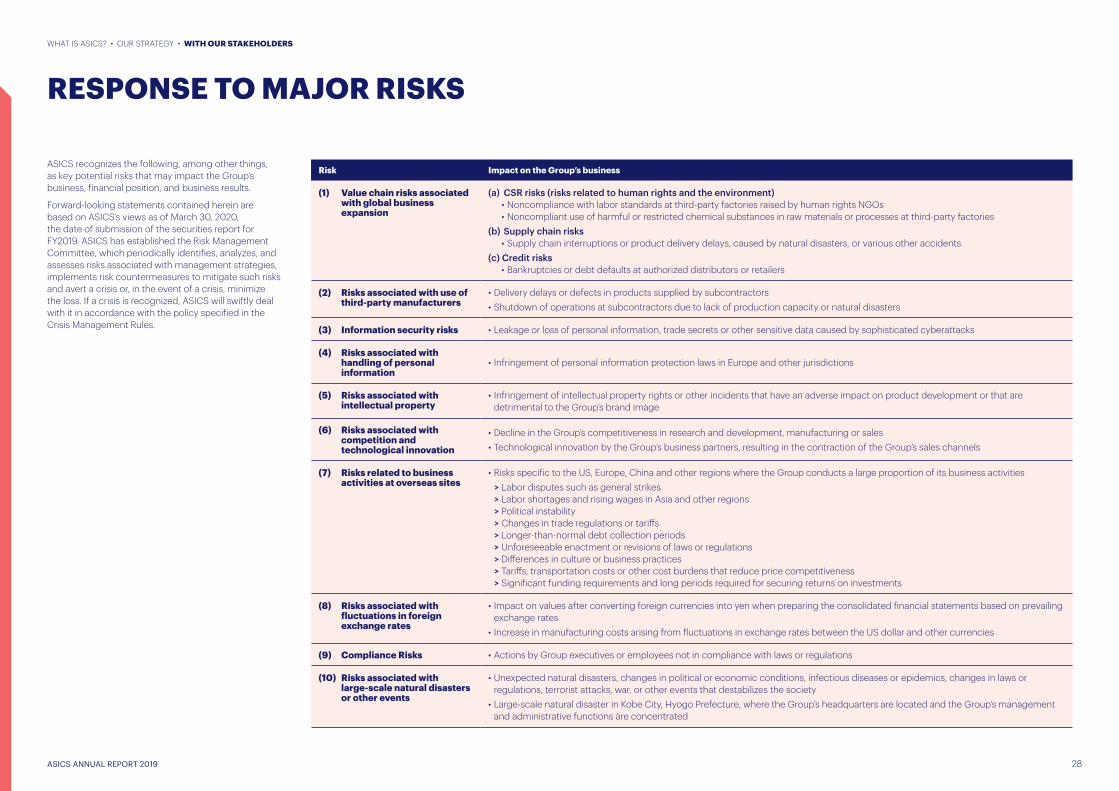
Risk Impact on the Group’s business
(1) Value chain risks associated with global business expansion
(a) CSR risks (risks related to human rights and the environment) • Noncompliance with labor standards at third-party factories raised by human rights NGOs • Noncompliant use of harmful or restricted chemical substances in raw materials or processes at third-party factories
(b) Supply chain risks • Supply chain interruptions or product delivery delays, caused by natural disasters, or various other accidents
(c) Credit risks • Bankruptcies or debt defaults at authorized distributors or retailers
(2) Risks associated with use of third-party manufacturers
• Delivery delays or defects in products supplied by subcontractors• Shutdown of operations at subcontractors due to lack of production capacity or natural disasters
(3) Information security risks • Leakage or loss of personal information, trade secrets or other sensitive data caused by sophisticated cyberattacks
(4) Risks associated with handling of personal information
• Infringement of personal information protection laws in Europe and other jurisdictions
(5) Risks associated with intellectual property
• Infringement of intellectual property rights or other incidents that have an adverse impact on product development or that are detrimental to the Group’s brand image
(6) Risks associated with competition and technological innovation
• Decline in the Group’s competitiveness in research and development, manufacturing or sales• Technological innovation by the Group’s business partners, resulting in the contraction of the Group’s sales channels
(7) Risks related to business activities at overseas sites
• Risks specific to the US, Europe, China and other regions where the Group conducts a large proportion of its business activities � Labor disputes such as general strikes � Labor shortages and rising wages in Asia and other regions � Political instability � Changes in trade regulations or tariffs � Longer-than-normal debt collection periods � Unforeseeable enactment or revisions of laws or regulations � Differences in culture or business practices � Tariffs, transportation costs or other cost burdens that reduce price competitiveness � Significant funding requirements and long periods required for securing returns on investments
(8) Risks associated with fluctuations in foreign exchange rates
• Impact on values after converting foreign currencies into yen when preparing the consolidated financial statements based on prevailing exchange rates
• Increase in manufacturing costs arising from fluctuations in exchange rates between the US dollar and other currencies
(9) Compliance Risks • Actions by Group executives or employees not in compliance with laws or regulations
(10) Risks associated with large-scale natural disasters or other events
• Unexpected natural disasters, changes in political or economic conditions, infectious diseases or epidemics, changes in laws or regulations, terrorist attacks, war, or other events that destabilizes the society
• Large-scale natural disaster in Kobe City, Hyogo Prefecture, where the Group’s headquarters are located and the Group’s management and administrative functions are concentrated
ASICS recognizes the following, among other things, as key potential risks that may impact the Group’s business, financial position, and business results.
Forward-looking statements contained herein are based on ASICS’s views as of March 30, 2020, the date of submission of the securities report for FY2019. ASICS has established the Risk Management Committee, which periodically identifies, analyzes, and assesses risks associated with management strategies, implements risk countermeasures to mitigate such risks and avert a crisis or, in the event of a crisis, minimize the loss. If a crisis is recognized, ASICS will swiftly deal with it in accordance with the policy specified in the Crisis Management Rules.

MANAGEMENT’S DISCUSSION AND ANALYSISPerformance Analysis1) Net sales
Net sales decreased 2.2% (an increase of 1.6% if applying the previous fiscal year’s foreign exchange rate) to ¥378,051 million mainly due to weak sales of the Apparel and Equipment category, in addition to the effect of foreign exchange rates despite strong sales of the Performance Running category and the Onitsuka Tiger category on a local currency basis.
2) Gross profit
Gross profit decreased 0.5% to ¥179,681 million, mainly due to the effect of foreign exchange rates on account of the strong yen, despite an improved cost of sales ratio.
3) Operating income
Selling, general and administrative expenses decreased 0.6% to ¥169,047 million due to the effects of business restructuring carried out at the end of the previous fiscal year despite strategic marketing investment.
As a result, operating income increased 1.1% to ¥10,634 million.
4) Profit attributable to owners of parent
Profit attributable to owners of parent was ¥7,097 million, mainly due to the recording of deferred tax assets due to tax consolidation in Japan applied from the next fiscal year.
Category InformationBusiness results by category were as follows. Overhead costs are allocated to each category based on a certain method. The results of the previous fiscal year have been reclassified to reflect changes in some categories in the current fiscal year.
Effective from this first quarter, Group companies’ e-commerce platform usage fees, etc., are included in the results of each category. Operating income without Group companies’ e-commerce platform usage fees is shown as the same basis as the previous fiscal year.
1) Performance Running
Net sales decreased 0.4% (an increase of 4.4% if applying the previous fiscal year’s foreign exchange rate) to ¥170,150 million mainly due to weak sales in Europe as well as the effect of foreign exchange rates, despite strong sales in Japan, North America, Oceania and South America. Operating income decreased 53.7% (a decrease of 49.2% if applying the previous fiscal year’s foreign exchange rate) to ¥3,964 million.
In business results by category measured by the same basis as the previous fiscal year, operating income decreased 31.2% (a decrease of 25.9% if applying the previous fiscal year’s foreign exchange rate) to ¥5,896 million.
2) Sports Style
Net sales decreased 12.1% (a decrease of 7.7% if applying the previous fiscal year’s foreign exchange rate) to ¥34,272 million. Operating loss amounted to ¥405 million.
In business results by category measured by the same basis as the previous fiscal year, operating loss was ¥7 million.
3) Core Performance Sports
Even though sales increased 1.4% (an increase of 4.4% using the previous fiscal year’s foreign exchange rate) to ¥41,737 million mainly due to strong sales in Japan and North America, operating loss was ¥1,336 million due to strategic marketing investments.
In business results by category measured by the same basis as the previous fiscal year, operating loss was ¥1,069 million.
4) Apparel and Equipment
Net sales decreased 13.3% (a decrease of 10.4% if applying the previous fiscal year’s foreign exchange rate) to ¥39,227 million. An operating loss persisted.
5) Onitsuka Tiger
Net sales increased 6.3% (an increase of 10.1% if applying the previous fiscal year’s foreign exchange rate) to ¥45,597 million due to strong sales in Japan, the Southeast and South Asia and Korea. Operating income increased 10.9% (an increase of 14.6% if applying the previous fiscal year’s foreign exchange rate) to ¥8,303 million.
In business results by category measured by the same basis as the previous fiscal year, operating income increased 13.3% (an increase of 17.1% if applying the previous fiscal year’s foreign exchange rate) to ¥8,482 million.
Financial ConditionAs for the consolidated financial position as of December 31, 2019, total assets increased 3.8% from the end of the previous fiscal year to ¥316,115 million, total liabilities increased 19.0% from the end of the previous fiscal year to ¥163,792 million and net assets decreased 8.7% from the end of the previous fiscal year to ¥152,323 million.
Cash FlowsAs for cash flows as of December 31, 2019, cash and cash equivalents (hereinafter, “cash”) decreased ¥27,893 million from the end of the previous fiscal year to ¥37,985 million.
The respective cash flow positions and main factors behind the changes are as follows:
1) Cash flows from operating activities
Net cash provided by operating activities was ¥14,792 million, an increase of ¥3,743 million compared with the same period in the previous fiscal year.
Major sources of cash were ¥12,917 million from depreciation and amortization and ¥10,207 million from profit before income taxes, while major uses of cash were ¥6,248 million for an increase in inventories, and ¥5,876 million for income taxes paid.
2) Cash flows from investing activities
Net cash used in investing activities was ¥12,186 million, an increase of ¥6,719 million compared with the same period in the previous fiscal year.
Major uses of cash were ¥6,450 million for purchases of intangible assets and ¥4,812 million for purchases of property, plant and equipment.
3) Cash flows from financing activities
Net cash used in financing activities was ¥29,471 million, an increase of ¥15,718 million compared with the same period in the previous fiscal year.
Major uses of cash were ¥30,000 million for the redemption of bonds with stock acquisition rights, ¥10,002 million for the purchases of treasury shares, ¥6,828 million for the repayment of lease obligations and ¥4,532 million for cash dividends paid, while major sources of cash were ¥19,911 million for the issuance of bonds.
ASICS ANNUAL REPORT 2019 29

ASICS ANNUAL REPORT 2019 30
ASICS Corporation and Consolidated SubsidiariesDecember 31, 2019
CONSOLIDATED BALANCE SHEET
Millions of yen
Thousands ofU.S. dollars
(Note 1)
ASSETS 2019 2018 2019
Current assets:
Cash and deposits (Notes 7 and 20)........................................................................................... ¥ 39,199 ¥ 68,287 $ 359,624
Notes and accounts receivable (Note 20):
Trade........................................................................................................................................ 65,191 66,819 598,083
Less allowance for doubtful receivables ................................................................................. (1,497) (2,051) (13,734)
Inventories (Note 9) ..................................................................................................................... 93,159 89,086 854,670
Other current assets ................................................................................................................... 18,466 16,436 169,412
Total current assets ................................................................................................................. 214,518 238,577 1,968,055
Property, plant and equipment:
Land (Note 10)............................................................................................................................. 5,798 5,809 53,193
Buildings and structures (Note 10).............................................................................................. 37,951 37,855 348,174
Machinery, equipment and vehicles ........................................................................................... 3,716 3,559 34,092
Tools, furniture and fixtures (Note 10) ......................................................................................... 28,932 28,175 265,431
Leased assets (Note 10) ............................................................................................................. 8,320 8,335 76,330
Construction in progress ............................................................................................................ 846 638 7,761
Less accumulated depreciation .................................................................................................. (51,267) (50,164) (470,339)
Property, plant and equipment, net (Note 26) ......................................................................... 34,296 34,207 314,642
Intangible assets:
Goodwill (Notes 10, 25 and 26) ................................................................................................... 2,831 5 25,972
Software (Notes 5 and 10) .......................................................................................................... 6,318 4,896 57,964
Right-of-use assets (Note 3) ....................................................................................................... 24,479 – 224,578
Other intangible assets (Notes 10 and 26) .................................................................................. 6,734 3,583 61,780
Total intangible assets ............................................................................................................. 40,362 8,484 370,294
Investments and other assets:
Investments in securities:
Investments in unconsolidated subsidiaries and affiliates ...................................................... 156 141 1,432
Other (Notes 8 and 20) ............................................................................................................ 9,724 9,268 89,212
Long-term loans receivable ........................................................................................................ 60 68 550
Deferred income taxes (Notes 4 and 18) .................................................................................... 7,844 5,402 71,963
Other assets (Note 10) ................................................................................................................ 9,853 8,829 90,394
Less allowance for doubtful receivables ..................................................................................... (698) (515) (6,404)
Total investments and other assets ............................................................................................ 26,939 23,193 247,147
Total assets (Note 26) .............................................................................................................. ¥316,115 ¥304,461 $2,900,138
Millions of yen
Thousands ofU.S. dollars
(Note 1)
LIABILITIES AND NET ASSETS 2019 2018 2019
Current liabilities:
Short-term bank loans (Notes 11 and 20) ................................................................................... ¥ 6,257 ¥ 1,292 $ 57,404
Current portion of long-term debt (Notes 11 and 20) ................................................................. 7,371 30,833 67,624
Notes and accounts payable (Note 20):
Trade........................................................................................................................................ 33,578 31,162 308,055
Construction ............................................................................................................................ – 11 –
Accrued income taxes (Note 18) ................................................................................................. 2,282 1,947 20,936
Accrued expenses ...................................................................................................................... 18,052 18,173 165,615
Provision for sales returns .......................................................................................................... 141 194 1,294
Provision for employees’ bonuses .............................................................................................. 549 414 5,037
Asset retirement obligations (Note 12) ........................................................................................ 117 14 1,073
Other current liabilities ................................................................................................................ 12,766 12,227 117,118
Total current liabilities .............................................................................................................. 81,113 96,267 744,156
Long-term liabilities:
Long-term debt (Notes 11 and 20).............................................................................................. 66,971 25,264 614,413
Liabilities for retirement benefits (Note 13) ................................................................................. 6,615 6,190 60,688
Asset retirement obligations (Note 12) ........................................................................................ 1,228 1,261 11,266
Deferred income taxes (Notes 4 and 18) .................................................................................... 1,508 2,628 13,835
Other long-term liabilities ............................................................................................................ 6,357 6,022 58,321
Total long-term liabilities ......................................................................................................... 82,679 41,365 758,523
Contingent liabilities (Note 14)
Net assets:
Shareholders’ equity (Note 15):
Common Stock:
Authorized shares –790,000,000 shares at December 31, 2019 and 2018Issued shares –189,870,559 shares at December 31, 2019 and 199,870,559 shares at December 31, 2018 ............................... 23,972 23,972 219,927
Capital surplus ......................................................................................................................... 15,482 17,354 142,036
Retained earnings (Note 27) .................................................................................................... 126,968 133,108 1,164,844Less treasury shares, at cost (7,179,322 shares at December 31, 2019 and 11,165,350 shares at December 31, 2018) ....... (10,960) (9,586) (100,550)
Total shareholders’ equity ........................................................................................................... 155,462 164,848 1,426,257
Accumulated other comprehensive income:
Unrealized holding gain on securities ...................................................................................... 2,054 2,608 18,844
Unrealized deferred gain on hedges (Note 21) ........................................................................ 3,438 3,578 31,541
Translation adjustments .......................................................................................................... (8,941) (5,857) (82,028)
Retirement benefits liability adjustments (Note 13) ................................................................. (306) (357) (2,807)
Total accumulated other comprehensive income ................................................................ (3,755) (28) (34,450)
Stock acquisition rights (Note 15) ............................................................................................... 475 433 4,358
Non-controlling interests............................................................................................................. 141 1,576 1,294
Total net assets .................................................................................................................... 152,323 166,829 1,397,459
Total liabilities and net assets .............................................................................................. ¥316,115 ¥304,461 $2,900,138
See accompanying notes to consolidated financial statements.

ASICS ANNUAL REPORT 2019 31
Millions of yen
Thousands ofU.S. dollars
(Note 1)
2019 2018 2019
Net sales (Note 26) ........................................................................................................................ ¥378,051 ¥386,662 $3,468,358
Cost of sales ................................................................................................................................. 198,370 205,996 1,819,908
Gross profit ................................................................................................................................. 179,681 180,666 1,648,450
Selling, general and administrative expenses ........................................................................... 169,047 170,150 1,550,890
Operating income (Note 26) ........................................................................................................ 10,634 10,516 97,560
Other income (expenses):
Interest and dividend income...................................................................................................... 1,034 1,141 9,486
Interest expense.......................................................................................................................... (1,840) (750) (16,881)
Exchange loss, net ...................................................................................................................... (583) (2,457) (5,349)
Gain on sales of investments in securities, net (Note 8) ............................................................. 1,462 1,267 13,413
Gain on redemption of investments in securities, net................................................................. – 13 –
Loss on sales or disposal of property, plant and equipment and other, net .............................. (121) (278) (1,110)
Loss on impairment of investments in securities (Note 8) .......................................................... (9) (17) (83)
Loss on impairment of property, plant and equipment (Notes 10 and 26) ................................. (1,227) (2,875) (11,257)
Business restructuring expenses (Notes 10, 13 and 17) ............................................................ – (21,143) –
Subsidy income .......................................................................................................................... 844 471 7,743
Other, net .................................................................................................................................... 13 (159) 120
(427) (24,787) (3,918)
Profit (loss) before income taxes ......................................................................................... 10,207 (14,271) 93,642
Income taxes (Note 18):
Current ........................................................................................................................................ 5,919 6,766 54,303
Refunded..................................................................................................................................... – (799) –
Deferred ...................................................................................................................................... (3,086) (162) (28,312)
2,833 5,805 25,991
Profit (loss) .................................................................................................................................... 7,374 (20,076) 67,651
Profit (loss) attributable to:
Non-controlling interests ......................................................................................................... 277 252 2,541
Owners of parent (Note 24) ..................................................................................................... ¥ 7,097 ¥ (20,328) $ 65,110
See accompanying notes to consolidated financial statements.
Millions of yen
Thousands ofU.S. dollars
(Note 1)
2019 2018 2019
Profit (loss) .................................................................................................................................... ¥ 7,374 ¥(20,076) $ 67,651
Other comprehensive income (loss) (Note 22):
Unrealized holding loss on securities ......................................................................................... (554) (2,195) (5,083)
Unrealized deferred (loss) gain on hedges .................................................................................. (139) 6,209 (1,275)
Revaluation reserve for assets of overseas subsidiaries ............................................................ – (18) –
Translation adjustments .............................................................................................................. (3,077) (9,909) (28,228)
Retirement benefits liability adjustments (Note 13) .................................................................... 50 71 459
Total other comprehensive loss, net ....................................................................................... (3,720) (5,842) (34,127)
Comprehensive income (loss) ..................................................................................................... ¥ 3,654 ¥(25,918) $ 33,524
Comprehensive income (loss) attributable to:
Owners of parent ........................................................................................................................ ¥ 3,371 ¥(26,081) $ 30,928
Non-controlling interests............................................................................................................. 283 163 2,596
See accompanying notes to consolidated financial statements.
ASICS Corporation and Consolidated SubsidiariesYear ended December 31, 2019
CONSOLIDATED STATEMENT OF COMPREHENSIVE INCOMEASICS Corporation and Consolidated SubsidiariesYear ended December 31, 2019
CONSOLIDATED STATEMENT OF OPERATIONS
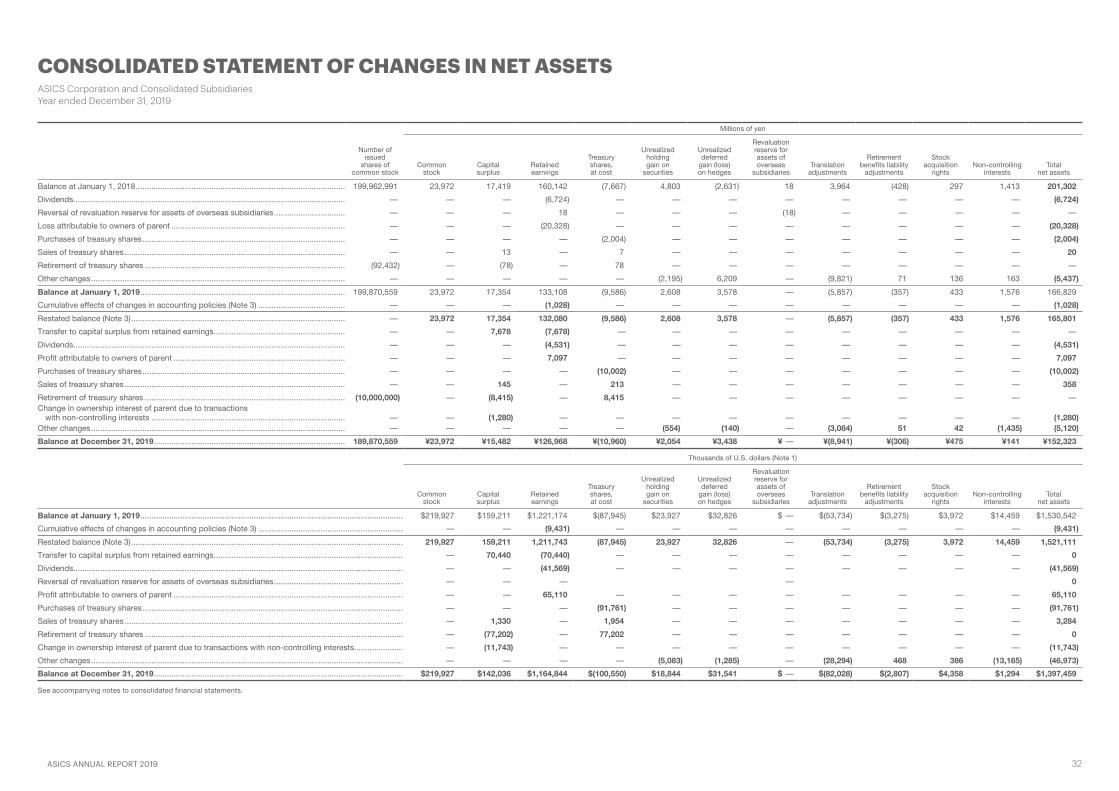
ASICS ANNUAL REPORT 2019 32
ASICS Corporation and Consolidated SubsidiariesYear ended December 31, 2019
CONSOLIDATED STATEMENT OF CHANGES IN NET ASSETS
Millions of yen
Number ofissued
shares ofcommon stock
Commonstock
Capitalsurplus
Retainedearnings
Treasuryshares,at cost
Unrealizedholdinggain on
securities
Unrealizeddeferred
gain (loss)on hedges
Revaluationreserve forassets ofoverseas
subsidiariesTranslation
adjustments
Retirementbenefits liability
adjustments
Stockacquisition
rightsNon-controlling
interestsTotal
net assets
Balance at January 1, 2018 .............................................................................................. 199,962,991 23,972 17,419 160,142 (7,667) 4,803 (2,631) 18 3,964 (428) 297 1,413 201,302
Dividends .......................................................................................................................... – – – (6,724) – – – – – – – – (6,724)
Reversal of revaluation reserve for assets of overseas subsidiaries ................................ – – – 18 – – – (18) – – – – –
Loss attributable to owners of parent .............................................................................. – – – (20,328) – – – – – – – – (20,328)
Purchases of treasury shares ........................................................................................... – – – – (2,004) – – – – – – – (2,004)
Sales of treasury shares ................................................................................................... – – 13 – 7 – – – – – – – 20
Retirement of treasury shares .......................................................................................... (92,432) – (78) – 78 – – – – – – – –
Other changes .................................................................................................................. – – – – – (2,195) 6,209 – (9,821) 71 136 163 (5,437)
Balance at January 1, 2019 ............................................................................................ 199,870,559 23,972 17,354 133,108 (9,586) 2,608 3,578 – (5,857) (357) 433 1,576 166,829
Cumulative effects of changes in accounting policies (Note 3) ....................................... – – – (1,028) – – – – – – – – (1,028)
Restated balance (Note 3) ................................................................................................ – 23,972 17,354 132,080 (9,586) 2,608 3,578 – (5,857) (357) 433 1,576 165,801
Transfer to capital surplus from retained earnings ........................................................... – – 7,678 (7,678) – – – – – – – – –
Dividends .......................................................................................................................... – – – (4,531) – – – – – – – – (4,531)
Profit attributable to owners of parent ............................................................................. – – – 7,097 – – – – – – – – 7,097
Purchases of treasury shares ........................................................................................... – – – – (10,002) – – – – – – – (10,002)
Sales of treasury shares ................................................................................................... – – 145 – 213 – – – – – – – 358
Retirement of treasury shares .......................................................................................... (10,000,000) – (8,415) – 8,415 – – – – – – – –Change in ownership interest of parent due to transactions
with non-controlling interests ....................................................................................... – – (1,280) – – – – – – – – – (1,280)Other changes .................................................................................................................. – – – – – (554) (140) – (3,084) 51 42 (1,435) (5,120)
Balance at December 31, 2019 ...................................................................................... 189,870,559 ¥23,972 ¥15,482 ¥126,968 ¥(10,960) ¥2,054 ¥3,438 ¥ – ¥(8,941) ¥(306) ¥475 ¥141 ¥152,323
Thousands of U.S. dollars (Note 1)
Commonstock
Capitalsurplus
Retainedearnings
Treasuryshares,at cost
Unrealizedholdinggain on
securities
Unrealizeddeferred
gain (loss)on hedges
Revaluationreserve forassets ofoverseas
subsidiariesTranslation
adjustments
Retirementbenefits liability
adjustments
Stockacquisition
rightsNon-controlling
interestsTotal
net assets
Balance at January 1, 2019 ...................................................................................................................... $219,927 $159,211 $1,221,174 $(87,945) $23,927 $32,826 $ – $(53,734) $(3,275) $3,972 $14,459 $1,530,542
Cumulative effects of changes in accounting policies (Note 3) ................................................................. – – (9,431) – – – – – – – – (9,431)
Restated balance (Note 3) .......................................................................................................................... 219,927 159,211 1,211,743 (87,945) 23,927 32,826 – (53,734) (3,275) 3,972 14,459 1,521,111
Transfer to capital surplus from retained earnings ..................................................................................... – 70,440 (70,440) – – – – – – – – 0
Dividends .................................................................................................................................................... – – (41,569) – – – – – – – – (41,569)
Reversal of revaluation reserve for assets of overseas subsidiaries .......................................................... – – – – 0
Profit attributable to owners of parent ....................................................................................................... – – 65,110 – – – – – – – – 65,110
Purchases of treasury shares ..................................................................................................................... – – – (91,761) – – – – – – – (91,761)
Sales of treasury shares ............................................................................................................................. – 1,330 – 1,954 – – – – – – – 3,284
Retirement of treasury shares .................................................................................................................... – (77,202) – 77,202 – – – – – – – 0
Change in ownership interest of parent due to transactions with non-controlling interests...................... – (11,743) – – – – – – – – – (11,743)
Other changes ............................................................................................................................................ – – – – (5,083) (1,285) – (28,294) 468 386 (13,165) (46,973)
Balance at December 31, 2019 ................................................................................................................ $219,927 $142,036 $1,164,844 $(100,550) $18,844 $31,541 $ – $(82,028) $(2,807) $4,358 $1,294 $1,397,459
See accompanying notes to consolidated financial statements.
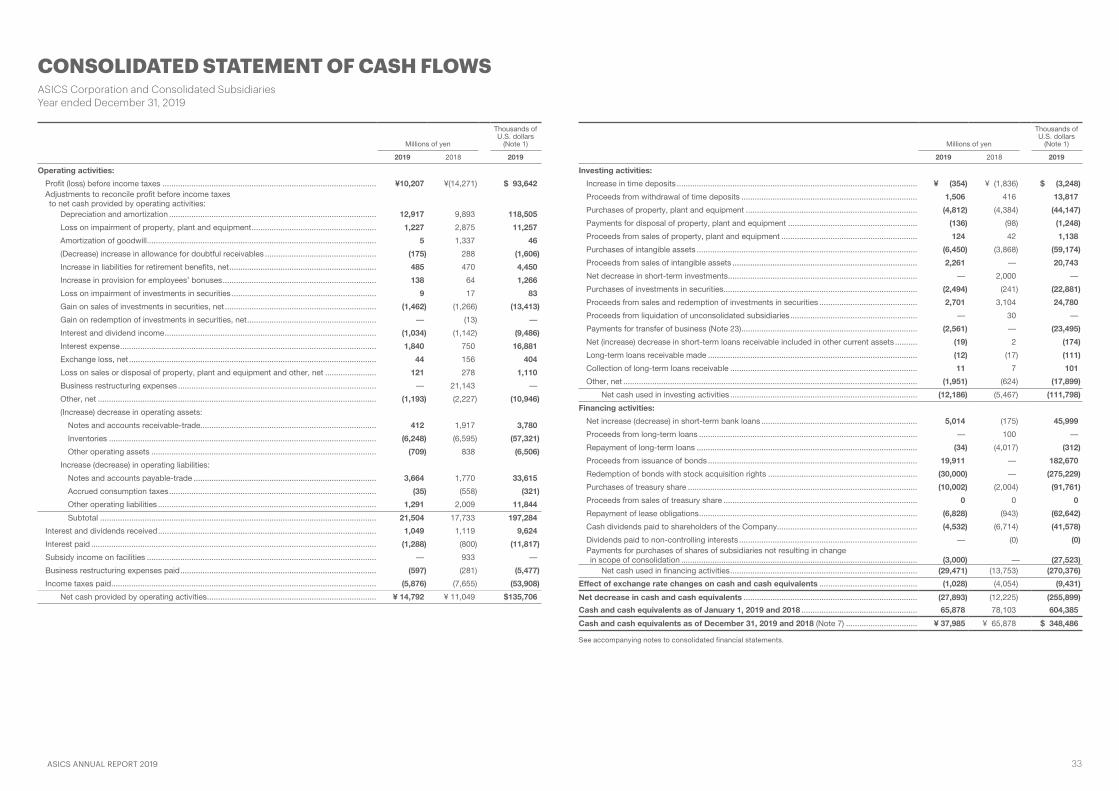
ASICS ANNUAL REPORT 2019 33
ASICS Corporation and Consolidated SubsidiariesYear ended December 31, 2019
CONSOLIDATED STATEMENT OF CASH FLOWS
Millions of yen
Thousands ofU.S. dollars
(Note 1)
2019 2018 2019
Operating activities:
Profit (loss) before income taxes ................................................................................................ ¥10,207 ¥(14,271) $ 93,642Adjustments to reconcile profit before income taxes to net cash provided by operating activities:
Depreciation and amortization ............................................................................................. 12,917 9,893 118,505
Loss on impairment of property, plant and equipment ........................................................ 1,227 2,875 11,257
Amortization of goodwill ....................................................................................................... 5 1,337 46
(Decrease) increase in allowance for doubtful receivables .................................................. (175) 288 (1,606)
Increase in liabilities for retirement benefits, net .................................................................. 485 470 4,450
Increase in provision for employees’ bonuses ..................................................................... 138 64 1,266
Loss on impairment of investments in securities ................................................................. 9 17 83
Gain on sales of investments in securities, net .................................................................... (1,462) (1,266) (13,413)
Gain on redemption of investments in securities, net .......................................................... – (13) –
Interest and dividend income ............................................................................................... (1,034) (1,142) (9,486)
Interest expense ................................................................................................................... 1,840 750 16,881
Exchange loss, net ............................................................................................................... 44 156 404
Loss on sales or disposal of property, plant and equipment and other, net ....................... 121 278 1,110
Business restructuring expenses ......................................................................................... – 21,143 –
Other, net ............................................................................................................................. (1,193) (2,227) (10,946)
(Increase) decrease in operating assets:
Notes and accounts receivable-trade............................................................................... 412 1,917 3,780
Inventories ........................................................................................................................ (6,248) (6,595) (57,321)
Other operating assets ..................................................................................................... (709) 838 (6,506)
Increase (decrease) in operating liabilities:
Notes and accounts payable-trade .................................................................................. 3,664 1,770 33,615
Accrued consumption taxes ............................................................................................. (35) (558) (321)
Other operating liabilities .................................................................................................. 1,291 2,009 11,844
Subtotal ............................................................................................................................ 21,504 17,733 197,284
Interest and dividends received .................................................................................................. 1,049 1,119 9,624
Interest paid ................................................................................................................................ (1,288) (800) (11,817)
Subsidy income on facilities ....................................................................................................... – 933 –
Business restructuring expenses paid ........................................................................................ (597) (281) (5,477)
Income taxes paid ....................................................................................................................... (5,876) (7,655) (53,908)
Net cash provided by operating activities ............................................................................ ¥ 14,792 ¥ 11,049 $135,706
Millions of yen
Thousands ofU.S. dollars
(Note 1)
2019 2018 2019
Investing activities:
Increase in time deposits ............................................................................................................ ¥ (354) ¥ (1,836) $ (3,248)
Proceeds from withdrawal of time deposits ............................................................................... 1,506 416 13,817
Purchases of property, plant and equipment ............................................................................. (4,812) (4,384) (44,147)
Payments for disposal of property, plant and equipment .......................................................... (136) (98) (1,248)
Proceeds from sales of property, plant and equipment ............................................................. 124 42 1,138
Purchases of intangible assets ................................................................................................... (6,450) (3,868) (59,174)
Proceeds from sales of intangible assets ................................................................................... 2,261 – 20,743
Net decrease in short-term investments ..................................................................................... – 2,000 –
Purchases of investments in securities ....................................................................................... (2,494) (241) (22,881)
Proceeds from sales and redemption of investments in securities ............................................ 2,701 3,104 24,780
Proceeds from liquidation of unconsolidated subsidiaries ......................................................... – 30 –
Payments for transfer of business (Note 23) ............................................................................... (2,561) – (23,495)
Net (increase) decrease in short-term loans receivable included in other current assets .......... (19) 2 (174)
Long-term loans receivable made .............................................................................................. (12) (17) (111)
Collection of long-term loans receivable .................................................................................... 11 7 101
Other, net .................................................................................................................................... (1,951) (624) (17,899)
Net cash used in investing activities .................................................................................... (12,186) (5,467) (111,798)
Financing activities:
Net increase (decrease) in short-term bank loans ...................................................................... 5,014 (175) 45,999
Proceeds from long-term loans .................................................................................................. – 100 –
Repayment of long-term loans ................................................................................................... (34) (4,017) (312)
Proceeds from issuance of bonds .............................................................................................. 19,911 – 182,670
Redemption of bonds with stock acquisition rights ................................................................... (30,000) – (275,229)
Purchases of treasury share ....................................................................................................... (10,002) (2,004) (91,761)
Proceeds from sales of treasury share ....................................................................................... 0 0 0
Repayment of lease obligations .................................................................................................. (6,828) (943) (62,642)
Cash dividends paid to shareholders of the Company............................................................... (4,532) (6,714) (41,578)
Dividends paid to non-controlling interests ................................................................................ – (0) (0)Payments for purchases of shares of subsidiaries not resulting in change in scope of consolidation .......................................................................................................... (3,000) – (27,523)
Net cash used in financing activities .................................................................................... (29,471) (13,753) (270,376)
Effect of exchange rate changes on cash and cash equivalents ............................................ (1,028) (4,054) (9,431)
Net decrease in cash and cash equivalents .............................................................................. (27,893) (12,225) (255,899)
Cash and cash equivalents as of January 1, 2019 and 2018 .................................................... 65,878 78,103 604,385
Cash and cash equivalents as of December 31, 2019 and 2018 (Note 7) ................................ ¥ 37,985 ¥ 65,878 $ 348,486
See accompanying notes to consolidated financial statements.

ASICS ANNUAL REPORT 2019 34
NOTES TO CONSOLIDATED FINANCIAL STATEMENTSASICS Corporation and Consolidated SubsidiariesDecember 31, 2019
Basis of Preparation1
The accompanying consolidated financial statements of ASICS Corporation (the “Company”) and consolidated subsidiaries are
prepared on the basis of accounting principles generally accepted in Japan, which are different in certain respects as to the application
and disclosure requirements of International Financial Reporting Standards, and are compiled from the consolidated financial
statements prepared by the Company as required by the Financial Instruments and Exchange Act of Japan.
Certain reclassifications of previously reported amounts have been made to conform the consolidated financial statements for the
year ended December 31, 2018 to the 2019 presentation. Such reclassifications had no effect on consolidated profit or loss, net assets
or cash flows.
The U.S. dollar amounts in the accompanying consolidated financial statements have been translated from yen amounts solely for
convenience, as a matter of arithmetic computation only, at ¥109 = U.S.$1.00, the approximate rate of exchange prevailing on December
31, 2019. This translation should not be construed as a representation that yen amounts have been, could have been, or could in the
future be, converted into U.S. dollars at the above or any other rate.
Summary of Significant Accounting Policies2
(a) Principles of consolidation
The accompanying consolidated financial statements include the accounts of the Company and significant companies which it
controls directly or indirectly. All assets and liabilities of the consolidated subsidiaries are revalued on acquisition, if applicable. All
significant intercompany transactions and accounts have been eliminated in consolidation.
Certain subsidiaries were excluded from the scope of consolidation because the effect of its sales, net profit or loss, total assets
and retained earnings on the accompanying consolidated financial statements was immaterial.
(b) Foreign currency translation
All monetary assets and liabilities denominated in foreign currencies are translated into yen at the rates of exchange in effect at the
balance sheet date and gain or loss on each translation is credited or charged to income. Revenue and expense items arising from
transactions denominated in foreign currencies are generally translated into yen at the rates in effect at the respective transaction
dates. Foreign exchange gain or loss is credited or charged to income in the period in which the gain or loss is recognized for
financial reporting purposes.
The financial statements of the overseas consolidated subsidiaries are translated into yen at the rates of exchange in effect at the
balance sheet date, except that the components of net assets excluding non-controlling interests are translated at their historical
exchange rates.
(c) Cash and cash equivalents
For the purposes of the consolidated statement of cash flows, cash and cash equivalents consist of cash on hand, deposits with
banks withdrawable on demand, and short-term investments which are readily convertible into cash subject to an insignificant risk
of any change in their value and which were purchased with an original maturity of three months or less.
(d) Securities
Marketable securities classified as other securities are carried at fair value with any changes in unrealized holding gain or loss, net
of the applicable income taxes, reported as a separate component of net assets. Cost of securities sold is determined by the
moving-average method. Non-marketable equity securities classified as other securities are stated at cost determined by the
moving-average method. Non-marketable debt securities classified as other securities are stated at net amortized cost.
Investments in limited liability partnerships and other similar partnerships, which are deemed to be securities under Article 2,
Clause 2 of the Financial Instruments and Exchange Act of Japan, are valued at the amount of the underlying equity in their net
assets based on the latest financial statements available as of the closing date stipulated in the partnership agreement.
(e) Inventories
Inventories are principally stated at the lower of cost or net realizable value, cost being determined by the moving-average method.
(f) Property, plant and equipment (except for leased assets under finance leases)
The Company and its domestic consolidated subsidiaries compute depreciation of property, plant and equipment by the declining-
balance method over the estimated useful lives of the respective assets, except that the straight-line method is applied to buildings
(other than structures attached to the buildings) acquired on or subsequent to April 1, 1998 and structures attached to the buildings
and other structures acquired on or subsequent to April 1, 2016.
Overseas consolidated subsidiaries compute depreciation of property, plant and equipment by the straight-line method over the
estimated useful lives of the respective assets.
Significant renewals and additions are capitalized at cost. Maintenance and repairs are charged to income as incurred.
The principal estimated useful lives used for calculating depreciation are as follows:
Buildings and structures 3 to 50 years
Machinery, equipment and vehicles 2 to 17 years
Tools, furniture and fixtures 2 to 20 years
(g) Intangible assets (except for leased assets under finance leases)
Expenditures relating to computer software developed for internal use are charged to income as incurred, unless the software is
expected to contribute to the generation of future income or to cost savings, in which case such expenditures are capitalized as
intangible assets and amortized by the straight-line method over their respective estimated useful lives, a period of ten years.
The Company and its consolidated subsidiaries have recorded intangible assets such as brand and customer base based on
revaluation of assets acquired and liabilities assumed as a result of business combinations at fair value. Such intangible assets are
amortized by the straight-line method over periods of 6 to 24 years.
(h) Leased assets
Finance leases under which ownership of the leased assets is not transferred to the lessees are depreciated using the straight-line
method over the lease term with no residual value.
Finance leases under which ownership of the leased assets is transferred to the lessees are depreciated by the same methods
used for owned fixed assets.
(i) Goodwill
Goodwill is amortized by the straight-line method over the estimated period of benefit of no more than 20 years from the year of
acquisition.
(j) Allowance for doubtful receivables
The Company and its domestic consolidated subsidiaries provide an allowance for doubtful receivables at an amount calculated
based on their historical experience of bad debts on ordinary receivables plus an additional estimate of probable specific bad debts
from customers experiencing financial difficulties.
The overseas consolidated subsidiaries provide an allowance for doubtful receivables at an amount calculated based on probable
specific bad debts from their customers.
(k) Provision for sales returns
Provision for sales returns is provided for losses from sales returns at an amount calculated based on the historical experience of
sales returns.
(l) Provision for employees’ bonuses
Provision for employees’ bonuses is provided at an expected payment amount of the bonuses to employees attributable to the fiscal
year.
(m) Retirement benefits for employees
Liabilities for retirement benefits for employees are provided principally at an amount calculated based on the retirement benefit
obligation and the fair value of the plan assets as of the balance sheet date.
The retirement benefit obligation is attributed to each period by the benefit formula method.
Actuarial gain or loss is amortized principally in the year following the year in which the gain or loss is incurred by the straight-line
method over a period which falls within the estimated average remaining years of service of the eligible employees. Certain
consolidated subsidiaries amortize actuarial gain or loss in the year in which the gain or loss is incurred by the straight-line method
over a period which falls within the estimated average remaining years of service of the eligible employees.
Certain consolidated subsidiaries have calculated their retirement benefit obligation and retirement benefit expenses based on
the amount which would be payable at the year end if all eligible employees terminated their services voluntarily (the “simplified
method”).
(n) Research and development costs
Research and development costs are charged to income as incurred.

ASICS ANNUAL REPORT 2019 35
(o) Income taxes
Deferred income taxes are provided for temporary differences between the balances of assets and liabilities reported for financial
reporting purposes and the corresponding balances for tax reporting purposes.
Certain US consolidated subsidiaries adopted the consolidated taxation system in the United States of America, which allows
companies to file tax returns based on the combined profit or loss of a parent company and its subsidiaries.
(p) Derivatives and hedging activities
The Company and its consolidated subsidiaries (“Group”) utilize derivatives of forward foreign exchange contracts, currency option
and interest swaps to hedge the risk arising from fluctuations in forward foreign currency exchange rates, mainly on forecast
transactions denominated in foreign currencies and interest rates, mainly on loans and bond issuing transactions.
Derivatives positions are carried at fair value with any changes in unrealized gain or loss charged or credited to income, except for
those which meet the criteria for deferral hedge accounting under which unrealized gain or loss, net of the applicable income taxes,
is deferred as a component of net assets. Receivables and payables hedged by qualified forward foreign exchange contracts are
translated at the corresponding foreign exchange contract rates (“allocation method”). Interest-rate swaps which meet certain
conditions are accounted for as if the interest rates applied to the swaps had originally applied to the underlying debt (“special
treatment”).
The hedge effectiveness of forward foreign exchange transactions is assessed by considering whether the transactions qualify
based on past experience and the probability of the transaction occurring in the future. The hedge effectiveness of interest-rate
swaps and currency options is assessed based on a comparison of the cumulative changes in cash flows of the hedged items and
those of the hedging instruments in the period from the start of the hedging relationship to the assessment date. However, the
assessment of hedge effectiveness is omitted if a high level of hedge effectiveness is identified based on the terms of the contracts.
(q) Distribution of retained earnings
Under the Corporation Law of Japan (the “Law”), the distribution of retained earnings with respect to a given financial period is
made by resolution of the shareholders at a general meeting held subsequent to the close of the financial period. The accounts for
that period do not, therefore, reflect such distributions. Refer to Note 27.
Change in Accounting Policy3
Some overseas subsidiaries have applied IFRS 16 “Leases” from the beginning of the fiscal year ended December 31, 2019. In applying
the standard, the Company recognized cumulative effect as of the initial date of application in accordance with transitional provisions for
retrospective application.
As a result of applying the standard, right-of-use assets of ¥24,479 million ($224,578 thousand) in intangible assets, and lease
obligations of ¥6,134 million ($56,275 thousand) in current liabilities and ¥20,359 million ($186,780 thousand) in long-term liabilities are
recorded in the consolidated balance sheet as of December 31, 2019.
The impact on operating income, profit before income taxes, net assets per share, and basic profit and diluted profit attributable to
owners of parent per share for the fiscal year ended December 31, 2019 was immaterial.
The restated balance of retained earnings at January 1, 2019 decreased by ¥1,028 million ($9,431 thousand) compared with the
original balance due to recognizing cumulative effect along with retrospective application.
Change in Presentation4
(Application of “Partial Amendments to Accounting Standard for Tax Effect Accounting”)
“Partial Amendments to Accounting Standard for Tax Effect Accounting” (ASBJ Statement No. 28 issued on February 16, 2018), etc.
have been applied from the beginning of the fiscal year ended December 31, 2019. Accordingly, “Deferred tax assets” are now
presented under “Investments and other assets” in the consolidated balance sheet, and “Deferred tax liabilities” are now presented
under “Long-term liabilities.”
Change in Accounting Estimate5
In prior years, software for global enterprise systems was depreciated over its useful life of five years. The Company reconsidered the
useful economic lives of assets as part of its business restructuring in the fiscal year ended December 31, 2018. As a result, in the
second quarter of the fiscal year ended December 31, 2019, the Company revised its estimate of the useful economic life, and it was
lengthened to 10 years from the date in corresponding asset enters into service. Consequently, the Company accounts for such a
change in estimate prospectively.
As a result of this change, operating income increased by ¥346 million ($3,174 thousand) and profit before income taxes increased by
¥329 million ($3,018 thousand) for the fiscal year ended December 31, 2019.
Accounting Standards Issued but Not Yet Effective6
(The Company and its domestic subsidiaries)
“Accounting Standard for Revenue Recognition” (ASBJ Statement No. 29, March 30, 2018)
“Implementation Guidance on Accounting Standard for Revenue Recognition” (ASBJ Guidance No. 30, March 30, 2018)
(1) Overview
This is a comprehensive accounting standard for revenue recognition. Revenue is recognized by applying the following five steps.
Step 1: Identify the contracts with a customer.
Step 2: Identify the performance obligations in the contract.
Step 3: Determine the transaction price.
Step 4: Allocate the transaction price to the performance obligations in the contract.
Step 5: Recognize revenue when (or as) the entity satisfies a performance obligation.
(2) Planned date of application
The Company and its domestic subsidiaries plan to apply the standard and implementation guidance from the beginning of the
fiscal year ending December 31, 2022.
(3) Impact of applying the standard and implementation guidance
The impact of applying the standard and implementation guidance on the consolidated financial statements is being evaluated.
(Overseas subsidiaries)
“Leases” (Accounting Standard Update (“ASU”) 2016-02 in US GAAP)
(1) Overview
The new accounting standard requires that lessees principally account for all leases on the balance sheet under a single model.
(2) Planned date of application
ASU 2016-02 will be applied from the beginning of the fiscal year ending December 31, 2021.
(3) Impact of applying the standard
The impact of applying the standard on the consolidated financial statements is being evaluated.
Cash and Deposits7
The balances of cash and deposits reflected in the accompanying consolidated balance sheets at December 31, 2019 and 2018 were
reconciled to the balances of cash and cash equivalents in the accompanying consolidated statements of cash flows for the years ended
December 31, 2019 and 2018 as follows:
Millions of yenThousands of U.S. dollars
2019 2018 2019Cash and deposits ............................................................................................................... ¥39,199 ¥68,287 $359,624Time deposits with original maturities in excess of three months, included in cash and deposits ............................................................................................ (1,214) (2,409) (11,138)
Cash and cash equivalents .................................................................................................. ¥37,985 ¥65,878 $348,486

ASICS ANNUAL REPORT 2019 36
amount is not recoverable from its business due to worsening profitability. The recoverable amount is measured based on value in use,
which is calculated as the sum of anticipated future cash flows discounted at a rate of 10.8%.
The Group has written down idle assets which are not expected to be utilized in the future and recorded the loss on impairment of
property, plant and equipment for the fiscal year ended December 31, 2018.
The Group has written down business assets in Korea whose future cash flow could not be expected due to the lower profitability and
recorded the loss on impairment of property, plant and equipment for the fiscal year ended December 31, 2018.
The Group has written down asset groups whose operating income has been continuously negative to their respective recoverable
amounts and recorded related losses on impairment of property, plant and equipment. The recoverable amounts of asset groups are
measured at the higher of their net selling value or value in use. The net selling value is based on estimated sales price.
Value in use is measured as the sum of anticipated future cash flows discounted at rates of 7.1% and 6.1% for the years ended
December 31, 2019 and 2018, respectively.
The Group has written down idle assets which are not expected to be utilized in the future and the recoverable amount of the idle
assets is measured based on their respective estimated net selling value determined by the Group for the years ended December 31,
2019 and 2018, respectively.
The details of loss on impairment of property, plant and equipment for the years ended December 31, 2019 and 2018 are as follows:
Millions of yenThousands of U.S. dollars
Use Location Classification 2019 2019Store assets Japan, U.S. and Europe etc. Tools, furniture and fixtures,
leased assets etc. ¥1,227 $11,257Total ¥1,227 $11,257
Millions of yenUse Location Classification 2018Business assets U.S. Software etc. ¥ 186Other Goodwill and intangible assets 7,084Other Sweden Goodwill and intangible assets 6,188Business assets Japan Software etc. 2,345Business assets Korea Tools, furniture and fixtures etc. 317Store assets Japan, U.S. and Europe etc. Tools, furniture and fixtures,
leased assets etc. 6,231Idle assets Japan Building and land etc. 213Total ¥22,564
Short-Term Bank Loans and Long-Term Debt11
The average annual interest rates on short-term bank loans are 1.0% and 4.2% at December 31, 2019 and 2018, respectively.
Long-term debt at December 31, 2019 and 2018 consisted of the following:
Millions of yenThousands of U.S. dollars
2019 2018 20190.14% yen unsecured bonds issued through public offering, due 2021 ............................. ¥20,000 ¥20,000 $183,4860.20% yen unsecured bonds issued through public offering, due 2024 ............................. 20,000 – 183,486Zero-coupon unsecured bonds with stock acquisition rights, due 2019 ............................. – 30,005 –Loans primarily from banks, due through 2021 at weighted average interest rates
ranging of 0.1% .............................................................................................................. 149 183 1,368Lease obligations ................................................................................................................. 34,193 5,909 313,697
74,342 56,097 682,037Current portion of long-term debt ........................................................................................ (7,371) (30,833) (67,624)
¥66,971 ¥25,264 $614,413
Zero-coupon unsecured bonds with stock acquisition rights with a gross issuance amount of ¥30,150 million were convertible into
shares of common stock of the Company at ¥2,702.7 per share and were exercisable from March 17, 2014 to February 15, 2019.
Information on the aggregate annual maturities of long-term debt subsequent to December 31, 2019 is presented in Note 20.
Short-Term Investments and Investments in Securities8
Information regarding other securities with determinable market value at December 31, 2019 and 2018 is summarized as follows:
Millions of yen Thousands of U.S. dollars2019 2018 2019
Carrying value
Acquisition costs
Unrealized gain (loss)
Carrying value
Acquisition costs
Unrealized gain (loss)
Carrying value
Acquisition costs
Unrealized gain (loss)
Securities whose carrying value exceeds their acquisition costs:Equity securities ............. ¥7,153 ¥4,289 ¥2,864 ¥7,298 ¥4,155 ¥3,143 $65,624 $39,349 $26,275Other .............................. – – – 815 349 466 – – –Subtotal 7,153 4,289 2,864 8,113 4,504 3,609 65,624 39,349 26,275
Securities whose carrying value does not exceed their acquisition costs:Equity securities ............. 901 956 (55) 214 245 (31) 8,266 8,770 (504)Subtotal ......................... 901 956 (55) 214 245 (31) 8,266 8,770 (504)
Total ................................... ¥8,054 ¥5,245 ¥2,809 ¥8,327 ¥4,749 ¥3,578 $73,890 $48,119 $25,771
Unlisted equity securities (carrying value for the years ended December 31, 2019 and 2018 amounted to ¥713 million ($6,541 thousand)
and ¥483 million, respectively), unlisted debt securities (carrying value for the years ended December 31, 2019 and 2018 amounted to
¥120 million ($1,101 thousand) and ¥120 million, respectively), investments in limited liability partnerships (carrying value for the years
ended December 31, 2019 and 2018 amounted to ¥449 million ($4,119 thousand) and ¥338 million, respectively) and unlisted others
(carrying value for the years ended December 31, 2019 amounted to ¥478 million ($4,385 thousand)) for which it is extremely difficult to
determine the fair value are not included in the above table.
Information regarding sales of other securities for the years ended December 31, 2019 and 2018 is summarized as follows:
Millions of yenThousands of U.S. dollars
2019 2018 2019Proceeds from sales ............................................................................................................. ¥2,692 ¥3,177 $24,697Gross realized gain ............................................................................................................... 1,466 1,307 13,450Gross realized loss ............................................................................................................... 4 40 37
The Company has recognized loss on impairment of marketable securities classified as other securities in the amount of ¥9 million
($83 thousand) and ¥17 million for the years ended December 31, 2019 and 2018 respectively. Impairment loss is recorded for the
securities whose market value declines by 30% or more as compared with their acquisition costs.
Inventories9
The following is a summary of inventories at December 31, 2019 and 2018:
Millions of yenThousands of U.S. dollars
2019 2018 2019Merchandise and finished products ..................................................................................... ¥91,622 ¥87,782 $840,569Work in process ................................................................................................................... 388 413 3,560Raw materials and supplies ................................................................................................. 1,149 891 10,541
¥93,159 ¥89,086 $854,670
Loss on Impairment of Property, Plant and Equipment10
The Group’s business assets are grouped by company or unit similar to an individual company. In addition, the Group also groups store
assets by store and groups assets intended for sale and idle assets individually. The assets are grouped by cash-generating units
defined as the smallest identifiable group of assets generating cash inflows.
The Group has written down business assets, goodwill and intangible assets held by former Fitness Keeper, Inc. in the United States
of America and recorded related losses on impairment as business restructuring expenses for the fiscal year ended December 31, 2018
because the business is not expected to generate profit that was originally estimated.
The Group has written down goodwill and intangible assets held by HAGLÖFS AB in Sweden to the recoverable amounts and recorded
related losses on impairment as business restructuring expenses for the fiscal year ended December 31, 2018, since the investment

ASICS ANNUAL REPORT 2019 37
The changes in plan assets, except for plans accounted for by the simplified method, during the years ended December 31, 2019 and
2018 are as follows:
Millions of yenThousands of U.S. dollars
2019 2018 2019Plan assets at the beginning of the year .............................................................................. ¥ – ¥ 287 $ –Decrease in plan assets due to transfer to defined contribution pension plans .................. – (287) –Plan assets at the end of the year ........................................................................................ ¥ – ¥ – $ –
The changes in liabilities for retirement benefits calculated by the simplified method during the years ended December 31, 2019 and
2018 are as follows:
Millions of yenThousands of U.S. dollars
2019 2018 2019Liabilities for retirement benefits at the beginning of the year ............................................. ¥734 ¥780 $6,734Retirement benefit expenses ................................................................................................ 71 75 651Retirement benefits paid ...................................................................................................... (48) (84) (440)Other ..................................................................................................................................... (31) (37) (284)Liabilities for retirement benefits at the end of the year ....................................................... ¥726 ¥734 $6,661
The following table sets forth the funded status of the plans and the amounts recognized in the consolidated balance sheets as of
December 31, 2019 and 2018 for the Company’s and the consolidated subsidiaries’ defined benefit plan:
Millions of yenThousands of U.S. dollars
2019 2018 2019Funded retirement benefit obligations ................................................................................. ¥6,269 ¥5,893 $57,514Plan assets at fair value ........................................................................................................ (315) (339) (2,890)
5,954 5,554 54,624Unfunded retirement benefit obligations .............................................................................. 661 636 6,064Net liability for retirement benefits in the consolidated balance sheet ................................ 6,615 6,190 60,688
Liabilities for retirement benefits .......................................................................................... 6,615 6,190 60,688Assets for retirement benefits .............................................................................................. – – –Net liability for retirement benefits in the consolidated balance sheet ................................ ¥6,615 ¥6,190 $60,688
The components of retirement benefit expenses for the years ended December 31, 2019 and 2018 are as follows:
Millions of yenThousands of U.S. dollars
2019 2018 2019Service cost .......................................................................................................................... ¥681 ¥666 $6,248Interest cost .......................................................................................................................... 49 45 450Amortization of unrecognized actuarial loss ........................................................................ 57 72 523Net retirement benefit expenses calculated by the simplified method ................................ 71 75 651Retirement benefit expenses ................................................................................................ ¥858 ¥858 $7,872
In addition to the above, additional payments of ¥1,454 million resulting from business restructuring was recorded as business
restructuring expenses for the years ended December 31, 2018.
Actuarial gain included in other comprehensive income (before tax effects) for the years ended December 31, 2019 and 2018 is as
follows:
Millions of yenThousands of U.S. dollars
2019 2018 2019Actuarial gain ........................................................................................................................ ¥60 ¥83 $550
Unrecognized actuarial loss included in accumulated other comprehensive income (before tax effects) as of December 31, 2019 and
2018 is as follows:
Millions of yenThousands of U.S. dollars
2018 2017 2018Unrecognized actuarial loss ................................................................................................. ¥361 ¥421 $3,312
Asset Retirement Obligations12
(a) Outline of asset retirement obligations
The Company and its domestic consolidated subsidiaries estimated the cost of restoration liabilities based on property lease
agreements of certain domestic offices and retail stores and recognized them as asset retirement obligations. The Company and its
domestic consolidated subsidiaries also estimated the disposal costs determined under the “Ordinance on Prevention of Asbestos
Hazards.” Certain overseas consolidated subsidiaries estimated restoration costs for certain overseas offices at the time of vacating
the leased property and recognized them as asset retirement obligations.
(b) Calculation method for asset retirement obligations
Asset retirement obligations for the restoration liabilities based on the property lease agreements of certain domestic offices and
retail stores were calculated using an estimated useful life of 2 to 41 years from the acquisitions of leasehold improvements and
discount rates from 0% to 1.397%. Asset retirement obligations for the disposal costs determined under the “Ordinance on
Prevention of Asbestos Hazards” were calculated using an estimated useful life of 5 to 35 years from the acquisitions of leasehold
improvements and discount rates from 0.375% to 2.301%. Asset retirement obligations for the restoration costs of certain overseas
offices at the time of vacating the leased property were calculated using an estimated useful life of 2 to 20 years from the
acquisitions of leasehold improvements and discount rates from 1.733% to 5.717%.
(c) Changes in the balance of asset retirement obligations during the years ended December 31, 2019 and 2018 are
summarized as follows:
Millions of yenThousands of U.S. dollars
2019 2018 2019Balance at beginning of the year .......................................................................................... ¥1,275 ¥1,164 $11,697Increase due to acquisition of property, plant and equipment ............................................ 208 170 1,908Accretion expense ................................................................................................................ 16 17 147Decrease due to settlement of asset retirement liabilities ................................................... (144) (98) (1,321)Other (decrease) increase, net ............................................................................................. (10) 22 (92)Balance at end of the year ................................................................................................... ¥1,345 ¥1,275 $12,339
Retirement Benefits13
The Company and certain domestic consolidated subsidiaries have lump-sum payment plans, defined contribution pension plans or a
smaller enterprise retirement allowance mutual aid plan.
Certain overseas consolidated subsidiaries adopted lump-sum payment plans, defined contribution pension plans or defined benefit
plans.
Defined Benefit Plans
The changes in the retirement benefit obligations, except for plans accounted for by the simplified method, during the years ended
December 31, 2019 and 2018 are as follows:
Millions of yenThousands of U.S. dollars
2019 2018 2019Retirement benefit obligations at the beginning of the year ................................................ ¥5,456 ¥5,310 $50,055Service cost .......................................................................................................................... 681 666 6,248Interest cost .......................................................................................................................... 49 45 450Actuarial gain ........................................................................................................................ (3) (11) (28)Retirement benefits paid ...................................................................................................... (295) (266) (2,706)Decrease in retirement benefit obligations for retirement benefits due to transfer to
defined contribution pension plans................................................................................. – (288) –Other ..................................................................................................................................... 1 (0) 9Retirement benefit obligations at the end of the year .......................................................... ¥5,889 ¥5,456 $54,028

ASICS ANNUAL REPORT 2019 38
As there were no plan assets as of December 31, 2019 and 2018 disclosure of fair value is omitted.
The expected return on plan assets has been estimated considering the anticipated allocation to each asset class and the expected
long-term returns on assets held in each category.
The assumptions used in accounting for the above retirement benefit plans for the years ended December 31, 2019 and 2018 are as
follows:
2019 2018Discount rates ............................................................................................................................................... 0.1% - 2.0% 0.1% - 3.0%
Defined Contribution Pension Plans
Total contributions paid by the Company and its consolidated subsidiaries to the defined contribution pension plans for the years ended
December 31, 2019 and 2018 amounted to ¥1,159 million ($10,633 thousand) and ¥1,248 million, respectively.
Contingent Liabilities14
The assets pledged as collateral for a third-party’s borrowings at December 31, 2019 and 2018 were as follows:
Millions of yenThousands of U.S. dollars
2019 2018 2019Investments and other assets:
Investments in securities ................................................................................................... ¥320 ¥320 $2,936
Shareholders’ Equity15
The Law provides that an amount equal to 10% of the amount to be disbursed as distributions of capital surplus (other than the capital
reserve) and retained earnings (other than the legal reserve) be transferred to the capital reserve and the legal reserve, respectively, until
the sum of the capital reserve and the legal reserve equals 25% of the capital stock account. Such distributions can be made at any
time by resolution of the shareholders or by the Board of Directors if certain conditions are met.
The Company’s legal reserve included in retained earnings is nil at December 31, 2019 and 2018.
Movements in common stock and treasury stock for the years ended December 31, 2019 and 2018 are summarized as follows:
Number of Shares2019
January 1, 2019 Increase Decrease December 31, 2019Shares issued:
Common Stock .................................. 199,870,559 – 10,000,000 189,870,559Treasury stock:
Treasury Stock ................................... 11,165,350 6,245,964 10,231,992 7,179,322
The decrease in common stock of 10,000,000 shares is due to cancelation of 10,000,000 shares by the resolution on board meeting.
The increase in treasury stock of 6,245,964 shares is due to purchases of 6,238,000 shares by the resolution on board meeting,
acquisition at no cost of 6,548 shares related to restricted stock remuneration, and purchases of 1,416 shares of less than one voting
unit.
The decrease in treasury stock of 10,231,992 shares is due to cancelation of 10,000,000 shares by the resolution on board meeting,
disposal of 177,512 shares for restricted stock remuneration, sales of 180 shares at the requests of shareholders who own less than one
voting unit, and of 54,300 shares corresponding to exercising stock options for the year ended December 31, 2019.
Number of Shares2018
January 1, 2018 Increase Decrease December 31, 2018Shares issued:
Common Stock .................................. 199,962,991 – 92,432 199,870,559Treasury stock:
Treasury Stock ................................... 10,137,292 1,129,412 101,354 11,165,350
The decrease in common stock of 92,432 shares is due to cancelation of 92,432 shares by the resolution on board meeting. The
increase in treasury stock of 1,129,412 shares is due to purchases of 1,127,300 shares by the resolution on board meeting and purchases
of 2,112 shares of less than one voting unit and the decrease in treasury stock of 101,354 shares is due to cancelation of 92,432 shares
by the resolution on board meeting, sales of 22 shares at the requests of shareholders who own less than one voting unit and of 8,900
shares corresponding to exercising stock options for the year ended December 31, 2018.
Stock option plans
Stock option costs included in selling, general and administrative expenses for the years ended December 31, 2019 and 2018 amounted
to ¥160 million ($1,468 thousand) and ¥155 million, respectively.
A description of the stock option plan (the “2018 plan”) is as follows:
Stock option plans 2018 planDate of approval at a meeting of the Board of Directors April 20, 2018Individuals covered by the plan Directors other than outside directors 6
Employees of the Company 12Directors of the Company’s subsidiaries 4Employee of the Company’s subsidiary 2
Type and number of shares to be issued upon the exercise of the stock options 2018 plan
Common stock ................................................................ 85,200Grant date ....................................................................... May 18, 2018Service period ................................................................. Not definedExercise period ................................................................ From May 19, 2021 to May 18, 2048
A description of the stock option plan (the “2017 plan”) is as follows:
Stock option plans 2017 planDate of approval at a meeting of the Board of Directors April 26, 2017Individuals covered by the plan Directors other than outside directors 5
Employees of the Company 6Directors of the Company’s subsidiaries 4Employee of the Company’s subsidiary 2
Type and number of shares to be issued upon the exercise of the stock options 2017 plan
Common stock ................................................................ 101,400Grant date ....................................................................... May 29, 2017Service period ................................................................. Not definedExercise period ................................................................ From May 30, 2020 to May 29, 2047
A description of the stock option plan (the “2016 plan”) is as follows:
Stock option plans 2016 planDate of approval at a meeting of the Board of Directors April 22, 2016Individuals covered by the plan Directors other than outside directors 4
Employees of the Company 7Directors of the Company’s subsidiaries 2Employees of the Company’s subsidiaries 3
Type and number of shares to be issued upon the exercise of the stock options 2016 plan
Common stock ................................................................ 85,900Grant date ....................................................................... May 17, 2016Service period ................................................................. Not definedExercise period ................................................................ From May 18, 2019 to May 17, 2046
A description of the stock option plan (the “2015 plan”) is as follows:
Stock option plans 2015 planDate of approval at a meeting of the Board of Directors April 7, 2015Individuals covered by the plan Directors other than outside directors 5
Employees of the Company 6Directors of the Company’s subsidiaries 3Employees of the Company’s subsidiaries 2

ASICS ANNUAL REPORT 2019 39
Type and number of shares to be issued upon the exercise of the stock options 2015 plan
Common stock ................................................................ 23,700Grant date ....................................................................... May 12, 2015Service period ................................................................. Not definedExercise period ................................................................ From May 13, 2018 to May 12, 2045
A description of the stock option plan (the “2014 plan”) is as follows:
Stock option plans 2014 planDate of approval at a meeting of the Board of Directors July 18, 2014Individuals covered by the plan Directors other than outside directors 7
Executive officers who are residents of Japan under the Income Tax Law of Japan 6
Type and number of shares to be issued upon the exercise of the stock options 2014 plan
Common stock ................................................................ 26,500Grant date ....................................................................... August 8, 2014Service period ................................................................. Not definedExercise period ................................................................ From August 9, 2017 to August 8, 2044
A description of the stock option plan (the “2013 plan”) is as follows:
Stock option plans 2013 planDate of approval at a meeting of the Board of Directors July 19, 2013Individuals covered by the plan Directors other than outside directors 7
Executive officers who are residents of Japan under the Income Tax Law of Japan 5
Type and number of shares to be issued upon the exercise of the stock options 2013 plan
Common stock ................................................................ 37,200Grant date ....................................................................... August 6, 2013Service period ................................................................. Not definedExercise period ................................................................ From August 7, 2016 to August 6, 2043
Vesting conditions for the exercise of stock acquisition rights are as follows:
For the “2018 plan”, “2017 plan” and “2016 plan”
1) If the individuals to whom the stock acquisition rights are granted (the “Holders”) forfeit stock acquisition rights, the stock options
cannot be exercised.
2) Other conditions are included in the contract entered into between the Company and the Holders.
For the “2015 plan”
If the Holders forfeit stock acquisition rights, the stock options cannot be exercised.
For the “2014 plan” and “2013 plan”
1) When the Holders cease to be a director or/and executive officer, the Holders can exercise the rights within five years following
the date on which the Holders leave their positions with valid reasons as approved by the Company, such as the fulfillment of the
service period.
2) If the Holders forfeit stock acquisition rights, the stock options cannot be exercised.
3) Other conditions are included in the contract entered into between the Company and the Holders.
The following table summarizes stock option activity under the stock option plans referred to above during the year ended December
31, 2019:
2018 plan 2017 plan 2016 planNumber of stock optionsUnvested:
Outstanding at the end of prior fiscal period ............................................................ 84,600 97,400 84,300Granted ...................................................................................................................... – – –Forfeited ..................................................................................................................... 2,400 – –Vested ........................................................................................................................ – – 84,300Outstanding at the end of the fiscal period ............................................................... 82,200 97,400 –
Vested:Outstanding at the end of prior fiscal period ............................................................. – – –Vested ........................................................................................................................ – – 84,300Exercised ................................................................................................................... – – 15,800Forfeited ..................................................................................................................... – – –Outstanding at the end of the fiscal period ............................................................... – – 68,500
YenExercise price ................................................................................................................ ¥ 1 ¥ 1 ¥ 1Weighted average exercise price .................................................................................. ¥ – ¥ – ¥1,526Weighted average fair value per stock at the grant date .............................................. ¥1,786 ¥1,670 ¥2,178
U.S. dollarsExercise price ................................................................................................................ $0.01 $0.01 $0.01Weighted average exercise price .................................................................................. $ – $ – $ 14Weighted average fair value per stock at the grant date .............................................. $ 16 $ 15 $ 20
2015 plan 2014 plan 2013 planNumber of stock optionsUnvested:
Outstanding at the end of prior fiscal period ............................................................. – – –Granted ...................................................................................................................... – – –Forfeited ..................................................................................................................... – – –Vested ........................................................................................................................ – – –Outstanding at the end of the fiscal period ............................................................... – – –
Vested:Outstanding at the end of prior fiscal period ............................................................. 19,900 20,400 23,300Vested ........................................................................................................................ – – –Exercised ................................................................................................................... 9,700 11,200 17,600Forfeited ..................................................................................................................... – – –Outstanding at the end of the fiscal period ............................................................... 10,200 9,200 5,700
YenExercise price ................................................................................................................ ¥ 1 ¥ 1 ¥ 1Weighted average exercise price .................................................................................. ¥1,449 ¥1,450 ¥1,440Weighted average fair value per stock at the grant date .............................................. ¥3,008 ¥2,135 ¥1,707
U.S. dollarsExercise price ................................................................................................................ $0.01 $0.01 $0.01Weighted average exercise price .................................................................................. $ 13 $ 13 $ 13Weighted average fair value per stock at the grant date .............................................. $ 28 $ 20 $ 16
Valuation method for estimating fair value was not applicable.
Because it is difficult to reasonably estimate the number of stock options that will be forfeited in the future, the estimation reflects only
the actual number of forfeited stock options.
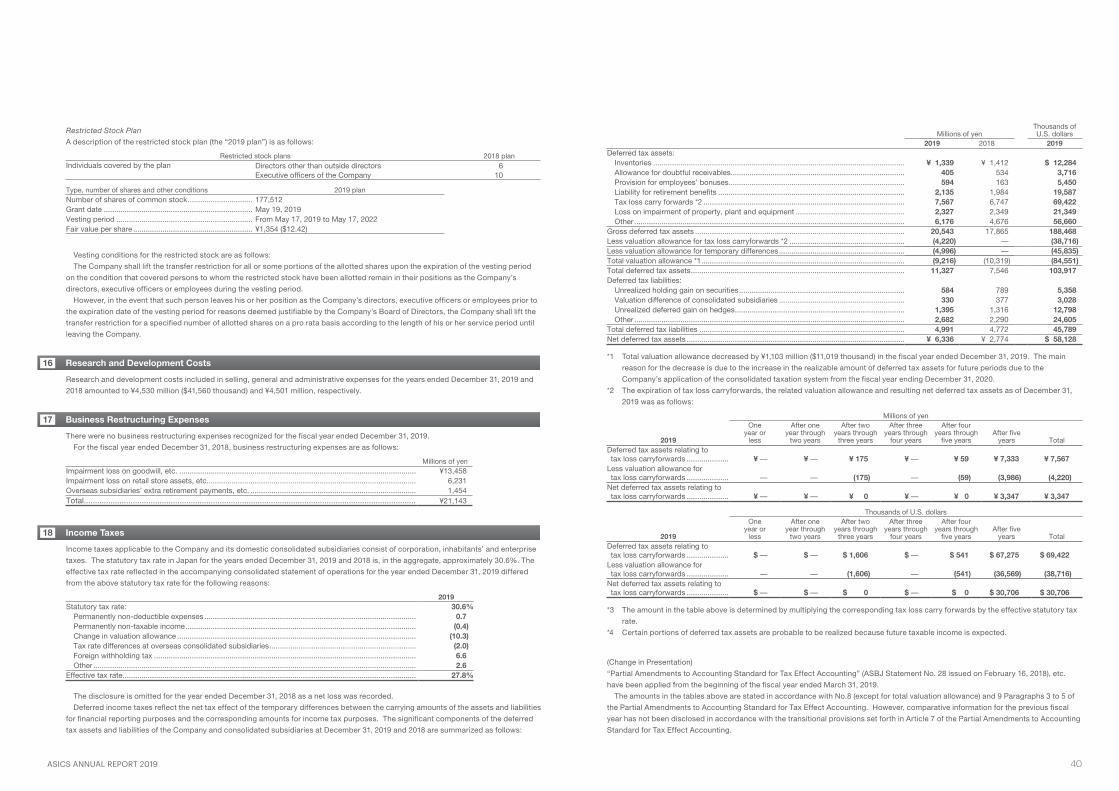
ASICS ANNUAL REPORT 2019 40
Restricted Stock Plan
A description of the restricted stock plan (the “2019 plan”) is as follows:
Restricted stock plans 2018 planIndividuals covered by the plan Directors other than outside directors 6
Executive officers of the Company 10
Type, number of shares and other conditions 2019 planNumber of shares of common stock ............................... 177,512Grant date ....................................................................... May 19, 2019Vesting period ................................................................. From May 17, 2019 to May 17, 2022Fair value per share ......................................................... ¥1,354 ($12.42)
Vesting conditions for the restricted stock are as follows:
The Company shall lift the transfer restriction for all or some portions of the allotted shares upon the expiration of the vesting period
on the condition that covered persons to whom the restricted stock have been allotted remain in their positions as the Company’s
directors, executive officers or employees during the vesting period.
However, in the event that such person leaves his or her position as the Company’s directors, executive officers or employees prior to
the expiration date of the vesting period for reasons deemed justifiable by the Company’s Board of Directors, the Company shall lift the
transfer restriction for a specified number of allotted shares on a pro rata basis according to the length of his or her service period until
leaving the Company.
Research and Development Costs16
Research and development costs included in selling, general and administrative expenses for the years ended December 31, 2019 and
2018 amounted to ¥4,530 million ($41,560 thousand) and ¥4,501 million, respectively.
Business Restructuring Expenses17
There were no business restructuring expenses recognized for the fiscal year ended December 31, 2019.
For the fiscal year ended December 31, 2018, business restructuring expenses are as follows:
Millions of yenImpairment loss on goodwill, etc. ................................................................................................................. ¥13,458Impairment loss on retail store assets, etc.................................................................................................... 6,231Overseas subsidiaries’ extra retirement payments, etc. ............................................................................... 1,454Total ..................................................................................................................................................... ¥21,143
Income Taxes18
Income taxes applicable to the Company and its domestic consolidated subsidiaries consist of corporation, inhabitants’ and enterprise
taxes. The statutory tax rate in Japan for the years ended December 31, 2019 and 2018 is, in the aggregate, approximately 30.6%. The
effective tax rate reflected in the accompanying consolidated statement of operations for the year ended December 31, 2019 differed
from the above statutory tax rate for the following reasons:
2019Statutory tax rate: 30.6%
Permanently non-deductible expenses ..................................................................................................... 0.7Permanently non-taxable income .............................................................................................................. (0.4)Change in valuation allowance .................................................................................................................. (10.3)Tax rate differences at overseas consolidated subsidiaries ...................................................................... (2.0)Foreign withholding tax ............................................................................................................................. 6.6Other .......................................................................................................................................................... 2.6
Effective tax rate ............................................................................................................................................ 27.8%
The disclosure is omitted for the year ended December 31, 2018 as a net loss was recorded.
Deferred income taxes reflect the net tax effect of the temporary differences between the carrying amounts of the assets and liabilities
for financial reporting purposes and the corresponding amounts for income tax purposes. The significant components of the deferred
tax assets and liabilities of the Company and consolidated subsidiaries at December 31, 2019 and 2018 are summarized as follows:
Millions of yenThousands of U.S. dollars
2019 2018 2019Deferred tax assets:
Inventories ........................................................................................................................ ¥ 1,339 ¥ 1,412 $ 12,284Allowance for doubtful receivables ................................................................................... 405 534 3,716Provision for employees’ bonuses .................................................................................... 594 163 5,450Liability for retirement benefits ......................................................................................... 2,135 1,984 19,587Tax loss carry forwards *2 ................................................................................................ 7,567 6,747 69,422Loss on impairment of property, plant and equipment .................................................... 2,327 2,349 21,349Other ................................................................................................................................. 6,176 4,676 56,660
Gross deferred tax assets .................................................................................................... 20,543 17,865 188,468Less valuation allowance for tax loss carryforwards *2 ....................................................... (4,220) – (38,716)Less valuation allowance for temporary differences ............................................................ (4,996) – (45,835)Total valuation allowance *1 ................................................................................................. (9,216) (10,319) (84,551)Total deferred tax assets ...................................................................................................... 11,327 7,546 103,917Deferred tax liabilities:
Unrealized holding gain on securities ............................................................................... 584 789 5,358Valuation difference of consolidated subsidiaries ............................................................ 330 377 3,028Unrealized deferred gain on hedges ................................................................................. 1,395 1,316 12,798Other ................................................................................................................................. 2,682 2,290 24,605
Total deferred tax liabilities .................................................................................................. 4,991 4,772 45,789Net deferred tax assets ........................................................................................................ ¥ 6,336 ¥ 2,774 $ 58,128
*1 Total valuation allowance decreased by ¥1,103 million ($11,019 thousand) in the fiscal year ended December 31, 2019. The main
reason for the decrease is due to the increase in the realizable amount of deferred tax assets for future periods due to the
Company’s application of the consolidated taxation system from the fiscal year ending December 31, 2020.
*2 The expiration of tax loss carryforwards, the related valuation allowance and resulting net deferred tax assets as of December 31,
2019 was as follows:
Millions of yen
2019
One year or
less
After one year through
two years
After two years through
three years
After three years through
four years
After four years through
five yearsAfter five
years TotalDeferred tax assets relating to tax loss carryforwards .................... ¥ – ¥ – ¥ 175 ¥ – ¥ 59 ¥ 7,333 ¥ 7,567
Less valuation allowance for tax loss carryforwards .................... – – (175) – (59) (3,986) (4,220)
Net deferred tax assets relating to tax loss carryforwards .................... ¥ – ¥ – ¥ 0 ¥ – ¥ 0 ¥ 3,347 ¥ 3,347
Thousands of U.S. dollars
2019
One year or
less
After one year through
two years
After two years through
three years
After three years through
four years
After four years through
five yearsAfter five
years TotalDeferred tax assets relating to tax loss carryforwards .................... $ – $ – $ 1,606 $ – $ 541 $ 67,275 $ 69,422
Less valuation allowance for tax loss carryforwards .................... – – (1,606) – (541) (36,569) (38,716)
Net deferred tax assets relating to tax loss carryforwards .................... $ – $ – $ 0 $ – $ 0 $ 30,706 $ 30,706
*3 The amount in the table above is determined by multiplying the corresponding tax loss carry forwards by the effective statutory tax
rate.
*4 Certain portions of deferred tax assets are probable to be realized because future taxable income is expected.
(Change in Presentation)
“Partial Amendments to Accounting Standard for Tax Effect Accounting” (ASBJ Statement No. 28 issued on February 16, 2018), etc.
have been applied from the beginning of the fiscal year ended March 31, 2019.
The amounts in the tables above are stated in accordance with No.8 (except for total valuation allowance) and 9 Paragraphs 3 to 5 of
the Partial Amendments to Accounting Standard for Tax Effect Accounting. However, comparative information for the previous fiscal
year has not been disclosed in accordance with the transitional provisions set forth in Article 7 of the Partial Amendments to Accounting
Standard for Tax Effect Accounting.
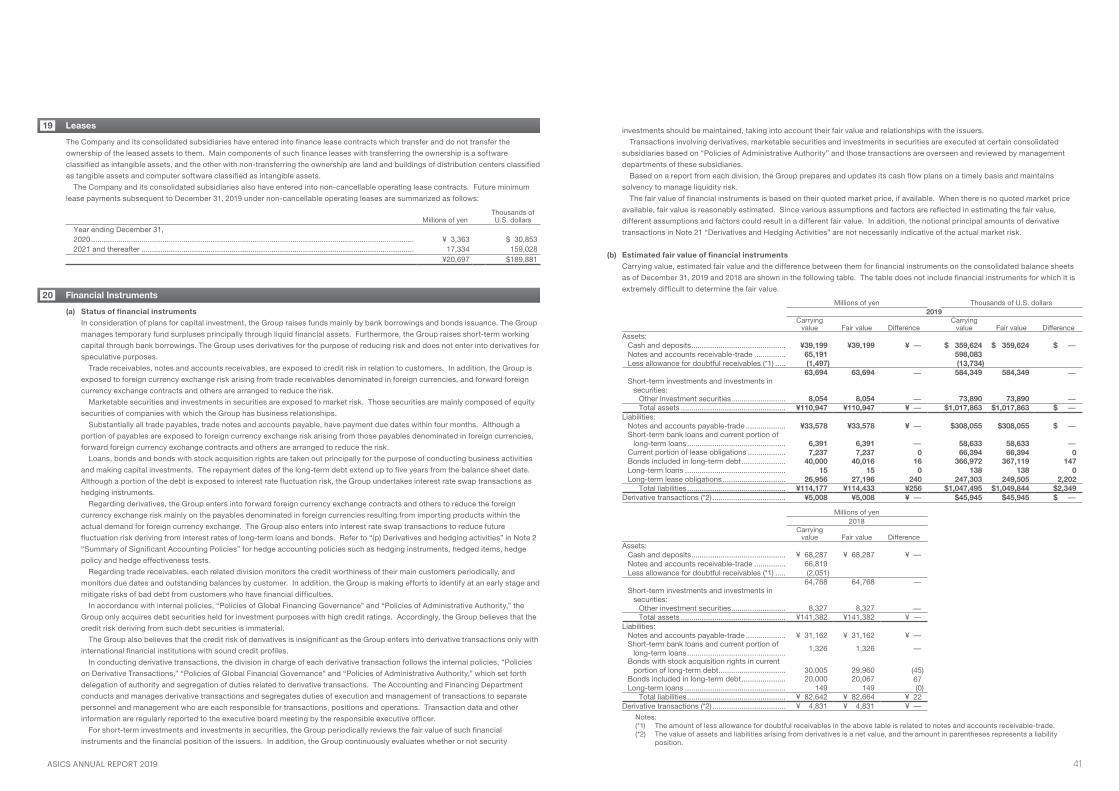
ASICS ANNUAL REPORT 2019 41
Leases19
The Company and its consolidated subsidiaries have entered into finance lease contracts which transfer and do not transfer the
ownership of the leased assets to them. Main components of such finance leases with transferring the ownership is a software
classified as intangible assets, and the other with non-transferring the ownership are land and buildings of distribution centers classified
as tangible assets and computer software classified as intangible assets.
The Company and its consolidated subsidiaries also have entered into non-cancellable operating lease contracts. Future minimum
lease payments subsequent to December 31, 2019 under non-cancellable operating leases are summarized as follows:
Millions of yenThousands of U.S. dollars
Year ending December 31,2020 .......................................................................................................................................................... ¥ 3,363 $ 30,8532021 and thereafter .................................................................................................................................. 17,334 159,028
¥20,697 $189,881
Financial Instruments20
(a) Status of financial instruments
In consideration of plans for capital investment, the Group raises funds mainly by bank borrowings and bonds issuance. The Group
manages temporary fund surpluses principally through liquid financial assets. Furthermore, the Group raises short-term working
capital through bank borrowings. The Group uses derivatives for the purpose of reducing risk and does not enter into derivatives for
speculative purposes.
Trade receivables, notes and accounts receivables, are exposed to credit risk in relation to customers. In addition, the Group is
exposed to foreign currency exchange risk arising from trade receivables denominated in foreign currencies, and forward foreign
currency exchange contracts and others are arranged to reduce the risk.
Marketable securities and investments in securities are exposed to market risk. Those securities are mainly composed of equity
securities of companies with which the Group has business relationships.
Substantially all trade payables, trade notes and accounts payable, have payment due dates within four months. Although a
portion of payables are exposed to foreign currency exchange risk arising from those payables denominated in foreign currencies,
forward foreign currency exchange contracts and others are arranged to reduce the risk.
Loans, bonds and bonds with stock acquisition rights are taken out principally for the purpose of conducting business activities
and making capital investments. The repayment dates of the long-term debt extend up to five years from the balance sheet date.
Although a portion of the debt is exposed to interest rate fluctuation risk, the Group undertakes interest rate swap transactions as
hedging instruments.
Regarding derivatives, the Group enters into forward foreign currency exchange contracts and others to reduce the foreign
currency exchange risk mainly on the payables denominated in foreign currencies resulting from importing products within the
actual demand for foreign currency exchange. The Group also enters into interest rate swap transactions to reduce future
fluctuation risk deriving from interest rates of long-term loans and bonds. Refer to “(p) Derivatives and hedging activities” in Note 2
“Summary of Significant Accounting Policies” for hedge accounting policies such as hedging instruments, hedged items, hedge
policy and hedge effectiveness tests.
Regarding trade receivables, each related division monitors the credit worthiness of their main customers periodically, and
monitors due dates and outstanding balances by customer. In addition, the Group is making efforts to identify at an early stage and
mitigate risks of bad debt from customers who have financial difficulties.
In accordance with internal policies, “Policies of Global Financing Governance” and “Policies of Administrative Authority,” the
Group only acquires debt securities held for investment purposes with high credit ratings. Accordingly, the Group believes that the
credit risk deriving from such debt securities is immaterial.
The Group also believes that the credit risk of derivatives is insignificant as the Group enters into derivative transactions only with
international financial institutions with sound credit profiles.
In conducting derivative transactions, the division in charge of each derivative transaction follows the internal policies, “Policies
on Derivative Transactions,” “Policies of Global Financial Governance” and “Policies of Administrative Authority,” which set forth
delegation of authority and segregation of duties related to derivative transactions. The Accounting and Financing Department
conducts and manages derivative transactions and segregates duties of execution and management of transactions to separate
personnel and management who are each responsible for transactions, positions and operations. Transaction data and other
information are regularly reported to the executive board meeting by the responsible executive officer.
For short-term investments and investments in securities, the Group periodically reviews the fair value of such financial
instruments and the financial position of the issuers. In addition, the Group continuously evaluates whether or not security
investments should be maintained, taking into account their fair value and relationships with the issuers.
Transactions involving derivatives, marketable securities and investments in securities are executed at certain consolidated
subsidiaries based on “Policies of Administrative Authority” and those transactions are overseen and reviewed by management
departments of these subsidiaries.
Based on a report from each division, the Group prepares and updates its cash flow plans on a timely basis and maintains
solvency to manage liquidity risk.
The fair value of financial instruments is based on their quoted market price, if available. When there is no quoted market price
available, fair value is reasonably estimated. Since various assumptions and factors are reflected in estimating the fair value,
different assumptions and factors could result in a different fair value. In addition, the notional principal amounts of derivative
transactions in Note 21 “Derivatives and Hedging Activities” are not necessarily indicative of the actual market risk.
(b) Estimated fair value of financial instruments
Carrying value, estimated fair value and the difference between them for financial instruments on the consolidated balance sheets
as of December 31, 2019 and 2018 are shown in the following table. The table does not include financial instruments for which it is
extremely difficult to determine the fair value.
Millions of yen Thousands of U.S. dollars2019
Carrying value Fair value Difference
Carrying value Fair value Difference
Assets:Cash and deposits ............................................. ¥39,199 ¥39,199 ¥ – $ 359,624 $ 359,624 $ –Notes and accounts receivable-trade ............... 65,191 598,083Less allowance for doubtful receivables (*1) ..... (1,497) (13,734)
63,694 63,694 – 584,349 584,349 –Short-term investments and investments in
securities:Other investment securities .......................... 8,054 8,054 – 73,890 73,890 –Total assets .................................................. ¥110,947 ¥110,947 ¥ – $1,017,863 $1,017,863 $ –
Liabilities:Notes and accounts payable-trade ................... ¥33,578 ¥33,578 ¥ – $308,055 $308,055 $ –Short-term bank loans and current portion of
long-term loans ............................................... 6,391 6,391 – 58,633 58,633 –Current portion of lease obligations .................. 7,237 7,237 0 66,394 66,394 0Bonds included in long-term debt ..................... 40,000 40,016 16 366,972 367,119 147Long-term loans ................................................ 15 15 0 138 138 0Long-term lease obligations .............................. 26,956 27,196 240 247,303 249,505 2,202
Total liabilities ............................................... ¥114,177 ¥114,433 ¥256 $1,047,495 $1,049,844 $2,349Derivative transactions (*2) ................................... ¥5,008 ¥5,008 ¥ – $45,945 $45,945 $ –
Millions of yen2018
Carrying value Fair value Difference
Assets:Cash and deposits ............................................. ¥ 68,287 ¥ 68,287 ¥ –Notes and accounts receivable-trade ............... 66,819Less allowance for doubtful receivables (*1) ..... (2,051)
64,768 64,768 –Short-term investments and investments in
securities:Other investment securities .......................... 8,327 8,327 –Total assets .................................................. ¥141,382 ¥141,382 ¥ –
Liabilities:Notes and accounts payable-trade ................... ¥ 31,162 ¥ 31,162 ¥ –Short-term bank loans and current portion of
long-term loans ...............................................1,326 1,326 –
Bonds with stock acquisition rights in current portion of long-term debt ................................ 30,005 29,960 (45)
Bonds included in long-term debt ..................... 20,000 20,067 67Long-term loans ................................................ 149 149 (0)
Total liabilities ............................................... ¥ 82,642 ¥ 82,664 ¥ 22Derivative transactions (*2) ................................... ¥ 4,831 ¥ 4,831 ¥ –
Notes: (*1) The amount of less allowance for doubtful receivables in the above table is related to notes and accounts receivable-trade. (*2) The value of assets and liabilities arising from derivatives is a net value, and the amount in parentheses represents a liability
position.
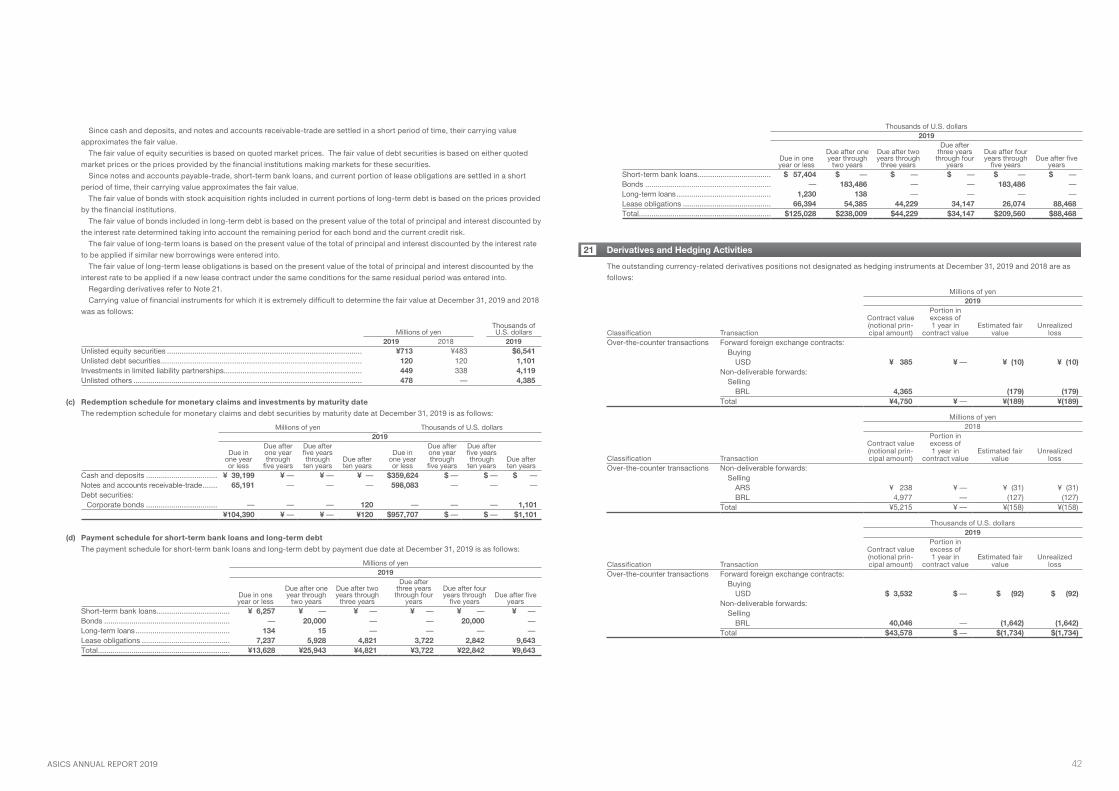
ASICS ANNUAL REPORT 2019 42
Since cash and deposits, and notes and accounts receivable-trade are settled in a short period of time, their carrying value
approximates the fair value.
The fair value of equity securities is based on quoted market prices. The fair value of debt securities is based on either quoted
market prices or the prices provided by the financial institutions making markets for these securities.
Since notes and accounts payable-trade, short-term bank loans, and current portion of lease obligations are settled in a short
period of time, their carrying value approximates the fair value.
The fair value of bonds with stock acquisition rights included in current portions of long-term debt is based on the prices provided
by the financial institutions.
The fair value of bonds included in long-term debt is based on the present value of the total of principal and interest discounted by
the interest rate determined taking into account the remaining period for each bond and the current credit risk.
The fair value of long-term loans is based on the present value of the total of principal and interest discounted by the interest rate
to be applied if similar new borrowings were entered into.
The fair value of long-term lease obligations is based on the present value of the total of principal and interest discounted by the
interest rate to be applied if a new lease contract under the same conditions for the same residual period was entered into.
Regarding derivatives refer to Note 21.
Carrying value of financial instruments for which it is extremely difficult to determine the fair value at December 31, 2019 and 2018
was as follows:
Millions of yenThousands of U.S. dollars
2019 2018 2019Unlisted equity securities ............................................................................................. ¥713 ¥483 $6,541Unlisted debt securities ................................................................................................ 120 120 1,101Investments in limited liability partnerships.................................................................. 449 338 4,119Unlisted others ............................................................................................................. 478 – 4,385
(c) Redemption schedule for monetary claims and investments by maturity date
The redemption schedule for monetary claims and debt securities by maturity date at December 31, 2019 is as follows:
Millions of yen Thousands of U.S. dollars2019
Due in one year or less
Due after one year through
five years
Due after five years through
ten yearsDue after ten years
Due in one year or less
Due after one year through
five years
Due after five years through
ten yearsDue after ten years
Cash and deposits .................................. ¥ 39,199 ¥ – ¥ – ¥ – $359,624 $ – $ – $ –Notes and accounts receivable-trade ....... 65,191 – – – 598,083 – – –Debt securities:
Corporate bonds .................................. – – – 120 – – – 1,101¥104,390 ¥ – ¥ – ¥120 $957,707 $ – $ – $1,101
(d) Payment schedule for short-term bank loans and long-term debt
The payment schedule for short-term bank loans and long-term debt by payment due date at December 31, 2019 is as follows:
Millions of yen2019
Due in one year or less
Due after one year through
two years
Due after two years through
three years
Due after three years through four
years
Due after four years through
five yearsDue after five
yearsShort-term bank loans ................................... ¥ 6,257 ¥ – ¥ – ¥ – ¥ – ¥ –Bonds ............................................................ – 20,000 – – 20,000 –Long-term loans ............................................. 134 15 – – – –Lease obligations .......................................... 7,237 5,928 4,821 3,722 2,842 9,643Total ............................................................... ¥13,628 ¥25,943 ¥4,821 ¥3,722 ¥22,842 ¥9,643
Thousands of U.S. dollars2019
Due in one year or less
Due after one year through
two years
Due after two years through
three years
Due after three years through four
years
Due after four years through
five yearsDue after five
yearsShort-term bank loans ................................... $ 57,404 $ – $ – $ – $ – $ –Bonds ............................................................ – 183,486 – – 183,486 –Long-term loans ............................................. 1,230 138 – – – –Lease obligations .......................................... 66,394 54,385 44,229 34,147 26,074 88,468Total ............................................................... $125,028 $238,009 $44,229 $34,147 $209,560 $88,468
Derivatives and Hedging Activities21
The outstanding currency-related derivatives positions not designated as hedging instruments at December 31, 2019 and 2018 are as
follows:
Millions of yen2019
Classification Transaction
Contract value (notional prin-cipal amount)
Portion in excess of 1 year in
contract valueEstimated fair
valueUnrealized
lossOver-the-counter transactions Forward foreign exchange contracts:
BuyingUSD ¥ 385 ¥ – ¥ (10) ¥ (10)
Non-deliverable forwards:Selling
BRL 4,365 (179) (179)Total ¥4,750 ¥ – ¥(189) ¥(189)
Millions of yen2018
Classification Transaction
Contract value (notional prin-cipal amount)
Portion in excess of 1 year in
contract valueEstimated fair
valueUnrealized
lossOver-the-counter transactions Non-deliverable forwards:
SellingARS ¥ 238 ¥ – ¥ (31) ¥ (31)BRL 4,977 – (127) (127)
Total ¥5,215 ¥ – ¥(158) ¥(158)
Thousands of U.S. dollars2019
Classification Transaction
Contract value (notional prin-cipal amount)
Portion in excess of 1 year in
contract valueEstimated fair
valueUnrealized
lossOver-the-counter transactions Forward foreign exchange contracts:
BuyingUSD $ 3,532 $ – $ (92) $ (92)
Non-deliverable forwards:Selling
BRL 40,046 – (1,642) (1,642)Total $43,578 $ – $(1,734) $(1,734)

ASICS ANNUAL REPORT 2019 43
Fair value is based on the prices obtained from counterparty financial institutions.
There are no outstanding interest-related derivative positions not designated as hedging instruments at December 31, 2019 and 2018.
The outstanding currency-related derivatives positions designated as hedging instruments at December 31, 2019 and 2018 are as follows:
Millions of yen Thousands of U.S. dollars2019
Classification Transaction Hedged item
Contract value
(notional principal amount)
Portion in excess of 1 year in contract
valueEstimated fair value
Contract value
(notional principal amount)
Portion in excess of 1 year in contract
valueEstimated fair value
Deferral hedge accounting Forward foreign exchange contracts:
Selling
USD Accounts receivable-trade (Forecasted transaction) ¥ 107 ¥ – ¥ (1) $ 982 $ – $ (9)
EUR Accounts receivable-trade (Forecasted transaction) 1,190 – 11 10,917 – 101
GBP Accounts receivable-trade (Forecasted transaction) 9,243 4,357 (536) 84,798 39,972 (4,917)
NOK Accounts receivable-trade (Forecasted transaction) 324 – 2 2,972 – 18
DKK Accounts receivable-trade (Forecasted transaction) 397 – 4 3,642 – 37
Buying
USD Accounts payable-trade (Forecasted transaction) 149,358 66,608 5,717 1,370,258 611,083 52,449
Subtotal 160,619 70,965 5,197 1,473,569 651,055 47,679Allocation method for forward foreign exchange contracts
Forward foreign exchange contracts:Selling
USD Accounts receivable-trade 208 – – 1,908 – –Buying
USD Accounts payable-trade 4,075 – – 37,385 – –Total ¥164,902 ¥70,965 ¥5,197 $1,512,862 $651,055 $47,679
Millions of yen2018
Classification Transaction Hedged item
Contract value
(notional principal amount)
Portion in excess of 1 year in contract
valueEstimated fair value
Deferral hedge accounting Forward foreign exchange contracts:
Selling
USD Accounts receivable-trade (Forecasted transaction) ¥ 51 ¥ – ¥ 0
EUR Accounts receivable-trade (Forecasted transaction) 1,214 – 3
GBP Accounts receivable-trade (Forecasted transaction) 11,952 5,736 185
NOK Accounts receivable-trade (Forecasted transaction) 402 – 16
DKK Accounts receivable-trade (Forecasted transaction) 490 – 3
Buying
USD Accounts payable-trade (Forecasted transaction) 147,848 71,529 4,782
Subtotal 161,957 77,265 4,989Allocation method for forward foreign exchange contracts
Forward foreign exchange contracts:Selling
USD Accounts receivable-trade 199 – –Buying
USD Accounts payable-trade 765 – –Total ¥162,921 ¥77,265 ¥4,989
The fair value of forward foreign exchange contracts that qualify for the allocation method is included in accounts receivable-trade and
accounts payable-trade. Fair value is based on the prices obtained from counterparty financial institutions.
There are no outstanding interest-related derivative positions designed as hedging instruments at December 31, 2019 and 2018.
Other Comprehensive Loss22
The following table presents the changes in the components of other comprehensive loss for the years ended December 31, 2019 and
2018:
Millions of yenThousands of U.S. dollars
2019 2018 2019Net unrealized holding loss on securities:
Unrealized holding gain (loss) arising during the year ...................................................... ¥ 694 ¥ (1,846) $ 6,367Net gain reclassified into income ...................................................................................... (1,453) (1,263) (13,330)Subtotal ............................................................................................................................ (759) (3,109) (6,963)Less: tax effect ................................................................................................................. 205 914 1,880
Net unrealized holding loss on securities ............................................................................. (554) (2,195) (5,083)
Unrealized deferred (loss) gain on hedges:Unrealized deferred gain arising during the year .............................................................. 3,339 20,499 30,633Net gain reclassified into income ...................................................................................... (3,532) (12,106) (32,404)Subtotal ............................................................................................................................ (193) 8,393 (1,771)Less: tax effect ................................................................................................................. 54 (2,184) 496
Unrealized deferred (loss) gain on hedges ........................................................................... (139) 6,209 (1,275)
Revaluation reserve for assets of overseas subsidiaries...................................................... – (18) –
Translation adjustments:Translation adjustments arising during the year ............................................................... (3,077) (9,909) (28,228)Net gain reclassified into income ...................................................................................... – – –Subtotal ............................................................................................................................ (3,077) (9,909) (28,228)Less: tax effect ................................................................................................................. – – –
Translation adjustments ....................................................................................................... (3,077) (9,909) (28,228)
Retirement benefits liability adjustments:Retirement benefits liability adjustments arising during the year ..................................... 3 11 28Net loss reclassified into income ...................................................................................... 57 72 523Subtotal ............................................................................................................................ 60 83 551Less: tax effect ................................................................................................................. (10) (12) (92)
Retirement benefits liability adjustments ............................................................................. 50 71 459Total other comprehensive loss, net .................................................................................... ¥(3,720) ¥ (5,842) $(34,127)
Supplementary Information on the Consolidated Statement of Cash Flows23
Information on significant non-cash transactions
The Company and its consolidated subsidiaries recorded leased assets of ¥2,781 million ($25,514 thousand) and ¥969 million and lease
obligations of ¥2,781 million ($25,514 thousand) and ¥969 million under finance leases for the years ended December 31, 2019 and 2018,
respectively.
Assets corresponding to asset retirement obligations recorded as of December 31, 2019 and 2018 were ¥209 million ($1,917 thousand)
and ¥186 million, respectively. Liabilities corresponding to asset retirement obligations recorded as of December 31, 2019 and 2018
were ¥224 million ($2,055 thousand) and ¥202 million, respectively.
Outline of assets acquired and liabilities assumed through a business acquisition during the year ended December 31, 2019, related
acquisition cost of business and payment for acquisition of business are as follows:
Millions of yenThousands of U.S. dollars
2019 2019Current assets .............................................................................................................................................. ¥ 375 $ 3,440Long-term assets ......................................................................................................................................... 374 3,431Goodwill ....................................................................................................................................................... 2,831 25,972Current liabilities ........................................................................................................................................... (538) (4,935)Long-term liabilities ...................................................................................................................................... (451) (4,138)Foreign currency translation adjustment ...................................................................................................... (30) (275)Acquisition cost of business ........................................................................................................................ 2,561 23,495Payment for acquisition of business ............................................................................................................. ¥2,561 $23,495
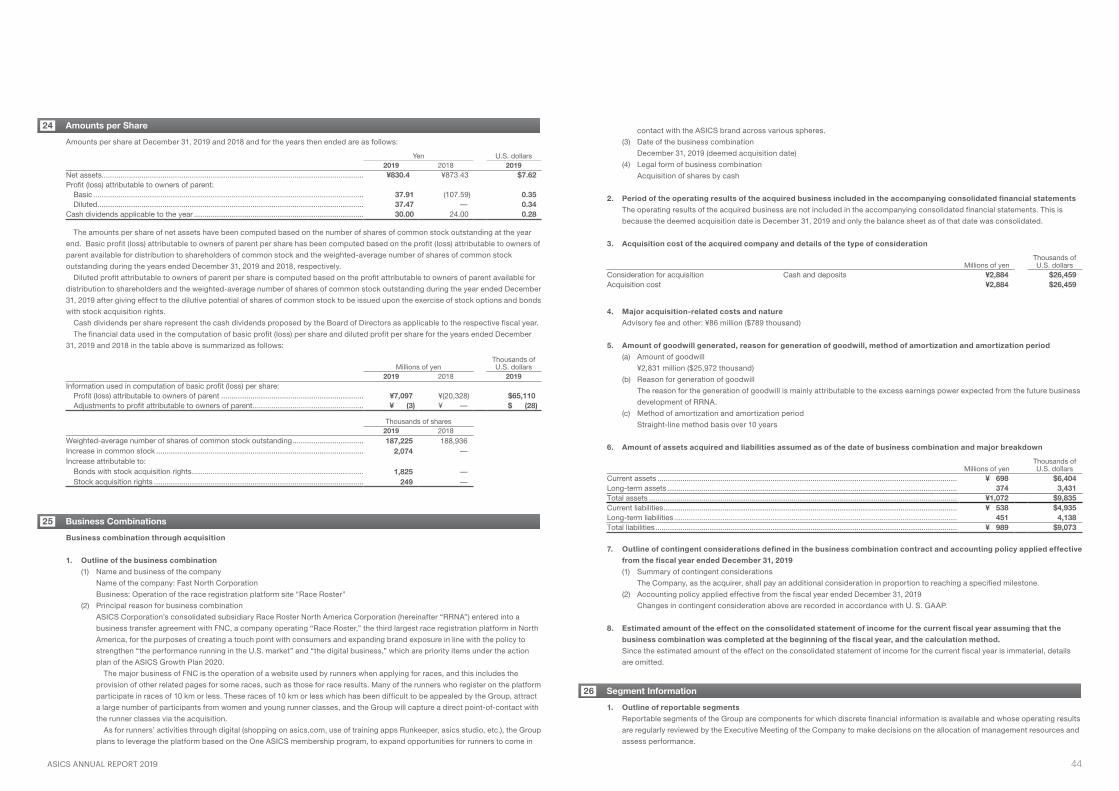
ASICS ANNUAL REPORT 2019 44
Amounts per Share24
Amounts per share at December 31, 2019 and 2018 and for the years then ended are as follows:
Yen U.S. dollars2019 2018 2019
Net assets............................................................................................................................. ¥830.4 ¥873.43 $7.62Profit (loss) attributable to owners of parent:
Basic ................................................................................................................................. 37.91 (107.59) 0.35Diluted ............................................................................................................................... 37.47 – 0.34
Cash dividends applicable to the year ................................................................................. 30.00 24.00 0.28
The amounts per share of net assets have been computed based on the number of shares of common stock outstanding at the year
end. Basic profit (loss) attributable to owners of parent per share has been computed based on the profit (loss) attributable to owners of
parent available for distribution to shareholders of common stock and the weighted-average number of shares of common stock
outstanding during the years ended December 31, 2019 and 2018, respectively.
Diluted profit attributable to owners of parent per share is computed based on the profit attributable to owners of parent available for
distribution to shareholders and the weighted-average number of shares of common stock outstanding during the year ended December
31, 2019 after giving effect to the dilutive potential of shares of common stock to be issued upon the exercise of stock options and bonds
with stock acquisition rights.
Cash dividends per share represent the cash dividends proposed by the Board of Directors as applicable to the respective fiscal year.
The financial data used in the computation of basic profit (loss) per share and diluted profit per share for the years ended December
31, 2019 and 2018 in the table above is summarized as follows:
Millions of yenThousands of U.S. dollars
2019 2018 2019Information used in computation of basic profit (loss) per share:
Profit (loss) attributable to owners of parent .................................................................... ¥7,097 ¥(20,328) $65,110Adjustments to profit attributable to owners of parent ..................................................... ¥ (3) ¥ – $ (28)
Thousands of shares2019 2018
Weighted-average number of shares of common stock outstanding .................................. 187,225 188,936Increase in common stock ................................................................................................... 2,074 –Increase attributable to:
Bonds with stock acquisition rights .................................................................................. 1,825 –Stock acquisition rights .................................................................................................... 249 –
Business Combinations25
Business combination through acquisition
1. Outline of the business combination
(1) Name and business of the company
Name of the company: Fast North Corporation
Business: Operation of the race registration platform site “Race Roster”
(2) Principal reason for business combination
ASICS Corporation’s consolidated subsidiary Race Roster North America Corporation (hereinafter “RRNA”) entered into a
business transfer agreement with FNC, a company operating “Race Roster,” the third largest race registration platform in North
America, for the purposes of creating a touch point with consumers and expanding brand exposure in line with the policy to
strengthen “the performance running in the U.S. market” and “the digital business,” which are priority items under the action
plan of the ASICS Growth Plan 2020.
The major business of FNC is the operation of a website used by runners when applying for races, and this includes the
provision of other related pages for some races, such as those for race results. Many of the runners who register on the platform
participate in races of 10 km or less. These races of 10 km or less which has been difficult to be appealed by the Group, attract
a large number of participants from women and young runner classes, and the Group will capture a direct point-of-contact with
the runner classes via the acquisition.
As for runners’ activities through digital (shopping on asics.com, use of training apps Runkeeper, asics studio, etc.), the Group
plans to leverage the platform based on the One ASICS membership program, to expand opportunities for runners to come in
contact with the ASICS brand across various spheres.
(3) Date of the business combination
December 31, 2019 (deemed acquisition date)
(4) Legal form of business combination
Acquisition of shares by cash
2. Period of the operating results of the acquired business included in the accompanying consolidated financial statements
The operating results of the acquired business are not included in the accompanying consolidated financial statements. This is
because the deemed acquisition date is December 31, 2019 and only the balance sheet as of that date was consolidated.
3. Acquisition cost of the acquired company and details of the type of consideration
Millions of yenThousands of U.S. dollars
Consideration for acquisition Cash and deposits ¥2,884 $26,459Acquisition cost ¥2,884 $26,459
4. Major acquisition-related costs and nature
Advisory fee and other: ¥86 million ($789 thousand)
5. Amount of goodwill generated, reason for generation of goodwill, method of amortization and amortization period
(a) Amount of goodwill
¥2,831 million ($25,972 thousand)
(b) Reason for generation of goodwill
The reason for the generation of goodwill is mainly attributable to the excess earnings power expected from the future business
development of RRNA.
(c) Method of amortization and amortization period
Straight-line method basis over 10 years
6. Amount of assets acquired and liabilities assumed as of the date of business combination and major breakdown
Millions of yenThousands of U.S. dollars
Current assets ............................................................................................................................................... ¥ 698 $6,404Long-term assets .......................................................................................................................................... 374 3,431Total assets ................................................................................................................................................... ¥1,072 $9,835Current liabilities ............................................................................................................................................ ¥ 538 $4,935Long-term liabilities ....................................................................................................................................... 451 4,138Total liabilities ................................................................................................................................................ ¥ 989 $9,073
7. Outline of contingent considerations defined in the business combination contract and accounting policy applied effective
from the fiscal year ended December 31, 2019
(1) Summary of contingent considerations
The Company, as the acquirer, shall pay an additional consideration in proportion to reaching a specified milestone.
(2) Accounting policy applied effective from the fiscal year ended December 31, 2019
Changes in contingent consideration above are recorded in accordance with U. S. GAAP.
8. Estimated amount of the effect on the consolidated statement of income for the current fiscal year assuming that the
business combination was completed at the beginning of the fiscal year, and the calculation method.
Since the estimated amount of the effect on the consolidated statement of income for the current fiscal year is immaterial, details
are omitted.
Segment Information26
1. Outline of reportable segments
Reportable segments of the Group are components for which discrete financial information is available and whose operating results
are regularly reviewed by the Executive Meeting of the Company to make decisions on the allocation of management resources and
assess performance.
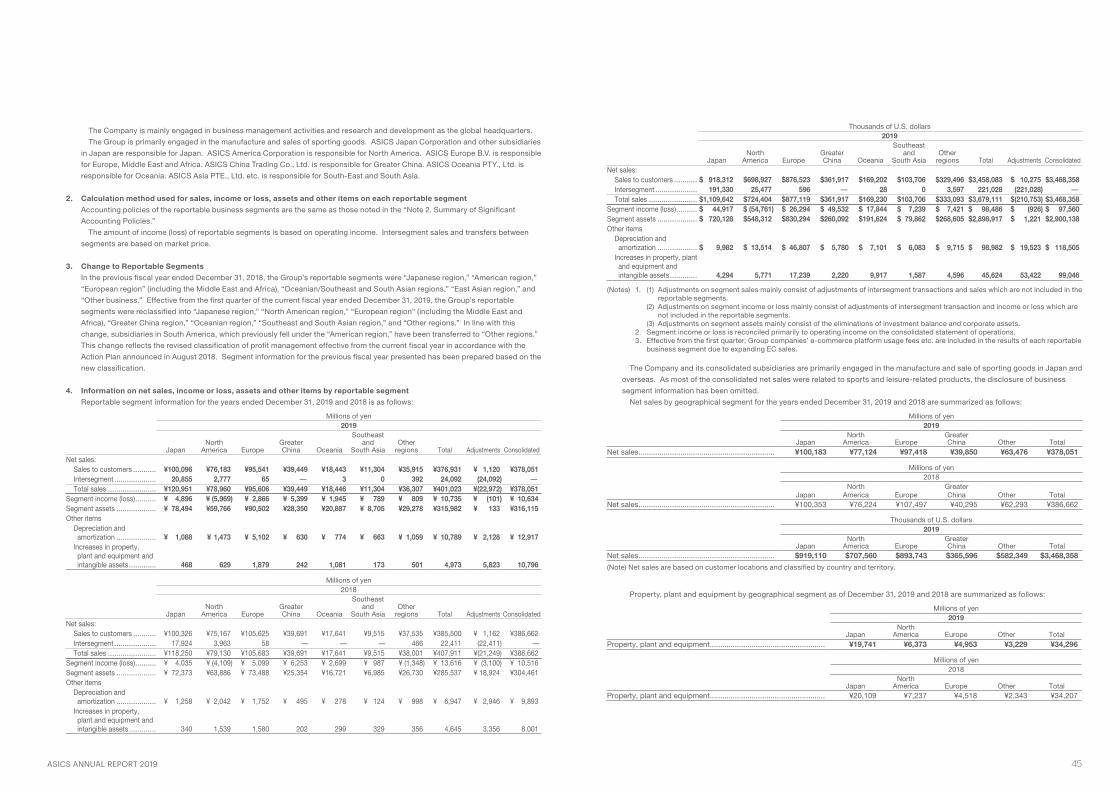
ASICS ANNUAL REPORT 2019 45
The Company is mainly engaged in business management activities and research and development as the global headquarters.
The Group is primarily engaged in the manufacture and sales of sporting goods. ASICS Japan Corporation and other subsidiaries
in Japan are responsible for Japan. ASICS America Corporation is responsible for North America. ASICS Europe B.V. is responsible
for Europe, Middle East and Africa. ASICS China Trading Co., Ltd. is responsible for Greater China. ASICS Oceania PTY., Ltd. is
responsible for Oceania. ASICS Asia PTE., Ltd. etc. is responsible for South-East and South Asia.
2. Calculation method used for sales, income or loss, assets and other items on each reportable segment
Accounting policies of the reportable business segments are the same as those noted in the “Note 2. Summary of Significant
Accounting Policies.”
The amount of income (loss) of reportable segments is based on operating income. Intersegment sales and transfers between
segments are based on market price.
3. Change to Reportable Segments
In the previous fiscal year ended December 31, 2018, the Group’s reportable segments were “Japanese region,” “American region,”
“European region” (including the Middle East and Africa), “Oceanian/Southeast and South Asian regions,” “East Asian region,” and
“Other business.” Effective from the first quarter of the current fiscal year ended December 31, 2019, the Group’s reportable
segments were reclassified into “Japanese region,” “North American region,” “European region” (including the Middle East and
Africa), “Greater China region,” “Oceanian region,” “Southeast and South Asian region,” and “Other regions.” In line with this
change, subsidiaries in South America, which previously fell under the “American region,” have been transferred to “Other regions.”
This change reflects the revised classification of profit management effective from the current fiscal year in accordance with the
Action Plan announced in August 2018. Segment information for the previous fiscal year presented has been prepared based on the
new classification.
4. Information on net sales, income or loss, assets and other items by reportable segment
Reportable segment information for the years ended December 31, 2019 and 2018 is as follows:
Millions of yen2019
JapanNorth
America EuropeGreater China Oceania
Southeast and
South AsiaOther
regions Total Adjustments ConsolidatedNet sales:
Sales to customers ........... ¥100,096 ¥76,183 ¥95,541 ¥39,449 ¥18,443 ¥11,304 ¥35,915 ¥376,931 ¥ 1,120 ¥378,051Intersegment .................... 20,855 2,777 65 – 3 0 392 24,092 (24,092) –Total sales ....................... ¥120,951 ¥78,960 ¥95,606 ¥39,449 ¥18,446 ¥11,304 ¥36,307 ¥401,023 ¥(22,972) ¥378,051
Segment income (loss) .......... ¥ 4,896 ¥ (5,969) ¥ 2,866 ¥ 5,399 ¥ 1,945 ¥ 789 ¥ 809 ¥ 10,735 ¥ (101) ¥ 10,634Segment assets ................... ¥ 78,494 ¥59,766 ¥90,502 ¥28,350 ¥20,887 ¥ 8,705 ¥29,278 ¥315,982 ¥ 133 ¥316,115Other items
Depreciation and amortization ................... ¥ 1,088 ¥ 1,473 ¥ 5,102 ¥ 630 ¥ 774 ¥ 663 ¥ 1,059 ¥ 10,789 ¥ 2,128 ¥ 12,917
Increases in property, plant and equipment and intangible assets ............. 468 629 1,879 242 1,081 173 501 4,973 5,823 10,796
Millions of yen2018
JapanNorth
America EuropeGreater China Oceania
Southeast and
South AsiaOther
regions Total Adjustments ConsolidatedNet sales:
Sales to customers ........... ¥100,326 ¥75,167 ¥105,625 ¥39,691 ¥17,641 ¥9,515 ¥37,535 ¥385,500 ¥ 1,162 ¥386,662Intersegment .................... 17,924 3,963 58 – – – 466 22,411 (22,411) –Total sales ....................... ¥118,250 ¥79,130 ¥105,683 ¥39,691 ¥17,641 ¥9,515 ¥38,001 ¥407,911 ¥(21,249) ¥386,662
Segment income (loss) .......... ¥ 4,035 ¥ (4,109) ¥ 5,099 ¥ 6,253 ¥ 2,699 ¥ 987 ¥ (1,348) ¥ 13,616 ¥ (3,100) ¥ 10,516Segment assets ................... ¥ 72,373 ¥63,886 ¥ 73,488 ¥25,354 ¥16,721 ¥6,985 ¥26,730 ¥285,537 ¥ 18,924 ¥304,461Other items
Depreciation and amortization ................... ¥ 1,258 ¥ 2,042 ¥ 1,752 ¥ 495 ¥ 278 ¥ 124 ¥ 998 ¥ 6,947 ¥ 2,946 ¥ 9,893
Increases in property, plant and equipment and intangible assets ............. 340 1,539 1,580 202 299 329 356 4,645 3,356 8,001
Thousands of U.S. dollars2019
JapanNorth
America EuropeGreater China Oceania
Southeast and
South AsiaOther
regions Total Adjustments ConsolidatedNet sales:
Sales to customers ........... $ 918,312 $698,927 $876,523 $361,917 $169,202 $103,706 $329,496 $3,458,083 $ 10,275 $3,468,358Intersegment .................... 191,330 25,477 596 – 28 0 3,597 221,028 (221,028) –Total sales ....................... $1,109,642 $724,404 $877,119 $361,917 $169,230 $103,706 $333,093 $3,679,111 $(210,753) $3,468,358
Segment income (loss) .......... $ 44,917 $ (54,761) $ 26,294 $ 49,532 $ 17,844 $ 7,239 $ 7,421 $ 98,486 $ (926) $ 97,560Segment assets ................... $ 720,128 $548,312 $830,294 $260,092 $191,624 $ 79,862 $268,605 $2,898,917 $ 1,221 $2,900,138Other items
Depreciation and amortization ................... $ 9,982 $ 13,514 $ 46,807 $ 5,780 $ 7,101 $ 6,083 $ 9,715 $ 98,982 $ 19,523 $ 118,505
Increases in property, plant and equipment and intangible assets ............. 4,294 5,771 17,239 2,220 9,917 1,587 4,596 45,624 53,422 99,046
(Notes) 1. (1) Adjustments on segment sales mainly consist of adjustments of intersegment transactions and sales which are not included in the reportable segments.
(2) Adjustments on segment income or loss mainly consist of adjustments of intersegment transaction and income or loss which are not included in the reportable segments.
(3) Adjustments on segment assets mainly consist of the eliminations of investment balance and corporate assets. 2. Segment income or loss is reconciled primarily to operating income on the consolidated statement of operations. 3. Effective from the first quarter, Group companies’ e-commerce platform usage fees etc. are included in the results of each reportable
business segment due to expanding EC sales.
The Company and its consolidated subsidiaries are primarily engaged in the manufacture and sale of sporting goods in Japan and
overseas. As most of the consolidated net sales were related to sports and leisure-related products, the disclosure of business
segment information has been omitted.
Net sales by geographical segment for the years ended December 31, 2019 and 2018 are summarized as follows:
Millions of yen2019
JapanNorth
America EuropeGreater China Other Total
Net sales ................................................................. ¥100,183 ¥77,124 ¥97,418 ¥39,850 ¥63,476 ¥378,051
Millions of yen2018
JapanNorth
America EuropeGreater China Other Total
Net sales ................................................................. ¥100,353 ¥76,224 ¥107,497 ¥40,295 ¥62,293 ¥386,662
Thousands of U.S. dollars2019
JapanNorth
America EuropeGreater China Other Total
Net sales ................................................................. $919,110 $707,560 $893,743 $365,596 $582,349 $3,468,358
(Note) Net sales are based on customer locations and classified by country and territory.
Property, plant and equipment by geographical segment as of December 31, 2019 and 2018 are summarized as follows:
Millions of yen2019
JapanNorth
America Europe Other TotalProperty, plant and equipment ....................................................... ¥19,741 ¥6,373 ¥4,953 ¥3,229 ¥34,296
Millions of yen2018
JapanNorth
America Europe Other TotalProperty, plant and equipment ....................................................... ¥20,109 ¥7,237 ¥4,518 ¥2,343 ¥34,207
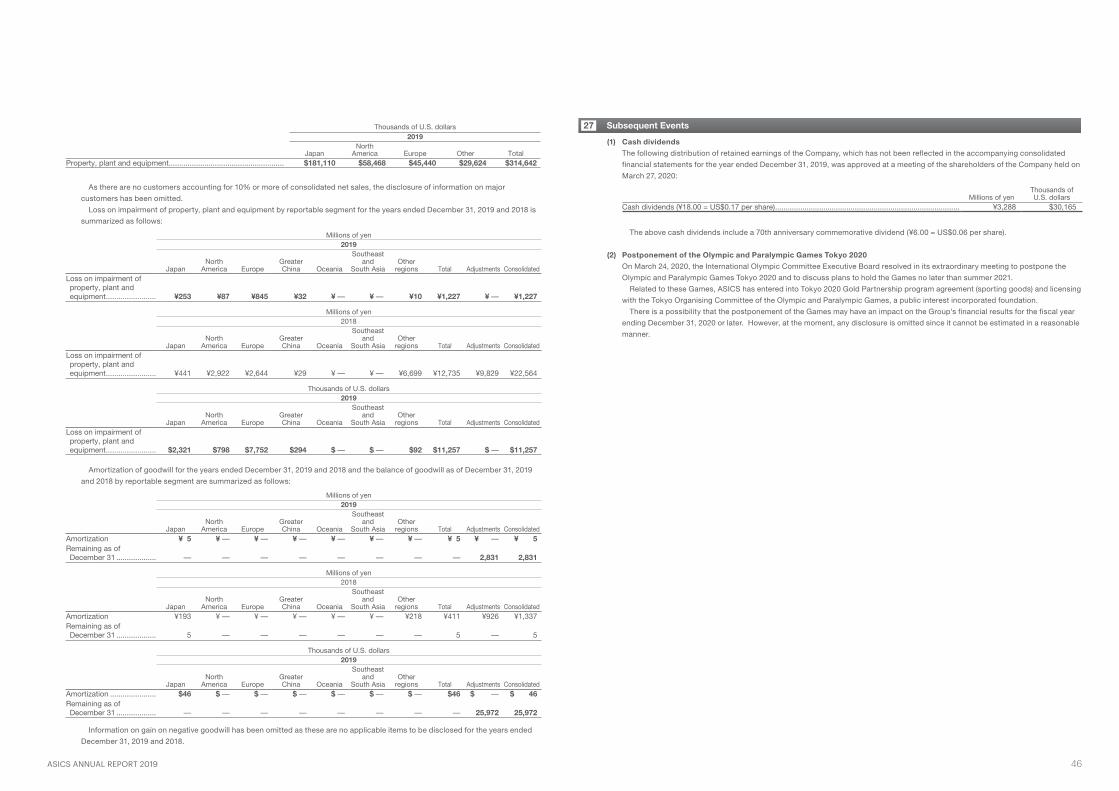
ASICS ANNUAL REPORT 2019 46
Thousands of U.S. dollars2019
JapanNorth
America Europe Other TotalProperty, plant and equipment ....................................................... $181,110 $58,468 $45,440 $29,624 $314,642
As there are no customers accounting for 10% or more of consolidated net sales, the disclosure of information on major
customers has been omitted.
Loss on impairment of property, plant and equipment by reportable segment for the years ended December 31, 2019 and 2018 is
summarized as follows:
Millions of yen2019
JapanNorth
America EuropeGreater China Oceania
Southeast and
South AsiaOther
regions Total Adjustments ConsolidatedLoss on impairment of property, plant and equipment ........................ ¥253 ¥87 ¥845 ¥32 ¥ – ¥ – ¥10 ¥1,227 ¥ – ¥1,227
Millions of yen2018
JapanNorth
America EuropeGreater China Oceania
Southeast and
South AsiaOther
regions Total Adjustments ConsolidatedLoss on impairment of property, plant and equipment ........................ ¥441 ¥2,922 ¥2,644 ¥29 ¥ – ¥ – ¥6,699 ¥12,735 ¥9,829 ¥22,564
Thousands of U.S. dollars2019
JapanNorth
America EuropeGreater China Oceania
Southeast and
South AsiaOther
regions Total Adjustments ConsolidatedLoss on impairment of property, plant and equipment ........................ $2,321 $798 $7,752 $294 $ – $ – $92 $11,257 $ – $11,257
Amortization of goodwill for the years ended December 31, 2019 and 2018 and the balance of goodwill as of December 31, 2019
and 2018 by reportable segment are summarized as follows:
Millions of yen2019
JapanNorth
America EuropeGreater China Oceania
Southeast and
South AsiaOther
regions Total Adjustments ConsolidatedAmortization ¥ 5 ¥ – ¥ – ¥ – ¥ – ¥ – ¥ – ¥ 5 ¥ – ¥ 5Remaining as of December 31 ................... – – – – – – – – 2,831 2,831
Millions of yen2018
JapanNorth
America EuropeGreater China Oceania
Southeast and
South AsiaOther
regions Total Adjustments ConsolidatedAmortization ¥193 ¥ – ¥ – ¥ – ¥ – ¥ – ¥218 ¥411 ¥926 ¥1,337Remaining as of December 31 ................... 5 – – – – – – 5 – 5
Thousands of U.S. dollars2019
JapanNorth
America EuropeGreater China Oceania
Southeast and
South AsiaOther
regions Total Adjustments ConsolidatedAmortization ...................... $46 $ – $ – $ – $ – $ – $ – $46 $ – $ 46Remaining as of December 31 ................... – – – – – – – – 25,972 25,972
Information on gain on negative goodwill has been omitted as these are no applicable items to be disclosed for the years ended
December 31, 2019 and 2018.
Subsequent Events27
(1) Cash dividends
The following distribution of retained earnings of the Company, which has not been reflected in the accompanying consolidated
financial statements for the year ended December 31, 2019, was approved at a meeting of the shareholders of the Company held on
March 27, 2020:
Millions of yenThousands of U.S. dollars
Cash dividends (¥18.00 = US$0.17 per share) ........................................................................................ ¥3,288 $30,165
The above cash dividends include a 70th anniversary commemorative dividend (¥6.00 = US$0.06 per share).
(2) Postponement of the Olympic and Paralympic Games Tokyo 2020
On March 24, 2020, the International Olympic Committee Executive Board resolved in its extraordinary meeting to postpone the
Olympic and Paralympic Games Tokyo 2020 and to discuss plans to hold the Games no later than summer 2021.
Related to these Games, ASICS has entered into Tokyo 2020 Gold Partnership program agreement (sporting goods) and licensing
with the Tokyo Organising Committee of the Olympic and Paralympic Games, a public interest incorporated foundation.
There is a possibility that the postponement of the Games may have an impact on the Group’s financial results for the fiscal year
ending December 31, 2020 or later. However, at the moment, any disclosure is omitted since it cannot be estimated in a reasonable
manner.
ASICS ANNUAL REPORT 2019 47
The Board of Directors
ASICS Corporation
We have audited the accompanying consolidated financial statements of ASICS Corporation and its consolidated subsidiaries, which
comprise the consolidated balance sheet as at December 31, 2019, and the consolidated statements of operations, comprehensive
income, changes in net assets, and cash flows for the year then ended and a summary of significant accounting policies and other
explanatory information, all expressed in Japanese yen.
Management’s Responsibility for the Consolidated Financial Statements
Management is responsible for the preparation and fair presentation of these consolidated financial statements in accordance with
accounting principles generally accepted in Japan, and for designing and operating such internal control as management determines is
necessary to enable the preparation and fair presentation of the consolidated financial statements that are free from material
misstatement, whether due to fraud or error.
Auditor’s Responsibility
Our responsibility is to express an opinion on these consolidated financial statements based on our audit. We conducted our audit in
accordance with auditing standards generally accepted in Japan. Those standards require that we plan and perform the audit to obtain
reasonable assurance about whether the consolidated financial statements are free from material misstatement.
An audit involves performing procedures to obtain audit evidence about the amounts and disclosures in the consolidated financial
statements. The procedures selected depend on the auditor’s judgment, including the assessment of the risks of material misstatement
of the consolidated financial statements, whether due to fraud or error. The purpose of an audit of the consolidated financial statements
is not to express an opinion on the effectiveness of the entity’s internal control, but in making these risk assessments the auditor
considers internal controls relevant to the entity’s preparation and fair presentation of the consolidated financial statements in order to
design audit procedures that are appropriate in the circumstances. An audit also includes evaluating the appropriateness of accounting
policies used and the reasonableness of accounting estimates made by management, as well as evaluating the overall presentation of
the consolidated financial statements.
We believe that the audit evidence we have obtained is sufficient and appropriate to provide a basis for our audit opinion.
Opinion
In our opinion, the consolidated financial statements referred to above present fairly, in all material respects, the consolidated financial
position of ASICS Corporation and its consolidated subsidiaries as at December 31, 2019, and their consolidated financial performance
and cash flows for the year then ended in conformity with accounting principles generally accepted in Japan.
Convenience Translation
We have reviewed the translation of these consolidated financial statements into U.S. dollars, presented for the convenience of readers,
and, in our opinion, the accompanying consolidated financial statements have been properly translated on the basis described in Note 1.
March 27, 2020
Osaka, Japan
INDEPENDENT AUDITOR’S REPORT

Common Stock:
Authorized ........... 790,000,000 sharesIssued ................. 189,870,559 shares(including treasury stock of 7,179,322 shares)
Number of Shareholders:
35,746
Shareholder Information (As of December 31, 2019)
Principal Shareholders: (As of December 31, 2019)
NameShareholdings(Thousands)
Ownership*(%)
The Master Trust Bank of Japan, Ltd.(Trust Account)
11,719 6.41
MUFG Bank, Ltd. 7,858 4.30
Japan Trustee Services Bank, Ltd. (Trust Account)
7,024 3.85
Sumitomo Mitsui Banking Corporation 6,607 3.62
JP MORGAN CHASE BANK 385632 5,881 3.22
Nippon Life Insurance Company 5,679 3.11
STATE STREET BANK AND TRUST COMPANY 505001
3,471 1.90
Japan Trustee Services Bank, Ltd.(Trust Account 5)
3,347 1.83
UBS AG LONDON A/C IPB SEGREGATED CLIENT ACCOUNT
3,138 1.72
Mizuho Bank, Ltd. 2,784 1.52
Major Consolidated Subsidiaries (As of December 31, 2019)
• ASICS Japan Corporation• ASICS America Corporation• ASICS Europe B.V.• ASICS China Trading Co., Ltd.• ASICS Oceania PTY. LTD.• ASICS Asia PTE. LTD.
• ASICS BRASIL LTDA• ASICS Korea Corporation• HAGLÖFS AB• SANIN ASICS Industry Corporation• ASICS Apparel Industry Corporation
Chairman and CEO, Representative Director: Motoi Oyama
President and COO, Representative Director: Yasuhito Hirota
Outside Directors: Hitoshi Kashiwaki
Kazuo Sumi
Makiko Yamamoto
Director (Audit and Supervisory Committee Member):
Noriatsu Yoshimi
Outside Directors (Audit and Supervisory Committee Members):
Miwa Suto
Yasushi Yokoi
Managing Executive Officers: Hokuto Nakano
Tsuyoshi Nishiwaki
Naoki Matsushita
Shinji Senda
Ryoji Shoda
Mitsuyuki Tominaga
Executive Officers: Norio Takaoka
Manabu Kuramoto
Atsushi Takatsuki
Yoshiyuki Murakami
Kenichi Harano
Tomoko Koda
Takaaki Kondo
Gary Fukumoto
Yotaro Taguchi
Masaaki Koizumi
Koji Hayashi
Akihiko Sadaka
Tomoki Yanagisawa
Megumi Ohta
Junji Kobayashi
Koichiro Kodama
Unbehaun Carsten
Hilda Chan
Executives (As of April 1, 2020)
Breakdown of Shareholders: (As of December 31, 2019)
Individuals and Others13.6%
Non-Japanese Companies41.7%
Other Domestic Companies7.3%
Securities Companies1.4%
Financial Institutions36.0%
*Ownership ratios were calculated by deducting shares of treasury stock.
CORPORATE INFORMATION
Corporate Name: ASICS Corporation
Founded: September 1, 1949
Paid-in Capital: ¥23,972 million
Principal Business: Manufacture and sales of sports goodsHead Office: 1-1, Minatojima-Nakamachi 7-chome, Chuo-ku,
Kobe 650-8555, JapanTel: +81-78-303-2231
Institute: ASICS Institute of Sport Science2-1, Takatsukadai 6-chome, Nishi-ku, Kobe 651-2271, JapanTel: +81-78-992-0810
Number of Employees: 9,039 (consolidated basis)
Corporate Data (As of December 31, 2019)
ASICS ANNUAL REPORT 2019 48