weymouth and portland - dorset councils online ... approximately 200 people and are specifically...
TRANSCRIPT

WEYMOUTH AND PORTLAND
Dorset Deprivation IndicesCensus based measures of Deprivation
for Census output areas in Dorset
Produced by:
Dorset County CouncilResearch & Information Group
County HallDorchester
Dorset DT1 1XJ01305 224354February, 2005
The Research & Information Group welcome the reproduction of this original researchbut kindly request that the source is clearly referenced.

Contents
Introduction 1
Presentation of Results 2
Multiple Deprivation 3
Income Deprivation 4
Employment Deprivation 5
Education and Skills Deprivation 6
Health Deprivation 7
Key Map 8
Domains, Indicators and Data Sources 9
Methodology 10
Summary of Methodology 11
Exponential Transformation 12
WEYMOUTH AND PORTLAND CONTENTS
Dorset Deprivation Indices

Introduction
This report is one of a series of six, which present the results of the Dorset Deprivation Indices(DDI) for each of the district local authorities within the County. The Dorset Deprivation Indicesare constructed exclusively from information from the 2001 Census and cover the geographicarea for which Dorset County Council is responsible for the delivery of its services.
The recently published English Indices of Deprivation 2004 (ID2004) provides a nation-widepicture of deprivation, in all its various forms, across England. This picture has been built fromcontemporary data sources from central government departments and other publicorganisations, private organisations and the 2001 Census.
Part of the value of the Dorset Indices is that it places deprivation within a Dorset context, whichis of particular relevance to the County and district councils for the operational planning ofservice delivery.
While the national ranks for Dorset areas from the English indices can always be converted toCounty ranks to place the results in a local context, the most significant value of the DorsetDeprivation Indices is that they are based on a lower level of geography. The English Indicesare based on super output areas (SOAs), which contain, on average, approximately 1,500people. In contrast, the Census-based Dorset Indices are based on the geography of Censusoutput areas (OAs). These areas are much smaller in population terms and contain, onaverage, approximately 200 people and are specifically designed to be homogenous in terms oftheir socio-economic characteristics.
This is significant for two reasons. Firstly, average levels of deprivation for larger, moreheterogeneous, areas can mask areas of the most severe deprivation at a lower level ofgeography. This is borne out by the results of the Dorset Deprivation Indices, which reveal manymiddle-ranking super output areas that contain both OAs that rank among the most deprived inthe County, alongside OAs that rank among the least deprived in the County. Secondly, theextent of deprivation is likely to be higher in the most deprived OAs than the most deprivedSOAs because the former are more homogenous in terms of their socio-economiccharacteristics. The use of the finer geography as a basis for building deprivation indices can,therefore, yield a more detailed picture of deprivation.
The exclusive use of Census statistics can also provide a unique picture of deprivation that isdifferent from other indices. As such, they can provide a fresh, alternative perspective ondeprivation.
WEYMOUTH AND PORTLAND INTRODUCTION
Dorset Deprivation Indices Page 1

Presentation of Results
The Dorset Deprivation Indices consist of nine indices for each output area in the County.These are the seven domain indices: income; employment; education and skills; health;housing; indoors living environment and mobility. There are, also, two multiple deprivationindices. The first is an overall multiple deprivation index, which is a combination of all thedomains. The second is a composite index based on the combination of the four main domainsthat the DDI shares with the ID2004, income, employment, education and skills and health.
Each of the nine indices is assigned a County rank. There are 1384 output areas in Dorset. Themost deprived OA is assigned a rank of 1 and the least deprived is given a rank of 1384. Theranks provide an easy way of showing how an output area compares with all other output areasin the County in terms of deprivation. Effectively, they constitute a league table of deprivationfor output areas and, therefore, help to prioritise areas in terms of social need within the County.
The results presented here are for the overall multiple deprivation index covering all sevendomains and the four main domain indices: income; employment; education and skills andhealth. Each of the district reports follows the same format with a page of analysis for each ofthese indices. This includes a commentary to accompany the following...
District maps of OA level deprivation for each of the indices. All OAs inthe County have been divided into ten groups based on their Countyranks, each containing ten-percent of the total number of output areas(deciles) in the County. The areas shaded in dark blue are among theten-percent most deprived in the County while the areas shaded in brightyellow are the among the ten-percent least deprived in the County.
Graphs of the relative position of each district in terms of the extent ofdeprivation. There are two graphs. The first records the proportion ofthe district’s population that lives in the ten-percent most deprived OAsin the County. The second records the proportion of each district’spopulation living in the ten percent least deprived OAs in the County.
A graph showing the proportion of each super output area’s populationthat live in the ten-percent most deprived output areas in the County.
Website
Each of these district reports is available to download in pdf format from the County Council’swebsite at www.dorsetcc.gov.uk. The full set of SOA level indices and OA level indices from theDorset Deprivation Indices is available in Excel Spreadsheet on request. This file also includesthe SOA level ID2004 deprivation indices. There are also a set of MapInfo files containing theSOA and OA boundaries available on request. E:mail [email protected] to requestcopies of these files.
WEST DORSETWEYMOUTH AND PORTLAND
Dorset Deprivation Indices Page 2
PRESENTATION OF RESULTS

0
20
40
60
80
100
Little
moor W
est
Rodwell
and C
hape
lhay
Melcom
be R
egis
Carlton
Roa
d
Wes
tham N
orth W
estha
ven
Fortun
eswell
Nort
h
Melcom
be R
egis
Town C
entre
Melcom
be R
egis
Park D
istric
t
Wes
ton W
est
Fortun
eswell
Sou
th
Melcom
be R
egis
Lodm
oor H
ill
Wey
mouth
Wes
t Don
caste
r Rd
Wes
tham E
ast K
nights
dale
Road
Wes
tham E
ast A
bbots
bury
Road
Upwey
and B
roadw
ey E
ast
Wes
tham N
orth G
oldcro
ft Roa
d
Wey
mouth
West E
veres
t Roa
d
Wyk
e Reg
is Ferr
y Brid
ge
Little
moor E
ast
Wes
tham W
est L
aneh
ouse
MULTIPLE DEPRIVATION
WEYMOUTH AND PORTLAND
Dorset Deprivation Indices Page 3
2
kilometres
10
0 to 138 (52)138 to 276 (36)276 to 414 (26)414 to 552 (23)552 to 690 (19)690 to 828 (24)828 to 966 (10)966 to 1,104 (9)
1,104 to 1,242 (11)1,242 to 1,384 (10)
(C) Crown copyright. All rights reserved.Dorset County Council, LA076570. 2001
Dorset Deprivation IndicesCensus Output Areas
MULTIPLE DEPRIVATION
Most Deprived
Least Deprived
N
0
5
10
15
20
25
Weymou
th
Christc
hurch
Purbec
k
West D
orset
East D
orset
North D
orset
0
5
10
15
20
25
East D
orset
North D
orset
West D
orset
Weymou
th
Purbec
k
Christc
hurch
In population terms, 14,510 people live in theseoutput areas. This represents 22.8% of thedistrict’s population, the largest figure of all thedistricts by some margin. The population livingin the 10% most deprived output areas in theCounty is 37,360 or 9.6%: 38.8% of thesepeople live in Weymouth and Portland. In otherwords, roughly four out of ten people living in the10% most deprived output areas in the Countylive in Weymouth and Portland.
Weymouth and Portland district contains fifty-twoof the 10% most deprived output areas in theCounty. Weymouth and Portland has 220 outputareas in total so 23.6% of its output areas areamong the 10% most deprived in Dorset.
The OA focus of the DMDI reveals little deprivation that isn’talready known at SOA level. Forty-five of the 52 deprivedoutput areas in Weymouth and Portland are in SOAs thatappear in the 10% most deprived on the DMDI.
The most deprived output area in Weymouth andPortland is ranked 1st out of 1384 and is located inLittlemoor West SOA ranked 1st on the SOA level DMDI.
Melcombe Regis Town Centre is the only SOA in theCounty to appear in the ten-percent most deprivedSOAs in England as recorded by the English Indicesof Deprivation 2004. However, Melcombe RegisTown Centre ranks 4th out of 247 on the SOA levelDMDI, behind Rodwell and Chapelhay, FortuneswellNorth and Littlemoor West. It is likely that the crimeelement in the IMD2004 promotes Melcombe Regisin the English rankings.
% Population livingin the 10% mostdeprived OAs inDorset
% Population livingin the 10% leastdeprived OAs inDorset
MULTIPLE DEPRIVATIONWEYMOUTH AND PORTLANDP
erce
nt o
f pop
ulat
ion
livin
g in
the
10%
mos
t dep
rived
OA
s in
Dor
set
The population in Weymouthand Portland living in the 10%least deprived output areas inthe County is 2,820 or 4.4%.
© Crown Copyright. All rights reserved.Dorset County Council. LA100019790. 2004
Weymouth
Fortuneswelland Easton

0
20
40
60
80
100
Fortun
eswell
Nort
h
Melcom
be R
egis
Town C
entre
Little
moor W
est
Wes
tham N
orth W
estha
ven
Fortun
eswell
Sou
th
Melcom
be R
egis
Lodm
oor H
ill
Rodwell
and C
hape
lhay
Melcom
be R
egis
Park D
istric
t
Weston
Wes
t
Upwey
and B
roadw
ey E
ast
Wey
mouth
Wes
t Don
caste
r Rd
Westha
m Eas
t Knig
htsda
le Roa
d
Wyke S
quare
Westha
m Wes
t St A
ugus
tines
Westha
m Nort
h Gold
croft R
oad
Weymou
th W
est E
veres
t Roa
d
Wyk
e Reg
is Ferr
y Brid
ge
Rodwell
and t
he N
othe
Little
moor E
ast
Westha
m Wes
t Lan
ehou
se
INCOME DEPRIVATIONWEYMOUTH AND PORTLAND
2
kilometres
10
13274155698296
1,101,24
(C) Crown copy right. All rights reserv ed.Dorset County Council, LA076570. 2001
Dorset Deprivation IndicesCensus Output Areas
INCOME DOMAIN
Most Deprived
Least Deprived
N
0
5
10
15
20
25
East D
orset
Purbec
k
North D
orset
Wes
t Dors
et
Christc
hurch
Wey
mouth
0
5
10
15
20
25
Wey
mouth
Christc
hurch
Wes
t Dors
et
East D
orset
North D
orset
Purbec
kIn population terms, just over 10,950 people livein these output areas. This represents 17.2% ofthe district’s population, the largest figure of allthe districts. The population living in the 10%most income deprived output areas in theCounty is 36,070 or 9.2%. 30.3% of thesepeople live in Weymouth and Portland.
Weymouth and Portland district contains forty ofthe 10% most income deprived output areas inthe County. Weymouth and Portland district has220 output areas in total, so 18.2% of its outputareas are among the 10% most income deprivedin Dorset.
The most income deprived output area inWeymouth and Portland is ranked 1st out of1384 and is located in Westham NorthWesthaven SOA - ranked 5th on the SOA levelDDI. The most income deprived SOA in thedistrict - and the County - is Rodwell andChapelhay.
Income deprivation in Weymouth is principally foundin the town centre in Melcombe Regis, parts ofRodwell and Westham, and further to the northof the distrct in Littlemoor and Upwey.
On Portland, income deprivation is concentrated inFortuneswell North, Fortuneswell South and WestonWest SOAs. Fortuneswell North SOA has the highestpercentage of people living in the 10% most deprivedoutput areas in the County, out of all SOAs in Dorset.
% Population livingin the 10% mostdeprived OAs inDorset
% Population livingin the 10% leastdeprived OAs inDorset
INCOME DEPRIVATIONWEYMOUTH AND PORTLANDP
erce
nt o
f pop
ulat
ion
livin
g in
the
10%
mos
t dep
rived
OA
s in
Dor
set
The population in Weymouth and Portlandliving in the 10% least deprived
output areas in the County is 2,180 or just 3.4%, the lowest figure in Dorset.
© Crown Copyright. All rights reserved.Dorset County Council. LA100019790. 2004
Weymouth
Fortuneswelland Easton
Dorset Deprivation Indices Page 4

EMPLOYMENT DEPRIVATIONWEYMOUTH AND PORTLAND
Dorset Deprivation Indices Page 5
0
20
40
60
80
100
Little
moor W
est
Rodwell
and C
hape
lhay
Melcom
be R
egis
Park D
istric
t
Melcom
be R
egis
Town C
entre
Melcom
be R
egis
Carlton
Roa
d
Fortun
eswell
Nort
h
Wes
tham N
orth W
estha
ven
Fortun
eswell
Sou
th
Wes
tham E
ast K
nights
dale
Road
Melcom
be R
egis
Lodm
oor H
ill
Tophil
l Eas
t Grov
e Roa
d
Rodwell
and t
he N
othe
Wes
tham E
ast A
bbots
bury
Road
Wes
ton W
est
Wey
mouth
Wes
t Don
caste
r Rd
Southw
ell an
d Port
land B
ill
Wes
tham W
est L
aneh
ouse
Castle
town a
nd C
hiswell
Upwey
and B
roadw
ey W
est
Wey
mouth
Wes
t Eve
rest R
oad
Wey
Vall
ey an
d Nott
ington
Red
lands
Wyk
e Reg
is Ferr
y Brid
ge
Tophil
l Eas
t Eas
ton
Little
moor E
ast
Upwey
and B
roadw
ey Eas
t
2
kilometres
10
13274155698296
1,101,24
(C) Crown copy right. All rights reserv ed.Dorset County Council, LA076570. 2001
Dorset Deprivation IndicesCensus Output Areas
EMPLOYMENT DOMAIN
Most Deprived
Least Deprived
NIn population terms, just over 19,240 peoplelive in these output areas. This represents30.2% of the district’s population, almost threetimes the figure for the second most depriveddistrict by this measure. The population living inthe 10% most employment deprived output areas inthe County is 38,920 or 10%.%: half of these peoplelive in Weymouth and Portland (49.4%).
Weymouth and Portland district contains sixty-seven of the 10% most employment deprivedoutput areas in the County. Weymouth andPortland district has 220 output areas in total,so 30.5% of its output areas are among the10% most employment deprived in Dorset.
Employment deprivation in Weymouth is relatively widespreadbut is most acute in Littlemoor West and Rodwell & ChapelhaySOAs where 100% of their respective populations live in the 10%most deprived OAs in the County. Other main areas ofdeprivation are found in Weymouth Town Centre, in particularMelcombe Regis and Westham. On Portland, employmentdeprivation is concentrated in Fortuneswell North and WestonWest SOAs and parts of Southwell.
0
5
10
15
20
25
30
35
Weymou
th
Christc
hurch
West D
orset
North D
orset
Purbec
k
East D
orset
0
5
10
15
20
25
30
35
East D
orset
North D
orset
West D
orset
Purbec
k
Christc
hurch
Weymou
th
% Population livingin the 10% mostdeprived OAs inDorset
% Population livingin the 10% leastdeprived OAs inDorset
EMPLOYMENT DEPRIVATIONWEYMOUTH AND PORTLAND
Per
cent
of p
opul
atio
n liv
ing
in th
e10
% m
ost d
epriv
ed O
As
in D
orse
t
© Crown Copyright. All rights reserved.Dorset County Council. LA100019790. 2004
Themost
employment deprived output
area in Weymouth andPortland is ranked 1st outof 1384 and is located in
Melcombe Regis TownCentre SOA.
The mostemployment deprived SOA in the County is
Littlemoor West.
Weymouth
Fortuneswelland Easton

EDUCATION AND SKILLS DEPRIVATIONWEYMOUTH AND PORTLAND
Dorset Deprivation Indices Page 6
2
kilometres
10
13274155698296
1,101,24
(C) Crown copy right. All rights reserv ed.Dorset County Council, LA076570. 2001
Dorset Deprivation IndicesCensus Output Areas
EDUCATION DOMAIN
Most Deprived
Least Deprived
NIn population terms, 9,460 people live inthese output areas. This represents 14.9%of the district’s population. The populationliving in the 10% most education and skillsdeprived output areas in the County is 40,560or 10.4%. 23.3% of these people live in Weymouthand Portland.
Weymouth and Portland district contains twenty-eight of the 10% most education and skillsdeprived output areas in the County. Weymouthand Portland district has 220 output areas in total,so 12.7% of its output areas are among the 10%most education and skills deprived in Dorset.
Education and skills deprivation in Weymouth is mainlyconcentrated in the Westham North and Westham West SOAsand in Littlemoor West to the north of the district. Interestingly,none of the OAs in Melcombe Regis SOA appear among the tenpercent most deprived in the County; Melcombe Regis SOA itselfranks 81st on the SOA level DDI education and skills index. OnPortland, education and skills deprivation is concentrated inFortuneswell and Weston West.
% Population livingin the 10% mostdeprived OAs inDorset
% Population livingin the 10% leastdeprived OAs inDorset
EDUCATION AND SKILLS DEPRIVATIONWEYMOUTH AND PORTLAND
Per
cent
of p
opul
atio
n liv
ing
in th
e10
% m
ost d
epriv
ed O
As
in D
orse
t
© Crown Copyright. All rights reserved.Dorset County Council. LA100019790. 2004
The most
education and skills
deprived output area inWeymouth and Portland
is ranked 14th out of1384 and is located in
Westham NorthWesthaven SOA.
The most education andskills deprived SOA in thedistrict - ranked 4th on the
SOA level DDI education andskills index - is Fortuneswell
North. Fortuneswell North isalso identified as the most
deprived SOA in the districton the ID2004 education and
skills domain index and isalso ranked 4th in the County.
0
5
10
15
20
25
Wey
mouth
North D
orset
Purbec
k
Christc
hurch
Wes
t Dors
et
East D
orset
0
5
10
15
20
25
West D
orset
East D
orset
North D
orset
Christc
hurch
Weymou
th
Purbec
k
0
20
40
60
80
100
Wes
tham N
orth W
estha
ven
Little
moor W
est
Fortun
eswell
Nort
h
Fortun
eswell
Sou
th
Tophil
l Eas
t Grov
e Roa
d
Wes
tham W
est L
aneh
ouse
Wes
tham N
orth G
oldcro
ft Roa
d
Wes
ton W
est
Wes
tham W
est S
t Aug
ustin
es
Wyk
e Reg
is Ferr
y Brid
ge
Wey
mouth
West D
onca
ster R
d
Little
moor E
ast
Wes
ton Eas
t
Rodwell
and C
hape
lhay
Wes
tham E
ast K
nights
dale
Road
Wey
mouth
Wes
t Eve
rest R
oad
Weymouth
Fortuneswelland Easton
HEALTH DEPRIVATIONWEYMOUTH AND PORTLAND
Dorset Deprivation Indices Page 7
2
kilometres
10
13274155698296
1,101,24
(C) Crown copy right. All rights reserv ed.Dorset County Council, LA076570. 2001
Dorset Deprivation IndicesCensus Output Areas
HEALTH DOMAIN
Most Deprived
Least Deprived
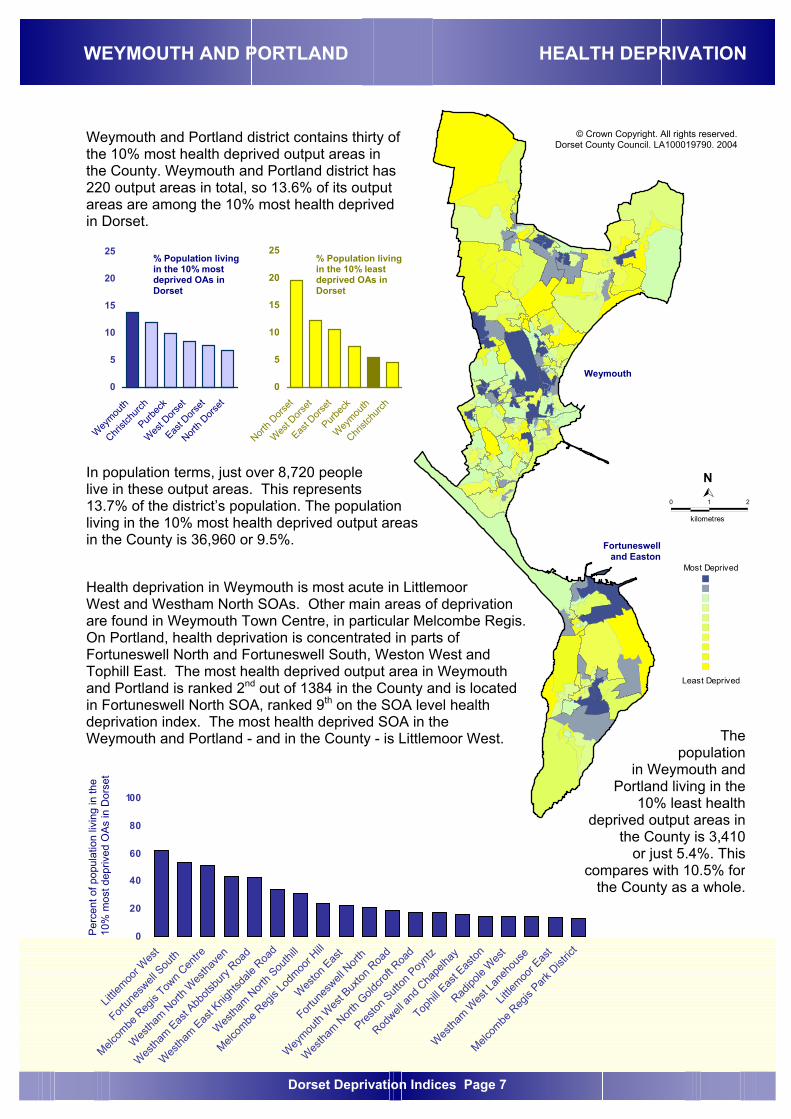
NIn population terms, just over 8,720 peoplelive in these output areas. This represents13.7% of the district’s population. The populationliving in the 10% most health deprived output areasin the County is 36,960 or 9.5%. 23.6% of these peoplelive in Weymouth and Portland.
Weymouth and Portland district contains thirty ofthe 10% most health deprived output areas inthe County. Weymouth and Portland district has220 output areas in total, so 13.6% of its outputareas are among the 10% most health deprivedin Dorset.
Health deprivation in Weymouth is most acute in LittlemoorWest and Westham North SOAs. Other main areas of deprivationare found in Weymouth Town Centre, in particular Melcombe Regis.On Portland, health deprivation is concentrated in parts ofFortuneswell North and Fortuneswell South, Weston West andTophill East. The most health deprived output area in Weymouthand Portland is ranked 2nd out of 1384 in the County and is locatedin Fortuneswell North SOA, ranked 9th on the SOA level healthdeprivation index. The most health deprived SOA in theWeymouth and Portland - and in the County - is Littlemoor West.
% Population livingin the 10% mostdeprived OAs inDorset
% Population livingin the 10% leastdeprived OAs inDorset
HEALTH DEPRIVATIONWEYMOUTH AND PORTLAND
Per
cent
of p
opul
atio
n liv
ing
in th
e10
% m
ost d
epriv
ed O
As
in D
orse
t
© Crown Copyright. All rights reserved.Dorset County Council. LA100019790. 2004
0
20
40
60
80
100
Little
moor W
est
Fortun
eswell
Sou
th
Melcom
be R
egis
Town C
entre
Wes
tham N
orth W
estha
ven
Wes
tham E
ast A
bbots
bury
Road
Wes
tham E
ast K
nights
dale
Road
Wes
tham N
orth S
outhi
ll
Melcom
be R
egis
Lodm
oor H
ill
Wes
ton E
ast
Fortun
eswell
Nort
h
Wey
mouth
Wes
t Bux
ton R
oad
Wes
tham N
orth G
oldcro
ft Roa
d
Preston
Sutt
on P
oyntz
Rodwell
and C
hape
lhay
Tophil
l Eas
t Eas
ton
Radipo
le Wes
t
Wes
tham W
est L
aneh
ouse
Little
moor E
ast
Melcom
be R
egis
Park D
istric
t
0
5
10
15
20
25
North D
orset
Wes
t Dors
et
East D
orset
Purbec
k
Wey
mouth
Christc
hurch
0
5
10
15
20
25
Wey
mouth
Christc
hurch
Purbec
k
Wes
t Dors
et
East D
orset
North D
orset
The population
in Weymouth andPortland living in the
10% least health deprived output areas in
the County is 3,410 or just 5.4%. This
compares with 10.5% forthe County as a whole.
Weymouth
Fortuneswelland Easton

2
3
1
6
14
3436
33
38
16
27
28
26
25
9
13
1829
12
104
520
17
7
8
11
15
19
21
22
24
30
31
32
35
37
39
KEY MAPWEYMOUTH AND PORTLAND
Dorset Deprivation Indices Page 8
KEY MAPWEYMOUTH AND PORTLAND
N
1 Castletown and Chiswell2 Fortuneswell North3 Fortuneswell South4 Littlemoor East5 Littlemoor West6 Melcombe Regis Carlton Road7 Melcombe Regis Lodmoor Hill8 Melcombe Regis Park District9 Melcombe Regis Town Centre
10 Preston11 Preston Overcoombe12 Preston Sutton Poyntz13 Radipole East14 Radipole West15 Rodwell and Chapelhay16 Rodwell and the Nothe17 Southwell and Portland Bill18 Tophill East Easton19 Tophill East Grove Road20 Upwey and Broadwey East
21 Upwey and Broadwey West22 Westham East Abbotsbury Road23 Westham East Knightsdale Road24 Westham North Goldcroft Road25 Westham North Southill26 Westham North Westhaven27 Westham West Lanehouse28 Westham West St Augustines29 Weston East30 Weston West31 Wey Valley & Radipole North Radipole
Village32 Wey Valley and Nottington Redlands33 Weymouth West Buxton Road34 Weymouth West Doncaster Rd35 Weymouth West Everest Road36 Wyke Regis All Saints37 Wyke Regis Castle Hill38 Wyke Regis Ferry Bridge39 Wyke Square
© Crown Copyright. All rights reserved.Dorset County Council. LA100019790. 2004
Weymouth
Fortuneswelland Easton
SUPER OUTPUT AREAS

DOMAINSub domain
INDICATOR DENOMINATORS CENSUSTABLE
Income Lone Pensioners Households All HH – HH with DCH KS02Lone Parent Households All HH with DCH KS02No adults working with dependent child All HH with DCH KS21
Employment Permanently Sick/Disabled KS09aLong term Unemployed KS09aNever Worked KS09aUnemployed KS09a
Sub-domains Inactive Econ Inactive Population KS09aActive Econ Active Population KS09a
Health People whose health was not good Total Population KS08People with limiting long-term illness Total Population KS08Permanently Sick/Disabled Total Population KS09aPeople providing unpaid care for morethan 50 hours a week
Total Population KS08
Education No Qualifications KS13and skills Level 1Qualifications KS13
Low Skilled Occupations KS12aRoutine Occupations KS14a
Sub-domains Low qualifications Population aged 16-74 KS13Low skill Population aged 16-74
in EmploymentKS12a
Housing Households in accommodationrented from the council KS18Households in accommodationrented from a housing association KS18Households inovercrowded accommodation KS19
Sub-domains Tenure All households KS18Overcrowding All households KS19
Indoors LivingEnvironment
Households where lowest level ofaccommodation is 1st floor and above
KS19
Households with central heatingand shared WC/bath
KS19
Households without centralheating and shared WC/bath
KS19
Sub-domains Floor Level All households KS19Amenities All households KS19
Mobility Households without a car All households KS17
DOMAINS, INDICATORS AND DATA SOURCES
Dorset Deprivation Indices Page 9

Methodology
The method for generating the indices draws on the methodology for producing the EnglishIndices devised by the Social Disadvantage Research Centre at the University of Oxford.
A total of twenty-one Census variables were selected as indicators of deprivation from the 2001Census. The indicators were assigned to domains similar to the ID2004. One simple method ofcombining the indicators into domain scores is simply summing the indicators and dividing by acommon denominator.
In this case, however, each indicator is treated as a separate, distinct strand of deprivationindependently of its extent or scale. This is because of the widely differing ranges of score forindicators combined with the fact that many of the Census variables were proxy indicators. Thechosen method of combination involved standardising the indicators to a common distribution, inthis case to a normal distribution, by assigning a rank based on the individual indicator scoresfor output areas.
The ranks are transformed to an exponential distribution to prevent cancellation betweenindicators within the same domain when they are combined to generate an overall domainscore. ‘Cancellation’ is where the absence of deprivation recorded by one indicator cancels thedeprivation recorded by another indicator within the same domain. This transformation isparticularly relevant at OA level since there may be instances where the more homogenouscharacter of output areas may make one indicator dominant to the extent that it is impossible toachieve a score for other indicators within the same domain. This transformation introduces acontrolled reduction of cancellation between indicators. The resulting scores occupy a commonrange from 0 to 100 for each indicator with 0 for the least deprived and 100 for the mostdeprived.
The standardised, exponentially transformed scores for output areas are combined into domainscores with weights derived from the correlation of indicator ranks with the relevant ID2004domain ranks at SOA level. This effectively weights indicators in terms of their relativeperformance at measuring deprivation within a domain using the ID2004 study as anestablished benchmark. The resulting scores are then assigned a rank to create the domainindices.
The individual steps to create the indices are summarised on the following page.
METHODOLOGY
Dorset Deprivation Indices Page 10

THE CONSTRUCTION OF CENSUS-BASED INDICES OF DEPRIVATION AND AN INDEXOF MULTIPLE DEPRIVATION FOR OUTPUT AREAS IN DORSET
Indicator Scores
1 Calculate indicator scores for OAs. These are the numbers for each Census variable,taken directly from the Census key statistics tables for output areas and expressed assimple rates by dividing by the relevant population.
Domain Indices
2 Calculate Census indicator scores, as above, only for SOAs, then assign ranks based ontheir scores. Correlate the Census-based indicator ranks for SOAs with thecorresponding SOA domain ranks from the ID2004 to derive weights for combining theCensus indicators into domain scores at OA level.
3 Take the OA indicator scores from step 1 and standardise them to a normal distribution byassigning ranks based on the scores.
4 Skew the distribution of OA indicator ranks from step 3, exponentially, to provide premiumscores at the most deprived tail of the distribution. These range from 0 for the leastdeprived to 100 for the most deprived.
5 Combine exponentially transformed OA indicator ranks from step 4 with weights derivedfrom step 2 to provide domain scores for OAs.
Multiple Deprivation Index
6 Derive weights for combination of domain scores from IMD2004 domain weights, adjustedwhere necessary to account for missing/ incomplete domains.
7 Standardise the OA domain scores from step 5 to a normal distribution by assigning arank.
8 Transform the OA ranks from step 6 to an exponential distribution.
9 Combine the exponentially transformed domain ranks from step 7 with weights from step 5to provide an overall multiple deprivation score for OAs.
The same procedure is followed for the calculation of SOA indices only starting at step 2,replacing SOAs for OAs in the subsequent steps. In step 3, the indicator scores are, of course,taken from step 2.
Dorset Deprivation Indices Page 11
SUMMARY OF METHODOLOGY

The transformation used is that drawn directly from the English Indices of Deprivation and isreproduced here in slightly modified form to reflect the level of geography. The ranks referredto are County ranks and the level of geography is the Census output area.
“For any…[Census output area]…, denote its rank on the Domain, scaledto the range [0,1] by R…
[where R=1-(RANK/N) with a RANK of 1 for the most deprived and aRANK of 1384 for the least deprived and where N is the number of OAs inthe County. If we were to name the transformed Domain, X, then]…
X = -23*log{1-R*[1-exp(-100/23)]}
where log denotes natural logarithm and exp the exponential or antilogtransformation.”
(English Indices of Deprivation 2004, Annex I, p150, Crown Copyright)
The transformations were carried out using Microsoft Excel Worksheet functions EXP andLOG. The syntax of the LOG function in Excel is in the following format.
LOG(number,base)
Where number is the positive real number for which you want the logarithm and base is thebase of the logarithm. The natural logarithm is the logarithm to the base e where e isapproximately 2.7182818.
The rationale for this transformation is to prevent the cancellation of recorded deprivation onone domain/indicator caused by an absence of deprivation on another domain/indicator. Thetransformation achieves this effect in the following way…
“Each transformed domain …[or indicator]… has a range of O to 100, witha score of 100 for the most deprived…[OA]…. The constant (23)determines that approximately ten percent of…[OAs]… have a scorehigher than 50. When transformed scores from different domains… [orindicators]…are combined by averaging them, the skewness of thedistribution reduces the extent to which deprivation on one domain…[orindicator]… is cancelled by a lack of deprivation on another. For example,if the transformed scores on two domains are simply averaged, with equalweights, a (hypothetical)…[output area]… that scored 100 on one domainand 0 on the other would have a combined score of 50 and would thus beranked at the 90th percentile. (Averaging the untransformed ranks, or aftertransformation to a normal distribution, would result in such … [an outputarea]… being ranked instead at the 50th percentile: the high deprivation inone domain would have been fully cancelled by the low deprivation in theother.”
(English Indices of Deprivation 2004, p44, Crown Copyright)
The exponential transformation of the ranks, thereby, introduces a controlled reduction of thecancellation of deprivation between domains or indicators.
EXPONENTIAL TRANSFORMATION
Dorset Deprivation Indices Page 12