western cape tourism barometer · western cape tourism barometer volume 2. issue 1. march 2008. ......
TRANSCRIPT

Cape Town & Western Cape www.tourismcapetown.co.za
GLOBAL TRENDS Global international tourism arrivals
reached 898 million in 2007
representing 6% year-on-year growth.
All the different regions achieved
annual growth well above their long-
term forecast. The Middle East with
13% year-on-year growth led the
regional growth ranking, followed by
Asia and the Pacific (10%), Africa
(8%), Americas (5%) and Europe with
4%.
The Middle East received a total of 46
million international tourist arrivals
despite continuous tensions and
threats. According to UNWTO (2008)
the Middle East region is emerging as
a strong tourism destination with visitor
numbers increasing faster than for the
world total. Saudi Arabia and Egypt are
the leading Middle East destinations.
Asia and the Pacific had 185 million
international arrivals with some
countries such as Malaysia (20%),
Cambodia (19%) and Indonesia (15%)
attaining double digit growth.
WESTERN CAPE TOURISM BAROMETER
Volume 2. Issue 1. March 2008.
The Provincial Tourism Intelligence Source
IN THIS ISSUE
Global Trends 1 National Trends 3
• International Arrivals 3
• International arrivals by region of origin 4
• Top overseas source markets for South Africa 4 Provincial Trends 5
• Performance Indicators 6
• ACSA arrivals: International, regional & domestic 6
• Attractions visitations data 8 o Kirstenbosch Botanical Gardens 8 o Worcester Living Open-Air Museum at Kleinplasie 9
o Table Mountain Aerial Cableway 9 o TMNP: Boulders 10 o TMNP: Cape of Good Hope 11
o West Coast National Park 11 o Robben Island 13
o V&A Waterfront 14 o Cango Caves 14
Regional visitor trends 16
• Cape Town visitor patterns & lodging statistics 20
• Cape Overberg visitor patterns 30
• Cape Garden Route visitor patterns 35
• Cape Karoo visitor patterns 40
• Cape Winelands visitor patterns 41 Special in this issue: Cape Town & Western Cape Brand
Awareness study findings 46

2
Cape Town & Western Cape www.tourismcapetown.co.za
Western Cape Tourism Barometer Volume 2. Issue 1. March 2008
Africa received 44 million international
arrivals in 2007 and achieved an average
annual growth rate of 7% since 2000. In
2007 international arrivals to North Africa
grew by 8% and to Sub-Saharan Africa by
7%. Awareness of Southern African
countries has grown especially for South
Africa in the build up to the 2010 FIFA World
Cup. The Americas achieved 5% annual
growth to 142 million international arrivals in
2007 driven by good performance of North
America (UNWTO,2008).
Europe, the world’s largest destination
region accounting for over 50% of global
international arrivals had a total of 480
million international arrivals in 2007,
representing 4% year-on-year growth.

3
Cape Town & Western Cape www.tourismcapetown.co.za
Western Cape Tourism Barometer Volume 2. Issue 1. March 2008
NATIONAL TOURISM PERFORMANCE
South Africa received 9.07 million
international arrivals in 2007 representing
about 8% year-on-year growth. There were
2.45 million international arrivals in Q4 2007
from 2.2 million in Q4 2006. Monthly arrivals
data shows that there was 4.9% year-on-
year growth in October and 6.65% in
November (Figure 1).
Figure 1: Q4 2005-2007 International arrivals to South Africa
0
500,000
1,000,000
1,500,000
2,000,000
num
ber
of a
rriv
als
0.001.002.003.004.005.006.007.00
06/07 % change
2005 674,458 671,970 1,346,428
2006 755,953 747,050 1,503,003
2007 792,913 796,741 1,589,654
06/07 % change 4.89 6.65 5.76
October November Total

4
Cape Town & Western Cape www.tourismcapetown.co.za
Western Cape Tourism Barometer Volume 2. Issue 1. March 2008
Figure 2: Q4 2005-2007 International arrivals to South Africa by origin region (excluding December)
0
500,000
1,000,000
1,500,000
2,000,000
Inte
rnat
iona
l arr
ival
s
0.002.004.006.008.0010.0012.0014.0016.00 06/07 %
change
Q4 2005 288,052 51,476 49,685 950,577 1,346,428
Q4 2006 305,853 58,916 57,588 1,074,234 1,503,003
Q4 2007 310,370 66,998 62,395 1,140,842 1,589,654
Q4 06/07 % change 1.48 13.72 8.35 6.20 5.77
Europe Americas Asia & Australasia
Africa & M. East Total
There were 1.59 million international arrivals
to South Africa in October and November
2007, representing 5.77% growth from the
same period in 2006. There was growth from
all regions, and the highest year-on-year
growth of 13.72% was from the Americas
(Figure 2). The United Kingdom was the top
overseas source market for South Africa
during this period with 95,184 arrivals.
Germany with 64,203 arrivals followed in
second place and the United States was
third (refer to Figure 3).
Figure 3: Q4 2007 Top five overseas source markets for South Africa (excluding December)
0
20,000
40,000
60,000
80,000
100,000
Num
ber o
f arr
ival
s
UK 46,190 48,994 95,184
Germany 29,809 34,394 64,203
USA 24,452 21,355 45,807
Netherlands 18,250 14,968 33,218
France 11,567 13,364 24,931
October November Total

5
Cape Town & Western Cape www.tourismcapetown.co.za
Western Cape Tourism Barometer Volume 2. Issue 1. March 2008
PROVINCIAL TRENDS
The Western Cape achieved 5.75% growth
in international arrivals in Q3 2007 from
374,637 in 2006 to 396,194 in 2007. There
were 1.23 million international arrivals to the
Western Cape between January and
September 2007 representing 1.64%
increase from the same period in 2006.
While full figures are still to come, modest
growth in international arrivals is anticipated
for 2007. Q4 2007 short term lodging
statistics for the province show growth in
occupancy rates, average room rates and
Revenue Per Available Room (RevPAR)
(refer to Table 1).
Table 1: Lodging statistics for the Western Cape Province
% Occupancy Average room rate (R ) RevPAR (R ) Month/Item
2007 2006 %change 2007 2006 %change 2007 2006 %change
October 66.9 66.5 0.7 735.35 659.77 11.5 492.24 438.70 12.2 November 87 84.2 3.3 874.33 785.86 11.3 760.49 661.5 14.9 December 72 72.1 0.2 909.63 904.84 0.5 655.09 652.67 0.4 Q4 2007 75.3 74.3 1.4 839.77 783.49 7.2 635.94 584.29 8.8
(Source: Deloitte HotelBenchmark, 2008)

6
Cape Town & Western Cape www.tourismcapetown.co.za
Western Cape Tourism Barometer Volume 2. Issue 1. March 2008
INDICATORS
ACSA Cape Town International Airport Arrivals
Figure 4: Q4 2005-2007 International arrivals through Cape Town International Airport
0
50,000
100,000
150,000
200,000
250,000
Inte
rnat
iona
l arr
ival
s
012345678
06/07 % grow
th
2005 53,031 61,745 67,404 182,180
2006 48,729 69,035 76,022 193,786
2007 52,202 72,060 77,712 201,974
06/07 % growth 7.13 4.38 2.22 4.23
October November December Total
(Source: ACSA, 2007)
There were a total of 201,974 international
arrivals through Cape Town International
Airport in Q4 2007, representing 4.23%
growth from 193,786 international arrivals in
Q4 2006. All three Q4 months showed
growth from the previous year.

7
Cape Town & Western Cape www.tourismcapetown.co.za
Western Cape Tourism Barometer Volume 2. Issue 1. March 2008
Figure 5: Q4 2005-2007 Regional arrivals through Cape Town International Airport (ACSA,2008)
0
5,000
10,000
15,000
20,000
25,000
Reg
iona
l arr
ival
s
-7-6-5-4-3-2-10
06/07 % grow
th
2005 7,094 6,337 6,773 20,204
2006 7,271 6,608 6,599 20,478
2007 7,017 6,518 6,165 19,700
06/07 % growth -3.49 -1.36 -6.58 -3.80
October November December Total
There was 3.80% year-on-year decrease in
regional arrivals through Cape Town
International Airport in Q4 2007. The highest
decrease of 6.58% was recorded in
December. Q4 2007 achieved 10.7%
increase in domestic arrivals from Q4 of the
previous year. Q4 2007 Domestic arrivals
through Cape Town International Airport
reached 915,452. All Q4 months recorded
growth with October registering the highest
(16.35%) year-on-year growth among the
three Q4 months (Figure 6).
Figure 6: Q4 2005-2007 Domestic arrivals through Cape Town International Airport (ACSA,2008)
0
200,000
400,000
600,000
800,000
1,000,000
Dom
estic
arr
ival
s
024681012141618
06/07 % grow
th
2005 240,277 234,079 264,222 738,578
2006 263,858 260,835 302,218 826,911
2007 306,992 298,558 309,902 915,452
06/07 % growth 16.35 14.46 2.54 10.7
October November December Total

8
Cape Town & Western Cape www.tourismcapetown.co.za
Western Cape Tourism Barometer Volume 2. Issue 1. March 2008
ATTRACTIONS Kirstenbosch Botanical Gardens Kirstenbosch Botanical Gardens
experienced a 3% decrease in visitation in
Q4 2007 from the same period in 2006.
Decrease was recorded in all the three Q4
months with October having the highest
decrease of 3.68%.
Figure 7: Q4 2007 visitation to Kirstenbosch Botanical Garden
(Source: Kirstenbosch Botanical Garden, 2007)
0 50,000
100,000 150,000 200,000 250,000
Num
ber o
f vis
itors
-4.00 -3.50 -3.00 -2.50 -2.00 -1.50 -1.00 -0.50 0.00 06/07 %
Change
2004 65,949 68,582 66,849 201,380 2005 71,978 68,669 72,741 213,388 2006 66,465 68,060 74,166 208,691 2007 64,016 66,224 72,172 202,412 06/07 %Change -3.68 -2.70 -2.69 -3.01
October November December Q4 Total

9
Cape Town & Western Cape www.tourismcapetown.co.za
Western Cape Tourism Barometer Volume 2. Issue 1. March 2008
Worcester Living Open-Air Museum at Kleinplasie Figure 8: Q3 2007 Worcester Living Open-Air Museum at Kleinplasie
0
2000
4000
6000
8000
10000
Num
ber
of v
isito
rs
0
5
10
15
20
25
30
06/07 % grow
th
2006 2201 2300 3502 8003
2007 2605 2854 3546 9005
06/07 % growth 18.36 24.09 1.26 12.52
October November December Total
(Source: Worcester Living Open-Air Museum, 2007)
The Worcester Living Open-Air Museum at
Kleinplasie received 9005 visitors in Q4
2007 12.52% more than Q4 the previous
year. All the months recorded positive year-
on-year growth: 18.36% in October; 24.09%
in November and 1.26% in December.
Table Mountain Aerial Cableway Visitation to Table Mountain through the
aerial cableway declined by 4.57% in Q4
2007 compared to the same period in 2006.
October and November both recorded a
decrease of 4.12% and 15.88% respectively
(Figure 9). December, with 3.90% growth,
was the only Q4 month with positive growth
in 2007.

10
Cape Town & Western Cape www.tourismcapetown.co.za
Western Cape Tourism Barometer Volume 2. Issue 1. March 2008
Figure 9: Q4 2006/2007 visitation to Table Mountain through Aerial Cableway
-4.12%
-15.88%
3.90%
-4.57%
0
50000
100000
150000
200000
250000
300000
October November December Total-20.00%
-15.00%
-10.00%
-5.00%
0.00%
5.00%
2006
2007
06/07 %growth
(Source: Table Mountain Cableway, 2007)
Table Mountain National Park: Boulders Table Mountain National Park: Boulders
received a total of 217,028 visitors in Q4
2007 representing 6.12% growth from Q4
2006. December recorded double digit
growth of 26% masking the negative year-
on-year growth of 1.4% and 6.6% recorded
in the other two Q4 months of October and
November respectively.
Figure 10: Q4 2004- 2007 visitation to Table Mountain National Park: Boulders
0
50,000
100,000
150,000
200,000
250,000
num
ber of
vis
itors
-10.00-5.000.005.0010.0015.0020.0025.0030.00
06/07 % grow
th
2004 57,428 64,977 63,532 185,937
2005 61,665 65,904 65,394 192,963
2006 63,872 71,311 69,320 204,503
2007 62,965 66,592 87,471 217,028
06/07 % growth -1.42 -6.62 26.18 6.12
October November December Total
(Source: Table Mountain National Park, 2007)
11
Cape Town & Western Cape www.tourismcapetown.co.za
Western Cape Tourism Barometer Volume 2. Issue 1. March 2008
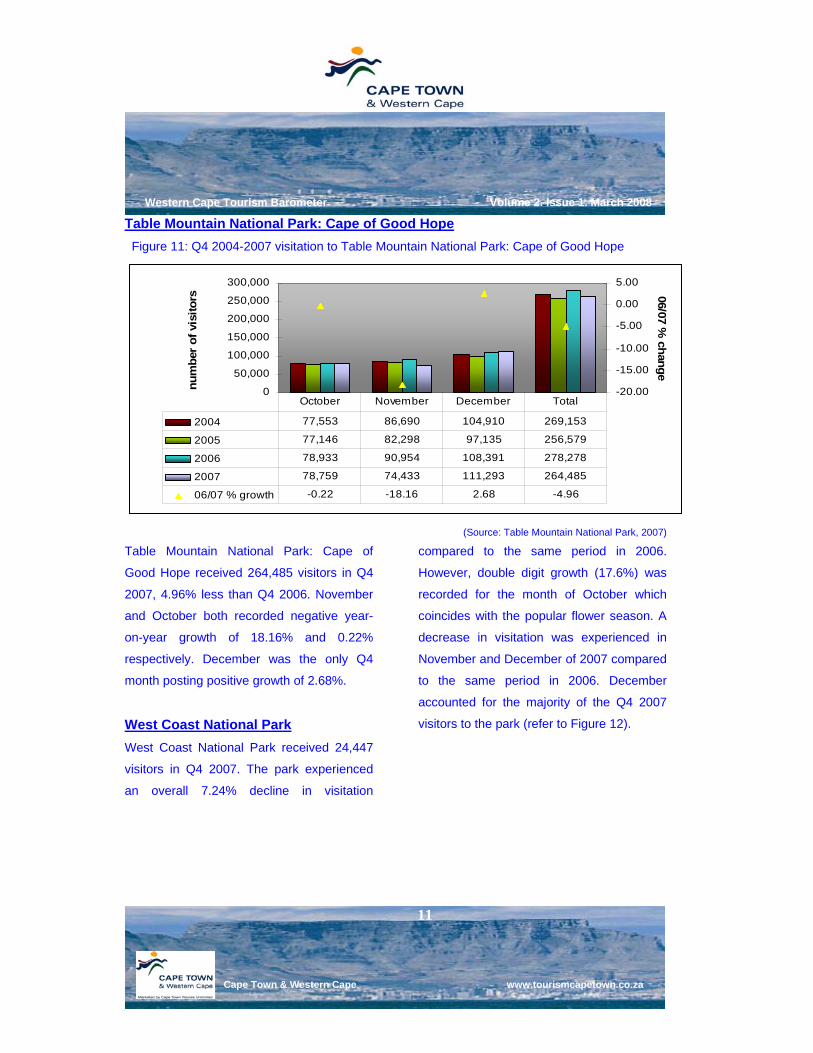
Table Mountain National Park: Cape of Good Hope Figure 11: Q4 2004-2007 visitation to Table Mountain National Park: Cape of Good Hope
0
50,000
100,000
150,000
200,000
250,000
300,000
num
ber o
f vis
itors
-20.00
-15.00
-10.00
-5.00
0.00
5.00
06/07 % change
2004 77,553 86,690 104,910 269,153
2005 77,146 82,298 97,135 256,579
2006 78,933 90,954 108,391 278,278
2007 78,759 74,433 111,293 264,485
06/07 % growth -0.22 -18.16 2.68 -4.96
October November December Total
(Source: Table Mountain National Park, 2007)
Table Mountain National Park: Cape of
Good Hope received 264,485 visitors in Q4
2007, 4.96% less than Q4 2006. November
and October both recorded negative year-
on-year growth of 18.16% and 0.22%
respectively. December was the only Q4
month posting positive growth of 2.68%.
West Coast National Park West Coast National Park received 24,447
visitors in Q4 2007. The park experienced
an overall 7.24% decline in visitation
compared to the same period in 2006.
However, double digit growth (17.6%) was
recorded for the month of October which
coincides with the popular flower season. A
decrease in visitation was experienced in
November and December of 2007 compared
to the same period in 2006. December
accounted for the majority of the Q4 2007
visitors to the park (refer to Figure 12).

12
Cape Town & Western Cape www.tourismcapetown.co.za
Western Cape Tourism Barometer Volume 2. Issue 1. March 2008
Figure 12: Visitation to West Coast National Park (Source: West Coast National Park, 2008)
0
5000
10000
15000
20000
25000
30000
num
ber o
f vis
itors
-20-15-10-505101520
06/0
7%C
hang
e
2006 4842 6551 14963 26356
2007 5693 5492 13262 24447
06/07%Change 17.6 -16.2 -11.4 -7.24
October November December Total
Table 2: Q4 2007 West Coast National Park visitation statistics
Visitor Information October November December Totals
Overnight Guests 2006 803 858 928 2,589
Overnight Guests 2007 1,216 1,022 452 2,690
06/07%Change 51.43 19.11 -51.29 3.9
Day Guests 2006 2,813 3,837 12,698 19,348
Day Guests 2007 3,148 2,785 11,718 17,651
06/07%Change 11.91 -27.42 -7.72 -8.77 International Guests 2006 1,226 1,856 1,337 4,419
International Guests 2007 1,329 1,685 1,092 4,106
06/07%Change 8.4 -9.21 -18.32 -7.08 Domestic Guests 2006 3,616 4,695 13,626 21,937
Domestic Guests 2007 4,364 3,807 12,170 20,341 06/07%Change 20.69 -18.91 -10.69 -7.28
(Source: West Coast National Park, 2008)

13
Cape Town & Western Cape www.tourismcapetown.co.za
Western Cape Tourism Barometer Volume 2. Issue 1. March 2008
Table 2 above provides a breakdown of the
number of visitors to West Coast National
Park during Q4 2007. Overnight guests
increased for the months of October
(51.43%) and November (19.11%), while a
decline (-51.29%) was experienced in
December. There was an overall 3.9% year-
on-year increase in overnight visits in Q4
2007.
An increase in day visits was recorded in
October. November with -27.42% and
December (-7.72%) both recorded a
decrease in day visits. Overall, the park
experienced 8.77% decrease in day visits.
However, an increase in international visitors
was recorded in October (8.4%), but the
other two Q4 months recorded a decrease in
international visitors (refer to Table 2). Robben Island Robben Island experienced a remarkable
double digit year-on-year growth of 42.57%
in Q4 2007. The highest growth of over 50%
was recorded in December (Figure 13)
Figure 13: Q4 2006-2007 visitation to Robben Island
0
20,000
40,000
60,000
80,000
100,000
120,000
num
ber
of v
isito
rs
0
10
20
30
40
50
60
06/07 % grow
th
2006 22,354 22,782 22,980 68,116
2007 32,574 28,498 36,042 97,114
06/07 % growth 45.72 25.09 56.84 42.57
October November December Total
(Source: Robben Island, 2007)

14
Cape Town & Western Cape www.tourismcapetown.co.za
Western Cape Tourism Barometer Volume 2. Issue 1. March 2008
V& A Waterfront Figure 14: Q4 2007 V&A Waterfront
Q4 06/07 Visitation to V & A Waterfront
0
1,000,000
2,000,000
3,000,000
4,000,000
5,000,000
6,000,000
7,000,000
Num
ber o
f Vis
itors
-3.00
-2.00
-1.00
0.00
1.00
2.00
3.00
4.00
06/0
7 %
Cha
nge
2006 1,747,012 1,865,378 2,321,142 5,933,532
2007 1,769,739 1,924,345 2,270,199 5,964,283
06/07 %Change 1.30 3.16 -2.19 0.52
October November December Q4 Total
(Source: V&A Waterfront, 2007)
In Q4 2007 the V&A Waterfront experienced
a slight increase of 0.52% from Q4 2006.
December was the only Q4 month that
experienced a decline of 2.19%.
Visitation to Cango Caves Figure 15: Q4 2004-2007 Visitation to Cango Caves
0
20,000
40,000
60,000
80,000
100,000
Num
ber o
f vis
itors
-8.00-6.00
-4.00-2.00
0.002.00
4.00
06/0
7% C
hang
e
2004 21,982 22,670 32,730 77,382
2005 19,482 23,643 32,857 75,982
2006 20,391 24,041 33,266 77,698
2007 20,800 22,321 32,957 76,078
06/07 %Change 2.01 -7.15 -0.93 -2.08
October November December Total
(Source: Cango Caves, 2008)

15
Cape Town & Western Cape www.tourismcapetown.co.za
Western Cape Tourism Barometer Volume 2. Issue 1. March 2008
In Q4 2007 Cango Caves experienced a
slight (2.08%) decrease in visitation from the
same period in 2006. October was the only
Q4 2007 month that experienced year-on-
year growth.
Figure 16 below illustrates visitation to
Cango Caves by foreign nationals.
November was the only Q4 month with
negative year-on-year change in visitation.
December recorded the highest growth of
5.11%. There, however, was overall
negative year-on-year change (-2.13%) in
number of foreign visitors due to poor
performance in October and November.
Figure 16: Q4 2004-2007 visitation to Cango Caves
0
10,000
20,000
30,000
40,000
50,000
Num
ber o
f for
eign
vis
itors
-10.00-8.00-6.00-4.00-2.000.002.004.006.00
06/0
7 %
Cha
nge
2004 15,604 18,118 9,383 43,105
2005 13,233 18,481 9,081 40,795
2006 13,862 18,271 8,994 41,127
2007 13,906 16,891 9,454 40,251
06/07 %Change 0.32 -7.55 5.11 -2.13
October November December Total
(Source: Cango Caves, 2008)
16
Cape Town & Western Cape www.tourismcapetown.co.za
Western Cape Tourism Barometer Volume 2. Issue 1. March 2008
Q4 2007 CAPE TOWN & WESTERN CAPE VISITOR TRENDS
This section covers an analysis of Western
Cape travel and tourism trends by region.
This issue includes all Western Cape
regions, but the West Coast. The first
section discusses overall trends in the
Western Cape and the second section
covers trends by individual regions.
There were a total of 3,064 responses from
the Western Cape in Q4 2007 from the
following regions: Cape Winelands, Cape
Karoo, Cape Garden Route & Klein Karoo,
Cape Overberg, and Cape Town.
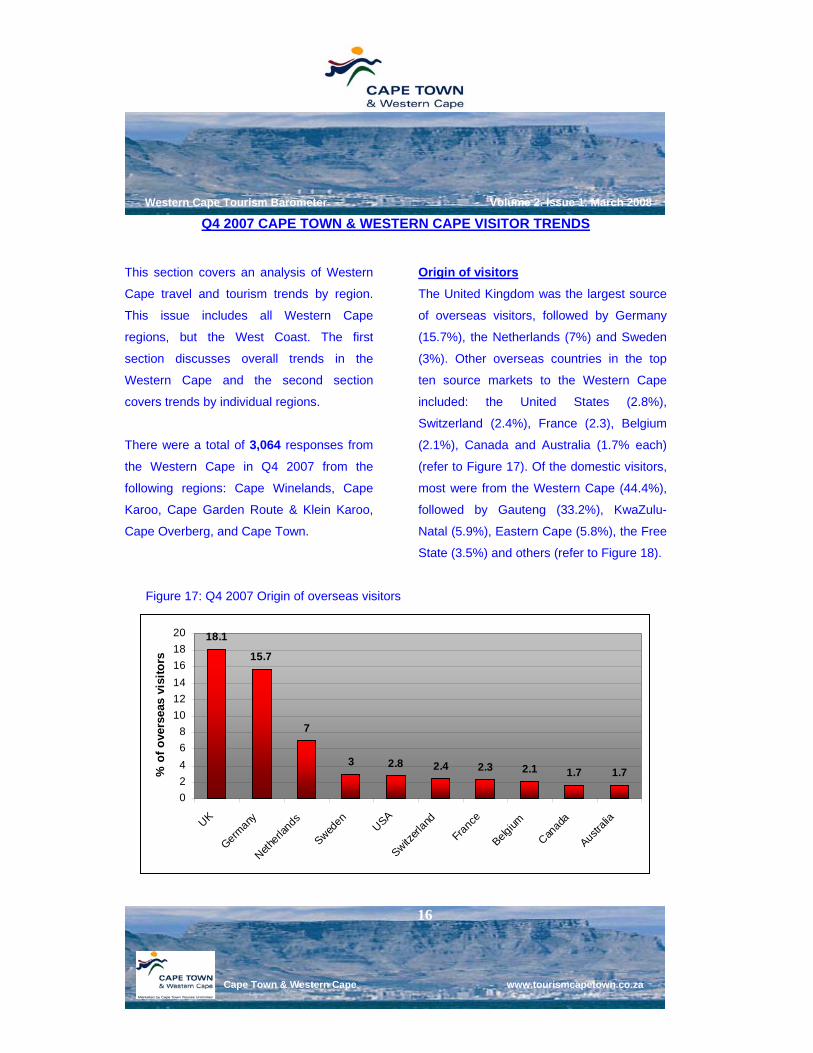
Origin of visitors The United Kingdom was the largest source
of overseas visitors, followed by Germany
(15.7%), the Netherlands (7%) and Sweden
(3%). Other overseas countries in the top
ten source markets to the Western Cape
included: the United States (2.8%),
Switzerland (2.4%), France (2.3), Belgium
(2.1%), Canada and Australia (1.7% each)
(refer to Figure 17). Of the domestic visitors,
most were from the Western Cape (44.4%),
followed by Gauteng (33.2%), KwaZulu-
Natal (5.9%), Eastern Cape (5.8%), the Free
State (3.5%) and others (refer to Figure 18).
Figure 17: Q4 2007 Origin of overseas visitors
18.1
15.7
7
3 2.8 2.4 2.3 2.1 1.7 1.7
02468
101214161820
UK
Germany
Netherla
nds
Sweden
USA
Switzerl
and
Franc
e
Belgium
Canad
a
Austra
lia
% o
f ove
rsea
s vi
sito
rs

17
Cape Town & Western Cape www.tourismcapetown.co.za
Western Cape Tourism Barometer Volume 2. Issue 1. March 2008
Figure 18: Q4 2007 Domestic visitors’ province of origin
33.2
44.4
5.8 5.92.4 0.7
3.5 1.9 2.105
101520253035404550
Gauten
g
Wester
n Cap
e
Easter
n Cap
eKZN
Mpumala
nga
Limpo
po
Free S
tate
Northe
rn Cap
e
North W
est
% d
omes
tic v
isito
rs
Travel group size and length of stay Figure 19 illustrates travel group sizes of
visitors to the Western Cape in Q4 2007.
60.3% travelled in pairs, 10.6% threes. The
average travel group size was three and the
most common was two. 35.1% of the visitors
stayed for one night in the Western Cape
towns, 9.2% for two nights and 11.1% for
three nights (Figure 20). The overall average
length of stay was five nights.
Figure 19: Q4 2007 Travel group size
alone, 8.7%
twos, 60.3%
threes, 10.6%
fours, 12.1%
fives, 3.3%
six+, 4.7%

18
Cape Town & Western Cape www.tourismcapetown.co.za
Western Cape Tourism Barometer Volume 2. Issue 1. March 2008
Figure 20: Q4 2007 Length of stay
4 nights: 7.1% 3 nights:
11.1%2 nights: 19.2%
1 night: 35.1%
5 nights:4.9%
6 nights: 3.1%
7 nights: 6.1% 8+ nights: 13.0%
Even though the most common length of
stay in towns was one, the trend varied
tremendously between different regions and
also by origin region of visitors. Table 3
illustrates the average length of stay in
different Western Cape regions by origin of
visitor. The length of stay in each region
also varied by town and this is discussed
under each regional section.
Table 3: Average length of stay in the regions by origin of visitor
Average length of stay (nights) Region
Overseas Africa(excluding domestic) Domestic All
Cape Town (n=1011) 6.9 5.7 3.2 6.3
Cape Garden Route (n=381) 1.9 - 3.4 2.5
Cape Winelands (n=679) 3.6 - 2.9 3.3
Cape Overberg (n=236) 2 - 2.9 2.3 Blank spaces indicate inadequate responses from that group to make conclusions

19
Cape Town & Western Cape www.tourismcapetown.co.za
Western Cape Tourism Barometer Volume 2. Issue 1. March 2008
Main purpose of visit and mode of transport Most (94%) of visitors to the Western Cape
indicated that their main purpose for visiting
was holiday, followed by business (3.6%),
honeymoon (0.9%), visiting friends and
relatives (0.7%) and others. Most visitors
(84.3%) made use of cars as their mode of
transport, followed by public transport with
6.1%.
Figure 21: Q4 2007 Mode of transport
84.3
1.3 0.1 1.7 0.5 2.3 0.3 1.2 2.3 6.1
0102030405060708090
Car Air
Rail Bus
4x4 T
ruck
Taxi
Foot
Bike
Shutt
le se
rvice
Publi
c Tra
nspo
rt
% m
ode
of tr
ansp
ort

20
Cape Town & Western Cape www.tourismcapetown.co.za
Q4 2007 CAPE TOWN REGIONAL TRENDS
There were a total of 1171 responses
obtained from the Cape Town Region in Q4
2007 from the following visitor information
centres (VIC’s): Cape Town Burg Street,
Waterfront Gateway, Somerset West,
Muizenberg/Simonstown, Cape Town
International Airport (CTIA) international and
domestic terminals, Blaauwberg,
Willowbridge, Kirstenbosch, Hout Bay,
Tygervalley and Table Mountain.
Origin of visitors The majority (82.9%) of visitors were from
overseas, followed by domestic (14.7%) and
Africa (excluding domestic) (2.4%) (refer to
Figure 22). UK was the largest (25.4%)
source market, followed by Germany
(16.2%), and South Africa accounting for
14.6%. Other top source countries included
the Netherlands (5.5%), Sweden (5.2%) and
USA with 3.8%. Of the domestic visitors,
most were from Guateng (50%). The
Western Cape followed with 16.7%, a further
15.2% were from KwaZulu-Natal, 8% from
Eastern Cape and others (refer to Figure
23).
Figure 22: Origin region of visitors
14.7%2.4%
82.9%
Overseas Domestic Africa (excluding domestic)

21
Cape Town & Western Cape www.tourismcapetown.co.za
Figure 23: Q4 2007 Domestic visitors’ province of origin
50%
16.7% 15.2%
8% 2.9% 2.9% 2.2% 2.2%
0%
10%
20%
30%
40%
50%
60%
Gauten
g
Western
Cape
Kwazulu
Nata
l
Easter
n Cap
e
Mpumala
nga
Free State
Northern
Cape
North W
est
% o
f dom
estic
vis
itors
Travel Group size and length of stay The average as well as the most common
travel group size for Cape Town was two.
59.6% travelled in pairs, 19.9% alone, 8.9%
in fours and 7.4% in three’s. Of the overseas
visitors, majority (61.4%) travelled in pairs
and 19.1% travelled alone. 52.6% of
domestic visitors travelled in pairs and
22.7% alone. Of the African (excluding
domestic) visitors, 37% travelled in pairs and
29.6% alone (Figure 24).
Figure 24: Travel group size by origin region
0.0%
10.0%
20.0%
30.0%
40.0%
50.0%
60.0%
70.0%
Overseas African (excludingdomestic)
Domestic
alonetwosthreesfoursfivessix +
22
Cape Town & Western Cape www.tourismcapetown.co.za
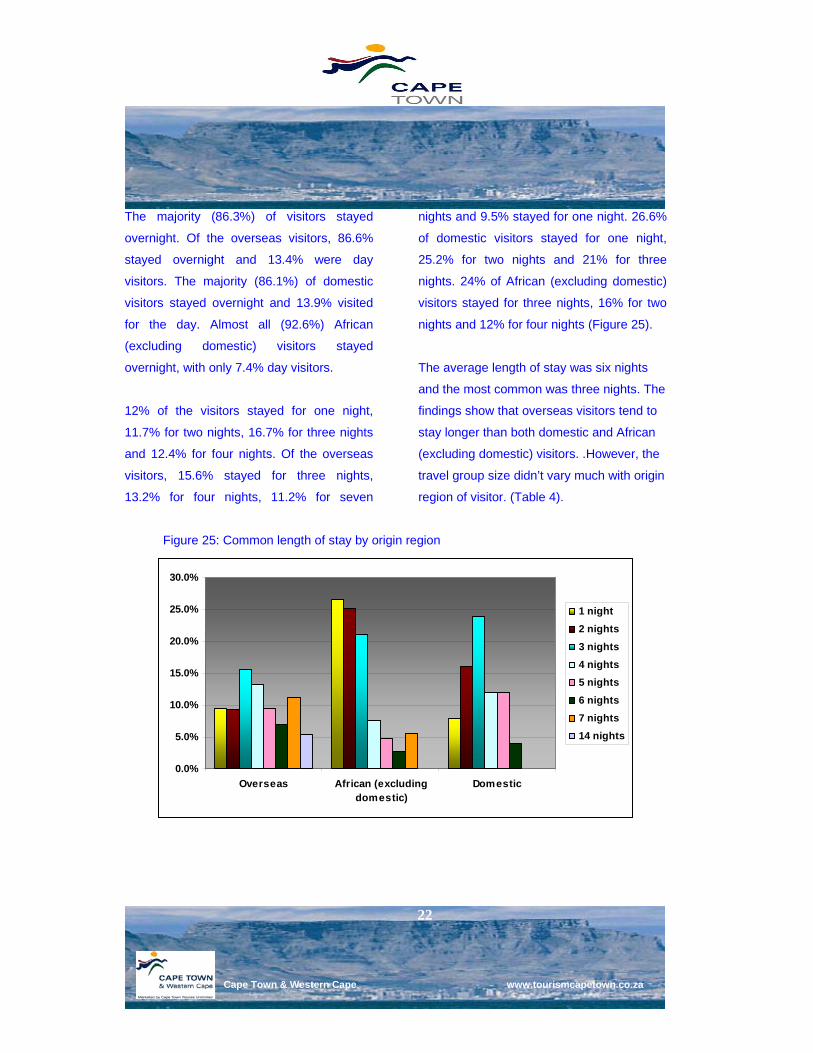
The majority (86.3%) of visitors stayed
overnight. Of the overseas visitors, 86.6%
stayed overnight and 13.4% were day
visitors. The majority (86.1%) of domestic
visitors stayed overnight and 13.9% visited
for the day. Almost all (92.6%) African
(excluding domestic) visitors stayed
overnight, with only 7.4% day visitors.
12% of the visitors stayed for one night,
11.7% for two nights, 16.7% for three nights
and 12.4% for four nights. Of the overseas
visitors, 15.6% stayed for three nights,
13.2% for four nights, 11.2% for seven
nights and 9.5% stayed for one night. 26.6%
of domestic visitors stayed for one night,
25.2% for two nights and 21% for three
nights. 24% of African (excluding domestic)
visitors stayed for three nights, 16% for two
nights and 12% for four nights (Figure 25).
The average length of stay was six nights
and the most common was three nights. The
findings show that overseas visitors tend to
stay longer than both domestic and African
(excluding domestic) visitors. .However, the
travel group size didn’t vary much with origin
region of visitor. (Table 4).
Figure 25: Common length of stay by origin region
0.0%
5.0%
10.0%
15.0%
20.0%
25.0%
30.0%
Overseas African (excludingdomestic)
Domestic
1 night2 nights3 nights4 nights5 nights6 nights7 nights14 nights

23
Cape Town & Western Cape www.tourismcapetown.co.za
Table 4: Average length of stay and travel group size by origin
Origin of visitor Average Length of stay (nights) Travel group size
Overseas 6.9 2.4
Africa (excluding domestic) 5.7 2.3
Domestic 3.2 2.3
All 6.3 2.4
Purpose of visit and mode of transport The main purpose of visit to Cape Town was
holiday (89.9%). 6.7% travelled for business,
1.4% for wedding and honeymoon purposes.
Of the overseas visitors, almost all (94.4%)
visited for holiday and 2.7% for business. Of
domestic visitors, 67.4% travelled for
holiday, 26.4% for business, 2.8% visited
friends and relatives (VFR) and 2.8% were
on honeymoon. 81.5% of African (excluding
domestic) visitors travelled for holiday,
14.8% for business and 3.7% for education
(Figure 26).
The majority (63%) of visitors used cars as
their mode of transport, followed by public
transport (17.5%), taxi services (6.8%) and
shuttle services (6.5%). 61.7% of overseas
visitors travelled by car and 20.7% utilised
public transport and shuttle services (5.5%).
Of the domestic visitors, 77.6% used cars,
11.9% taxis and 8.2% shuttle service.
African visitors mostly used cars and shuttle
service (26.1% each) and 21.7% used public
transport.

24
Cape Town & Western Cape www.tourismcapetown.co.za
Figure 26: Purpose of visit
0.0%10.0%20.0%30.0%40.0%50.0%60.0%70.0%80.0%90.0%
100.0%
Overseas Africa(excludingdomestic)
Domestic All
holiday
business
education
VFR
honeymoon
Information Sources Friends and relatives (44.2%) continue to
rank top on “how the visitors hear of the
destination” and the trend didn’t vary much
with origin of visitor. 18.2% indicated that
visitor information centres (VICs) were their
source of information followed by online
sources (14.5%), media (12.2%), personal
experience (5.8%), travel books (3%) and
schools (2.1%) (Figure 27).
Figure 27: Main source of information
friends & relatives, 44.2%
VICs, 18.2%
travel books, 3.0%
media, 12.2%school, 2.1%
personal experience, 5.8%
online, 14.5%

25
Cape Town & Western Cape www.tourismcapetown.co.za
46.3% of overseas visitors heard of the
destination from their friends and relatives,
16.9% from online sources, 13% from VIC’s,
12.4% from the media and 5.4% from
personal experience. Of the domestic
visitors, 39.3% heard of the destination from
friends and relatives, 37.5% from VIC’s,
12.5% from the media and 6.3% from
personal experience. 36.4% of African
visitors heard of the destination from their
friends and relatives. A further 22.7%
obtained information from VIC’s, 13.6% from
online sources and personal experience,
9.1% from school and 4.5% from the media.
The consistent appearance of personal
experience as source of information
indicates that the destination enjoys
substantial repeat business.
Daily Budget The average daily budget for this quarter
was R742.43. However, the most common
daily budget was R500.00. The most
common daily budget for overseas visitors
was R500.00, R400.00 for domestic visitors
and R300.00 for African visitors (Table 5).
Table 5: Daily budget by orign
Daily budget (Rands) Origin
Average Most common
Overseas 771.73 500
Africa (excluding domestic) 685.38 300
Domestic 677.2 400
All 742.50 500
Repeat visits Asked if they would visit again, 60.8% said
they would, 38.2% said they might and 1.0%
said they would not. The majority across all
source markets indicated they would
definitely visit Cape Town again. Of the
overseas visitors, 55.3% said they would
visit again, 43.5% said they might and 1.2%
said they would not visit again. Almost all
(91.3%) domestic visitors said they would
visit again, 8.7% said they might. 84% of
African visitors said they would visit again,
16% said they might.

26
Cape Town & Western Cape www.tourismcapetown.co.za
Q4 2007 CAPE TOWN LODGING STATISTICS
A total of 237 responses were received in
Q4 2007, equally distributed among the
three Q4 months of October, November and
December. All the four Cape Town regions
were represented as follows: Cape Town
Central, 24.1% and 25.3% each for the other
three regions (East, North and South). Four
lodging categories were represented
including: Hotels (25.7%), Guest Houses
(23%), Self Catering (27%) and B&Bs
(24.3%). Star rating of the participating
establishments is presented in figure 28.
The summary for Q4 2007 lodging statistics
is presented below:
Average Occupancy: 70.8%
Average room rate: R895.54
RevPAR: R633.59
Forward booking January (as reported in
December): 66.5%
Forward booking February (as reported in
December): 62.3%
Forward booking March (as reported in
December): 60.6%
Figure 28: Star Grading of participating lodging establishments
3-star, 16.5%
4-star, 29.1%
5-star, 6.3%
2-star, 1.3%Unspecified,
46.8%

27
Cape Town & Western Cape www.tourismcapetown.co.za
Table 6: Q4 2007 Cape Town lodging statistics by month Month Occupancy (%) Average Room Rate ( R ) October 64.6 859.93November 69.1 891.08December 78 936.58All 70.8 895.54 The month of December achieved both the
highest occupancy and average room rates
as shown in Table 6. Analysis of the data by
Cape Town region showed that Cape Town
Central achieved both the highest average
room rate (R1,400.63) and occupancy rate
(82.91%). Cape Town South had the second
highest average room rate (R930.98) while
Cape Town East had the second highest
occupancy rate (72.68%) (Table 7).
However, Cape Town East had the highest
percentage forward bookings for the three
months following December, followed by
Cape Town Central.
Hotels achieved the highest average room
rate (R1,480.84) and occupancy rate
(79.86%) followed by self-catering
establishments. Hotels also had the highest
forward booking rates for the three months
following December 2007 (Table 8). First
quarter 2008 outlook was good as lodging
establishments were already over 60%
booked for January, February and March
2008 by December 2007.
Table 7: Q4 2007 Lodging statistics by Cape Town Region Cape Town
Region
% Occupancy
Average Room Rate
( R )
RevPAR ( R )
*%Forward booking 1 month
*%Forward booking
2 months
*%Forward booking
3 months Central 82.9 1400.63 1161.26 75.2 65.6 57.2 East 72.7 583.83 424.33 76.5 80 79.3 South 59.0 930.98 549.46 57.8 45.4 48.1 North 67.2 617.93 425.31 54.2 50.4 46.6 All 70.8 895.54 633.59 66.5 62.3 60.7
*December as benchmark month

28
Cape Town & Western Cape www.tourismcapetown.co.za
Table 8: Q4 2007 lodging statistics by category of establishment Category Average
Room Rate (R)
% Occupancy
RevPAR( R)
*% Forward booking 1month
*% Forward booking 2months
*% Forward booking 3months
Hotel 1480.84 79.9 1182.60 76.4 74.5 72.1 Guest House 745.60 67.3 501.86 62.2 48.4 432 B&B 592.15 69.1 409.23 65.1 60.3 62.6 Self Catering 757.48 69.7 527.89 62.4 68.7 68.1
*December as benchmark month
Analysis of different lodging category
performance in each region shows that
Cape Town Central’s performance as
indicated by both average room rates and
occupancy rates was generally very high.
Lodging performance statistics for Cape
Town East and North were overall lower
than those for Central and South (refer to
Table 9 below).
Booking Method Telephone was the single most common
booking method through which the
participating establishments received the
bulk of their bookings. 27.4% of the
establishments received the bulk of their
bookings via all three methods while 20.7%
received their bookings through both
telephone and e-mail (refer to Figure 29).
Table 9: Lodging statistics by Cape Town region and category of establishment
Cape Town Central
Cape Town East Cape Town South Cape Town North Category/ Region
Ave. Room
Rate (R)
%Occu- pancy
Ave. Room
Rate (R)
%Occu- pancy
Ave. Room
Rate (R)
%Occu- pancy
Ave. Room Rate (R)
%Occu- pancy
Hotel 2298.79 89.4 836.00 77.4 1879.00 75.4 884.62 77.1 Guest House
1091.67 78.9 444.67 67.3 717.50 70.3 547.50 44.7
B&B 1220.57 82.2 373.33 71.7 354.00 48.6 396.25 68.1 Self Catering
1013.57 81.5 681.33 74.3 714.27 48.8 607.92 70.8
All 1400.63 82.9 583.83 72.7 992.28 61.2 610.00 67.2

29
Cape Town & Western Cape www.tourismcapetown.co.za
Figure 29: Method through which bulk of bookings were received
Web, 7.6%
E-mail & Web, 4.2%
Telephone & Web, 6.3%
All 3 methods, 27.4%
E-mail, 5.5%
Telephone, 23.2%
Telephone & E-mail, 20.7%

30
Cape Town & Western Cape www.tourismcapetown.co.za
Q4 2007 CAPE OVERBERG REGIONAL TRENDS
There were a total of 304 responses
obtained from the Overberg Region in Q4
2007, distributed across the towns of
Hangklip/Kleinmond (8.6%) and Swellendam
(91.4%).
Origin of visitors 65.6% of the respondents were overseas
and 34% domestic. Among the overseas
visitors, the top source countries were the
UK (22.6%), Germany (16%), Netherlands
(10.1%), Switzerland (3.5%) and 2.8% each
for France and Belgium.
70.8% of the respondents from
Hangklip/Kleinmond were domestic visitors
and 29.2% were from overseas. The
overseas visitors were from the UK (12.5%),
8.3% from France, 4.2% from Netherlands
and Norway (4.2%). Findings show the
complete opposite for the town of
Swellendam, with the majority (68.9%)
originating from overseas and 30.7%
domestic. Of the overseas visitors, most
(23.5%) were from the UK, followed by
17.4% from Germany, 10.6% from
Netherlands and 3.8% from Switzerland.
Figure 30: Visitor origin region
0.010.020.030.040.050.060.070.080.0
% o
f vis
itors
Overseas 29.2 68.9
Domestic 70.8 30.7
Hangklip/Kleinmond Swellendam

31
Cape Town & Western Cape www.tourismcapetown.co.za
Of the domestic visitors, the majority
(52.2%) were from the Western Cape
Province, followed by 36.7% from Gauteng,
KwaZulu-Natal and Mpumalanga (refer to
Figure 31). The main domestic source
provinces for each of the participating towns
were the Western Cape, Gauteng,
Mpumalanga and Free State.
Figure 31: Domestic visitors’ province of origin
Figure 32: Origin of domestic visitors by participating Overberg Towns
50.7
38.4
29.4
58.8
2.75.9
1.4
5.9
4.1
0.0
10.0
20.0
30.0
40.0
50.0
60.0
70.0
Hangklip/Kleinmond Swellendam
% o
f vis
itors
Gauteng
Western Cape
Mpumalanga
Free State
KwaZulu-Natal
52.2%
36.7%
3.3%
3.3%
2.2%
1.1%
1.1%
Western Cape
Gauteng
Mpumalanga
KwaZulu-Natal
Free State
Northern Cape
Eastern Cape

32
Cape Town & Western Cape www.tourismcapetown.co.za
Travel group size and length of stay The overall average and most common
travel group size was two. The majority
(68.4%) of visitors travelled in pairs, 11.2%
travelled in fours, 9.2% in threes, 5.1%
travelled alone, 2% in fives and 2.4% in
sixes (refer to Figure 33). Of the overseas
visitors, 75.8% travelled in pairs, 11.8% in
fours, 5.4% in threes and 2.2% alone. Most
(52.2%) domestic visitors travelled in pairs,
16.3% in threes, 12% alone and 10.9% in
groups of four.
Figure 33: Travel group size
twos, 68.4%
fours, 11.2%
fives, 2.2%
sixes, 2.4%
7+, 1.6%
threes, 9.2%
alone, 5.1%

33
Cape Town & Western Cape www.tourismcapetown.co.za
Figure 34: Travel group size by origin region of visitor
12.0%
2.2%
75.8%
52.2%
5.4%
16.3%11.8% 10.9%
0.0%
10.0%
20.0%
30.0%
40.0%
50.0%
60.0%
70.0%
80.0%
Overseas Domestic
% o
f vis
itors
One
Two
Three
Four
The overall average length of stay was two
nights, however, the most common length of
stay was one night. 77.6% of the visitors
stayed overnight and 22.4% were day
visitors. 47% stayed for one night, 35.6% for
two nights, 6.8% for three nights and 2.5%
for four nights. 80.4% of overseas visitors
stayed overnight, with the majority (50.7%)
staying for one night, 32.9% for two nights,
7.9% for three nights and 2% for four nights.
However, the majority (41.7%) of domestic
visitors stayed for two nights, followed by
36.1% staying for one night (refer to Figure
35).

34
Cape Town & Western Cape www.tourismcapetown.co.za
Figure 35: Length of Stay by origin
0.0%
10.0%
20.0%
30.0%
40.0%
50.0%
60.0%
Overseas Domestic All
1 night2 nights3 nights4 nights5+
Main purpose of visit & mode of transport The majority (98.7%) of visitors visited for
holiday. Of the overseas visitors, almost all
(99.5%) visited for holiday. 97.9% of
domestic visitors were in the destination for
holiday and 2.1% for business.
88.9% of visitors travelled by car, 8.2% by
bike and 2.5% by bus. Of the overseas
visitors, 95.1% travelled by car, 3.3% by bus
and 1.6% by bycicle. Of the domestic
visitors, 73.2% travelled by car, 24.4% by
bicycle and 1.2% by bus.
General comments about the Overberg All the comments for the destination were
positive. There were no negative comments
on the destination from both overseas and
domestic visitors. Visitors to both
Hangklip/Kleinmond and Swellendam
provided good feedback on the customer
service received at the respective tourism
offices.
35
Cape Town & Western Cape www.tourismcapetown.co.za
Q4 2007 CAPE GARDEN ROUTE REGIONAL TRENDS
There were a total of 555 responses from
the Cape Garden Route region in Q4 2007,
from five towns including Uniondale (5.2%),
De Rust (3.1%), George (15.9%),
Oudtshoorn (53.9%) and Mossel Bay (2%).
The responses were distributed across the
three Q4 months as follows: October,
15.1%; November, 33.3% and 51.5% in
December.
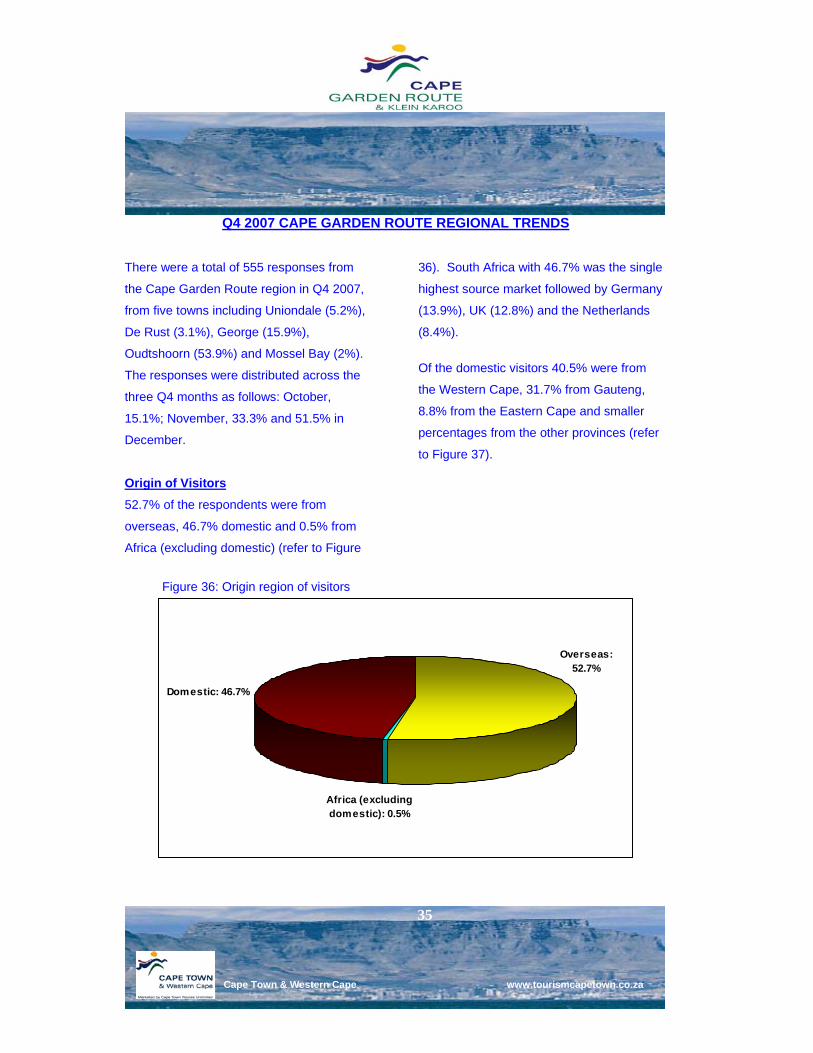
Origin of Visitors 52.7% of the respondents were from
overseas, 46.7% domestic and 0.5% from
Africa (excluding domestic) (refer to Figure
36). South Africa with 46.7% was the single
highest source market followed by Germany
(13.9%), UK (12.8%) and the Netherlands
(8.4%).
Of the domestic visitors 40.5% were from
the Western Cape, 31.7% from Gauteng,
8.8% from the Eastern Cape and smaller
percentages from the other provinces (refer
to Figure 37).
Figure 36: Origin region of visitors
Africa (excluding domestic): 0.5%
Domestic: 46.7%
Overseas:52.7%

36
Cape Town & Western Cape www.tourismcapetown.co.za
Figure 37: Q4 2007 Domestic visitor province of origin
40.5%
31.7%
8.0%
5.7%
4.0%
3.1%
2.6%
1.8%
1.8%
Western Cape
Gauteng
Eastern Cape
Free State
KwaZulu-Natal
Northern Cape
Mpumalanga
Limpopo
North West
Analysis of origin by participating location
showed that most of the visitors in the
participating towns were domestic except for
Oudtshoorn that had more overseas than
domestic visitors.
Figure 38: Origin region by participating Garden Route town
61.6%
1.0%
70.9%
38.4%
25.8%
13.8%
28.0%
74.2%
86.2%
0.0%
10.0%
20.0%
30.0%
40.0%
50.0%
60.0%
70.0%
80.0%
90.0%
100.0%
Uniondale De Rust George Oudtshoorn
% o
f Vis
itors
Overseas Domestic Africa (excluding domestic)

37
Cape Town & Western Cape www.tourismcapetown.co.za
Travel group size The overall average travel group size was
three and the most common was two. 61.9%
of the respondents travelled in twos, 14.8%
in fours, 8.7% in threes and 5.5% alone
(refer to Figure 39). Average travel group
size didn’t vary much with origin region of
visitor. The average group size for overseas
was 2.8 while that for domestics was 2.9.
While there wasn’t much origin region
variation in travel group size there was a
substantial proportion of domestic visitors
travelling in fives and sixes than there were
overseas visitors. However, there was also a
substantial proportion (3.1%) of overseas
visitors travelling in groups of seven and
more probably in arranged tour groups (refer
to figure 40). There were not enough African
(excluding domestic) visitors to include in
comparisons.
Figure 39: Travel group size
twos, 61.9%
threes, 8.7%
fours, 14.8%
fives, 3.6%
sixes, 2.4%
seven +, 3.0%
alone, 5.5%

38
Cape Town & Western Cape www.tourismcapetown.co.za
Figure 40: Travel group size by origin region of visitor
0.0%
10.0%
20.0%
30.0%
40.0%
50.0%
60.0%
70.0%
80.0%
% o
f vis
itors
alone 4.5% 6.9%
twos 70.9% 50.5%
threes 5.6% 13.0%
fours 13.1% 17.1%
fives 2.6% 4.6%
sixes 0.4% 5.1%
Seven+ 3.1% 2.8%
Overseas Domestic
Length of Stay The overall average length of stay in the
participating Cape Garden Route Towns
was 2.5 nights but the most common was
one night. Average length of stay for
overseas visitors was two nights and that for
domestic visitors was 3.4 nights. 54.9%
stayed for one night and 25.7% for two
nights. However, average length of stay
varied with town and origin region of visitor
(Figure 41). George had the highest overall
average length of stay of seven nights, 10
nights for domestic visitors and 3.2 nights for
overseas visitors. Overall average length of
stay for the whole trip was 16.3 nights, 24
nights for overseas visitors and 11 nights for
domestic visitors. This finding shows that
overseas visitors spend about a sixth of their
entire trip time in the Cape Garden Route
towns suggesting that they visit multiple
destinations in one trip.

39
Cape Town & Western Cape www.tourismcapetown.co.za
Figure 41: Average length of stay by origin region and participating town.
1.7
3.2
1.91.7
10.3
3.5
1.7
7.4
2.3
0
2
4
6
8
10
12
De Rust George Oudtshoorn
Ave.
Len
gth
of s
tay
(nig
hts)
Overseas Domestic All Mode of transport and purpose of visit Almost all (95.7%) of the visitors used car as
their mode of transport in the destination
followed by bus (3.3%). 97% of the visitors
were in the destination on holiday and 2.1%
on business. The pattern didn’t vary much
with origin of visitor.
40
Cape Town & Western Cape www.tourismcapetown.co.za
Q4 2007 CAPE KAROO REGIONAL TRENDS
There were only 28 responses received from
the Cape Karoo region in Q4 2007 from the
Laingsburg visitor information centre.
Because of the low response rate, not much
analysis could be done for the region in this
quarter. Only a few general descriptives are,
therefore, presented below.
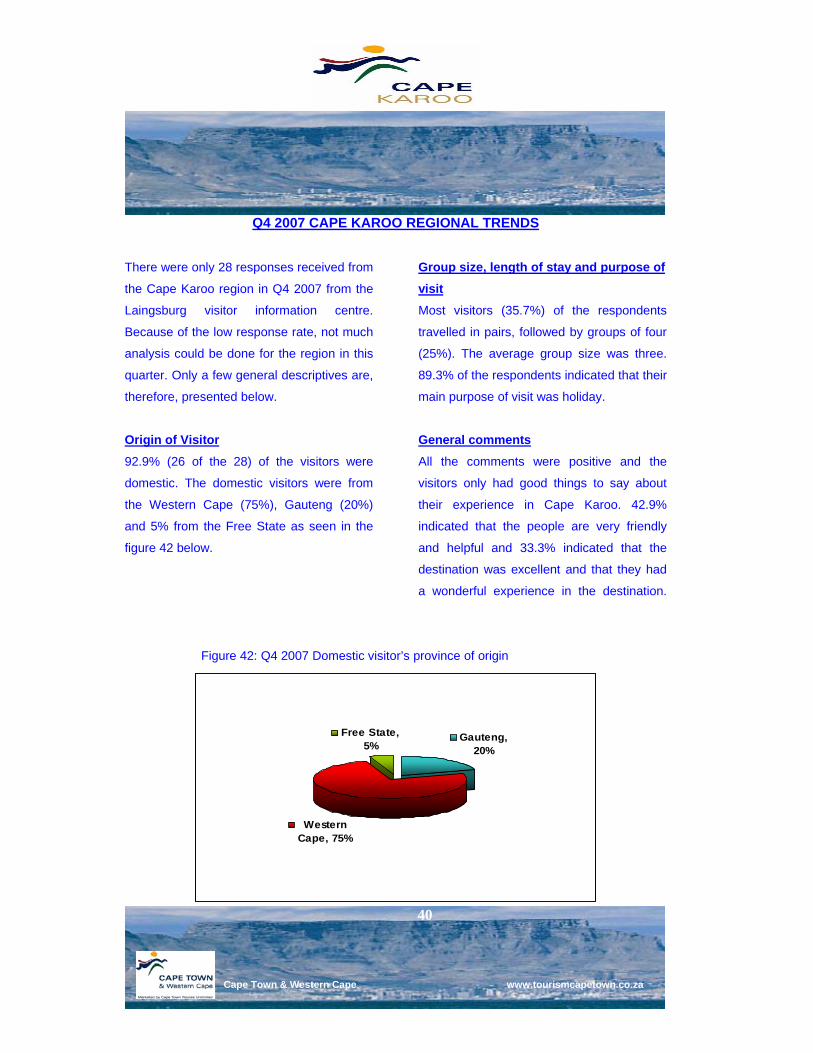
Origin of Visitor 92.9% (26 of the 28) of the visitors were
domestic. The domestic visitors were from
the Western Cape (75%), Gauteng (20%)
and 5% from the Free State as seen in the
figure 42 below.
Group size, length of stay and purpose of visit Most visitors (35.7%) of the respondents
travelled in pairs, followed by groups of four
(25%). The average group size was three.
89.3% of the respondents indicated that their
main purpose of visit was holiday.
General comments
All the comments were positive and the
visitors only had good things to say about
their experience in Cape Karoo. 42.9%
indicated that the people are very friendly
and helpful and 33.3% indicated that the
destination was excellent and that they had
a wonderful experience in the destination.
Figure 42: Q4 2007 Domestic visitor’s province of origin
Gauteng, 20%
Western Cape, 75%
Free State, 5%

41
Cape Town & Western Cape www.tourismcapetown.co.za
Q4 2007 CAPE WINELANDS REGIONAL TRENDS
There were a total of 1,006 responses from
the Winelands region in Q4 2007. These
were from Robertson (11.3%), Tulbagh
(52.4%), Ceres (27.3%) and Montagu
(8.9%). The responses were distributed
across the three Q4 months as follows:
October, 19.9% November, 21.2% and
58.9% in December.
Origin of visitors 50.8% of the visitors were from overseas,
0.9% from Africa and 48.6% domestic.
South Africa with 48.6% was the single
largest source of visitors followed by
Germany (16.2%), UK (11.8%) and
Netherlands (7.1%). The composition of
visitors in each participating town varied
slightly but the major source markets pretty
much dominated across all towns (refer to
Table 10).
Table 10: Top three source countries in each participating Cape Winelands town
Rank/Town Robertson Tulbagh Ceres Montagu
1 South Africa, UK, Germany (18.9% each)
South Africa (47.2%)
South Africa (63%)
South Africa (49.4%)
2 Netherlands (8.1%) Germany (18.1%)
Germany (11.9%)
Germany (14.9%)
3 USA (7.2%) UK (14.1%) UK (6.7%) UK & Netherlands (5.7% each)

42
Cape Town & Western Cape www.tourismcapetown.co.za
Figure 43: Domestic visitors province of origin
52.3%
28.6%
4.8%
4.8%
2.8%
2.8%
2.1%
1.4%
0.5%
W.Cape
Gauteng
E.Cape
KZN
F.State
N.West
Mpumalanga
N.Cape
Limpopo
Of the domestic visitors 52.3% were from
the Western Cape, 28% from Gauteng and a
few from the other provinces (Figure 43).
Western Cape and Gauteng dominated as
the major sources of domestic visitors in all
the participating Cape Winelands towns
(Table 11).
Table 11: Top four domestic visitors’ province of origin by participating Cape Winelands town Rank /Town
Robertson Tulbagh Ceres Montagu
1 W. Cape (68.4%) W. Cape (53.2%)
W. Cape (50.6%)
W. Cape (45.9%)
2 E. Cape & F. State (10.5% each)
Gauteng (28.2%)
Gauteng (31.5%)
Gauteng (29.7%)
3 Gauteng (5.3%) KZN (5.1%) KZN (6.2%) E. Cape (10.8%)
4 N. West (5%) E. Cape (3.7%) E. Cape (4.3%) F. State (8.1%)

43
Cape Town & Western Cape www.tourismcapetown.co.za
Travel group size The average travel group size was three, but
the most common group size was two.
58.5% of the visitors travelled in pairs,
14.2% in fours and 9.7% in threes (Figure
44). 70.4% of overseas visitors travelled in
pairs, 9.6% in fours and 6.7% in threes.
46.2% of domestic visitors travelled in pairs,
19.2% in fours and 12.8% in threes (refer to
Figure 45).
Figure 44: Travel group size
twos58%
threes10%
fours14%
8+ 4%
sixes3%fives
5%
sevens1%
alone5%
Figure 45: Travel group size by origin region
0.0%
10.0%
20.0%
30.0%
40.0%
50.0%
60.0%
70.0%
80.0%
% o
f Vis
itors
alone 3.9% 4.7%
twos 70.4% 46.2%
threes 6.7% 12.8%
fours 9.5% 19.2%
fives 2.2% 8.8%
sixes 2.2% 3.4%
7+ 4.8% 5.0%
Overseas Domestic

44
Cape Town & Western Cape www.tourismcapetown.co.za
Length of stay Figure 46: Most common length of stay
4 nights, 3.2%
5 nights, 2.8%
7 nights, 3.8%
14 nights, 2.1%
2 nights:21.2%
1 night, 54.5%
3 nights, 6.0%
10 nights:1.8%
Other: 4.6%
The overall average length of stay of visitors
in the participating Winelands towns was
three nights but the most common length of
stay was one night. Average length of stay
for overseas visitors was two nights and that
for domestic visitors was three. 54.5% of the
visitors stayed for one night, 21.2% for two
nights, 6% for three nights and the rest for
four nights and longer (Figure 46).
Comparing average length of stay among
the participating Cape Winelands region
towns showed that Montagu enjoyed the
highest (4.5 nights) length of stay followed
by Ceres. However, Ceres enjoyed the
highest (5.6 nights) length of stay from
overseas visitors while Montagu enjoyed the
highest length of stay from domestic visitors
(refer to Table 12).
Table 12: Average length of stay by participating Cape Winelands town and region of origin
Average length of stay (nights) Participating Cape Winelands town Overseas Domestic All
Robertson 3.9 2.6 3.6Tulbagh 2.9 2 2.4Ceres 5.6 3.1 4.2Montagu 3 5.6 4.5All 3.6 2.9 3.3

45
Cape Town & Western Cape www.tourismcapetown.co.za
Main purpose of visit and mode of transport The most common purpose of visit among
almost all (95.1%) of the respondents was
holiday followed by business (2%). A few
were in the destination visiting friends and
relatives (1%) and for educational purposes
(1%) (Figure 47). The main mode of
transport was car (98.4%) and only 0.1%
made use of public transportation.
Figure 47: Main purpose of visit to the Winelands
Holiday, 95.1%
Education, 1.0%
Religion, 0.2%
VFR, 1.0%
Business, 2.0%
Honeymoon, 0.6%

46
Cape Town & Western Cape www.tourismcapetown.co.za
Destination Brand Awareness: Domestic Market Study 2007 A brand awareness study was conducted in
June 2007 across South Africa to assess the
level of awareness of brand Cape Town &
Western Cape along with the destination’s
sub-brands. A probability sample of 2,464
was selected from the population 16 and
over across South Africa. Data collection
was conducted by AC Nielsen through face-
to-face questionnaire administration. 50.1%
of respondents were male, and 49.9% were
female. 52.6% were Black, 25.7% were
White 11.9% were Coloured, and 9.7% were
Indian.
Top of Mind (TOM) Destination Awareness Respondents were asked to name any
destination that immediately comes to mind
when thinking of taking a pleasure trip in
South Africa. Several destinations were
mentioned, but the top five top of mind
(TOM) domestic destinations were:
• Cape Town (28.5%)
• Durban (24%)
• Johannesburg (5.2%)
• Mpumalanga (4.9%)
• Port Elizabeth (2.4%).
Analysis of the top of mind destinations by
province showed that Western Cape
destinations were at the top followed by
KwaZulu-Natal (Figure 48). This implies that
Western Cape’s destinations come to mind
when people are thinking of taking a
domestic pleasure trip more often than do
destinations in other provinces.
Figure 48: TOM Destination awareness by province
0.20.92.32.55.75.77.1
29.9
37
0
5
10
15
20
25
30
35
40
W. C
ape
KZN
Gaute
ng
Mpumala
nga
E. Cap
e
North
west
Limpo
po
F. S
tate
N. Cap
e
% o
f Res
pond
ents
47
Cape Town & Western Cape www.tourismcapetown.co.za
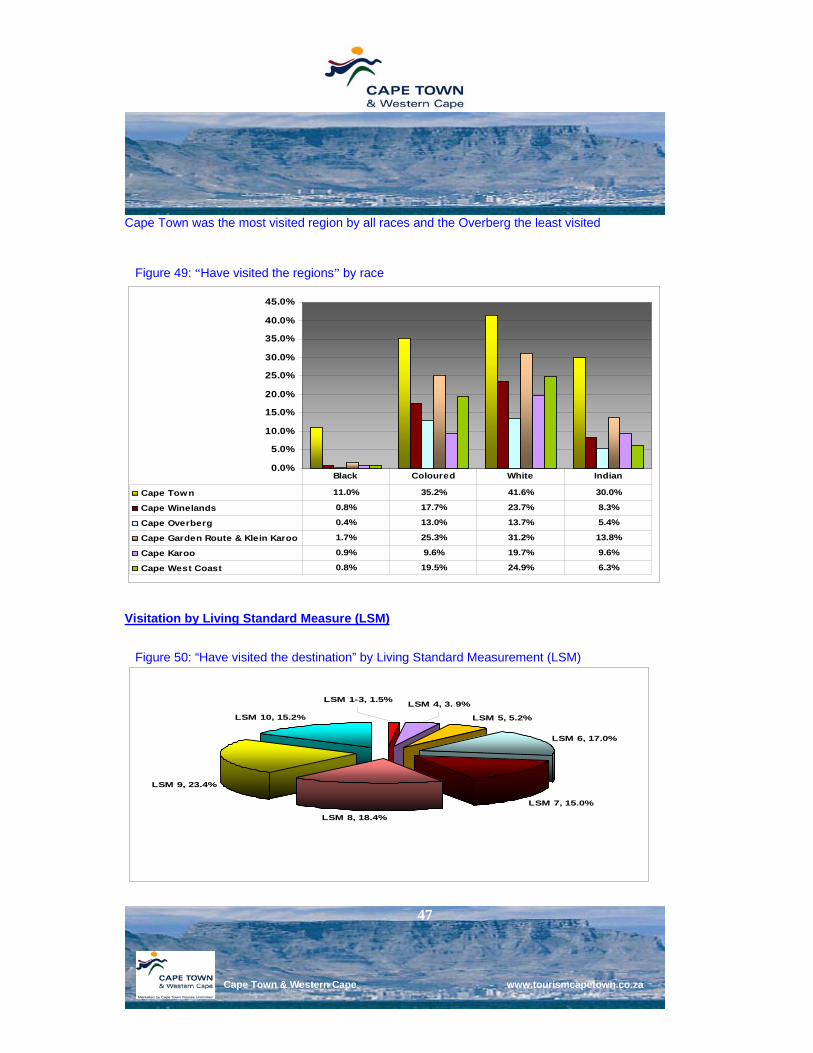
Cape Town was the most visited region by all races and the Overberg the least visited
Figure 49: “Have visited the regions” by race
Visitation by Living Standard Measure (LSM)
Figure 50: “Have visited the destination” by Living Standard Measurement (LSM)
0.0%
5.0%
10.0%
15.0%
20.0%
25.0%
30.0%
35.0%
40.0%
45.0%
Cape Town 11.0% 35.2% 41.6% 30.0%
Cape Winelands 0.8% 17.7% 23.7% 8.3%
Cape Overberg 0.4% 13.0% 13.7% 5.4%
Cape Garden Route & Klein Karoo 1.7% 25.3% 31.2% 13.8%
Cape Karoo 0.9% 9.6% 19.7% 9.6%
Cape West Coast 0.8% 19.5% 24.9% 6.3%
Black Coloured White Indian
LSM 5, 5.2%
LSM 6, 17.0%
LSM 7, 15.0%
LSM 8, 18.4%
LSM 9, 23.4%
LSM 10, 15.2%
LSM 1-3, 1.5% LSM 4, 3. 9%

48
Cape Town & Western Cape www.tourismcapetown.co.za
LSM 9 and 10 accounted for 28.6% of those
who indicated that they had visited Cape
Town & the Western Cape. LSM 1-5
accounted for only 10.6%. Most of those
who had visited were from Gauteng followed
by KwaZulu-Natal, Eastern Cape and Free
State. Over 60% of those that had visited the
province were 35 years old and over (Figure
51). Findings of this study, therefore, show
that visitors to the province are likely to be:
white and secondly coloured; come from
Gauteng, KwaZulu-Natal and Eastern Cape;
35 years and over and belong to LSM 6 and
above.
Figure 51: “Have visited the destination” by residence province and age
0.0%5.0%
10.0%15.0%20.0%25.0%30.0%35.0%40.0%45.0%50.0%
Gauteng
KZN
E.Cap
e
F.State
25-34
16-24
35-49
50+
% o
f res
pond
ents

49
Cape Town & Western Cape www.tourismcapetown.co.za
Brand Recognition Respondents were presented with the
different Cape Town & Western destination
brand logos and asked if they recognised
any of them and what they thought the brand
logos meant or represented. The most
recognised destination brand logo was that
for Cape Town, followed by Cape Town &
Western Cape, Cape Garden Route & Klein
Karoo and others (refer to Table 13). 33.4%
of the respondents did not recognise any of
the destination brands.
Table 13: Destination Brand recognition
Brand logo % of respondents recognising the brand logo
56.7%
34%
26.7%
23.7%
23%
22.2%
14.4%

50
Cape Town & Western Cape www.tourismcapetown.co.za
Figure 52: What brand Cape Town & Western Cape represents to the domestic market
City of CT emblem11.8%
Cape Tourism
4.6%Tourist
attractions
3.8%
Sunshine in
the W. Cape
4.3%
Holiday,
peace & tranquility
3.2%
RollingMountains
1.4%
Sporting events, running man
2.3%
Don’t know20.3%Nothing 2.4%
Nature, wilderness
1.2%
Fun,
ex
citem
ent
1.2%
Table Mountain
1.2%
People
relaxing 1.1%
W. Cape beaches 1%
Other:Tourism 5.6%
Other: non tourism 5.4%
Figure 53: What Cape Town Routes Unlimited represents to the domestic market
Tourist routes of Cape Town,
14.6%Touris
t
attractio
ns,
5.8%
W. Cape
Tourism, 4.1%
City of Cape Town, 1.7%
Wine Routes,
3.1%
Garden Route,
1.6%
Roads of Cape Town, 1.9%
Western Cape places &
resorts, 1.4%
Cape Town tourin
g,
tour operators,
1.1%
Don’t know,
22.2%
Nothing, 2.6%
Other: non tourism, 3.5%
Unlimited
destinations, 1%
Other: tourism related, 4.9%

51
Cape Town & Western Cape www.tourismcapetown.co.za
Figure 54: CTT-What the brand represents to the domestic market
Cape Town Tourism logo,
23.3%
Table
mountain,
7.3%
Tourist
attractions,
4.2%
Cape Town, 3.5%Se
a in th
e Ca
pe, 7
.6%
Mountains in
the Cape, 2%Beaches in the Cape,
1.1%Cape
Tow
n
aqua
rium, 1
%
Don ’t know,
15.5%
Nothing, 1.9%Other, 7%
Holiday making,
places in Cape
Town, 0.9%
Sightseeing, 0.9%
Relaxing, peaceful, 0.7%
Figure 55: This city works for you-What the brand represents to the domestic market
City of Cape Town, 10.5%
Cape T
own
city c
ounc
il,
mun
icipa
lity,
6.5%
Holiday destination, 5.5%
Table Mountain
trademark, 6.3%
Rainbow nation,4.6%
Cape Town is a
city that works for
its people, 5%
Cape Town
region flag, 1.6%
Cape T
own is
multi-rac
ial, 1
.5%
Don’t know,
18.5%
Nothing, 2.1%
Welcome to city of Cape Town, 0.9%
Other, 7.8%
Mountains in
Cape Town, 1.2%

52
Cape Town & Western Cape www.tourismcapetown.co.za
Figure 56: Words/statements that best describe brand Cape Town and the Western Cape…
Beautiful, 32.7%Beautiful
white sandy beaches, 29.1% Good food
& Wine, 28.1%
Friendliness, 25.9%
Natural & scenicbeauty, 24.1%
Relaxation, 25.1%
Rich culture & heritage,
18.2%
All year round
destination, 17.5%
Shopping, 14.2%
Welcoming, 13.8%
Outdoor active, 13.2%
Great events, 12.7%
Escape from
busy life destination,
13%
Business destination.,
11.9%
Diversity of
experiences, 10.8%
Body, mind & spirit, 10.2%
Warm & caring, 10.5%
Cosmopolitanvibe, 7.9%
Vibrant nightlife,
7.5%
Wedding, honeymoon destination,
6.7%
Respondents were asked to state five
statements that, in their view, best described
brand Cape Town & Western Cape. Figure
56 above shows in descending order how
the brand is viewed in the domestic market.
Figure 57 shows how the brand is perceived
by those who have visited and those who
have not visited the province. Those who
have visited mostly describe brand Cape
Town and the Western Cape as a “Good
food and wine,” destination while those who
have not visited mostly perceive the
destination as just “beautiful” and “relaxing”.
Bordered in green are the destination brand
strengths.

53
Cape Town & Western Cape www.tourismcapetown.co.za
Figure 57: What brand Cape Town & Western Cape represents by whether or not one has visited the destination
0.0%
10.0%
20.0%
30.0%
40.0%
50.0%
60.0%
Friendlin
ess
Outdoor
activ
e
Beautifu
l
Good fo
od & W
ine
Rich cu
lture
& H
eritag
e
Natural
& sc
enic
beauty
Relaxa
tion
Vibrant
nightlife
Beautifu
l white
sandy
beache
s
Body, m
ind &
spirit
Cosmop
olitan vi
be
Warm &
carin
g
Great e
vents
Diveris
ty of ex
perien
ces
Busines
s des
tinati
on
Escap
e from
busy lif
e des
tinatio
n
Welcoming
Shopping
All yea
r round
destin
ation
Wedding/H
oeymoon de
stinati
on
% o
f Res
pons
es
Visited Western Cape
Not visited Western Cape
Figure 58 below shows what brand Cape
Town and Western Cape represents in the
three major domestic source markets for
Western Cape including Gauteng, KZN and
Eastern Cape. “Just beautiful” is how the
domestic market mostly views brand Cape
Town & Western Cape regardless of source
province. ‘Friendly’ and ‘relaxing’ also rank
top among those from KwaZulu-Natal. To
those from Gauteng the brand represents
“beautiful sandy beaches,” “good food &
wine” and also “relaxation.” Bordered in red
are the current Cape Town & Western Cape
marketing themes. Figure 58: What brand ‘Cape Town & Western Cape’ represents by domestic source market
05
101520253035404550
All yea
r round
destin
ation
Beautifu
l
Body, M
ind & S
pirit
Beautifu
l white
sandy
beache
s
Busines
s des
tinati
on
Cosmop
olitan vi
be
Divers
ity of
experi
ences
Escap
e from
busy lif
e des
tinatio
n
Friendlin
ess
Good Foo
d & W
ine
Great E
vents
Natural
& Sce
nic B
eauty
Outdoor
Acti
ve
Relaxa
tion
Rich cu
lture
& heri
tage
Shopping
Vibrant
nightlife
Warm &
carin
g
Wedding, h
oneymoon
destin
ation
Welcoming
% o
f res
pons
es
Gauteng
KZN
E.Cape
Produced by: