welcome to dtu research database
TRANSCRIPT
General rights Copyright and moral rights for the publications made accessible in the public portal are retained by the authors and/or other copyright owners and it is a condition of accessing publications that users recognise and abide by the legal requirements associated with these rights.
Users may download and print one copy of any publication from the public portal for the purpose of private study or research.
You may not further distribute the material or use it for any profit-making activity or commercial gain
You may freely distribute the URL identifying the publication in the public portal If you believe that this document breaches copyright please contact us providing details, and we will remove access to the work immediately and investigate your claim.
Downloaded from orbit.dtu.dk on: Feb 17, 2022
Analysis of vaccineStructure, storage, moisture, and classification by infrared technology
Zheng, Yiwu
Publication date:2006
Document VersionPublisher's PDF, also known as Version of record
Link back to DTU Orbit
Citation (APA):Zheng, Y. (2006). Analysis of vaccine: Structure, storage, moisture, and classification by infrared technology.Technical University of Denmark.
Analysis of vaccine:
Structure, storage, moisture, and classification
by infrared technology
Ph.D. Thesis by
Yiwu Zheng
2006
BioCentrum-DTU
Section of Biochemistry and Nutrition
Technical University of Denmark
Building 224, Sølvtofts Plads
2800 Kgs. Lyngby
Denmark

i
Preface
This thesis has been submitted as partial fulfilment of the requirement for a Ph.D. degree at the
Technical University of Denmark. The work has been done at Biochemistry and Nutrition Group,
BioCentrum-DTU and ALK-Abelló A/S. I would like to thank my supervisors Susanne Jacobsen
and Henning Løwenstein for giving me the opportunity to do this project and for all the work they
have done for me.
I specially wish to thank Ib Søndergaard, Henrik Ipsen, and Jørgen Nedergaard Larsen for
enthusiastic discussions and the comments on the project and the thesis. If I were not with them, I
would need a couple of more years to finish this Ph.D. project. I also would like to thank Charlotte
Hejl for bridging the communication between the company and me when I worked at DTU. And
also thank her for the helpful suggestion on the project. I want to thank Helene Henmar for the
introduction of CD technique and the help on the experiments and data analysis. Mercedes Ferreras
are greatly appreciated for the great discussion and references.
I want to thank Marianne K. Pertersen, Ljljana Nesic, Gitte Nordskov Hansen, and Lotte Friberg for
the help in the labs. Susanne Warng Bruun is greatly appreciated for discussions of the same
interest—infrared and that we have been able to support each other. I would like to thank all the
people in the research department, ALK-Ablleó A/S and at Biochemistry and Nutrition Group,
BioCentrum-DTU for kind help and the beautiful working environment. And also thank all the
Danish and Chinese friends for your help during these years.
At last, but not the least, I would like to thank my pretty wife Xuxin and my lovely daughter Xinyi
for all your love and supports.
Yiwu Zheng
June 2006, Denmark
ii
Summary
Aims of this thesis
The research described in this thesis is to extend our knowledge on the properties of vaccines and
antigens using fast and cheap infrared techniques. FTIR-ATR spectroscopy is applied to elucidate
the structural changes when antigen is adsorbed by aluminium hydroxide and when it is
subsequently released. The structural stability during the storage and heating process is investigated
as well. The alterations of other parameters, such as adsorption, release, and pH are also
investigated during the storage. FT-NIR is applied as a fast and non-destructive method to
determine the residual moisture content in lyophilized vaccines and to classify and identify different
vaccine products.
Organization of this thesis
In Chapter I, the background of the project and the introductions to infrared spectroscopy as well
as chemometrics are given respectively. In Chapter II, the current techniques for protein structure
analysis have been discussed, especially the FTIR-ATR method.
In Chapter III, the structural changes of two model antigens are investigated when they are
adsorbed by aluminium hydroxide and the structures refold to their native state when they are
released from adjuvant. The mechanism of the adjuvant enhancing the immune response is
discussed in this chapter too.
Chapter IV describes the structural stability of adsorbed model antigens in thermal and aging
process in comparison to the antigens in solutions. The results indicate that aluminium hydroxide
can protect the structure of antigens against aggregation at high temperature and/or after long period
storage. It is more pronounced for BSA. Further study is required to confirm if the protection is
protein specific.
Chapter V gives the alterations of model vaccines during storage at two different temperatures. It
demonstrates that the change of adsorption capacity by aluminium hydroxide during the storage is
protein specific. The release of adsorbed protein from adjuvant decreases as a function of storing
time. The pH and NIR absorbance also change. The aging effects undergo faster modification at 37
ºC than 4 ºC during the storage. The rotation effects when preparing vaccines are also discussed in
this chapter as well.
NIR method for determination of residual moisture content of lyophilized allergen vaccines is
iii
introduced in Chapter VI. Five different allergen vaccines are analyzed. Acceptable calibration
model (RMESEP 10.20 μg H2O / vial with 2 PLS factors) is obtained for multi-products data. The
models based on product-specific data are slightly better (Appendix B). However, a general multi-
products model is more attractive since one model can predict all samples. The reference data which
are measured by Karl Fischer titration are presented in Appendix A.
NIR spectroscopy is applied to classify and identify five different allergen vaccines (the information
of samples in Appendix C) at different concentrations of antigens and different batches in Chapter
VII. The results show that NIR spectroscopy can be used to classify different allergen vaccines at
highest antigen concentration (100,000 SQ) without api. The highest concentration products can be
separated from other low concentrations. The discrimination of different batches may also be
possible but need further experiments to confirm this. All SIMCA results are given in Appendix C
to Appendix S.
iv
Resumé
Hensigt med afhandlingen
Forskningsarbejdet, beskrevet i denne afhandling, skal øge vores viden om vacciners og antigeners
egenskaber ved hjælp af hurtige og billige infrarød-teknikker. FTIR-ATR spektroskopi benyttes til
bestemmelse af strukturændringer, når antigen adsorberer til aluminium hydroxid, og når det
efterfølgende frigives. Den strukturelle stabilitet under opbevaringen og under
opvarmningsprocessen undersøges ligeledes. Desuden undersøges ændringer i andre parametre,
såsom adsorption, frigivelse og pH, under opbevaringen. FT-NIR benyttes som en hurtig og ikke-
destruktiv metode til at bestemme resterende fugtindhold i frysetørrede vacciner og til at
klassificere og identificere forskellige vaccineprodukter.
Organisering af afhandlingen
I kapitel I er baggrunden for projektet samt introduktion til infrarød spektroskopi og kemometri
beskrevet. I kapitel II er de nuværende teknikker til protein-struktur-analyse, især FTIR-ATR
metoden, blevet diskuteret.
I kapitel III er undersøgt strukturændringer af to model antigener ved adsorption til aluminium
hydroxid samt deres foldning tilbage til nativ tilstand ved frigivelse fra adjuvanten. Mekanismen for
den immunfremmende effekt af adjuvanten er ligeledes diskuteret.
Kapitel IV beskriver strukturel stabilitet af adsorberet modelantigen i termiske- og
aldringsprocesser sammenlignet med antigener i opløsning. Resultaterne indikerer at aluminium
hydroxid kan beskytte strukturen af antigenet mod aggregeringen ved høj temperatur og/eller lang
tids opbevaring. Dette er mest udtalt for BSA. Yderligere studier kræves for at bekræfte om denne
beskyttelse er protein-specifik.
Kapitel V omhandler ændringen af modelvacciner under opbevaring ved to forskellige
temperaturer. Det demonstrerer at ændringen i aluminium hydroxids adsorptionskapacitet under
opbevaring er protein-specifik. Frigivelse af adsorberet protein fra adjuvanten nedsættes som
funktion af opbevaringstid. Ligeledes ændres pH og NIR-absorbansen. Aldringseffekterne
gennemgår hurtigere modifikationer med opbevaringstiden ved 37 oC end ved 4 oC.
Rotationseffekter under fremstilling af vacciner diskuteres også i kapitlet.
NIR-metoden til bestemmelse af resterende fugtindhold i frysetørrede allergenvacciner introduceres
i kapitel VI. Fem forskellige allergenvacciner analyseres. Acceptable kalibreringsmodeller (RMSEP
v
10.20 μg H2O/ flaske med 2 PLS faktorer) er opnået for multi-produkt data. Modellerne baseret på
produktspecifikke data er lidt bedre (Appendiks B). Imidlertid er en generel multiprodukt-model
mere attraktiv idet en enkelt model kan forudsige alle prøverne. Referencedataene som måles ved
Karl Fischer-titrering præsenteres i Appendiks A.
NIR spektroskopi benyttes til at klassificere og identificere fem forskellige allergenvacciner
(information om prøverne ses i Appendiks C) ved forskellige koncentrationer af antigener og
forskellige batcher i kapitel VII. Resultaterne viser at NIR spektroskopi kan benyttes til at
klassificere forskellige allergen vacciner ved højeste antigenkoncentration (100,000 SQ) uden api.
Produkter ved den højeste koncentration kan adskilles fra produkter ved lave koncentrationer.
Diskrimineringen af forskellige batcher kan også være mulig. Dette mangler dog at blive bekræftet.
Alle SIMCA-resultater gives i Appendiks C til Appendiks S.
vi
Publications include in this thesis
1. Yiwu Zheng, Xuxin Lai, Henrik Ipsen, Jørgen Nedergaard Larsen, Henning Løwenstein, Ib
Søndergaard and Susanne Jacobsen. Characterization of the structural changes of model
antigens using FTIR-ATR. Submitted to Vaccine 2006.
2. Yiwu Zheng, Xuxin Lai, Henrik Ipsen, Jørgen Nedergaard Larsen, Henning Løwenstein, Ib
Søndergaard and Susanne Jacobsen. The structural stability of model antigens adsorbed by
aluminium hydroxide in heating and aging processes in comparison to the antigens in
solutions. Submitted to Vaccine 2006.
3. Yiwu Zheng, Xuxin Lai, Henrik Ipsen, Jørgen Nedergaard Larsen, Henning Løwenstein, Ib
Søndergaard and Susanne Jacobsen. Stability of model vaccines during storage analysed by
NIR spectroscopy. Submitted to Vaccine.
4. Yiwu Zheng, Xuxin Lai, Henrik Ipsen, Jørgen Nedergaard Larsen, Henning Løwenstein, Ib
Søndergaard and Susanne Jacobsen. Determination of residual moisture content of
lyophilized allergen vaccines by NIR spectroscopy. Will be submitted to Applied
Spectroscopy 2006.
vii
Abbreviation list
3D, three dimensional;
ACA, aluminium-contained adjuvants;
ADT, accelerated degradation test;
ATR, attenuated total reflection;
BSA, bovine serum albumin;
BLG, β-Lactoglobulin;
CD, circular dischroism;
EMSC, extended multiplicative scatter correction;
FT, Fourier transform;
FTIR, Fourier transform infrared spectroscopy;
FSD, Fourier self-deconvolution;
KF, Karl Fischer;
MIR, mid infrared;
MSC, multiplicative scatter correction;
MVA, multivariate data analysis;
NIR, near infrared;
NMR, multidimensional nuclear magnetic resonance;
PCs, principal components
PCA, principal component analysis;
PCR, principal component regression;
PBS, phosphate buffer;
PLS, partial least squares;
RMC, residue moisture content;
RMSE, root mean square average;
RMSED, root mean square error of deviation;
RMSEP, root mean square error of prediction;
SIMCA, soft independent modelling of class analogy;
SIT, allergen-specific immunotherapy;
SNR, signal to noise ratio;
SNV, standard normal variate.

viii
Table of contents Preface......................................................................................................................................... i
Summary .................................................................................................................................... ii
Resumé...................................................................................................................................... iv
Publications include in this thesis ............................................................................................. vi
Abbreviation list....................................................................................................................... vii
Table of contents..................................................................................................................... viii
Chapter I: Background of the project and the introductions to infrared technology and chemometrics
.................................................................................................................................................... 1
Chapter II: Protein structure and protein structure analysis..................................................... 23
Chapter III: Characterization of the structural changes of model antigen when it is absorbed onto
and released from aluminium hydroxide using FTIR-ATR..................................................... 39
Chapter IV: The structural stability of model antigens adsorbed by aluminium hydroxide in heating
and aging processes in comparison to the antigens in solutions .............................................. 62
Chapter V: Stability of model vaccines during storage analysed by NIR spectroscopy.......... 82
Chapter VI: Determination of residual moisture content of lyophilized allergen vaccines by NIR
spectroscopy........................................................................................................................... 100
Chapter VII: Classification and identification of lyophilized allergen vaccines by NIR spectroscopy
................................................................................................................................................ 116
Chapter VIII: Conclusions and perspectives.......................................................................... 130
Appendices............................................................................................................................. 133
1
Chapter I: Background of the project and the introductions to infrared technology and chemometrics
This chapter describes the background and purpose of this study, as well as infrared technology and
chemometrics, which are the core technologies used in this work.
1 Background
Two public health interventions, clean water and vaccines, have had the greatest impact on the
world’s health. Vaccines prevent disease or death for millions of individuals every year [1]. Vaccine
manufacturers and public authorities, e.g. World Health Organization (WHO), have established
ambitious goals for enhancing present vaccines and for developing new ones. New vaccine
candidates have emerged over the past years against allergic, infectious, autoimmune diseases, and
for cancer and fertility treatment as well [2].
In the case of allergy, the prevalence of hypersensitivity reactions increases rapidly, especially in
developed countries. Allergic diseases concern approximately 30% of the population, thus they
become a serious clinical and social problem [3]. Allergic diseases such as asthma, atopic
dermatitis, allergic rhinitis and conjunctivitis belong to inflammatory disorders, which can be
treated using anti-inflammatory drugs. Although efficient in symptom control, this treatment is not
a causal method and the WHO recommends combination treatment considering immunotherapy [4].
The conventional allergen-specific immunotherapy (SIT) protocol was introduced by Noon and
Freeman in 1911 [5], when they injected an extract of grass pollen to a person whose allergic
symptoms coincided with the pollination of grass. Since then, controlled studies have shown that
SIT is effective in patients with allergic diseases. SIT involves repeated administration of gradually
increasing quantities of specific allergens to an allergic patient until a dose is reached that will raise
the patient’s tolerance to the allergen. Among the current approaches in allergy therapy, SIT is the
only treatment that may affect the course of allergic diseases and it also may prevent the
development of asthma in patients with allergic rhinitis [4]. The mechanisms of SIT have been
reviewed elsewhere [4]. A successful SIT is dependent on the use of high quality allergen vaccines
that are properly standardized and can be manufactured consistently.
Vaccine is produced by maximum adsorption of antigens onto adjuvants. Beginning in the early 20th
century, researchers experimented with a wide variety of organic and inorganic compounds
including aluminium salts, mineral oil, and killed mycobacteria to improve the immunogenicity of
vaccines, but most of these concepts were never accepted for routine vaccination because of safety
2
concerns, e.g. acute toxicity and the possibility of delayed side effects [2]. These compounds are
called adjuvants, which derived from the Latin verb adjuvare meaning “to help” [2, 6-8]. In brief, an
adjuvant is a substance that, when mixed with an antigen and injected with it, enhances the
immunogenicity of that antigen. Adjuvants are often used to boost the immune response when an
antigen has low immunogenicity or when only small amounts of an antigen are available [9].
Aluminium-contained adjuvants (ACA), first described in 1926 [10], are the only immunologic
adjuvants used in human vaccines licensed in the United States, and are also present in many
veterinary vaccines. They have been administered to hundreds of millions of people with only rare
reports of serious local reactions [11]. Vaccines containing ACA are prepared by two principal
methods [12, 13]: 1) Antigens are adsorbed by aluminium hydroxide or aluminium phosphate. Such
products are termed adsorbed vaccines. The commercial products are prepared by this method. 2)
Antigen solutions are mixed with a solution of KAl(SO4)2.12H2O. These products are termed alum
precipitated vaccines. The alum precipitated vaccines are not applied today, because such
preparations could be highly heterogeneous [12].
Although adjuvants have been used for many years to enhance, accelerate and prolong the specific
immune response towards the desired response to vaccine antigens, the mechanism by which
adjuvant can enhance the immune response and/or exert their activities is still not clear [9]. A few
hypotheses have been proposed elsewhere [2, 6, 9, 12, 14-18], which are briefly introduced here.
• The first hypothesis is known as the “depot effect”. It is based on the lower solubility of
aluminium-protein complex compared to the free protein solution. Vaccine antigen is
released slowly after administration, which results in a sufficient time to induce a significant
immune response [2, 6, 9, 12, 14-18].
• The physical appearance of the antigen is defined by the adjuvants in the vaccine [2].
• Adjuvant may target the distribution of antigens to specific cells. And it may regulate both
quantitatively and qualitatively aspects of the ensuing immune responses [2].
• Adjuvant itself can stimulate immune response since it is associated with e.g. cytokine
production [12, 14].
• The particles of size from 5 to 10 μm are more easily phagocytosed by macrophages,
dendritic cells, and neutrophils, than other particles. These are the size for most aluminium-
protein complexes [9, 14, 15].
• Protein may be destabilized by adsorption of adjuvants. The adsorbed protein, once inside
cells, would be more prone to degradation than the free protein. In this way the protein is
3
processed faster and thereby quickly reaches the outer membrane of antigen presenting cells
[15].
• Adjuvants can protect the antigen from degradation and elimination [2].
Thus, adjuvants may enhance the immune response as a result of multiple factors. Individual
antigens vary in their physical, biological and immunogenic properties and thus antigens may have
different needs for help from an adjuvant [2]. Whatever the case, the structure of protein antigen is
of great importance because it results in the functions of protein. It may also important to stimulate
an immune response. There is little knowledge about the structure when protein antigen is adsorbed
by ACA and after it is released, as well as on the stability of adsorbed protein antigens during
storage and the effect of temperature variation. However, the stability of proteins has become
recognized as a major problem in the past decades. Denatured and/or aggregated protein will not
only be therapeutically inactive, but also may cause unpredictable side effects, such as acute
toxicity [19, 20].
1.1 Objective of the project
In order to produce high quality vaccines and manufacture consistently and to well understand
antigens and vaccines, the study focuses on the structures of model antigens when they are adsorbed
by aluminium hydroxide and when they are subsequently released. The mechanism of ACA
enhancement of immune responses is also discussed. The stability of vaccines is investigated during
storage and temperature variation. And finally, a fast, non-destructive method is also introduced for
the determination of the residual moisture content and classification of lyophilized allergy vaccines.
2 Introduction to infrared spectroscopy
The human eyes only respond to electromagnetic radiation within a range of wavelengths between
400-700 nm, i. e. the visible spectrum. However, the electromagnetic spectrum extends from the
extremely short wavelength of gamma radiation to the long wavelength of radio waves. Infrared
refers to that part of the electromagnetic spectrum between the visible and the microwave regions.
The infrared region is divided into three regions: near, mid, and far infrared. Near infrared (NIR)
radiation is in the wavelength range of 780-2500 nm or 12,821- 4,000 cm-1, and the mid-infrared
(MIR) radiation is in regions from 2500 nm to 25000 nm or 4000- 400 cm-1. MIR chemists prefer to
use the wavenumber (cm-1) designation, whereas in NIR, most people use wavelength in
nanometers (nm).
The NIR radiation was discovered in 1800 by Herschel [21], who separated the electromagnetic
4
spectrum with a glass prism and found that the temperature increased markedly beyond the red, i.e.
in the region that is called NIR today. Coblentz [22] recorded the first MIR spectrum in 1900, and
the first commercial IR spectrometer emerged in the 1950s. From then on, MIR spectroscopy has
been accepted as a research tool and structure-elucidation techniques in the industrial as well as the
academic environment, especially from the availability of the first commercial Fourier transform
infrared (FTIR) spectrometer in 1970 [23]. A number of NIR experiments were carried out in the
early 1920s. The general attitude was that the NIR region was too confusing with many weak bands
and overlapping peaks of numerous overtone and combination bands. Compared with the MIR
absorption, NIR features were very weak and because of the overall complexity, baselines were
hard to define. The seemingly hopeless results led to neglect of NIR. The re-birth of the NIR
occurred in the early 1970s when Norris coupled a spectrometer to a computer and employed it to
unravel the reflectance spectra of cereals [24]. In recent years, with the personal computers and new
optical techniques rapidly developing, NIR spectroscopy has become an indispensable tool for
academic research and industrial quality control in a wide field of applications ranging from
chemistry to agriculture and from life science to environmental analysis. More detailed information
on the applications of NIR spectroscopy in chemistry, polymers and textiles, agricultural and
foodstuff, medical sciences, industrial process control, as well as pharmaceutical industry can be
found elsewhere [25, 26]
2.1 Theory
Unless stated otherwise, the description of theory is taken from the handbooks or from personal
experience. The detailed information also can also be found in these books [27-29].
NIR and MIR are closely related technologies. Both analyze functional group vibrations of organic
molecules by monitoring their absorption of radiation as a function of frequency in the infrared
spectrum [23]. Infrared radiation is absorbed by the sample when the frequency corresponds to its
molecular vibrational transitions. Molecular vibrations give rise to absorption fundamental bands
generally located in the MIR range. The NIR region contains adsorption bands corresponding to
overtone and combinations of fundamental bands. The difference between NIR and MIR is only the
frequency of these vibrations.
The frequency of a bond can be approximated by Hooke’s law. In this approximation, two atoms
and the connecting bond can be treated as a simple harmonic oscillator composed of two atoms
joined by a spring. According to Hooke’s law, the frequency of the vibration of the spring is related
to the mass and the force constant of the spring, by the following formula (Eq. 1.1):
5
μπν k
21= Eq. 1.1
where ν is the frequency of the vibration; k is the force constant; μ is the reduced mass and can be
given by:
MmmM+
=μ Eq. 1.2
where m and M are masses of atoms.
In the classical harmonic oscillator, vibrational energy can be given as follow formula:
νhE = Eq. 1.3
Where h is Planck’s constant, 6.6 × 10⁻³⁴ Js.
However, vibrational motion is quantized, and must follow the rules of quantum mechanics.
νhnE )21( += Eq. 1.4
where n is the quantum number: 0, 1, 2, 3…
Therefore, the lowest energy level is νhE21
0 = . At ambient temperature, most molecules are at this
ground level 0E , and the most observed transition is from this level to the next level. The transitions
with 1=Δn are called fundamental transitions, which match the energy of radiation in the MIR
region. The occasional transitions with ,2=n 3 , or higher are observed, which are designated as
‘hot bands’.
However, a molecule is actually an anharmonic oscillator. Transition with 2Δ=n , 3Δ or higher are
possible in this anharmonic oscillator. These correspond to bands called overtones in the NIR
region. The vibrational energy levels become more closely spaced with increasing interatomic
distance in the anharmonic oscillator. The allowed transitions become smaller in terms of energy.
Thus, overtones can be lower in energy than predicted by the harmonic oscillator theory. The
energy level can be expressed as following formula:
,....2,1,0,)21()
21( 2 =+−+= nnhvxnhvE Eq. 1.5
where x is the anharmonicity constant, which is from 0.01 to 0.05, and it accounts for dissociation of
atoms and repulsion between atoms.
For most chemical bonds the frequency of overtones can be estimated from their fundamental
vibrations with the anharmonicity constant by following equation:
6
)1(0 nxnx Δ−Δ= νν Eq. 1.6
Where xv is frequency of x overtone; 0v is frequency of fundamental vibration; x is the
anharmonicity constant.
Combination band appear between 1900 nm to 2500 nm in NIR region. It is the result of
fundamental vibration interactions, i.e. when the energy of an adsorbed photon is shared by two or
more fundamental transitions. The frequency of a fundamental band is the sum of multiples of each
interacting frequency.
It should be noted that bonds which do not involve hydrogen do not have absorption in NIR region.
It is because hydrogen atom is the lightest and thus exhibits the largest vibrations and greatest
deviations from harmonic behaviour. Another reason is that most X-H fundamentals absorb at
wavelength < 5000 nm, which results in their first overtone appear in NIR region. Some polar
bonds, However, such as C-O, C=O, and C-F, have intense fundamental bands in the MIR region
resulting from their absorption at wavelength > 5000 nm. The absorption bands of these bonds in
the NIR region are very weak and can be neglected due to the intensity loss. NIR absorption bands
are typically broad, overlapping and 10-100 times weaker than their corresponding fundamental
MIR absorption bands, since the probabilities of overtone and combination transitions are low. The
low absorption coefficient in NIR, however, permits high penetration depth, which allows direct
analysis of strongly absorbing and highly scattering samples and makes sample preparation
unnecessary.
Despite their common fundamental basis, the instrumentation used in the two fields has traditionally
been quite different.
2.2 Sample presentation
Sample presentation is one of the important factors affecting measurements using infrared
spectroscopy. The sample presentation methods for NIR and MIR are different due to the different
extinction coefficients. NIR cannot be used for trace analysis as the mid-IR. However, this
disadvantage becomes important when considering process analysis. The strong light source and
weak absorbance allow NIR radiation to penetrate further into the sample, which make it possible to
measure intact solid samples. An appropriate sample presentation improves the accuracy, precision
and sensitivity of the spectroscopic measurements, especially when measuring solid sample due to
scatter effects. Selecting the sample presentation for infrared spectroscopic analysis mainly depends
on the physical conditions of samples and target parameters. Although there are some general
7
guidelines for sample presentation, the proper method is a case by case decision.
2.2.1 NIR sample presentation
A detailed description of NIR sample presentation can be found elsewhere [26, 30-32].
Transmittance
In this case, the light source and the detector are positioned opposite of each other and the incident
light has to pass through the whole sample to be detected. Therefore, the light intensity should be
high enough to penetrate the sample, which depends on the absorption coefficient of the sample and
the sample thickness. In general, it is widely applied for the liquids, solutions, and can also be used
for suspensions, or some solids such as tablets and capsules. Limitations are observed with very
thick solid samples [26].
Diffuse reflectance
Diffuse reflectance mode is used for solid samples and requires a different spectrometer
configuration comparing to transmittance mode. The light source and the detector are on the same
side in an angle of 45 ºC to each other. The configuration minimizes the contribution to
measurement of the specular reflectance, which contains little information about composition of
samples. The incident light reaches the surface of the sample. It penetrates some millimeters
depending on structure, particle size and other properties of the sample. Some light is absorbed by
the sample and the rest is reflected, but only a part reaches the detector. Therefore, for low
concentration applications, one can use a larger or multi-channel detector to increase the sensitivity.
Transflectance
Transflectance was originally developed by Technicon for the Infraanalyzer, which combines
transmittance and reflectance. Incident light is transmitted through the sample and then scattered
back from a reflector, which is normally made of ceramic or aluminium. Since the incident light has
to pass through the sample twice, the limitations mentioned under transmittance measurements are
especially relevant.
Interaction
In the case of interaction, a fibre optic probe having a concentric outer ring of illuminator and an
inner portion of receptor is usually used. The end of the probe should be on or near (depends on the
applications) the surface of the sample. This mode can be used for online analysis.
2.2.2 MIR sample presentation
The techniques of MIR sample presentation have been developed allowing the analysis of samples
in any physical phase: solid, liquid or gas. The most common methods are transmittance
8
experiments with pressed disks; diffuse reflectance experiments with powder samples, and
attenuated total reflectance (ATR) measurements with aqueous solutions and hydrated suspensions.
These presentation methods are briefly discussed here focusing on structural analysis of proteins.
Different methods may not provide the same information about protein structures. Weet and co-
workers [33] demonstrated the effect of sampling methods on the protein conformation.
Transmittance
This is the simplest and most common method of FTIR measurement. Solid samples are diluted to
1-2% in a medium (usually KBr) and made into a disk with a certain pressure. The final sample is a
thin, clear disk that is placed perpendicular to the infrared beam. Water must be removed from the
system; thus, samples are heated to remove as must water as possible prior to dilution. Although the
high-pressure affects the structure of proteins in aqueous solution [34, 35], the current established
procedures for producing KBr-pellets does not induce protein structural changes [36-38]. For
sample solution, the spectra can be measured in a special liquid cell with CaF2 windows. The
pathlength has to be approximately 6 μm to allow for precise subtraction of the strong water band
around 1640 cm-1 which overlaps the protein amide I bands. Experiments measured in transmission
can provide quantitative information more easily than other sampling methods, since Beer-Lambert
Law is directly applicable. The pathlength is known. However, heating samples during water
removing may lead to structural changes in the sample.
Diffuse reflectance
This technique is only suited for powder samples. Measurements can be conducted for raw samples
(without dilution) or diluted with non-absorbing matrix such as KBr. Samples do not need to be
pressed into a disk as measured in transmission, but can be packed directly onto the sample holder.
This avoids the high-pressure during the pellet preparation. However, samples have to necessarily
ground with a mortar and pestle to avoid large particles that may distort the spectrum. Regardless of
the sample preparation, the diffuse reflectance spectra are different from the data which are
collected in transmission mode experiments. Peak intensities at higher wave number are typically
compressed, and all peaks tend to be rather rounded compared with sharp peaks from pressed disks.
This can be solved using a mathematical correction known as the Kubelka-Munk equation, which is
usually available from the software used to control the FTIR. One thing that has to be noted is that
samples should be dried and may need to be diluted with a matrix if the absorption is overloaded.
ATR
ATR (also called internal reflection element or briefly IRE) is a versatile and powerful technique
9
for MIR sampling. Minimal or no sample preparation is usually required for rapid analysis. ATR is
ideal for those materials which are strongly absorbing. In addition, ATR is a useful technique for
providing information about the surface properties or conditions of the material. Materials which
are either too thick or too strongly absorbing to be analyzed by transmission spectroscopy can be
routinely analyzed using ATR. With the ATR technique, it is possible to measure a wide range of
samples. Basic details of ATR are reviewed elsewhere [39, 40].
When using ATR, it is important to have the sample in intimate contact with the crystal. For solids,
it is important to use a pressure device which presses the sample against the crystal. Paste or slurry
samples are problematic, but the analysis becomes easy when measuring films by evaporating the
solvent from the samples. The intimate contact is easily achieved with most liquids since they wet
the surface of the ATR crystal. In addition, a clear advantage of ATR spectra of solutions is the
reproducibility of the pathlength comparing to the transmission experiments, in which a very thin
cell (6 μm) is applied to deal with a reasonable absorbance in transmission experiments. Such small
pathlength is difficult to reproduce with sufficient accuracy. Liquid samples can also be analyzed as
films by evaporating the solvent, which minimize the effect of water absorption [41].
The FTIR-ATR spectra depend on the following parameters: wavelength of the incident radiation,
refractive indices of the internal reflection element and the sample, angle of incidence and
efficiency of the contact between sample and the crystal. In particular, strongly distorted spectra
result from an unwise choice of the incidence angle, from the nature of the internal reflection
element and from the thickness of the sample (pathlength).
Since the ATR spectra depend on the refractive index, the spectra may be distinctly different from
the absorption bands. How much the band shapes and intensities are different from absorption
spectra depend on the experimental conditions. However, these differences are due to the particular
nature of the reflection spectrum and should not be confused with distortion of a true spectrum.
Furthermore, it is a possibility to quantify concentrations even for components which are not
absorbing within the spectral range of investigation [42]. A disadvantage, which should be noted, is
that the spectrum may be affected by the adsorption by the ATR crystal [43] and the anomalous
dispersion of sample on the surface of ATR [44, 45].
2.3 Quantitative analysis using infrared spectroscopy
In transmission mode, the basic theory of quantitative analysis results from the Beer-Lambert Law
(Eq. 1.7). It says that the absorbance of a homogeneous sample (with an extinction coefficientε ) is
proportional to the concentration c and pathlength l. The law is defined only for transmittance
10
measurements on homogeneous samples using data that has been corrected for non-absorption
effects.
clTA ε== )/1log( Eq. 1.7
The theory of reflectance is not clear, because people have not found a way to determine the
pathlength followed by the radiation energy in the sample. In addition, we do not yet have a good
model for the way radiation interacts with the sample at particle interfaces. What we know is that
reflection is non-linear with respect to the constituent concentrations. However, even though the
theory of reflectance is not clear, it is widely applied in infrared spectroscopic measurements.
3 Introduction to Chemometics
Infrared spectra are typically composed of broad overlapping bands, and the absorption bands
contain both chemical and physical information of all sample components. The interesting
information is always multivariate in nature, and thus, hardly selective [46]. The spectral data
always contain more variables than samples and have correlated variables. The classical multiple
linear regressions are not suitable in this case [47]. Therefore, Cheometrics (also known as
multivariate data analysis, MVA) is required to extract useful information and reduce the irrelevant
information. Cheometrics can be defined as the development and application of mathematical and
statistical methods to extract useful chemical information from chemical measurements [48, 49].
Chemometircs was emerged in the late of 1960s and developed during 1970s and was introduced to
spectroscopic data in this period [49]. The whole idea of chemometrics is that the data contain
redundant information and can be reduced substantially. The reduced data are easier to understand
and have more stability and residuals contain noise and less useful information [50]. The new latent
variables in the reduced data set provide an overview of the main variation in the raw data. The
outliers can be identified and the noise can be separated from the signal as well [51].
In the following sections, the basic methods of Chemometrics and some methods for pre- treatments
of mathematical data are briefly introduced. These methods are used throughout this work for
analysis of NIR and MIR spectroscopic data.
3.1 Data pre-treatment
Visualization of data has always been very important in Chemometrics and it is impossible to
discuss Chemometrics without showing plots of data [50]. However, raw data often need prior
treatment to mathematically remove defects due to light scattering, path length variations and
random noise. Careful selection of the method of pre-treatments can significantly improve the
11
robustness of the final calibration model. The most commonly used methods in this thesis are
briefly discussed with respect to the effect they are able to correct. The detailed description is
available in textbooks [52] and in the introduction to the Unscrambler software.
Standard normal variate (SNV)
SNV removes the multiplicative interference of scatter and particle size. The method removes slope
variations for individual spectra. Each spectrum is transformed independently as the function of:
∑ −−
−=
)1/()( 2,nxx
xxx
i
isnvi Eq. 1.8
Where, xi,snv is the transformed spectrum; xi is the original spectral; x is the average value of the
variable; and n is the number of the variables in the spectrum. In other words, SNV transformation
is row centring followed by row scaling [53].
Multiplicative scatter correction (MSC)
MSC is used to correct for the significant light scattering problems. It is used based on the
assumption that all samples have same scatter coefficient for all variables. A mean spectrum of the
dataset is applied to estimate the scatter of the spectra. Other spectra are corrected to have the same
scatter level as this mean spectrum. Each spectrum is shifted and rotated to fit as closely as possible
to the mean spectrum. The fit for each spectrum is obtained by least squares as the following
function:
iiiii xbax ε++= 1 Eq. 1.9
Where, xi is individual spectrum. ix is the mean spectrum of the dataset, and iε is the residual
spectrum, which ideally represents the chemical information in the spectrum. The fitted constants ai
(offset, intercept) and bi (slope) are used to correct each value of the spectrum i (Eq. 1.10) and they
reflects additive and multiplicative light scattering effects, respectively.
i
iiMSCi b
axx 1,
−= Eq. 1.10
A disadvantage of MSC is that the obtained parameters may be affected by the chemical variations,
since the mean spectrum is simply used as the ideal chemical spectrum.
Extended multiplicative scatter correction (EMSC)
This method is an extension to conventional MSC and is used to remove unwanted physical
information resulting from light scattering, pathlength variations, and baseline drifts [54]. It allows
a separation of physical light scattering effects from chemical light absorbance in the spectra. The
12
sample spectra are expressed as ideal chemical spectra modified by various physical effects. In the
case of EMSC, Eq. 1.9 is extended with correction for linear and quadratic wavelength effects, i. e.
the wavelength-dependent scatters. It is given in Eq. 1.11, where λ represents the wavelength range;
chemix , is the ideal chemical spectrum.
Eq. 1.11
The parameters in Eq. 1.11 are used to correct each value of the spectrum using Eq. 1.12. The
baseline and pathlength variations as well as wavelength-dependent spectral effect will be removed,
yielding corrected spectra with only chemical absorbance information left.
iiiiicorrectedi bedaxx /)1( 2, λλ −−−= Eq. 1.12
Derivatives
Derivatives have been described in detail by Mark and Workman [55-58]. They are an approach to
addressing two of the basic problems with infrared spectra: overlapping peaks and removing large
baseline shifts. Derivatives are used for MIR spectra as a resolution-enhancement method (see
Chapter II, III, and IV). The effect of derivatives is most clearly seen with the second derivative of a
spectrum, which is able to separate overlapping absorption bands because it is slated to curvature
and has the same sign as the curvature of a spectrum. Second derivative can be used to remove the
baseline shifts, because the curvature of a straight line is zero, the derivative of a spectrum-plus-a-
straight-line-baseline will be the same as the derivative of the spectrum. The first derivative also has
these two effects, but to a lesser extent, and has a geometric interpretation as the slope of the
spectrum at each wavelength. Higher-order derivatives have the same two basic functions as second
derivative, and will resolve overlapping adsorption bands more effectively than the lower-order
derivatives. They will remove gently curved background as well as linear background shifts.
However, they are more sensitive to noise and generate more artefacts than the lower-order
derivatives. Higher-order derivatives do not easily give rise to get visual geometric interpretation
and have not been widely applied in infrared spectra. They have not been shown to give great
advantages in calibration or validation.
There are three common methods to calculate derivatives: Savitzky-Golay, finite-difference, and
Fourier transform. The Savitzky-Golay method fits the spectrum with a polynomial and then takes
the derivative of that polynomial. It is most useful with very sharp absorption bands and with high
noise spectra.
The drawback of the derivative is that it amplifies noise. Therefore, sometimes, it is necessary to
ichemiiiiii xbedax ελλ ++++= ,21

13
smooth the data beforehand.
Smoothing
Smoothing is used to reduce the noise in the data. Savitzky-Golay is an averaging algorithm that fits
a polynomial to the data points. The value to be averaged is then predicted from this polynomial
equation. The number of variables or points has to be chosen in the averaging segment. If the
variable number in the segment is large, it will give a smoother shape to the sample, but if the
segment is too large, sharp peaks may be removed and the remaining bands are distorted [59]. It
should be noted that after the operation the data will be slightly truncated at both ends. If n is the
number of variables in the averaging segment, the first and last n variables will be zero. The order
of the polynomial to be fitted is also important. Typically, a second- or third-order polynomial is
used [58]. A second-polynomial means that a second-degree equation will be used to fit the data
points.
Normalization
Normalization is used to get all data in approximately the same scaling or to get a more even
distribution of the variances and the average values. Normalization of a sample is accomplished by
dividing each variable by a constant. It reduces systematic variation, but normalization may remove
important concentration information.
It is a row-oriented transformation, that is to say the contents of a cell are likely to be influenced by
its horizontal neighbours. There are three types of normalization: 1) mean normalization;
2) maximum normalization; 3) range normalization. Mean normalization is the standard
normalization. Maximum normalization is a normalization that “polarizes” the spectra. The peaks of
all spectra with positive values touch +1, while spectra with values of both signs touch -1. Range
normalization involves scaling all samples to a common range, for example between 0 and +1. Thus
each axis in a plot of range-scaled data is adjusted such that the data fill the region of the plot in all
directions.
Baseline transformation
Baseline transformation includes baseline offset and linear baseline correction. The formula for the
baseline offset can be written as in Eq. 1.13, where xi is a variable and X denotes all selected
variables for a spectrum. For each sample, the value of the lowest point in the spectrum is
subtracted from all the variables. The result of this is that the minimum value is set as zero and the
rest are positive values.
14
)min(, Xxx ioffseti −= Eq. 1.13
Linear baseline correction transforms a sloped baseline into a horizontal baseline. The technique is
performed by pointing out two variables which are set as zero and as a new baseline. The rest of the
variables are transformed according to this with linear interpolation or extrapolation.
3.2 Principal component analysis (PCA)
The further details of PCA are available elsewhere [50, 60-62]. A brief introduction is given here
based on spectral data. PCA is the basis of multivariate data analysis. The most important use of
PCA is to represent a multivariate data set as a low dimensional space to find interesting
phenomena, often without prior knowledge. As a result, outliers, clustering of objects and gradients
between clusters may be detected [50].
PCA is a mathematical procedure that resolves the data into orthogonal components whose linear
combination approximates the original data. The original data matrix X, consisting of i spectra and
each spectrum having j variables (data-points), is described by two smaller matrices called score T
(i, R) and loading P (j, R) as shown in Eq. 1.14. R is the principal components (PCs) of the PCA
model, which expresses the complexity of the observed variations in the data. The matrices T and P
can be calculated by nonlinear iterative partial least square (NIPALS). The matrix E (i, j) consists of
the difference between the values in the data matrix and the values obtained from the multiplication
of T and LT. It is called residual matrix or error matrix [63].
ETPX T += Eq. 1.14
The obtained scores and loadings can be used in scores plots that allow an efficient interpretation of
the whole data space [50].To discriminate several different materials, score vectors are plotted
against each other. If the vectors form different clusters which are clearly separated from each
other, identification is possible.
3.3 Multivariate calibration for quantitative analysis
The PCs from the PCA are found by successively reducing the residual sums of squares of X (e.g.
NIR spectra) with no consideration to interest Y (e.g. concentration); there is no predictive
optimality that will subsequently be used for regression onto Y. Thus, PCA cannot be used for
quantitative analysis. The multivariate calibration methods most frequently used in quantitative
analysis are principal component regression (PCR) and partial least squares regression (PLSR) [64].
They are the most successful applications of the combinations of Chemometrics with spectral data
15
[50]. PCR uses the PCs provide by PCA to perform regression on sample property. PLS finds the
direction of greatest variability by comparing both spectral (X) and target property (Y) information
with the new axes, called PLS components or PLS factors. The main difference between these two
methods is that the first PC or factor. In PCR, the first factor represents the largest variations in the
spectrum, whereas in PLS it presents the most relevant variations showing the best correlation with
the target property. Therefore, to reach an ideal regression model, PCR needs more PCs than PLS.
PLS relates two data matrices, X and Y, to each other by a linear multivariate model. It models both
X and Y matrices simultaneously to find latent variables in X that will predict the latent variables in
Y. No direct closed mathematical description can be made for PLSR [65], but it may be simply
given in Eq. 1.15. B is the regression coefficients, which is helpful in spectroscopic analyses and
band assignment [66]. The detailed algorithm of PLS can found elsewhere [67].
FXBY += Eq. 1.15
3.4 Soft independent modelling of class analogy (SIMCA)
The detailed theory of SIMCA has already been extensively discussed by others [67-69]. The idea
behind this method is that objects in one class or group show similar behaviour and this approach
allows the objects to display intrinsic individualities as well as their common patterns, but only
common properties of the class are modelled. SIMCA is based on making a PCA model for each
class in the training set. Each class is modelled separately with a certain number of significant PCs.
The number of PCs is normally selected by cross-validation automatically. This can be described in
Eq. 1.16 for one class or group (c) [69].
)()()( ijcT
jRciRccc EPTXX ++= Eq. 1.16
Where cX is the mean centred data matrix, )(iRcT is the score matrix obtained for i objects and R
selected PCs. TjRcP )( is the loading matrix obtained for R selected PCs and j variables and )(ijcE is the
residual matrix.
After the PCA models have been contrasted, the distances between classes e.g. RMSE(X)c can be
calculated as in Eq. 1.17, and also the distance from an object to the specified class e.g. RMSE(X)i,c
can be calculated as in Eq. 1.18.
∑= }/)({)( 2, NXRMSEXRMSE cic Eq. 1.17
)}/({)( ',,,,, RjeeXRMSE RciRcici −= Eq. 1.18
Where, RMSE is the root-mean-square average. N is the sample size of class c. R is the selected

16
PCs, and j is the number of variables of X, The X-residual vector is ei,cR.
The class modes are cross-classified and evaluated. Then a new unknown sample can be classified
by checking if it falls inside the boundaries of any class models and assigned to classes according to
its analogy to the training samples. The detailed methodology of SIMCA is described in [68].
17
References
1. http://www.vaclib.org/news/vaccinelicense.htm Feb. 2006.
2. Guideline on adjuvants in vaccines for human use. The European Medicines Agency.
http://www.emea.eu.int. Feb. 2006.
3. Grzela K, Lazarczyk M, Dziunycz P, Milewski L, Niderla J, Grzela T. Molecular therapy
versus standard treatment in allergy. International Journal of Molecular Medicine, 2004;
14:3-22.
4. Bousquet J, Lockey RF, Malling HJ. WHO position paper. Allergen immunotherapy:
therapeutic vaccines for allergic diseases. Allergy 1998; 53: 1-43.
5. Noon L. Prophylactic inoculation against hay fever. Lancet, 1911; 1:1572-1573.
6. Rogan D, Babiuk LA. Animal health: biologics/biopharmaceutics- novel vaccines from
biotechnology. Revue Scientifique et Technique – Office International des Epizooties, 2005;
24: 159-174.
7. Matheis W, Zott A, Schwanig M. The role of the adsorption process for production and
control combined adsorbed vaccines, Vaccine, 2000; 20: 67-73.
8. Gupta RK, Siber GR. Adjuvants for human vaccines—current status, problems and future
prospects, Vaccine, 1995; 14: 1263-1276.
9. Goldsby RA, Kindt TJ, Osborne BA, Kuby J. Immunology, 5th edition, W.H. Freeman
Company. New York, 2003, p66
10. Glenny AT, Pope CG, Waddington H, Wallace UJ. The antigen value of toxoid precipitated
by potassium alum, Journal of Pathology and Bacteriology, 1926; 29:31-40.
11. Gupta RK, Rost BE, Relyveld E, Siber GR. Adjuvant properties of aluminium and calcium
compounds. In: Powell MF, Newman MJ, editors. Vaccine design: the subunit and adjuvant
approach. New York: Plenum Press, 1995, p229-148.
12. Lindblad EB, Aluminium adjuvants—in the retrospect and prospect, Vaccine, 2004; 22:
3658-3668.
13. Shirodkar S, Hutchinson RL, Perry DL, White JL, Hem SL. Aluminium compounds used as
adjuvants in vaccines, Pharmaceutical Research, 1990; 7: 1282-1288.
14. Morten JM, Rasmus LK. Adsorption of proteolytic enzymes to the adjuvant aluminium
hydroxide, Master’s thesis, BioCentrum-DTU, 2005.
18
15. Jones LS, Peek LJ, Power J, Markham A, Yazzie B, Middaugh CR. Effect of adsorption to
aluminium salt adjuvants on the structure and stability of model protein antigens. The
Journal of Biological Chemistry, 2005: 280: 13406-13414.
16. HogenEsch H. Mechanisms of stimulation of the immune response by aluminium adjuvants,
Vaccine, 2002; 20: 34-39.
17. Cox JC, Coulter AR. Adjuvants—a classification and review of their modes of action,
Vaccine, 1997; 15: 248-256.
18. Alexander J, Brewer JM, Adjuvants and their modes of action, Livestock Production
Science, 1995; 42: 153-162.
19. Weet MVD, Hennink W, Jiskoot W. Protein instability in poly (lactic-co-glycolic acid)
microparticles. Pharmaceutical Research, 2000; 17: 1159-1167.
20. Cleland JL, Powell MF, Shire SJ. The development of stable protein formulations: a close
look at protein aggregation, deamidation, and oxidation. Critical Reviews in Therapeutic
Drug Carrier System, 1993; 10: 307-377.
21. Pasquini C. Near infrared spectroscopy: fundamentals, practical aspects and analytical
applications. Journal of the Brazilian chemical Society, 2003; 14: 198-219.
22. Burns DA. Historical development. In: Burns DA. Ciurczak EW (Eds.), Handbook of near-
infrared analysis. Marcel Dekker Inc. New York, 1992, p 1-6.
23. Doyle WM. Near-IR and mid-IR process analysis – a critical comparison. Axiom Analytical
Inc. www.gozxiom.com/an_911.html.
24. Williams PC, Norris KH, Zarowski WS. Influence of temperature on estimation of protein
and moisture in wheat by near-infrared reflectance. Cereal Chemistry, 1982; 59: 473-480.
25. Siesler HW, Ozaki Y. Kawata S, Heise HM (Eds.). Near-infrared spectroscopy: principles,
instruments, Applications.WILEY-VCH Verlag GmbH, Germany, 2002 p179-328.
26. Reich G. Near-infrared spectroscopy and imaging: basic principles and pharmaceutical
applications. Advanced Drug Delivery Reviews 2005; 57: 1109-1143.
27. Bokobza L. Origin of near-infrared absorption bands. In: Siesler HW, Ozaki Y. Kawata S,
Heise HM (Eds.), Near-infrared spectroscopy: principles, instruments, applications.
WILEY-VCH Verlag GmbH, Germany, 2002, p11-41.
28. Olinger JM, Griffiths PR, Burger T. Theory of diffuses reflection in the NIR region, in:
Burns DA, Ciurczak EW. (Eds.), Handbook of near-infrared analysis, 2nd edition, Marcel
Dekker Inc., New York, 2001, pp 75-84.

19
29. Osborne BG, Fearn T, Hindle PH. Practical NIR spectroscopy with applications in food and
beverage analysis. Longman Scientific & Technical. Harlow, England, 1993, p13-35.
30. Kawano S. Sampling and sample presentation. in: Siesler HW, Ozaki Y. Kawata S, Heise
HM (Eds.). Near-infrared spectroscopy: principles, instruments, Applications.WILEY-VCH
Verlag GmbH, Germany, 2002, p115-124.
31. Sukowski L. NIR based process analytical technology: In-line residual moisture
determination for a complete batch inspection of lyophilized end-products. PhD thesis,
University of Basel, Deutschland, 2003.
32. Pasquini C. Near infrared spectroscopy: fundamentals, practical aspects and analytical
applications. Journal of the Brazilian Chemical Society, 2003; 14: 198-219.
33. Weet MVD, Haris PI, Hennink WE, Crommelin DJA. Fourier Transform infrared
spectrometric analysis of protein conformation: effect of sampling method and stress factors.
Analytical Biochemistry, 2001; 297: 160-169.
34. Prehoda KE, Mooberry ES, Markley JL. Pressure denaturation of proteins: evaluation of
compressibility effects. Biochemistry, 1998; 37: 5785-5790.
35. Tanaka N, Nishizawa H, Kunugi S. Structure of pressure-induced denatured state of human
serum albumin: a comparison with the intermediate in urea-induced denaturation.
Biochimica et Biophysica Acta, 1997; 1338: 13-20.
36. Carpenter JF, Prestrelski SJ, Arakawa T. Separation of freezing- and drying-induced
denaturation of lyophilized proteins using stress-specific stabilization. I: enzyme activity
and calorimetric studies. Archives of Biochemistry and Biophysics, 1993; 303: 456-464.
37. Costantino HR, Nguyen TH, Hsu CC. Fourier-transform infrared spectroscopy demonstrates
that lyophilization alters the secondary structure of recombinant human growth hormone.
Journal of Pharmaceutical Sciences, 1996; 2: 229-232.
38. Costantino HR, Carrasquillo KG, Cordero RA, Mummenthaler M, Hsu CC, Griebenow K.
The effect of excipients on the structure and stability of lyophilized recombinant human
growth hormone. Journal of Pharmaceutical Sciences, 1998; 87: 1412-1420.
39. Goormaghtigh E, Raussens V, Ruysschaer JM. Attenuated total reflection infrared
spectroscopy of proteins and lipids in biological membranes. Biochimica et Biophysica
Acta, 1999; 1422: 105-185.
40. Chittur KK. FTIR/ATR for protein adsorption to biomaterial surfaces. Biomaterials, 1998;
19: 375-369.
20
41. de Jongh HHJ, Goormaghtigh E, Ruysschaert JM. The different molar absorptivities of the
secondary structure types in the amide I region: an attenuated total reflection infrared study
on globular proteins. Analytical Biochemistry, 1996; 242: 95-103.
42. Muller G, Abraham K, Schaldach M. Quantitative ATR spectroscopy: some basic
considerations, Applied Optics, 1981; 20: 1182-1190.
43. Oberg KA, Fink AL. A new attenuated total reflectance Fourier transform infrared
spectroscopy method for the study of proteins in solution. Analytical Biochemistry, 1988;
256: 92-106.
44. Hancer M, Sperline RP, Miller JD. Anomalous dispersion effects in the IR-ATR
spectroscopy of water. Applied Spectroscopy, 2000; 54: 138-143.
45. Max JJ, Chapados C. Influence of anomalous dispersion on the ATR spectra of aqueous
solutions. Applied Spectroscopy, 1999; 53: 1045-1053.
46. Reich G. Near-infrared spectroscopy and imagine: Basic principles and pharmaceutical
applications. Advanced Drug Delivery Reviews, 2005; 57: 1109-1143.
47. Murry I. Scattering information: philosophy and practice of near infrared spectroscopy. In:
Davies AMC, Garrido-Varo A (Eds.) Near infrared spectroscopy: proceedings of the 11th
international conference. NIR publications, Chichester, England, 2004. pp 1-12.
48. Barton FE, Kays SE. Analytical application to fibrous foods and commodities. In: Williams
P, Norris K (Eds.), Near-infrared technology in the agricultural and food industries.
American Association of Cereal Chemists, Inc. St. Paul, Minnesota, USA. 2001, p215-231.
49. Martens H, Martens M. Multivariate analysis of quality; an introduction. John Wiley &
Sons, LTD. 2001, p3-23.
50. Geladi P. Chemometrics in spectroscopy. Part 1: Classical chemometrics. Spectrochimica
Acta Part B, 2003; 58: 767-782.
51. Wold S. Sjostrom M. Eriksson L. PLS-regression: a basic tool of chemometrics.
Chemometrics and Intelligent Laboratory System, 2001; 58: 109-130.
52. Hesise HM, Winzen R. Chemometrics in Near-infrared spectroscopy, in: Siesler HW, Ozaki
Y. Kawata S, Heise HM (Eds.). Near-infrared spectroscopy: principles, instruments,
Applications.WILEY-VCH Verlag GmbH, Germany, 2002, p125-162.
53. Pravdova V, Walczak B, Massart DL, Kawano S, Toyoda K, Tsenkova R. Calibration of
somatic cell count in milk based on NIR spectroscopy. Analytica Chimica Acta, 2001; 450:
131-141.
21
54. Martens H, Nielsen JP, Engelsen SB. Light scattering and light absorbance separated by
extended multiplicative signal correction. Application to near-infrared transmission analysis
of powder mixture. Analytical Chemistry, 2003; 75: 394-404.
55. Mark H., Workman JJ. Derivatives in spectroscopy Part I- The behavior of Derivative.
Spectroscopy 2003; 4: 32-37.
56. Mark H., Workman JJ. Derivatives in spectroscopy Part II- the true derivative. Spectroscopy
2003; 9: 25-28.
57. Mark H., Workman JJ. Derivatives in spectroscopy Part III- Computing the derivative.
Spectroscopy 2003; 12: 106-111.
58. Mark H., Workman JJ. Derivatives in spectroscopy Part IV-Calibrating with derivatives.
Spectroscopy 2004, 1: 44-51.
59. Beebe K, Pell RJ, Seasholts MB. Chemometrics: A practical guide. John Wiley & Sons,
INC. New York, 1998; p 33.
60. Martens H, Martens M. Multivariate analysis of quality. An introduction. John Wiley &
Sons, LTD. 2001, p93-109.
61. Howard M. Data analysis: multilinear regression and principal component analysis, in:
Burns DA, Ciurczak EW (Eds.), Handbook of near-infrared analysis, 2nd edition, Marcel
Dekker Inc., New York/Basel, 2001, p 129-184.
62. Esbensen KH, Multivariate data analysis --in practice. 4th edition, CAMO ASA, 2000, p19-
97.
63. Kramer K, Ebel S. Application of NIR reflectance spectroscopy for the identification of
pharmaceutical excipients, Analytical chimica Acta, 2000; 420: 155-161.
64. Naes T, Isaksson T, Fearn T, Davies T. A user friendly guide to multivariate calibration and
classification. NIR publication, Chichester, 2002, 27-54.
65. Andersson CA. Exploratory multivariate data analysis with applications in food technology.
PhD thesis, the Royal Veterinary and Agricultural University, Denmark. 2000, 15-16.
66. Šašić S, Ozaki Y. Band assignment of near-infrared spectra of milk by use of partial least-
squares regression. Applied Spectroscopy, 2000; 54: 1327-1338.
67. Esbensen KH. Multivariate data analysis – in practice: an introduction to multivariate data
analysis and experimental design. 5th Edition. CAMO ASA/ CAMO Process AS. 2001;
p145.
22
68. Martens H, Martens M. Multivariate analysis of quality: an introduction. John Wiley &
Sons, Ltd. England, 2001; p163-169.
69. Candolfi A, Maesschalck, Massart DL, Hailey PA, Harrington ACE. Identification of
pharmaceutical excipients using NIR spectroscopy and SIMCA. Journal of Pharmaceutical
and Biomedical Analysis, 1999; 19: 923-935.
23
Chapter II: Protein structure and protein structure analysis
This chapter briefly introduces protein structures and the methods used for protein structure
analysis. The main focus of the chapter is on protein structures when adsorbed onto surfaces and
FTIR spectroscopy.
1 Protein structures The primary structure of a segment of a polypeptide chain or of a protein is the amino-acid
sequence of the polypeptide chain, without regard to spatial arrangement [1]. The secondary
structure of a segment of polypeptide chain is the local spatial arrangement of its main-chain atoms
without regard to the conformation of its side chains or to its relationship with other segments [1].
The secondary structures are formed through certain patterns of hydrogen bonding of the peptide
backbone. There are three common secondary structures in proteins, namely α-helix, β-sheet, and
turns. Those segments, which cannot be classified as one of the standard three classes is usually
grouped into a category called ‘other’ or ‘random coil’ [1].
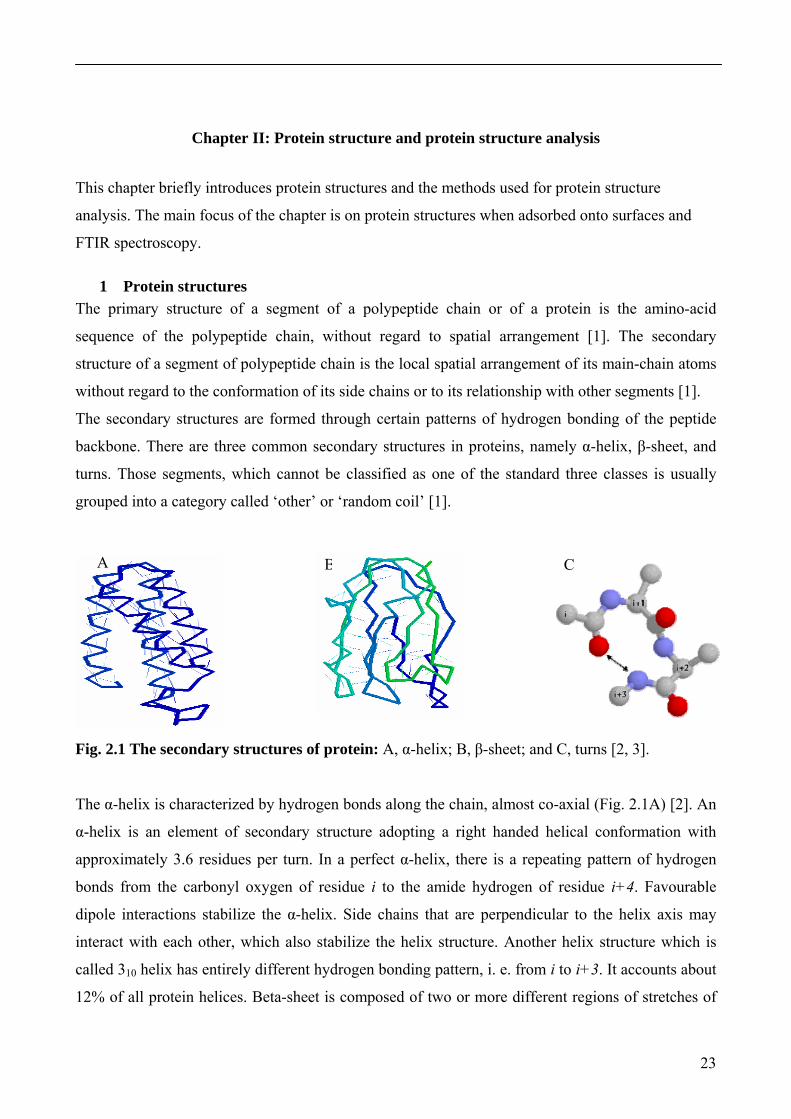
Fig. 2.1 The secondary structures of protein: A, α-helix; B, β-sheet; and C, turns [2, 3].
The α-helix is characterized by hydrogen bonds along the chain, almost co-axial (Fig. 2.1A) [2]. An
α-helix is an element of secondary structure adopting a right handed helical conformation with
approximately 3.6 residues per turn. In a perfect α-helix, there is a repeating pattern of hydrogen
bonds from the carbonyl oxygen of residue i to the amide hydrogen of residue i+4. Favourable
dipole interactions stabilize the α-helix. Side chains that are perpendicular to the helix axis may
interact with each other, which also stabilize the helix structure. Another helix structure which is
called 310 helix has entirely different hydrogen bonding pattern, i. e. from i to i+3. It accounts about
12% of all protein helices. Beta-sheet is composed of two or more different regions of stretches of
A B C
24
at least 5 to 10 amino acids, which are stabilized by hydrogen bonds crossing between chains (Fig.
2.1B) [2]. Beta-sheets include parallel and anti-parallel forms and also the mixture of both β-sheets.
In parallel sheets adjacent peptide chains proceed in the same direction; i.e. the direction of N-
terminal to C-terminal is the same. In anti-parallel sheets adjacent chains are aligned in opposite
directions. The third type of secondary structures is turns. Turns involve 4 amino acid residues
which form a loop. A hydrogen bond is formed between the carbonyl oxygen of residue i and the
amide nitrogen of i+3 (Fig. 2.1C) [3].
The tertiary structure of a protein molecule is the arrangement of all its atoms in space, without
regards to its relationship with neighbouring molecules. The quaternary structure of a protein
molecule is the arrangement of its subunits in space and the ensemble of its inter-subunit contacts
and interactions, without regards to the internal geometry of the subunits.
2 Protein structure analysis Protein structure analysis has gained increasing interests in recent years. The information of protein
structures is important for the understanding of protein function and facilitates pharmaceutical drug
development [4]. The function and activity of proteins depends on their three-dimensional (3D)
structure. However, the 3D structures of proteins do not only depend on the protein molecules
themselves, but result from van der Walls, electrostatic and hydrophobic interactions between the
various amino acids residues and surrounding molecules, as well as the formation of hydrogen and
disulfide bonds [5]. Protein molecules are amphoteric, i.e. they contain both acidic and basic
moieties, and they are amphiphilic molecules, i.e. they contain both hydrophilic and hydrophobic
moieties. This chemical character causes proteins to be easily adsorbed by a wide rage of different
surfaces.
The adsorption of proteins by material surfaces is not only a fundamental phenomenon but is also a
key to several important and novel applications. For examples, the applications of protein
purification and protein analysis by chromatography rely on the protein adsorption [6, 7]. Protein
adsorption is the first step in the integration of an implanted material with tissue [8]. The adsorption
of serum proteins can influence the adhesion of leukocytes, macrophages or platelets, and
ultimately lead to fibrous encapsulation [9]. In pharmaceuticals, vaccines are formulated by protein
antigens adsorbed onto adjuvants to enhance the immune response. Several reviews are available on
physicochemical aspects of the adsorption of proteins onto biomaterials [10-12]. The structure of
protein is often thought to be changed after they are adsorbed by biomaterial surface. The protein-
surfaces interaction involves a large number of dynamic steps, e.g., transport (diffusion) of proteins
25
toward to the surface, reversible attachment, structural rearrangement, irreversible adsorption, and
desorption from the surfaces of adsorbents [13-15]. Direct observation of protein-surface
interaction is presently impossible [5], but progress has been made toward determining protein
structure on a surface and useful structural information can be obtained. Many available techniques
have been introduced [16]. A number of common methods are briefly discussed in this thesis with
regard to the advantages, limitations, sample requirements and especially the application of
measurement of protein adsorption by adsorbents.
X-ray crystallography
This method yields information on the three-dimensional structure of protein molecules [17-19].
However, the main challenges of this method are to form a well ordered single crystals and pure
protein is required, thus, it is not suitable to study the structure of the adsorbed protein, since a two-
dimensional crystal is difficult to obtain [20]. Furthermore, a question arises as to whether the
relatively ‘static’ structure in single crystal adequately represents the protein conformation in a
complex and dynamic environment. Moreover, data interpretation is also complex and time-
consuming.
Multidimensional nuclear magnetic resonance (NMR) spectroscopy
This is another method which can provide full three-dimensional structural determination [21, 22].
NMR is used for measuring sample in solution; the concentration of protein is normally from 2 to
20 mg/ml. This technique is only suitable for the small proteins (~15-30 kDa), since interpretation
of the NMR spectra of large proteins is very complex, and the assignment of inter-proton distances
generated by the NMR experiment is not always feasible [23]. The method for the study of
adsorbed proteins is also severely limited by experimental difficulties; only a few applications have
been reported on protein structural changes and the adsorption of protein on a solid interface [24,
25].
Circular Dischroism (CD) spectroscopy
This is a good method to monitor the secondary and tertiary structure of proteins in solution [26,
27]. Far-UV CD (170-250 nm) spectroscopy is a good tool to obtain overall information on the
secondary structure, i.e., the relative amount of α-helix, β-sheet, turns and random coil. The amount
of α-helix or β-sheet can be estimated after fitting the Far-UV CD spectra to the corresponding
spectra with known secondary structures [28]. The tertiary structure can be measured using near-
UV CD spectroscopy (250 -300 nm), where the spectral characteristics of the aromatic amino acids
are dependent on solvent exposure. Since the aromatic residues tryptophan and tyrosine are also
26
fluorescent, near-UV CD spectroscopy is complementary to the intrinsic fluorescence spectroscopy.
CD spectroscopy has been applied to study the conformation of adsorbed protein both on colloidal
suspension adsorbent and solid macroscopic interfaces. Usually, concentrations of protein in the
range of 0.05 to 1mg/ml are used [25]. The particles of adsorbents should not significantly absorb in
the UV band and should have a refractive index that is close to that of water.
Circular dichroism together with fluorescence spectrometry and Fourier transform infrared
spectroscopy, which will be introduced later, provide global insight into the overall secondary
structure of proteins without being able to establish a precise three-dimensional structure.
Fluorescence spectrometry:
Steady state fluorescence and quenching of fluorescence are useful tools for determination of
secondary and tertiary structure [29-31], although one should be aware that these methods only
reflect local changes in the environments of the fluorophore. Most measurements focus on the
fluorescent amino acid residue, tryptophan. Tyrosine and phenylalanine can also be measured;
however, the intensity is often low. Some proteins contain either no or many trytophan residues,
thus limiting its use to provide detailed structural information. Fluorescence spectroscopy is not
necessarily restricted to the fluorescence of intrinsic fluorophores. Specific residues on the protein
can be labeled with a fluorescent group [32], but this modification of a protein may lead to
structural change. For intrinsic fluorescence measurements, the concentration of protein is usually
above 50 μg/ml.
Fluorescence spectroscopy can be used to measure the system in which suspended adsorbent
particles provide an interface for protein adsorption [32, 33]. In contrast to CD, the wavelengths
used are higher and the concentration of protein and adsorbent used are lower. This drastically
reduces the effect of light scattering in fluorescence spectroscopy compared to CD spectroscopy. In
addition, fluorescence spectroscopy is more sensitive than CD spectroscopy.
3 Protein structure determination using Fourier transforms infrared spectroscopy (FTIR)
The application of FTIR spectroscopy to protein analysis is based on the assessment of the amide
bands. FTIR is a good method to determine the secondary structure of globular proteins [34-36].
Kumosinski et al. [37] demonstrated that the secondary structures of 14 proteins from FTIR
spectroscopy was in excellent agreement with the values calculated from X-ray crystallographic
data. Structural analysis using FTIR offers many advantages over other spectroscopy techniques.
The major advantage is the lack of dependence on the physical state of the sample. Samples may be

27
gas, aqueous or organic solution, hydrated film, inhomogeneous suspension, or solid. The use of
FTIR spectroscopy to analyze the structure of proteins has been extensively reviewed [36, 38-41].
FTIR is particularly suitable for the analysis of adsorbed proteins [42, 43]. It was applied to track
the loss of secondary structure during insulin unfolding on a model lipid-water interface [44],
proteins adsorb to silica surfaces [45-47], different clay surfaces [48], oil-water interface [49], air-
water interface [50], and brushite [51]. The conformation of adsorbed protein depends on properties
of the surface.
3.1 FTIR spectrum of protein
FTIR absorption bands are particularly sensitive to bond angles and hydrogen bands, theoretically,
any specific alteration, peak shifts or intensity change, is caused by the changes in secondary
structure of protein. Each type of secondary structure is thought to absorb at a specific frequency in
FTIR spectrum [38]. The amide groups of polypeptides or proteins exhibit nine vibrational modes
in the infrared region, giving rise to the amide bands A, B, and I-VII [40, 52]. However, due to the
very low intensities, the amide IV-VII bands are not important in mid-infrared region. Only the
amide I, amide II and amide III can be applied to determine secondary structure of proteins [53].
Amide I
The amide I vibration present as an infrared band from 1600 to 1700 cm-1, around 1650 cm-1, arises
mainly from the C=O stretching vibration with minor contributions from the out-of-phase CN
stretching vibration, the CNN deformation and the NH in-plane bend [34, 52]. About 70-85 % of
the band intensity is from C=O stretching and 10-20 % is from CN stretching [34]. The amide I
band is hardly affected by the nature of the amino acid side-chain. It only depends on the secondary
structure of the backbone. Thus, it is best suited to determine the secondary structure of proteins.
Amide II
Amide II vibration is from 1500 to 1600 cm-1, around 1550 cm-1. Amide II is the out-of-phase
combination of the NH in-plane bending (40-60 %) and the CN stretching vibration (18-40 % with
smaller contributions from the CO in-plane bend and the CC and CN stretching vibrations [34]. As
amide I, amide II is hardly affected by side-chain vibrations. However, the correlation between
secondary structure and frequency is less straightforward as compared to the amide I region.
Amide III
Amide III vibration can be seen in the infrared region from 1200 to 1400 cm-1. It is the in-phase
combination of the NH bending and the CN stretching vibration with small contribution from the
CN in-plane bending and CC stretching vibration [34]. Therefore, the amide III band is affected by

28
side-chain, and the backbone vibrations vary considerably, which makes the amide III vibration less
suitable for secondary structure analysis. However, amide III vibration also has an advantage for
secondary structure analysis of protein because of the reduced water effect. Previous studies also
showed that the amide III region can be used to calculate the secondary structures for various
proteins [54-57], although the amide III is much weaker than the amide I band. However, better
band separation allows for curve-fitting without the need of employing resolution-enhancement
methods. Griebenow and Klibanov found that the amide III results and X-ray data were in good
agreement for most proteins [58].
3.2 The correspondence between protein secondary structure and amide bonds
A critical step in the interpretation of infrared spectra of proteins is to assign the component bands
to different types of secondary structures. Theoretical and experimental attempts have been made to
correlate FTIR absorption bands of protein to the secondary structure of protein either in aqueous
state or in solid state. Briefly, bands in the range 1650-1658 cm-1 is generally associated with the
presence of α-helix conformers in aqueous environments. Nevertheless, intensity increase in this
region of the spectrum is hardly assigned to increase in α-helical structure alone, since α-helical
structures overlap significantly with those from random or unordered structure (1645-1652 cm-1)
[59] and loops (1658-1665 cm-1) [60]. When helical proteins are associated with membranes, the
band appears in the range 1656 to 1658 cm-1, whereas in soluble proteins this band occurs at the
lower wave numbers, approximately 1650 to 1655 cm-1 [61].
The β-sheet vibration has been shown in region 1620 to 1640 cm-1. The exact position is affected by
varying strengths of the hydrogen bonding and transition dipole coupling in different β-strands [59].
The possibility of distinguishing between parallel and anti-parallel β-sheets was investigated in a
previous study [62]. Bands around 1662-1690 cm-1 has been assigned as β-turn or turn. Beta-turns
appear at a broad region in the amide I region due to the diversity of its geometries. Moreover, β-
turn with internal hydrogen bonds gives rise to absorption band around 1638-1646 cm-1 [63]. Like
the amide I, the amide II region is also used for investigation of the secondary structure of protein,
but the correspondence between FTIR absorption bands and secondary structure is more complex
than in the amide I region. Bands in the amide II region have not been well studied. Generally,
bands in the range 1540-1550 cm-1 are regarded as α-helix. The β-sheet vibration is at the range
1520-1530 cm-1 [64, 65]. Beta-turns are assigned around 1568 cm-1 [66, 67].
In the amide III region, the protein absorption bands have not been fully understood due to the low
intensity and high contribution from side chain vibrations. Cai and Singh [56] have reported that α-
29
helix bands usually appear in range 1295-1340 cm-1; β-turns gives rise to bands around 1270-1295
cm-1; random structure is at 1250-1270 cm-1; and β-sheet is assigned from 1220 to 1250 cm-1. The
assignments of FTIR bands are given in Tab. 2.1.
Tab. 2.1 Band assignments in the amide I region of FTIR spectrum.
FTIR region Wavenumbers (cm-1) Secondary structure References
1620-1640 β-sheet [59]
1645-1652 Random or unordered [59]
1650-1658 α-helix [59]
Amide I
1662-1690 β-turn [59, 63]
1520-1530 β-sheet [64, 65]
1540-1550 α-helix [64, 65]
Amide II
1568 β-turn [66, 67]
1220-1250 β-sheet [56]
1250-1270 Random [56]
1270-1295 β-turn [56]
Amide III
1295-1340 α-helix [56]
3.3 Water absorption in FTIR spectrum
The absorption bands of a specific component can also be influenced by the contribution of other
compounds. These contributions need to be removed before further analysis of the spectrum. The
most common interfering substance is liquid water, which has three prominent bands centred at
3360 cm-1 (H-O stretching band), 2130 cm-1 (water association band) and at 1640 cm-1 (the H-O-H
bending vibration) [43]. The amide I band for proteins absorption bands overlap directly with a
water bending vibational band at 1640 cm-1. The intensity of the water band at 1640 cm-1 is about
an order of magnitude larger than the amide I bands of proteins and yet precise subtraction of the
water band is possible because of the frequency precision in FTIR spectra.
Techniques have been developed to automatically subtract the water band to obtain information
from the protein. The objective of these techniques is to eliminate the possible individual bias and
uncertainty in the selection of the scale factor due to baseline variations. Powell and co-workers
[68] approached the water subtraction problem through analysis of the change in the region from
1900 to 1790 cm-1 in the protein spectrum as the scale factor for the water spectrum is changed.
30
Dousseau et al. [69] assume that 2125 cm-1 water association band is not affected by the presence of
protein. This assumption works for most proteins except when they are highly charged. The
accuracy of subtraction of the very large water band at 1640 cm-1 is always a concern, but studies
have shown that the positions and intensities of the bands are maintained even with deliberate over
or under subtraction of the water peak [70]. A simple and practical method is to subtract the water
band until the region from 1900 to 1740 cm-1 is flat. This method works well with most proteins and
surface combinations if applied consistently.
3.4 Resolution-enhancement
Compared to NIR spectra, the peaks of MIR spectra are not that broad and overlapped, but it is still
difficult to perform a straightforward analysis of the spectra, especially for complicated samples,
e.g. proteins. Resolution-enhancement methods are applied to solve this problem. However, this
terminology is misleading. Resolution is an instrumental parameter that cannot be changed after the
spectra are collected. These mathematical techniques are more correctly referred to as band-
narrowing procedures.
Fourier self-deconvolution (FSD) and derivation have been used for many years to allow
visualization of overlapping bands [71-74].
FSD requires knowledge of the number of bands, their shapes and parameters, such as position,
band width and intensity. For example, if the chosen band width is greater than the width of the
peak being studied, the result will be side-lobes at the edges of the deconvoluted bands, which can
lead to problems with visualization of weaker neighbouring bands. On the other hand, if the chosen
band width is too small, the deconvoluted spectra will appear unaltered and no additional
information will be gained. Moreover, if the bands are highly overlapped, the results obtained may
be ambiguous and largely dependent on the initial parameters [75]. FSD also reduces the width of
water vapour absorption and enhance noise, producing very sharp peaks with even minimal
deconvolution. Noise and water vapour can very quickly become a problem in deconvoluted
spectra. Thus, FSD should only be performed on spectra with a high signal-to-noise ratio (SNR) and
a low contribution from water vapour [38]. A spectrum may be judged to be water vapour-free if no
sharp absorption is seen from 1700 to 1800 cm-1.
Derivative spectroscopy was introduced by Dong et al. [76], who analyzed the secondary structure
of proteins in aqueous solution. It is mainly employed to identify the number of bands and their
position. The derivative spectra are applied rarely for quantitative studies. The pitfalls that apply to
FSD are also applicable to derivation. Furthermore, derivation suffers from the fact that relative
31
integrated intensities are not maintained. In addition, significant edge effects are possible in
derivative spectra [38, 77]. If the spectrum has a significant slope at the edges of the peak to which
derivation is to be performed, distortions will be introduced at the edges of the derivative spectrum.
This is easily avoided by choosing a wider spectral region for derivative calculation, and the
features at the edges of the extended region should be ignored.
3.5 Disadvantages of FTIR for protein structure analysis
As mentioned above, FTIR cannot provide full three-dimensional structural information of proteins.
The spectrum of a protein may be influenced by water and other components. It also should be
noted that high protein concentration (10-20% w/w) is normally needed for FTIR measurements for
obtaining the SNR necessary for conformational analyses. This is due to the use of small path
length in FTIR measurements [78, 79].
32
References
1. http://www.friedli.com/herbs/phytochem/proteins.html. Feb, 2006.
2. http://bmbiris.bmb.uga.edu/wampler/tutorial/prot2.html. Feb, 2006.
3. http://www.med.unibs.it/~marchesi/proteins.html. Feb, 2006.
4. Zhang C, Kim SH. Overview of structural genomics: from structure to function. Current
Opinion in Chemical Biology, 2003; 7: 28-32.
5. Weert MVD, Hennink WE, Jiskoot W. Protein instability in poly (lactic-co-glycolic acid)
microparticles. Pharmaceutical Research, 2000; 17: 1159-1167.
6. Chase HA, Purification of proteins from feedstocks containing particulate material by
adsorption chromatography in expended beds, Trends Biotechnology, 1994; 12: 296-303.
7. Regnier FE. Chromatography of complex protein mixtures. Journal of Chromatography,
1987; 418: 115-143.
8. Horbett TA, Biological activity of adsorbed proteins. Surfactant Science Series, 2003; 110:
393-413.
9. Shen M, Martinson L, Wagner MS, Castner DG, Ratner BD, Horbett TA, PEO-like plasma
polymerized tetraglyme surface interaction with leukocytes and proteins: in vitro and in vivo
studies. Journal of Biomaterials Science, Polymer Edition, 2002; 13: 367-390.
10. Gray JJ: The interaction of proteins with solid surface. Current Opinion in Structural
Biology, 2004; 14: 110-115.
11. Nakanishi K, Sakiyama T, Imamura K. On the adsorption of proteins on solid surfaces, a
common but very complicated phenomenon. Journal of Bioscience and Bioengineering,
2001; 91: 233-244.
12. Malmsten M. Formation of adsorbed protein layers. Journal of Colloid and Interface
Science, 1998; 207: 186-199.
13. Urano H, Fukuzaki S. Conformation of adsorbed bovine serum albumin governing its
desorption behavior at alumina-water interfaces, Journal of Bioscience and Bioengineering,
2000; 90: 105-111.
14. McGuire J, Krisdhasima V. Surface chemical influences on protein adsorption kinetics.
Food Technology, 1991; 45: 92-96.
15. Wahlgren M, Arnebrant T. Protein adsorption to solid surfaces. Trends in Biotechnology,
1991; 9: 201-208.
33
16. Herron J, Jikoot W, Crommelin DJA (Edts.). Physical methods to characterize
pharmaceutical proteins. Plenum Pub Corp, New York, 1995.
17. Pusey ML, Liu ZJ, Termpel W, Praissman J, Lin D, Wang BC, Gavira JA, Ng JD. Life in
the fast lane for protein crytalliztion and X-ray crystallography. Progress in Biophysics and
Molecular Biology, 2005; 88: 359-386.
18. Jean-Philippe C, Hartmut L. X-ray crystallographic analysis of lipid-protein interactions in
the bacteriorhodopsin purple membrane. Annual Review of Biophysics and Biomolecular
Structure, 2003, 32: 285-310.
19. Tsuda S. Modern NMR spectroscopy and x-ray crystallography: a different approach to
study the structure and its functions of a protein. Journal of the Crystallographic Society of
Japan, 1996; 38: 84-88.
20. Hasler L, Heymann JB, Engel A, Kistler J, Walz T. 2D crystallization of membrane
proteins: rationales and examples. Journal of Structural Biology, 1998; 121: 162-171.
21. Jahnke W, Widmer H. Protein NMR in biomedical research. Cellular and Molecular Life
Science, 2004; 61: 580-599.
22. Mierlo CPMV, Steensma E. Protein folding and stability investigated by fluorescence,
circular dichroism (CD), and nuclear magnetic resonance (NMR) spectroscopy: the
flavodoxin story. Journal of Biotechnology, 2000; 79: 281-298.
23. Surewicz WK, Mantsch HH, Chapman D. Determination of protein secondary structure by
Fourier transform infrared spectroscopy: A critical assessment, Biochemistry, 1993; 32:
389-394.
24. Conejero LF, ParradoJ, Lazuaga A, Smith RAG, Ponting CP, Dobson CM. Stability of the
three domains of streptokinase studied by circular dichroism and nuclear magnetic
resonance. Protein Science, 1996; 5: 2583-2591.
25. Engel MFM. Detailed characterized of adsorption-induced protein unfolding. Ph.D thesis.
http://library.wur.nl/wda/dissertations/dis3563.pdf. Oct, 2005.
26. Bulone D, Martorana V, Biagio PLS. Effects of intermediates on aggregation of native
bovine serum albumin. Biophysical Chemistry, 2001; 91: 61-69.
27. Itri R, Caetano W, Barbosa LRS, Baptista MS. Effect of urea on bovine serum albumin in
aqueous and reverse micelle environments investigated by small angle X-ray scattering,
fluoresecence and circular dichroism. Brazilian Journal of Physics, 2004; 34: 58-63.
34
28. Greenfield NJ. Methods to estimate the conformation of proteins and polypeptides from
circular dichroism data. Analytical Biochemistry, 1996; 235: 1-10.
29. Castelain C, Genot C. Conformational changes of bovine serum albumin upon its adsorption
in dodecane-in-water emulsions as revealed by front-face steady-state fluorescence.
Biochimica et Biophysica Acta, 1994; 1199: 59-64
30. Gelamo EL, Tabak M. Spectroscopic studies on the interaction of bovine and human serum
albumins with ionic surfactants. Spectrochimica Acta Part A, 2000; 56: 2255-2271.
31. Gelamo EL, Silva CHTP, Imassato H, Tabak M. Interaction of bovine (BSA) and human
(HAS) serum albumins with ionic surfactants: spectroscopy and modeling. Biochimca et
Biophysica Acta, 2002; 1954: 84-99.
32. Tan J, Martic P. Protein adsorption and conformational changes on small polymer particles,
Journal of Colloid Interface Science, 1990; 136: 415-431.
33. Clark SP, Billsten P, Elwing H. A fluorescence technique for investigating protein
adsorption phenomena at a colloidal silica surface. Colloid Surf. B-Biointerfaces 2, (1994)
457-461.
34. Barth A, Zscherp C. What vibrations tell us about proteins. Quarterly Reviews of
Biophysics, 2002; 35: 369-430.
35. Byler DM, Susi H. Examination of the secondary structure of proteins by deconvolved FTIR
spectra. Biopolymers, 1986; 25: 469-487.
36. Surewicz WK, Mantsch HH. New insight into protein secondary structure from resolution-
enhanced infrared spectra. Biochemica et Biophysica Acta, 1988; 952: 115-130.
37. Kumosinki TF, Unruh JJ. Quantization of the global secondary structure of globular proteins
by FTIR spectroscopy: comparison with X-ray crystallographic structure. Talanta, 1996; 43:
199-219.
38. Jackson M, Mantsch HH. The use and misuse of FTIR spectroscopy in the determination of
protein structure. Critical Reviews in Biochemistry and Molecular Biology, 1995; 30: 95-
120.
39. Surewicz WK, Mantsch HH, Chapman D. Determination of protein secondary structure by
Fourier transform infrared spectroscopy: A critical assessment. Biochemistry, 1993; 32:
389-394.
40. Bandekar J. Amide modes and protein conformation. Biochimica et Biophysica Acta, 1992;
1120: 123-143.
35
41. Braiman MS, Rothschild KJ. Fourier-transform infrared techniques for probing membrane
protein structure. Annual Review of Biophysics and Biophysical Chemistry, 1988; 17: 541-
570.
42. Gray J. The interaction of protein with solid surface. Current Opinion in Structural Biology,
2004; 14: 110-115.
43. Chittur KK. FTIR/ATR for protein adsorption to biomaterial surfaces. Biomaterials, 1998;
19: 357-369.
44. Sharp JS, Forrest JA, Jones RA. Surface denaturaration and amyloid fibril formation of
insulin at model lipid-water interface. Biochemistry, 2002; 41: 15810-15819.
45. Tunc S, Maitz MF, Steiner G, Vázquez L, Pham MT, Salzer R. In situ conformational
analysis of fibrinogen adsorbed on Si surfaces. Colloids and Surfaces B: Biointerfaces,
2005; 42: 219-225.
46. Giacomelli CE, Bremer MGEG, Norde W. ATR-FTIR study of IgG adsorbed on different
silica surface. Journal of Colloid interface Science, 1999; 220: 13-23.
47. Tarasevich YI, Monakhova LI. Interaction between globular proteins and silica surfaces.
Colloid Journal, 2002, 64: 482-487.
48. S-Noinville S, Revault M, Quiquampoix H, Baron MH. Journal of Colloid and Interface
Science, 2000; 221: 273-283.
49. Fang Y, Dalgleish DG. Conformation of β-lactoglobulin studied by FTIR: effect of pH,
temperature, and adsorption to the oil-water interface. Journal of Colloid and Interface
Science, 1997; 196: 292-298.
50. Meinders MBJ, Bosch GGM, Jongh HHJ. Adsorption properties of proteins at and near the
air/water interface from IRRAS spectra of protein solutions. European Biophysics Journal,
2001; 30: 256-267.
51. Xie J, Riley C, Kumar M, Chittur K. FTIR/ATR study of protein adsorption and brushite
transformation to hydroxyapatite. Biomaterials, 2002; 23: 3609-3626.
52. Krimm S., Bandekar J., Vibrational spectroscopy and conformation of peptides,
polypeptides, and proteins. Advances in Protein Chemistry, 1986; 38: 181-364.
53. Griebenow K, Santos AM, Carrasquillo KG. Secondary structure of proteins in the
amorphous dehydrated state probed by FTIR spectroscopy. The Internet Journal of
Vibrational Spectroscopy, http://www.Ijvs.com/volume3/edition1/section3. Nov, 2005.
36
54. Cai S, Singh BR. A distinct utility of the amide III infrared band for secondary structure
estimation of aqueous protein solution using partial least squares methods. Biochemistry,
2004; 43: 2541-2549.
55. Cai S, Singh BR. Theory and basic principles- Determination of the secondary structure of
proteins from amide I and amide III infrared bands using partial least square method. ACS
Symposium Series, 2000; 750: 117-131.
56. Cai S, Singh BR. Identification of beta-turn and random coil amide III infrared bands for
secondary structure estimation of proteins. Biophysical Chemistry, 1999; 80: 7-20.
57. Fu FN, Deoliveira DB, Trumble WR, Sarkar HK, Singh BR. Secondary structure estimation
of proteins using the amide III region of Fourier transform infrared spectroscopy:
application to analyze calcium-banding-induced structural changes in calsequestrin. Applied
Spectroscopy, 1994; 48: 1432-1441.
58. Griebenow K, Klibanov AM. Lyophilization-induced reversible structural changes of
proteins. Proceedings of the National Academy of Science, 1995: 92: 10969-10976.
59. Haris PI, Seveercan F. FTIR spectroscopic characterization of protein structure in aqueous
and non-aqueous media. Journal of Molecular Catalysis B: Enzymatic, 1999; 7: 207-221.
60. Khurana R, Fink AL. Do parallel beta-helix proteins have a unique Fourier transform
infrared spectrum. Biophysical Journal, 2000; 78: 994-1000.
61. Buijs J, Norde W. Changes in the secondary structure of adsorbed IgG and F(ab)2 studied by
FTIR spectroscopy. Langmuir, 1996; 12: 1605-1613.
62. Oberg KA, Ruysschaert JM, Goormaghtigh E. The optimization of protein secondary
structure determination with infrared and circular dichroism spectra. European Journal of
Biochemistry, 2004; 271: 2937-2948.
63. Mantsch HH, Perczel A, Hollosi M, Fasman GD. Characterization of beta-turns in cyclic
hexapeptides in solution by Fourier-transform IR spectroscopy. Biopolymers, 1993; 33:
201-207.
64. Tamm LK, Tatulian SA. Infrared spectroscopy of proteins and peptides in lipids bilayers,
Quarterly reviews of biophysics, 1997; 30: 365-429.
65. Speare JO, Rush TS. IR spectra of cytochrome c denatured with deuterated guanidine
hydrochloride show increase in β sheet. Biopolymers, 2003; 72: 193-204.
37
66. Lacey DJ, Wellner N, Beaudoin F, Napier JA, Shewry PR. Secondary structure of oleosins
in oil bodies isolated from seeds of safflower (Carthamus tinctorius L.) and sunflower
(Helianthus annuus L.). Biochemical Journal, 1998: 334: 469-477.
67. Krimm S. Bandekar J. Vibrational spectroscopy and conformation of peptides, polypeptides,
and proteins. Advances in Protein Chemistry, 1986; 38: 181-364.
68. Powell JR, Wasacz FM, Jacobsen RJ. An algorithm for the reproducible spectral subtraction
of water from the FTIR spectra of proteins in dilute solutions and adsorbed monolayers.
Applied Spectroscopy, 1986; 40: 339-344.
69. Dousseau F, Therrien M, Pezolet M. On the spectral subtraction of water from the FTIR
spectra of aqueous solution of proteins. Applied Spectroscopy, 1989; 43: 538-542.
70. Lenk TJ. Infrared studies of protein adsorption and transitions on polyurethanes. PhD
dissertation, University of Washington Chemical Engineering, 1994
71. Cameron DG, Moffatt DJ. A generalized approach to derivative spectroscopy. Applied
Spectroscopy, 1987; 41: 539-544.
72. Cameron DG, Moffatt DJ. Deconvolution, derivation and smoothing of spectra using
Fourier transforms. Journal of Testing & Evaluation, 1984; 12: 78-85.
73. Kauppinen JK, Moffatt DJ, Mantsch HH, Carmeron DG. Fourier transforms in the
computation of self-deconvolution and first-order derivative spectra of overlapped band
contours. Analytical Chemistry, 1981; 53: 1454-1457.
74. Kauppinen JK, Moffatt DJ, Mantsch HH, Cameron DG. Fourier self-deconvolution: a
method for resolving intrinsically overlapped bands. Applied Spectroscopy, 1981; 35: 271-
276.
75. Czarnecki MA, Ozaki Y. Determination of integrated intensities of overlapped IR bands by
curve-fitting, Fourier self-deconvolution and combination of both methods, Spectroshimica
Acta Part A, 1996; 52: 1593-1601.
76. Dong A, Huang P, Caughy W. Protein secondary structures in water from second-derivative
amide I infrared spectra. Biochemistry, 1990; 29: 3303-3308.
77. Moffatt DJ, Mantsch HH. Fourier resolution enhancement of infrared spectral data. Methods
in Enzymology, 1992; 210: 192-200.
78. Haris PI, Seveercan F. FTIR spectroscopic characterization of protein structure in aqueous
and non-aqueous media. Journal of Molecular Catalysis B: Enzymatic, 1999; 7: 207-221.

38
79. Jackson M, Mantsch HH. The use and misuse of FTIR spectroscopy in the determination of
protein structure. Critical Reviews in Biochemistry and Molecular Biology, 1995; 30: 95-
120.
39
Chapter III: Characterization of the structural changes of model antigen when it is absorbed
onto and released from aluminium hydroxide using FTIR-ATR
Abstract
Aluminium hydroxide is often used as adjuvant in specific immunotherapy, i.e. allergy vaccination.
Structural integrity of antigens upon adsorption and release is not only important for investigating
vaccine immunogenicity, but also for the epitope specificity of the resulting immune response and
hence therapeutic efficacy. However, it is also important for understanding the mechanism of how
adjuvants can enhance the immune response. However, little is known about an antigen’s structure
when it is adsorbed and subsequently released from aluminium adjuvants. In this study, the
structural changes of two model antigens, bovine serum albumin (BSA) and β-lactoglobulin (BLG),
were investigated using Fourier transform infrared – attenuated total reflection (FTIR-ATR)
spectroscopy. The secondary structures of both model antigens change when absorbed to aluminium
hydroxide. The structural perturbation depends on the amount of the adsorbed protein. Maximal
adsorption gives a more native-like structure than lower protein adsorption. This may indicate that
protein is adsorbed by aluminium hydroxide by different mechanisms depending on the
concentration. The adsorbed model antigens are released using phosphate buffer (PBS) pH 7.4 with
final concentrations between 5 mM and 200 mM. The maximum antigen recovery is 80% after 40
min in the presence of phosphate buffer (PBS). The recovery curves of both proteins also indicated
two different adsorption modes. FTIR-ATR and circular dischroism (CD) spectroscopy yield
similar results suggesting that the antigens refold to their native state after release. Released BSA
regains its native structure more complete than BLG.
40
1 Introduction
Antigens are proteins capable of inducing specific immune responses when injected to humans. The
molecular properties of antigens and the way in which these properties contribute to immune
activation are central to determine the outcome of vaccination treatments. All four levels of protein
organization—primary, secondary, tertiary, and quaternary—affect its immunogenicity [1]. The
structural information of the antigen is not only important for investigating its immunogenicity; it is
also important to understanding of the interaction between antigen and adjuvant and the mechanism
of how adjuvant can enhance the immune response. In general, proteins have a very fragile three-
dimensional structure [2, 3], and this structure may easily change in different environments, such as
binding to membranes, at air-water interfaces, under pressure, or even during drying and storage.
Protein adsorption processes are believed to cause structural changes in the protein. Previous studies
have shown that the adsorption of a protein onto interfaces or solid surfaces induces structural
changes in the protein [4-8]. These structural changes during absorption may lead to irreversible
aggregate formation, inactivate the ability to induce an immune response, or even cause serious
side-reactions. Protein aggregation is difficult to control and hampers precise prediction of the
release profile of the protein. Furthermore, protein aggregates can be immunogenic and may
potentially constitute risk patients.
Aluminium adsorbed vaccines have been safely used for many years. However, the structure of the
antigen when adsorbed to aluminium-containing adjuvants, have not been well characterized. Two
studies have addressed the structure of aluminium adsorbed proteins [9, 10], but a major obstacle is
the lack of experimental techniques allowing structural information to be obtained directly on this
complex system. Hem and white demonstrated that a slight deformation of the structure of pepsin
occurred when adsorbed by aluminium hydroxide using infrared spectroscopy. They regarded this
an example of ligand exchange [9]. Jones et al. [10] studied the structures of model antigens as a
function of temperature by FTIR-ATR spectroscopy in order to investigate vaccine stability. To our
knowledge, there is no available structural information of released antigens from aluminium-
containing adjuvants.
FTIR spectroscopy is a good method to determine the secondary structure of globular proteins. It
offers many advantages over other spectroscopic techniques [11, 12]. A major advantage is the lack
of dependence on the physical state of the sample. Sample can be gas, aqueous or organic solution,
hydrated film, inhomogeneous suspension, or solid. FTIR is particularly suitable for the analysis of
proteins adsorbed by other materials, especially when an ATR crystal is used. FTIR was applied to
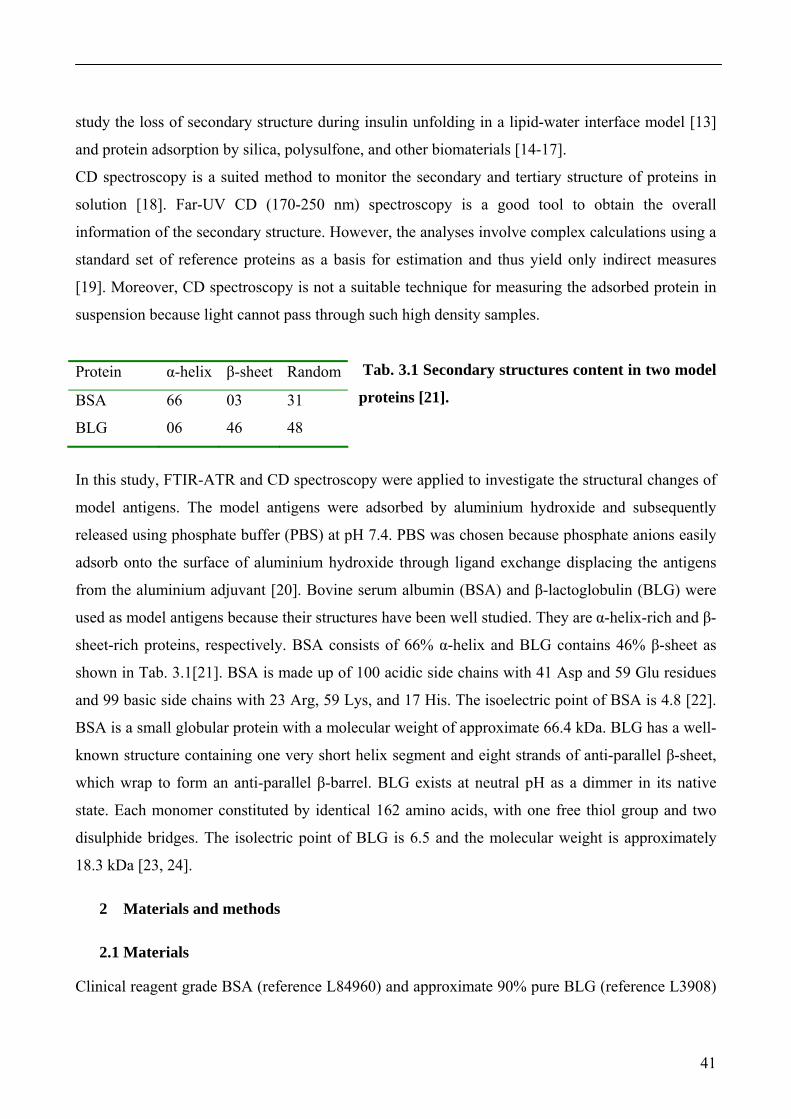
41
study the loss of secondary structure during insulin unfolding in a lipid-water interface model [13]
and protein adsorption by silica, polysulfone, and other biomaterials [14-17].
CD spectroscopy is a suited method to monitor the secondary and tertiary structure of proteins in
solution [18]. Far-UV CD (170-250 nm) spectroscopy is a good tool to obtain the overall
information of the secondary structure. However, the analyses involve complex calculations using a
standard set of reference proteins as a basis for estimation and thus yield only indirect measures
[19]. Moreover, CD spectroscopy is not a suitable technique for measuring the adsorbed protein in
suspension because light cannot pass through such high density samples.
Tab. 3.1 Secondary structures content in two model
proteins [21].
In this study, FTIR-ATR and CD spectroscopy were applied to investigate the structural changes of
model antigens. The model antigens were adsorbed by aluminium hydroxide and subsequently
released using phosphate buffer (PBS) at pH 7.4. PBS was chosen because phosphate anions easily
adsorb onto the surface of aluminium hydroxide through ligand exchange displacing the antigens
from the aluminium adjuvant [20]. Bovine serum albumin (BSA) and β-lactoglobulin (BLG) were
used as model antigens because their structures have been well studied. They are α-helix-rich and β-
sheet-rich proteins, respectively. BSA consists of 66% α-helix and BLG contains 46% β-sheet as
shown in Tab. 3.1[21]. BSA is made up of 100 acidic side chains with 41 Asp and 59 Glu residues
and 99 basic side chains with 23 Arg, 59 Lys, and 17 His. The isoelectric point of BSA is 4.8 [22].
BSA is a small globular protein with a molecular weight of approximate 66.4 kDa. BLG has a well-
known structure containing one very short helix segment and eight strands of anti-parallel β-sheet,
which wrap to form an anti-parallel β-barrel. BLG exists at neutral pH as a dimmer in its native
state. Each monomer constituted by identical 162 amino acids, with one free thiol group and two
disulphide bridges. The isolectric point of BLG is 6.5 and the molecular weight is approximately
18.3 kDa [23, 24].
2 Materials and methods
2.1 Materials
Clinical reagent grade BSA (reference L84960) and approximate 90% pure BLG (reference L3908)
Protein α-helix β-sheet Random
BSA 66 03 31
BLG 06 46 48
42
were purchased from ICN biomedical Inc and Sigma respectively. Both proteins were used directly
without further purification. Aluminium hydroxide adjuvant was purchased from Superfos
Biosector A/S (Denmark) and used without further treatment. Other chemicals were all of analytical
grade and obtained from commercial sources.
2.2 Adsorption experiments
Sample preparation
A protein stock solution (10 mg/ml) was prepared by dissolving protein in Milli-Q water. Working
samples were prepared by mixing the appropriate amount of protein stock solution and aluminium
hydroxide and subsequently diluted to 1 ml using Milli-Q water. The final calculated aluminium
concentration was 3.4 mg/ml for all samples; the final protein concentrations were from 1mg/ml to
5mg/ml, with final pH 6.5. Samples were mixed gently by end-over-end rotation for 30 min to
obtain the maximum protein adsorption before FTIR measurement.
FTIR-ATR measurement
Spectra were collected using a FTIR spectrometer (PerkinElmer Spectrum One), which was
mounted with a three bounces ZnSe ATR crystal (PerkinElmer). An 8 μl sample was deposited onto
ATR crystal and by evaporating the solvent to obtain a film. The calculated amount of aluminium
hydroxide for a film was 27.2 μg; and the calculated value of protein was from 8 μg to 40 μg,
respectively. Spectra were directly recorded on the film by co-adding 128 scans with a resolution of
4 cm-1 at a scan speed 0.2 cm/s. Control spectra were collected from the samples which contained
the same components except protein at same experimental conditions. All samples were analyzed at
least in duplicate.
2.3 Release experiments
Sample preparation
Samples were prepared as described for the adsorption experiments. The final concentration of
aluminium hydroxide was 3.4 mg/ml for each sample; final protein concentration was 4 mg/ml for
BSA and 3 mg/ml for BLG. The samples were gently rotating by end-over-end at room temperature
for one hour, and stored at 4 ºC overnight. Adsorbed proteins were released by adding PBS pH 7.4
to a final concentration between 5 and 200 mM at room temperature. Samples were incubated for
40 min before measurement.
FTIR-ATR measurements
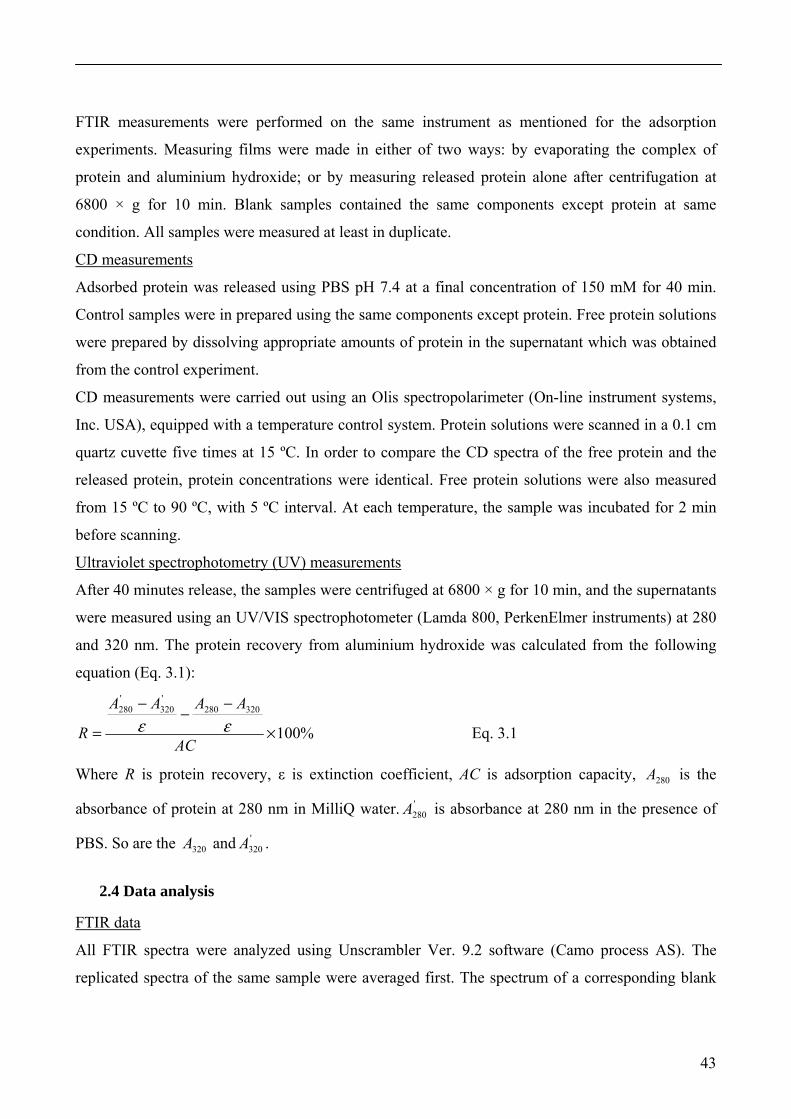
43
FTIR measurements were performed on the same instrument as mentioned for the adsorption
experiments. Measuring films were made in either of two ways: by evaporating the complex of
protein and aluminium hydroxide; or by measuring released protein alone after centrifugation at
6800 × g for 10 min. Blank samples contained the same components except protein at same
condition. All samples were measured at least in duplicate.
CD measurements
Adsorbed protein was released using PBS pH 7.4 at a final concentration of 150 mM for 40 min.
Control samples were in prepared using the same components except protein. Free protein solutions
were prepared by dissolving appropriate amounts of protein in the supernatant which was obtained
from the control experiment.
CD measurements were carried out using an Olis spectropolarimeter (On-line instrument systems,
Inc. USA), equipped with a temperature control system. Protein solutions were scanned in a 0.1 cm
quartz cuvette five times at 15 ºC. In order to compare the CD spectra of the free protein and the
released protein, protein concentrations were identical. Free protein solutions were also measured
from 15 ºC to 90 ºC, with 5 ºC interval. At each temperature, the sample was incubated for 2 min
before scanning.
Ultraviolet spectrophotometry (UV) measurements
After 40 minutes release, the samples were centrifuged at 6800 × g for 10 min, and the supernatants
were measured using an UV/VIS spectrophotometer (Lamda 800, PerkenElmer instruments) at 280
and 320 nm. The protein recovery from aluminium hydroxide was calculated from the following
equation (Eq. 3.1):
%100320280
'320
'280
×
−−
−
=AC
AAAA
R εε Eq. 3.1
Where R is protein recovery, ε is extinction coefficient, AC is adsorption capacity, 280A is the
absorbance of protein at 280 nm in MilliQ water. '280A is absorbance at 280 nm in the presence of
PBS. So are the 320A and '320A .
2.4 Data analysis
FTIR data
All FTIR spectra were analyzed using Unscrambler Ver. 9.2 software (Camo process AS). The
replicated spectra of the same sample were averaged first. The spectrum of a corresponding blank
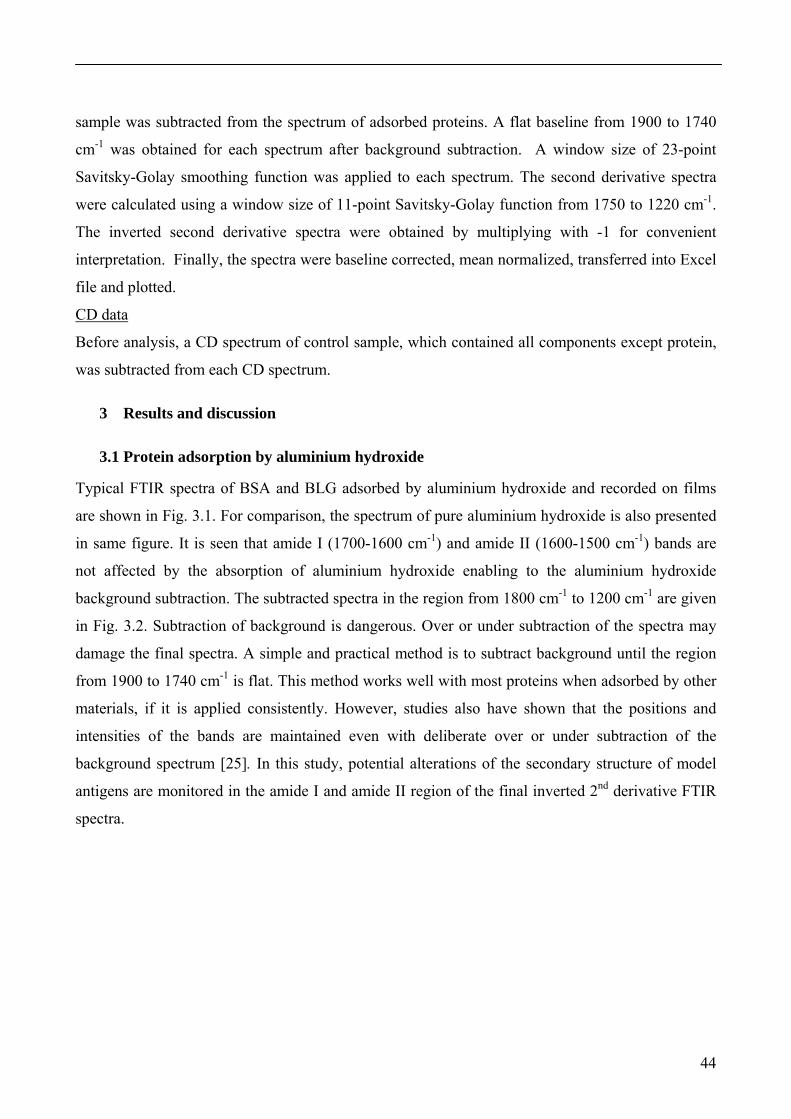
44
sample was subtracted from the spectrum of adsorbed proteins. A flat baseline from 1900 to 1740
cm-1 was obtained for each spectrum after background subtraction. A window size of 23-point
Savitsky-Golay smoothing function was applied to each spectrum. The second derivative spectra
were calculated using a window size of 11-point Savitsky-Golay function from 1750 to 1220 cm-1.
The inverted second derivative spectra were obtained by multiplying with -1 for convenient
interpretation. Finally, the spectra were baseline corrected, mean normalized, transferred into Excel
file and plotted.
CD data
Before analysis, a CD spectrum of control sample, which contained all components except protein,
was subtracted from each CD spectrum.
3 Results and discussion
3.1 Protein adsorption by aluminium hydroxide
Typical FTIR spectra of BSA and BLG adsorbed by aluminium hydroxide and recorded on films
are shown in Fig. 3.1. For comparison, the spectrum of pure aluminium hydroxide is also presented
in same figure. It is seen that amide I (1700-1600 cm-1) and amide II (1600-1500 cm-1) bands are
not affected by the absorption of aluminium hydroxide enabling to the aluminium hydroxide
background subtraction. The subtracted spectra in the region from 1800 cm-1 to 1200 cm-1 are given
in Fig. 3.2. Subtraction of background is dangerous. Over or under subtraction of the spectra may
damage the final spectra. A simple and practical method is to subtract background until the region
from 1900 to 1740 cm-1 is flat. This method works well with most proteins when adsorbed by other
materials, if it is applied consistently. However, studies also have shown that the positions and
intensities of the bands are maintained even with deliberate over or under subtraction of the
background spectrum [25]. In this study, potential alterations of the secondary structure of model
antigens are monitored in the amide I and amide II region of the final inverted 2nd derivative FTIR
spectra.
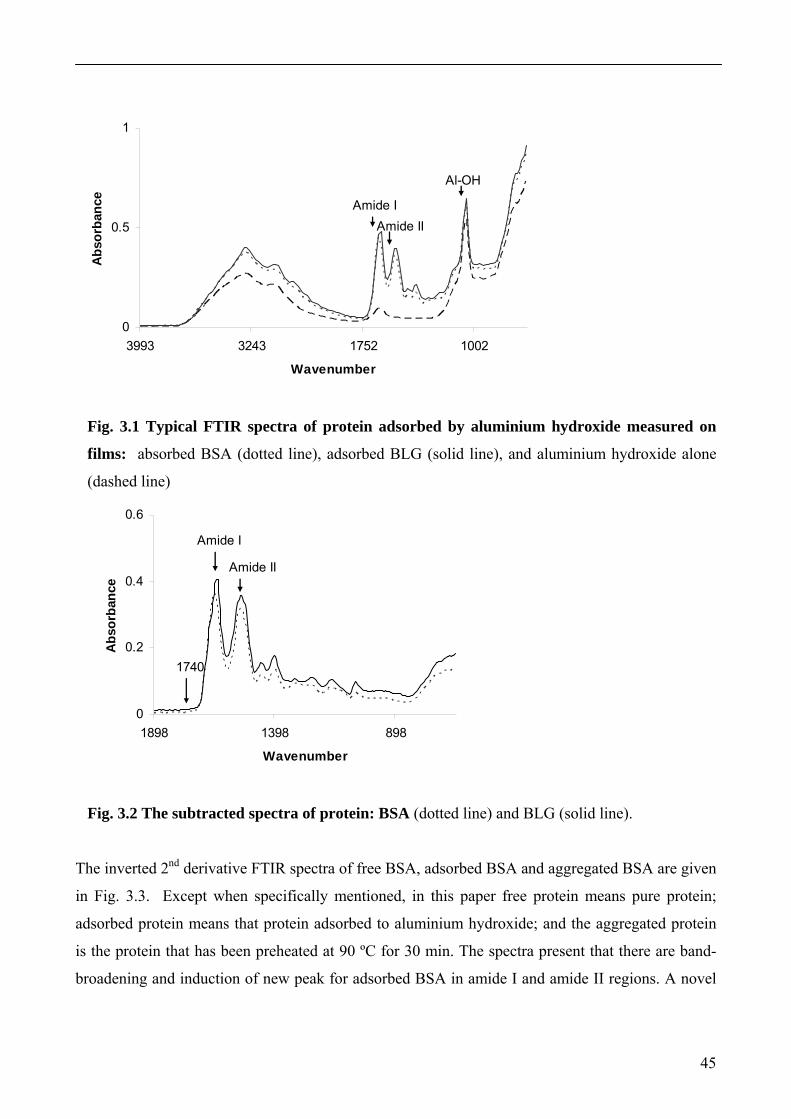
45
0
0.5
1
3993 3243 1752 1002
Wavenumber
Abs
orba
nce
Amide IAmide II
Al-OH
Fig. 3.1 Typical FTIR spectra of protein adsorbed by aluminium hydroxide measured on
films: absorbed BSA (dotted line), adsorbed BLG (solid line), and aluminium hydroxide alone
(dashed line)
0
0.2
0.4
0.6
1898 1398 898
Wavenumber
Abs
orba
nce
Amide I
Amide II
1740
Fig. 3.2 The subtracted spectra of protein: BSA (dotted line) and BLG (solid line).
The inverted 2nd derivative FTIR spectra of free BSA, adsorbed BSA and aggregated BSA are given
in Fig. 3.3. Except when specifically mentioned, in this paper free protein means pure protein;
adsorbed protein means that protein adsorbed to aluminium hydroxide; and the aggregated protein
is the protein that has been preheated at 90 ºC for 30 min. The spectra present that there are band-
broadening and induction of new peak for adsorbed BSA in amide I and amide II regions. A novel
46
peak at 1646 cm-1 is induced and can be assigned to random structure. Another band at 1653 cm-1
decreases in intensity, which ascribes to α-helix. In other words, adsorbed BSA loses its α-helix but
gains random structure in amide I range. In amide II region, two new bands are induced at 1549 cm-
1 and 1533 cm-1. Bands around 1570 cm-1 and 1513 cm-1 increase in intensity during adsorption.
The significant difference in the spectra of adsorbed BSA and free BSA indicates that the secondary
structure of BSA changes when adsorbed to aluminium hydroxide. Noinville et al. [26] had studied
BSA adsorbed by montmorillonite and concluded that all unfolding processes involve about 20% of
the backbone.
0
2
4
1700 1680 1660 1640 1620 1600 1580 1560 1540 1520 1500
Wavenumber
Inve
rted
2nd
der
ivat
ive
1622
1694
1646 154915331541
1513
1653
16521570
Fig. 3.3 Inverted 2nd derivative spectra of BSA in amide I and amide II region: free BSA
(solid line), adsorbed BSA (dashed line) and aggregated BSA (dotted line).
In order to compare the structural difference of adsorbed protein and the aggregated protein, BSA
was preheated at 90 ºC for 30 min and the spectrum was recorded under identical experimental
condition at room temperature. The final inverted 2nd derivative spectrum of aggregated BSA is also
shown in Fig. 3.3 for comparison. For aggregated BSA, there are two novel bands around 1622 cm-1
and 1694 cm-1 in the amide I region. The band at 1622 cm-1 is extremely strong. These two bands
relate to intermolecular anti-parallel β-sheet formation. The result agrees with other heat-denatured
protein aggregates [27-29]. In the amide II range, aggregated BSA loses intensities at 1549 cm-1 and
1541 cm-1 compared to adsorbed and free BSA. These significant differences indicate that the
adsorption-induced secondary structural change is not the same as observed for protein aggregation.
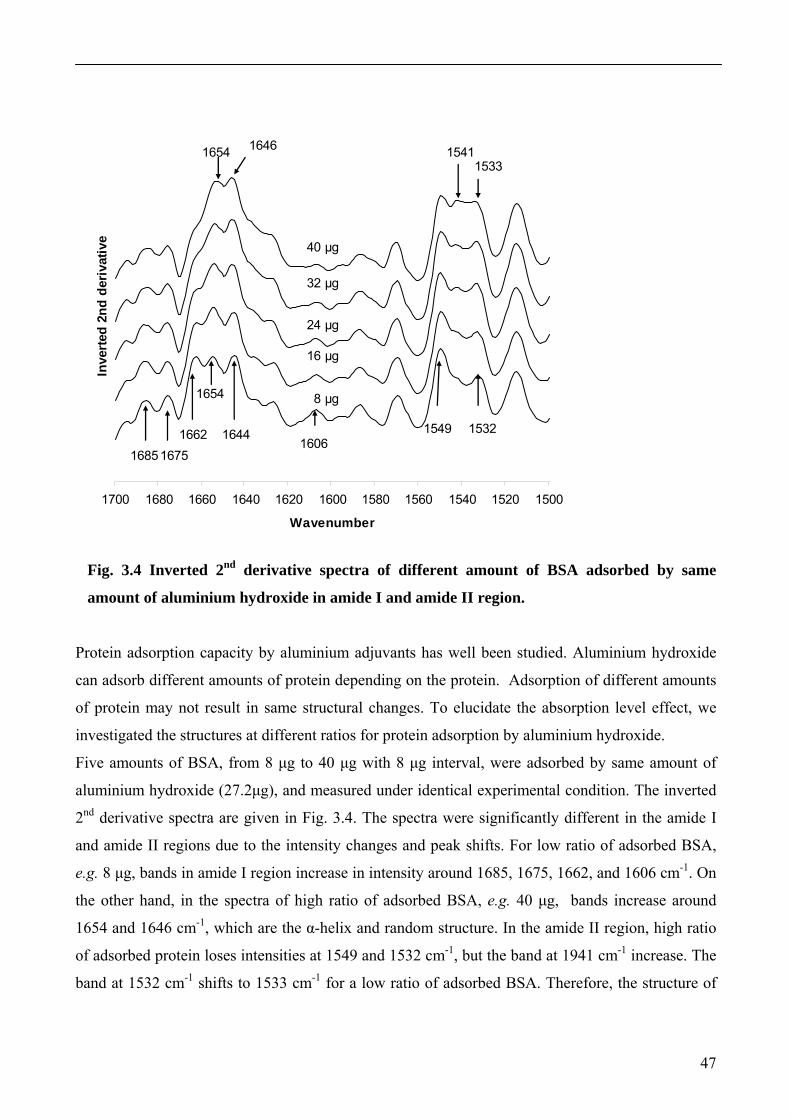
47
1700 1680 1660 1640 1620 1600 1580 1560 1540 1520 1500
Wavenumber
Inve
rted
2nd
der
ivat
ive
1549
1654
1654
1662 1644
1646
8 μg
16 μg
24 μg
32 μg
40 μg
1532
1533
160616751685
1541
Fig. 3.4 Inverted 2nd derivative spectra of different amount of BSA adsorbed by same
amount of aluminium hydroxide in amide I and amide II region.
Protein adsorption capacity by aluminium adjuvants has well been studied. Aluminium hydroxide
can adsorb different amounts of protein depending on the protein. Adsorption of different amounts
of protein may not result in same structural changes. To elucidate the absorption level effect, we
investigated the structures at different ratios for protein adsorption by aluminium hydroxide.
Five amounts of BSA, from 8 μg to 40 μg with 8 μg interval, were adsorbed by same amount of
aluminium hydroxide (27.2μg), and measured under identical experimental condition. The inverted
2nd derivative spectra are given in Fig. 3.4. The spectra were significantly different in the amide I
and amide II regions due to the intensity changes and peak shifts. For low ratio of adsorbed BSA,
e.g. 8 μg, bands in amide I region increase in intensity around 1685, 1675, 1662, and 1606 cm-1. On
the other hand, in the spectra of high ratio of adsorbed BSA, e.g. 40 μg, bands increase around
1654 and 1646 cm-1, which are the α-helix and random structure. In the amide II region, high ratio
of adsorbed protein loses intensities at 1549 and 1532 cm-1, but the band at 1941 cm-1 increase. The
band at 1532 cm-1 shifts to 1533 cm-1 for a low ratio of adsorbed BSA. Therefore, the structure of
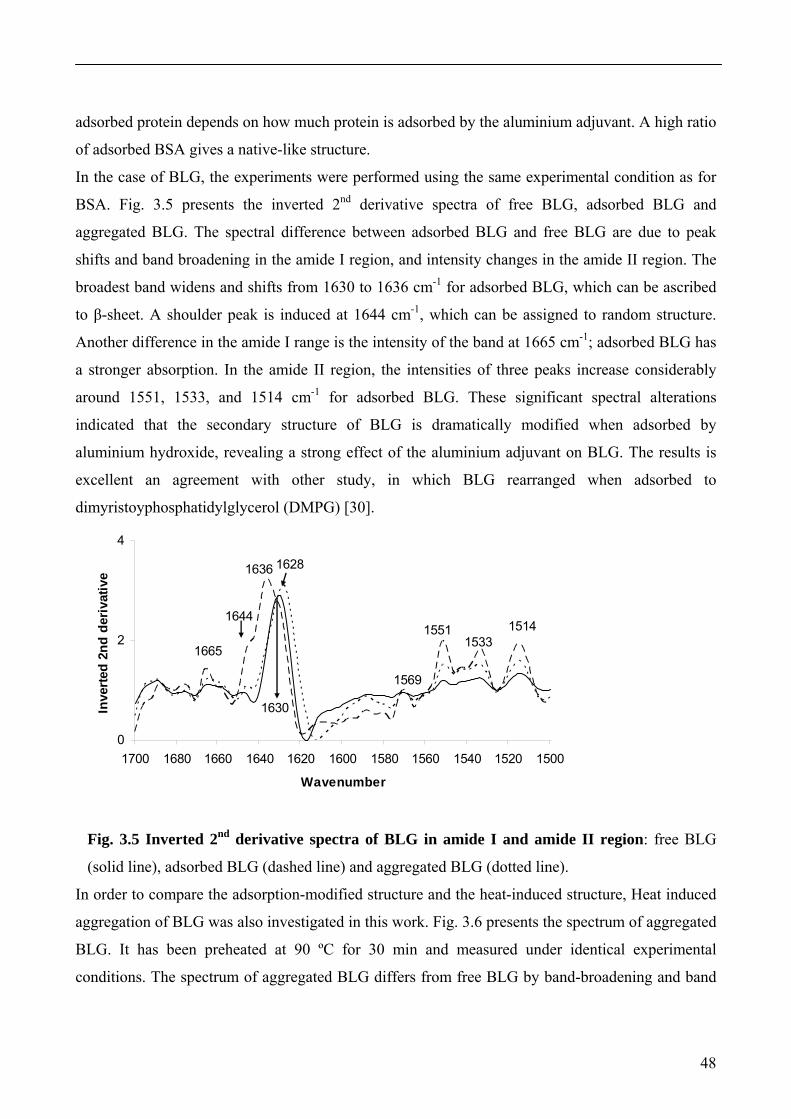
48
adsorbed protein depends on how much protein is adsorbed by the aluminium adjuvant. A high ratio
of adsorbed BSA gives a native-like structure.
In the case of BLG, the experiments were performed using the same experimental condition as for
BSA. Fig. 3.5 presents the inverted 2nd derivative spectra of free BLG, adsorbed BLG and
aggregated BLG. The spectral difference between adsorbed BLG and free BLG are due to peak
shifts and band broadening in the amide I region, and intensity changes in the amide II region. The
broadest band widens and shifts from 1630 to 1636 cm-1 for adsorbed BLG, which can be ascribed
to β-sheet. A shoulder peak is induced at 1644 cm-1, which can be assigned to random structure.
Another difference in the amide I range is the intensity of the band at 1665 cm-1; adsorbed BLG has
a stronger absorption. In the amide II region, the intensities of three peaks increase considerably
around 1551, 1533, and 1514 cm-1 for adsorbed BLG. These significant spectral alterations
indicated that the secondary structure of BLG is dramatically modified when adsorbed by
aluminium hydroxide, revealing a strong effect of the aluminium adjuvant on BLG. The results is
excellent an agreement with other study, in which BLG rearranged when adsorbed to
dimyristoyphosphatidylglycerol (DMPG) [30].
0
2
4
1700 1680 1660 1640 1620 1600 1580 1560 1540 1520 1500
Wavenumber
Inve
rted
2nd
deriv
ativ
e
1644
1636 1628
1630
15511533
1514
1569
1665
Fig. 3.5 Inverted 2nd derivative spectra of BLG in amide I and amide II region: free BLG
(solid line), adsorbed BLG (dashed line) and aggregated BLG (dotted line).
In order to compare the adsorption-modified structure and the heat-induced structure, Heat induced
aggregation of BLG was also investigated in this work. Fig. 3.6 presents the spectrum of aggregated
BLG. It has been preheated at 90 ºC for 30 min and measured under identical experimental
conditions. The spectrum of aggregated BLG differs from free BLG by band-broadening and band
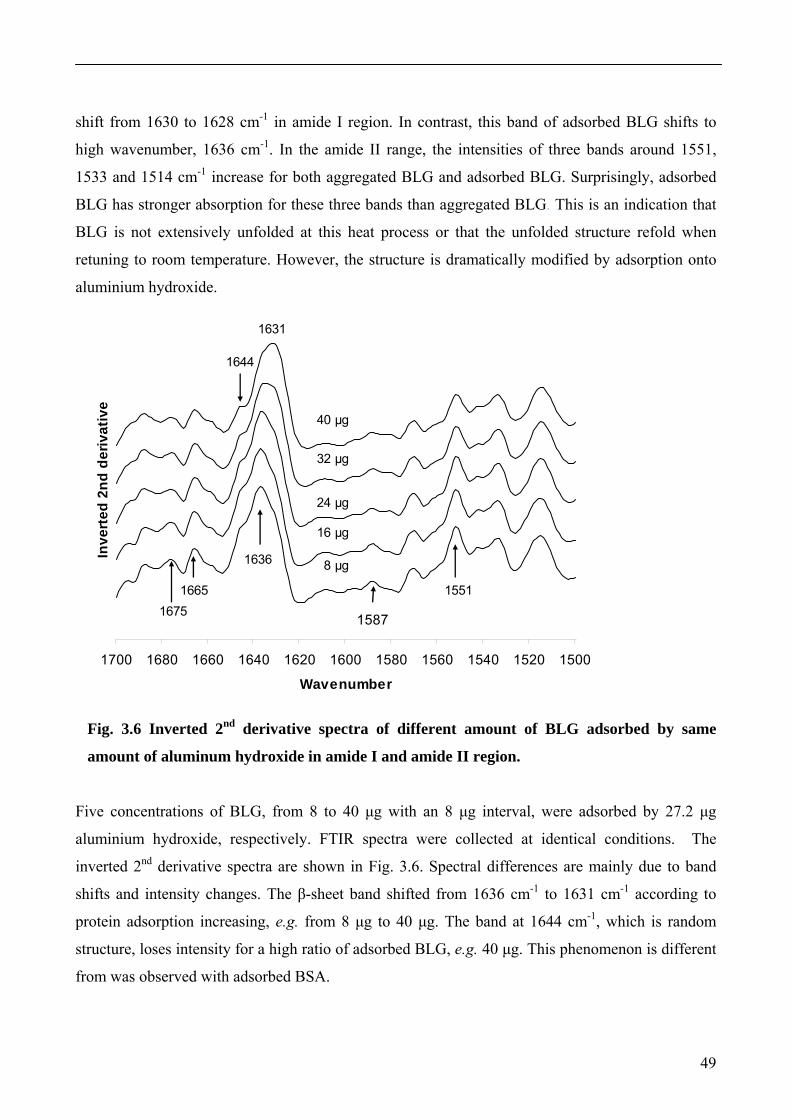
49
shift from 1630 to 1628 cm-1 in amide I region. In contrast, this band of adsorbed BLG shifts to
high wavenumber, 1636 cm-1. In the amide II range, the intensities of three bands around 1551,
1533 and 1514 cm-1 increase for both aggregated BLG and adsorbed BLG. Surprisingly, adsorbed
BLG has stronger absorption for these three bands than aggregated BLG. This is an indication that
BLG is not extensively unfolded at this heat process or that the unfolded structure refold when
retuning to room temperature. However, the structure is dramatically modified by adsorption onto
aluminium hydroxide.
1700 1680 1660 1640 1620 1600 1580 1560 1540 1520 1500
Wavenumber
Inve
rted
2nd
der
ivat
ive
1636
1631
8 μg
16 μg
32 μg
40 μg
24 μg
15511665
1644
1675 1587
Fig. 3.6 Inverted 2nd derivative spectra of different amount of BLG adsorbed by same
amount of aluminum hydroxide in amide I and amide II region.
Five concentrations of BLG, from 8 to 40 μg with an 8 μg interval, were adsorbed by 27.2 μg
aluminium hydroxide, respectively. FTIR spectra were collected at identical conditions. The
inverted 2nd derivative spectra are shown in Fig. 3.6. Spectral differences are mainly due to band
shifts and intensity changes. The β-sheet band shifted from 1636 cm-1 to 1631 cm-1 according to
protein adsorption increasing, e.g. from 8 μg to 40 μg. The band at 1644 cm-1, which is random
structure, loses intensity for a high ratio of adsorbed BLG, e.g. 40 μg. This phenomenon is different
from was observed with adsorbed BSA.
50
Two bands at 1675 and 1665 cm-1 have stronger absorption at a low ratio adsorbed of BLG. In the
amide II range, a low ratio of adsorbed BSA has a stronger absorption at 1551 cm-1. Therefore, the
structures differ as a function of amount of adsorbed BLG. The more BLG adsorbed, the more
native-like the structure is. Interference from free BLG in the adsorbed sample can not be excluded
in this case, as BLG can not be totally adsorbed by aluminium hydroxide even at very low
concentrations. Free protein may affect the final spectra, especially for high amount of protein
adsorption such as 40 μg.
Antigen adsorption is believed resulting from the electrostatic attraction between protein and
aluminium adjuvant. When antigen is adsorbed onto aluminium surface, the resulting
intermolecular electrostatic interaction may weaken the intramolecular forces that stabilize the
protein native structure. It may be the reason of adsorption-induced structural changes in the
antigens.
The manner by which the structural changes depends on the adsorbed amount of protein, which is in
agreement with other studies [31, 32]. Urano et al. [31] demonstrated that BSA was adsorbed on the
Al2O3 surface by formation of a monomolecular layer. A model of BSA adsorption was proposed
according to which protein was adsorbed in two different configurations depending on the amount
of adsorbed protein. Nevertheless, Urano et al. [31] did not conclude that protein structure changes
due to adsorption using potentiometric titration. It is probably because the conformation of adsorbed
protein depends on the prosperities of the aluminium hydroxide surface [33, 34]. In this study, two
model proteins are adsorbed by aluminium hydroxide resulting in different conformations. Small
amounts of protein are strongly adsorbed by aluminium hydroxide. The protein molecules form a
monomolecular layer on aluminium hydroxide and secondary structure becomes more denatured.
On the other hand, the structural perturbation of the protein becomes smaller when the degree of
banding decreases. A high ratio of adsorbed protein is weakly adsorbed via few linking points. The
protein molecules are oriented perpendicular onto the aluminium hydroxide, which results in a
native-like structure. This model is illustrated in Fig. 3.7. However, structural changes of the
proteins when adsorbed on the ATR crystal cannot be excluded. Previous study showed that the
changes in protein structure may occur upon adsorption onto ATR surface [35].
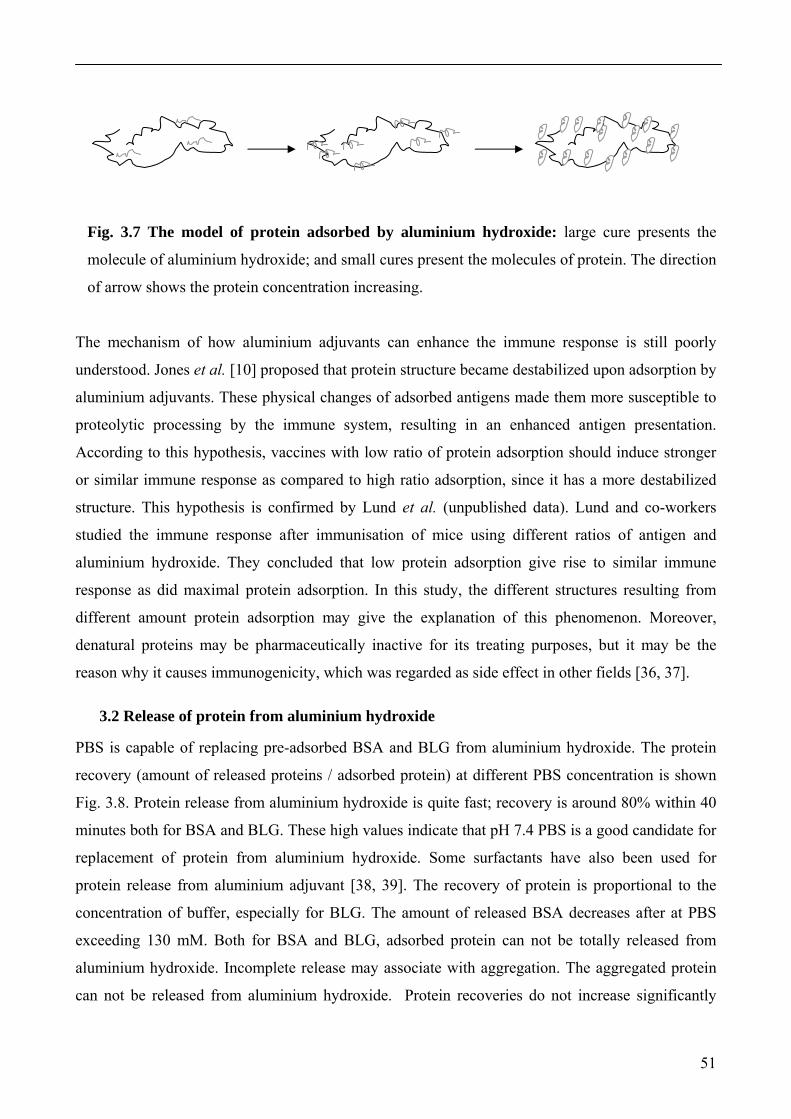
51
Fig. 3.7 The model of protein adsorbed by aluminium hydroxide: large cure presents the
molecule of aluminium hydroxide; and small cures present the molecules of protein. The direction
of arrow shows the protein concentration increasing.
The mechanism of how aluminium adjuvants can enhance the immune response is still poorly
understood. Jones et al. [10] proposed that protein structure became destabilized upon adsorption by
aluminium adjuvants. These physical changes of adsorbed antigens made them more susceptible to
proteolytic processing by the immune system, resulting in an enhanced antigen presentation.
According to this hypothesis, vaccines with low ratio of protein adsorption should induce stronger
or similar immune response as compared to high ratio adsorption, since it has a more destabilized
structure. This hypothesis is confirmed by Lund et al. (unpublished data). Lund and co-workers
studied the immune response after immunisation of mice using different ratios of antigen and
aluminium hydroxide. They concluded that low protein adsorption give rise to similar immune
response as did maximal protein adsorption. In this study, the different structures resulting from
different amount protein adsorption may give the explanation of this phenomenon. Moreover,
denatural proteins may be pharmaceutically inactive for its treating purposes, but it may be the
reason why it causes immunogenicity, which was regarded as side effect in other fields [36, 37].
3.2 Release of protein from aluminium hydroxide
PBS is capable of replacing pre-adsorbed BSA and BLG from aluminium hydroxide. The protein
recovery (amount of released proteins / adsorbed protein) at different PBS concentration is shown
Fig. 3.8. Protein release from aluminium hydroxide is quite fast; recovery is around 80% within 40
minutes both for BSA and BLG. These high values indicate that pH 7.4 PBS is a good candidate for
replacement of protein from aluminium hydroxide. Some surfactants have also been used for
protein release from aluminium adjuvant [38, 39]. The recovery of protein is proportional to the
concentration of buffer, especially for BLG. The amount of released BSA decreases after at PBS
exceeding 130 mM. Both for BSA and BLG, adsorbed protein can not be totally released from
aluminium hydroxide. Incomplete release may associate with aggregation. The aggregated protein
can not be released from aluminium hydroxide. Protein recoveries do not increase significantly
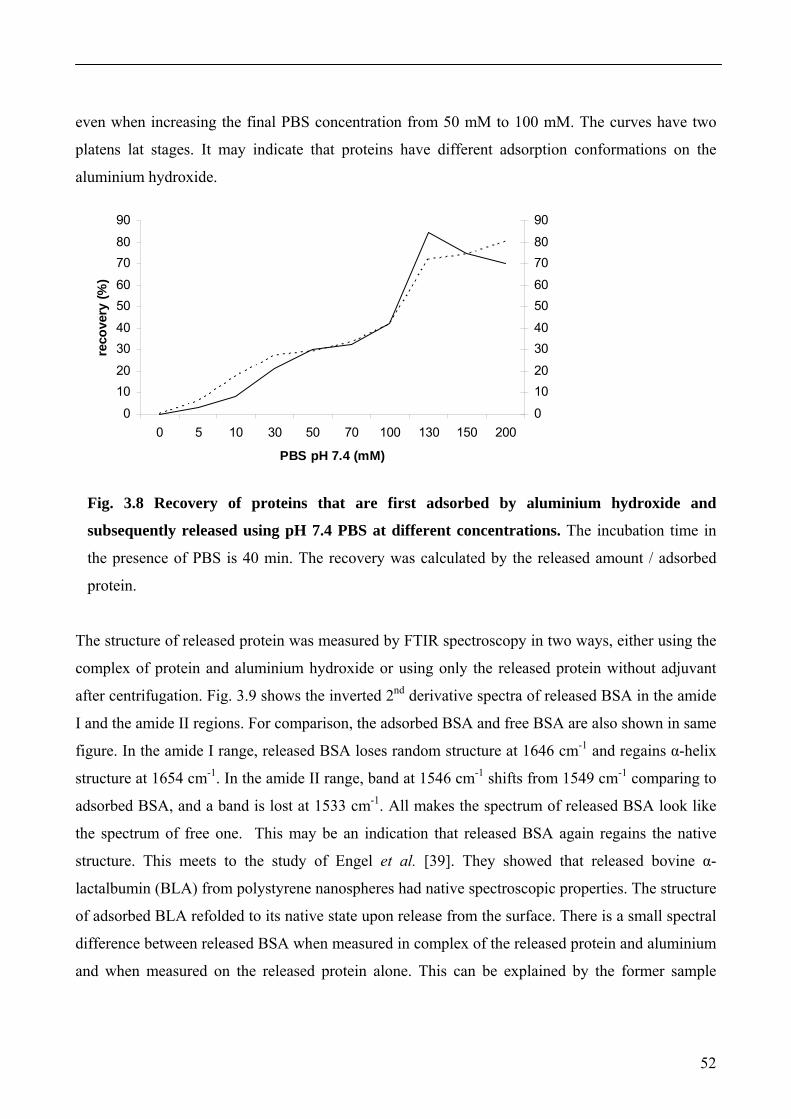
52
even when increasing the final PBS concentration from 50 mM to 100 mM. The curves have two
platens lat stages. It may indicate that proteins have different adsorption conformations on the
aluminium hydroxide.
0
1020
3040
5060
7080
90
0 5 10 30 50 70 100 130 150 200
PBS pH 7.4 (mM)
reco
very
(%)
0
1020
3040
5060
7080
90
Fig. 3.8 Recovery of proteins that are first adsorbed by aluminium hydroxide and
subsequently released using pH 7.4 PBS at different concentrations. The incubation time in
the presence of PBS is 40 min. The recovery was calculated by the released amount / adsorbed
protein.
The structure of released protein was measured by FTIR spectroscopy in two ways, either using the
complex of protein and aluminium hydroxide or using only the released protein without adjuvant
after centrifugation. Fig. 3.9 shows the inverted 2nd derivative spectra of released BSA in the amide
I and the amide II regions. For comparison, the adsorbed BSA and free BSA are also shown in same
figure. In the amide I range, released BSA loses random structure at 1646 cm-1 and regains α-helix
structure at 1654 cm-1. In the amide II range, band at 1546 cm-1 shifts from 1549 cm-1 comparing to
adsorbed BSA, and a band is lost at 1533 cm-1. All makes the spectrum of released BSA look like
the spectrum of free one. This may be an indication that released BSA again regains the native
structure. This meets to the study of Engel et al. [39]. They showed that released bovine α-
lactalbumin (BLA) from polystyrene nanospheres had native spectroscopic properties. The structure
of adsorbed BLA refolded to its native state upon release from the surface. There is a small spectral
difference between released BSA when measured in complex of the released protein and aluminium
and when measured on the released protein alone. This can be explained by the former sample
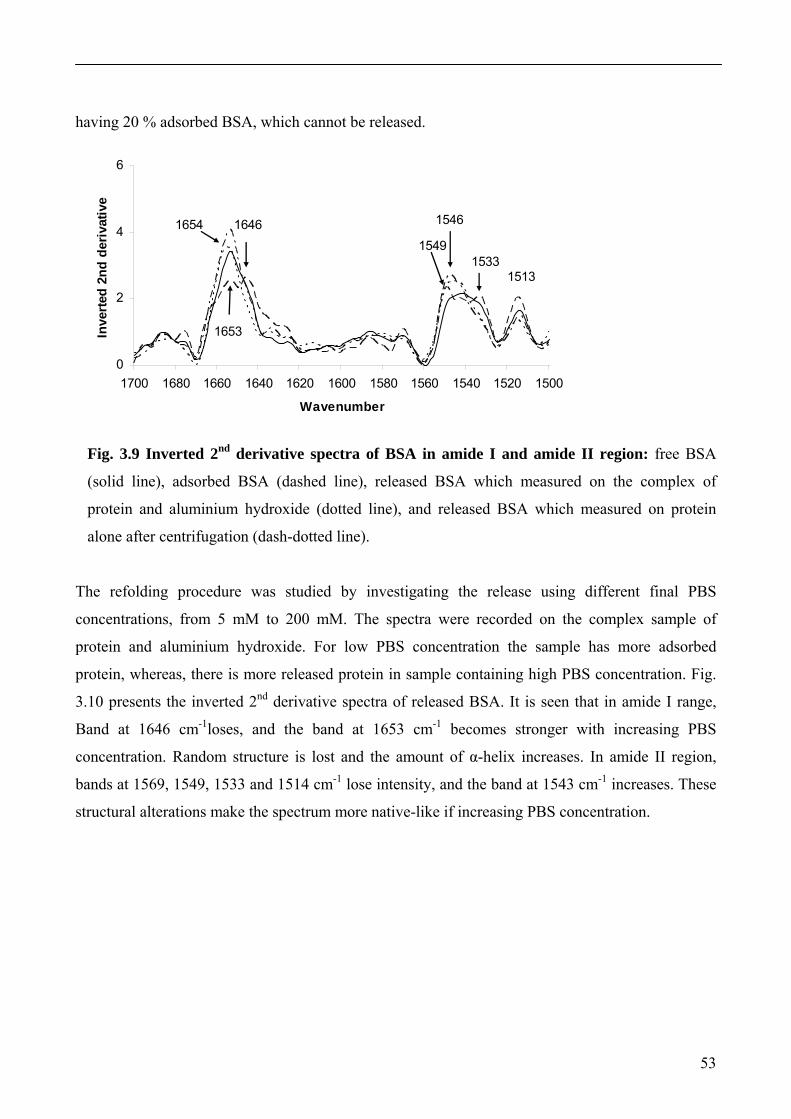
53
having 20 % adsorbed BSA, which cannot be released.
0
2
4
6
1700 1680 1660 1640 1620 1600 1580 1560 1540 1520 1500
Wavenumber
Inve
rted
2nd
der
ivat
ive
1653
1654 16461549
1546
15331513
Fig. 3.9 Inverted 2nd derivative spectra of BSA in amide I and amide II region: free BSA
(solid line), adsorbed BSA (dashed line), released BSA which measured on the complex of
protein and aluminium hydroxide (dotted line), and released BSA which measured on protein
alone after centrifugation (dash-dotted line).
The refolding procedure was studied by investigating the release using different final PBS
concentrations, from 5 mM to 200 mM. The spectra were recorded on the complex sample of
protein and aluminium hydroxide. For low PBS concentration the sample has more adsorbed
protein, whereas, there is more released protein in sample containing high PBS concentration. Fig.
3.10 presents the inverted 2nd derivative spectra of released BSA. It is seen that in amide I range,
Band at 1646 cm-1loses, and the band at 1653 cm-1 becomes stronger with increasing PBS
concentration. Random structure is lost and the amount of α-helix increases. In amide II region,
bands at 1569, 1549, 1533 and 1514 cm-1 lose intensity, and the band at 1543 cm-1 increases. These
structural alterations make the spectrum more native-like if increasing PBS concentration.
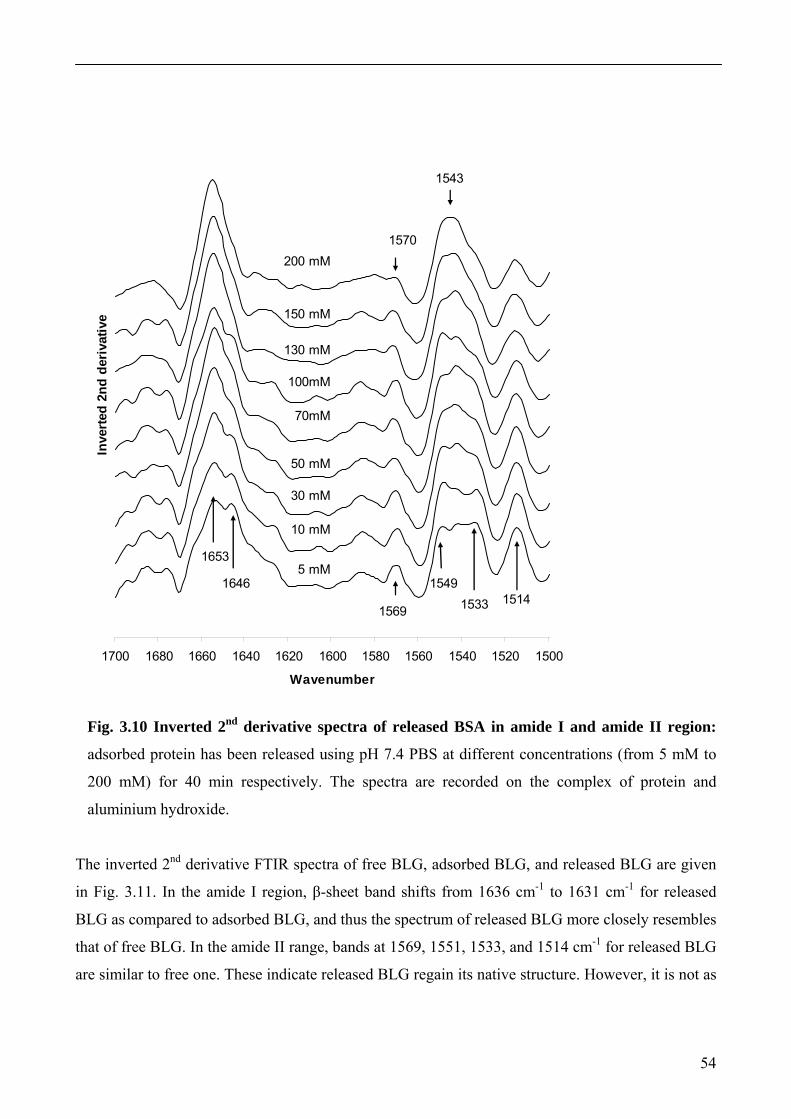
54
1700 1680 1660 1640 1620 1600 1580 1560 1540 1520 1500
Wavenumber
Inve
rted
2nd
der
ivat
ive
1653
1646
1569
15491533 1514
1543
1570
5 mM
10 mM
30 mM
50 mM
70mM
100mM
130 mM
150 mM
200 mM
Fig. 3.10 Inverted 2nd derivative spectra of released BSA in amide I and amide II region:
adsorbed protein has been released using pH 7.4 PBS at different concentrations (from 5 mM to
200 mM) for 40 min respectively. The spectra are recorded on the complex of protein and
aluminium hydroxide.
The inverted 2nd derivative FTIR spectra of free BLG, adsorbed BLG, and released BLG are given
in Fig. 3.11. In the amide I region, β-sheet band shifts from 1636 cm-1 to 1631 cm-1 for released
BLG as compared to adsorbed BLG, and thus the spectrum of released BLG more closely resembles
that of free BLG. In the amide II range, bands at 1569, 1551, 1533, and 1514 cm-1 for released BLG
are similar to free one. These indicate released BLG regain its native structure. However, it is not as
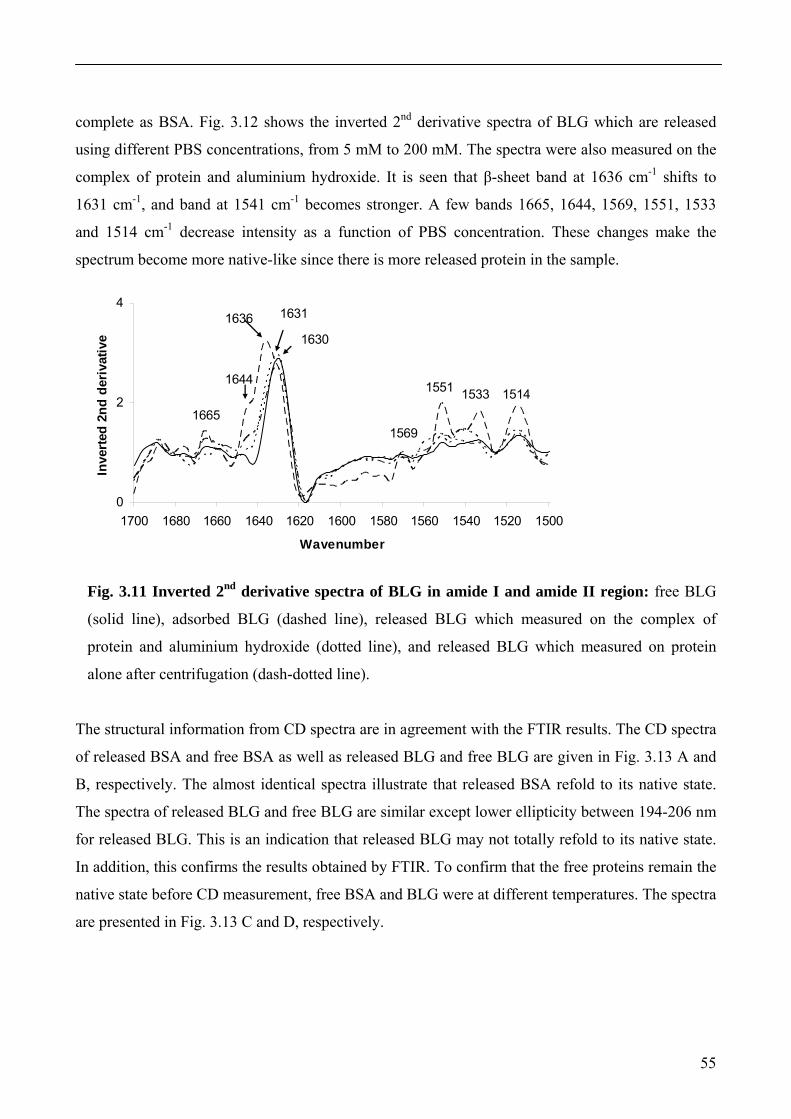
55
complete as BSA. Fig. 3.12 shows the inverted 2nd derivative spectra of BLG which are released
using different PBS concentrations, from 5 mM to 200 mM. The spectra were also measured on the
complex of protein and aluminium hydroxide. It is seen that β-sheet band at 1636 cm-1 shifts to
1631 cm-1, and band at 1541 cm-1 becomes stronger. A few bands 1665, 1644, 1569, 1551, 1533
and 1514 cm-1 decrease intensity as a function of PBS concentration. These changes make the
spectrum become more native-like since there is more released protein in the sample.
0
2
4
1700 1680 1660 1640 1620 1600 1580 1560 1540 1520 1500
Wavenumber
Inve
rted
2nd
der
ivat
ive
16361630
1631
1644 1551 1533 1514
15691665
Fig. 3.11 Inverted 2nd derivative spectra of BLG in amide I and amide II region: free BLG
(solid line), adsorbed BLG (dashed line), released BLG which measured on the complex of
protein and aluminium hydroxide (dotted line), and released BLG which measured on protein
alone after centrifugation (dash-dotted line).
The structural information from CD spectra are in agreement with the FTIR results. The CD spectra
of released BSA and free BSA as well as released BLG and free BLG are given in Fig. 3.13 A and
B, respectively. The almost identical spectra illustrate that released BSA refold to its native state.
The spectra of released BLG and free BLG are similar except lower ellipticity between 194-206 nm
for released BLG. This is an indication that released BLG may not totally refold to its native state.
In addition, this confirms the results obtained by FTIR. To confirm that the free proteins remain the
native state before CD measurement, free BSA and BLG were at different temperatures. The spectra
are presented in Fig. 3.13 C and D, respectively.
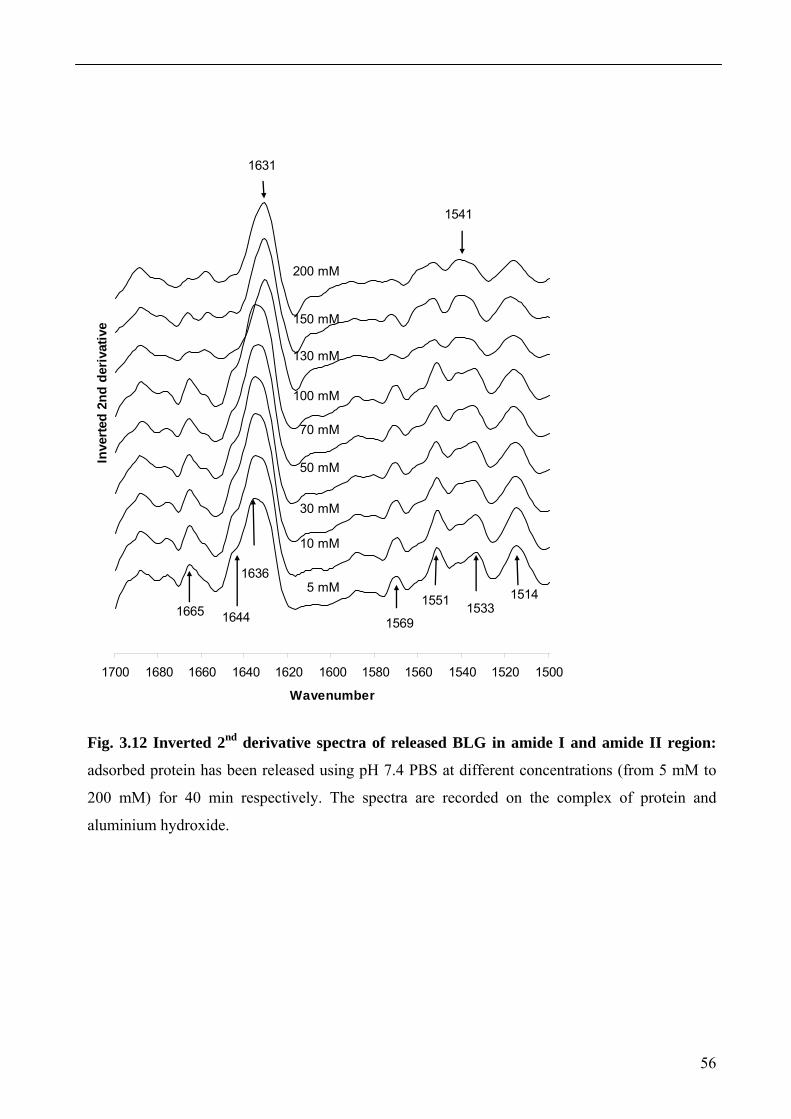
56
1700 1680 1660 1640 1620 1600 1580 1560 1540 1520 1500
Wavenumber
Inve
rted
2nd
der
ivat
ive
5 mM
10 mM
30 mM
50 mM
70 mM
100 mM
130 mM
150 mM
200 mM
1636
1631
16651569
1551 15331514
1644
1541
Fig. 3.12 Inverted 2nd derivative spectra of released BLG in amide I and amide II region:
adsorbed protein has been released using pH 7.4 PBS at different concentrations (from 5 mM to
200 mM) for 40 min respectively. The spectra are recorded on the complex of protein and
aluminium hydroxide.
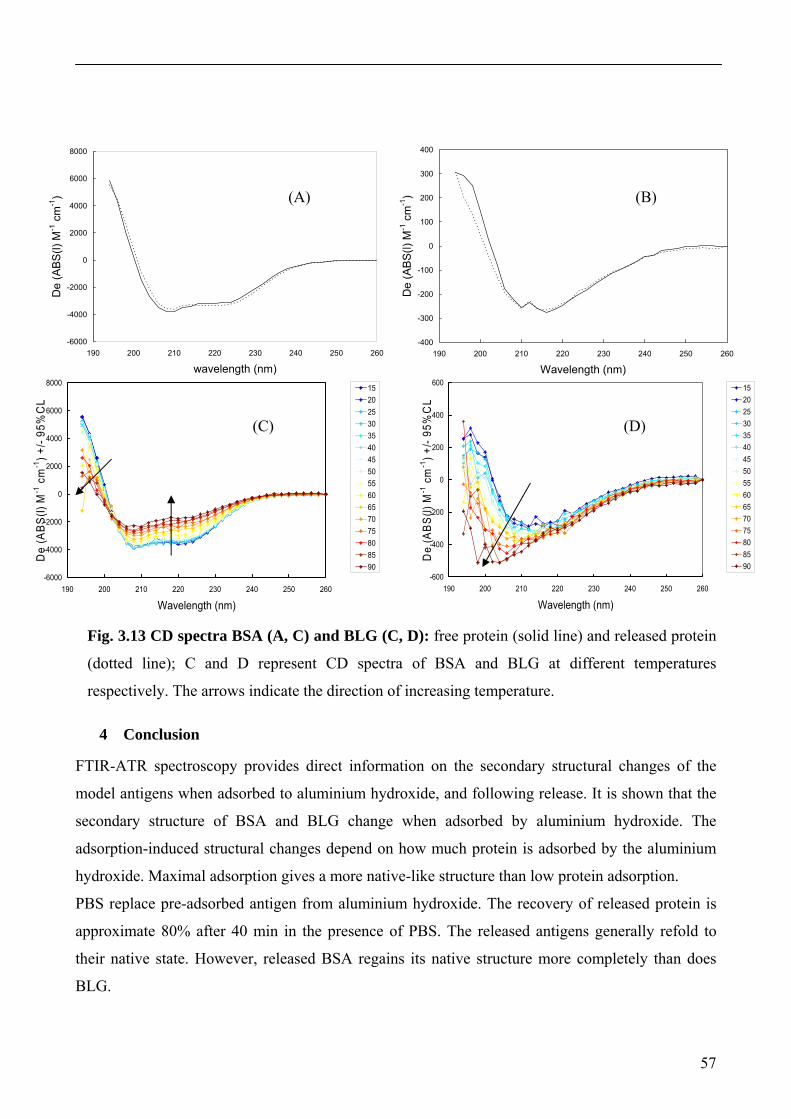
57
-6000
-4000
-2000
0
2000
4000
6000
8000
190 200 210 220 230 240 250 260
wavelength (nm)
De
(ABS
(l) M
-1 c
m-1
)
-400
-300
-200
-100
0
100
200
300
400
190 200 210 220 230 240 250 260
Wavelength (nm)
De
(AB
S(l)
M-1
cm
-1)
-600
-400
-200
0
200
400
600
190 200 210 220 230 240 250 260
Wavelength (nm)
De
(ABS
(l) M
-1 c
m-1
) +/-
95%
CL
15202530354045505560657075808590
-6000
-4000
-2000
0
2000
4000
6000
8000
190 200 210 220 230 240 250 260
Wavelength (nm)
De
(ABS
(l) M
-1 c
m-1
) +/-
95%
CL
15202530354045505560657075808590
Fig. 3.13 CD spectra BSA (A, C) and BLG (C, D): free protein (solid line) and released protein
(dotted line); C and D represent CD spectra of BSA and BLG at different temperatures
respectively. The arrows indicate the direction of increasing temperature.
4 Conclusion
FTIR-ATR spectroscopy provides direct information on the secondary structural changes of the
model antigens when adsorbed to aluminium hydroxide, and following release. It is shown that the
secondary structure of BSA and BLG change when adsorbed by aluminium hydroxide. The
adsorption-induced structural changes depend on how much protein is adsorbed by the aluminium
hydroxide. Maximal adsorption gives a more native-like structure than low protein adsorption.
PBS replace pre-adsorbed antigen from aluminium hydroxide. The recovery of released protein is
approximate 80% after 40 min in the presence of PBS. The released antigens generally refold to
their native state. However, released BSA regains its native structure more completely than does
BLG.
(C)
(A) (B)
(D)
58
References
1. Goldsby RA., Kindt T, Osborne BA, Immunology, 4th edition. New York: W.H. Freeman
and Company, 2001, p 63-65.
2. Schoneich C, Hageman MJ, Borchardt RT. Stability of peptides and proteins. In: Controlled
Drug Delivery. Challenges and strategies (Park K, Ed.). Washington DC: ASC professional
reference books, p. 205-228.
3. Manning MC, Patel K, Borchardt RT. Stability of protein pharmaceuticals. Pharmaceutical
Research 1989; 6: 903-918.
4. Fu K, Greibenow K, Hsieh L, Klibanov AM, Langer R. Use of FTIR spectroscopy to
characterize the secondary structure of proteins encapsulated with PLGA microspheres.
Journal of Controlled Release 1999; 58: 357-366.
5. Yang TH, Dong A, Meyer J, Johnson OL, Cleland J, Carpenter JF. Use of infrared
spectroscopy to assess secondary structure of human growth hormone within biocegradable
microspheres. Journal of Pharmaceutical Sciences-Columbus 1999; 88: 161-165.
6. Castelain C, Genot C, Conformational changes of bovine serum albumin upon its adsorption
in dodecane-in-water emulsions as revealed by front-face steady-state fluorescence.
Biochimica et Biophysica Acta 1994; 1199: 59-64.
7. Kowalczyk D, Slomkowski S, Wang FW. Changes in conformation of human serum
albumin and gamma globulins upon adsorption to polystyrene and poly latexes: Studies by
fluorescence spectroscopy. Journal of Bioactive and Compatible Polymers 1994; 9: 282-309.
8. Maste MCL, Norde W, Visser AJWG. Adsorption-induced conformational changes in the
serine proteinase sannase: A tryptophan fluorescence and circular dichroism study. Journal
of Colloid and Interface Science 1997; 196: 224-230.
9. Hem SL, White JL. Characterization of aluminum hydroxide for use as an adjuvant in
parenteral vaccines. Journal of Parenteral Science and Technology 1984; 38: 2-10.
10. Jones LS, Peek LJ, Power J, Marham A, Yazzie B, Middaugh CR. Effects of adsorption to
aluminum salt adjuvants on the structure and stability of model protein antigens. The
Journal of Biological Chemistry 2005; 280: 13406-13414.
11. Barth A, Zscherp C. What vibrations tell us about proteins, Quarterly reviews of biophysics
2002; 35: 369-430.
12. Haris PI. Theory and basic principles- 3. Fourier transform infrared spectroscopic studies of
59
peptides: potentials and pitfalls. ACS Symposium Series 2000; 750: 54-95.
13. Sharp JS, Forrest JA, Jones RAL. Surface denaturaration and amyloid fibril formation of
insulin at model lipid-water interface. Biochemistry 2002; 41: 15810-15819.
14. Giacomelli CE, Bremer MGEG, Norde W, ATR-FTIR study of IgG adsorbed on different
silica surface. Journal of Colloid and interface Science 1999; 220: 13-23.
15. Tarasevich YI, Monakhova LI. Interaction between globular proteins and silica surfaces.
Colloid Journal 2002; 64: 482-487.
16. Bummer PM. An FTIR study of the structure of human serum albumin adsorbed to
polysulfone. International Journal of Pharmaceutics 1996; 132:143-151.
17. Chittur KK. FTIR/ATR for protein adsorption to biomaterial surfaces. Biomaterials 1998;
19: 357-369.
18. Itri R, Caetano W, Barbosa LRS, Baptista MS. Effect of urea on bovine serum albumin in
aqueous and reverse micelle environments investigated by small angle X-ray scattering,
fluoresecence and circular dichroism. Brazilian Journal of Physics 2004; 34: 58-63.
19. Kossovsky N, Nguyen A, Sukiassians K, Festekjian A, Gelman A, Sponesler E. Secondary
structure of albumin acquired rapidly by modified conventional ATR-FTIR is comparable to
CD spectral data. Journal of Colloid and Interface Science, 1994; 166: 350-355.
20. Liu J, Feldkamp JL, White JL, Hem SL. Adsorption of phosphate by aluminium
hydroxycarbonate. Journal of Pharmaceutical Science 1984; 10: 1355-1358.
21. Robert P, Devaux MF, Mouhous N, Dufour E. Monitoring the secondary structure of
proteins by near infrared spectroscopy. Applied Spectroscopy, 1999; 53: 226-232.
22. Servagent NS, Revault M, Quiquampoix H, Baron MH. Conformational changes of bovine
serum albumin induced by adsorption on different clay surfaces: FTIR analysis. Journal of
Colloid and Interface Science 2000; 221: 272-283.
23. Sawyer L, Kontopidis G, Wu SY.β-lactoglobuli - A three-dimensional perspective.
International Journal of Food Science and Technology 1999; 34: 409-418.
24. Lefevre T, Subirade M. Interaction of β-lactoglobulin with phospholipids bilayers: a
molecular level elucidation as revealed by infrared spectroscopy. International Journal of
Biological Macromolecules, 2000; 28: 59-67.
25. Lenk TJ. Infrared studies of protein adsorption and transitions on polyurethanes. PhD
dissertation, University of Washington Chemical Engineering. 1994
26. Noinville SS, Revault M, Quiquamoix H, Baron MH. Conformational changes of bovine
60
serum albumin induced by adsorption on different clay surfaces: FTIR analysis. Journal of
Colloid and Interface Science, 2000; 221: 273-283.
27. Schladitz C, Vieira EP, Hermel H, Mohrwald H. Amyloid-β-sheet formation at the air-water
interface. Biophysics 1999; 77: 3305-3310.
28. Kendrick BS, Cleland JL, Lam X, Nguyen T, Randolph TW, Manning MC, Carpenter JF.
Aggregation of recombinant human interferon gamma: kinetics and structural transitions.
Journal of Pharmaceutical Science 1998; 87: 1069-1076.
29. Dong A, Prestrelski SJ, Allison SD, Carpenter JF. Infrared spectroscopy studies of
lyophilization- and temperature-induced protein aggregation. Journal of Pharmaceutical
Science 1995; 84:415-424.
30. Lefevre T, Subirade M. Conformational rearrangement of β-lactoglobulin upon interaction
with an anionic membrance. Biochimica et Biophysica Acta, 2001; 1549: 37-50.
31. Urano H, Fukuzaki S. Conformation of adsorbed bovine serum albumin governing its
desorption behavior at alumina-water interfaces. Journal of Bioscience and Bioengineering
2000; 90: 105-111.
32. Hajra S, Chattoraj DK. Protein adsorption at solid-liquid interfaces: part II- adsorption from
binary protein mixture, Indian Journal of Biochemistry and Biophysics 1991; 2: 124-132.
33. Xie J, Riley C, Kumar M, Chittur K. FTIR/ATR study of protein adsorption and brushite
transformation to hydroxyappatite. Biomaterials, 2002; 23: 3609-3616.
34. Norde W. Behavior of proteins at interfaces, with special attention to the role of the
structure stability of the protein molecule. Clinical Material, 1992; 11: 85-90.
35. Oberg KA, Fink AL. A new attenuated total reflectance Fourier transform infrared
spectroscopy method for the study of proteins in solution. Analytical Biochemistry, 1988;
256: 92-106.
36. Weet MVD, Hennink W, Jiskoot W. Protein instability in poly (lactic-co-glycolic acid)
microparticles. Pharmaceutical Research, 2000; 17: 1159-1167.
37. Cleland JL, Powell MF, Shire SJ. The development of stable protein formulations: a close
look at protein aggregation, deamidation, and oxidation. Critical Reviews in Therapeutic
Drug Carrier System, 1993; 10: 307-377.
38. Rinella JV, Workman RF, White JL, Hem SL. Elutabilility of proteins from aluminum-
containing vaccine adjuvants by treatment with surfactants. Journal of Colloid and Interface
Science 1998; 197: 48-56.

61
39. Engel MFM, Visser AJWG, Mierlo CPM. Refolding of adsorbed bovine α-lactalbumin
during surfactant induced displacement from a hydrophobic interface. Langmuir 2003; 7:
2929-2937.

62
Chapter IV: The structural stability of model antigens adsorbed by aluminium hydroxide in heating and aging processes in comparison to the antigens in solutions
Abstract
The structural stability of two model antigens adsorbed to aluminium-containing adjuvant was
studied. The two model antigens were bovine serum albumin (BSA) and β-lactoglobulin (BLG),
and the method used was Fourier transform infrared – attenuated total reflection (FTIR-ATR)
spectroscopy. The stability was studied during heating and storage. The results showed that the
structure of proteins when adsorbed onto the surface of aluminium hydroxide was more stable than
proteins in solution at high temperature and/or after a period of storage. This indicated that
adsorption by aluminium-containing adjuvants protected antigens against degrading. This
phenomenon was more pronounced for BSA than BLG. The reason might be that there are more
free BLG in the sample system compared to BSA. Reduced adsorption of proteins to the adjuvant in
a vaccine may facilitate the degradation of the antigen in the vaccine.
63
1 Introduction Aluminium-containing adjuvants are used in vaccines to adsorb the antigens and enhance the
immune response upon injection. Although the mechanism by which aluminium-containing
adjuvants potentiate the immune response is not fully understood, it is generally accepted that the
antigens should be adsorbed by the adjuvants [1]. The World Health Organization recommends that
at least 80% of tetanus and diphtheria toxoids should be adsorbed onto aluminium-containing
adjuvants [2]. Therefore, vaccines are produced by selecting adjuvants, pH, buffer, and/or ionic
strength to achieve maximal adsorption of the antigens [1].
The study of Jones et al. [3] and our previous work [4] have shown changes in secondary structure
when protein antigens are adsorbed by an aluminium hydroxide adjuvant. The stability of this
modified structure is of major importance, since it may affect degradation of the antigens during the
storage and/or due to high temperature, and this could potentially pose a risk to patients. The term
stability, when it relates to proteins, is often used in a variety of ways [5]. It includes chemical
and/or physical degradation. Chemical degradation refers to modifications involving covalent
bonds, such as deamidation, oxidation, and disulphide bond shuffling. Physical degradation
includes protein unfolding, undesirable adsorption to surfaces, and aggregation [6, 7]. However, the
definition in this paper is the stability of the secondary structure of protein.
In this study the secondary structures of two model antigens were investigated during heating and
storage in comparison to the antigens in solutions using Fourier transform infrared-attenuated total
reflection (FTIR-ATR) spectroscopy. For the storage experiments, apart from normal storage
temperature (4ºC), an accelerated degradation test (ADT) was also employed, which subjected the
samples to elevated temperature (37ºC) at which denaturation should occur more rapidly than at the
normal storage temperature. It is well known that some vaccines are temperature sensitive [8]. Both
high and low (freezing) temperatures can cause inactivation of vaccines. The structural stabilities of
the model antigens were investigated at different heating temperatures in this work, since the
temperature alterations are an important problem during the transportation and storage of vaccines,
especially in developing countries where the quality of the cold chain is not always optimal [9].
2 Materials and methods
2.1 Materials Clinical reagent grade bovine serum albumin (BSA, reference L84960) and approximate 90% β-
lactoglobulin (BLG, reference L3908) were purchased from ICN biomedical Inc and Sigma
64
respectively. Both proteins were used directly without further purification. Aluminium hydroxide
adjuvant was purchased from Superfos Biosector A/S (Denmark). A stock aluminium hydroxide
adjuvant was prepared by adjusting pH to 8 by the addition of 1 M NaOH. All other chemicals were
analytical grade and obtained from commercial sources without further treatment.
2.2 Sample preparation A stock protein solution (20 mg/ml) was prepared by dissolving a certain amount protein in Milli-Q
water. Model vaccines were prepared by mixing the appropriate amount of protein stock solution
and aluminium hydroxide. The final calculated aluminium concentration was 3.4 mg/ml and the
final protein concentrations 4 mg/ml. The final pH value for BSA and BLG model vaccines were
7.41 and 7.60, respectively. Samples were mixed gently by end-over-end rotation for 30 min to
obtain the maximal protein adsorption. Protein water solutions were prepared by diluting the stock
solution to 4 mg/ml using Milli-Q water. Blank samples containing 3.4 mg/ml aluminium hydroxide
without proteins, were prepared by diluting the stock aluminium adjuvants using Milli-Q water.
2.3 FTIR-ATR measurement Spectra were collected using a FTIR spectrometer (PerkinElmer Spectrum One), which was
mounted with a three bounces ZnSe ATR crystal (PerkinElmer). For the storage process, samples
were stored at 4 ºC and 37 ºC between experiments, respectively. All samples were measured at
room temperature. For the heating process, the samples were divided into different vials and were
heated at different temperature (25, 37, 50, 60, 70, 80, 90 ºC) for 30 min, respectively; and cooled
to room temperature before FTIR spectra were recorded.
A sample film was obtained by depositing an 8 μl sample onto the ATR crystal and evaporating the
solvent. The calculated amount of aluminium hydroxide for each film was 27.2 μg; and the
calculated amount of protein was 32 μg. Spectra were directly recorded on the film by co-adding
128 scans with a resolution of 4 cm-1 at a scan speed 0.2 cm/s. Control spectra were recorded by
measuring the blank samples which contained the same components except protein under the same
experiment conditions. All samples were analyzed at least in duplicate.
2.4 Data analysis All FTIR spectra were analyzed using the Unscrambler ver. 9.2 software (Camo process AS).
Replicated spectra of the same sample were averaged first. For the adsorbed proteins, the spectra of
a corresponding blank sample were subtracted from the spectra of the adsorbed proteins. A flat
baseline from 1900 to 1740 cm-1 was obtained for each spectrum after subtraction. A 23-point
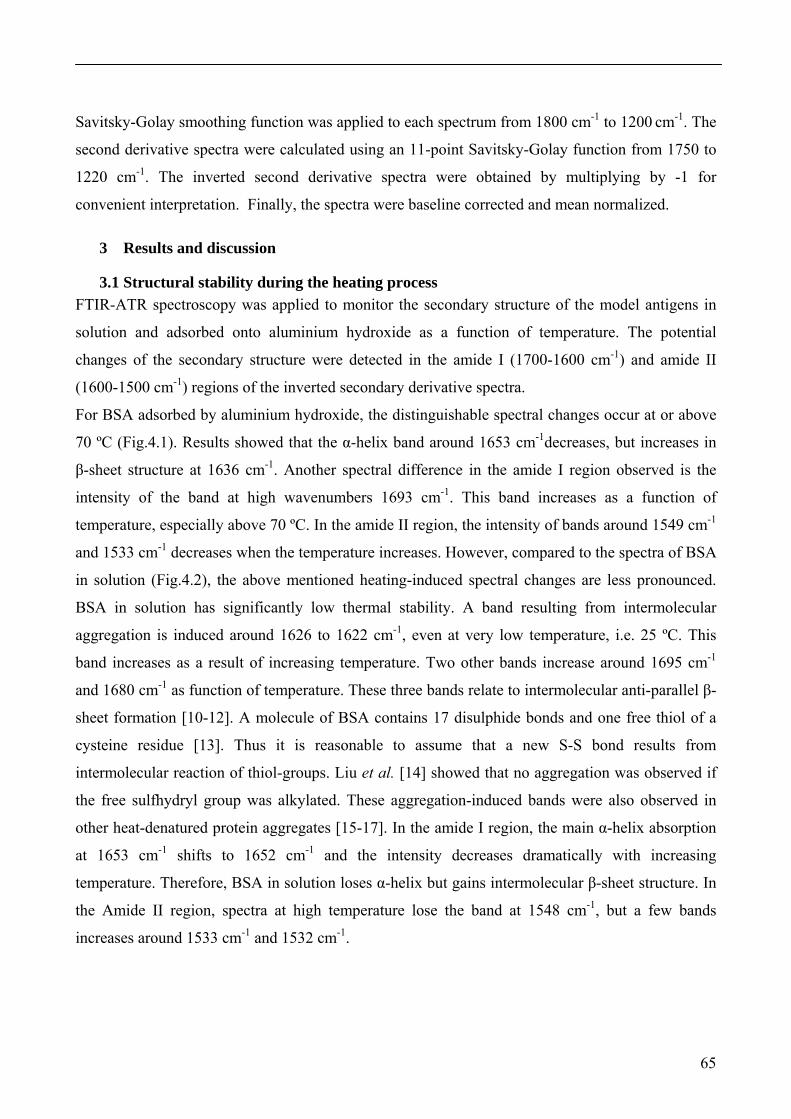
65
Savitsky-Golay smoothing function was applied to each spectrum from 1800 cm-1 to 1200 cm-1. The
second derivative spectra were calculated using an 11-point Savitsky-Golay function from 1750 to
1220 cm-1. The inverted second derivative spectra were obtained by multiplying by -1 for
convenient interpretation. Finally, the spectra were baseline corrected and mean normalized.
3 Results and discussion
3.1 Structural stability during the heating process FTIR-ATR spectroscopy was applied to monitor the secondary structure of the model antigens in
solution and adsorbed onto aluminium hydroxide as a function of temperature. The potential
changes of the secondary structure were detected in the amide I (1700-1600 cm-1) and amide II
(1600-1500 cm-1) regions of the inverted secondary derivative spectra.
For BSA adsorbed by aluminium hydroxide, the distinguishable spectral changes occur at or above
70 ºC (Fig.4.1). Results showed that the α-helix band around 1653 cm-1decreases, but increases in
β-sheet structure at 1636 cm-1. Another spectral difference in the amide I region observed is the
intensity of the band at high wavenumbers 1693 cm-1. This band increases as a function of
temperature, especially above 70 ºC. In the amide II region, the intensity of bands around 1549 cm-1
and 1533 cm-1 decreases when the temperature increases. However, compared to the spectra of BSA
in solution (Fig.4.2), the above mentioned heating-induced spectral changes are less pronounced.
BSA in solution has significantly low thermal stability. A band resulting from intermolecular
aggregation is induced around 1626 to 1622 cm-1, even at very low temperature, i.e. 25 ºC. This
band increases as a result of increasing temperature. Two other bands increase around 1695 cm-1
and 1680 cm-1 as function of temperature. These three bands relate to intermolecular anti-parallel β-
sheet formation [10-12]. A molecule of BSA contains 17 disulphide bonds and one free thiol of a
cysteine residue [13]. Thus it is reasonable to assume that a new S-S bond results from
intermolecular reaction of thiol-groups. Liu et al. [14] showed that no aggregation was observed if
the free sulfhydryl group was alkylated. These aggregation-induced bands were also observed in
other heat-denatured protein aggregates [15-17]. In the amide I region, the main α-helix absorption
at 1653 cm-1 shifts to 1652 cm-1 and the intensity decreases dramatically with increasing
temperature. Therefore, BSA in solution loses α-helix but gains intermolecular β-sheet structure. In
the Amide II region, spectra at high temperature lose the band at 1548 cm-1, but a few bands
increases around 1533 cm-1 and 1532 cm-1.
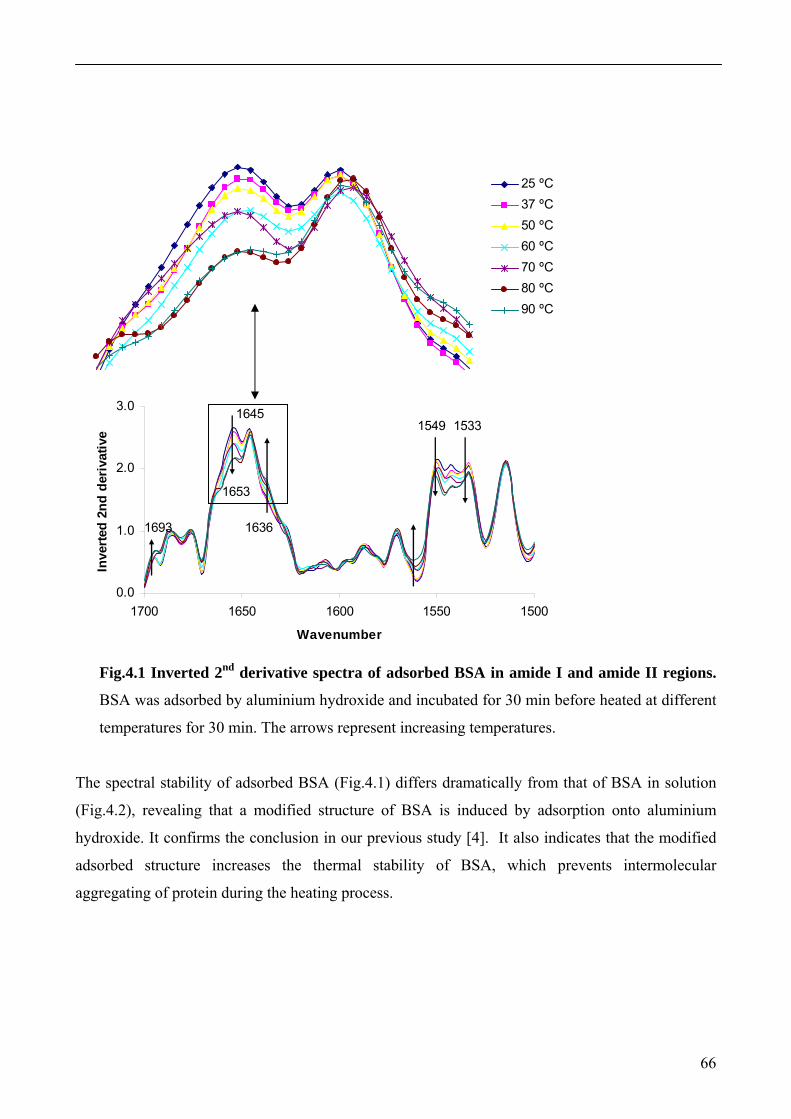
66
25 ºC37 ºC50 ºC60 ºC70 ºC80 ºC90 ºC
0.0
1.0
2.0
3.0
1700 1650 1600 1550 1500
Wavenumber
Inve
rted
2nd
der
ivat
ive
1653
1549 1533
1636
1645
1693
Fig.4.1 Inverted 2nd derivative spectra of adsorbed BSA in amide I and amide II regions.
BSA was adsorbed by aluminium hydroxide and incubated for 30 min before heated at different
temperatures for 30 min. The arrows represent increasing temperatures.
The spectral stability of adsorbed BSA (Fig.4.1) differs dramatically from that of BSA in solution
(Fig.4.2), revealing that a modified structure of BSA is induced by adsorption onto aluminium
hydroxide. It confirms the conclusion in our previous study [4]. It also indicates that the modified
adsorbed structure increases the thermal stability of BSA, which prevents intermolecular
aggregating of protein during the heating process.
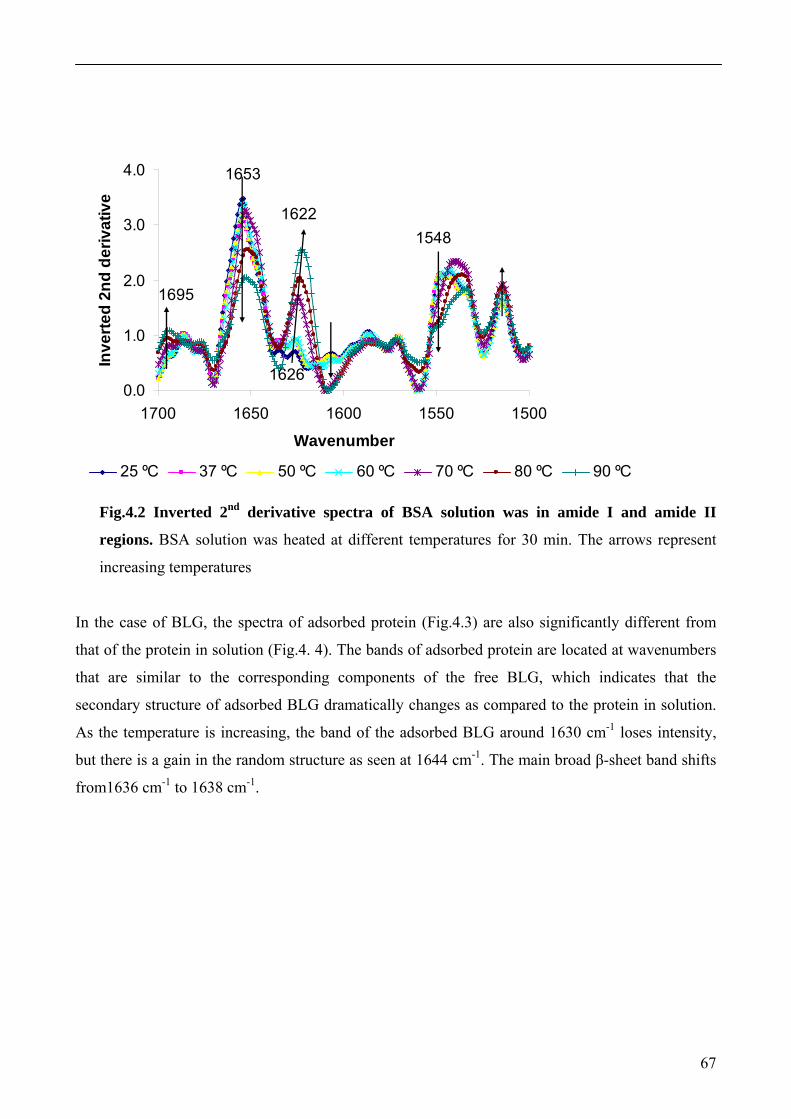
67
0.0
1.0
2.0
3.0
4.0
1700 1650 1600 1550 1500
Wavenumber
Inve
rted
2nd
deriv
ativ
e
25 ºC 37 ºC 50 ºC 60 ºC 70 ºC 80 ºC 90 ºC
1653
1622
1626
1695
1548
Fig.4.2 Inverted 2nd derivative spectra of BSA solution was in amide I and amide II
regions. BSA solution was heated at different temperatures for 30 min. The arrows represent
increasing temperatures
In the case of BLG, the spectra of adsorbed protein (Fig.4.3) are also significantly different from
that of the protein in solution (Fig.4. 4). The bands of adsorbed protein are located at wavenumbers
that are similar to the corresponding components of the free BLG, which indicates that the
secondary structure of adsorbed BLG dramatically changes as compared to the protein in solution.
As the temperature is increasing, the band of the adsorbed BLG around 1630 cm-1 loses intensity,
but there is a gain in the random structure as seen at 1644 cm-1. The main broad β-sheet band shifts
from1636 cm-1 to 1638 cm-1.
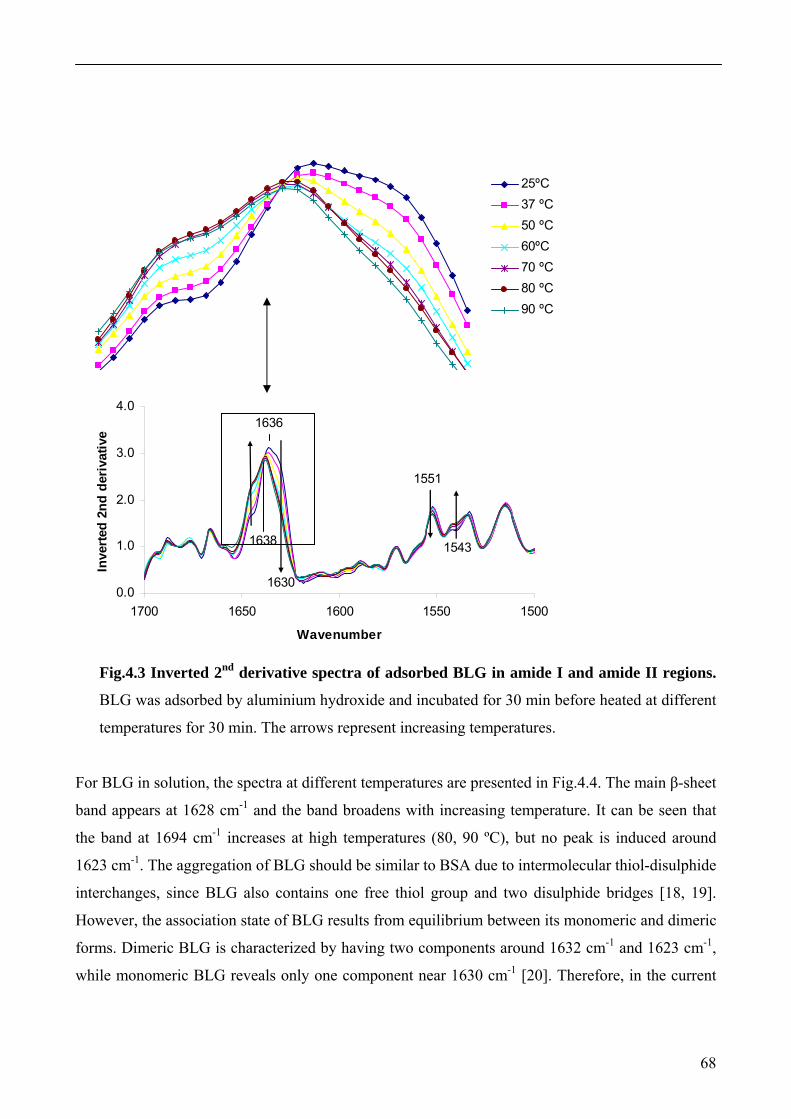
68
25ºC37 ºC50 ºC60ºC70 ºC80 ºC90 ºC
0.0
1.0
2.0
3.0
4.0
1700 1650 1600 1550 1500
Wavenumber
Inve
rted
2nd
der
ivat
ive
1636
1638
1551
1543
1630
Fig.4.3 Inverted 2nd derivative spectra of adsorbed BLG in amide I and amide II regions.
BLG was adsorbed by aluminium hydroxide and incubated for 30 min before heated at different
temperatures for 30 min. The arrows represent increasing temperatures.
For BLG in solution, the spectra at different temperatures are presented in Fig.4.4. The main β-sheet
band appears at 1628 cm-1 and the band broadens with increasing temperature. It can be seen that
the band at 1694 cm-1 increases at high temperatures (80, 90 ºC), but no peak is induced around
1623 cm-1. The aggregation of BLG should be similar to BSA due to intermolecular thiol-disulphide
interchanges, since BLG also contains one free thiol group and two disulphide bridges [18, 19].
However, the association state of BLG results from equilibrium between its monomeric and dimeric
forms. Dimeric BLG is characterized by having two components around 1632 cm-1 and 1623 cm-1,
while monomeric BLG reveals only one component near 1630 cm-1 [20]. Therefore, in the current
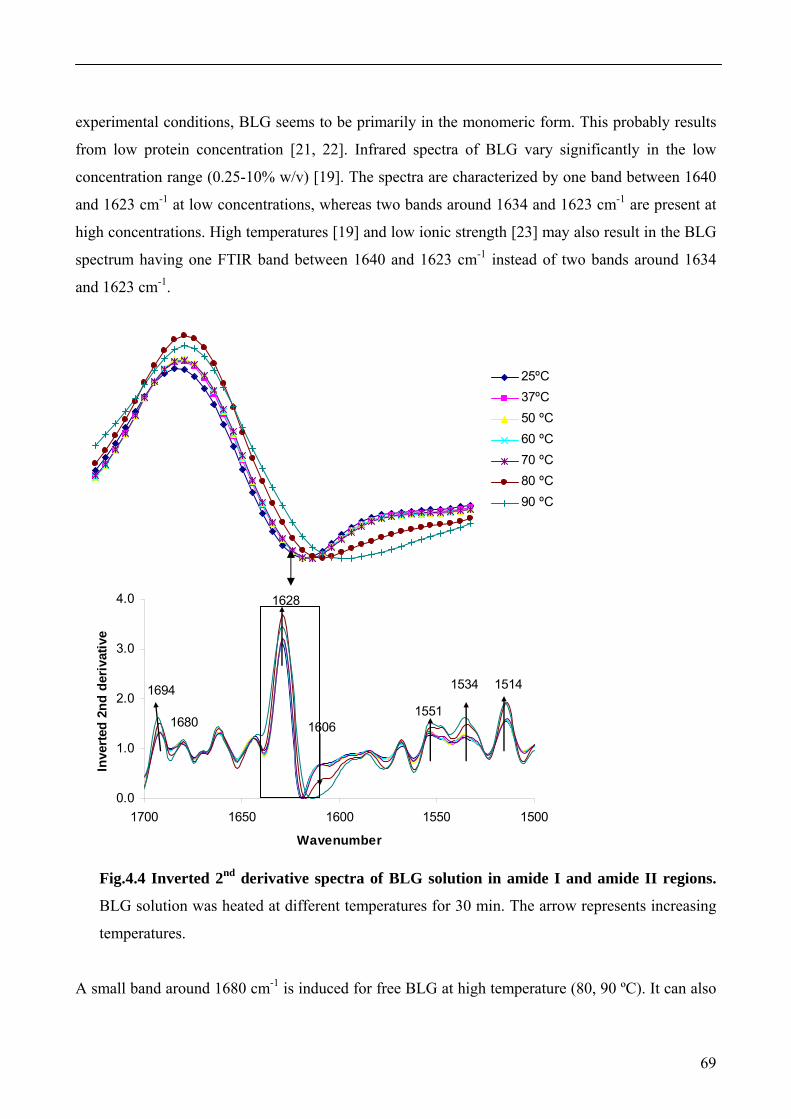
69
experimental conditions, BLG seems to be primarily in the monomeric form. This probably results
from low protein concentration [21, 22]. Infrared spectra of BLG vary significantly in the low
concentration range (0.25-10% w/v) [19]. The spectra are characterized by one band between 1640
and 1623 cm-1 at low concentrations, whereas two bands around 1634 and 1623 cm-1 are present at
high concentrations. High temperatures [19] and low ionic strength [23] may also result in the BLG
spectrum having one FTIR band between 1640 and 1623 cm-1 instead of two bands around 1634
and 1623 cm-1.
25ºC37ºC50 ºC60 ºC70 ºC80 ºC90 ºC
0.0
1.0
2.0
3.0
4.0
1700 1650 1600 1550 1500
Wavenumber
Inve
rted
2nd
der
ivat
ive
1694
1680
1628
16061551
1534 1514
Fig.4.4 Inverted 2nd derivative spectra of BLG solution in amide I and amide II regions.
BLG solution was heated at different temperatures for 30 min. The arrow represents increasing
temperatures.
A small band around 1680 cm-1 is induced for free BLG at high temperature (80, 90 ºC). It can also
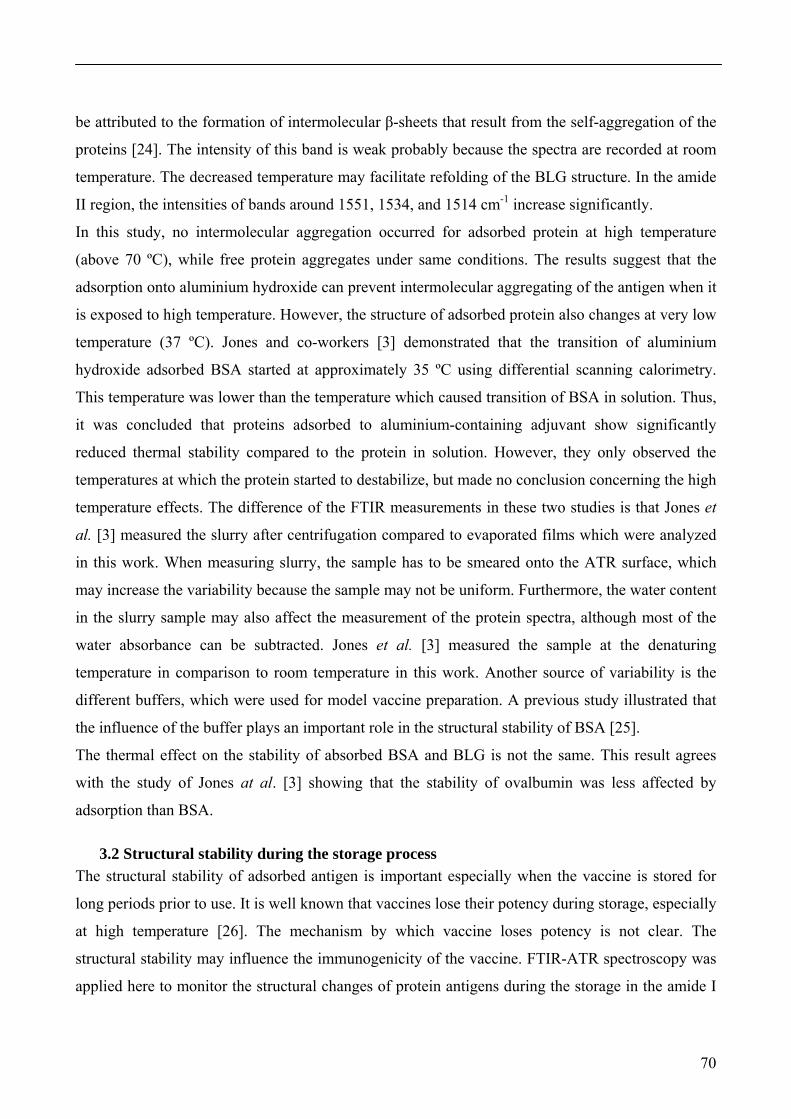
70
be attributed to the formation of intermolecular β-sheets that result from the self-aggregation of the
proteins [24]. The intensity of this band is weak probably because the spectra are recorded at room
temperature. The decreased temperature may facilitate refolding of the BLG structure. In the amide
II region, the intensities of bands around 1551, 1534, and 1514 cm-1 increase significantly.
In this study, no intermolecular aggregation occurred for adsorbed protein at high temperature
(above 70 ºC), while free protein aggregates under same conditions. The results suggest that the
adsorption onto aluminium hydroxide can prevent intermolecular aggregating of the antigen when it
is exposed to high temperature. However, the structure of adsorbed protein also changes at very low
temperature (37 ºC). Jones and co-workers [3] demonstrated that the transition of aluminium
hydroxide adsorbed BSA started at approximately 35 ºC using differential scanning calorimetry.
This temperature was lower than the temperature which caused transition of BSA in solution. Thus,
it was concluded that proteins adsorbed to aluminium-containing adjuvant show significantly
reduced thermal stability compared to the protein in solution. However, they only observed the
temperatures at which the protein started to destabilize, but made no conclusion concerning the high
temperature effects. The difference of the FTIR measurements in these two studies is that Jones et
al. [3] measured the slurry after centrifugation compared to evaporated films which were analyzed
in this work. When measuring slurry, the sample has to be smeared onto the ATR surface, which
may increase the variability because the sample may not be uniform. Furthermore, the water content
in the slurry sample may also affect the measurement of the protein spectra, although most of the
water absorbance can be subtracted. Jones et al. [3] measured the sample at the denaturing
temperature in comparison to room temperature in this work. Another source of variability is the
different buffers, which were used for model vaccine preparation. A previous study illustrated that
the influence of the buffer plays an important role in the structural stability of BSA [25].
The thermal effect on the stability of absorbed BSA and BLG is not the same. This result agrees
with the study of Jones at al. [3] showing that the stability of ovalbumin was less affected by
adsorption than BSA.
3.2 Structural stability during the storage process The structural stability of adsorbed antigen is important especially when the vaccine is stored for
long periods prior to use. It is well known that vaccines lose their potency during storage, especially
at high temperature [26]. The mechanism by which vaccine loses potency is not clear. The
structural stability may influence the immunogenicity of the vaccine. FTIR-ATR spectroscopy was
applied here to monitor the structural changes of protein antigens during the storage in the amide I
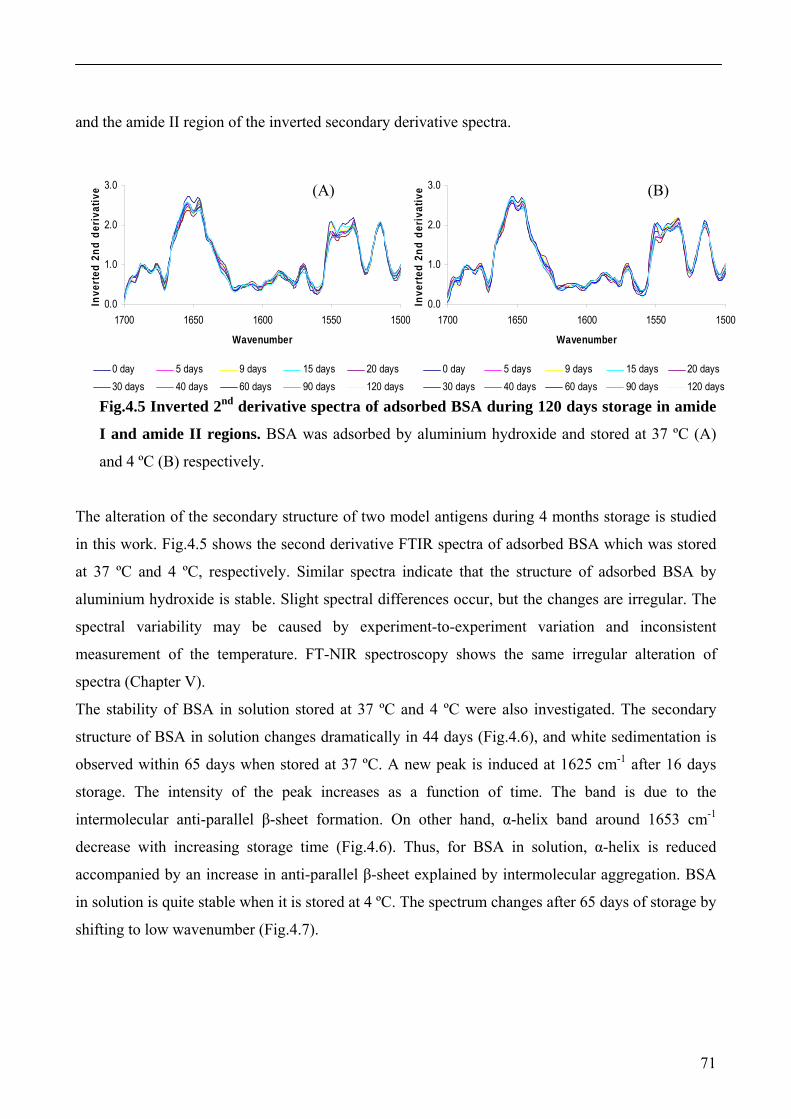
71
0.0
1.0
2.0
3.0
1700 1650 1600 1550 1500
Wavenumber
Inve
rted
2nd
deriv
ativ
e
0 day 5 days 9 days 15 days 20 days30 days 40 days 60 days 90 days 120 days
0.0
1.0
2.0
3.0
1700 1650 1600 1550 1500
Wavenumber
Inve
rted
2nd
deriv
ativ
e
0 day 5 days 9 days 15 days 20 days30 days 40 days 60 days 90 days 120 days
and the amide II region of the inverted secondary derivative spectra.
Fig.4.5 Inverted 2nd derivative spectra of adsorbed BSA during 120 days storage in amide
I and amide II regions. BSA was adsorbed by aluminium hydroxide and stored at 37 ºC (A)
and 4 ºC (B) respectively.
The alteration of the secondary structure of two model antigens during 4 months storage is studied
in this work. Fig.4.5 shows the second derivative FTIR spectra of adsorbed BSA which was stored
at 37 ºC and 4 ºC, respectively. Similar spectra indicate that the structure of adsorbed BSA by
aluminium hydroxide is stable. Slight spectral differences occur, but the changes are irregular. The
spectral variability may be caused by experiment-to-experiment variation and inconsistent
measurement of the temperature. FT-NIR spectroscopy shows the same irregular alteration of
spectra (Chapter V).
The stability of BSA in solution stored at 37 ºC and 4 ºC were also investigated. The secondary
structure of BSA in solution changes dramatically in 44 days (Fig.4.6), and white sedimentation is
observed within 65 days when stored at 37 ºC. A new peak is induced at 1625 cm-1 after 16 days
storage. The intensity of the peak increases as a function of time. The band is due to the
intermolecular anti-parallel β-sheet formation. On other hand, α-helix band around 1653 cm-1
decrease with increasing storage time (Fig.4.6). Thus, for BSA in solution, α-helix is reduced
accompanied by an increase in anti-parallel β-sheet explained by intermolecular aggregation. BSA
in solution is quite stable when it is stored at 4 ºC. The spectrum changes after 65 days of storage by
shifting to low wavenumber (Fig.4.7).
(A) (B)
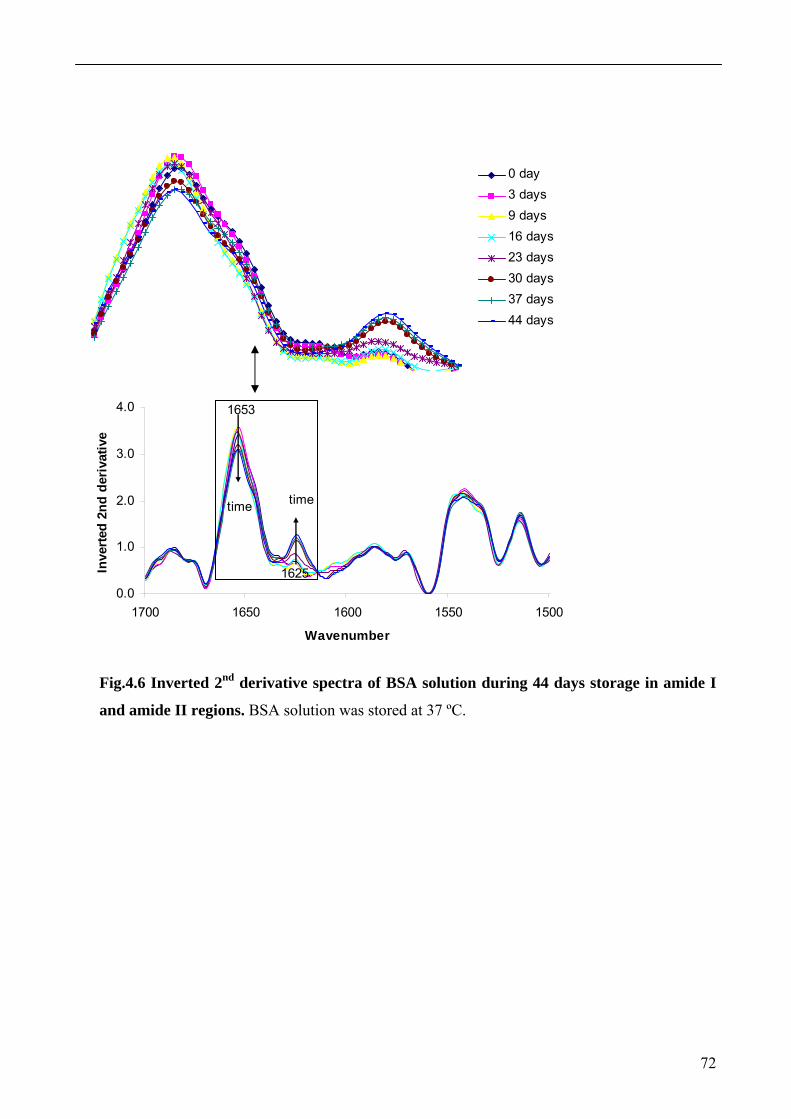
72
0 day3 days9 days16 days23 days30 days37 days44 days
0.0
1.0
2.0
3.0
4.0
1700 1650 1600 1550 1500
Wavenumber
Inve
rted
2nd
der
ivat
ive
time
1625
time
1653
Fig.4.6 Inverted 2nd derivative spectra of BSA solution during 44 days storage in amide I
and amide II regions. BSA solution was stored at 37 ºC.
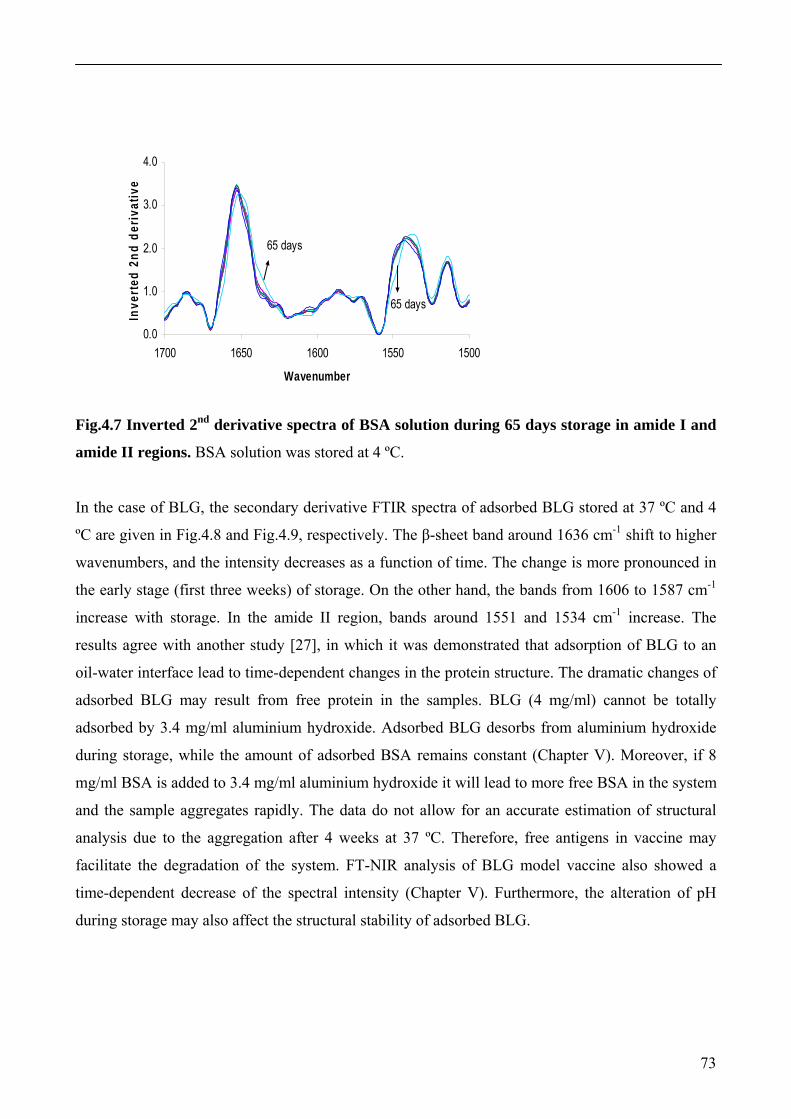
73
0.0
1.0
2.0
3.0
4.0
1700 1650 1600 1550 1500
Wavenumber
Inve
rted
2nd
der
ivat
ive
65 days
65 days
Fig.4.7 Inverted 2nd derivative spectra of BSA solution during 65 days storage in amide I and
amide II regions. BSA solution was stored at 4 ºC.
In the case of BLG, the secondary derivative FTIR spectra of adsorbed BLG stored at 37 ºC and 4
ºC are given in Fig.4.8 and Fig.4.9, respectively. The β-sheet band around 1636 cm-1 shift to higher
wavenumbers, and the intensity decreases as a function of time. The change is more pronounced in
the early stage (first three weeks) of storage. On the other hand, the bands from 1606 to 1587 cm-1
increase with storage. In the amide II region, bands around 1551 and 1534 cm-1 increase. The
results agree with another study [27], in which it was demonstrated that adsorption of BLG to an
oil-water interface lead to time-dependent changes in the protein structure. The dramatic changes of
adsorbed BLG may result from free protein in the samples. BLG (4 mg/ml) cannot be totally
adsorbed by 3.4 mg/ml aluminium hydroxide. Adsorbed BLG desorbs from aluminium hydroxide
during storage, while the amount of adsorbed BSA remains constant (Chapter V). Moreover, if 8
mg/ml BSA is added to 3.4 mg/ml aluminium hydroxide it will lead to more free BSA in the system
and the sample aggregates rapidly. The data do not allow for an accurate estimation of structural
analysis due to the aggregation after 4 weeks at 37 ºC. Therefore, free antigens in vaccine may
facilitate the degradation of the system. FT-NIR analysis of BLG model vaccine also showed a
time-dependent decrease of the spectral intensity (Chapter V). Furthermore, the alteration of pH
during storage may also affect the structural stability of adsorbed BLG.
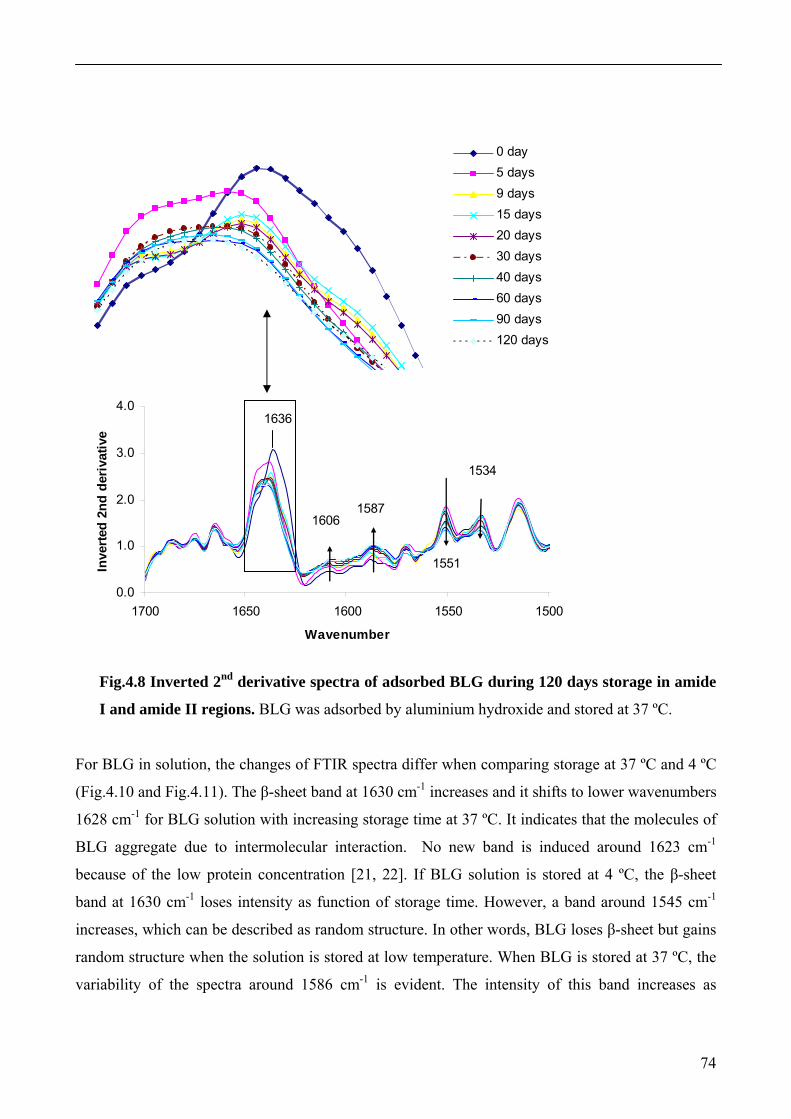
74
0 day5 days9 days15 days20 days30 days 40 days60 days90 days120 days
0.0
1.0
2.0
3.0
4.0
1700 1650 1600 1550 1500
Wavenumber
Inve
rted
2nd
der
ivat
ive
1636
1551
15871606
1534
Fig.4.8 Inverted 2nd derivative spectra of adsorbed BLG during 120 days storage in amide
I and amide II regions. BLG was adsorbed by aluminium hydroxide and stored at 37 ºC.
For BLG in solution, the changes of FTIR spectra differ when comparing storage at 37 ºC and 4 ºC
(Fig.4.10 and Fig.4.11). The β-sheet band at 1630 cm-1 increases and it shifts to lower wavenumbers
1628 cm-1 for BLG solution with increasing storage time at 37 ºC. It indicates that the molecules of
BLG aggregate due to intermolecular interaction. No new band is induced around 1623 cm-1
because of the low protein concentration [21, 22]. If BLG solution is stored at 4 ºC, the β-sheet
band at 1630 cm-1 loses intensity as function of storage time. However, a band around 1545 cm-1
increases, which can be described as random structure. In other words, BLG loses β-sheet but gains
random structure when the solution is stored at low temperature. When BLG is stored at 37 ºC, the
variability of the spectra around 1586 cm-1 is evident. The intensity of this band increases as
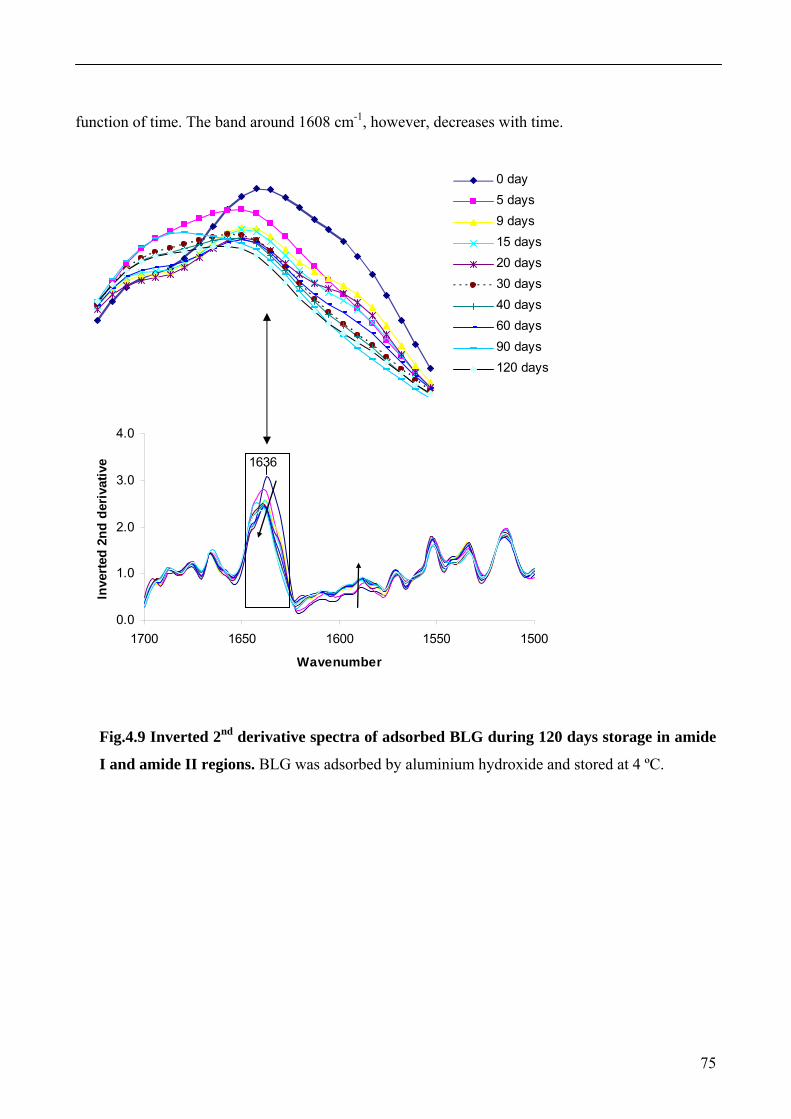
75
function of time. The band around 1608 cm-1, however, decreases with time.
0 day5 days9 days15 days20 days30 days 40 days60 days90 days120 days
0.0
1.0
2.0
3.0
4.0
1700 1650 1600 1550 1500
Wavenumber
Inve
rted
2nd
der
ivat
ive 1636
Fig.4.9 Inverted 2nd derivative spectra of adsorbed BLG during 120 days storage in amide
I and amide II regions. BLG was adsorbed by aluminium hydroxide and stored at 4 ºC.
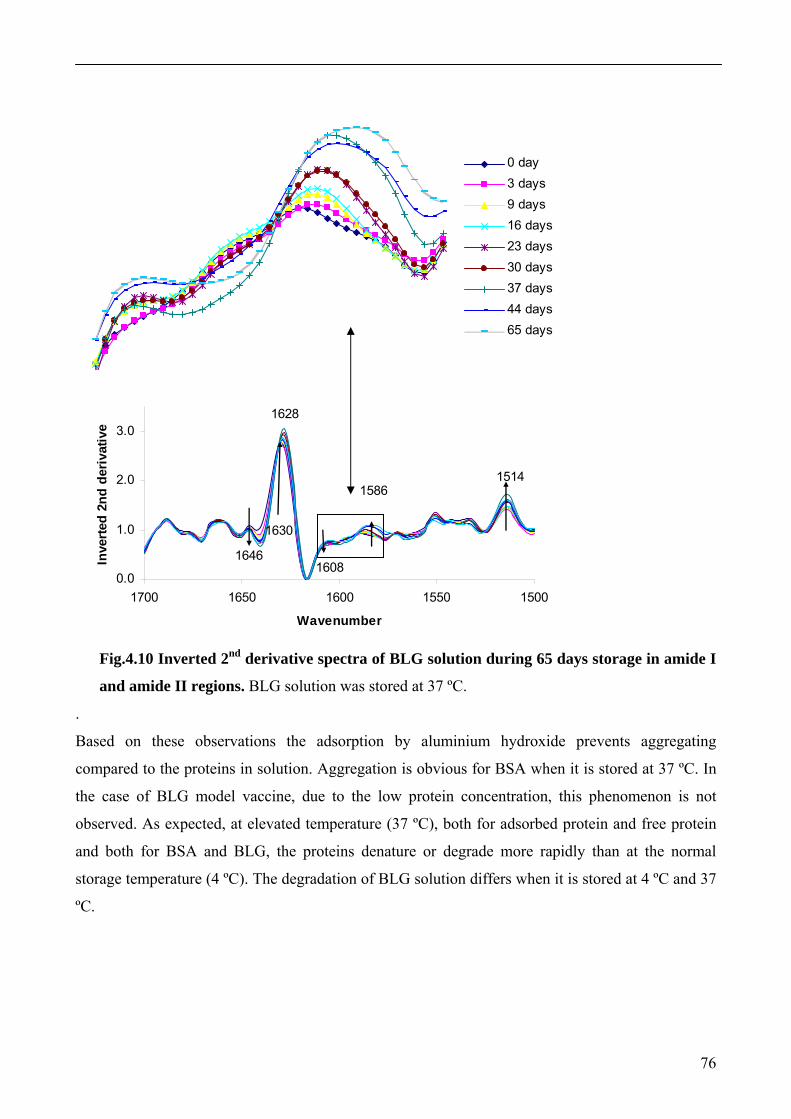
76
0 day3 days9 days16 days23 days30 days37 days44 days65 days
0.0
1.0
2.0
3.0
1700 1650 1600 1550 1500
Wavenumber
Inve
rted
2nd
deriv
ativ
e
1646
1628
15141586
1630
1608
Fig.4.10 Inverted 2nd derivative spectra of BLG solution during 65 days storage in amide I
and amide II regions. BLG solution was stored at 37 ºC.
.
Based on these observations the adsorption by aluminium hydroxide prevents aggregating
compared to the proteins in solution. Aggregation is obvious for BSA when it is stored at 37 ºC. In
the case of BLG model vaccine, due to the low protein concentration, this phenomenon is not
observed. As expected, at elevated temperature (37 ºC), both for adsorbed protein and free protein
and both for BSA and BLG, the proteins denature or degrade more rapidly than at the normal
storage temperature (4 ºC). The degradation of BLG solution differs when it is stored at 4 ºC and 37
ºC.
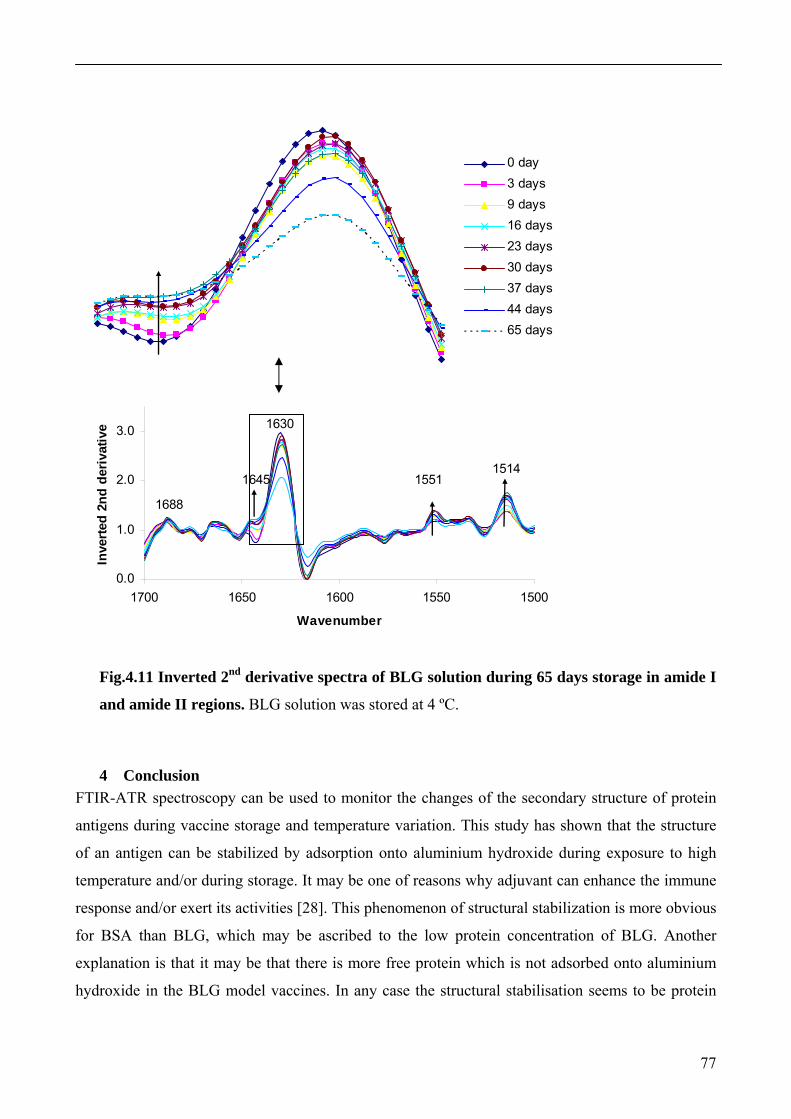
77
0 day3 days9 days16 days23 days30 days37 days44 days65 days
0.0
1.0
2.0
3.0
1700 1650 1600 1550 1500
Wavenumber
Inve
rted
2nd
deriv
ativ
e
1688
1551
1630
15141645
Fig.4.11 Inverted 2nd derivative spectra of BLG solution during 65 days storage in amide I
and amide II regions. BLG solution was stored at 4 ºC.
4 Conclusion FTIR-ATR spectroscopy can be used to monitor the changes of the secondary structure of protein
antigens during vaccine storage and temperature variation. This study has shown that the structure
of an antigen can be stabilized by adsorption onto aluminium hydroxide during exposure to high
temperature and/or during storage. It may be one of reasons why adjuvant can enhance the immune
response and/or exert its activities [28]. This phenomenon of structural stabilization is more obvious
for BSA than BLG, which may be ascribed to the low protein concentration of BLG. Another
explanation is that it may be that there is more free protein which is not adsorbed onto aluminium
hydroxide in the BLG model vaccines. In any case the structural stabilisation seems to be protein

78
specific. Free protein antigens present in vaccines may facilitate degradation of the vaccine, but
further experiments are required to confirm this hypothesis.
79
References
1. Chang MF, Shi Y, Nail SL, HogenEsch H, Adams SB, White JL, Hem SL. Degree of
antigen adsorption in the vaccine or interstitial fluid and its effect on the antibody response
in rabbits. Vaccine, 2001, 19: 2884-2889.
2. World Health Organization. Immunological adjuvants. World Health Organization
Technical Report Series No. 595. Geneva: World Health Organization, 1976: 6-8.
3. Jones LS, Peek LJ, Power J, Markham A, Yazzie B. Effects of adsorption to aluminum salt
adjuvants on the structure and stability of model protein antigens. The Journal of Biological
Chemistry, 2005; 280: 13406-13414.
4. Zheng Y, Lai X, Ipsen H, Larsen JN , Løwenstein H, Søndergaard I, Jacobsen S.
Characterization of the structural changes of model antigens using FTIR-ATR. submitted to
Vaccine, 2006.
5. Manning MC, Patella L, Borchardt RY. Stability of protein pharmaceuticals. Pharmaceutical
Research, 1989; 6: 903-917.
6. Chi EY, Krishnan S, Randolph TW, Carpenter JF. Physical stability of proteins in aqueous
solution: mechanism and driving faces in nonnative protein aggregation. Pharmaceutical
Research, 2003; 20: 1325-1336.
7. Randolph TW, Jones LS. Surfactant-protein interactions. In: Carpenter JF, Mannings MC
(Eds.). Rational design of stable protein formulations, theory and practice. Kluwer
Academic/Plenum Publishers, New York, 2002, p198.
8. Frank KJ. Monitoring temperature-sensitive vaccines and immunologic drugs, including
anthrax vaccine. American Journal of Health-System Pharmacy, 1999; 56: 2052-2055.
9. Coenen F, Tolboom JTBM, Frijlink HW. Stability of influenza sub-unit vaccine: does a
couple of days outside the refrigerator matter. Vaccine, 2006; 24: 525-531.
10. Militello V, Casarino C, Emanuele A, Giostra A, Pullara F, Leone M. Aggregation kinetics
of bovine serum albumin studied by FTIR spectroscopy and light scattering. Biophysical
Chemistry, 2004; 107:175-187.
11. Meersman F, Smeller L, Heremans K. Comparative Fourier transform infrared spectroscopy
study of cold-, pressure- and heat-induced unfolding and aggregation of myoglobin.
Biophysical Journal. 2002; 82: 2635-2644.
80
12. Stokkum JHM, Linsdell HL, Hadden JM, Haris PI, Chapman D, Bloemenda L.
Temperature-induced changes in protein structures studied by Fourier transform infrared
spectroscopy and globe analysis. Biochemistry, 1995; 34: 10508-10518.
13. Foster JF. Some aspects of the structure and conformational properties of serum alumin. In:
Roseoer VM, Oratz M, Rothschild MA (Eds.). Albumin structure, function, and uses.
Pergamon Press, Oxford, England. 1977. p53-84.
14. Liu WR, Langer R, Klibanov AM. Moisture-induced aggregation of lyophilized proteins in
the solid state. Biotechnology and Bioengineering, 1991; 37: 177-184.
15. Schladitz C, Vieira EP, Hermel H, Mohrwald H. Amyloid-β-sheet formation at the air-water
interface. Biophysics 1999; 77: 3305-3310.
16. Kendrick BS, Cleland JL, Lam X, Nguyen T, Randolph TW, Manning MC, Carpenter JF.
Aggregation of recombinant human interferon gamma: kinetics and structural transitions.
Journal of Pharmaceutical Science 1998; 87: 1069-1076.
17. Dong A, Prestrelski SJ, Allison SD, Carpenter JF. Infrared spectroscopy studies of
lyophilization- and temperature-induced protein aggregation. Journal of Pharmaceutical
Science, 1995; 84: 415-424.
18. McKenzie HA, Ralston GB, Shaw DC. Location of sulfhydryl and disulfide groups in
bovine-lactoglobulins and effect of urea. Biochemistry, 1972; 21: 4539-4546.
19. Lefevre T, Subirade M. Interaction of β-lactoglobulin with phospholipids bilayers: a
molecular level elucidation as revealed by infrared spectroscopy. International Journal of
Biological Macromolecules, 2000; 28: 59-67.
20. Lefevre T, Subirade M. Conformational rearrangement of β-lactoglobulin upon interaction
with an anionic membrance. Biochimica et Biophysica Acta, 2001; 1549: 37-50.
21. Lefevre T, Subirade M. Structural and interaction properties of β-lactoglobulin as studied by
FTIR spectroscopy. International Journal of Food Science and Technology, 1999; 34: 419-
428.
22. Czarnik MB, Murayama K, Wu Y, Ozaki Y. Two-dimensional attenuated total
reflection/infrared correlation spectroscopy of adsorption-induced and concentration-
dependent spectral variations of β-lactoglobulin in aqueous solutions. Journal of Physical
Chemistry, 2000; 104: 7803-7811.
81
23. Aymard P, Durand D, Nicolai T. The effect of temperature and ionic strength on the
dimerisation of β-lactoglobulin. International Journal of Biological Macromolecules, 1996;
19: 213-221.
24. Clark AH, Saunderson DHP, Suggett A. Infrared and laser-Raman spectroscopic studies of
thermally-induced globular protein gels. International Journal of Peptide and Protein
Research, 1981; 17: 353-364.
25. Larsericsdotter H, Oscarsson S, Buijs J. Structure, stability, and orientation of BSA
adsorbed to silica. Journal of Colloid and Interface Science, 2005; 289: 26-35.
26. Arya SC, Agarwal N. Efficacy of measles vaccine interlinked with potency and storage.
Acta Tropica, 2004; 90: 223-225.
27. Fang Y, Dalgleish DG. Conformation of β-lactoglobulin studied by FTIR: effect of pH,
temperature, and adsorption to the oil-water interface. Journal of Colloid and Interface
Science, 1997; 196: 292-298.
28. Guideline on adjuvants in vaccines for human use. The European Medicines Agency.
http://www.emea.eu.int Feb, 2006.
82
Chapter V: Stability of model vaccines during storage analysed by NIR spectroscopy
Abstract
Two model vaccines were monitored during storage at normal and elevated temperatures. The
results showed that the release of pre-adsorbed protein antigen decreases drastically. It may indicate
why vaccine loses or decreases potency during storage. The protein adsorption by aluminium
hydroxide and pH of vaccine also change during storage, and these two parameters are protein
specific. NIR spectroscopy is for the first time used to monitor the aging of vaccine. The results
suggest that it may be possible to detect the changes of adsorption/desorption of protein antigens,
but difficult to determine the alteration of particle size during vaccine storage, even though
analyzing the particle size of aluminium hydroxide may be practical. The rotation effects on both
model vaccines and aluminium hydroxide are also investigated. Drastically rotation increases the
particle size of aluminium hydroxide and may denature protein antigens. Thus, it should be
minimised in vaccine productions.
83
1 Introduction It is well known that vaccines may lose potency prior to vaccination after long period storage,
especially at high temperatures [1]. To ensure the optimal potency of vaccines, storage and handling
need careful attention. However, the ‘cold chain’ system required during storage and shipment is
not always optimal in developing countries [2]. The stability of vaccine especially the rate at which
vaccine may lose its potency is of great importance to decide whether the vaccine should be
destroyed, retesting or used [3]. It is also valuable to ensure reproducible efficacy of the
vaccination. The loss of potency has been studied for some specific vaccines during storage at
different conditions [4, 5], but the reason that vaccine loses potency is not clear. Previous
investigators hypothesised that it might be due to the reversal of protein adsorption from aluminium
adjuvant or because of the secondary, tertiary or quaternary structure or even fragmentation of the
protein antigens [6, 7].
To well understand the stability of vaccine and the potential reasons that vaccines lose the potency
during storage, a few parameters such as pH, adsorption capacity onto aluminium adjuvant, in vitro
release of the adsorbed antigen and near infrared (NIR) absorbance of two model vaccines were
investigated in this study. To our knowledge, NIR spectroscopy (more details are available in
Chapter I and Chapter VI) was for the first time reported here for monitoring the aging process
during vaccine storage. Apart from stored at the normal storage temperature (4 ºC), an elevated
temperature (37 ºC) was also applied in this study, at which the degradation of vaccine should occur
more rapidly than at 4 ºC.
2 Materials and methods
2.1 Materials
Clinical reagent grade BSA (reference L84960) and approximate 90% BLG (reference L3908) were
purchased from ICN biomedical Inc and Sigma respectively. Both proteins were used directly
without further purification. Aluminium hydroxide adjuvant was purchased from Superfos
Biosector A/S (Denmark). A stock aluminium hydroxide adjuvant was prepared by adjusting pH to
8 by the addition of 1 M NaOH. Other chemicals were all of analytical grade and obtained from
commercial sources.
2.2 Model vaccine preparation
Model vaccines were prepared by mixing the appropriate amount of protein stock solution and
84
aluminium hydroxide. The final calculated aluminium concentration was 1.14 mg/ml and the final
protein concentration was 2.5 mg/ml. Samples were mixed gently by end-over-end rotation. The
protein adsorption capacity onto aluminium hydroxide was investigated as the function of time at
room temperature. To study the influence of the rotation time on the aluminium hydroxide, two
concentrations in two different tubes were studied. The samples were measured using FT-NIR
spectroscopy and the slopes of the NIR absorption curves were probed.
The model vaccines for storage experiments were produced at the identical conditions with 30 min
rotation. Thereafter, all samples were stored at 4 ºC and 37 ºC, respectively.
2.3 Experimental procedures
Model vaccine preparation
Protein adsorption capacity was determined by measuring the light absorbance at 280 and 320 nm
using a UV/VIS spectrophotometer (Lamda 800, PerkenElmer instruments) with a 1 cm pathlength
after centrifugation at 9000 × g for 10 min. Protein adsorption capacity was calculated by following
equation (Eq. 5.1):
Alum
pro
C
AAC
AC ε320280 −
−= Eq. 5.1
where AC is adsorption capacity, ε is extinction coefficient, Cpro is total added protein and CAlum is
total added aluminium hydroxide, 280A and 320A are the UV absorbance of protein at 280 nm and
320 nm, respectively.
The data of rotation effects on protein adsorption capacity and aluminium hydroxide were analyzed
using the Prism software, version 4.03 (GraphPad Software, USA).
Stability of model vaccine during storage
One randomly selected vial for each sample was withdrawn every week. After the sample had
reached room temperature, pH was determined using a pH meter (Meterlab PHM220, Radiometer
Analytical SAS).
The same sample was gently mixed for 10 min before Fourier transform near infrared spectroscopy
(FT-NIR) analysis using a FT-NIR spectrometer (PerkinElmer Spectrum One, PerkinElmer) with an
InGaAs detector. Each spectrum was the average of 80 scans at 16 cm-1 resolution over the range of
780-2500 nm. The raw NIR spectra were investigated and subsequently analysed by a partial least
squared regression (PLS) modelling using the Unscrambler software, version 9.2 (Camo process
AS, Oslo, Norway).
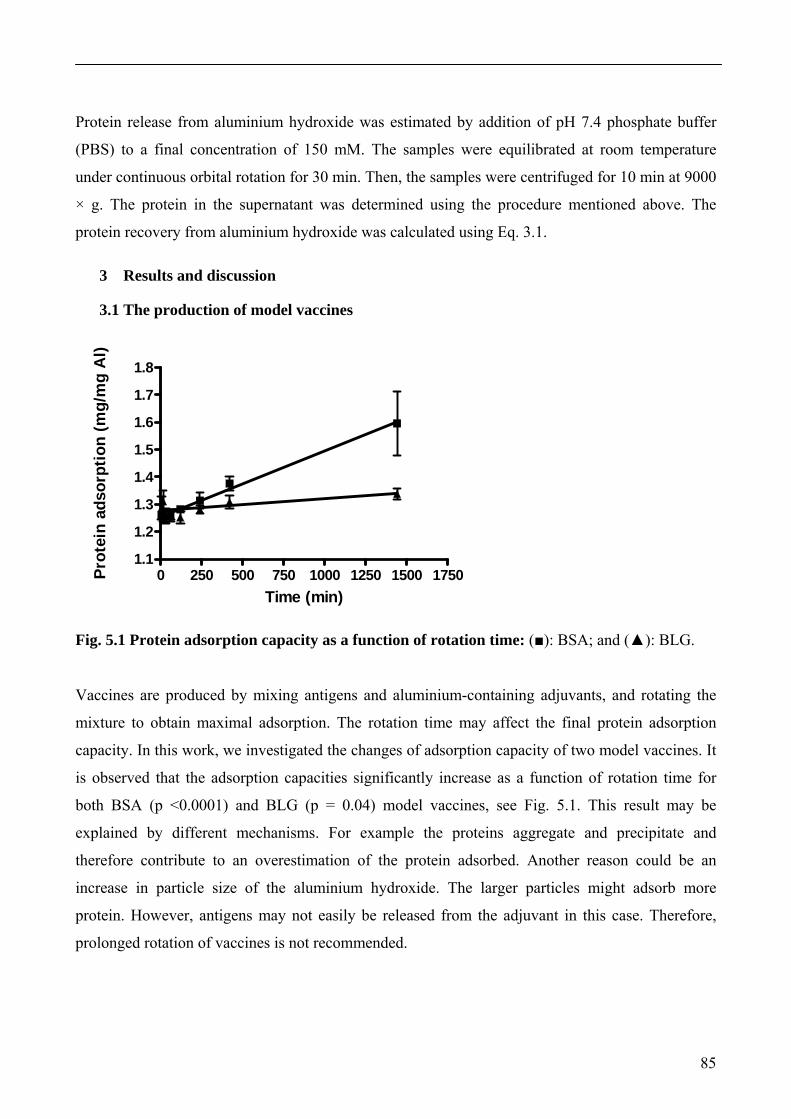
85
Protein release from aluminium hydroxide was estimated by addition of pH 7.4 phosphate buffer
(PBS) to a final concentration of 150 mM. The samples were equilibrated at room temperature
under continuous orbital rotation for 30 min. Then, the samples were centrifuged for 10 min at 9000
× g. The protein in the supernatant was determined using the procedure mentioned above. The
protein recovery from aluminium hydroxide was calculated using Eq. 3.1.
3 Results and discussion
3.1 The production of model vaccines
0 250 500 750 1000 1250 1500 17501.1
1.2
1.3
1.4
1.5
1.6
1.7
1.8
Time (min)
Prot
ein
adso
rptio
n (m
g/m
g A
l)
Fig. 5.1 Protein adsorption capacity as a function of rotation time: (■): BSA; and (▲): BLG.
Vaccines are produced by mixing antigens and aluminium-containing adjuvants, and rotating the
mixture to obtain maximal adsorption. The rotation time may affect the final protein adsorption
capacity. In this work, we investigated the changes of adsorption capacity of two model vaccines. It
is observed that the adsorption capacities significantly increase as a function of rotation time for
both BSA (p <0.0001) and BLG (p = 0.04) model vaccines, see Fig. 5.1. This result may be
explained by different mechanisms. For example the proteins aggregate and precipitate and
therefore contribute to an overestimation of the protein adsorbed. Another reason could be an
increase in particle size of the aluminium hydroxide. The larger particles might adsorb more
protein. However, antigens may not easily be released from the adjuvant in this case. Therefore,
prolonged rotation of vaccines is not recommended.
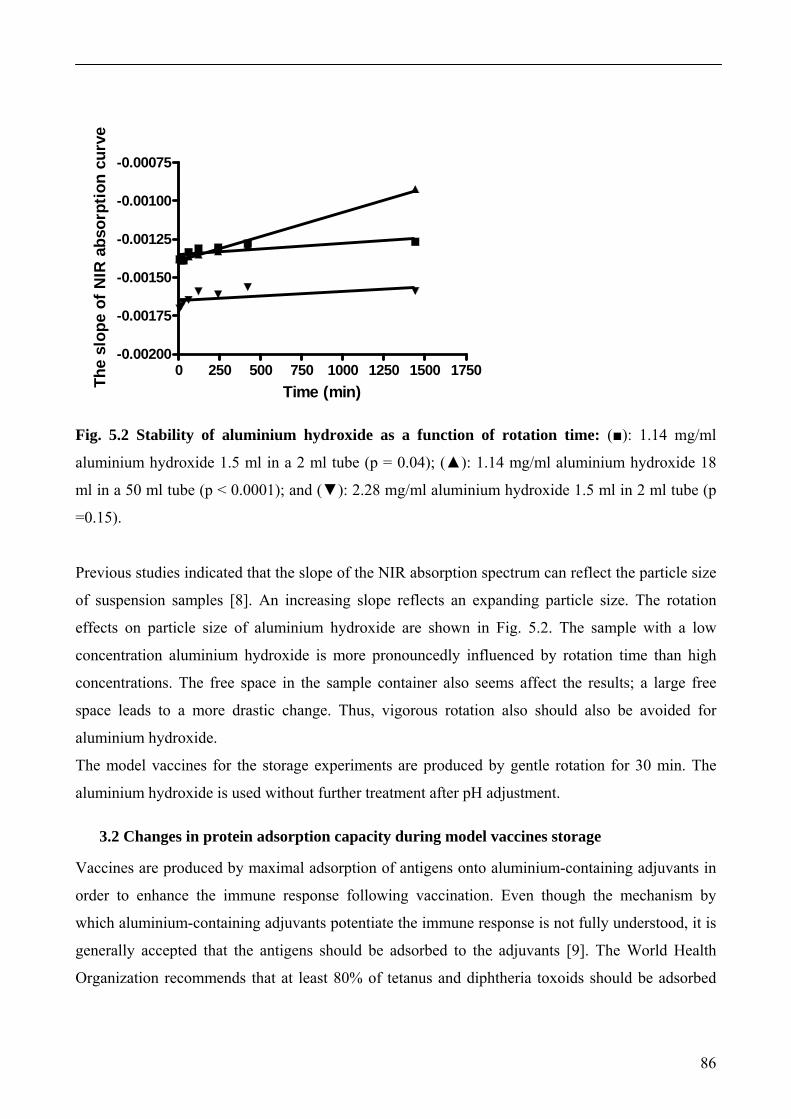
86
0 250 500 750 1000 1250 1500 1750-0.00200
-0.00175
-0.00150
-0.00125
-0.00100
-0.00075
Time (min)The
slop
e of
NIR
abs
orpt
ion
curv
e
Fig. 5.2 Stability of aluminium hydroxide as a function of rotation time: (■): 1.14 mg/ml
aluminium hydroxide 1.5 ml in a 2 ml tube (p = 0.04); (▲): 1.14 mg/ml aluminium hydroxide 18
ml in a 50 ml tube (p < 0.0001); and (▼): 2.28 mg/ml aluminium hydroxide 1.5 ml in 2 ml tube (p
=0.15).
Previous studies indicated that the slope of the NIR absorption spectrum can reflect the particle size
of suspension samples [8]. An increasing slope reflects an expanding particle size. The rotation
effects on particle size of aluminium hydroxide are shown in Fig. 5.2. The sample with a low
concentration aluminium hydroxide is more pronouncedly influenced by rotation time than high
concentrations. The free space in the sample container also seems affect the results; a large free
space leads to a more drastic change. Thus, vigorous rotation also should also be avoided for
aluminium hydroxide.
The model vaccines for the storage experiments are produced by gentle rotation for 30 min. The
aluminium hydroxide is used without further treatment after pH adjustment.
3.2 Changes in protein adsorption capacity during model vaccines storage
Vaccines are produced by maximal adsorption of antigens onto aluminium-containing adjuvants in
order to enhance the immune response following vaccination. Even though the mechanism by
which aluminium-containing adjuvants potentiate the immune response is not fully understood, it is
generally accepted that the antigens should be adsorbed to the adjuvants [9]. The World Health
Organization recommends that at least 80% of tetanus and diphtheria toxoids should be adsorbed
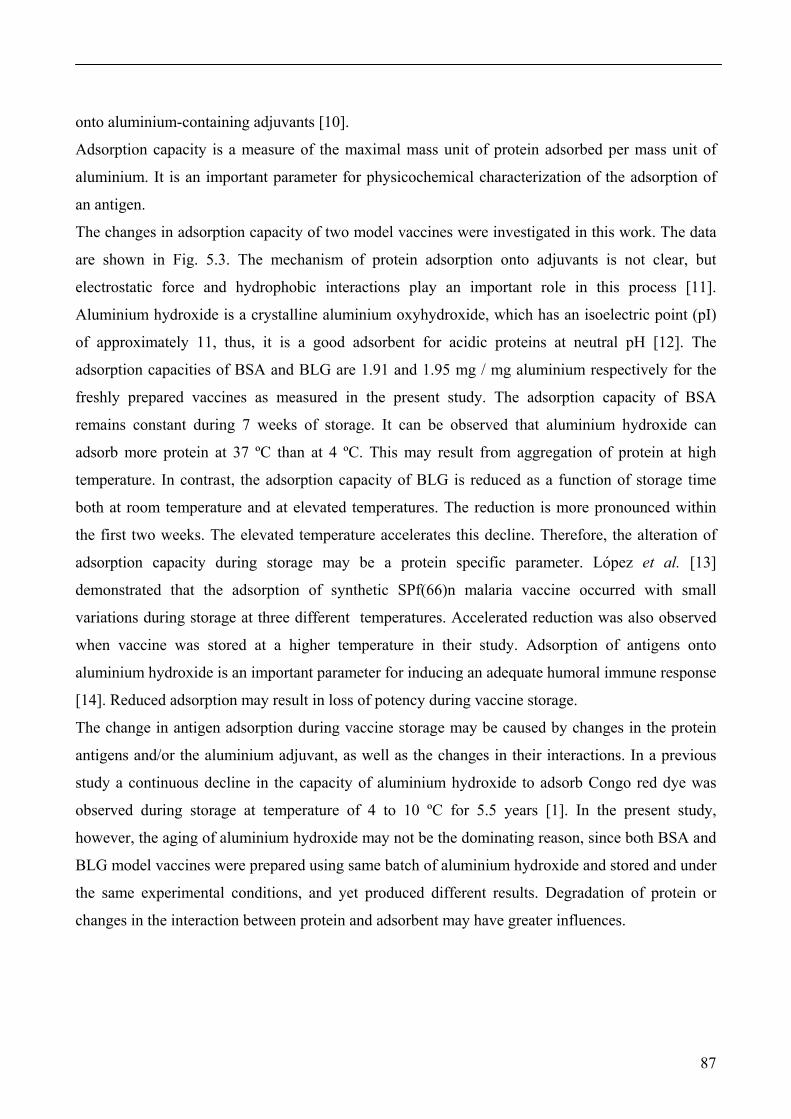
87
onto aluminium-containing adjuvants [10].
Adsorption capacity is a measure of the maximal mass unit of protein adsorbed per mass unit of
aluminium. It is an important parameter for physicochemical characterization of the adsorption of
an antigen.
The changes in adsorption capacity of two model vaccines were investigated in this work. The data
are shown in Fig. 5.3. The mechanism of protein adsorption onto adjuvants is not clear, but
electrostatic force and hydrophobic interactions play an important role in this process [11].
Aluminium hydroxide is a crystalline aluminium oxyhydroxide, which has an isoelectric point (pI)
of approximately 11, thus, it is a good adsorbent for acidic proteins at neutral pH [12]. The
adsorption capacities of BSA and BLG are 1.91 and 1.95 mg / mg aluminium respectively for the
freshly prepared vaccines as measured in the present study. The adsorption capacity of BSA
remains constant during 7 weeks of storage. It can be observed that aluminium hydroxide can
adsorb more protein at 37 ºC than at 4 ºC. This may result from aggregation of protein at high
temperature. In contrast, the adsorption capacity of BLG is reduced as a function of storage time
both at room temperature and at elevated temperatures. The reduction is more pronounced within
the first two weeks. The elevated temperature accelerates this decline. Therefore, the alteration of
adsorption capacity during storage may be a protein specific parameter. López et al. [13]
demonstrated that the adsorption of synthetic SPf(66)n malaria vaccine occurred with small
variations during storage at three different temperatures. Accelerated reduction was also observed
when vaccine was stored at a higher temperature in their study. Adsorption of antigens onto
aluminium hydroxide is an important parameter for inducing an adequate humoral immune response
[14]. Reduced adsorption may result in loss of potency during vaccine storage.
The change in antigen adsorption during vaccine storage may be caused by changes in the protein
antigens and/or the aluminium adjuvant, as well as the changes in their interactions. In a previous
study a continuous decline in the capacity of aluminium hydroxide to adsorb Congo red dye was
observed during storage at temperature of 4 to 10 ºC for 5.5 years [1]. In the present study,
however, the aging of aluminium hydroxide may not be the dominating reason, since both BSA and
BLG model vaccines were prepared using same batch of aluminium hydroxide and stored and under
the same experimental conditions, and yet produced different results. Degradation of protein or
changes in the interaction between protein and adsorbent may have greater influences.
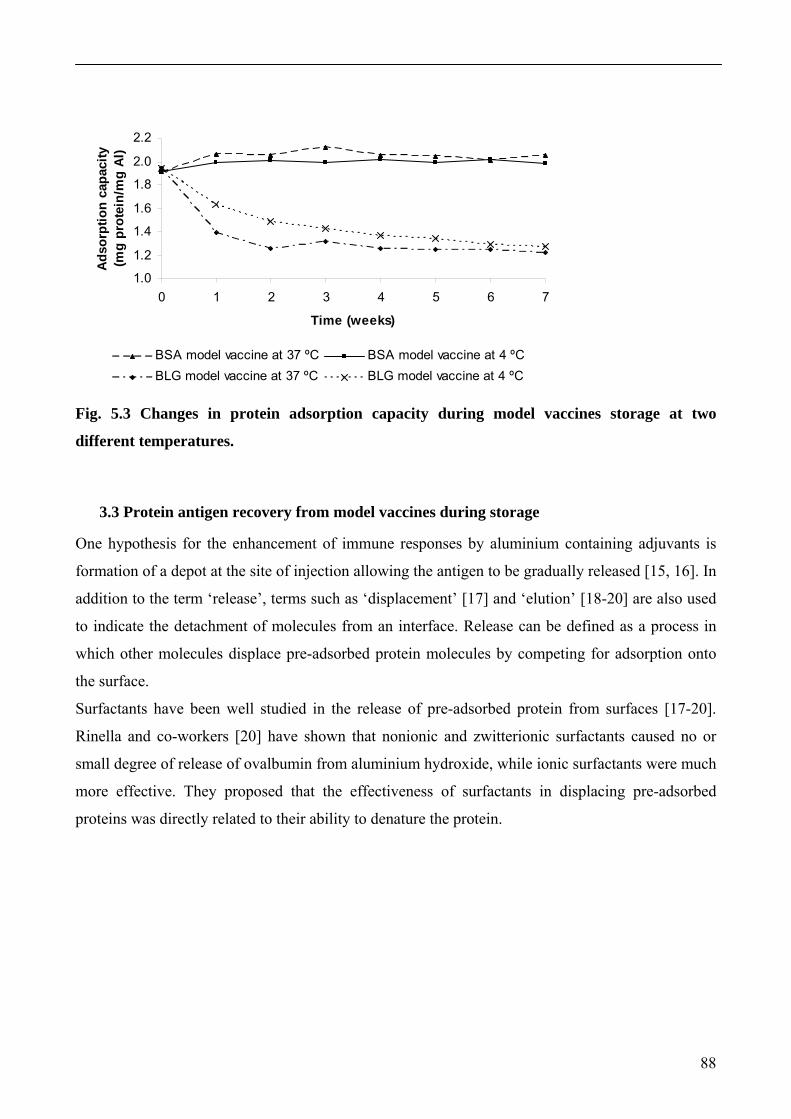
88
1.0
1.2
1.4
1.6
1.8
2.0
2.2
0 1 2 3 4 5 6 7
Time (weeks)
Adso
rptio
n ca
paci
ty(m
g pr
otei
n/m
g Al
)
BSA model vaccine at 37 ºC BSA model vaccine at 4 ºC BLG model vaccine at 37 ºC BLG model vaccine at 4 ºC
Fig. 5.3 Changes in protein adsorption capacity during model vaccines storage at two
different temperatures.
3.3 Protein antigen recovery from model vaccines during storage
One hypothesis for the enhancement of immune responses by aluminium containing adjuvants is
formation of a depot at the site of injection allowing the antigen to be gradually released [15, 16]. In
addition to the term ‘release’, terms such as ‘displacement’ [17] and ‘elution’ [18-20] are also used
to indicate the detachment of molecules from an interface. Release can be defined as a process in
which other molecules displace pre-adsorbed protein molecules by competing for adsorption onto
the surface.
Surfactants have been well studied in the release of pre-adsorbed protein from surfaces [17-20].
Rinella and co-workers [20] have shown that nonionic and zwitterionic surfactants caused no or
small degree of release of ovalbumin from aluminium hydroxide, while ionic surfactants were much
more effective. They proposed that the effectiveness of surfactants in displacing pre-adsorbed
proteins was directly related to their ability to denature the protein.
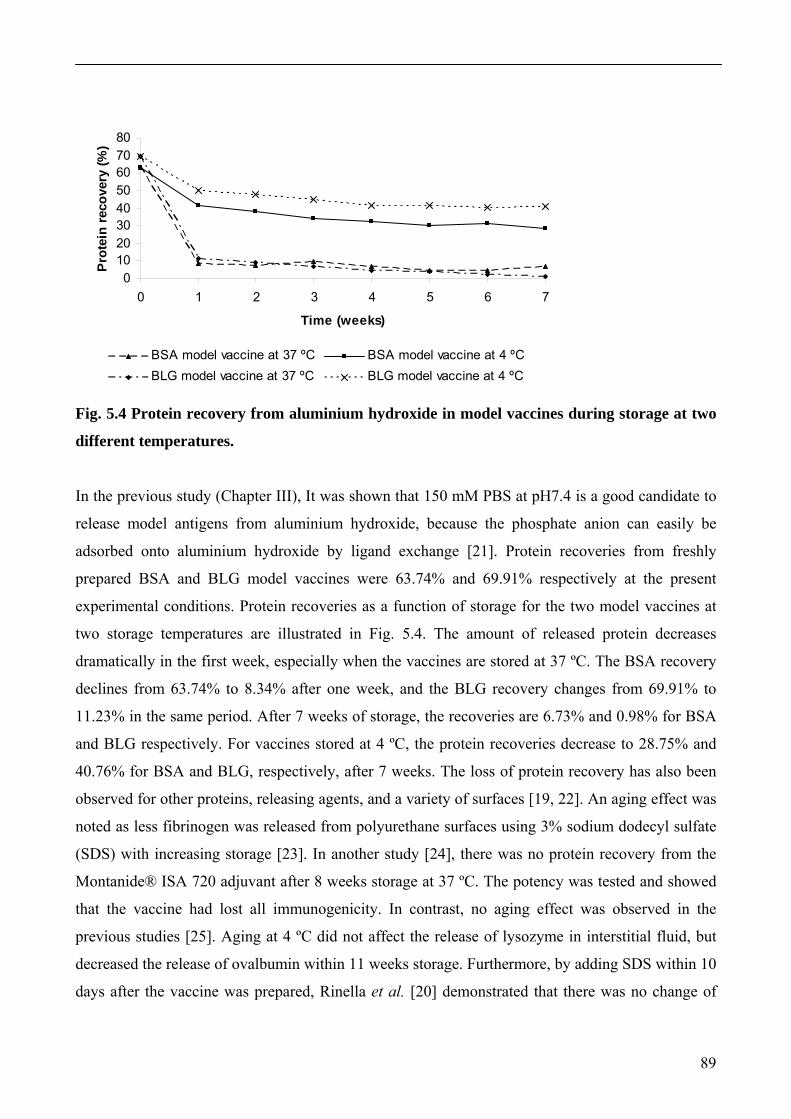
89
01020304050607080
0 1 2 3 4 5 6 7
Time (weeks)
Pro
tein
reco
very
(%)
BSA model vaccine at 37 ºC BSA model vaccine at 4 ºC BLG model vaccine at 37 ºC BLG model vaccine at 4 ºC
Fig. 5.4 Protein recovery from aluminium hydroxide in model vaccines during storage at two
different temperatures.
In the previous study (Chapter III), It was shown that 150 mM PBS at pH7.4 is a good candidate to
release model antigens from aluminium hydroxide, because the phosphate anion can easily be
adsorbed onto aluminium hydroxide by ligand exchange [21]. Protein recoveries from freshly
prepared BSA and BLG model vaccines were 63.74% and 69.91% respectively at the present
experimental conditions. Protein recoveries as a function of storage for the two model vaccines at
two storage temperatures are illustrated in Fig. 5.4. The amount of released protein decreases
dramatically in the first week, especially when the vaccines are stored at 37 ºC. The BSA recovery
declines from 63.74% to 8.34% after one week, and the BLG recovery changes from 69.91% to
11.23% in the same period. After 7 weeks of storage, the recoveries are 6.73% and 0.98% for BSA
and BLG respectively. For vaccines stored at 4 ºC, the protein recoveries decrease to 28.75% and
40.76% for BSA and BLG, respectively, after 7 weeks. The loss of protein recovery has also been
observed for other proteins, releasing agents, and a variety of surfaces [19, 22]. An aging effect was
noted as less fibrinogen was released from polyurethane surfaces using 3% sodium dodecyl sulfate
(SDS) with increasing storage [23]. In another study [24], there was no protein recovery from the
Montanide® ISA 720 adjuvant after 8 weeks storage at 37 ºC. The potency was tested and showed
that the vaccine had lost all immunogenicity. In contrast, no aging effect was observed in the
previous studies [25]. Aging at 4 ºC did not affect the release of lysozyme in interstitial fluid, but
decreased the release of ovalbumin within 11 weeks storage. Furthermore, by adding SDS within 10
days after the vaccine was prepared, Rinella et al. [20] demonstrated that there was no change of

90
protein release of the model vaccine composed of ovalbumin-aluminium hydroxide by adding SDS
within 10 days after the vaccine was prepared. Therefore, the release of adsorbed protein is not only
dependent on the specific protein, but also depends on the releasing agents and the absorbents.
The loss of protein recovery may result from conformational changes of adsorbed protein molecules
due to intra- and intermolecular aggregation which leads to a more tightly bound complex.
However, FTIR analysis (chapter IV) showed that the secondary structure of adsorbed BSA did not
change during four months of storage; while the structure of adsorbed BLG changed dramatically.
The release of both BSA and BLG are reduced during storage in the present work. Therefore, the
conformational change of the adsorbed protein is not the only reason leading to loss of protein
release. Degradation of the aluminium adjuvant, changes in the interaction between the protein and
the adjuvant, and changes in protein-water bonding may also play an important role.
Another hypothesis described that the loss of protein release was due to a change in the adsorption
mechanism from principally electrostatic attraction to the much stronger ligand exchange [25].
3.4 Changes in pH of model vaccines during storage
The pH was measured weekly in the two model vaccines stored at two temperatures for 7 weeks,
see Fig. 5.5. It can be observed that changes in pH are accelerated at elevated temperature. For the
BSA model vaccine, pH decreased during the 7 weeks of storage at 37 ºC, while it remained
constant at 4 ºC. In the case of the BLG model vaccine, pH decreased at 4 ºC; but when stored at 37
ºC, the pH decreased during the first two weeks and then increased. In a previous study, pH changes
were also observed in the storage of outer membrane vesicles vaccines at 56 ºC [26]. Furthermore,
the pH of milk samples first decreased and then increased during 100 days of storage [27].
The pH changes may be explained by chemical degradation of the proteins, such as oxidation,
deamidation, and fragmentation. In this connection it was noticed that the BLG model vaccine
smelled like sulphide during the later stage of storage when opening the vial. However, this was not
further investigated in this study. The degradation of aluminium hydroxide may also play a role in
the pH change, since the pH of a diluted aluminium hydroxide (1.14 mg/ml) declines as a function
of time at room temperature (Fig. 5.6). Other investigators also demonstrated that the pH changed in
diluted aluminium-containing adjuvants [28]. The alteration of pH may affect the structural stability
of the proteins. In chapter IV, it is shown that the structure of adsorbed BSA remained constant,
while adsorbed BLG changed dramatically. Moreover, the structural changes of adsorbed BLG
were different when stored at 4 ºC as compared to 37 ºC. Further experiments are required to
ascertain whether the slight change in pH can lead structural changes.
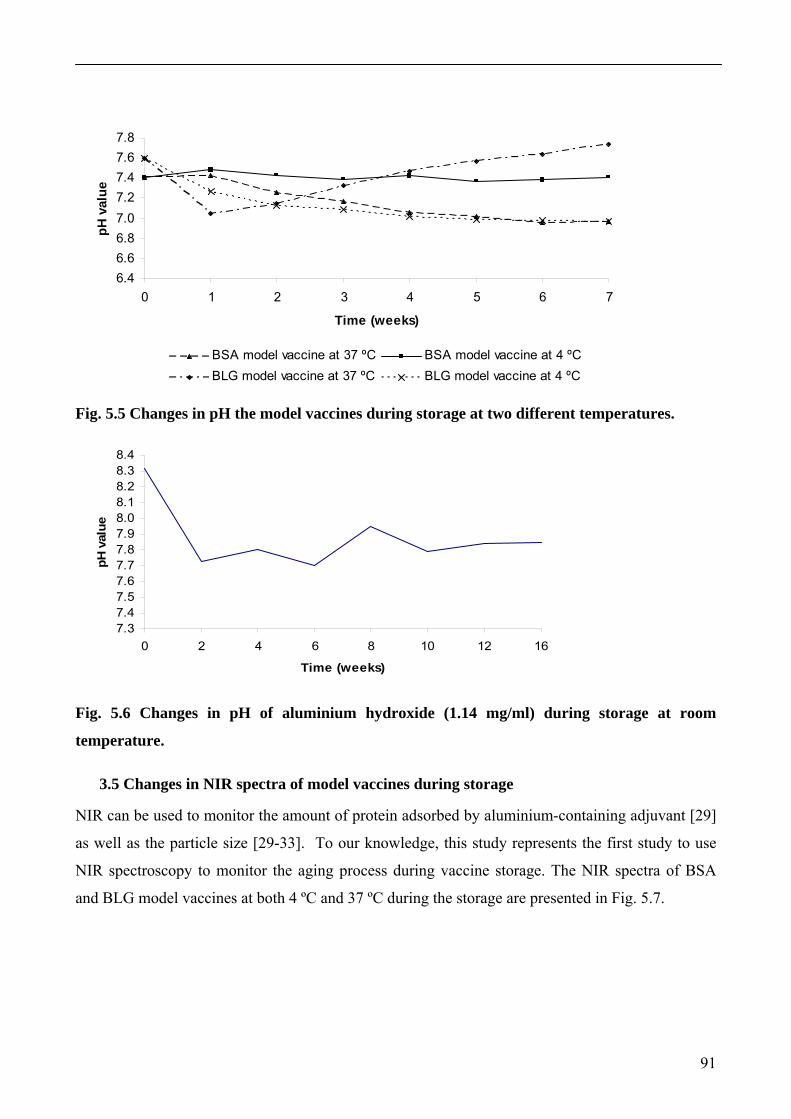
91
6.46.66.87.07.27.47.67.8
0 1 2 3 4 5 6 7
Time (weeks)
pH v
alue
BSA model vaccine at 37 ºC BSA model vaccine at 4 ºC BLG model vaccine at 37 ºC BLG model vaccine at 4 ºC
Fig. 5.5 Changes in pH the model vaccines during storage at two different temperatures.
7.37.47.57.67.77.87.98.08.18.28.38.4
0 2 4 6 8 10 12 16
Time (weeks)
pH v
alue
Fig. 5.6 Changes in pH of aluminium hydroxide (1.14 mg/ml) during storage at room
temperature.
3.5 Changes in NIR spectra of model vaccines during storage
NIR can be used to monitor the amount of protein adsorbed by aluminium-containing adjuvant [29]
as well as the particle size [29-33]. To our knowledge, this study represents the first study to use
NIR spectroscopy to monitor the aging process during vaccine storage. The NIR spectra of BSA
and BLG model vaccines at both 4 ºC and 37 ºC during the storage are presented in Fig. 5.7.
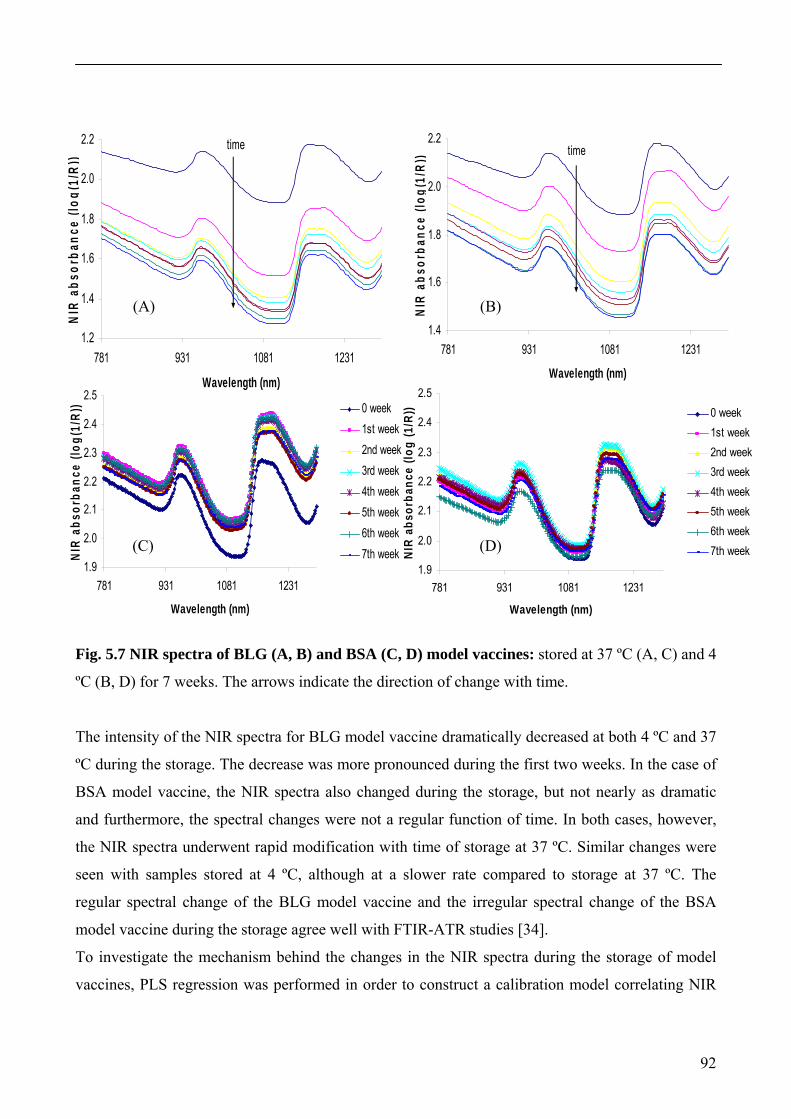
92
1.2
1.4
1.6
1.8
2.0
2.2
781 931 1081 1231
Wavelength (nm)
NIR
abs
orba
nce
(log(
1/R)
)
time
1.4
1.6
1.8
2.0
2.2
781 931 1081 1231
Wavelength (nm)
NIR
abs
orba
nce
(log(
1/R)
) time
1.9
2.0
2.1
2.2
2.3
2.4
2.5
781 931 1081 1231
Wavelength (nm)
NIR
abso
rban
ce (l
og(1
/R)) 0 week
1st week2nd week3rd week4th week5th week6th week7th week
1.9
2.0
2.1
2.2
2.3
2.4
2.5
781 931 1081 1231
Wavelength (nm)
NIR
abso
rban
ce (l
og (1
/R)) 0 week
1st week2nd week3rd week4th week5th week6th week7th week
Fig. 5.7 NIR spectra of BLG (A, B) and BSA (C, D) model vaccines: stored at 37 ºC (A, C) and 4
ºC (B, D) for 7 weeks. The arrows indicate the direction of change with time.
The intensity of the NIR spectra for BLG model vaccine dramatically decreased at both 4 ºC and 37
ºC during the storage. The decrease was more pronounced during the first two weeks. In the case of
BSA model vaccine, the NIR spectra also changed during the storage, but not nearly as dramatic
and furthermore, the spectral changes were not a regular function of time. In both cases, however,
the NIR spectra underwent rapid modification with time of storage at 37 ºC. Similar changes were
seen with samples stored at 4 ºC, although at a slower rate compared to storage at 37 ºC. The
regular spectral change of the BLG model vaccine and the irregular spectral change of the BSA
model vaccine during the storage agree well with FTIR-ATR studies [34].
To investigate the mechanism behind the changes in the NIR spectra during the storage of model
vaccines, PLS regression was performed in order to construct a calibration model correlating NIR
(A) (B)
(D) (C)
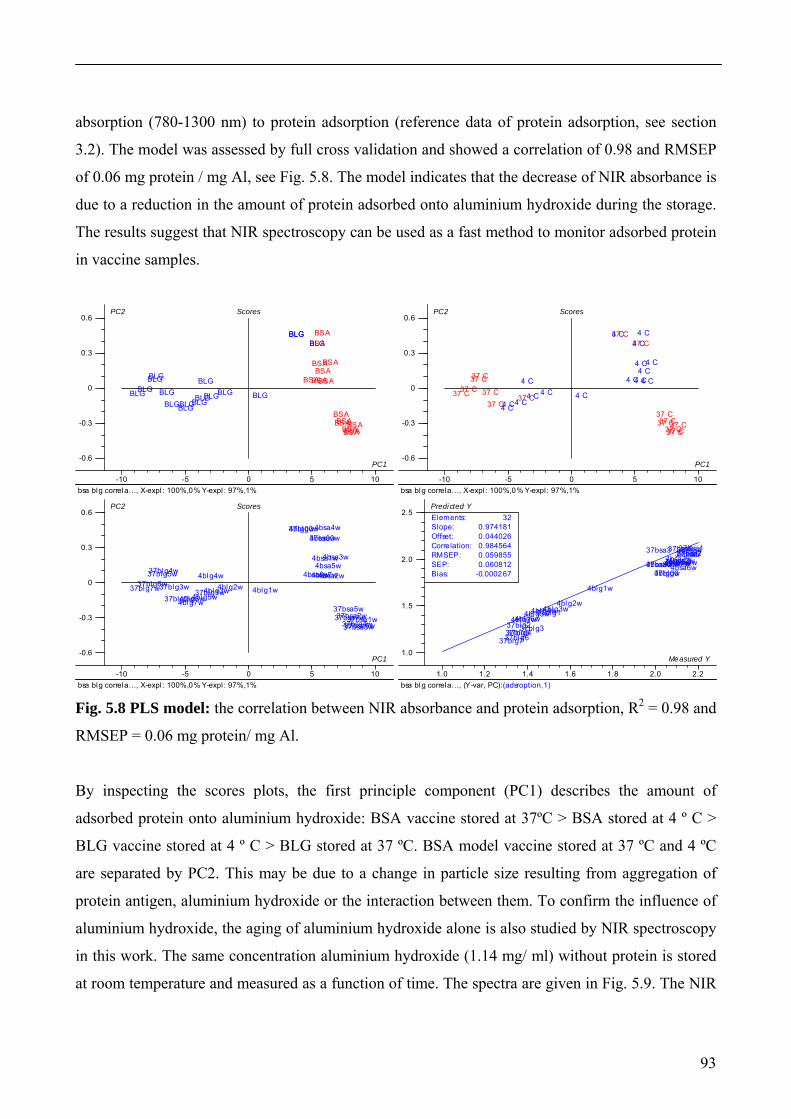
93
absorption (780-1300 nm) to protein adsorption (reference data of protein adsorption, see section
3.2). The model was assessed by full cross validation and showed a correlation of 0.98 and RMSEP
of 0.06 mg protein / mg Al, see Fig. 5.8. The model indicates that the decrease of NIR absorbance is
due to a reduction in the amount of protein adsorbed onto aluminium hydroxide during the storage.
The results suggest that NIR spectroscopy can be used as a fast method to monitor adsorbed protein
in vaccine samples.
-0.6
-0.3
0
0.3
0.6
-10 -5 0 5 10 bsa blg correla…, X-expl : 100%,0% Y-expl : 97%,1%
BLG
BLGBLG
BLG
BLGBLGBLGBLG
BSA
BSABSABSABSA
BSA
BSABSA
BLG
BLGBLGBLG
BLG
BLGBLGBLG
BLG
BSA
BSA
BSA
BSA
BSABSABSA
PC1
PC2 Scores
-0.6
-0.3
0
0.3
0.6
-10 -5 0 5 10 bsa blg correla…, X-expl : 100%,0% Y-expl : 97%,1%
37 C
37 C37 C
37 C
37 C37 C37 C37 C
37 C
37 C37 C37 C37 C
37 C
37 C37 C
4 C
4 C4 C4 C
4 C
4 C4 C4 C
4 C
4 C
4 C
4 C
4 C
4 C4 C4 C
PC1
PC2 Scores
-0.6
-0.3
0
0.3
0.6
-10 -5 0 5 10 bsa blg correla…, X-expl : 100%,0% Y-expl : 97%,1%
37blg0w
37blg1w37blg2w
37blg3w
37blg4w37blg5w37blg6w37blg7w
37bsa0w
37bsa1w37bsa2w37bsa3w37bsa4w
37bsa5w
37bsa6w37bsa7w
4blg0w
4blg1w4blg2w4blg3w
4blg4w
4blg5w4blg6w4blg7w
4bsa0w
4bsa1w
4bsa2w
4bsa3w
4bsa4w
4bsa5w4bsa6w4bsa7w
PC1
PC2 Scores
1.0
1.5
2.0
2.5
1.0 1.2 1.4 1.6 1.8 2.0 2.2bsa blg correla…, (Y-var, PC): (adsroption,1)
37blg0
37blg1
37blg237blg337blg437blg537blg637blg7
37bsa0
37bsa137bsa237bsa3 37bsa437bsa5
37bsa637bsa7
4blg0w
4blg1w
4blg2w4blg3w4blg4w4blg5w
4blg6w4blg7w
4bsa0w4bsa1w4bsa2w4bsa3w4bsa4w4bsa5w4bsa6w4bsa7w
Elements:Slope:Offset:Correlation:RMSEP:SEP:Bias:
320.9741810.0440260.9845640.0598550.060812
-0.000267
Measured Y
Predicted Y
Fig. 5.8 PLS model: the correlation between NIR absorbance and protein adsorption, R2 = 0.98 and
RMSEP = 0.06 mg protein/ mg Al.
By inspecting the scores plots, the first principle component (PC1) describes the amount of
adsorbed protein onto aluminium hydroxide: BSA vaccine stored at 37ºC > BSA stored at 4 º C >
BLG vaccine stored at 4 º C > BLG stored at 37 ºC. BSA model vaccine stored at 37 ºC and 4 ºC
are separated by PC2. This may be due to a change in particle size resulting from aggregation of
protein antigen, aluminium hydroxide or the interaction between them. To confirm the influence of
aluminium hydroxide, the aging of aluminium hydroxide alone is also studied by NIR spectroscopy
in this work. The same concentration aluminium hydroxide (1.14 mg/ ml) without protein is stored
at room temperature and measured as a function of time. The spectra are given in Fig. 5.9. The NIR
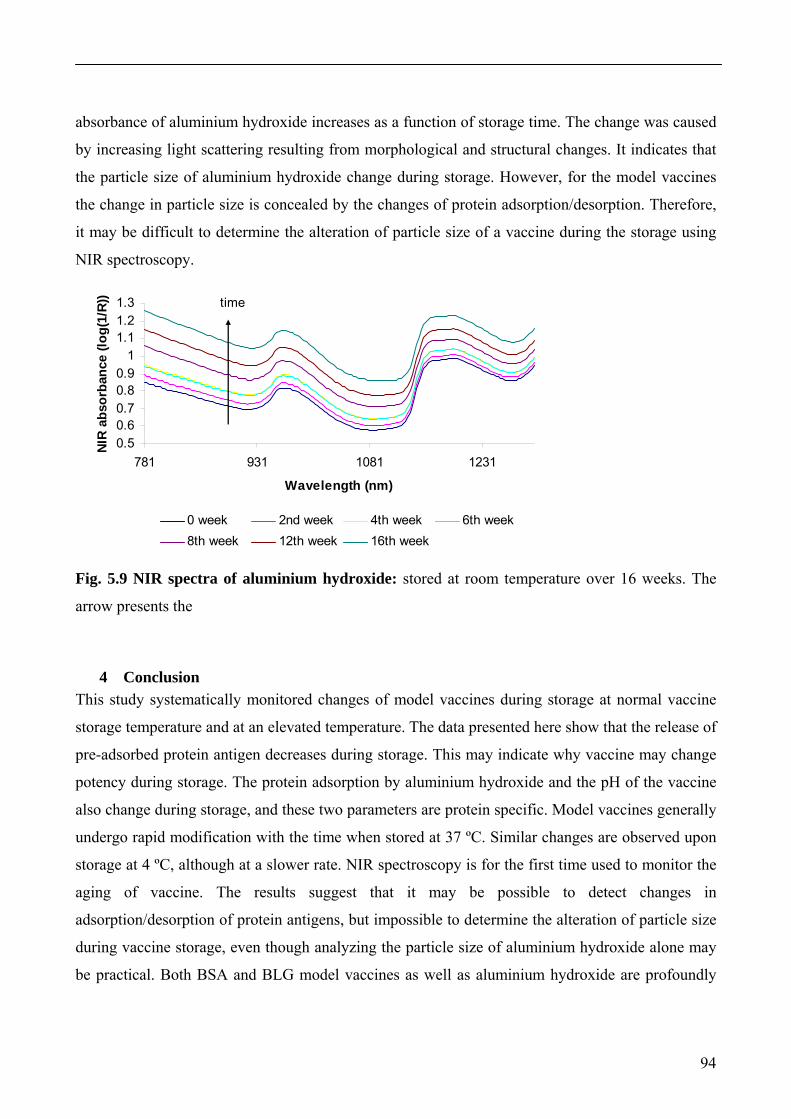
94
absorbance of aluminium hydroxide increases as a function of storage time. The change was caused
by increasing light scattering resulting from morphological and structural changes. It indicates that
the particle size of aluminium hydroxide change during storage. However, for the model vaccines
the change in particle size is concealed by the changes of protein adsorption/desorption. Therefore,
it may be difficult to determine the alteration of particle size of a vaccine during the storage using
NIR spectroscopy.
0.50.60.70.80.9
11.11.21.3
781 931 1081 1231
Wavelength (nm)
NIR
abs
orba
nce
(log(
1/R)
)
0 week 2nd week 4th week 6th week8th week 12th week 16th week
time
Fig. 5.9 NIR spectra of aluminium hydroxide: stored at room temperature over 16 weeks. The
arrow presents the
4 Conclusion This study systematically monitored changes of model vaccines during storage at normal vaccine
storage temperature and at an elevated temperature. The data presented here show that the release of
pre-adsorbed protein antigen decreases during storage. This may indicate why vaccine may change
potency during storage. The protein adsorption by aluminium hydroxide and the pH of the vaccine
also change during storage, and these two parameters are protein specific. Model vaccines generally
undergo rapid modification with the time when stored at 37 ºC. Similar changes are observed upon
storage at 4 ºC, although at a slower rate. NIR spectroscopy is for the first time used to monitor the
aging of vaccine. The results suggest that it may be possible to detect changes in
adsorption/desorption of protein antigens, but impossible to determine the alteration of particle size
during vaccine storage, even though analyzing the particle size of aluminium hydroxide alone may
be practical. Both BSA and BLG model vaccines as well as aluminium hydroxide are profoundly

95
affected by rotation. Vigorous rotation increases the particle size of aluminium hydroxide and may
denature protein antigens. Thus, it should be minimised in vaccine production.
96
References
1. Galazka A, Milstien J, Zaffran M. Thermostability of vaccines. World Health Organization,
1998; Geneva. http://wwwlive.who.ch/vaccines-documents/ DocsPDF/www9661.pdf
2. Jeremijenko A, Kelly H, Sibthorpe B, Attewell R. Improving vaccine storage in general
practice refrigerators. British Medical Journal, 1996; 312: 1651-1652.
3. Labuza TP, Fu B. Vaccine stability and the use of time-temperature integrators for
monitoring the cold chain in distribution. http://courses .che.umn.edu/oofscn8334-1f-
folder/vaccine.
4. Arya S, Agarwal N. Efficacy measles vaccine interlinked with potency and storage. Acta
Tropica, 2004; 90: 223-225.
5. Miles AP, McClellan HA, Rausch KM, Zhu D, Whitemore MD, Singh S, Martin LB, Wu Y,
Giersing BK, Stowers AW. Montanide ISA 720 vaccines: quality control of emulsions,
stability of formulated antigens, and comparative immunogenicity of vaccine formulations.
Vaccine, 2005; 23: 2528-2537.
6. Dimayuga R, Scheifele D. Effects of freezing in DPT and DPT-IPV vaccine adsorbed.
Canada Communicable Disease Report, 1995; 21: 101-103.
7. Boros CA, Hanlon M, Gold MS, Roberton DM. Storage at -3 ºC for 24 h alters the
immunogenicity of pertussis vaccine. Vaccine, 2001; 19: 3537-3542.
8. Lai X, Zheng Y, Ipsen H, Jacobsen S, Larsen JN, Løwenstein H, Søndergaard I. Particle size
determination in suspensions using near-infrared transmittance spectroscopy. Submitted to
Applied Spectroscopy, 2006.
9. Chang MF, Shi Y, Nail SL, HogenEsch H, Admas SB, White JL, Hem SL. Degree of
antigen adsorption in the vaccine or interstitial fluid and its effect on the antibody response
in rabbits. Vaccine, 2001; 19: 2884-2889.
10. World Health Organization. Immunological adjuvants. World Health Organization
Technical Report Series No. 595. Geneva: World Health Organization, 1976: 6-8.
11. Al-Shakhshir RH, Regnier F, White JL, Hem SL. Contribution of electrostatic and
hydrophobic interaction to the adsorption of proteins by aluminium adjuvants. Vaccine,
1995; 13: 41-44.
12. Seeber SJ, White JL, Hem SL, Predicting the adsorption of proteins by aluminium-
containing adjuvants. Vaccine, 1991; 9: 201-203.
97
13. López MC, Thomas MC, Olivares M, Alonso P, Alonso C. The effect of temperature on the
stability of the synthetic SPf(66)n malaria vaccine. Vaccine, 1995; 13: 1180-1182.
14. Amador R, Moreno A, Valero V, Murillo L, Mora AL, Rojas M, Rocha C, Salcedo M,
Guzman F, Espejo F, Nunez F, Patarroyo ME. The first field trials of the chemically
synthesized malaria vaccine SPf66: safety, immunogenicity and protectivity. Vaccine, 1992;
10: 179-184.
15. Jones LS, Peek LJ, Power J, Markham A, Yazzie B, Middaugh R. Effects of adsorption to
aluminium salt adjuvants on the structure and stability of model protein antigens. The
Journal of Biological Chemistry, 2005; 280: 13406-13414.
16. Rogan D, Babiuk LA. Animal health: biologics/biopharmaceutics – novel vaccines from
biotechnology. Revue Scientifique et Technique – Office International des Epizooties, 2005;
24: 159-174.
17. Engel MFM, Visser AJWG, Mierlo CPMV. Refolding of adsorbed bovine α-lactalbumin
during surfactant induced displacement from a hydrophobic interface. Langmuir, 2003; 19:
2929-2937.
18. Rapoza RJ, Horbett TA. Effects of concentration and adsorption time on the elutability of
adsorbed proteins in surfactant solutions of varying structures and concentrations. Journal of
Colloid interface Science, 1990; 136: 480-493.
19. Bohnert JL, Horbett TA. Changes in adsorbed fibrinogen and albumin interactions with
polymers indicated by decreases in detergent elutability. Journal of Colloid Interface
Science, 1985; 111: 363-377.
20. Rinella JV, Workman RF, Hermodson MA, White JL, Hem SL. Elutability of proteins from
aluminum-containing vaccine adjuvants by treatment with surfactants. Journal of Colloid
and Interface Science, 1998; 197: 48-56.
21. Bleam WF, Pfeffer PE, Goldberg S, Taylor RW, Dudley RA. 31P solid-state nuclear
magnetic resonance study of phosphate adsorption at the boehmite/aqueous solution
interface. Langmuir, 1991; 7: 1702-1712.
22. Slack SM, Horbett TA. Changes in the strength of fibrinogen attachment to solid surfaces:
an explanation of the influence of surface chemistry on the vorman effect. Journal of Colloid
Interface Science, 1989; 133: 148-165.
98
23. Chinn JA, Posso SE, Horbett TA, Ratner BD. Postadsorption transitions in fibrinogen
adsorbed to polyurethanes: changes in antibody binding and sodium dodecyl sulfate
elutability. Journal of Biomedical Materials Research, 1992; 26: 757-778.
24. Miles AP, McClellan HA, Rausch KM, Zhu D, Whitemore MD, Singh S, Martin LB, Wu Y,
Giersing BK, Stowers AW. Montanide ISA 720 vaccines: quality control of emulsions,
stability of formulated antigens, and comparative immunogenicity of vaccine formulations.
Vaccine, 2005; 23: 2528-2537.
25. Shi Y, HogenEsch H, Hem SL. Change in the degree of adsorption of proteins by
aluminium-containing adjuvants following exposure to interstitial fluid: freshly prepared
and aged model vaccines. Vaccine, 2002, 20: 80-85.
26. Arigita C, Jiskoot W, Westdijk J, Ingen CV, Hennink WE, Crommelin DJA, Kersten GFA.
Stability of mono- and trivalent meningococcal outer membrane vesicle vaccines. Vaccine,
2004; 22: 629-642.
27. Kelly AL, Foley J. Proteolysis and storage stability of UHT milk as influenced by milk
plasmin activity, plasmin/β-lactoglobulin complexation, plasminogen activation and somatic
cell count. International Dairy Journal, 1997; 7: 411-420.
28. Burrell LS, White JL, Hem SL. Stability of aluminium-containing adjuvants during aging at
room temperature. Vaccine, 2000; 18: 2188-2192.
29. Lai X. PhD thesis. The Technical University of Denmark, 2006.
30. Otsuka M. Comparative particle size determination of phenacetin bulk powder by using
Kubelka-Muck theory and principle componenet regression analysis based on near infrared
spectroscopy. Powder Technology, 2004; 141: 244-250.
31. O’Neil AJ, Jee RD, Moffat AC. Measurement of the percentage volume particle size
distribution of powdered microcrystalline cellulose using reflectance near infrared
spectroscopy. The Analyst, 2003; 128: 1326-1330.
32. Pasikatan MC, Steele JL, Spillman CK, Haque E. Near infrared reflectance spectroscopy for
online particle size analysis of powders and ground materials. Journal of Near Infrared
Spectroscopy, 2001; 9: 153-164.
33. Santos AF, Lima EL, Pinto JC. In-line evaluation of average particle size in styrene
suspension polymeriztions using near-infrared spectroscopy. Journal of Applied Polymer
Science, 1998; 70: 1737-1745.

99
34. Zheng Y, Lai X, Ipsen H, Larsen JN , Løwenstein H, Søndergaard I, Jacobsen S. The
structural stability of the adsorbed model antigens by aluminium hydroxide in heating and
aging processes in comparison to the antigens in solutions. Submitted to Vaccine, 2006.
100
Chapter VI: Determination of residual moisture content of lyophilized allergen vaccines by NIR spectroscopy
Abstract
Residual moisture content is an important parameter for lyophilized vaccines. Currently, Karl
Fischer (KF) titration is widely used for moisture determination in routine analysis. However, this
method is time-consuming, sample destructive and requires environment polluting reagents, as well
as the results rely on the random samplings. Near infrared spectroscopy (NIR) was used as a fast,
non-invasive and non-destructive method to determinate the residual moisture content in
lyophilized allergy vaccines in this study. Five different vaccine products were investigated, which
contained water from 0.168 to 1.51 % (w/w) analyzed by KF titration as reference measure.
Different data pre-treatments, wavelength selection and partial least squares regression were applied
to construct calibration models. Acceptable multi-products model (with RMSEP 10.20 μg H2O/vial,
2 PLS factors) and product-specific models were obtained. The results summarized in this work
suggest that NIR is an optimal alternative for determination moisture content in lyophilized
vaccines.
101
1 Introduction Lyophilization (freeze-drying) is widely applied for the preservation and storage of many vaccines.
Lyophilized vaccines always contain some water, known as residual moisture, which is usually
constitutes between 1% and 5% of the final product after the bulk of the aqueous solvent has been
removed during the freeze-drying process. Residual moisture content (RMC) is a critical quality
parameter influencing not only the vaccine appearance and quality but also its shelf life [1-3].
Therefore, RMC should be sufficiently low so that immunological potency and integrity of the
product are not compromised over time. However, RMC of the vaccine should not be so low that
the properties of the product are deteriorated due to over-drying. Over-drying results in broken
product cake. It may also cause the structure of the antigen to change, which may induce
aggregation of the protein complex, and lead to increased difficulty predicting the release profile of
the antigens. Furthermore, RMC is also an important parameter for manufacturers to control their
lyophilizing cycle.
Pharmaceutical companies have to verify that the RMC in their products is consistently within
specifications. Currently, KF titration is widely used for RMC determination in lyophilized
products [4]. This method is time-consuming, sample destructive and requires environment
polluting reagents. Thermogravimetry and gas chromatography are also applied for RMC analysis
[5, 6]. However, the methods are also expensive, time-consuming and destructive. Ambient
moisture may affect the results for low moisture level samples since the vials have to be opened
before analysis. IN addition, many random samples have to be analysed for each batch in the
production line, which is a resource consuming procedure, and random sampling has inherent
disadvantages. Clusters of products deviating in water content caused by momentary production
problems may not always be monitored and entire batches of the product may have to be rejected
due to the results from the outliers that have been sampled. It would therefore be advantageous to
replace these procedures with an automated online method.
Near infrared spectroscopy (NIR) offers many advantages over traditional methods for moisture
determination. It is a physical, non-invasive, non-destructive method. Thus, the analysis can be
performed through sealed glass vials, directly on the final product without opening the vials. It is
suitable for online analysis because NIR radiation can penetrate the glass vial making sample
preparation redundant. NIR analyses are typically rapid and the spectra provide information on both
physical and chemical properties of the product analysed, such as sample identity and
concentration, particle size, hardness, and even taste. NIR is easy and safe to use, since there is no
102
sample preparation, no reagents are used, and no wastes are produced. Lastly, the use of NIR
spectroscopy avoids random sampling in the control of RMC.
Water is the strongest absorbing compound in the NIR region, exhibiting four absorption maxima
around 970, 1190, 1450, and 1940 nm. The NIR absorption of water has been well investigated
because of its importance in all applications of the technique. Strong absorption bands of water
appear around 1400-1450 nm and 1900-1950 nm, which are due to the first overtone of OH
stretching and combination of the OH stretching band and OH bending [7]. Variations in the water
band around the 1400 nm region are dependent on the state of water in the sample. In samples with
a water content reaching 70-90% the adsorption band appears at similar wavelengths to those of
pure water, around 1400-1410 nm. In dry samples the band associated with free water seems to
disappear except for a trace of absorption near 1430 nm [8]. These two bands have often been used
to quantify water content in various samples. Other water bands in the NIR region are located at 970
nm and 1190 nm. The intensities of these bands are not strong, since they arise from the second
overtone of the OH stretching band, as well as the combination of the first overtone of the OH
stretching and the OH bending [7].
The determination of moisture content by NIR spectroscopy in both transmittance and reflectance
modes have been described extensively in the literature, covering applications in agriculture,
forestry, textiles, chemicals, and pharmaceutical areas. NIR has been used for lyophilized products
and for tablet analyses. NIR is also applied to measure the amount of moisture during granulation,
drying, and purification stages of solids and liquids, and the monitoring of moisture during process
optimization [9-16]. Most of the early studies using NIR for water determination have been
summarized and discussed by Blanco et al. [13], and recent applications have been reviewed by
Reich [9].
NIR applications for protein pharmaceuticals, however, have not been widely adopted [9, 11].
Lyophilized pharmaceutical products typically contain 1% to 2% residual water, which is a narrow
range for the construction of a calibration model. In order to compensate for the narrow range
previous studies have extended the range by adding artificial samples, which were obtained by
adsorbing and/or further secondary drying [11, 17]. The artificial calibration samples, however,
were damaged before NIR measurements, and the model did not improve the prediction results
significantly.
To our knowledge, NIR has never been used to determine RMC in vaccine products. The objective
of this study was to develop a non-invasive, non-destructive and rapid method for RMC
103
determination for lyophilized allergen vaccines. All samples were directly measured using a Fourier
transform NIR (FT-NIR) spectrometer without sample preparation, i.e. through the bottom of the
intact glass vials by diffuse reflectance. A general calibration model was constructed for five
vaccine products using KF titration as reference method. Calibration models for each vaccine
product were also built for comparison. The models were validated by cross validation.
2 Materials and methods
2.1 Samples Five different lyophilized allergy vaccine products, a total of 95 vials were collected by random
sampling. Detailed information is given in Tab. 6.1.
2.2 NIR measurement All NIR measurements were carried out using a FT-NIR spectrometer (PerkinElmer Spectrum One,
PerkinElmer) with an InGaAs detector. NIR spectra were collected in the reflectance mode at
ambient temperature, although products were stored refrigerated. Each spectrum was the average of
80 scans at 16 cm-1 resolution over the range 700-2500 nm. For each sample, four spectra were
collected by rotating the vial in different angles. Therefore, a total of 380 spectra were obtained.
2.3 KF titration analysis After NIR measurement, the same vials were analyzed for RMC using a 737 KF Coulometer
(Metrohm, Switzerland). A well-defined amount of dry methanol (1 ml) was added to each test vial.
The vial was mixed thoroughly using a Vortex mixer until the sample was uniform. The vial was
incubated at room temperature for two hours, and centrifuged at 2000 rpm. The RMC was detected
immediately after centrifugation. A plastic syringe was rinsed first using dry methanol.
Approximately 400 μl sample was drawn into the syringe. Pointing the needle upwards, air bobbles
and excess materials was removed until 350 μl samples remained in the syringe. Sample was added
under the surface of the fluid. The needle was pulled away from the surface of the fluid, and
simultaneously the plunger was drawn back to avoid leaving sample drops inside the membrane.
Then the equipment was started.
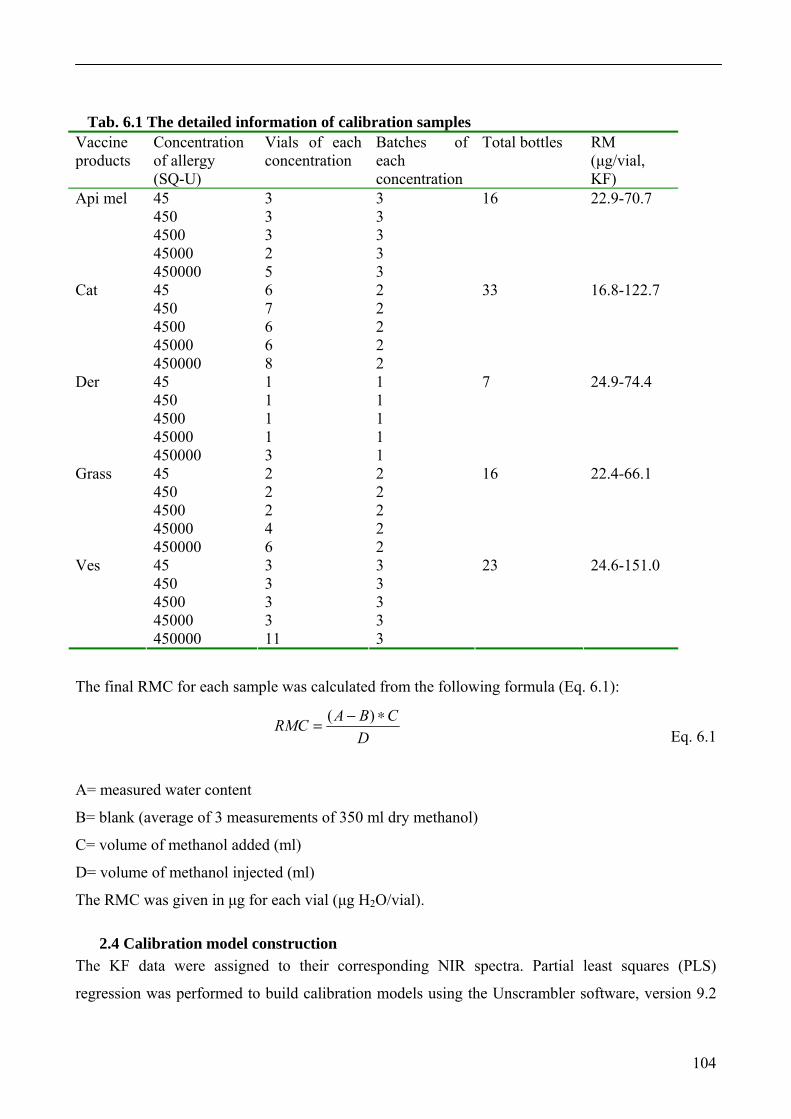
104
Tab. 6.1 The detailed information of calibration samples Vaccine products
Concentration of allergy (SQ-U)
Vials of each concentration
Batches of each concentration
Total bottles RM (μg/vial, KF)
45 3 3 450 3 3 4500 3 3 45000 2 3
Api mel
450000 5 3
16 22.9-70.7
45 6 2 450 7 2 4500 6 2 45000 6 2
Cat
450000 8 2
33 16.8-122.7
45 1 1 450 1 1 4500 1 1 45000 1 1
Der
450000 3 1
7 24.9-74.4
45 2 2 450 2 2 4500 2 2 45000 4 2
Grass
450000 6 2
16 22.4-66.1
45 3 3 450 3 3 4500 3 3 45000 3 3
Ves
450000 11 3
23 24.6-151.0
The final RMC for each sample was calculated from the following formula (Eq. 6.1):
DCBARMC ∗−= )(
Eq. 6.1
A= measured water content
B= blank (average of 3 measurements of 350 ml dry methanol)
C= volume of methanol added (ml)
D= volume of methanol injected (ml)
The RMC was given in μg for each vial (μg H2O/vial).
2.4 Calibration model construction The KF data were assigned to their corresponding NIR spectra. Partial least squares (PLS)
regression was performed to build calibration models using the Unscrambler software, version 9.2
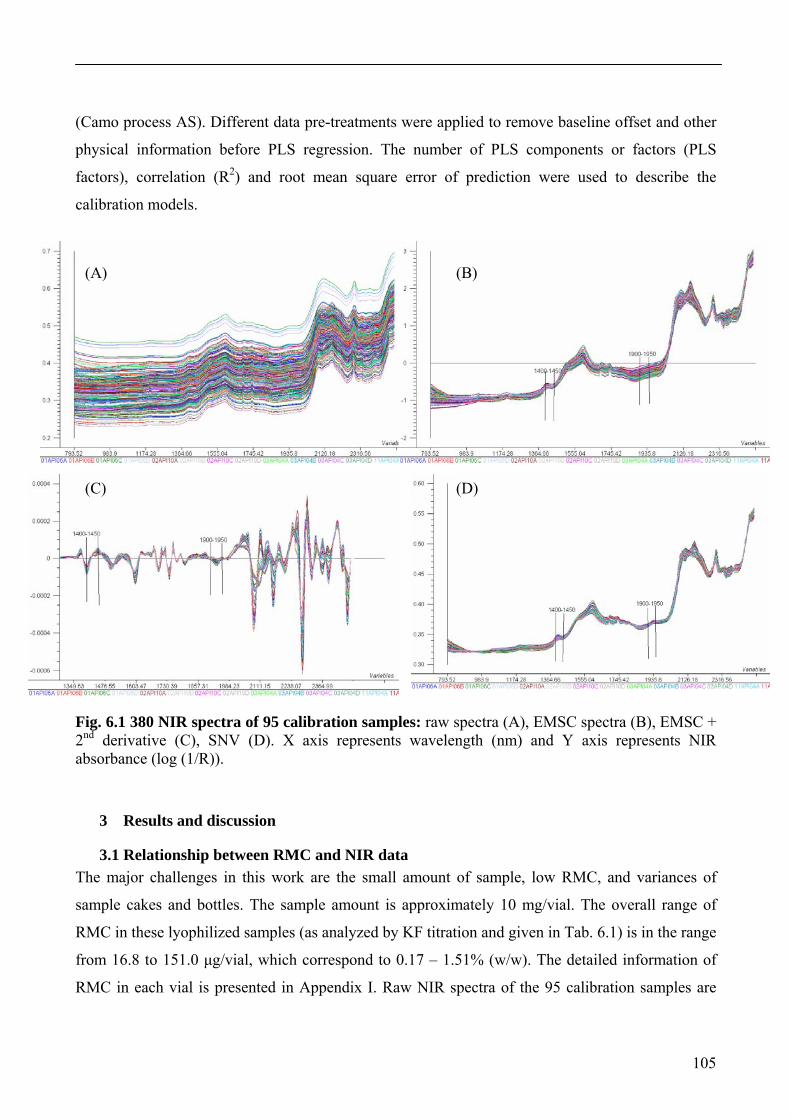
105
(Camo process AS). Different data pre-treatments were applied to remove baseline offset and other
physical information before PLS regression. The number of PLS components or factors (PLS
factors), correlation (R2) and root mean square error of prediction were used to describe the
calibration models.
Fig. 6.1 380 NIR spectra of 95 calibration samples: raw spectra (A), EMSC spectra (B), EMSC + 2nd derivative (C), SNV (D). X axis represents wavelength (nm) and Y axis represents NIR absorbance (log (1/R)).
3 Results and discussion
3.1 Relationship between RMC and NIR data The major challenges in this work are the small amount of sample, low RMC, and variances of
sample cakes and bottles. The sample amount is approximately 10 mg/vial. The overall range of
RMC in these lyophilized samples (as analyzed by KF titration and given in Tab. 6.1) is in the range
from 16.8 to 151.0 μg/vial, which correspond to 0.17 – 1.51% (w/w). The detailed information of
RMC in each vial is presented in Appendix I. Raw NIR spectra of the 95 calibration samples are
(A) (B)
(C) (D)
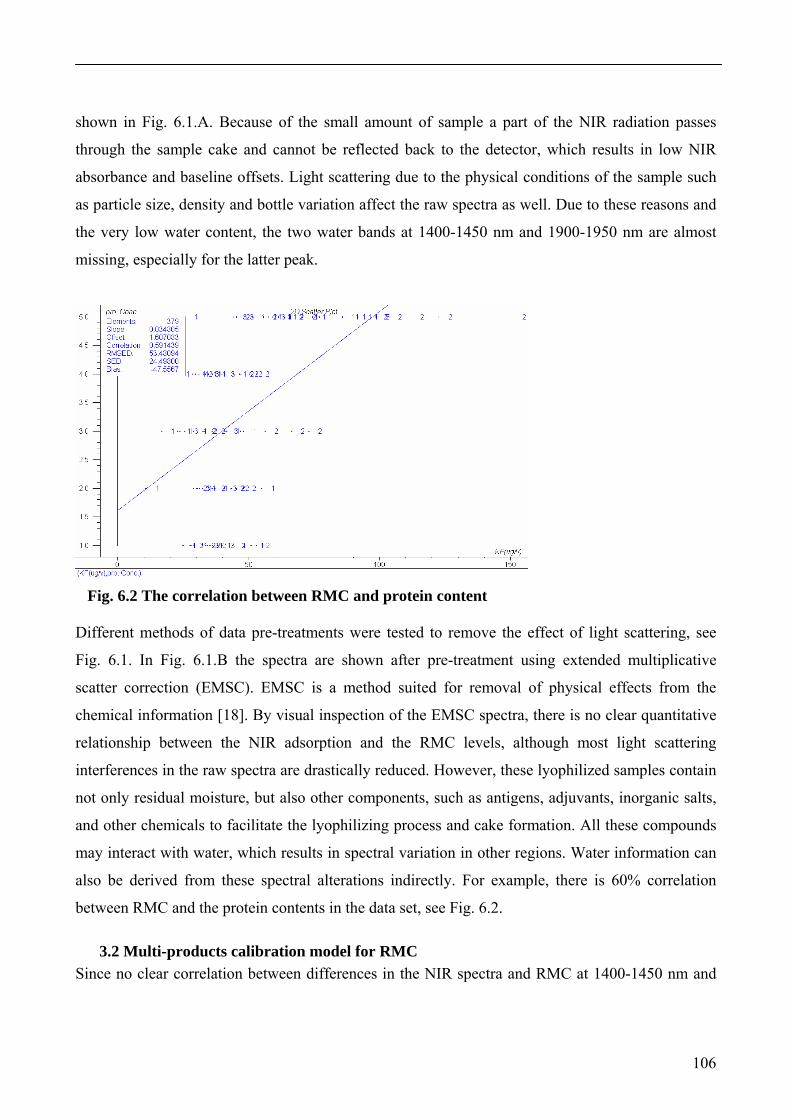
106
shown in Fig. 6.1.A. Because of the small amount of sample a part of the NIR radiation passes
through the sample cake and cannot be reflected back to the detector, which results in low NIR
absorbance and baseline offsets. Light scattering due to the physical conditions of the sample such
as particle size, density and bottle variation affect the raw spectra as well. Due to these reasons and
the very low water content, the two water bands at 1400-1450 nm and 1900-1950 nm are almost
missing, especially for the latter peak.
Fig. 6.2 The correlation between RMC and protein content Different methods of data pre-treatments were tested to remove the effect of light scattering, see
Fig. 6.1. In Fig. 6.1.B the spectra are shown after pre-treatment using extended multiplicative
scatter correction (EMSC). EMSC is a method suited for removal of physical effects from the
chemical information [18]. By visual inspection of the EMSC spectra, there is no clear quantitative
relationship between the NIR adsorption and the RMC levels, although most light scattering
interferences in the raw spectra are drastically reduced. However, these lyophilized samples contain
not only residual moisture, but also other components, such as antigens, adjuvants, inorganic salts,
and other chemicals to facilitate the lyophilizing process and cake formation. All these compounds
may interact with water, which results in spectral variation in other regions. Water information can
also be derived from these spectral alterations indirectly. For example, there is 60% correlation
between RMC and the protein contents in the data set, see Fig. 6.2.
3.2 Multi-products calibration model for RMC Since no clear correlation between differences in the NIR spectra and RMC at 1400-1450 nm and
107
1900-1950 nm were detected, all significant X variables (wavelength) after Jack-knifing were taken
into account in the calibration model. For comparison, one NIR water band (1900-1960 nm) was
also investigated to construct models. First, we attempted to make build one model w involving all
five vaccine products using PLS regression. The sample size in this study was not large enough,
even though it covered 5 products, 3 batches and 5 different antigen concentrations. To solve this
problem all NIR spectra were used as calibration data set instead of dividing them into calibration
and prediction data sets. Calibration models were built after different data pre-treatment procedures
and assessed by segment cross validation (numbers of each segment is four, since there are four
spectra for each sample). The models that considered the whole wavelength were rebuilt using
significant X variables from Jack-knifing. Each pre-treatment performed differently and the
corresponding results for the prediction are listed in Tab. 6.2.
Acceptable correlations (from 0.88 to 0.93, Tab.2) were obtained for each PLS model. This is an
indication that PLS is a good tool that can extract spectral variations related to varying moisture
levels. Spectral pre-treatments are preformed to remove the spectral noise and improve the
performance of the calibration models. In this study, most pre-treatment methods applied (Tab. 6.2)
improved the performance of the calibration models. NIR region 1900-1960 nm is still a good
wavelength window for quantitative water analysis; even though there were no clear water band
alterations in the spectra by visual inspection. The model based on this region was better than the
model with the significant X variables from Jack-knifing, since less PLS factors were used. This is
due to less noise in region 1900-1960 nm. Spectra should contain more information when spanning
the entire NIR window, but also contain more noise. Thus, it requires more PLS factors to explain
the data set.
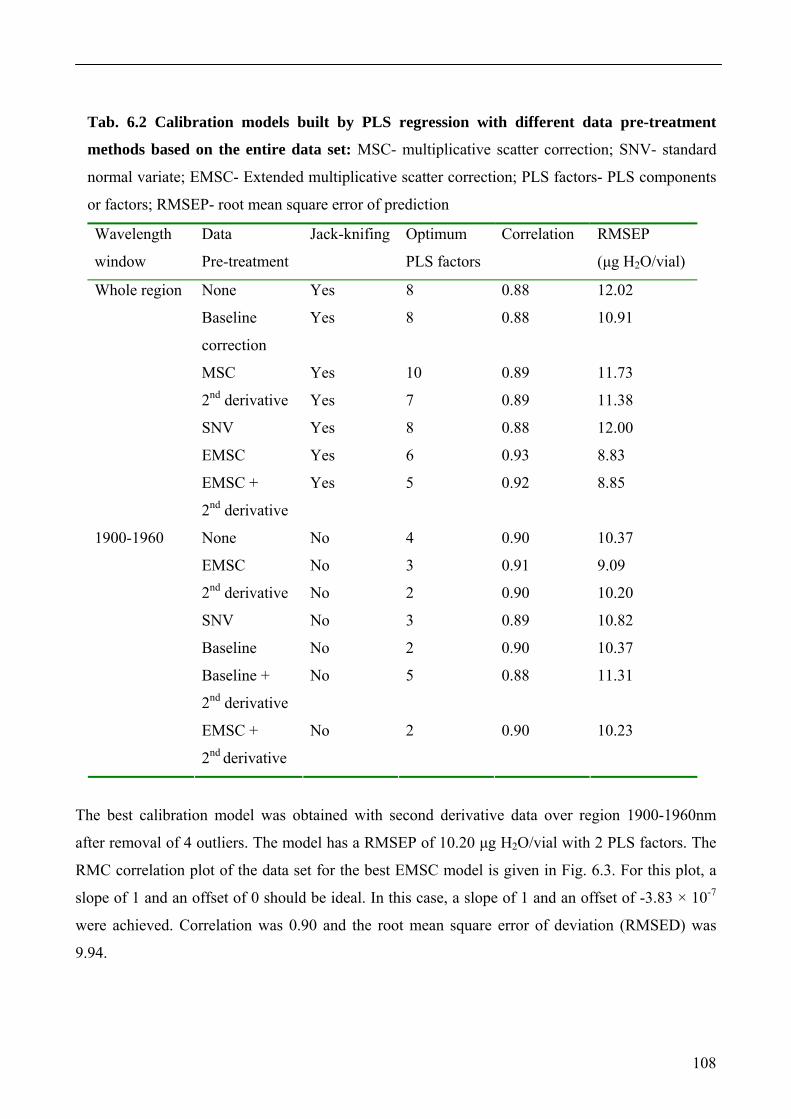
108
Tab. 6.2 Calibration models built by PLS regression with different data pre-treatment
methods based on the entire data set: MSC- multiplicative scatter correction; SNV- standard
normal variate; EMSC- Extended multiplicative scatter correction; PLS factors- PLS components
or factors; RMSEP- root mean square error of prediction
Wavelength
window
Data
Pre-treatment
Jack-knifing Optimum
PLS factors
Correlation RMSEP
(μg H2O/vial)
None Yes 8 0.88 12.02
Baseline
correction
Yes 8 0.88 10.91
MSC Yes 10 0.89 11.73
2nd derivative Yes 7 0.89 11.38
SNV Yes 8 0.88 12.00
EMSC Yes 6 0.93 8.83
Whole region
EMSC +
2nd derivative
Yes 5 0.92 8.85
None No 4 0.90 10.37
EMSC No 3 0.91 9.09
2nd derivative No 2 0.90 10.20
SNV No 3 0.89 10.82
Baseline No 2 0.90 10.37
Baseline +
2nd derivative
No 5 0.88 11.31
1900-1960
EMSC +
2nd derivative
No 2 0.90 10.23
The best calibration model was obtained with second derivative data over region 1900-1960nm
after removal of 4 outliers. The model has a RMSEP of 10.20 μg H2O/vial with 2 PLS factors. The
RMC correlation plot of the data set for the best EMSC model is given in Fig. 6.3. For this plot, a
slope of 1 and an offset of 0 should be ideal. In this case, a slope of 1 and an offset of -3.83 × 10⁻⁷
were achieved. Correlation was 0.90 and the root mean square error of deviation (RMSED) was
9.94.
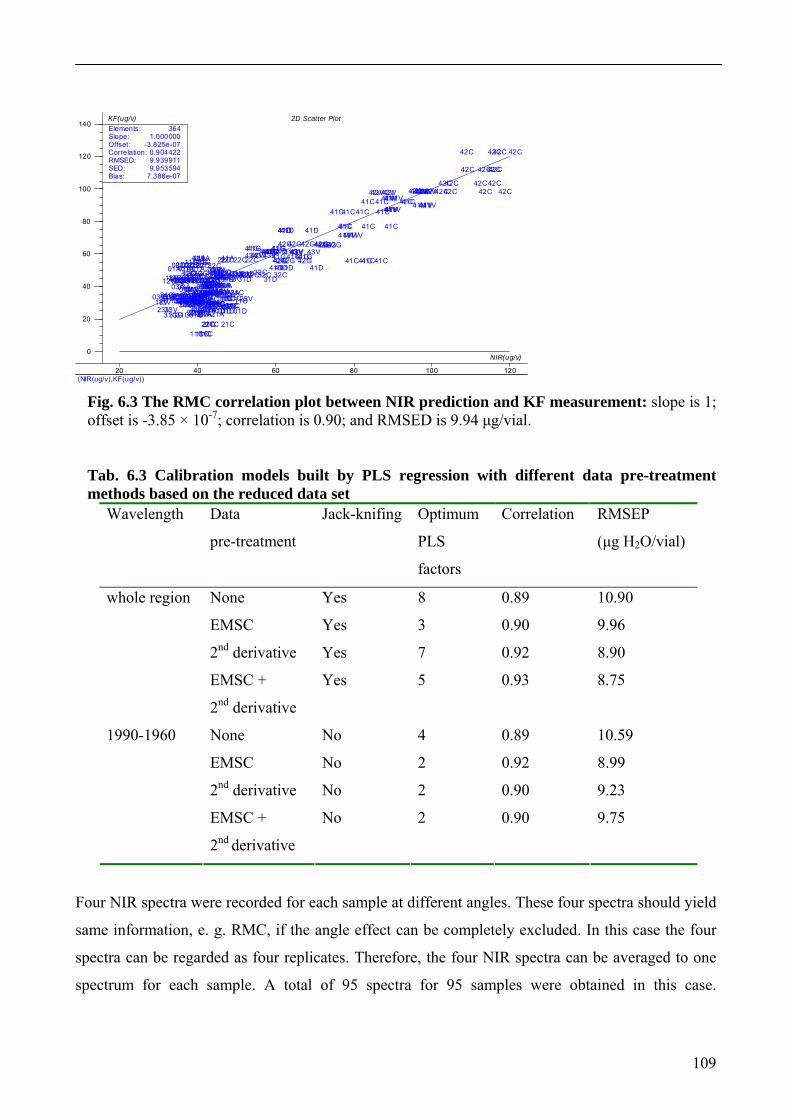
109
0
20
40
60
80
100
120
140
20 40 60 80 100 120 (NIR(ug/v),KF(ug/v))
01A01A01A01A
02A02A02A02A03A03A 03A03A
11A11A11A11A12A12A12A 12A
13A13A 13A13A
21A21A21A21A
22A22A 22A22A23A23A23A23A
31A31A31A31A
33A33A33A33A
41A41A41A41A
41A41A41A41A
42A42A42A42A43A 43A 43A43A
01C01C01C01C01C01C01C01C01C01C01C01C
02C02C02C02C
02C02C02C02C
02C02C02C02C
11C11C11C11C
11C11C11C11C
11C11C11C11C 11C11C11C11C
12C12C12C12C12C12C12C12C 12C12C12C12C
21C21C21C21C21C21C21C21C
21C21C21C21C
22C 22C22C22C
31C 31C31C 31C31C31C31C 31C31C31C 31C31C
32C32C32C32C32C 32C32C32C
32C32C32C32C41C 41C41C41C
41C41C 41C41C41C41C 41C41C
41C41C 41C41C
42C 42C42C42C
42C42C 42C42C
42C42C42C42C
42C42C42C 42C
01D01D 01D01D11D11D11D11D
21D21D21D 21D31D 31D31D31D
41D41D41D 41D
41D41D41D41D
41D41D 41D41D
01G01G01G 01G
02G02G02G02G
11G11G11G11G
12G 12G12G12G21G21G21G21G
22G22G22G22G31G31G31G31G31G31G31G31G
31G31G31G31G
32G32G32G32G
41G41G41G41G41G41G 41G41G41G41G 41G41G
42G42G42G42G
42G42G42G42G 42G42G42G42G
01V01V01V01V
02V02V02V02V03V03V03V 03V
11V11V11V11V
12V12V12V12V13V 13V13V13V
21V21V21V21V
22V22V22V22V23V 23V23V23V
31V31V31V31V32V32V32V32V
33V33V 33V33V
41V41V41V41V
41V41V41V41V 41V41V41V41V41V41V41V41V42V42V42V42V 42V42V42V42V42V42V 42V42V
43V43V43V43V
43V43V 43V43V 43V43V 43V43V
Elements:Slope:Offset:Correlation:RMSED:SED:Bias:
3641.000000
-3.825e-070.9044229.9399119.953594
7.388e-07
NIR(ug/v)
KF(ug/v) 2D Scatter Plot
Fig. 6.3 The RMC correlation plot between NIR prediction and KF measurement: slope is 1;
offset is -3.85 × 10⁻⁷; correlation is 0.90; and RMSED is 9.94 μg/vial. Tab. 6.3 Calibration models built by PLS regression with different data pre-treatment
methods based on the reduced data set Wavelength Data
pre-treatment
Jack-knifing Optimum
PLS
factors
Correlation RMSEP
(μg H2O/vial)
None Yes 8 0.89 10.90
EMSC Yes 3 0.90 9.96
2nd derivative Yes 7 0.92 8.90
whole region
EMSC +
2nd derivative
Yes 5 0.93 8.75
None No 4 0.89 10.59
EMSC No 2 0.92 8.99
2nd derivative No 2 0.90 9.23
1990-1960
EMSC +
2nd derivative
No 2 0.90 9.75
Four NIR spectra were recorded for each sample at different angles. These four spectra should yield
same information, e. g. RMC, if the angle effect can be completely excluded. In this case the four
spectra can be regarded as four replicates. Therefore, the four NIR spectra can be averaged to one
spectrum for each sample. A total of 95 spectra for 95 samples were obtained in this case.
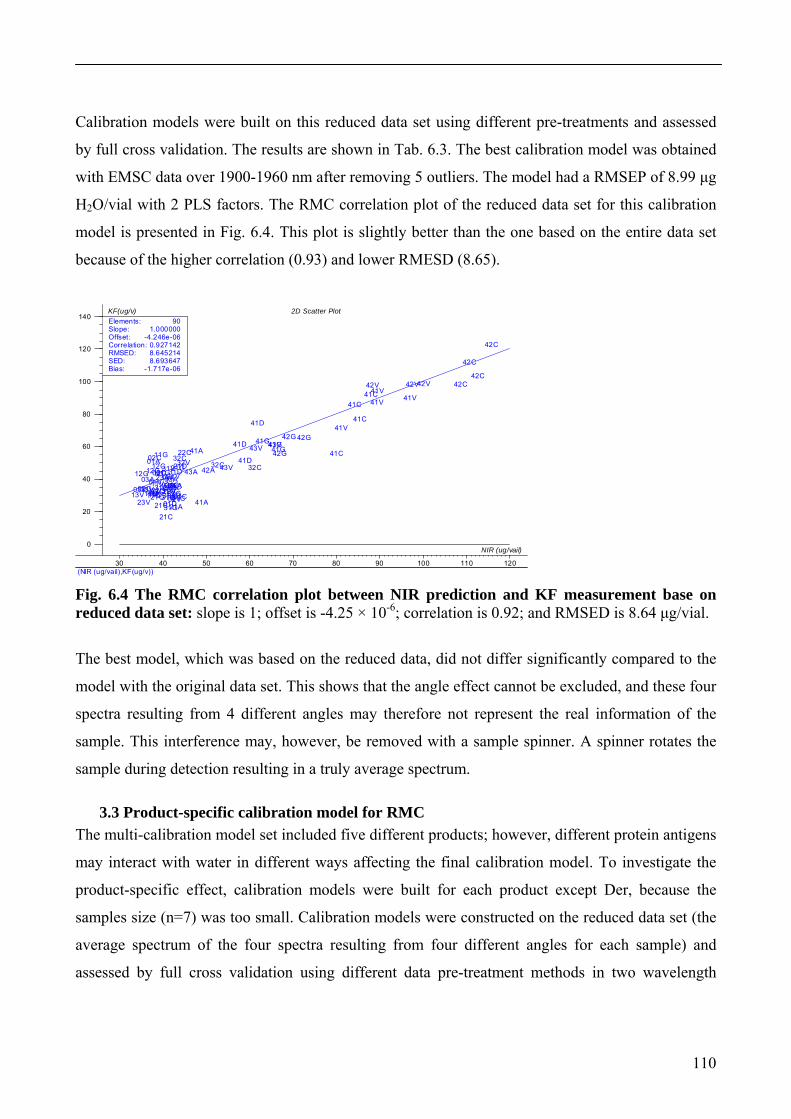
110
Calibration models were built on this reduced data set using different pre-treatments and assessed
by full cross validation. The results are shown in Tab. 6.3. The best calibration model was obtained
with EMSC data over 1900-1960 nm after removing 5 outliers. The model had a RMSEP of 8.99 μg
H2O/vial with 2 PLS factors. The RMC correlation plot of the reduced data set for this calibration
model is presented in Fig. 6.4. This plot is slightly better than the one based on the entire data set
because of the higher correlation (0.93) and lower RMESD (8.65).
0
20
40
60
80
100
120
140
30 40 50 60 70 80 90 100 110 120 (NIR (ug/vail),KF(ug/v))
01A
02A03A
11A12A
13A
21A
22A23A
31A
33A
41A
41A
42A43A
01C01C01C
02C
02C
02C
11C11C 11C
12C12C12C
21C21C
21C
22C
31C31C31C
32C32C
32C41C
41C41C
41C
42C
42C
42C
42C
01D11D
21D31D
41D
41D
41D
01G
02G
11G
12G21G
22G31G31G31G
32G
41G41G41G
42G
42G 42G
01V
02V03V
11V
12V13V
21V
22V23V
31V32V
33V
41V
41V 41V41V
42V 42V42V
43V
43V 43V
Elements:Slope:Offset:Correlation:RMSED:SED:Bias:
901.000000
-4.246e-060.9271428.6452148.693647
-1.717e-06
NIR (ug/vail)
KF(ug/v) 2D Scatter Plot
Fig. 6.4 The RMC correlation plot between NIR prediction and KF measurement base on reduced data set: slope is 1; offset is -4.25 × 10⁻⁶; correlation is 0.92; and RMSED is 8.64 μg/vial.
The best model, which was based on the reduced data, did not differ significantly compared to the
model with the original data set. This shows that the angle effect cannot be excluded, and these four
spectra resulting from 4 different angles may therefore not represent the real information of the
sample. This interference may, however, be removed with a sample spinner. A spinner rotates the
sample during detection resulting in a truly average spectrum.
3.3 Product-specific calibration model for RMC The multi-calibration model set included five different products; however, different protein antigens
may interact with water in different ways affecting the final calibration model. To investigate the
product-specific effect, calibration models were built for each product except Der, because the
samples size (n=7) was too small. Calibration models were constructed on the reduced data set (the
average spectrum of the four spectra resulting from four different angles for each sample) and
assessed by full cross validation using different data pre-treatment methods in two wavelength
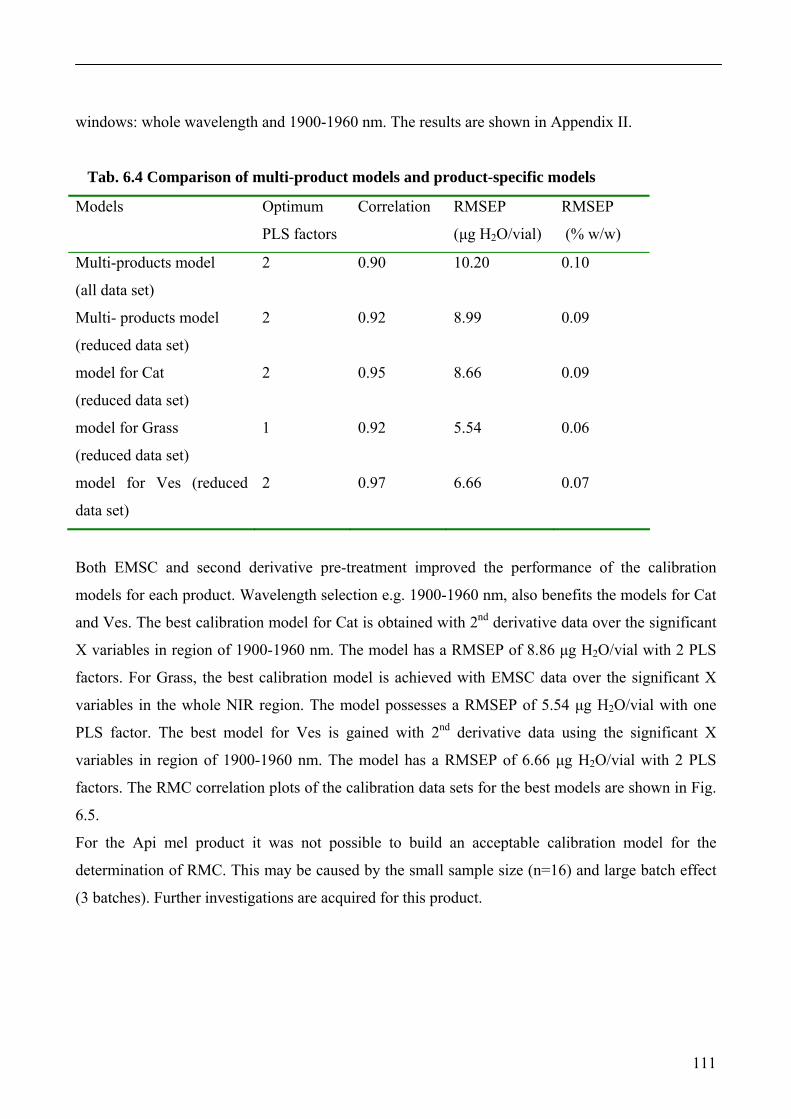
111
windows: whole wavelength and 1900-1960 nm. The results are shown in Appendix II.
Tab. 6.4 Comparison of multi-product models and product-specific models
Models Optimum
PLS factors
Correlation RMSEP
(μg H2O/vial)
RMSEP
(% w/w)
Multi-products model
(all data set)
2 0.90 10.20 0.10
Multi- products model
(reduced data set)
2 0.92 8.99 0.09
model for Cat
(reduced data set)
2 0.95 8.66 0.09
model for Grass
(reduced data set)
1 0.92 5.54 0.06
model for Ves (reduced
data set)
2 0.97 6.66 0.07
Both EMSC and second derivative pre-treatment improved the performance of the calibration
models for each product. Wavelength selection e.g. 1900-1960 nm, also benefits the models for Cat
and Ves. The best calibration model for Cat is obtained with 2nd derivative data over the significant
X variables in region of 1900-1960 nm. The model has a RMSEP of 8.86 μg H2O/vial with 2 PLS
factors. For Grass, the best calibration model is achieved with EMSC data over the significant X
variables in the whole NIR region. The model possesses a RMSEP of 5.54 μg H2O/vial with one
PLS factor. The best model for Ves is gained with 2nd derivative data using the significant X
variables in region of 1900-1960 nm. The model has a RMSEP of 6.66 μg H2O/vial with 2 PLS
factors. The RMC correlation plots of the calibration data sets for the best models are shown in Fig.
6.5.
For the Api mel product it was not possible to build an acceptable calibration model for the
determination of RMC. This may be caused by the small sample size (n=16) and large batch effect
(3 batches). Further investigations are acquired for this product.
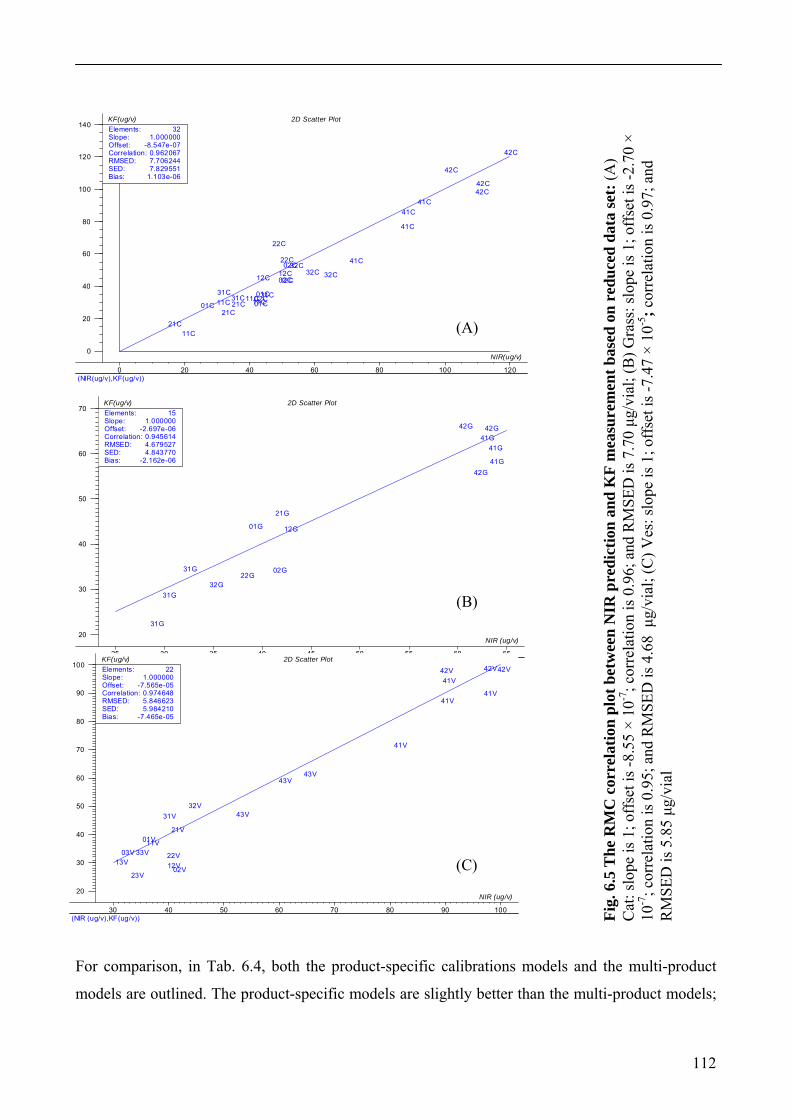
112
0
20
40
60
80
100
120
140
0 20 40 60 80 100 120 (NIR(ug/v),KF(ug/v))
01C 01C01C
02C
02C
02C
11C
11C
11C 11C
12C12C 12C
21C21C
21C
22C
22C
31C31C31C
32C32C
32C41C
41C41C
41C
42C
42C
42C
42C
Elements:Slope:Offset:Correlation:RMSED:SED:Bias:
321.000000
-8.547e-070.9620677.7062447.829551
1.103e-06
NIR(ug/v)
KF(ug/v) 2D Scatter Plot
20
30
40
50
60
70
25 30 35 40 45 50 55 60 65 (NIR (ug/v),KF(ug/v))
01G
02G
12G
21G
22G31G
31G
31G
32G
41G
41G41G
42G
42G 42G
Elements:Slope:Offset:Correlation:RMSED:SED:Bias:
151.000000
-2.697e-060.9456144.6795274.843770
-2.162e-06
NIR (ug/v)
KF(ug/v) 2D Scatter Plot
20
30
40
50
60
70
80
90
100
30 40 50 60 70 80 90 100 (NIR (ug/v),KF(ug/v))
01V
02V
03V11V
12V13V
21V
22V
23V
31V32V
33V
41V
41V41V
41V42V 42V42V
43V
43V43V
Elements:Slope:Offset:Correlation:RMSED:SED:Bias:
221.000000
-7.565e-050.9746485.8466235.984210
-7.465e-05
NIR (ug/v)
KF(ug/v) 2D Scatter Plot
Fig.
6.5
The
RM
C c
orre
latio
n pl
ot b
etw
een
NIR
pre
dict
ion
and
KF
mea
sure
men
t bas
ed o
n re
duce
d da
ta se
t: (A
) C
at: s
lope
is 1
; off
set i
s -8.
55 ×
10-7
; cor
rela
tion
is 0
.96;
and
RM
SED
is 7
.70 μg
/via
l; (B
) Gra
ss: s
lope
is 1
; off
set i
s -2.
70 ×
10
-7; c
orre
latio
n is
0.9
5; a
nd R
MSE
D is
4.6
8 μ
g/vi
al; (
C) V
es: s
lope
is 1
; off
set i
s -7.
47 ×
10-5
; cor
rela
tion
is 0
.97;
and
R
MSE
D is
5.8
5 μg
/via
l
For comparison, in Tab. 6.4, both the product-specific calibrations models and the multi-product
models are outlined. The product-specific models are slightly better than the multi-product models;
(A)
(B)
(C)
113
however, the sample sizes in the current product-specific models are not large enough, because 100
samples is ideal in a training data set [19]. Thus, further investigations are required for the product-
specific models. Nevertheless, a multi-product calibration model is more useful for routine analysis
because of easy use.
4 Conclusion This study for the first time demonstrates that NIR spectroscopy is reliable method for RMC
prediction in lyophilized allergy vaccines. RMC results obtained from NIR spectroscopy show good
agreement with results obtained by KF titration. The acceptable product-specific models and multi-
product models indicate that NIR spectroscopy can be used as a quantitative method to determine
RMC in lyophilized allergy vaccines. The models based on product-specific data are slightly better
than models based on multi-product data; however, a general multi-product model is more useful,
since one model can predict all samples in a pharmaceutical production of allergy vaccines.
114
Reference
1. Klibanov AM, Schefiliti JA. On the relationship between conformation and stability in solid
pharmaceutical protein formulations. Biotechnology Letters, 2004; 26: 1103-1106.
2. Costantino HR, Griebenow K, Mishra P, Langer R, Klibanov AM. Fourier-transform
infrared spectroscopic investigation of protein stability in the lyophilized form. Biochimica
et Biophsica Acta, 1995; 1253: 69-74.
3. Schwendeman SP, Costantino HR, Gupta RK, Siber GR, Klibanov AM, Langer R.
Stabilization of tetanus and diphtheria toxoids against moisture-induced aggregation.
Applied Biological Sciences, 1995; 92: 11234-11238.
4. Food and Drug Administration. Guideline for the determination of residual moisture of
residual moisture in dried biological products. Docket No. 89D-0140.
5. May JC, Del Grosso A, Etz N, Wheeler R, Rey L. Thermogravimetry and vapour pressure
moisture. Application to determination of residual moisture in BCG vaccine. Journal of
Thermal Analysis and Calorimetry, 2006; 83 (1): 31-33.
6. May JC, Del Grosso AV, Wheeler RM, Etz NM. TG/MS capillary interface. Applications to
determination of residual moisture in BCG vaccine and other freeze-dried biological
products. Journal of Thermal analysis, 1997; 49: 929-936.
7. Luck WAP. Structure of water and aqueous solution. Verlag Chemie-Physik, Weinheim,
Germany, 1974: p248-284.
8. Büning-Pfaue H. Analysis of water in food by near infrared spectroscopy. Food Chemistry
2003; 82: 107-115.
9. Reich G. Near-infrared spectroscopy and imaging: Basic principle and pharmaceutical
application. Advanced Drug Delivery Reviews, 2005: 1109-1143.
10. Bakeev KA. Near-infrared spectroscopy as a process analytical tool; Part II: at-line and on-
line applications and implementation strategies. Spectroscopy 2004; 19: 39-42.
11. Lin TP, Hsu CC. Determination of residual moisture in lyophilized protein pharmaceuticals
using a rapid and non-invasive method: near infrared spectroscopy. PDA Journal of
Pharmaceuticals Science and Technology, 2001; 56:196-205.
12. Dziki X, Bauer JF, Szpylman JJ, Quick JE, Nichols BC. The use of near-infrared
spectroscopy to monitor the mobility of water within the sarafloxacin crystal lattice, Journal
of Pharmaceutical and Biomedical Analysis, 2000; 22: 829-848.
115
13. Blanco M, Coello J, Itirriaga H, Maspoch S, de la Pezuela C. Near-infrared spectroscopy in
the pharmaceutical industry. Analyst 1998; 123: 135R-150R.
14. Zhou X, Hines P, Borer ME. Moisture determination in hygroscopic drug substances by
near infrared spectroscopy, Journal of Pharmaceutical and Biomedical Analysis 1998; 17:
219-225.
15. Kamat MS, Lodder RA, DeLuca PP. Near-infrared spectroscopic determination of residual
moisture in lyophilised sucrose through intact glass vials. Pharmaceutical Research, 1989; 6:
961-965.
16. Ciurczak EW, Torlini RP, Demkowicz MP. Determination of particle size of pharmaceutical
raw materials using near-infrared reflectance spectroscopy. Spectroscopy, 1986; 1: 36-39.
17. Sukowski L. NIR based process analytical technology: In-line residual moisture
determination for a complete batch inspection of lyophilized end-products. PhD thesis,
University of Basel, Deutschland, 2003
18. Martens H, Nielsen JP, Engelsen SB. Light scattering and light absorbance separated by
extended multiplicative signal correction application to near-infrared transmission analysis
of powder mixtures. Analytical Chemistry, 2003; 75: 394-404.
19. Williams PC, Norris K. Variables affecting near-infrared spectroscopic analysis. In:
Williams P, Norris K (Eds.), Near-infrared technology in the agricultural and food
industries. American Association of Cereal Chemists, Inc. St. Paul, Minnesota, USA. 2001,
p171-185.
116
Chapter VII: Classification and identification of lyophilized allergen vaccines by NIR spectroscopy
Abstract
In pharmaceutical production scenario quality control is essential to guarantee safety, efficacy and
reproducibility of the products. However, there is no method which can meet all requirements in
routine analysis. Near infrared spectroscopy combined with SIMCA as a rapid non-destructive tool
to classify and identify allergy vaccines at different concentrations, different species and different
batches has been demonstrated in this work. The results indicate that the highest concentration
vaccines are successfully classified from low concentrations (100% at the level of 95% confidence)
without the bee venom (api). Five different vaccine products at highest concentration are
discriminated from each other by a SIMCA model. The classification of different batches may be
possible for the highest concentrations vaccines. However, more experiments are required for low
concentration samples and if many batches involved data. The results indicate that NIR
spectroscopy can be applied as a rapid and non-destructive tool to classify and identify allergen
vaccines.
117
1 Introduction In a pharmaceutical production scenario, quality control is essential to guarantee safety, efficacy
and reproducibility of products, as well as to document identity, potency, and quality. Quality
control involves analysis of raw materials, intermediate productions, and final products [1], and
thus, quality control is performed in different ways, and at different steps in the production as well
as in careful analysis of final products [2]. In every case, a lot of random samples have to be
withdrawn and analysed in order to control the production process in an optimal way [3].
Conventional quality control methods involve time-consuming, laborious, and costly procedures,
and often also require reagents [4], which also needs to be controlled. It would be desirable to
overcome these disadvantages by the introduction of new methods. The new technique should be
sufficiently accurate and precise and without sample preparation, preferentially with simultaneous
determination of several parameters in a single experiment; and it should be fast, efficient, and
suitable for online or inline analysis [1]. Near infrared spectroscopy (NIR) is such a method.
NIR spectroscopy has many advantages over other analytical techniques. It offers many interesting
applications in pharmaceutical research, production, and quality control, such as identification and
qualification of raw materials, product quality control and process monitoring. Reich [5] recently
reviewed the application of NIR in the pharmaceutical industry. NIR spectroscopy has played a
significant role in quality control analysis to identify and classify the material [6-8]. NIR users have
called this application ‘qualitative analysis’, ‘discriminant analysis’, ‘product identification’,
‘pattern recognition’, or other terms [6].
In our previous study, NIR was demonstrated to be an as a fast, non-invasive, and non-destructive
method to determine the residual moisture content in lyophilized vaccines in Chapter VI. The
advantages of NIR spectroscopy has been discussed as well. One great advantage of NIR is that a
variety of information can be extracted from a same spectrum. Besides moisture content, the same
spectrum contains information capable of classifying and identifying different vaccine products.
Moreover, it is an easy way to provide information of the reproducibility from batch to batch. In the
present work, we describe a simultaneous and rapid identification and classification assay for the
determination of different species of allergy vaccines at different concentrations and different
batches.
2 Materials and methods
2.1 Samples Commercially available allergen vaccines (ALK-Abelló A/S, Denmark) used in this study
118
comprised the following species: bee venom (api), cat hair and dander (cat), house dust mite (der),
grass pollen (grass), and wasp venom (vespula). A total of 665 random samples representing
different concentrations and different batches were sued. Detailed information is given in Appendix
C.
2.2 NIR measurement
All NIR measurements were carried out using a FT-NIR spectrometer (PerkinElmer Spectrum One,
PerkinElmer) with an InGaAs detector. NIR spectra were recorded in the reflectance mode through
the bottom of the intact glass vials at ambient temperature. Each spectrum was the average of 80
successive scans at 16 cm-1 resolution. The spectral region used for the data analyses was from 700
to 2500 nm, the data were measured in 1.67 nm intervals, which resulted in 1078 data points per
spectrum. For each sample, four spectra were collected by rotating the vial at different angles.
Therefore, a total of 2660 spectra were obtained.
2.3 Data analysis
Spectra were exported in ASCII format into The Unscrambler software, version 9.2 (CAMO, Oslo,
Norway) for further analysis.
3 Results and discussion
3.1 Data pre-treatment
Since multivariate NIR spectral data contain huge numbers of X variables and because of the large
sample set (665 samples), there is a need to reduce the number of X variables for relatively rapid
analyses. An increase of the data interval to 8.35 nm result in each spectrum having 216 data points
after reduction. The entire data set is randomly divided into a calibration set (training set) and a test
set, with the calibration set being sufficiently large (532 samples) to detect unknown variation. The
test data set (665 samples) is composed of the calibration set (532 samples) and other new samples
(123 samples).
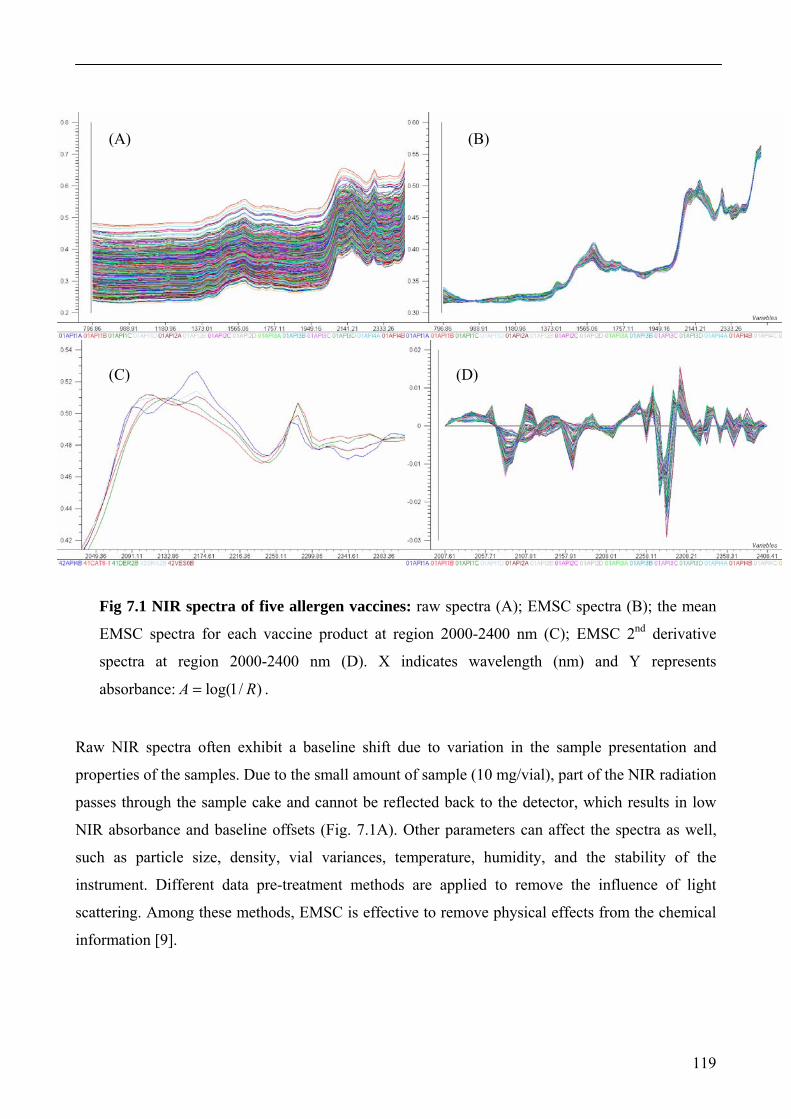
119
Fig 7.1 NIR spectra of five allergen vaccines: raw spectra (A); EMSC spectra (B); the mean
EMSC spectra for each vaccine product at region 2000-2400 nm (C); EMSC 2nd derivative
spectra at region 2000-2400 nm (D). X indicates wavelength (nm) and Y represents
absorbance: )/1log( RA = .
Raw NIR spectra often exhibit a baseline shift due to variation in the sample presentation and
properties of the samples. Due to the small amount of sample (10 mg/vial), part of the NIR radiation
passes through the sample cake and cannot be reflected back to the detector, which results in low
NIR absorbance and baseline offsets (Fig. 7.1A). Other parameters can affect the spectra as well,
such as particle size, density, vial variances, temperature, humidity, and the stability of the
instrument. Different data pre-treatment methods are applied to remove the influence of light
scattering. Among these methods, EMSC is effective to remove physical effects from the chemical
information [9].
(C) (D)
(A) (B)
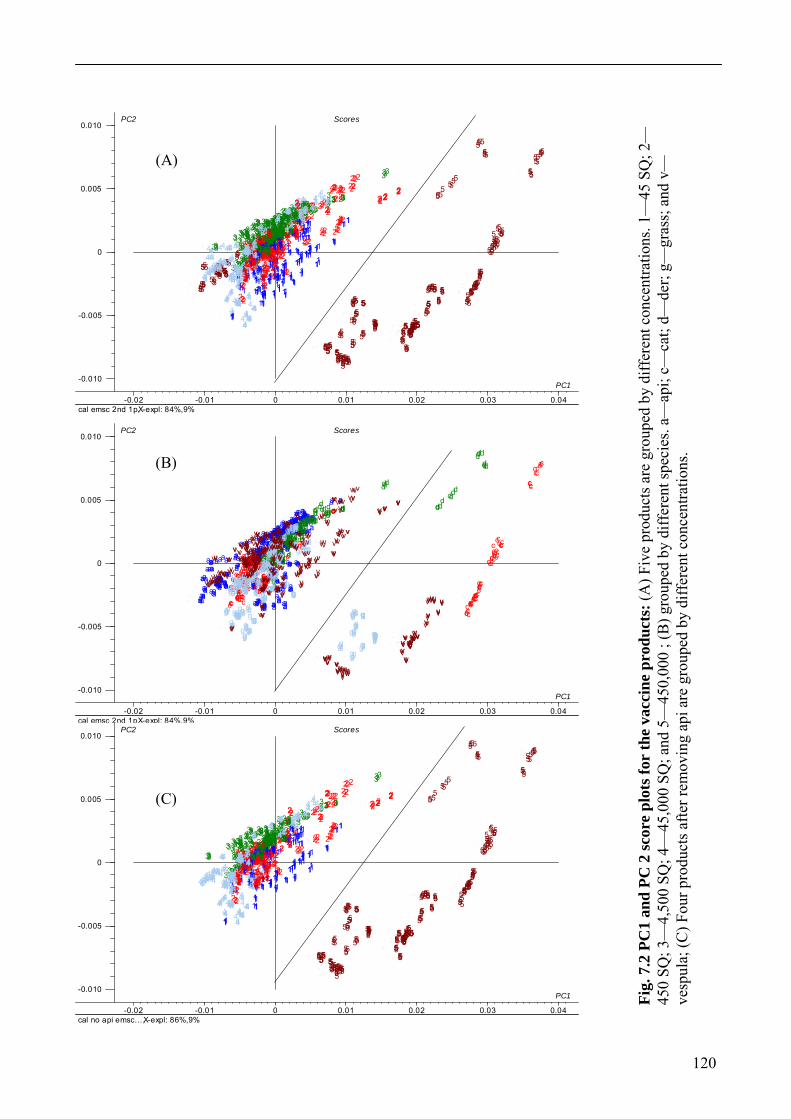
120
-0.010
-0.005
0
0.005
0.010
-0.02 -0.01 0 0.01 0.02 0.03 0.04 cal emsc 2nd 1p, X-expl: 84%,9%
1111 1111
111111111111
1111
1111
1111
1111
11111111
1111
222222222222 2222
2222
2222
22222222
2222
222222222222
333333333333333333333333
3333333333333333333333334444
44444444
4444
4444
4444
4444
4444
4444
4444
4444
4444
5555
5555
5555
55555555555555555555
5555
555555555555
1111
11111111
1111
1111
11111111
1111
1111
111122222222
2222
2222
22222222
22 22
2222333333 33333333333333
3333
3333333333333333
555555555555555555555555
5555
55555555
5 555
1111
1111
1111
11111111
1111
1111 111111111111
22222222
22222222
2222
22222222
2222
22222222333333333333
3333
33333333
33333333 3333
3333
4 444
44 44
444
44444
44 44
444444444444
4444
4444
5555555555555555
5555555555555555
55555555
1111
11111111
1111
1 111
1111
11111
11
111112222222222222222
2222
22223333
3333
3333
3333
3333333333333333 33333333
44444444
4444444444444444444444444444
55555555
5555
5555
5555
55555555
5555
5555
5555
11111111
11111111
111111111111
11111111
1111
2222
2222
2222 222222222222
2222
22222222
3 333
33333333
3333
333333333333
3333
3333
3333 4444
4444
44444444
4444
4444
44444444
44444444
5555
5555
5555
5555
5555
555555551111111111111111
1111
1111
11111111
1111 11111111
11112222
22222222
222222222222
2222
2222
22222222
2222
222
2
3333
333333333333
3333
333333333333 3333
3333
3333
3333
4444
44444444
4444 4444 4444
44444444
4444 444444444444
5555
5555
55555555
11111111
1111
111111111111
1111
11111111 1111
1111
1111
22222222
2222
2222
2222
2222
22222222
22222222
2222
2222
33333333
33333233
333333333333
33333333
3333
3333
3333
4444
4444 44444444
44444444
4444
444444444444
5555555555555555
1111
1111
1111
11111111
11111111
22222222 2222
2222
2222
22222222
3333
333333333333
333333333333
333333333333
44444 444
444444444444
444444444 44444444444
55555555
5555
55555555
55555555
1111
1111
1111
1111
11111111
1111
111111111111
1111
1111
2222
2222
2222
2222
2222
22222222
2222
2222
2222
22222222
33333333
3333
3333
333333333333
3333
33333333
3333333344444443
4444444444444444
4444444444444444
5555
555555555555555555555555555555555555
11111111
1111
11111111
1111
11111111
1111
1111
2222
2222
22222222
22222222
2222
22222222
2222
3333
3333333333333333
3333
33333333
3333
3333
44444444
4444
4444
4444
5555
5555
55555555
55555555
55555555
5555
5555
111111111111
1111
1111
1111
11111111
1111
11112222
2222
22222222
2222
22222222
2222
2222
2222
3333333333333333
3333333333333333
3333
3333
4444444444444444
44444444 44444444
44444444
55555555
55555555 5555555555555555
55555555
PC1
PC2 Scores
-0.010
-0.005
0
0.005
0.010
-0.02 -0.01 0 0.01 0.02 0.03 0.04 cal emsc 2nd 1p, X-expl: 84%,9%
aaaa aaaa
aaaaaaaaaaaa
aaaa
aaaa
aaaa
aaaa
aaaaaaaa
aaaa
aaaaaaaaaaaa aaaa
aaaa
aaaa
aaaaaaaa
aaaa
aaaaaaaaaaaa
aaaaaaaaaaaaaaaaaaaaaaaa
aaaaaaaaaaaaaaaaaaaaaaaaaaaa
aaaaaaaa
aaaa
aaaa
aaaa
aaaa
aaaa
aaaa
aaaa
aaaa
aaaa
aaaa
aaaa
aaaa
aaaaaaaaaaaaaaaaaaaa
aaaa
aaaaaaaaaaaa
aaaa
aaaaaaaa
aaaa
aaaa
aaaaaaaa
aaaa
aaaa
aaaaaaaaaaaa
aaaa
aaaa
aaaaaaaa
aa aa
aaaaaaaaaa aaaaaaaaaaaaaa
aaaa
aaaaaaaaaaaaaaaa
aaaaaaaaaaaaaaaaaaaaaaaa
aaaa
aaaaaaaa
a aaa
aaaa
aaaa
aaaa
aaaaaaaa
aaaa
aaaa aaaaaaaaaaaa
aaaaaaaa
aaaaaaaa
aaaa
aaaaaaaa
aaaa
aaaaaaaaaaaaaaaaaaaa
aaaa
aaaaaaaa
aaaaaaaa aaaa
aaaa
a aaa
aa aa
aaa
aaaaa
aa aa
aaaaaaaaaaaa
aaaa
aaaa
aaaaaaaaaaaaaaaa
aaaaaaaaaaaaaaaa
aaaaaaaa
cccc
cccccccc
cccc
c ccc
cccc
ccccc
cc
ccccccccccccccccccccc
cccc
cccccccc
cccc
cccc
cccc
cccccccccccccccc cccccccc
cccccccc
cccccccccccccccccccccccccccc
cccccccc
cccc
cccc
cccc
cccccccc
cccc
cccc
cccc
cccccccc
cccccccc
cccccccccccc
cccccccc
cccc
cccc
cccc
cccc cccccccccccc
cccc
cccccccc
c ccc
cccccccc
cccc
cccccccccccc
cccc
cccc
cccc cccc
cccc
cccccccc
cccc
cccc
cccccccc
cccccccc
cccc
cccc
cccc
cccc
cccc
ccccccccdddddddddddddddd
dddd
dddd
dddddddd
dddd dddddddd
dddddddd
dddddddd
dddddddddddd
dddd
dddd
dddddddd
dddd
ddd
d
dddd
dddddddddddd
dddd
dddddddddddd dddd
dddd
dddd
dddd
dddd
dddddddd
dddd dddd dddd
dddddddd
dddd dddddddddddd
dddd
dddd
dddddddd
gggggggg
gggg
gggggggggggg
gggg
gggggggg gggg
gggg
gggg
gggggggg
gggg
gggg
gggg
gggg
gggggggg
gggggggg
gggg
gggg
gggggggg
gggggggg
gggggggggggg
gggggggg
gggg
gggg
gggg
gggg
gggg gggggggg
gggggggg
gggg
gggggggggggg
gggggggggggggggg
gggg
gggg
gggg
gggggggg
gggggggg
gggggggg gggg
gggg
gggg
gggggggg
gggg
gggggggggggg
gggggggggggg
gggggggggggg
ggggg ggg
gggggggggggg
ggggggggg ggggggggggg
gggggggg
gggg
gggggggg
gggggggg
vvvv
vvvv
vvvv
vvvv
vvvvvvvv
vvvv
vvvvvvvvvvvv
vvvv
vvvv
vvvv
vvvv
vvvv
vvvv
vvvv
vvvvvvvv
v vvv
vvvv
vvvv
vvvvvvvv
vvvvvvvv
vvvv
vvvv
vvvvvvvvvvvv
vvvv
vvvvvvvv
vvvvvvvvvvvvvvvv
vvvvvvvvvvvvvvvv
vvvvvvvvvvvvvvvv
vvvv
vvvvvvvvvvvvvvvvvvvvvvvvvvvvvvvvvvvv
vvvvvvvv
vvvv
vvvvvvvv
vvvv
vvvvvvvv
vvvv
vvvv
vvvv
vvvv
vvvvvvvv
vvvvvvvv
vvvv
vvvv vvvv
vvvv
vvvv
vvvvvvvvvvvvvvvv
vvvv
vvvvvvvv
vvvv
vvvv
vvvvvvvv
vvvv
vvvv
vvvv
vvvv
vvvv
vvvvvvvv
vvvvvvvv
vvvvvvvv
vvvv
vvvv
vvvv vvvvvvvv
vvvv
vvvv
vvvv
vvvvvvvv
vvvv
vvvvvvvv
vvvv
vvvvvvvv
vvvv
vvvvvvvv
vvvv
vvvv
vvvv
vvvvvvvvvvvvvvvv
vvvvvvvvvvvvvvvv
vvvv
vvvv
vvvvvvvvvvvvvvvv
vvvvvvvv vvvvvvvv
vvvvvvvv
vvvvvvvv
vvvvvvvv vvvvvvvvvvvvvvvv
vvvvvvvv
PC1
PC2 Scores
-0.010
-0.005
0
0.005
0.010
-0.02 -0.01 0 0.01 0.02 0.03 0.04 cal no api emsc…, X-expl: 86%,9%
11111 1111111
1111
1 111
1111
11111
11
111112222222222222222
2222
22223333
3333
3333
3333
3333333333333333 3333
33334444
44444444
444444444444444444444444 5555
5555
5555
5555
5555
55555555
5555
5555
555511111111
11111111
111111111111
11111111
11112222
2222
2222 222222222222
2222
22222222
3 333
33333333
3333
333333333333
3333
3333
3333 4444
4444
44444444
4444
4444
44444444
4444
4444
5555
5555
5555
5555
5555
55555555
1111111111111111
1111
1111
11111111
1111 11111111
11112222
22222222
222222222222
2222
2222
22222222
2222
222
2
3333
333333333333
3333
333333333333 3333
3333
3333
3333
4444
44444444
44444444 4444
44444444
4444 44444444
4444
5555
5555
55555555
11111111
1111
111111111111
1111
11111111
11111111
1111
22222222
2222
2222
2222
2222
22222222
22222222
22222222
33333333
33333233
333333333333
33333333
3333
3333
3333
44444444 44444444
4444
4444
4444
444444444444
5555555555555555
1111
1111
1111
11111111
1111111122222222 22222222
2222
22222222
3333
333333333333
333333333333
333333333333
44444 444
444444444444
444444444 44444444444
55555555
5555
55555555
55555555
1111
1111
1111
1111
11111111
1111
111111111111
1111
1111
2222
2222
2222
2222
2222
22222222
2222
2222
2222
22222222
33333333
3333
3333
33333333
3333333
3
333333333333
3333 44444443444444444444
44444444444444444444
5555
555555555555555555555555555555555555
11111111
1111
11111111
1111
11111111
1111
1111
2222
2222
22222222
22222222
2222
22222222
2222
3333
3333333333333333
3333
33333333
3333
3333
44444444
4444
4444
4444
5555
5555
55555555
55555555
5555
5555
5555
5555
111111111111
1111
1111
1111
1111 1111
1111
11112222
2222
22222222
2222
22222222
2222
2222
2222
3333333333333333
3333333333333333
3333
3333
4444444444444444
44444444
4444444444444444
55555555
55555555 5555555555555555
55555555
PC1
PC2 Scores
(A)
(B)
(C)
Fig.
7.2
PC
1 an
d PC
2 sc
ore
plot
s for
the
vacc
ine
prod
ucts
: (A
) Fiv
e pr
oduc
ts a
re g
roup
ed b
y di
ffer
ent c
once
ntra
tions
. 1—
45 S
Q; 2
—45
0 SQ
; 3—
4,50
0 SQ
; 4—
45,0
00 S
Q; a
nd 5
—45
0,00
0 ; (
B) g
roup
ed b
y di
ffer
ent s
peci
es. a
—ap
i; c—
cat;
d—de
r; g—
gras
s; a
nd v
—ve
spul
a; (C
) Fou
r pro
duct
s afte
r rem
ovin
g ap
i are
gro
uped
by
diff
eren
t con
cent
ratio
ns.
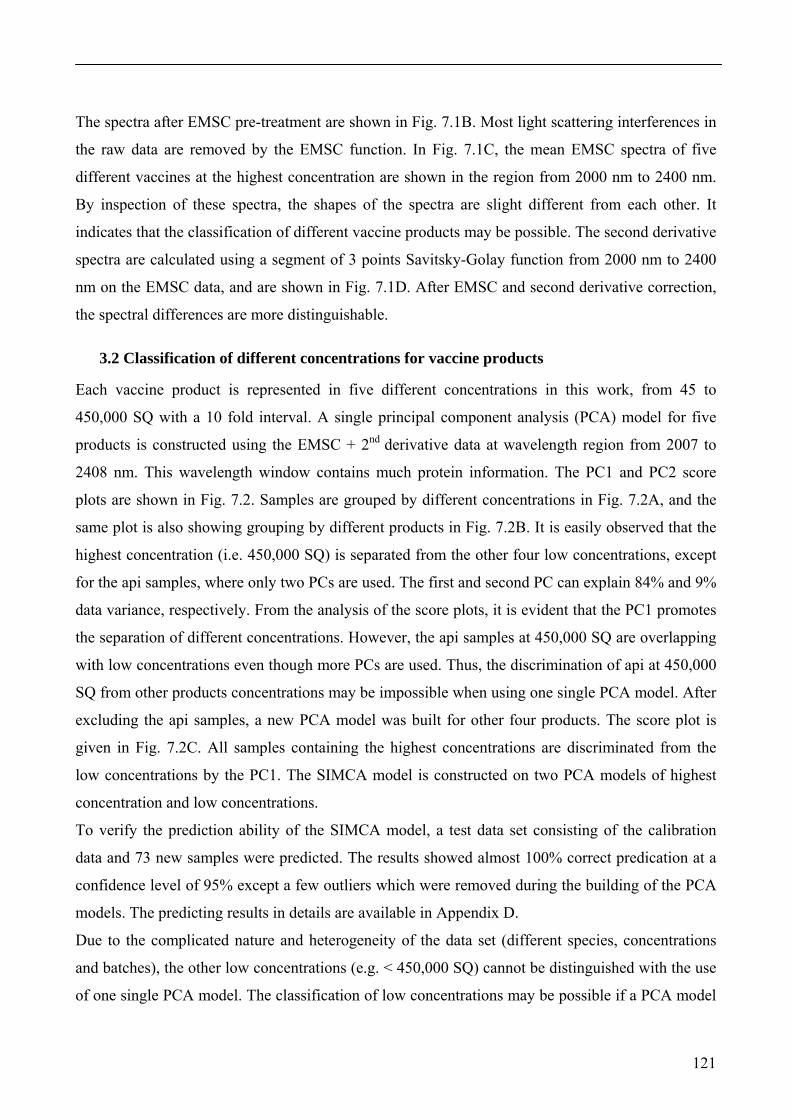
121
The spectra after EMSC pre-treatment are shown in Fig. 7.1B. Most light scattering interferences in
the raw data are removed by the EMSC function. In Fig. 7.1C, the mean EMSC spectra of five
different vaccines at the highest concentration are shown in the region from 2000 nm to 2400 nm.
By inspection of these spectra, the shapes of the spectra are slight different from each other. It
indicates that the classification of different vaccine products may be possible. The second derivative
spectra are calculated using a segment of 3 points Savitsky-Golay function from 2000 nm to 2400
nm on the EMSC data, and are shown in Fig. 7.1D. After EMSC and second derivative correction,
the spectral differences are more distinguishable.
3.2 Classification of different concentrations for vaccine products
Each vaccine product is represented in five different concentrations in this work, from 45 to
450,000 SQ with a 10 fold interval. A single principal component analysis (PCA) model for five
products is constructed using the EMSC + 2nd derivative data at wavelength region from 2007 to
2408 nm. This wavelength window contains much protein information. The PC1 and PC2 score
plots are shown in Fig. 7.2. Samples are grouped by different concentrations in Fig. 7.2A, and the
same plot is also showing grouping by different products in Fig. 7.2B. It is easily observed that the
highest concentration (i.e. 450,000 SQ) is separated from the other four low concentrations, except
for the api samples, where only two PCs are used. The first and second PC can explain 84% and 9%
data variance, respectively. From the analysis of the score plots, it is evident that the PC1 promotes
the separation of different concentrations. However, the api samples at 450,000 SQ are overlapping
with low concentrations even though more PCs are used. Thus, the discrimination of api at 450,000
SQ from other products concentrations may be impossible when using one single PCA model. After
excluding the api samples, a new PCA model was built for other four products. The score plot is
given in Fig. 7.2C. All samples containing the highest concentrations are discriminated from the
low concentrations by the PC1. The SIMCA model is constructed on two PCA models of highest
concentration and low concentrations.
To verify the prediction ability of the SIMCA model, a test data set consisting of the calibration
data and 73 new samples were predicted. The results showed almost 100% correct predication at a
confidence level of 95% except a few outliers which were removed during the building of the PCA
models. The predicting results in details are available in Appendix D.
Due to the complicated nature and heterogeneity of the data set (different species, concentrations
and batches), the other low concentrations (e.g. < 450,000 SQ) cannot be distinguished with the use
of one single PCA model. The classification of low concentrations may be possible if a PCA model
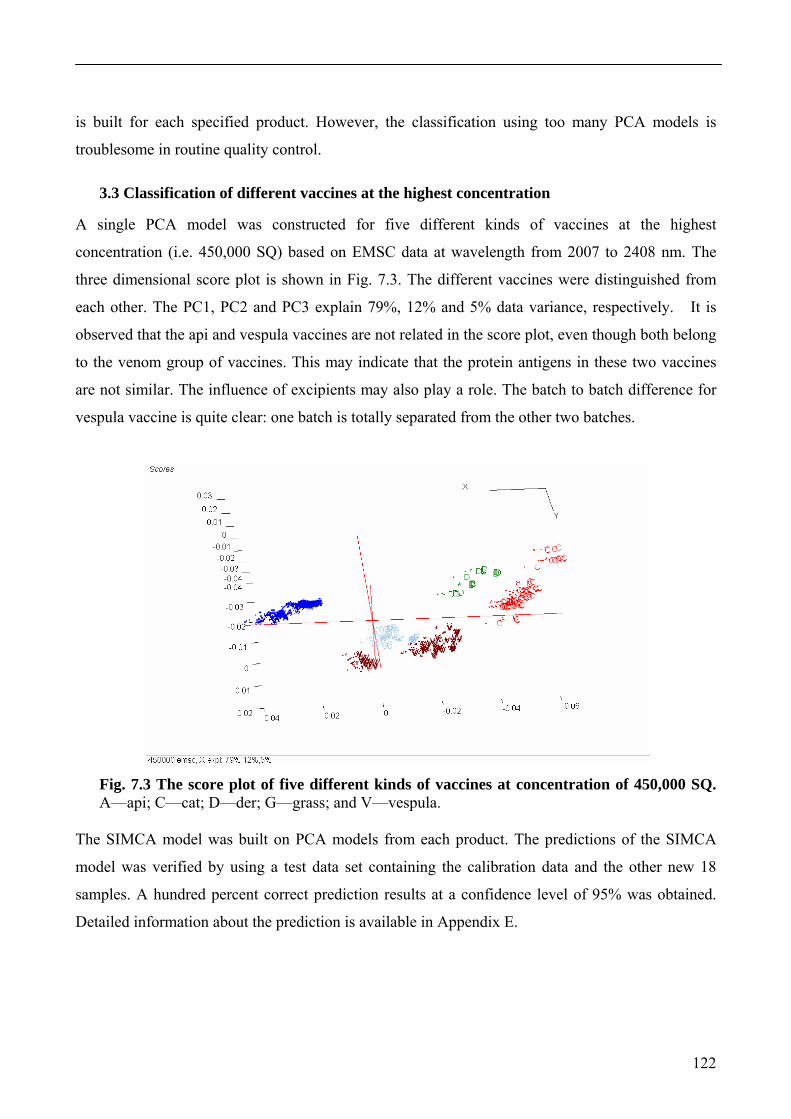
122
is built for each specified product. However, the classification using too many PCA models is
troublesome in routine quality control.
3.3 Classification of different vaccines at the highest concentration
A single PCA model was constructed for five different kinds of vaccines at the highest
concentration (i.e. 450,000 SQ) based on EMSC data at wavelength from 2007 to 2408 nm. The
three dimensional score plot is shown in Fig. 7.3. The different vaccines were distinguished from
each other. The PC1, PC2 and PC3 explain 79%, 12% and 5% data variance, respectively. It is
observed that the api and vespula vaccines are not related in the score plot, even though both belong
to the venom group of vaccines. This may indicate that the protein antigens in these two vaccines
are not similar. The influence of excipients may also play a role. The batch to batch difference for
vespula vaccine is quite clear: one batch is totally separated from the other two batches.
Fig. 7.3 The score plot of five different kinds of vaccines at concentration of 450,000 SQ. A—api; C—cat; D—der; G—grass; and V—vespula.
The SIMCA model was built on PCA models from each product. The predictions of the SIMCA
model was verified by using a test data set containing the calibration data and the other new 18
samples. A hundred percent correct prediction results at a confidence level of 95% was obtained.
Detailed information about the prediction is available in Appendix E.
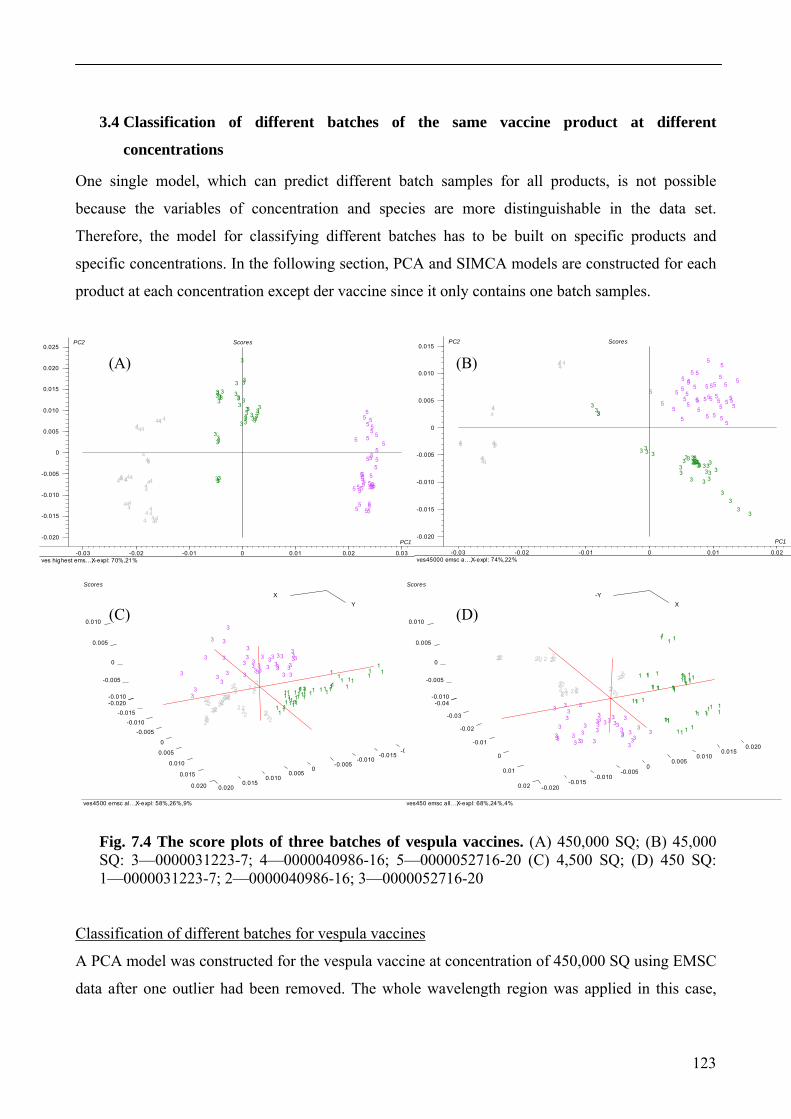
123
-0.020
-0.015
-0.010
-0.005
0
0.005
0.010
0.015
0.020
0.025
-0.03 -0.02 -0.01 0 0.01 0.02 0.03 ves highest ems…, X-expl: 70%,21%
3333
3333
3333
3333
3333
3333
3333
3333
3333
3
3
33
4444
4444
4444
4444
4444
444
4
4444
4444
4444
5
55
5
5555
5
5
5
5
55
5
5
55
55
5555
55
55 5
5
5555555 5
55
PC1
PC2 Scores
-0.020
-0.015
-0.010
-0.005
0
0.005
0.010
0.015
-0.03 -0.02 -0.01 0 0.01 0.02 ves45000 emsc a…, X-expl: 74%,22%
3 333
333333 33
3
333
33
33
333
3
3 33
3
3333
333333
33
444 4444
4444
4444
444
555
5 5
55
55
5
55
55
5
55
55
5
55
55
5
5 5
5
5
555
5
5
5
55 5 5
5
PC1
PC2 Scores
ves4500 emsc al…, X-expl: 58%,26%,9%
Scores
-0.010
-0.005
0
0.005
0.010
-0.025-0.020
-0.015-0.010
-0.0050
0.0050.010
0.0150.020
-0.020-0.015
-0.010-0.005
0
0.005
0.010
0.015
0.020
XY
11 111 111
11
11
11
11111 1
111 1
11111 1 11 11
11
1 11111
11
11
11
2 22
2222
22222222
22222222
22222222
2222
2 222
33
333
3
3
3
3 3
3
3
3
33
3
333
3
33
3
3
33
3
33
33
33
333
33
ves450 emsc all…, X-expl: 68%,24%,4%
Scores
-0.010
-0.005
0
0.005
0.010
-0.04
-0.03
-0.02
-0.01
0
0.01
0.02 -0.020-0.015
-0.010-0.005
00.005
0.0100.015
0.020
X-Y
1111
1 111
1111
1111
1 1 11
11111111
1111
1111
1 111
11 11
11 112222
2222
2222
22222222
2222
22222222
33
33
333
33 3
333
33
33333
333
3
3333
3 333
333
3
3.4 Classification of different batches of the same vaccine product at different
concentrations
One single model, which can predict different batch samples for all products, is not possible
because the variables of concentration and species are more distinguishable in the data set.
Therefore, the model for classifying different batches has to be built on specific products and
specific concentrations. In the following section, PCA and SIMCA models are constructed for each
product at each concentration except der vaccine since it only contains one batch samples.
Fig. 7.4 The score plots of three batches of vespula vaccines. (A) 450,000 SQ; (B) 45,000 SQ: 3—0000031223-7; 4—0000040986-16; 5—0000052716-20 (C) 4,500 SQ; (D) 450 SQ: 1—0000031223-7; 2—0000040986-16; 3—0000052716-20
Classification of different batches for vespula vaccines
A PCA model was constructed for the vespula vaccine at concentration of 450,000 SQ using EMSC
data after one outlier had been removed. The whole wavelength region was applied in this case,
(A) (B)
(C) (D)
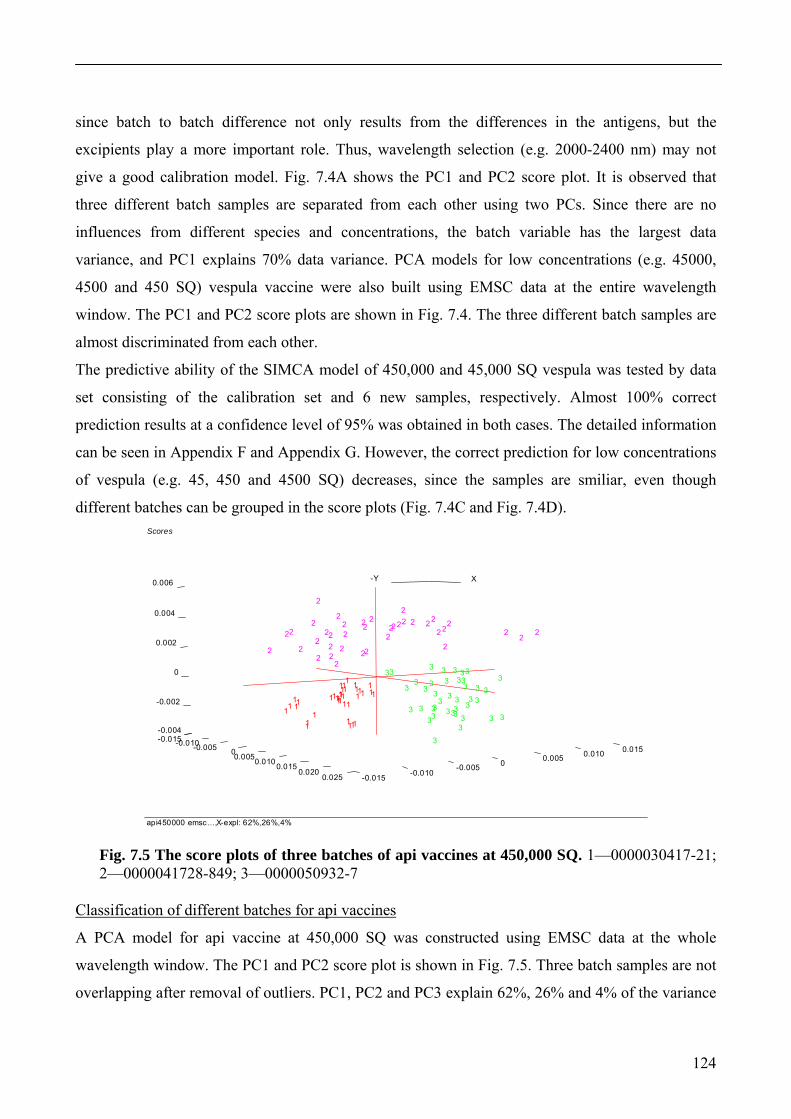
124
since batch to batch difference not only results from the differences in the antigens, but the
excipients play a more important role. Thus, wavelength selection (e.g. 2000-2400 nm) may not
give a good calibration model. Fig. 7.4A shows the PC1 and PC2 score plot. It is observed that
three different batch samples are separated from each other using two PCs. Since there are no
influences from different species and concentrations, the batch variable has the largest data
variance, and PC1 explains 70% data variance. PCA models for low concentrations (e.g. 45000,
4500 and 450 SQ) vespula vaccine were also built using EMSC data at the entire wavelength
window. The PC1 and PC2 score plots are shown in Fig. 7.4. The three different batch samples are
almost discriminated from each other.
The predictive ability of the SIMCA model of 450,000 and 45,000 SQ vespula was tested by data
set consisting of the calibration set and 6 new samples, respectively. Almost 100% correct
prediction results at a confidence level of 95% was obtained in both cases. The detailed information
can be seen in Appendix F and Appendix G. However, the correct prediction for low concentrations
of vespula (e.g. 45, 450 and 4500 SQ) decreases, since the samples are smiliar, even though
different batches can be grouped in the score plots (Fig. 7.4C and Fig. 7.4D).
api450000 emsc…, X-expl: 62%,26%,4%
Scores
-0.004
-0.002
0
0.002
0.004
0.006
-0.015-0.010-0.005 00.0050.0100.0150.020
0.025 -0.015 -0.010-0.005 0 0.005 0.010 0.015
X-Y
1111
111 1
111 1
1 111
111
11111
1111 1
1111
111
222
2
222 22
222 2
2222
22
2
22
2 2
22
22 2
2
2
2 22
222
2
33
33
33 33
33
333
3
33
33
3
3
3
33
3
33
3
333
3
33
3 3 3
3
3
3
3
Fig. 7.5 The score plots of three batches of api vaccines at 450,000 SQ. 1—0000030417-21; 2—0000041728-849; 3—0000050932-7
Classification of different batches for api vaccines
A PCA model for api vaccine at 450,000 SQ was constructed using EMSC data at the whole
wavelength window. The PC1 and PC2 score plot is shown in Fig. 7.5. Three batch samples are not
overlapping after removal of outliers. PC1, PC2 and PC3 explain 62%, 26% and 4% of the variance
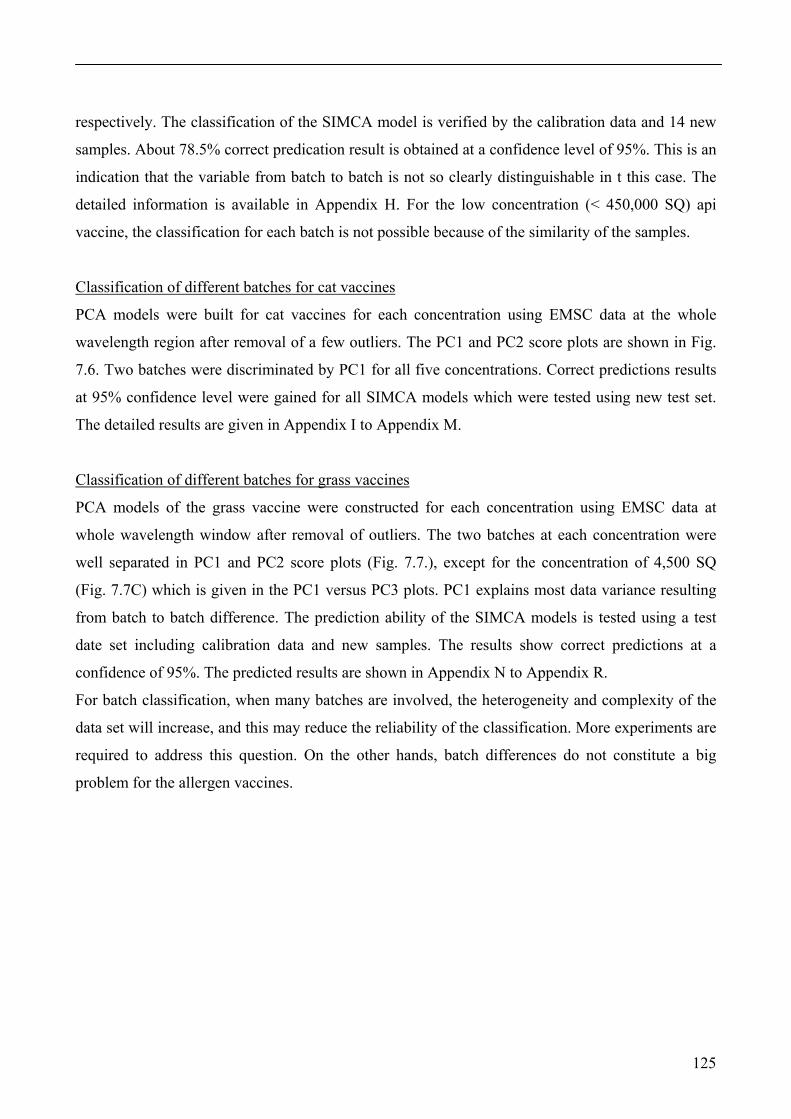
125
respectively. The classification of the SIMCA model is verified by the calibration data and 14 new
samples. About 78.5% correct predication result is obtained at a confidence level of 95%. This is an
indication that the variable from batch to batch is not so clearly distinguishable in t this case. The
detailed information is available in Appendix H. For the low concentration (< 450,000 SQ) api
vaccine, the classification for each batch is not possible because of the similarity of the samples.
Classification of different batches for cat vaccines
PCA models were built for cat vaccines for each concentration using EMSC data at the whole
wavelength region after removal of a few outliers. The PC1 and PC2 score plots are shown in Fig.
7.6. Two batches were discriminated by PC1 for all five concentrations. Correct predictions results
at 95% confidence level were gained for all SIMCA models which were tested using new test set.
The detailed results are given in Appendix I to Appendix M.
Classification of different batches for grass vaccines
PCA models of the grass vaccine were constructed for each concentration using EMSC data at
whole wavelength window after removal of outliers. The two batches at each concentration were
well separated in PC1 and PC2 score plots (Fig. 7.7.), except for the concentration of 4,500 SQ
(Fig. 7.7C) which is given in the PC1 versus PC3 plots. PC1 explains most data variance resulting
from batch to batch difference. The prediction ability of the SIMCA models is tested using a test
date set including calibration data and new samples. The results show correct predictions at a
confidence of 95%. The predicted results are shown in Appendix N to Appendix R.
For batch classification, when many batches are involved, the heterogeneity and complexity of the
data set will increase, and this may reduce the reliability of the classification. More experiments are
required to address this question. On the other hands, batch differences do not constitute a big
problem for the allergen vaccines.
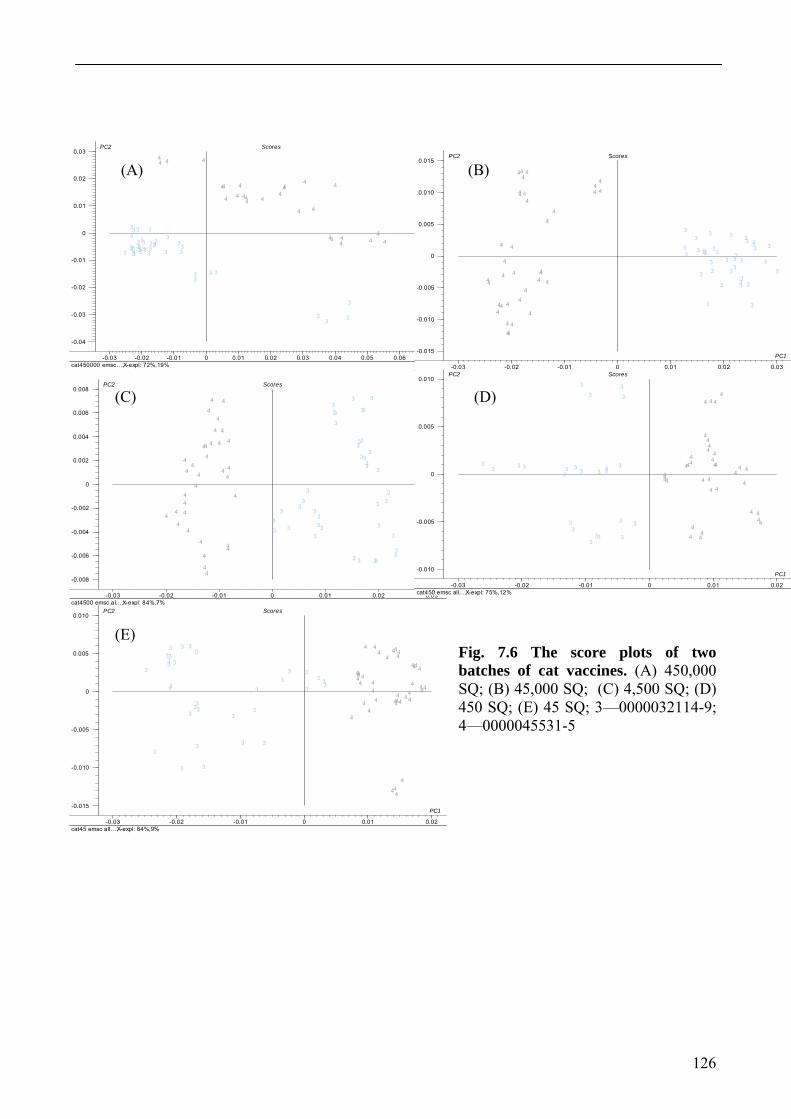
126
-0.04
-0.03
-0.02
-0.01
0
0.01
0.02
0.03
-0.03 -0.02 -0.01 0 0.01 0.02 0.03 0.04 0.05 0.06 0.07 cat450000 emsc…, X-expl: 72%,19%
3333
3
33
3
3
3
3 3
3333
333 3
333
3
3 3333
33
3
33
33
33 3
3
4
4
4 44
444
4 444
44
4 44444
4
4 44
4444
PC1
PC2 Scores
-0.015
-0.010
-0.005
0
0.005
0.010
0.015
-0.03 -0.02 -0.01 0 0.01 0.02 0.03 cat45000 emsc a…, X-expl: 86%,9%
3
3 3
3
3
33 3 33
3
33
3
3
3
3 333
3
3
3
33 3
3
3
33 3
3
33
3
3
444
4
4
44
4
4
4 4
44
4
4
44
44
4
44
4
4
4
4
4
4
4
4
4
44
4
4
4
PC1
PC2 Scores
-0.008
-0.006
-0.004
-0.002
0
0.002
0.004
0.006
0.008
-0.03 -0.02 -0.01 0 0.01 0.02 0.03 cat4500 emsc al…, X-expl: 84%,7%
33
33
333
3
3
3 33
3 3
33
3
3
3
3
33
3
3
3
3
3
3
3
33
3
3
3
33
3 33 3
44
4
4444
4
44
4
44
4
4
4
4 4
4
4
4 4
44
4
4
4
44
4
4
4
44
PC1
PC2 Scores
-0.010
-0.005
0
0.005
0.010
-0.03 -0.02 -0.01 0 0.01 0.02 cat450 emsc all…, X-expl: 75%,12%
33 33 33 3333
3 3
3
33
3
33
33
3
3
3
3
44 44
4
444
44
4 4
4
444
4
444
4444
44
44
4
4
4 4
4444
PC1
PC2 Scores
-0.015
-0.010
-0.005
0
0.005
0.010
-0.03 -0.02 -0.01 0 0.01 0.02 cat45 emsc all…, X-expl: 84%,9%
3
333
3
33
3
3
33
3
3
3
3
3
33 33
33
33
3
3
3
3
333
3
44
44
444
4
4
444
44
4
4
4444
4
4444
444
4
4
44
444 4
44
44
PC1
PC2 Scores
Fig. 7.6 The score plots of two batches of cat vaccines. (A) 450,000 SQ; (B) 45,000 SQ; (C) 4,500 SQ; (D) 450 SQ; (E) 45 SQ; 3—0000032114-9; 4—0000045531-5
(A) (B)
(C) (D)
(E)
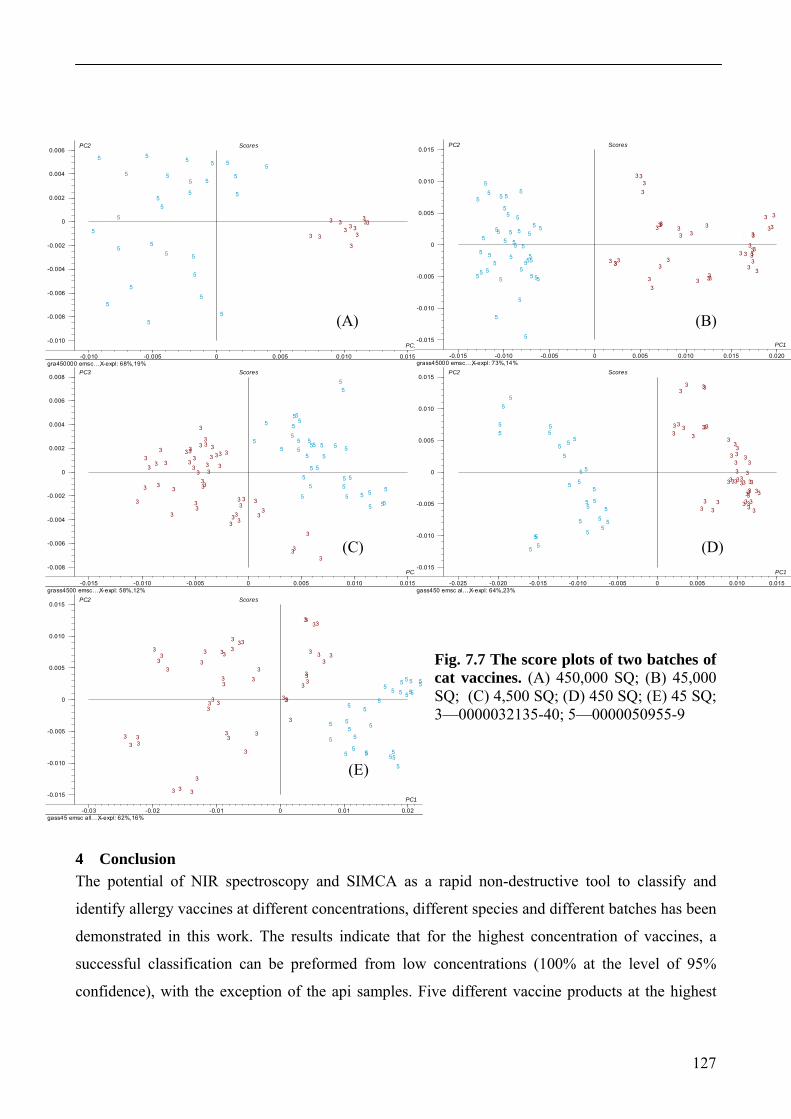
127
-0.010
-0.008
-0.006
-0.004
-0.002
0
0.002
0.004
0.006
-0.010 -0.005 0 0.005 0.010 0.015 gra450000 emsc…, X-expl: 68%,19%
33 3
33
33 3
33
3
35
5
55
5
5
5
5
5
55
5
55
55
5
5
5
5
5
55
5 5 55
PC1
PC2 Scores
-0.015
-0.010
-0.005
0
0.005
0.010
0.015
-0.015 -0.010 -0.005 0 0.005 0.010 0.015 0.020 grass45000 emsc…, X-expl: 73%,14%
3
33
3
3
33
3
333
3
3333 3 3
3 3
33333
3
33
3333
3
3 3
3
3 333
5
55
5
5
5
5
5
5
55
5
5
55
5
5
5
5
5
5
5
5
5
5
5
5
5
5
5
5
5
5
5
5
5
5
5
5
5PC1
PC2 Scores
-0.008
-0.006
-0.004
-0.002
0
0.002
0.004
0.006
0.008
-0.015 -0.010 -0.005 0 0.005 0.010 0.015 grass4500 emsc…, X-expl: 58%,12%
333
3
3
3
3
3
3333
33
3
3
3
3
3
3
3
3
3
3
333
3
3
333
33
33
33
33
33
3
3
33
33
5
5
5
5
5
55 5
5
5
5
5
5
5
5 5
5
55
5
5
55
55
5
5
5
55
5
5
5
5
5
PC1
PC3 Scores
-0.015
-0.010
-0.005
0
0.005
0.010
0.015
-0.025 -0.020 -0.015 -0.010 -0.005 0 0.005 0.010 0.015 gass450 emsc al…, X-expl: 64%,23%
3333
33 33
3 333
3 333
3333
3333
333 3 3
333
3333
33
33
3333
3
33
3
5
55
5
5
5
55
55
5 5
5
5
5
5
555
5
55
55
55
55
PC1
PC2 Scores
-0.015
-0.010
-0.005
0
0.005
0.010
0.015
-0.03 -0.02 -0.01 0 0.01 0.02 gass45 emsc all…, X-expl: 62%,16%
3
333
3333
33
33
3
333
3
3
33
3333
333 3
3333
3
333
33
33
3
333
333 3
555
5
55
55
5
5
5
5
55
5
5
5
555
5555
5
5
5
5
PC1
PC2 Scores
Fig. 7.7 The score plots of two batches of cat vaccines. (A) 450,000 SQ; (B) 45,000 SQ; (C) 4,500 SQ; (D) 450 SQ; (E) 45 SQ; 3—0000032135-40; 5—0000050955-9
4 Conclusion The potential of NIR spectroscopy and SIMCA as a rapid non-destructive tool to classify and
identify allergy vaccines at different concentrations, different species and different batches has been
demonstrated in this work. The results indicate that for the highest concentration of vaccines, a
successful classification can be preformed from low concentrations (100% at the level of 95%
confidence), with the exception of the api samples. Five different vaccine products at the highest
(C) (D)
(E)
(B) (A)

128
concentration were discriminated from each other by a SIMCA model. The classification of
different batches is possible when products at high concentrations are analyzed. However, more
experiments are required for the low concentration samples and for analysis including many
batches. The results indicate that NIR spectroscopy can be applied as a rapid and non-destructive
tool to classify and identify allergy vaccines. If implemented this technique will increases the
efficiency and decreases the costs of the quality control procedures in the allergy vaccine
manufacturing industry.
129
Reference
1. Blanco M, Eustaquio A, González JM, Serrano D. Identification and quantitation assays for
intact tablets of two related pharmaceutical preparations by reflectance near-infrared
spectroscopy: validation of the procedure. Journal of Pharmaceutical and Biomedical
Analysis, 2000; 22: 139-148.
2. Sanchez MS, Bertran E, Sarabia LA, Ortiz MC, Blanco M, Coello J. Quality control
decisions with near infrared data. Chemometrics and Intelligent Laboratory Systems, 2002;
53: 69-80.
3. Herkert T, Prinz H, Kovar KA. One hundred percent online identity check of pharmaceutical
products by near-infrared spectroscopy on the packaging line. European Journal of
Pharmaceutics and Biopharmaceutics, 2001; 51: 9-16.
4. Cozzolino D, Chree A, Scaife JR, Murray I. Usefulness of Near-infrared reflectance (NIR)
spectroscopy and chemometrics to discriminate fishmeal batches made with different fish
species. Journal of Agriculture and Food Chemistry, 2005; 53: 4459-4463.
5. Reich G. Near-infrared spectroscopy and imaging: Basic principle and pharmaceutical
application. Advanced Drug Delivery Reviews, 2005: 1109-1143.
6. Mark H. Qualitative near-infrared analysis. In: Williams P, Norris K (Eds.). Near-infrared
technology in the agricultural and food industries. American Association of Cereal
Chemists, Inc. St. Paul, Minnesota, USA 2001, p233-238.
7. Siesler HW, Ozaki Y, Kawata S, Heise HM (Eds.). Near-infrared spectroscopy—principles,
instruments, applications. Wiley-VCH, Weinheim Germany 2002, p2.
8. Bran & Luebbe GmbH. Near infrared spectroscopy for pharmaceuticals validation.
Pharmaceutical Manufacturing Review, 1999, 11: 10-11.
9. Martens H, Nielsen JP, Engelsen SB. Light scattering and light absorbance separated by
extended multiplicative signal correction application to near-infrared transmission analysis
of powder mixtures. Analytical Chemistry, 2003; 75: 394-404.
130
Chapter VIII: Conclusions and perspectives
Vaccine has had greatest impact on the world’s health. It prevents disease and death for millions of
individual every year. For allergic diseases, SIT is the only treatment that may affect the course and
it also may prevent the development of asthma in patients with allergic rhinitis. A successful SIT is
dependent on the use of high quality allergen vaccines that are properly standardized and can be
manufactured consistently. Allergen vaccines are produced by adsorption antigens onto ACA to
accelerate and prolong the specific immune response towards the desired response. To well
understand antigens and vaccines and to produce high quality vaccines and manufacture
consistently, this study focuses on the structures of model antigens when they are adsorbed by
aluminium hydroxide and when they are subsequently released. In relation this, the mechanism of
ACA is also discussed. The stability of vaccines is investigated during storage and under different
temperatures. A fast, non-destructive method is introduced for determining the residual moisture
content and classification of lyophilized allergy vaccines as well.
In chapter I, the background and purposes of the thesis are presented. The brief introductions to
NIR, MIR and MVA which are the core technologies in this work are presented. Chapter II
reviews the protein structures and the current methods for protein structural analysis. The
advantages and disadvantages of the methods are presented in addition to whether they are suitable
for adsorbed protein analysis, e.g., protein adsorbed by aluminium hydroxide. The technology is
especially focused on FTIR-ATR spectroscopy.
The results summarized in chapter III suggest that FTIR-ATR spectroscopy provides direct
information on the secondary structural changes of the model antigens when adsorbed to aluminium
hydroxide and subsequently release. It is shown that the secondary structures of protein antigens
change when adsorbed by aluminium hydroxide. The adsorption-induced protein structural changes
depend on how much protein is adsorbed by aluminium hydroxide. Maximal adsorption (e.g.
achieving adsorption capacity) gives a more native-like structure than low protein adsorption.
However, Less protein adsorbed may result in a stronger immune response, since the protein
structure becomes more denatural and this modified structure is more easily presented to the
immune system. According to Jones et al., protein structure became destabilized upon adsorption by
aluminium adjuvant. The physical changes of adsorbed antigens made them more susceptible to
proteolytic processing by the immune system, resulting in an enhanced antigen presentation. This
may be the reason why different amounts of antigens adsorbed onto same amount aluminium
131
hydroxide show similar immune response. PBS is a good buffer to release adsorbed protein antigens
from aluminium adjuvant. The current experiments showed that recovery is approximate 80% after
40 min in PBS. The released antigens generally refold to their native state. However, released BSA
regains its native structure more completely than does BLG.
In chapter IV, the structural stability of aluminium-adsorbed model antigens is compared to the
antigens in solutions. This study has shown that the structure of an antigen can be stabilized by
adsorption onto aluminium hydroxide during exposure to high temperature and/or during storage. It
may be one of the reasons why adjuvant can enhance the immune response and/or exert its
activities. This phenomenon of structural stabilization is more obvious for BSA than BLG, which
may be ascribed to the low protein concentration of BLG. Another explanation is that it may be that
there is more free protein which is not adsorbed onto aluminium hydroxide in the BLG model
vaccines. The free protein antigens may facilitate the degradation of vaccine, but further
experiments are required to confirm this hypothesis.
The changes of model vaccines during the storage at normal vaccine storage temperature and an
elevated temperature are systematically monitored see chapter V. The data show that the pre-
adsorbed antigens are difficult to release from the adjuvant during the storage. It may indicate why
vaccine loses or decreases potency during storage. The protein adsorption and pH of vaccine also
change during storage, and these two parameters are protein specific. Model vaccines generally
undergo rapid modifications with the time upon storage at 37 ºC. Similar changes are seen upon
storage at 4 ºC, although at a slower rate. NIR spectroscopy is for the first time used to monitor the
aging of vaccine. The results suggest that it is possible to detect the changes of
adsorption/desorption of protein antigens, but it is difficult to determine the change of particle size
during vaccine storage, even though analyzing the particle size of aluminium adjuvants may be
practical. Both BSA and BLG model vaccines as well as aluminium hydroxide are profoundly
affected by rotation. Vigorous rotation increases the particle size of aluminium hydroxide and may
denature protein antigens. Thus, it should be minimised in vaccine productions.
A general ability of NIR spectroscopy combined with multivariate data analysis to predict RMC for
lyophilized vaccines is conducted in chapter VI. RMC results obtained from NIR spectroscopy
show good agreement with results from KF titration. The acceptable product-specific models and
multi-product models indicate that NIR spectroscopy can be used as a quantitative method to
determine RMC in lyophilized allergy vaccines. The models based on product-specific data are
slightly better than models based on multi-product data; however, a general multi-product model is
132
more useful, since one model can predict all samples in a pharmaceutical production of allergy
vaccines. However, the current models have to be revalidated by new unknown data in the future
study.
In chapter VII, NIR spectroscopy is applied to classify and identify allergen vaccines at different
concentrations, different species and different batches. The vaccines with highest concentration
antigens are successfully classified from low concentrations (100% at the level of 95% confidence)
without the api samples. Five different vaccine products at the highest concentration are
successfully discriminated from each other by a SIMCA model. The classification of different batch
is possible for products which are at high concentrations antigens. However, more experiments are
required in the future study for low concentration samples and for many batches involved. The
results indicate that NIR spectroscopy can be applied as a rapid and non-destructive tool to classify
and identify allergy vaccines. If implemented this technique will increases the efficiency and
decreases the costs of the quality control procedures in the allergy vaccine manufacturing industry.
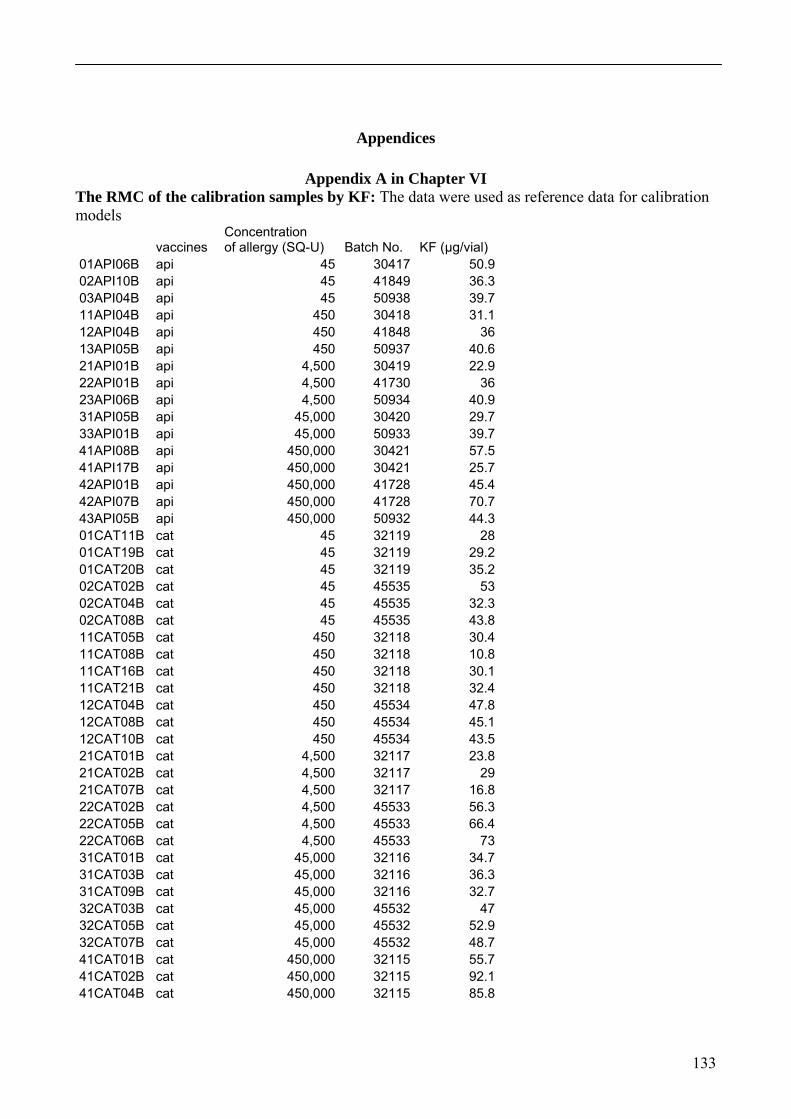
133
Appendices
Appendix A in Chapter VI The RMC of the calibration samples by KF: The data were used as reference data for calibration models
vaccines Concentration of allergy (SQ-U) Batch No. KF (μg/vial)
01API06B api 45 30417 50.902API10B api 45 41849 36.303API04B api 45 50938 39.711API04B api 450 30418 31.112API04B api 450 41848 3613API05B api 450 50937 40.621API01B api 4,500 30419 22.922API01B api 4,500 41730 3623API06B api 4,500 50934 40.931API05B api 45,000 30420 29.733API01B api 45,000 50933 39.741API08B api 450,000 30421 57.541API17B api 450,000 30421 25.742API01B api 450,000 41728 45.442API07B api 450,000 41728 70.743API05B api 450,000 50932 44.301CAT11B cat 45 32119 2801CAT19B cat 45 32119 29.201CAT20B cat 45 32119 35.202CAT02B cat 45 45535 5302CAT04B cat 45 45535 32.302CAT08B cat 45 45535 43.811CAT05B cat 450 32118 30.411CAT08B cat 450 32118 10.811CAT16B cat 450 32118 30.111CAT21B cat 450 32118 32.412CAT04B cat 450 45534 47.812CAT08B cat 450 45534 45.112CAT10B cat 450 45534 43.521CAT01B cat 4,500 32117 23.821CAT02B cat 4,500 32117 2921CAT07B cat 4,500 32117 16.822CAT02B cat 4,500 45533 56.322CAT05B cat 4,500 45533 66.422CAT06B cat 4,500 45533 7331CAT01B cat 45,000 32116 34.731CAT03B cat 45,000 32116 36.331CAT09B cat 45,000 32116 32.732CAT03B cat 45,000 45532 4732CAT05B cat 45,000 45532 52.932CAT07B cat 45,000 45532 48.741CAT01B cat 450,000 32115 55.741CAT02B cat 450,000 32115 92.141CAT04B cat 450,000 32115 85.8
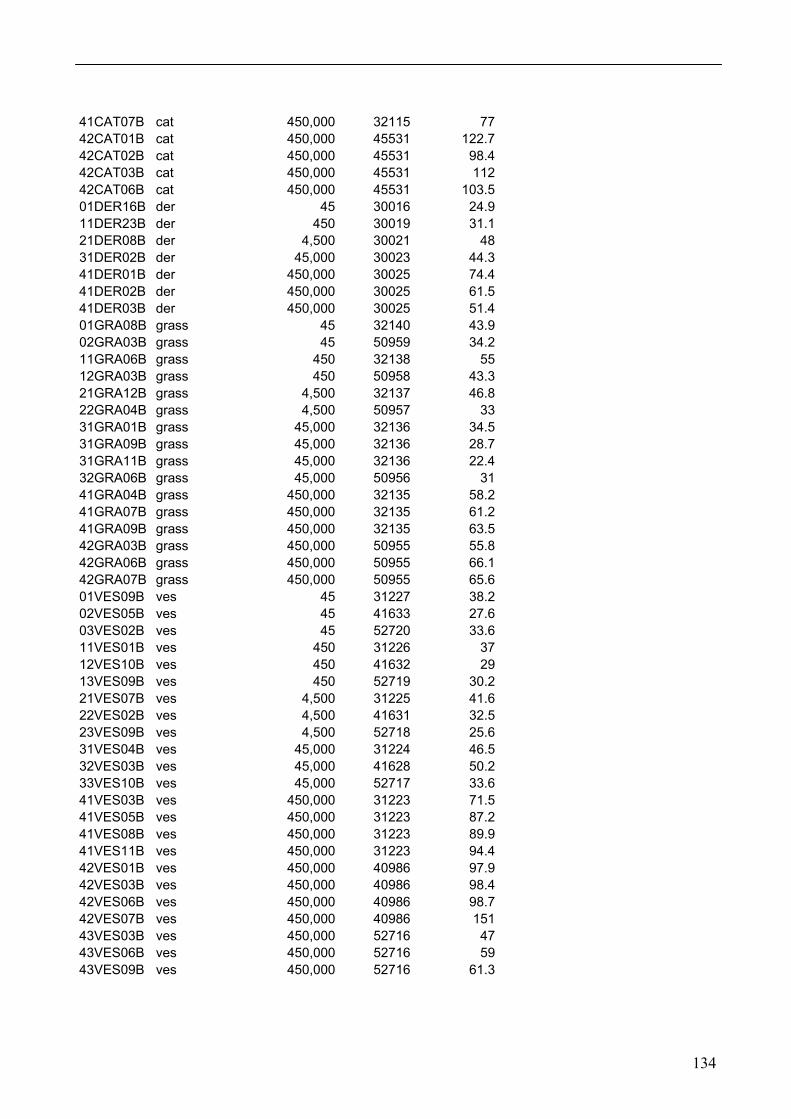
134
41CAT07B cat 450,000 32115 7742CAT01B cat 450,000 45531 122.742CAT02B cat 450,000 45531 98.442CAT03B cat 450,000 45531 11242CAT06B cat 450,000 45531 103.501DER16B der 45 30016 24.911DER23B der 450 30019 31.121DER08B der 4,500 30021 4831DER02B der 45,000 30023 44.341DER01B der 450,000 30025 74.441DER02B der 450,000 30025 61.541DER03B der 450,000 30025 51.401GRA08B grass 45 32140 43.902GRA03B grass 45 50959 34.211GRA06B grass 450 32138 5512GRA03B grass 450 50958 43.321GRA12B grass 4,500 32137 46.822GRA04B grass 4,500 50957 3331GRA01B grass 45,000 32136 34.531GRA09B grass 45,000 32136 28.731GRA11B grass 45,000 32136 22.432GRA06B grass 45,000 50956 3141GRA04B grass 450,000 32135 58.241GRA07B grass 450,000 32135 61.241GRA09B grass 450,000 32135 63.542GRA03B grass 450,000 50955 55.842GRA06B grass 450,000 50955 66.142GRA07B grass 450,000 50955 65.601VES09B ves 45 31227 38.202VES05B ves 45 41633 27.603VES02B ves 45 52720 33.611VES01B ves 450 31226 3712VES10B ves 450 41632 2913VES09B ves 450 52719 30.221VES07B ves 4,500 31225 41.622VES02B ves 4,500 41631 32.523VES09B ves 4,500 52718 25.631VES04B ves 45,000 31224 46.532VES03B ves 45,000 41628 50.233VES10B ves 45,000 52717 33.641VES03B ves 450,000 31223 71.541VES05B ves 450,000 31223 87.241VES08B ves 450,000 31223 89.941VES11B ves 450,000 31223 94.442VES01B ves 450,000 40986 97.942VES03B ves 450,000 40986 98.442VES06B ves 450,000 40986 98.742VES07B ves 450,000 40986 15143VES03B ves 450,000 52716 4743VES06B ves 450,000 52716 5943VES09B ves 450,000 52716 61.3
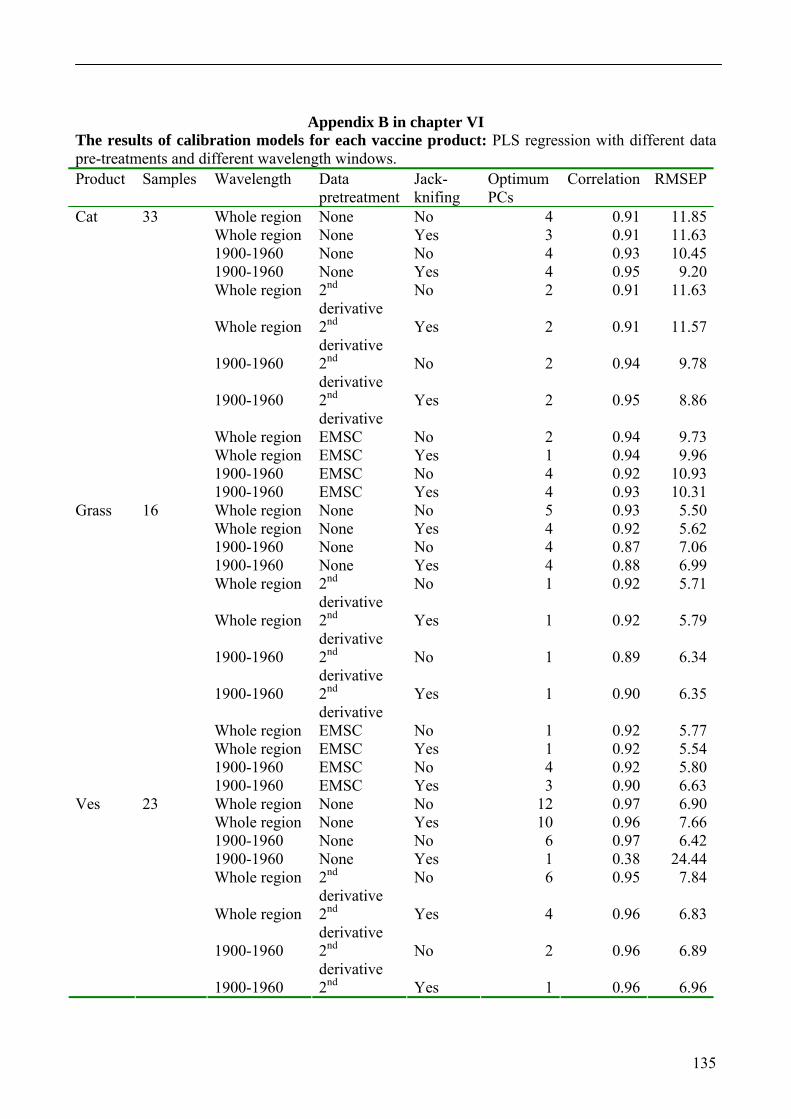
135
Appendix B in chapter VI The results of calibration models for each vaccine product: PLS regression with different data pre-treatments and different wavelength windows. Product Samples Wavelength Data
pretreatment Jack-knifing
Optimum PCs
Correlation RMSEP
Whole region None No 4 0.91 11.85Whole region None Yes 3 0.91 11.631900-1960 None No 4 0.93 10.451900-1960 None Yes 4 0.95 9.20Whole region 2nd
derivative No 2 0.91 11.63
Whole region 2nd derivative
Yes 2 0.91 11.57
1900-1960 2nd derivative
No 2 0.94 9.78
1900-1960 2nd derivative
Yes 2 0.95 8.86
Whole region EMSC No 2 0.94 9.73Whole region EMSC Yes 1 0.94 9.961900-1960 EMSC No 4 0.92 10.93
Cat 33
1900-1960 EMSC Yes 4 0.93 10.31Whole region None No 5 0.93 5.50Whole region None Yes 4 0.92 5.621900-1960 None No 4 0.87 7.061900-1960 None Yes 4 0.88 6.99Whole region 2nd
derivative No 1 0.92 5.71
Whole region 2nd derivative
Yes 1 0.92 5.79
1900-1960 2nd derivative
No 1 0.89 6.34
1900-1960 2nd derivative
Yes 1 0.90 6.35
Whole region EMSC No 1 0.92 5.77Whole region EMSC Yes 1 0.92 5.541900-1960 EMSC No 4 0.92 5.80
Grass 16
1900-1960 EMSC Yes 3 0.90 6.63Whole region None No 12 0.97 6.90Whole region None Yes 10 0.96 7.661900-1960 None No 6 0.97 6.421900-1960 None Yes 1 0.38 24.44Whole region 2nd
derivative No 6 0.95 7.84
Whole region 2nd derivative
Yes 4 0.96 6.83
1900-1960 2nd derivative
No 2 0.96 6.89
Ves 23
1900-1960 2nd Yes 1 0.96 6.96

136
derivative Whole region EMSC No 5 0.94 8.82Whole region EMSC Yes 3 0.94 9.231900-1960 EMSC No 3 0.97 6.67
1900-1960 EMSC Yes 2 0.97 6.66
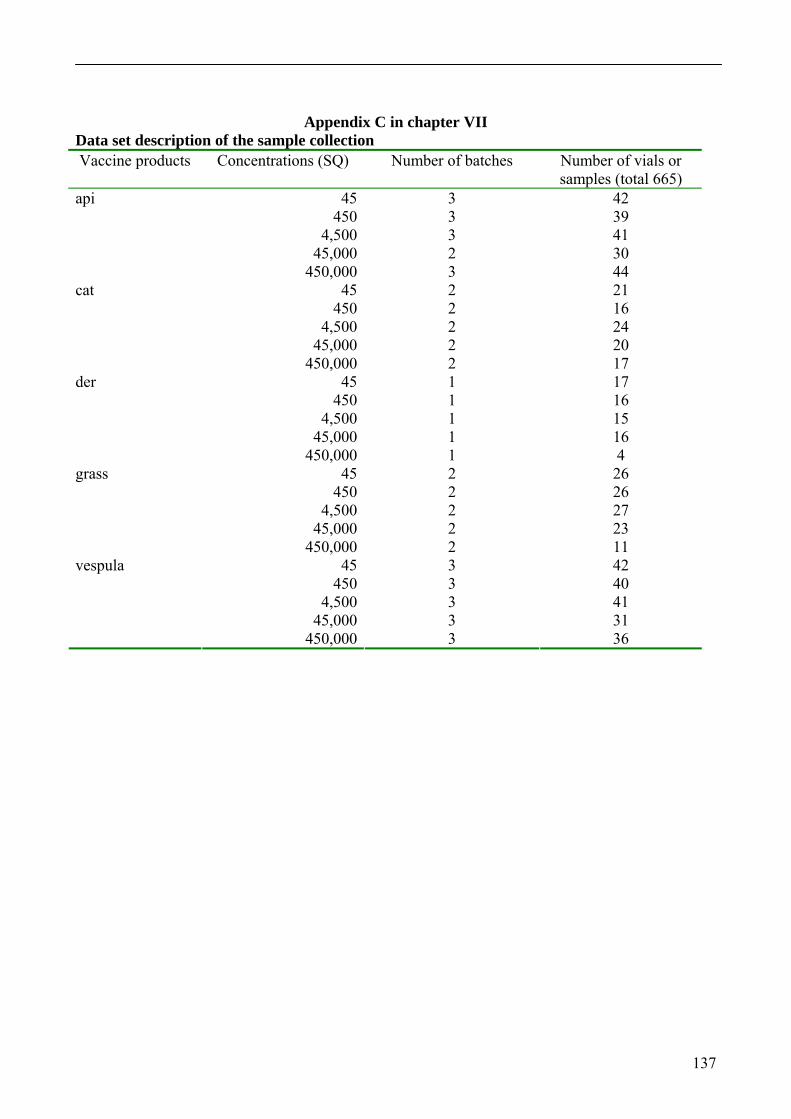
137
Appendix C in chapter VII Data set description of the sample collection Vaccine products Concentrations (SQ) Number of batches Number of vials or
samples (total 665) 45 3 42
450 3 39 4,500 3 41
45,000 2 30
api
450,000 3 44 45 2 21
450 2 16 4,500 2 24
45,000 2 20
cat
450,000 2 17 45 1 17
450 1 16 4,500 1 15
45,000 1 16
der
450,000 1 4 45 2 26
450 2 26 4,500 2 27
45,000 2 23
grass
450,000 2 11 45 3 42
450 3 40 4,500 3 41
45,000 3 31
vespula
450,000 3 36
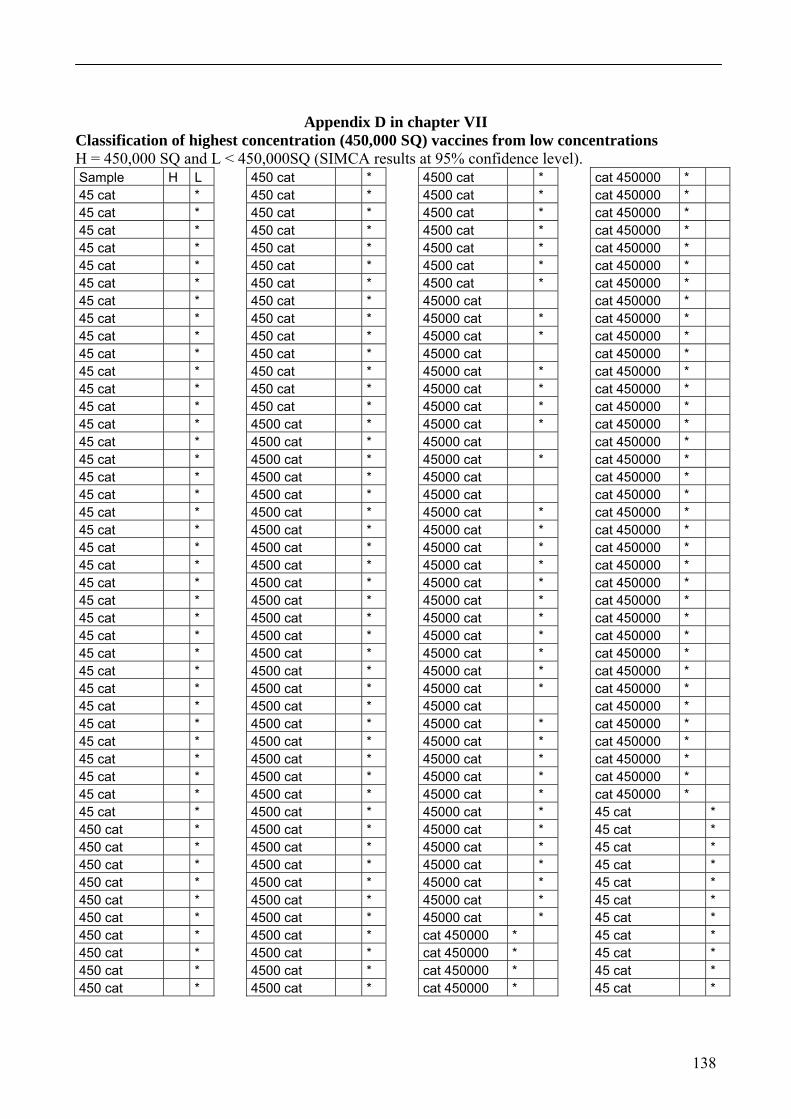
138
Appendix D in chapter VII Classification of highest concentration (450,000 SQ) vaccines from low concentrations H = 450,000 SQ and L < 450,000SQ (SIMCA results at 95% confidence level). Sample H L 45 cat * 45 cat * 45 cat * 45 cat * 45 cat * 45 cat * 45 cat * 45 cat * 45 cat * 45 cat * 45 cat * 45 cat * 45 cat * 45 cat * 45 cat * 45 cat * 45 cat * 45 cat * 45 cat * 45 cat * 45 cat * 45 cat * 45 cat * 45 cat * 45 cat * 45 cat * 45 cat * 45 cat * 45 cat * 45 cat * 45 cat * 45 cat * 45 cat * 45 cat * 45 cat * 45 cat * 450 cat * 450 cat * 450 cat * 450 cat * 450 cat * 450 cat * 450 cat * 450 cat * 450 cat * 450 cat *
450 cat * 450 cat * 450 cat * 450 cat * 450 cat * 450 cat * 450 cat * 450 cat * 450 cat * 450 cat * 450 cat * 450 cat * 450 cat * 450 cat * 4500 cat * 4500 cat * 4500 cat * 4500 cat * 4500 cat * 4500 cat * 4500 cat * 4500 cat * 4500 cat * 4500 cat * 4500 cat * 4500 cat * 4500 cat * 4500 cat * 4500 cat * 4500 cat * 4500 cat * 4500 cat * 4500 cat * 4500 cat * 4500 cat * 4500 cat * 4500 cat * 4500 cat * 4500 cat * 4500 cat * 4500 cat * 4500 cat * 4500 cat * 4500 cat * 4500 cat * 4500 cat * 4500 cat *
4500 cat * 4500 cat * 4500 cat * 4500 cat * 4500 cat * 4500 cat * 4500 cat * 45000 cat 45000 cat * 45000 cat * 45000 cat 45000 cat * 45000 cat * 45000 cat * 45000 cat * 45000 cat 45000 cat * 45000 cat 45000 cat 45000 cat * 45000 cat * 45000 cat * 45000 cat * 45000 cat * 45000 cat * 45000 cat * 45000 cat * 45000 cat * 45000 cat * 45000 cat * 45000 cat 45000 cat * 45000 cat * 45000 cat * 45000 cat * 45000 cat * 45000 cat * 45000 cat * 45000 cat * 45000 cat * 45000 cat * 45000 cat * 45000 cat * cat 450000 * cat 450000 * cat 450000 * cat 450000 *
cat 450000 * cat 450000 * cat 450000 * cat 450000 * cat 450000 * cat 450000 * cat 450000 * cat 450000 * cat 450000 * cat 450000 * cat 450000 * cat 450000 * cat 450000 * cat 450000 * cat 450000 * cat 450000 * cat 450000 * cat 450000 * cat 450000 * cat 450000 * cat 450000 * cat 450000 * cat 450000 * cat 450000 * cat 450000 * cat 450000 * cat 450000 * cat 450000 * cat 450000 * cat 450000 * cat 450000 * cat 450000 * cat 450000 * cat 450000 * cat 450000 * cat 450000 * 45 cat * 45 cat * 45 cat * 45 cat * 45 cat * 45 cat * 45 cat * 45 cat * 45 cat * 45 cat * 45 cat *
139
45 cat * 45 cat * 45 cat * 45 cat * 45 cat * 45 cat * 45 cat * 45 cat * 45 cat * 45 cat * 45 cat * 45 cat * 45 cat * 45 cat * 45 cat * 45 cat * 45 cat * 45 cat * 45 cat * 45 cat * 45 cat * 45 cat * 45 cat * 45 cat * 45 cat * 45 cat * 45 cat * 45 cat * 45 cat * 450 cat * 450 cat * 450 cat * 450 cat * 450 cat * 450 cat * 450 cat * 450 cat * 450 cat * 450 cat * 450 cat * 450 cat * 450 cat * 450 cat * 450 cat * 450 cat * 450 cat * 450 cat * 450 cat * 450 cat * 450 cat *
450 cat * 450 cat * 450 cat * 450 cat * 450 cat * 450 cat * 450 cat * 450 cat * 450 cat * 450 cat * 450 cat * 450 cat * 450 cat * 450 cat * 450 cat * 4500 cat * 4500 cat * 4500 cat * 4500 cat * 4500 cat * 4500 cat * 4500 cat * 4500 cat * 4500 cat * 4500 cat * 4500 cat * 4500 cat * 4500 cat * 4500 cat * 4500 cat * 4500 cat * 4500 cat * 4500 cat * 4500 cat * 4500 cat * 4500 cat * 4500 cat * 4500 cat * 4500 cat * 4500 cat * 4500 cat * 4500 cat * 4500 cat * 4500 cat * 4500 cat * 4500 cat * 4500 cat * 4500 cat * 4500 cat * 4500 cat *
4500 cat * 4500 cat * 4500 cat * 4500 cat * 4500 cat * 45000 cat * 45000 cat * 45000 cat * 45000 cat * 45000 cat * 45000 cat * 45000 cat * 45000 cat * 45000 cat * 45000 cat * 45000 cat * 45000 cat * 45000 cat * 45000 cat * 45000 cat * 45000 cat * 45000 cat * 45000 cat * 45000 cat * 45000 cat * 45000 cat * 45000 cat * 45000 cat * 45000 cat * 45000 cat * 45000 cat * 45000 cat * 45000 cat * 45000 cat * 45000 cat * 45000 cat * 45000 cat * 45000 cat * 45000 cat * 45000 cat * 45000 cat * 45000 cat * 45000 cat * 45000 cat 45000 cat * cat 450000 * cat 450000 * cat 450000 * cat 450000 * cat 450000 *
cat 450000 * cat 450000 * cat 450000 * cat 450000 * cat 450000 * cat 450000 * cat 450000 * cat 450000 * cat 450000 * cat 450000 * cat 450000 * cat 450000 * cat 450000 * cat 450000 * cat 450000 * cat 450000 * cat 450000 * cat 450000 * cat 450000 * cat 450000 * cat 450000 * cat 450000 * cat 450000 * 45 der * 45 der * 45 der * 45 der * 45 der * 45 der * 45 der * 45 der * 45 der * 45 der * 45 der * 45 der * 45 der 45 der * 45 der * 45 der * 45 der * 45 der * 45 der * 45 der * 45 der * 45 der * 45 der * 45 der * 45 der 45 der * 45 der *
140
45 der * 45 der * 45 der * 45 der * 45 der * 45 der * 45 der * 45 der * 45 der * 45 der * 45 der * 45 der * 45 der * 45 der * 45 der * 45 der 45 der * 45 der * 45 der * 45 der * 45 der * 450 der * 450 der * 450 der * 450 der * 450 der * 450 der * 450 der * 450 der * 450 der * 450 der * 450 der * 450 der * 450 der * 450 der * 450 der * 450 der * 450 der * 450 der * 450 der * 450 der * 450 der * 450 der * 450 der * 450 der * 450 der 450 der * 450 der * 450 der * 450 der *
450 der * 450 der * 450 der * 450 der * 450 der * 450 der * 450 der 450 der * 450 der * 450 der * 450 der * 450 der * 450 der * 450 der * 450 der * 450 der * 450 der * 450 der * 450 der * 4500 der * 4500 der * 4500 der * 4500 der * 4500 der * 4500 der * 4500 der * 4500 der * 4500 der * 4500 der * 4500 der * 4500 der * 4500 der * 4500 der * 4500 der * 4500 der * 4500 der * 4500 der * 4500 der * 4500 der * 4500 der * 4500 der * 4500 der * 4500 der * 4500 der * 4500 der * 4500 der * 4500 der * 4500 der * 4500 der * 4500 der *
4500 der * 4500 der * 4500 der * 4500 der * 4500 der * 4500 der * 4500 der * 4500 der * 4500 der * 4500 der * 4500 der * 4500 der * 4500 der * 4500 der * 4500 der * 4500 der * 4500 der * 45000 der * 45000 der * 45000 der * 45000 der * 45000 der * 45000 der * 45000 der * 45000 der * 45000 der * 45000 der * 45000 der * 45000 der * 45000 der * 45000 der * 45000 der * 45000 der * 45000 der * 45000 der * 45000 der * 45000 der * 45000 der * 45000 der * 45000 der * 45000 der * 45000 der * 45000 der * 45000 der * 45000 der * 45000 der * 45000 der * 45000 der * 45000 der * 45000 der *
45000 der * 45000 der * 45000 der * 45000 der * 45000 der * 45000 der * 45000 der * 45000 der * 45000 der * 45000 der * 45000 der * 45000 der * 45000 der * 45000 der * 45000 der * der 450000 * der 450000 * der 450000 * der 450000 * der 450000 * der 450000 * der 450000 * der 450000 * der 450000 der 450000 der 450000 der 450000 der 450000 * der 450000 * der 450000 * der 450000 * 45 grass * 45 grass * 45 grass * 45 grass * 45 grass * 45 grass * 45 grass * 45 grass * 45 grass * 45 grass * 45 grass * 45 grass * 45 grass * 45 grass * 45 grass * 45 grass * 45 grass * 45 grass * 45 grass *
141
45 grass * 45 grass * 45 grass * 45 grass * 45 grass * 45 grass * 45 grass * 45 grass * 45 grass * 45 grass * 45 grass * 45 grass * 45 grass * 45 grass * 45 grass * 45 grass * 45 grass * 45 grass * 45 grass * 45 grass * 45 grass * 45 grass * 45 grass * 45 grass * 45 grass * 45 grass * 45 grass * 45 grass * 45 grass * 450 grass * 450 grass * 450 grass * 450 grass * 450 grass * 450 grass * 450 grass * 450 grass * 450 grass * 450 grass * 450 grass * 450 grass * 450 grass * 450 grass * 450 grass * 450 grass * 450 grass * 450 grass * 450 grass * 450 grass * 450 grass *
450 grass * 450 grass * 450 grass * 450 grass * 450 grass * 450 grass * 450 grass * 450 grass * 450 grass * 450 grass * 450 grass * 450 grass * 450 grass * 450 grass * 450 grass * 450 grass * 450 grass * 450 grass * 450 grass * 450 grass * 450 grass * 450 grass * 450 grass * 450 grass * 450 grass * 450 grass * 450 grass * 4500 grass * 4500 grass * 4500 grass * 4500 grass * 4500 grass * 4500 grass * 4500 grass * 4500 grass * 4500 grass * 4500 grass * 4500 grass * 4500 grass * 4500 grass * 4500 grass * 4500 grass * 4500 grass * 4500 grass * 4500 grass * 4500 grass * 4500 grass * 4500 grass * 4500 grass * 4500 grass *
4500 grass * 4500 grass * 4500 grass * 4500 grass * 4500 grass * 4500 grass * 4500 grass * 4500 grass * 4500 grass * 4500 grass * 4500 grass * 4500 grass * 4500 grass * 4500 grass * 4500 grass * 4500 grass * 4500 grass * 4500 grass * 4500 grass * 4500 grass * 4500 grass * 4500 grass * 4500 grass * 4500 grass * 4500 grass * 45000 grass 45000 grass 45000 grass 45000 grass 45000 grass * 45000 grass * 45000 grass * 45000 grass * 45000 grass * 45000 grass * 45000 grass * 45000 grass 45000 grass * 45000 grass * 45000 grass * 45000 grass * 45000 grass * 45000 grass * 45000 grass * 45000 grass * 45000 grass * 45000 grass * 45000 grass * 45000 grass * 45000 grass
45000 grass 45000 grass 45000 grass 45000 grass * 45000 grass * 45000 grass * 45000 grass * 45000 grass 45000 grass 45000 grass 45000 grass 45000 grass * 45000 grass * 45000 grass * 45000 grass * grass 450000 * grass 450000 * grass 450000 * grass 450000 * grass 450000 * grass 450000 * grass 450000 * grass 450000 * grass 450000 * grass 450000 * grass 450000 * grass 450000 * grass 450000 * grass 450000 * grass 450000 * grass 450000 * 45 grass * 45 grass * 45 grass * 45 grass * 45 grass * 45 grass * 45 grass *

142
45 grass * 45 grass * 45 grass * 45 grass * 45 grass * 45 grass 45 grass 45 grass 45 grass 45 grass * 45 grass * 45 grass * 45 grass * 45 grass * 45 grass * 45 grass * 45 grass * 45 grass * 45 grass * 45 grass * 45 grass * 450 grass * 450 grass * 450 grass * 450 grass * 450 grass * 450 grass * 450 grass * 450 grass * 450 grass * 450 grass * 450 grass * 450 grass * 450 grass * 450 grass * 450 grass * 450 grass * 450 grass * 450 grass * 450 grass * 450 grass * 450 grass * 450 grass * 450 grass * 450 grass * 450 grass * 450 grass * 450 grass * 450 grass * 4500 grass *
4500 grass * 4500 grass * 4500 grass * 4500 grass * 4500 grass * 4500 grass * 4500 grass * 4500 grass * 4500 grass * 4500 grass * 4500 grass * 4500 grass * 4500 grass * 4500 grass * 4500 grass * 4500 grass * 4500 grass * 4500 grass * 4500 grass * 4500 grass * 4500 grass * 4500 grass * 4500 grass * 4500 grass * 4500 grass * 4500 grass * 4500 grass * 4500 grass * 4500 grass * 4500 grass * 4500 grass * 4500 grass * 4500 grass * 4500 grass * 4500 grass * 4500 grass * 4500 grass * 4500 grass * 4500 grass * 45000 grass * 45000 grass * 45000 grass * 45000 grass * 45000 grass * 45000 grass * 45000 grass * 45000 grass * 45000 grass * 45000 grass * 45000 grass *
45000 grass * 45000 grass * 45000 grass * 45000 grass * 45000 grass * 45000 grass * 45000 grass * 45000 grass * 45000 grass * 45000 grass * 45000 grass * 45000 grass * 45000 grass * 45000 grass * 45000 grass * 45000 grass * 45000 grass * 45000 grass * 45000 grass * 45000 grass * 45000 grass * 45000 grass * 45000 grass * 45000 grass * 45000 grass * 45000 grass * 45000 grass * 45000 grass * 45000 grass * grass 450000 * grass 450000 * grass 450000 * grass 450000 * grass 450000 * grass 450000 * grass 450000 * grass 450000 * grass 450000 * grass 450000 * grass 450000 * grass 450000 *
grass 450000 * grass 450000 * grass 450000 * grass 450000 * grass 450000 * grass 450000 * grass 450000 * grass 450000 * grass 450000 * grass 450000 * grass 450000 * grass 450000 * grass 450000 * grass 450000 * grass 450000 * grass 450000 * 45 ves * 45 ves * 45 ves * 45 ves * 45 ves * 45 ves * 45 ves * 45 ves * 45 ves * 45 ves * 45 ves * 45 ves * 45 ves * 45 ves * 45 ves * 45 ves * 45 ves * 45 ves * 45 ves * 45 ves * 45 ves * 45 ves *
143
45 ves * 45 ves * 45 ves * 45 ves * 45 ves * 45 ves * 45 ves * 45 ves * 45 ves * 45 ves * 45 ves * 45 ves * 45 ves * 45 ves * 45 ves * 45 ves * 45 ves * 45 ves * 45 ves * 45 ves * 45 ves * 45 ves * 45 ves 45 ves 45 ves 45 ves 450 ves * 450 ves * 450 ves * 450 ves * 450 ves * 450 ves * 450 ves * 450 ves * 450 ves * 450 ves * 450 ves * 450 ves * 450 ves * 450 ves * 450 ves * 450 ves * 450 ves * 450 ves * 450 ves * 450 ves * 450 ves * 450 ves * 450 ves * 450 ves *
450 ves * 450 ves * 450 ves * 450 ves * 450 ves * 450 ves * 450 ves * 450 ves * 450 ves * 450 ves * 450 ves * 450 ves * 450 ves * 450 ves * 450 ves * 450 ves * 450 ves * 450 ves * 450 ves * 450 ves * 450 ves * 450 ves * 450 ves * 450 ves * 4500 ves * 4500 ves * 4500 ves * 4500 ves * 4500 ves * 4500 ves * 4500 ves * 4500 ves * 4500 ves * 4500 ves * 4500 ves * 4500 ves * 4500 ves * 4500 ves * 4500 ves * 4500 ves * 4500 ves * 4500 ves * 4500 ves * 4500 ves * 4500 ves * 4500 ves * 4500 ves * 4500 ves * 4500 ves * 4500 ves *
4500 ves * 4500 ves * 4500 ves * 4500 ves * 4500 ves * 4500 ves * 4500 ves * 4500 ves * 4500 ves * 4500 ves * 4500 ves * 4500 ves * 4500 ves * 4500 ves * 4500 ves * 4500 ves * 4500 ves * 4500 ves * 4500 ves * 4500 ves * 4500 ves * 4500 ves * 45000 ves * 45000 ves * 45000 ves * 45000 ves * 45000 ves * 45000 ves * 45000 ves * 45000 ves * 45000 ves * 45000 ves * 45000 ves * 45000 ves * 45000 ves * 45000 ves * 45000 ves * 45000 ves * 45000 ves * 45000 ves * 45000 ves * 45000 ves * 45000 ves * 45000 ves * 45000 ves * 45000 ves * 45000 ves * 45000 ves * 45000 ves * 45000 ves *
45000 ves * 45000 ves * 45000 ves * 45000 ves * 45000 ves * 45000 ves * 45000 ves * 45000 ves * 45000 ves * 45000 ves * 45000 ves * 45000 ves * ves 450000 * ves 450000 * ves 450000 * ves 450000 * ves 450000 * ves 450000 * ves 450000 * ves 450000 * ves 450000 * ves 450000 * ves 450000 * ves 450000 * ves 450000 * ves 450000 * ves 450000 * ves 450000 * ves 450000 * ves 450000 * ves 450000 * ves 450000 * ves 450000 * ves 450000 * ves 450000 * ves 450000 * ves 450000 * ves 450000 * ves 450000 * ves 450000 * ves 450000 * ves 450000 * ves 450000 * ves 450000 * ves 450000 * ves 450000 * ves 450000 * ves 450000 * ves 450000 * ves 450000 *
144
ves 450000 * ves 450000 * 45 ves * 45 ves * 45 ves * 45 ves * 45 ves * 45 ves * 45 ves * 45 ves * 45 ves * 45 ves * 45 ves * 45 ves * 45 ves * 45 ves * 45 ves * 45 ves * 45 ves * 45 ves * 45 ves * 45 ves * 45 ves * 45 ves * 45 ves * 45 ves * 45 ves * 45 ves * 45 ves * 45 ves * 45 ves * 45 ves * 45 ves * 45 ves * 45 ves * 45 ves * 45 ves * 45 ves * 45 ves * 45 ves * 45 ves * 45 ves * 450 ves * 450 ves * 450 ves * 450 ves * 450 ves * 450 ves * 450 ves * 450 ves *
450 ves 450 ves 450 ves 450 ves 450 ves * 450 ves * 450 ves * 450 ves * 450 ves * 450 ves * 450 ves * 450 ves * 450 ves * 450 ves * 450 ves * 450 ves * 450 ves * 450 ves * 450 ves * 450 ves * 450 ves 450 ves * 450 ves 450 ves * 450 ves 450 ves 450 ves 450 ves 450 ves * 450 ves * 450 ves * 450 ves * 4500 ves * 4500 ves * 4500 ves * 4500 ves * 4500 ves * 4500 ves * 4500 ves * 4500 ves * 4500 ves * 4500 ves * 4500 ves * 4500 ves * 4500 ves * 4500 ves * 4500 ves * 4500 ves * 4500 ves * 4500 ves *
4500 ves * 4500 ves * 4500 ves * 4500 ves * 4500 ves * 4500 ves * 4500 ves * 4500 ves * 4500 ves * 4500 ves * 4500 ves * 4500 ves * 4500 ves * 4500 ves * 4500 ves * 4500 ves * 4500 ves * 4500 ves * 4500 ves * 4500 ves * 4500 ves * 4500 ves * 45000 ves * 45000 ves * 45000 ves * 45000 ves * 45000 ves * 45000 ves * 45000 ves * 45000 ves * 45000 ves * 45000 ves * 45000 ves * 45000 ves * 45000 ves * 45000 ves * 45000 ves * 45000 ves * 45000 ves * 45000 ves * 45000 ves * 45000 ves * ves 450000 ves 450000 ves 450000 * ves 450000 ves 450000 * ves 450000 * ves 450000 * ves 450000 *
ves 450000 * ves 450000 * ves 450000 * ves 450000 * ves 450000 * ves 450000 * ves 450000 * ves 450000 * ves 450000 * ves 450000 * ves 450000 * ves 450000 * ves 450000 * ves 450000 * ves 450000 * ves 450000 * ves 450000 * ves 450000 * ves 450000 * ves 450000 * ves 450000 * ves 450000 * ves 450000 * ves 450000 * ves 450000 * ves 450000 * ves 450000 * ves 450000 * ves 450000 * ves 450000 * ves 450000 * ves 450000 * 45 ves * 45 ves * 45 ves * 45 ves * 45 ves * 45 ves * 45 ves * 45 ves * 45 ves * 45 ves * 45 ves * 45 ves * 45 ves * 45 ves * 45 ves * 45 ves * 45 ves * 45 ves *
145
45 ves * 45 ves * 45 ves * 45 ves * 45 ves * 45 ves * 45 ves * 45 ves * 45 ves * 45 ves * 45 ves 45 ves * 45 ves 45 ves 45 ves * 45 ves * 45 ves * 45 ves * 45 ves * 45 ves * 45 ves * 45 ves * 450 ves * 450 ves * 450 ves * 450 ves * 450 ves * 450 ves * 450 ves * 450 ves * 450 ves * 450 ves * 450 ves * 450 ves * 450 ves * 450 ves * 450 ves * 450 ves * 450 ves * 450 ves * 450 ves * 450 ves * 450 ves * 450 ves * 450 ves * 450 ves * 450 ves * 450 ves * 450 ves * 450 ves *
450 ves * 450 ves * 450 ves * 450 ves * 450 ves * 450 ves * 450 ves * 450 ves * 450 ves * 450 ves * 450 ves * 450 ves * 4500 ves * 4500 ves * 4500 ves * 4500 ves * 4500 ves * 4500 ves * 4500 ves * 4500 ves * 4500 ves * 4500 ves * 4500 ves * 4500 ves * 4500 ves * 4500 ves * 4500 ves * 4500 ves * 4500 ves * 4500 ves * 4500 ves * 4500 ves * 4500 ves * 4500 ves * 4500 ves * 4500 ves * 4500 ves * 4500 ves * 4500 ves * 4500 ves * 4500 ves * 4500 ves * 4500 ves * 4500 ves * 4500 ves * 4500 ves * 4500 ves * 4500 ves * 4500 ves * 4500 ves *
4500 ves * 4500 ves * 45000 ves * 45000 ves * 45000 ves * 45000 ves * 45000 ves * 45000 ves * 45000 ves * 45000 ves * 45000 ves * 45000 ves * 45000 ves * 45000 ves * 45000 ves * 45000 ves * 45000 ves * 45000 ves * 45000 ves * 45000 ves * 45000 ves * 45000 ves * 45000 ves * 45000 ves * 45000 ves * 45000 ves * 45000 ves * 45000 ves * 45000 ves * 45000 ves * 45000 ves * 45000 ves * 45000 ves * 45000 ves * 45000 ves * 45000 ves * 45000 ves * 45000 ves * 45000 ves * 45000 ves * 45000 ves * 45000 ves * ves 450000 * ves 450000 * ves 450000 * ves 450000 * ves 450000 * ves 450000 * ves 450000 * ves 450000 *
ves 450000 * ves 450000 * ves 450000 * ves 450000 * ves 450000 * ves 450000 * ves 450000 * ves 450000 * ves 450000 * ves 450000 * ves 450000 * ves 450000 * ves 450000 * ves 450000 * ves 450000 * ves 450000 * ves 450000 * ves 450000 * ves 450000 * ves 450000 * ves 450000 * ves 450000 * ves 450000 * ves 450000 * ves 450000 * ves 450000 * ves 450000 * ves 450000 * ves 450000 * ves 450000 * ves 450000 * ves 450000 * 4500 cat * 4500 cat * 4500 cat * 4500 cat * 4500 cat * 4500 cat * 4500 cat * 4500 cat * 45 cat * 45 cat * 45 cat * 45 cat * 45 cat * 45 cat * 45 cat * 45 cat * 450 cat * 450 cat *

146
450 cat * 450 cat * 4500 cat * 4500 cat * 4500 cat * 4500 cat * 4500 cat * 4500 cat * 4500 cat * 4500 cat * 45000 cat * 45000 cat * 45000 cat * 45000 cat * 45 der * 45 der * 45 der * 45 der * 45 der * 45 der * 45 der * 45 der * 45 der * 45 der * 45 der * 45 der * 45 der * 45 der * 45 der * 45 der * 45 der * 45 der * 45 der * 45 der * 450 der * 450 der * 450 der * 450 der * 450 der 450 der * 450 der * 450 der * 450 der 450 der * 450 der * 450 der * 450 der * 450 der * 450 der * 450 der *
4500 der * 4500 der * 4500 der * 4500 der * 4500 der * 4500 der * 4500 der * 4500 der * 4500 der * 4500 der * 4500 der * 4500 der 45000 der * 45000 der * 45000 der * 45000 der * 45000 der * 45000 der * 45000 der 45000 der * 45000 der * 45000 der * 45000 der * 45000 der * 45000 der * 45000 der * 45000 der * 45000 der * 45 grass * 45 grass * 45 grass * 45 grass * 45 grass * 45 grass * 45 grass * 45 grass * 45 grass * 45 grass * 45 grass * 45 grass * 45 grass * 45 grass * 45 grass * 45 grass * 45 grass * 45 grass * 45 grass * 45 grass * 45 grass * 45 grass *
45 grass * 45 grass * 45 grass * 45 grass * 45 grass * 45 grass * 450 grass * 450 grass * 450 grass * 450 grass * 450 grass * 450 grass * 450 grass * 450 grass * 450 grass * 450 grass * 450 grass * 450 grass * 450 grass * 450 grass * 450 grass * 450 grass * 450 grass * 450 grass * 450 grass * 450 grass * 450 grass * 450 grass * 450 grass * 450 grass * 450 grass * 450 grass * 450 grass * 450 grass * 4500 grass * 4500 grass * 4500 grass * 4500 grass * 4500 grass * 4500 grass * 4500 grass * 4500 grass * 4500 grass * 4500 grass * 4500 grass * 4500 grass * 4500 grass * 4500 grass * 4500 grass * 4500 grass *
4500 grass * 4500 grass * 4500 grass * 4500 grass * 4500 grass * 4500 grass * 4500 grass * 4500 grass * 45000 grass * 45000 grass * 45000 grass * 45000 grass * 45000 grass * 45000 grass * 45000 grass * 45000 grass * 45 ves * 45 ves * 45 ves * 45 ves * 45 ves * 45 ves * 45 ves * 45 ves * 45 ves * 45 ves * 45 ves * 45 ves * 45 ves * 45 ves * 45 ves * 45 ves * 45 ves * 45 ves * 45 ves * 45 ves * 45 ves * 45 ves * 45 ves * 45 ves * 450 ves * 450 ves * 450 ves * 450 ves * 450 ves * 450 ves * 450 ves * 450 ves * 450 ves * 450 ves *

147
450 ves * 450 ves * 450 ves * 450 ves * 450 ves * 450 ves * 4500 ves * 4500 ves * 4500 ves * 4500 ves * 4500 ves * 4500 ves * 4500 ves * 4500 ves * 4500 ves * 4500 ves * 4500 ves * 4500 ves * 4500 ves * 4500 ves * 4500 ves * 4500 ves * 4500 ves * 4500 ves * 4500 ves * 4500 ves * 45000 ves * 45000 ves * 45000 ves * 45000 ves * 45000 ves *
45000 ves * 45000 ves * 45000 ves * 45000 ves * 45000 ves * 45000 ves * 45000 ves * 45000 ves * 45000 ves * 45000 ves * 45000 ves * ves 450000 * ves 450000 * ves 450000 * ves 450000 * ves 450000 * ves 450000 * ves 450000 * ves 450000 * ves 450000 * ves 450000 * ves 450000 * ves 450000 * ves 450000 * ves 450000 * ves 450000 * ves 450000 * 45 ves * 45 ves * 45 ves * 45 ves *
45 ves * 45 ves * 45 ves * 45 ves * 450 ves * 450 ves * 450 ves * 450 ves * 450 ves * 450 ves * 450 ves * 450 ves * 4500 ves * 4500 ves * 4500 ves * 4500 ves * 4500 ves * 4500 ves * 4500 ves * 4500 ves * ves 450000 * ves 450000 * ves 450000 * ves 450000 * ves 450000 * ves 450000 * ves 450000 * ves 450000 * 45 ves 45 ves 45 ves
45 ves 45 ves * 45 ves * 45 ves * 45 ves * 450 ves * 450 ves * 450 ves * 450 ves * 450 ves * 450 ves * 450 ves * 450 ves * 4500 ves * 4500 ves * 4500 ves * 4500 ves * 4500 ves * 4500 ves * 4500 ves * 4500 ves * 45000 ves * 45000 ves * 45000 ves * 45000 ves * 45000 ves * 45000 ves * 45000 ves * 45000 ves *

148
Appendix E in chapter VII Classification of different vaccines at concentration of 450,000 SQ A—api, C—cat, D—der, G—grass, and V—vespula, (SIMCA results at 95% confidence level).Sample A C D G V API * API * API * API * API * API * API * API * API * API * API * API * API * API * API * API * API * API * API * API * API * API * API * API * API * API * API * API * API * API * API * API * API * API * API * API * API * API * API * API * API * API * API * API * API * API *
API * API * API * API * API * API API * API * API * API * API * API * API * API * API * API * API * API * API * API * API * API * API * API * API API API * API * API * API * API * API * API * API * API API * API * API * API * API * API * API * API * API * API * API * API *
API * API * API * API * API * API * API * API * API * API * API * API * API * API * API * API API * API * API * API * API * API * API * API * API * API * API * API * API * API * API * API * API * API * API * CAT * CAT * CAT * CAT * CAT * CAT * CAT * CAT * CAT * CAT * CAT * CAT *
CAT * CAT * CAT * CAT * CAT * CAT * CAT * CAT * CAT * CAT * CAT * CAT * CAT * CAT * CAT * CAT * CAT * CAT * CAT * CAT * CAT * CAT * CAT * CAT * CAT * CAT * CAT * CAT * CAT * CAT CAT * CAT * CAT * CAT * CAT * CAT * CAT * CAT * CAT * CAT * CAT * CAT * CAT * CAT * CAT * CAT * CAT *
149
CAT * CAT * CAT * CAT * CAT * CAT * CAT * CAT * CAT * DER * DER * DER * DER * DER * DER * DER * DER * DER * DER * DER * DER * DER * DER * DER * DER * GRA GRA * GRA * GRA GRA * GRA * GRA * GRA * GRA * GRA * GRA * GRA * GRA * GRA * GRA * GRA * GRA * GRA * GRA * GRA * GRA * GRA * GRA * GRA * GRA *
GRA * GRA * GRA * GRA * GRA * GRA * GRA * GRA * GRA * GRA GRA * GRA * GRA * GRA * GRA * GRA * GRA * GRA * GRA * VES * VES * VES * VES * VES * VES * VES * VES * VES * VES * VES * VES * VES * VES * VES * VES * VES * VES * VES * VES * VES * VES * VES * VES * VES * VES * VES * VES * VES * VES * VES *
VES * VES * VES * VES * VES * VES * VES * VES * VES * VES * VES * VES * VES * VES * VES * VES * VES * VES * VES * VES * VES * VES * VES * VES * VES * VES * VES * VES * VES * VES * VES * VES * VES * VES * VES * VES * VES * VES * VES * VES * VES * VES * VES * VES * VES * VES * VES * VES * VES * VES *
VES * VES * VES * VES * VES * VES * VES * VES * VES * VES * VES * VES * VES * VES * VES * VES * VES * VES * VES * VES * VES * VES * VES * VES * VES * VES * VES * VES * VES * VES * VES * VES * VES * VES * VES * VES * VES * VES * VES * VES * API * API * API * API * API * API * API * API * API * API *
150
API * API API API * API API * API * API * API * API * API * API * API * API * API * API * API * API * API * API * API * API * API * API * API * API * API * API * API * API * API * API * API * API * API * API * API * VES * VES * VES * VES * VES * VES * VES * VES * VES * VES * VES * VES * VES *
VES * VES * VES * VES * VES * VES * VES * VES * VES * VES * VES *
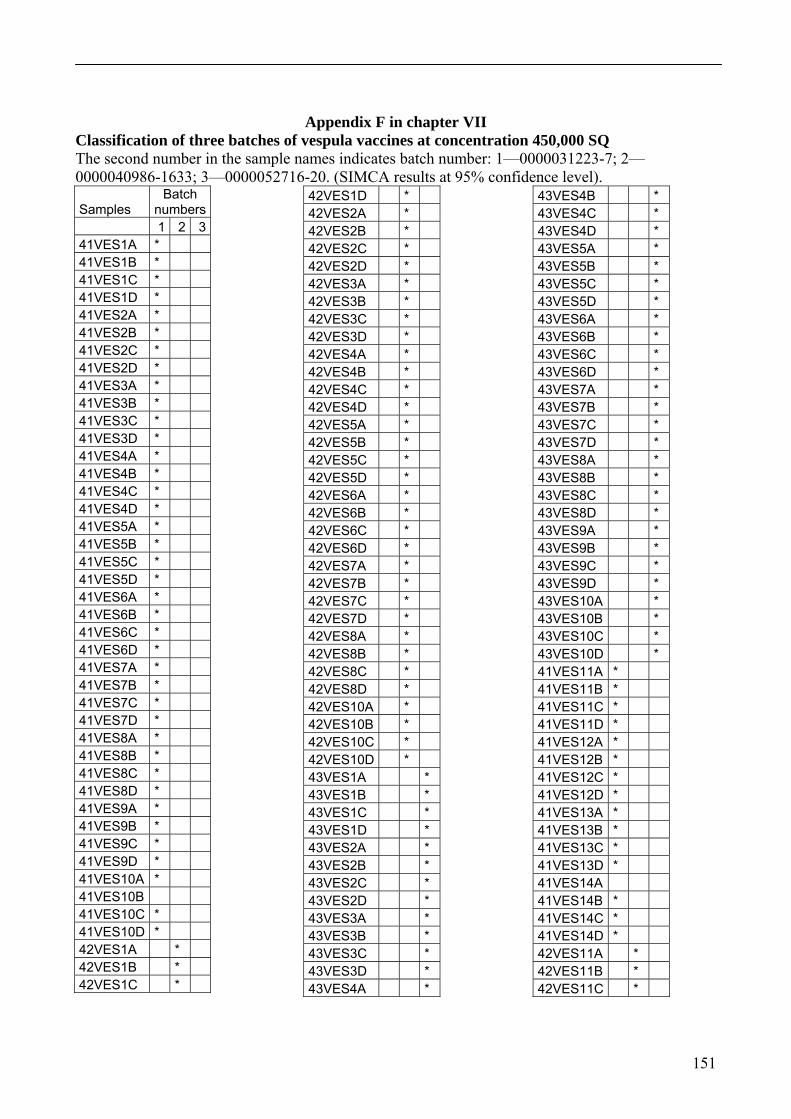
151
Appendix F in chapter VII Classification of three batches of vespula vaccines at concentration 450,000 SQ The second number in the sample names indicates batch number: 1—0000031223-7; 2—0000040986-1633; 3—0000052716-20. (SIMCA results at 95% confidence level).
Samples Batch
numbers 1 2 3 41VES1A * 41VES1B * 41VES1C * 41VES1D * 41VES2A * 41VES2B * 41VES2C * 41VES2D * 41VES3A * 41VES3B * 41VES3C * 41VES3D * 41VES4A * 41VES4B * 41VES4C * 41VES4D * 41VES5A * 41VES5B * 41VES5C * 41VES5D * 41VES6A * 41VES6B * 41VES6C * 41VES6D * 41VES7A * 41VES7B * 41VES7C * 41VES7D * 41VES8A * 41VES8B * 41VES8C * 41VES8D * 41VES9A * 41VES9B * 41VES9C * 41VES9D * 41VES10A * 41VES10B 41VES10C * 41VES10D * 42VES1A * 42VES1B * 42VES1C *
42VES1D * 42VES2A * 42VES2B * 42VES2C * 42VES2D * 42VES3A * 42VES3B * 42VES3C * 42VES3D * 42VES4A * 42VES4B * 42VES4C * 42VES4D * 42VES5A * 42VES5B * 42VES5C * 42VES5D * 42VES6A * 42VES6B * 42VES6C * 42VES6D * 42VES7A * 42VES7B * 42VES7C * 42VES7D * 42VES8A * 42VES8B * 42VES8C * 42VES8D * 42VES10A * 42VES10B * 42VES10C * 42VES10D * 43VES1A * 43VES1B * 43VES1C * 43VES1D * 43VES2A * 43VES2B * 43VES2C * 43VES2D * 43VES3A * 43VES3B * 43VES3C * 43VES3D * 43VES4A *
43VES4B * 43VES4C * 43VES4D * 43VES5A * 43VES5B * 43VES5C * 43VES5D * 43VES6A * 43VES6B * 43VES6C * 43VES6D * 43VES7A * 43VES7B * 43VES7C * 43VES7D * 43VES8A * 43VES8B * 43VES8C * 43VES8D * 43VES9A * 43VES9B * 43VES9C * 43VES9D * 43VES10A * 43VES10B * 43VES10C * 43VES10D * 41VES11A * 41VES11B * 41VES11C * 41VES11D * 41VES12A * 41VES12B * 41VES12C * 41VES12D * 41VES13A * 41VES13B * 41VES13C * 41VES13D * 41VES14A 41VES14B * 41VES14C * 41VES14D * 42VES11A * 42VES11B * 42VES11C *

152
42VES11D * 42VES12A * 42VES12B * 42VES12C * 42VES12D *
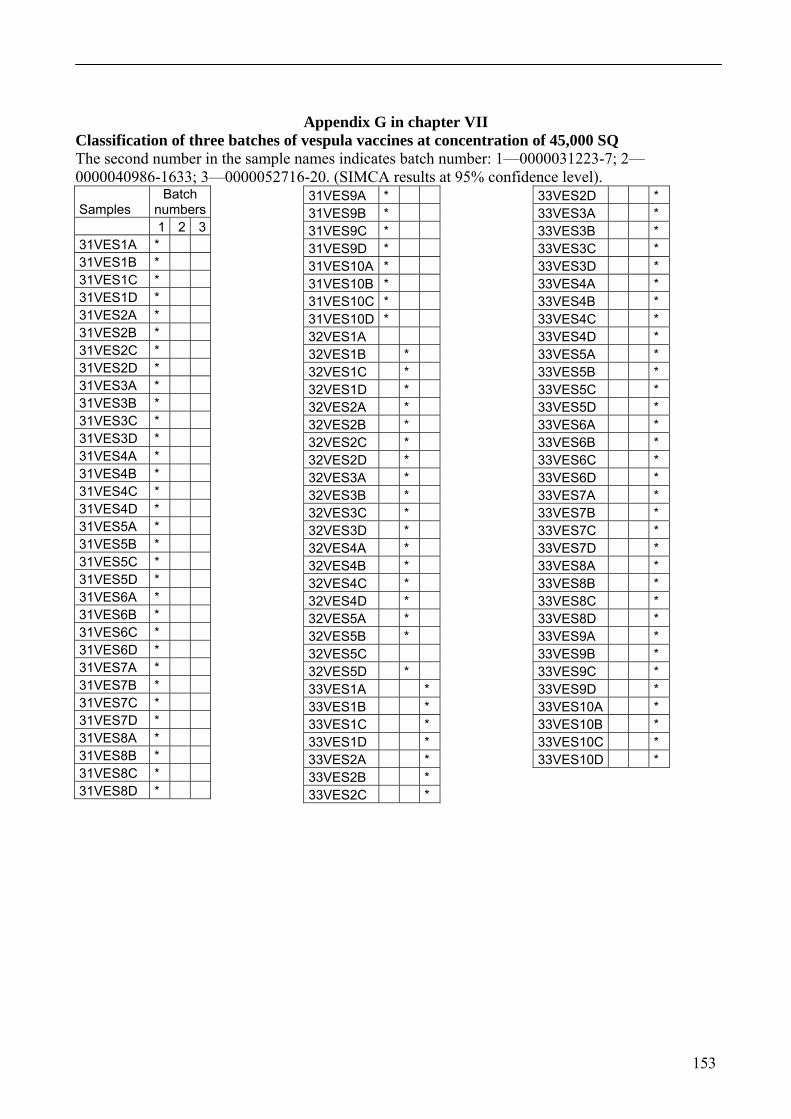
153
Appendix G in chapter VII Classification of three batches of vespula vaccines at concentration of 45,000 SQ The second number in the sample names indicates batch number: 1—0000031223-7; 2—0000040986-1633; 3—0000052716-20. (SIMCA results at 95% confidence level).
Samples Batch
numbers 1 2 3 31VES1A * 31VES1B * 31VES1C * 31VES1D * 31VES2A * 31VES2B * 31VES2C * 31VES2D * 31VES3A * 31VES3B * 31VES3C * 31VES3D * 31VES4A * 31VES4B * 31VES4C * 31VES4D * 31VES5A * 31VES5B * 31VES5C * 31VES5D * 31VES6A * 31VES6B * 31VES6C * 31VES6D * 31VES7A * 31VES7B * 31VES7C * 31VES7D * 31VES8A * 31VES8B * 31VES8C * 31VES8D *
31VES9A * 31VES9B * 31VES9C * 31VES9D * 31VES10A * 31VES10B * 31VES10C * 31VES10D * 32VES1A 32VES1B * 32VES1C * 32VES1D * 32VES2A * 32VES2B * 32VES2C * 32VES2D * 32VES3A * 32VES3B * 32VES3C * 32VES3D * 32VES4A * 32VES4B * 32VES4C * 32VES4D * 32VES5A * 32VES5B * 32VES5C 32VES5D * 33VES1A * 33VES1B * 33VES1C * 33VES1D * 33VES2A * 33VES2B * 33VES2C *
33VES2D * 33VES3A * 33VES3B * 33VES3C * 33VES3D * 33VES4A * 33VES4B * 33VES4C * 33VES4D * 33VES5A * 33VES5B * 33VES5C * 33VES5D * 33VES6A * 33VES6B * 33VES6C * 33VES6D * 33VES7A * 33VES7B * 33VES7C * 33VES7D * 33VES8A * 33VES8B * 33VES8C * 33VES8D * 33VES9A * 33VES9B * 33VES9C * 33VES9D * 33VES10A * 33VES10B * 33VES10C * 33VES10D *
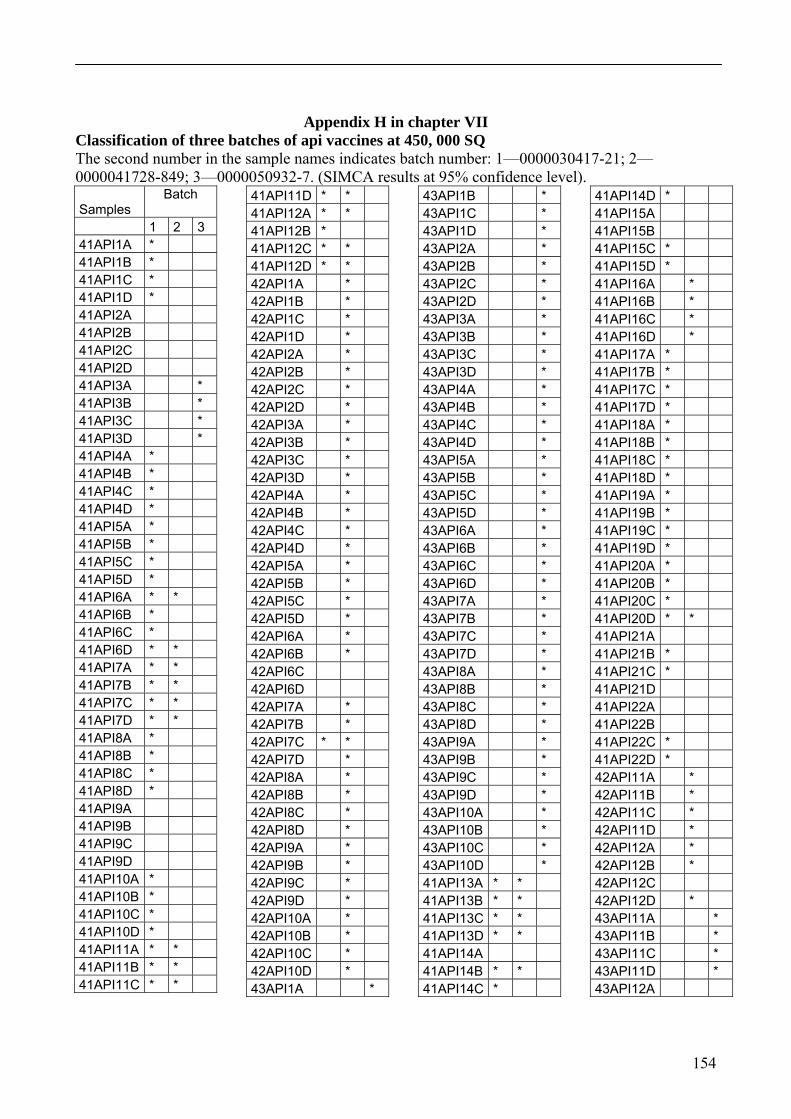
154
Appendix H in chapter VII Classification of three batches of api vaccines at 450, 000 SQ The second number in the sample names indicates batch number: 1—0000030417-21; 2—0000041728-849; 3—0000050932-7. (SIMCA results at 95% confidence level).
Samples Batch
1 2 3 41API1A * 41API1B * 41API1C * 41API1D * 41API2A 41API2B 41API2C 41API2D 41API3A * 41API3B * 41API3C * 41API3D * 41API4A * 41API4B * 41API4C * 41API4D * 41API5A * 41API5B * 41API5C * 41API5D * 41API6A * * 41API6B * 41API6C * 41API6D * * 41API7A * * 41API7B * * 41API7C * * 41API7D * * 41API8A * 41API8B * 41API8C * 41API8D * 41API9A 41API9B 41API9C 41API9D 41API10A * 41API10B * 41API10C * 41API10D * 41API11A * * 41API11B * * 41API11C * *
41API11D * * 41API12A * * 41API12B * 41API12C * * 41API12D * * 42API1A * 42API1B * 42API1C * 42API1D * 42API2A * 42API2B * 42API2C * 42API2D * 42API3A * 42API3B * 42API3C * 42API3D * 42API4A * 42API4B * 42API4C * 42API4D * 42API5A * 42API5B * 42API5C * 42API5D * 42API6A * 42API6B * 42API6C 42API6D 42API7A * 42API7B * 42API7C * * 42API7D * 42API8A * 42API8B * 42API8C * 42API8D * 42API9A * 42API9B * 42API9C * 42API9D * 42API10A * 42API10B * 42API10C * 42API10D * 43API1A *
43API1B * 43API1C * 43API1D * 43API2A * 43API2B * 43API2C * 43API2D * 43API3A * 43API3B * 43API3C * 43API3D * 43API4A * 43API4B * 43API4C * 43API4D * 43API5A * 43API5B * 43API5C * 43API5D * 43API6A * 43API6B * 43API6C * 43API6D * 43API7A * 43API7B * 43API7C * 43API7D * 43API8A * 43API8B * 43API8C * 43API8D * 43API9A * 43API9B * 43API9C * 43API9D * 43API10A * 43API10B * 43API10C * 43API10D * 41API13A * * 41API13B * * 41API13C * * 41API13D * * 41API14A 41API14B * * 41API14C *
41API14D * 41API15A 41API15B 41API15C * 41API15D * 41API16A * 41API16B * 41API16C * 41API16D * 41API17A * 41API17B * 41API17C * 41API17D * 41API18A * 41API18B * 41API18C * 41API18D * 41API19A * 41API19B * 41API19C * 41API19D * 41API20A * 41API20B * 41API20C * 41API20D * * 41API21A 41API21B * 41API21C * 41API21D 41API22A 41API22B 41API22C * 41API22D * 42API11A * 42API11B * 42API11C * 42API11D * 42API12A * 42API12B * 42API12C 42API12D * 43API11A * 43API11B * 43API11C * 43API11D * 43API12A

155
43API12B 43API12C 43API12D
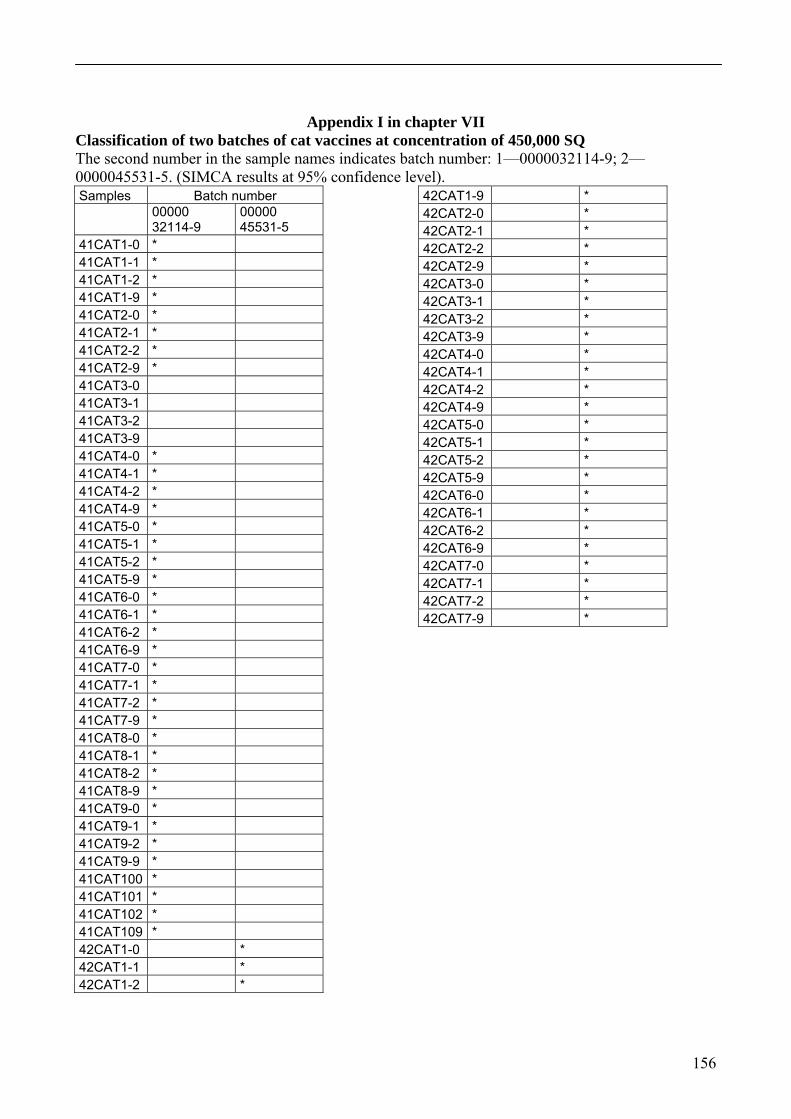
156
Appendix I in chapter VII Classification of two batches of cat vaccines at concentration of 450,000 SQ The second number in the sample names indicates batch number: 1—0000032114-9; 2—0000045531-5. (SIMCA results at 95% confidence level). Samples Batch number
00000 32114-9
00000 45531-5
41CAT1-0 * 41CAT1-1 * 41CAT1-2 * 41CAT1-9 * 41CAT2-0 * 41CAT2-1 * 41CAT2-2 * 41CAT2-9 * 41CAT3-0 41CAT3-1 41CAT3-2 41CAT3-9 41CAT4-0 * 41CAT4-1 * 41CAT4-2 * 41CAT4-9 * 41CAT5-0 * 41CAT5-1 * 41CAT5-2 * 41CAT5-9 * 41CAT6-0 * 41CAT6-1 * 41CAT6-2 * 41CAT6-9 * 41CAT7-0 * 41CAT7-1 * 41CAT7-2 * 41CAT7-9 * 41CAT8-0 * 41CAT8-1 * 41CAT8-2 * 41CAT8-9 * 41CAT9-0 * 41CAT9-1 * 41CAT9-2 * 41CAT9-9 * 41CAT100 * 41CAT101 * 41CAT102 * 41CAT109 * 42CAT1-0 * 42CAT1-1 * 42CAT1-2 *
42CAT1-9 * 42CAT2-0 * 42CAT2-1 * 42CAT2-2 * 42CAT2-9 * 42CAT3-0 * 42CAT3-1 * 42CAT3-2 * 42CAT3-9 * 42CAT4-0 * 42CAT4-1 * 42CAT4-2 * 42CAT4-9 * 42CAT5-0 * 42CAT5-1 * 42CAT5-2 * 42CAT5-9 * 42CAT6-0 * 42CAT6-1 * 42CAT6-2 * 42CAT6-9 * 42CAT7-0 * 42CAT7-1 * 42CAT7-2 * 42CAT7-9 *
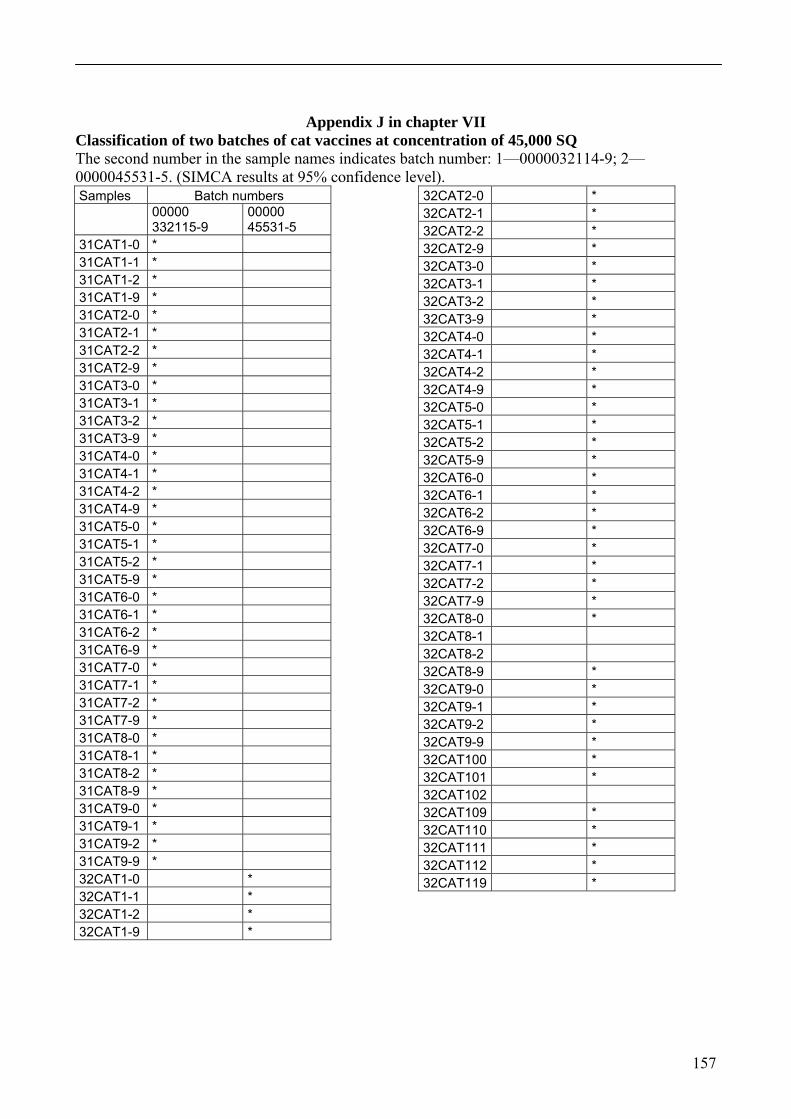
157
Appendix J in chapter VII Classification of two batches of cat vaccines at concentration of 45,000 SQ The second number in the sample names indicates batch number: 1—0000032114-9; 2—0000045531-5. (SIMCA results at 95% confidence level). Samples Batch numbers
00000 332115-9
00000 45531-5
31CAT1-0 * 31CAT1-1 * 31CAT1-2 * 31CAT1-9 * 31CAT2-0 * 31CAT2-1 * 31CAT2-2 * 31CAT2-9 * 31CAT3-0 * 31CAT3-1 * 31CAT3-2 * 31CAT3-9 * 31CAT4-0 * 31CAT4-1 * 31CAT4-2 * 31CAT4-9 * 31CAT5-0 * 31CAT5-1 * 31CAT5-2 * 31CAT5-9 * 31CAT6-0 * 31CAT6-1 * 31CAT6-2 * 31CAT6-9 * 31CAT7-0 * 31CAT7-1 * 31CAT7-2 * 31CAT7-9 * 31CAT8-0 * 31CAT8-1 * 31CAT8-2 * 31CAT8-9 * 31CAT9-0 * 31CAT9-1 * 31CAT9-2 * 31CAT9-9 * 32CAT1-0 * 32CAT1-1 * 32CAT1-2 * 32CAT1-9 *
32CAT2-0 * 32CAT2-1 * 32CAT2-2 * 32CAT2-9 * 32CAT3-0 * 32CAT3-1 * 32CAT3-2 * 32CAT3-9 * 32CAT4-0 * 32CAT4-1 * 32CAT4-2 * 32CAT4-9 * 32CAT5-0 * 32CAT5-1 * 32CAT5-2 * 32CAT5-9 * 32CAT6-0 * 32CAT6-1 * 32CAT6-2 * 32CAT6-9 * 32CAT7-0 * 32CAT7-1 * 32CAT7-2 * 32CAT7-9 * 32CAT8-0 * 32CAT8-1 32CAT8-2 32CAT8-9 * 32CAT9-0 * 32CAT9-1 * 32CAT9-2 * 32CAT9-9 * 32CAT100 * 32CAT101 * 32CAT102 32CAT109 * 32CAT110 * 32CAT111 * 32CAT112 * 32CAT119 *
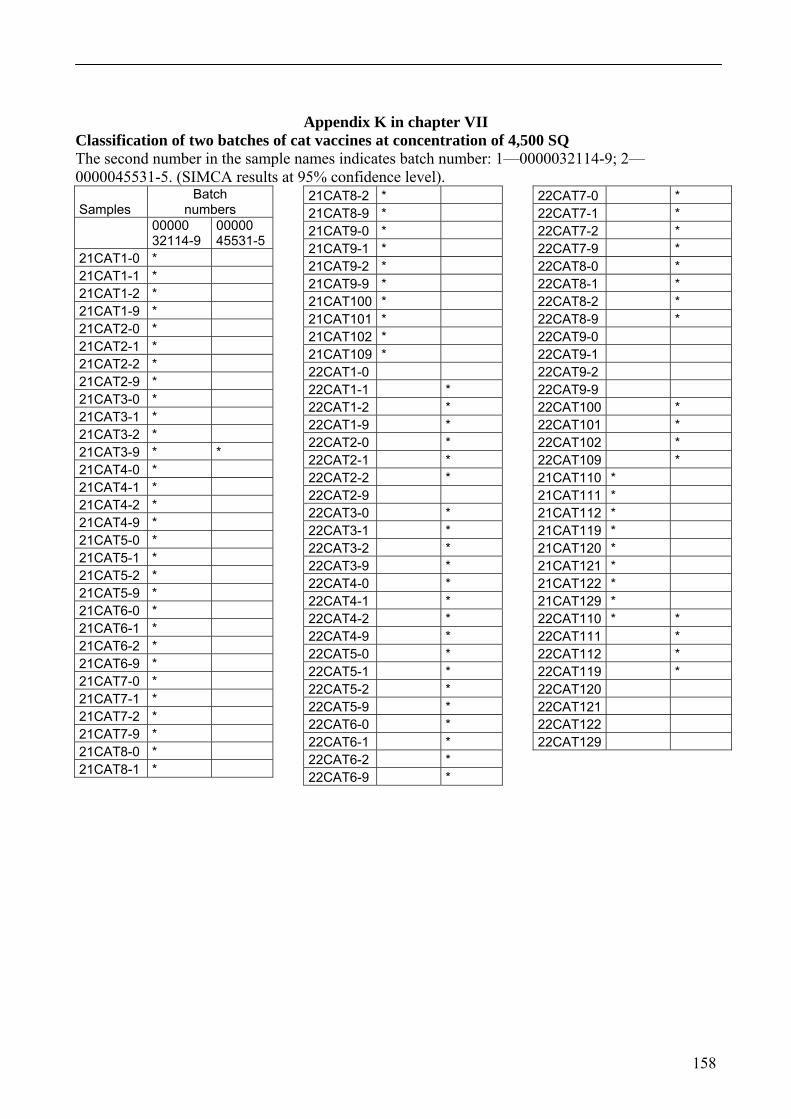
158
Appendix K in chapter VII Classification of two batches of cat vaccines at concentration of 4,500 SQ The second number in the sample names indicates batch number: 1—0000032114-9; 2—0000045531-5. (SIMCA results at 95% confidence level).
Samples Batch
numbers
00000 32114-9
00000 45531-5
21CAT1-0 * 21CAT1-1 * 21CAT1-2 * 21CAT1-9 * 21CAT2-0 * 21CAT2-1 * 21CAT2-2 * 21CAT2-9 * 21CAT3-0 * 21CAT3-1 * 21CAT3-2 * 21CAT3-9 * * 21CAT4-0 * 21CAT4-1 * 21CAT4-2 * 21CAT4-9 * 21CAT5-0 * 21CAT5-1 * 21CAT5-2 * 21CAT5-9 * 21CAT6-0 * 21CAT6-1 * 21CAT6-2 * 21CAT6-9 * 21CAT7-0 * 21CAT7-1 * 21CAT7-2 * 21CAT7-9 * 21CAT8-0 * 21CAT8-1 *
21CAT8-2 * 21CAT8-9 * 21CAT9-0 * 21CAT9-1 * 21CAT9-2 * 21CAT9-9 * 21CAT100 * 21CAT101 * 21CAT102 * 21CAT109 * 22CAT1-0 22CAT1-1 * 22CAT1-2 * 22CAT1-9 * 22CAT2-0 * 22CAT2-1 * 22CAT2-2 * 22CAT2-9 22CAT3-0 * 22CAT3-1 * 22CAT3-2 * 22CAT3-9 * 22CAT4-0 * 22CAT4-1 * 22CAT4-2 * 22CAT4-9 * 22CAT5-0 * 22CAT5-1 * 22CAT5-2 * 22CAT5-9 * 22CAT6-0 * 22CAT6-1 * 22CAT6-2 * 22CAT6-9 *
22CAT7-0 * 22CAT7-1 * 22CAT7-2 * 22CAT7-9 * 22CAT8-0 * 22CAT8-1 * 22CAT8-2 * 22CAT8-9 * 22CAT9-0 22CAT9-1 22CAT9-2 22CAT9-9 22CAT100 * 22CAT101 * 22CAT102 * 22CAT109 * 21CAT110 * 21CAT111 * 21CAT112 * 21CAT119 * 21CAT120 * 21CAT121 * 21CAT122 * 21CAT129 * 22CAT110 * * 22CAT111 * 22CAT112 * 22CAT119 * 22CAT120 22CAT121 22CAT122 22CAT129
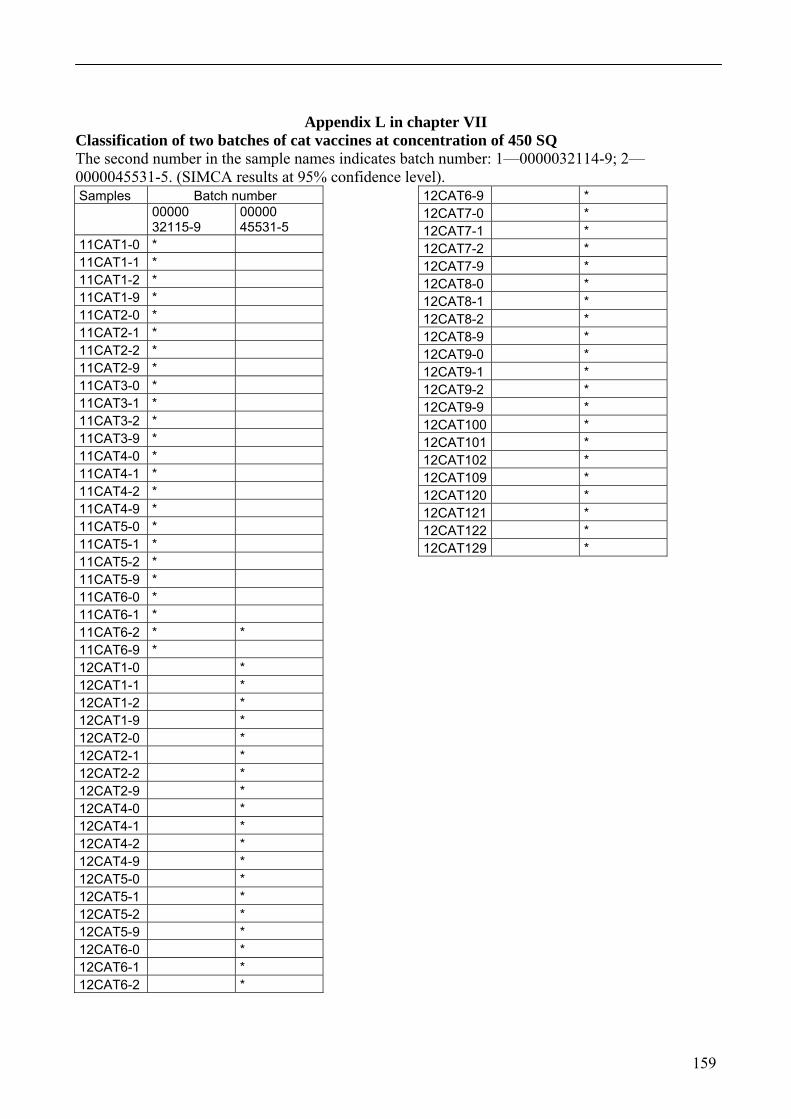
159
Appendix L in chapter VII Classification of two batches of cat vaccines at concentration of 450 SQ The second number in the sample names indicates batch number: 1—0000032114-9; 2—0000045531-5. (SIMCA results at 95% confidence level). Samples Batch number
00000 32115-9
00000 45531-5
11CAT1-0 * 11CAT1-1 * 11CAT1-2 * 11CAT1-9 * 11CAT2-0 * 11CAT2-1 * 11CAT2-2 * 11CAT2-9 * 11CAT3-0 * 11CAT3-1 * 11CAT3-2 * 11CAT3-9 * 11CAT4-0 * 11CAT4-1 * 11CAT4-2 * 11CAT4-9 * 11CAT5-0 * 11CAT5-1 * 11CAT5-2 * 11CAT5-9 * 11CAT6-0 * 11CAT6-1 * 11CAT6-2 * * 11CAT6-9 * 12CAT1-0 * 12CAT1-1 * 12CAT1-2 * 12CAT1-9 * 12CAT2-0 * 12CAT2-1 * 12CAT2-2 * 12CAT2-9 * 12CAT4-0 * 12CAT4-1 * 12CAT4-2 * 12CAT4-9 * 12CAT5-0 * 12CAT5-1 * 12CAT5-2 * 12CAT5-9 * 12CAT6-0 * 12CAT6-1 * 12CAT6-2 *
12CAT6-9 * 12CAT7-0 * 12CAT7-1 * 12CAT7-2 * 12CAT7-9 * 12CAT8-0 * 12CAT8-1 * 12CAT8-2 * 12CAT8-9 * 12CAT9-0 * 12CAT9-1 * 12CAT9-2 * 12CAT9-9 * 12CAT100 * 12CAT101 * 12CAT102 * 12CAT109 * 12CAT120 * 12CAT121 * 12CAT122 * 12CAT129 *
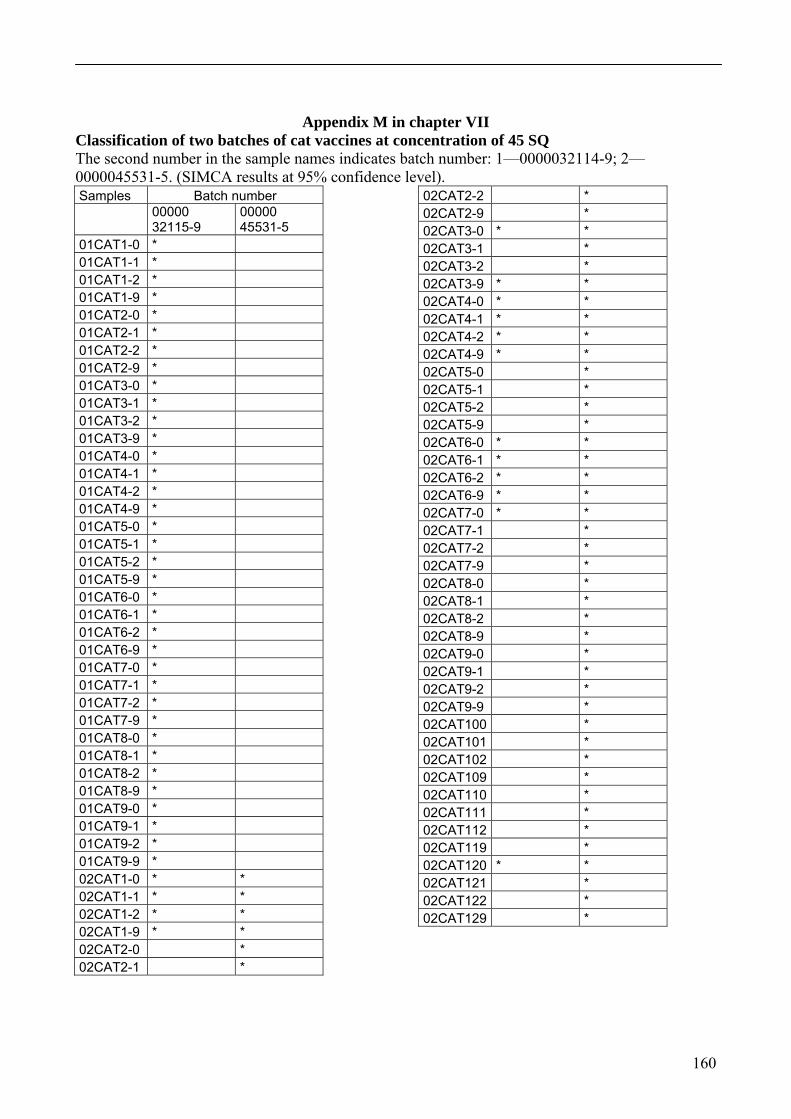
160
Appendix M in chapter VII Classification of two batches of cat vaccines at concentration of 45 SQ The second number in the sample names indicates batch number: 1—0000032114-9; 2—0000045531-5. (SIMCA results at 95% confidence level).Samples Batch number
00000 32115-9
00000 45531-5
01CAT1-0 * 01CAT1-1 * 01CAT1-2 * 01CAT1-9 * 01CAT2-0 * 01CAT2-1 * 01CAT2-2 * 01CAT2-9 * 01CAT3-0 * 01CAT3-1 * 01CAT3-2 * 01CAT3-9 * 01CAT4-0 * 01CAT4-1 * 01CAT4-2 * 01CAT4-9 * 01CAT5-0 * 01CAT5-1 * 01CAT5-2 * 01CAT5-9 * 01CAT6-0 * 01CAT6-1 * 01CAT6-2 * 01CAT6-9 * 01CAT7-0 * 01CAT7-1 * 01CAT7-2 * 01CAT7-9 * 01CAT8-0 * 01CAT8-1 * 01CAT8-2 * 01CAT8-9 * 01CAT9-0 * 01CAT9-1 * 01CAT9-2 * 01CAT9-9 * 02CAT1-0 * * 02CAT1-1 * * 02CAT1-2 * * 02CAT1-9 * * 02CAT2-0 * 02CAT2-1 *
02CAT2-2 * 02CAT2-9 * 02CAT3-0 * * 02CAT3-1 * 02CAT3-2 * 02CAT3-9 * * 02CAT4-0 * * 02CAT4-1 * * 02CAT4-2 * * 02CAT4-9 * * 02CAT5-0 * 02CAT5-1 * 02CAT5-2 * 02CAT5-9 * 02CAT6-0 * * 02CAT6-1 * * 02CAT6-2 * * 02CAT6-9 * * 02CAT7-0 * * 02CAT7-1 * 02CAT7-2 * 02CAT7-9 * 02CAT8-0 * 02CAT8-1 * 02CAT8-2 * 02CAT8-9 * 02CAT9-0 * 02CAT9-1 * 02CAT9-2 * 02CAT9-9 * 02CAT100 * 02CAT101 * 02CAT102 * 02CAT109 * 02CAT110 * 02CAT111 * 02CAT112 * 02CAT119 * 02CAT120 * * 02CAT121 * 02CAT122 * 02CAT129 *
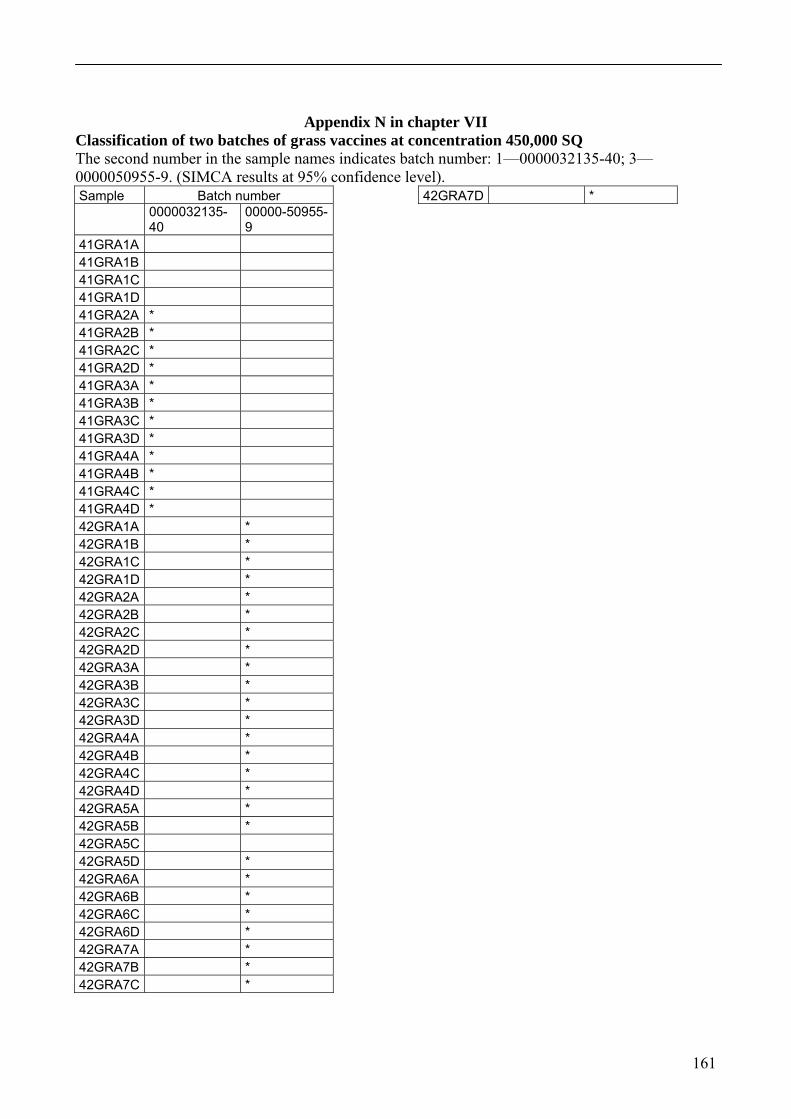
161
Appendix N in chapter VII Classification of two batches of grass vaccines at concentration 450,000 SQ The second number in the sample names indicates batch number: 1—0000032135-40; 3—0000050955-9. (SIMCA results at 95% confidence level). Sample Batch number
0000032135-40
00000-50955-9
41GRA1A 41GRA1B 41GRA1C 41GRA1D 41GRA2A * 41GRA2B * 41GRA2C * 41GRA2D * 41GRA3A * 41GRA3B * 41GRA3C * 41GRA3D * 41GRA4A * 41GRA4B * 41GRA4C * 41GRA4D * 42GRA1A * 42GRA1B * 42GRA1C * 42GRA1D * 42GRA2A * 42GRA2B * 42GRA2C * 42GRA2D * 42GRA3A * 42GRA3B * 42GRA3C * 42GRA3D * 42GRA4A * 42GRA4B * 42GRA4C * 42GRA4D * 42GRA5A * 42GRA5B * 42GRA5C 42GRA5D * 42GRA6A * 42GRA6B * 42GRA6C * 42GRA6D * 42GRA7A * 42GRA7B * 42GRA7C *
42GRA7D *
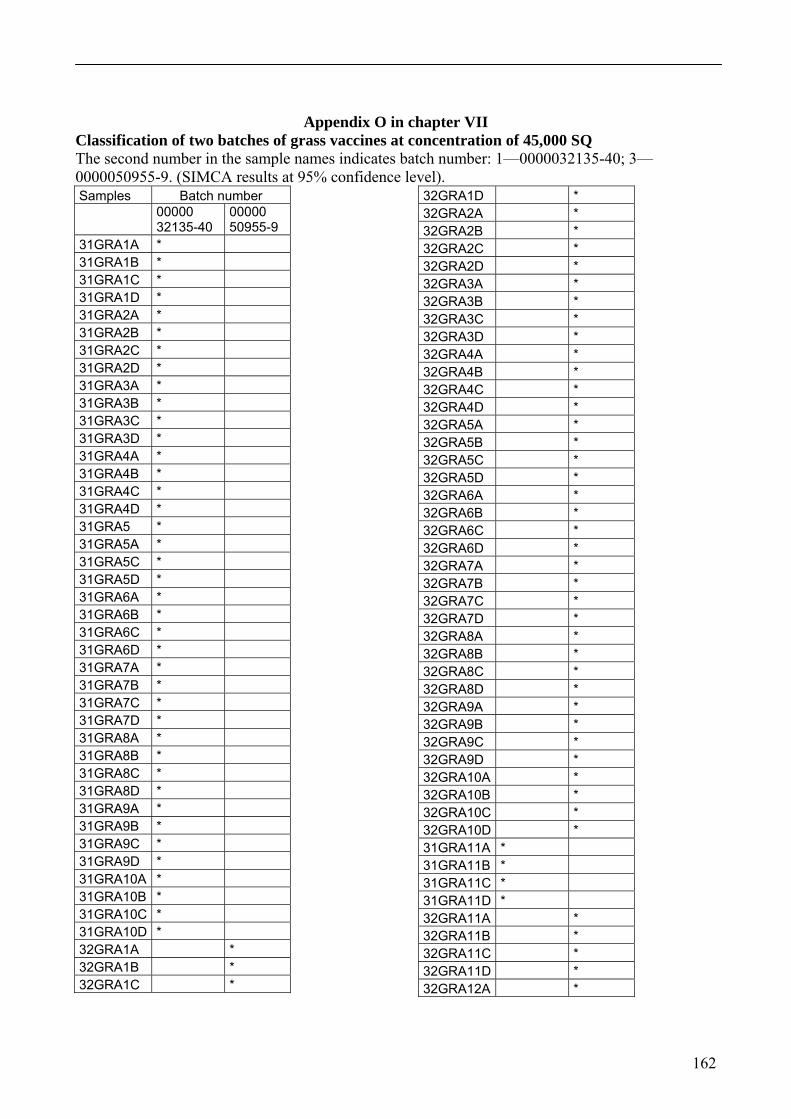
162
Appendix O in chapter VII Classification of two batches of grass vaccines at concentration of 45,000 SQ The second number in the sample names indicates batch number: 1—0000032135-40; 3—0000050955-9. (SIMCA results at 95% confidence level). Samples Batch number
00000 32135-40
00000 50955-9
31GRA1A * 31GRA1B * 31GRA1C * 31GRA1D * 31GRA2A * 31GRA2B * 31GRA2C * 31GRA2D * 31GRA3A * 31GRA3B * 31GRA3C * 31GRA3D * 31GRA4A * 31GRA4B * 31GRA4C * 31GRA4D * 31GRA5 * 31GRA5A * 31GRA5C * 31GRA5D * 31GRA6A * 31GRA6B * 31GRA6C * 31GRA6D * 31GRA7A * 31GRA7B * 31GRA7C * 31GRA7D * 31GRA8A * 31GRA8B * 31GRA8C * 31GRA8D * 31GRA9A * 31GRA9B * 31GRA9C * 31GRA9D * 31GRA10A * 31GRA10B * 31GRA10C * 31GRA10D * 32GRA1A * 32GRA1B * 32GRA1C *
32GRA1D * 32GRA2A * 32GRA2B * 32GRA2C * 32GRA2D * 32GRA3A * 32GRA3B * 32GRA3C * 32GRA3D * 32GRA4A * 32GRA4B * 32GRA4C * 32GRA4D * 32GRA5A * 32GRA5B * 32GRA5C * 32GRA5D * 32GRA6A * 32GRA6B * 32GRA6C * 32GRA6D * 32GRA7A * 32GRA7B * 32GRA7C * 32GRA7D * 32GRA8A * 32GRA8B * 32GRA8C * 32GRA8D * 32GRA9A * 32GRA9B * 32GRA9C * 32GRA9D * 32GRA10A * 32GRA10B * 32GRA10C * 32GRA10D * 31GRA11A * 31GRA11B * 31GRA11C * 31GRA11D * 32GRA11A * 32GRA11B * 32GRA11C * 32GRA11D * 32GRA12A *

163
32GRA12B * 32GRA12C 32GRA12D *

164
Appendix P in chapter VII Classification of two batches of grass vaccines at concentration of 4,500 SQ The second number in the sample names indicates batch number: 1—0000032135-40; 3—0000050955-9. (SIMCA results at 95% confidence level). Samples Batch numbers
00000 32135-40
00000 50955-9
21GRA1A * 21GRA1B * 21GRA1C * 21GRA1D * 21GRA2A * 21GRA2B * 21GRA2C * 21GRA2D * 21GRA3A * 21GRA3B * 21GRA3C * 21GRA3D * 21GRA4A * 21GRA4B * 21GRA4C * 21GRA4D * 21GRA5A * 21GRA5B * 21GRA5C * 21GRA5D * 21GRA6A * 21GRA6B * 21GRA6C * 21GRA6D * 21GRA7A * 21GRA7B * 21GRA7C * 21GRA7D * * 21GRA8A * * 21GRA8B * * 21GRA8C * * 21GRA8D * * 21GRA9A * 21GRA9B * 21GRA9C * 21GRA9D * 21GRA10A * 21GRA10B * 21GRA10C * 21GRA10D * 21GRA11A * 21GRA11B * 21GRA11C *
21GRA11D * 21GRA12A * 21GRA12B * 21GRA12C * 21GRA12D * 22GRA1A * 22GRA1B * 22GRA1C * 22GRA1D * 22GRA2A 22GRA2B 22GRA2C 22GRA2D 22GRA3A * 22GRA3B * 22GRA3C * 22GRA3D * 22GRA4A * 22GRA4B * 22GRA4C * 22GRA4D * 22GRA5A * 22GRA5B * 22GRA5C * 22GRA5D * 22GRA6A * 22GRA6B * 22GRA6C 22GRA6D * 22GRA7A * 22GRA7B * 22GRA7C * 22GRA7D * 22GRA8A * 22GRA8B * 22GRA8C * 22GRA8D * 22GRA9A * 22GRA9B * 22GRA9C * 22GRA9D * * 22GRA10A * 22GRA10B * 22GRA10C * 22GRA10D * 21GRA13A *
21GRA13B * 21GRA13C * 21GRA13D * 21GRA14A * 21GRA14B * 21GRA14C * 21GRA14D * 21GRA15A * 21GRA15B * 21GRA15C * 21GRA15D * 22GRA12A * 22GRA12B * 22GRA12C * 22GRA12D *
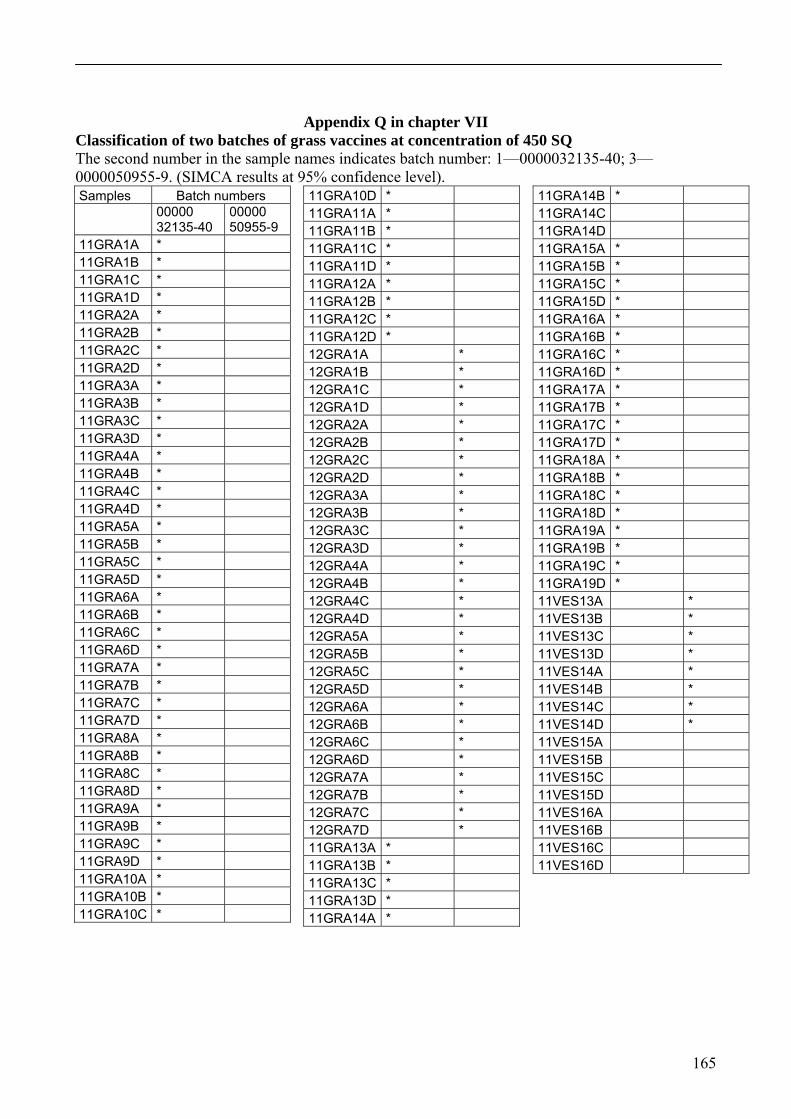
165
Appendix Q in chapter VII Classification of two batches of grass vaccines at concentration of 450 SQ The second number in the sample names indicates batch number: 1—0000032135-40; 3—0000050955-9. (SIMCA results at 95% confidence level). Samples Batch numbers
00000 32135-40
00000 50955-9
11GRA1A * 11GRA1B * 11GRA1C * 11GRA1D * 11GRA2A * 11GRA2B * 11GRA2C * 11GRA2D * 11GRA3A * 11GRA3B * 11GRA3C * 11GRA3D * 11GRA4A * 11GRA4B * 11GRA4C * 11GRA4D * 11GRA5A * 11GRA5B * 11GRA5C * 11GRA5D * 11GRA6A * 11GRA6B * 11GRA6C * 11GRA6D * 11GRA7A * 11GRA7B * 11GRA7C * 11GRA7D * 11GRA8A * 11GRA8B * 11GRA8C * 11GRA8D * 11GRA9A * 11GRA9B * 11GRA9C * 11GRA9D * 11GRA10A * 11GRA10B * 11GRA10C *
11GRA10D * 11GRA11A * 11GRA11B * 11GRA11C * 11GRA11D * 11GRA12A * 11GRA12B * 11GRA12C * 11GRA12D * 12GRA1A * 12GRA1B * 12GRA1C * 12GRA1D * 12GRA2A * 12GRA2B * 12GRA2C * 12GRA2D * 12GRA3A * 12GRA3B * 12GRA3C * 12GRA3D * 12GRA4A * 12GRA4B * 12GRA4C * 12GRA4D * 12GRA5A * 12GRA5B * 12GRA5C * 12GRA5D * 12GRA6A * 12GRA6B * 12GRA6C * 12GRA6D * 12GRA7A * 12GRA7B * 12GRA7C * 12GRA7D * 11GRA13A * 11GRA13B * 11GRA13C * 11GRA13D * 11GRA14A *
11GRA14B * 11GRA14C 11GRA14D 11GRA15A * 11GRA15B * 11GRA15C * 11GRA15D * 11GRA16A * 11GRA16B * 11GRA16C * 11GRA16D * 11GRA17A * 11GRA17B * 11GRA17C * 11GRA17D * 11GRA18A * 11GRA18B * 11GRA18C * 11GRA18D * 11GRA19A * 11GRA19B * 11GRA19C * 11GRA19D * 11VES13A * 11VES13B * 11VES13C * 11VES13D * 11VES14A * 11VES14B * 11VES14C * 11VES14D * 11VES15A 11VES15B 11VES15C 11VES15D 11VES16A 11VES16B 11VES16C 11VES16D
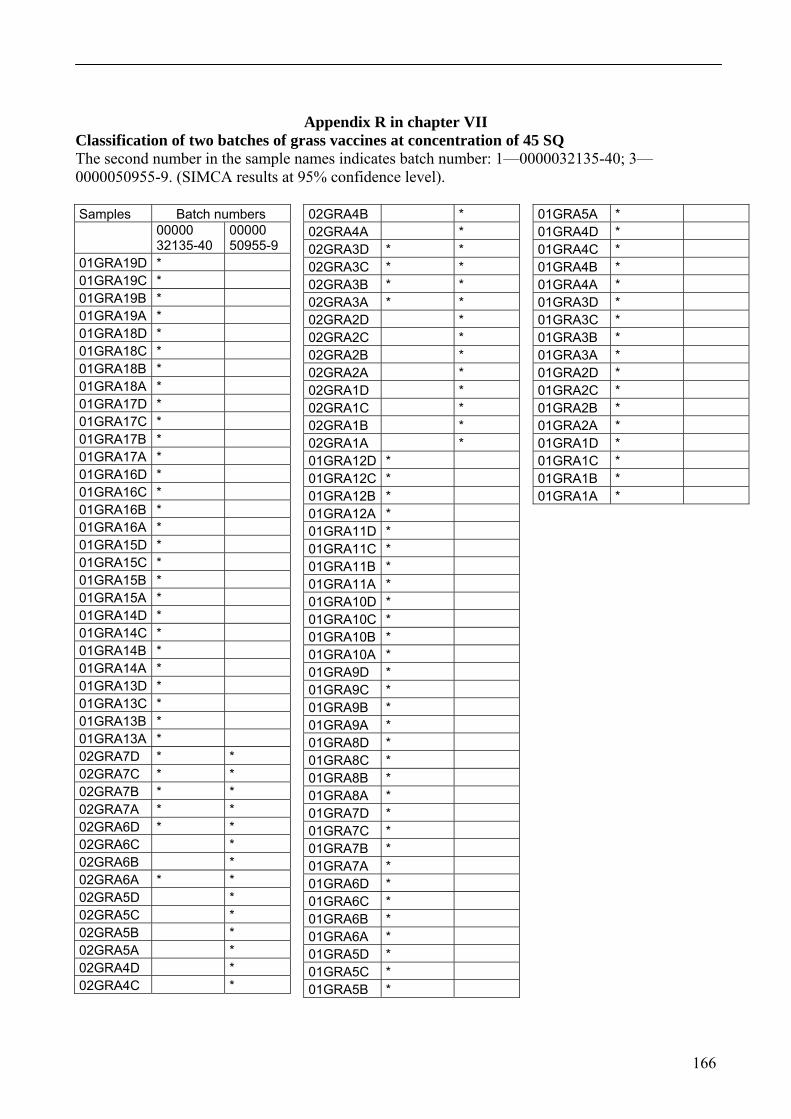
166
Appendix R in chapter VII Classification of two batches of grass vaccines at concentration of 45 SQ The second number in the sample names indicates batch number: 1—0000032135-40; 3—0000050955-9. (SIMCA results at 95% confidence level). Samples Batch numbers
00000 32135-40
00000 50955-9
01GRA19D * 01GRA19C * 01GRA19B * 01GRA19A * 01GRA18D * 01GRA18C * 01GRA18B * 01GRA18A * 01GRA17D * 01GRA17C * 01GRA17B * 01GRA17A * 01GRA16D * 01GRA16C * 01GRA16B * 01GRA16A * 01GRA15D * 01GRA15C * 01GRA15B * 01GRA15A * 01GRA14D * 01GRA14C * 01GRA14B * 01GRA14A * 01GRA13D * 01GRA13C * 01GRA13B * 01GRA13A * 02GRA7D * * 02GRA7C * * 02GRA7B * * 02GRA7A * * 02GRA6D * * 02GRA6C * 02GRA6B * 02GRA6A * * 02GRA5D * 02GRA5C * 02GRA5B * 02GRA5A * 02GRA4D * 02GRA4C *
02GRA4B * 02GRA4A * 02GRA3D * * 02GRA3C * * 02GRA3B * * 02GRA3A * * 02GRA2D * 02GRA2C * 02GRA2B * 02GRA2A * 02GRA1D * 02GRA1C * 02GRA1B * 02GRA1A * 01GRA12D * 01GRA12C * 01GRA12B * 01GRA12A * 01GRA11D * 01GRA11C * 01GRA11B * 01GRA11A * 01GRA10D * 01GRA10C * 01GRA10B * 01GRA10A * 01GRA9D * 01GRA9C * 01GRA9B * 01GRA9A * 01GRA8D * 01GRA8C * 01GRA8B * 01GRA8A * 01GRA7D * 01GRA7C * 01GRA7B * 01GRA7A * 01GRA6D * 01GRA6C * 01GRA6B * 01GRA6A * 01GRA5D * 01GRA5C * 01GRA5B *
01GRA5A * 01GRA4D * 01GRA4C * 01GRA4B * 01GRA4A * 01GRA3D * 01GRA3C * 01GRA3B * 01GRA3A * 01GRA2D * 01GRA2C * 01GRA2B * 01GRA2A * 01GRA1D * 01GRA1C * 01GRA1B * 01GRA1A *

1