webapps.4cd.edu...20181569.001a/ple17r67540 page ii of vi october 20, 2017 © 2017 kleinfelder 6700...
TRANSCRIPT

20181569.001A/PLE17R67540 Page i of vi October 20, 2017 © 2017 Kleinfelder
GEOLOGIC AND SEISMIC HAZARDS ASSESSMENT REPORT C-4016 NEW SCIENCE BUILDING CONTRA COSTA COLLEGE 2600 MISSION BELL DRIVE SAN PABLO, CALIFORNIA PROJECT No.: 20181569.001A
OCTOBER 20, 2017
Copyright 2017 Kleinfelder
All Rights Reserved
ONLY THE CLIENT OR ITS DESIGNATED REPRESENTATIVES MAY USE THIS DOCUMENT AND ONLY FOR THE SPECIFIC PROJECT FOR WHICH THIS REPORT WAS PREPARED.

20181569.001A/PLE17R67540 Page ii of vi October 20, 2017 © 2017 Kleinfelder
6700 Koll Center Parkway, Suite 120, Pleasanton, CA 94566-7032 p | 925.484.1700 f | 925.484.5838
October 20, 2017 Project No.: 20181569.001A Contra Costa Community College District (District) 2600 Mission Bell Drive San Pablo, California 94806 C/O Mr. Ron Johnson [email protected] SUBJECT: Geologic and Seismic Hazards Assessment Report C-4016 New Science Building Contra Costa College 2600 Mission Bell Drive, San Pablo, California Dear Mr. Johnson: Kleinfelder is pleased to present this geologic and seismic hazards assessment report for the planned New Science building at Contra Costa College in San Pablo, California. Figure 1 – Site Vicinity Map and Figure 2 – Site Plan and Geology Map show the approximate location of the planned project within the college campus. The project site is currently occupied by the Liberal Arts and Health Sciences buildings, which are abandoned and earmarked for demolition. This report is intended to identify and characterize potential geologic and seismic hazards at the project site and adjacent area of the campus in order to satisfy and comply with Note 48 guidelines and checklist items prepared by the California Geological Survey (CGS) for public school projects. The CGS reviews geologic and seismic hazard assessment reports for the Division of the State Architect (DSA). Conclusions pertaining to the potential impacts of these geologic hazards on the planned improvements are provided in the report. The accompanying report summarizes the results of our field reconnaissance, data research and review, and engineering geologic interpretations, conclusions, and recommendations. In addition, this report describes the geologic setting, faulting, seismicity, and potential geologic and seismic hazards that could impact the planned project. The primary geologic/seismic hazard considerations performed as part of this assessment include fault-related ground surface rupture, seismically-induced ground failures (liquefaction, lateral spreading, and dynamic compaction), expansive soils, landslides, flooding including from heavy rainstorms, tsunamis and seiches hazards, naturally-occurring asbestos, soil corrosion, and radon gas. Conclusions pertaining to the potential impacts of these geologic and seismic hazards on the planned development are provided in the report. A site-specific Seismic Hazards Analysis has been prepared for this site as part of our scope and is attached hereto in Appendix E. Kleinfelder (2017) has recently prepared a site-specific geotechnical engineering study for the subject project, which was issued under a separate cover and which we list in the References Section of this report.

20181569.001A/PLE17R67540 Page iii of vi October 20, 2017 © 2017 Kleinfelder
KLEINFELDER 6700 Koll Center Parkway, Suite 120, Pleasanton, CA 94566-7032 p | 925.484.1700 f | 925.484.5838
Based on the results of our assessment, it is our opinion that, from an engineering geologic and geotechnical viewpoint, the subject site is considered suitable for the planned project and associated improvements provided that our conclusions and recommendations presented herein and in our concurrent geotechnical engineering report are adhered to and incorporated into the design and construction of the planned new science building. The primary geological and seismic issues of concern are:
1. The project site is situated within the limits of the Alquist-Priolo Earthquake Fault Zone (AP Zone) associated with the active Hayward fault;
2. The proximity of the planned project to the main creeping trace of the Hayward fault;
3. Anticipated strong to violent ground shaking as a result of future seismic events along the Hayward fault and one of the active earthquake faults within the region;
4. The presence of low to highly expansive soils;
5. The presence of undocumented fill; and
6. The potential for highly corrosive soils.
Utilizing subsurface trenching techniques, Kleinfelder and other consultants have evaluated the presence and activity of any secondary sympathetic fault splays associated with the active Hayward fault within the vicinity of the planned new science building. The geologic trenches were excavated and logged in the general vicinity of the project area between 1972 through 2008 as shown on Figure 2. Kleinfelder evaluated these geologic trenches and existing earthquake fault mapping in our report titled Master Plan Seismic Study, Contra Costa College Campus, San Pablo, California, dated July 15, 2009 (Project Number 80412/Report/PLE9R266). In this report, three colored zones were delineated across the campus as follows:
• Red – indicating the presence of active faulting and the limits of a setback zone excluding the construction of structures intended for human habitation and occupancy;
• Yellow – areas that have yet to be cleared of secondary fault traces and that would require additional exploration to assess faulting; and
• Green – habitable zones where it has been demonstrated that no active faults exist and no additional studies would be needed to clear the area for development including structures intended for human habitation and occupancy.
The report concluded, based on existing available data, that the Liberal Arts and Health Sciences buildings were free of active fault traces and the surrounding trenches provided enough coverage and “shadowing” for possible fault traces in a northwestwardly trend. Therefore, the buildings were placed within the green-zone. However, the report concluded that there should be a 50-foot setback zone established on the northeast side of the Liberal Arts building from the western most fault observed in the trenches excavated by Harding-Lawson and Associates in 1972/1973 for the then proposed Physical Sciences building addition. Based on the above information, the currently planned location of the New Science building will be situated within the habitable zone colored green on the campus-wide seismic and fault setback map, which we utilize as base for Figure 2 of this report. The colored zones were further evaluated and adjusted by Kleinfelder in 2011 per the recommendations of CGS. Our conclusions and recommendations were provided in our letter report titled Re-Assessment of Fault-Related Exclusionary Boundaries Pertaining to Habitable Structures for the Campus Center Project/New Student Activities Building Proposed within the

20181569.001A/PLE17R67540 Page iv of vi October 20, 2017 © 2017 Kleinfelder
KLEINFELDER 6700 Koll Center Parkway, Suite 120, Pleasanton, CA 94566-7032 p | 925.484.1700 f | 925.484.5838
Contra Costa College Campus in San Pablo, California, dated March 24, 2011 (Project Number 112252/PWPORTABLES/PLE11L027). The green-zone was further adjusted to the southwest near the Liberal Arts and Health Sciences buildings. As noted above, our concurrent geotechnical engineering study for the subject project (Kleinfelder, 2017) provided conclusions and recommendations pertaining to grading, drainage, foundation design, and earthwork recommendations. Seismic design recommendations were presented in the site-specific ground motions seismic analysis report attached hereto in Appendix E. The geotechnical report also presented recommendations to mitigate potential fill settlement any potentially adverse geologic conditions associated with soil expansion and corrosion. We understand that the existing Liberal Arts building has sustained some distress, which may be related to the presence of undocumented fill or the magnitude of grading and type of foundations utilized. This assessment was performed based on conclusions developed from the review of published studies and maps, nearby site-specific evaluations, a site reconnaissance visit by our project Engineering Geologist, results of geologic trenching studies referenced, review of subsurface information obtained from our concurrent preliminary geotechnical engineering study, and our experience with this college campus and similar projects. If you have any questions regarding the information or recommendations presented in our report, please contact us at your convenience at (925) 484-1700. Sincerely, KLEINFELDER, INC. Omar Khan Sadek M. Derrega, PG, CEG #2175 Project Geologist Senior Principal Engineering Geologist OK/SMD/jmk

20181569.001A/PLE17R67540 Page v of vi October 20, 2017 © 2017 Kleinfelder
GEOLOGIC AND SEISMIC HAZARDS ASSESSMENT REPORT
C-4016 NEW SCIENCE BUILDING CONTRA COSTA COLLEGE 2600 MISSION BELL DRIVE SAN PABLO, CALIFORNIA
TABLE OF CONTENTS
1 INTRODUCTION ............................................................................................................. 1
SITE LOCATION AND DESCRIPTION ............................................................. 1
PURPOSE AND SCOPE OF SERVICES .......................................................... 2
2 GEOLOGIC SETTING ..................................................................................................... 5
REGIONAL GEOLOGY .................................................................................... 5
AREA AND SITE GEOLOGY ........................................................................... 6
SITE RECONNAISSANCE ............................................................................... 7
SUBSURFACE CONDITIONS .......................................................................... 7
3 FAULTING AND SEISMICITY......................................................................................... 9
4 CONCLUSIONS - GEOLOGIC AND SEISMIC HAZARDS ........................................... 10
FAULT-RELATED GROUND SURFACE RUPTURE ..................................... 10
SEISMICALLY-INDUCED GROUND FAILURE .............................................. 10
4.2.1 Liquefaction and Lateral Spreading .................................................. 10
4.2.2 Dynamic (Seismic) Compaction ........................................................ 11
EXPANSIVE SOILS ........................................................................................ 11
EXISTING FILL ............................................................................................... 11
LANDSLIDES ................................................................................................. 12
TSUNAMIS, SEICHES, AND FLOODING ...................................................... 12
NATURALLY-OCCURRING ASBESTOS ....................................................... 13
SOIL CORROSION......................................................................................... 13
RADON GAS .................................................................................................. 15
VOLCANIC ACTIVITY .................................................................................... 16
BEDROCK RIPPABILITY ............................................................................... 16
5 REFERENCES .............................................................................................................. 17
20181569.001A/PLE17R67540 Page vi of vi October 20, 2017 © 2017 Kleinfelder
GEOLOGIC AND SEISMIC HAZARDS ASSESSMENT REPORT
C-4016 NEW SCIENCE BUILDING CONTRA COSTA COLLEGE 2600 MISSION BELL DRIVE SAN PABLO, CALIFORNIA
TABLE OF CONTENTS
(CONTINUED)
FIGURES
Figure 1 Site Vicinity Map Figure 2 Site Plan and Geology Map Figure 3 Regional Geology Map Figure 4 Area Geology Map
Figure 5 Geologic Cross Sections A-A’ and B-B’
APPENDICES
APPENDIX A Boring Logs (this study)
APPENDIX B Laboratory Data (this study)
APPENDIX C Boring Logs and Trench Logs from Previous Kleinfelder Studies
APPENDIX D Corrosion Results
APPENDIX E Site-Specific Seismic Analysis
20181569.001A/PLE17R67540 Page 1 of 20 October 20, 2017 © 2017 Kleinfelder
1 INTRODUCTION
This report presents the results of Kleinfelder’s geologic and seismic hazards assessment for the
planned new science building at Contra Costa College in San Pablo, California. The approximate
location of the school campus is shown on the Site Vicinity Map (Figure 1) and the approximate
limits of the planned new science center are shown on the Site Plan and Geology Map (Figure 2).
This report has been prepared for submittal with supporting design documents to the Division of
the State Architect (DSA), as required for new construction of public schools and essential
services facilities. This report addresses the potential geologic and seismic hazards that could
impact the site as required by the California Geological Survey (CGS) Note 48, which may be
incorporated into future projects with appropriate updates of the information presented herein.
The updates should include site-specific borings and/or Cone Penetration Tests (CPTs),
reconnaissance for individual projects by qualified personnel, and evaluation of the data to confirm
that it is consistent with this report.
Kleinfelder has vast experience at the campus. That experience, coupled with our concurrent
geotechnical engineering study for the planned New Science building were relied on to
characterize the subsurface conditions. For the concurrent geotechnical engineering study we
drilled four soil borings at the planned New Science building site on August 11 and 18, 2017 to a
depth of approximately 31 to 41½ feet deep. The approximate locations of the borings are shown
on Figure 2. The subsurface conditions revealed by the borings drilled by Kleinfelder as part of
the concurrent geotechnical study and our previous experience at the campus were utilized to
characterize the potential for and magnitude of liquefaction at the project site and to generate
engineering recommendations pertaining to grading, drainage, foundation design, and
construction considerations for the planned new science center.
SITE LOCATION AND DESCRIPTION
The western part of the campus is located mostly on a level alluvial plain west of Rheem Creek.
The eastern portion of the campus slopes upward to the northeast. The active Hayward fault,
which crosses the campus, approximately separates the flat lying portion of the campus with the
elevated/hillside portion of the campus. Rheem Creek flows through the campus in a
northwesterly direction generally parallel to the base of the hillside. Most of the academic buildings
on the campus are located on the hillside portion of the campus, while the flat lying portion of the
campus contains mostly the athletic buildings and facilities. The ground surface elevation at the
20181569.001A/PLE17R67540 Page 2 of 20 October 20, 2017 © 2017 Kleinfelder
campus ranges from about 50 feet above mean sea level along the southwestern margin of the
campus to about 130 feet in the northeast corner along Campus Drive.
We understand that the campus plans to demolish the existing abandoned Liberal Arts and Health
Sciences buildings and construct a new 3-story building with an approximate footprint of up to
about 20,000 square feet. It is anticipated that cuts up to about 20 to 40 fee can be anticipated to
achieve finished grades. This could change since the project is currently in conceptual design
phase. Structural loads are assumed to be less than 300 kips for column loads. It is anticipated
that the structure will be founded on shallow spread footings. The final layout of the building has
not been determined at this time.
The existing buildings are currently situated northeast of Rheem Creek along the elevated portion
of the campus. As shown of Figure 2, the buildings are situated in between the Physical Sciences
building (located to the northeast), Administrative and Applied Arts building (located to the
southeast), and Library and Learning Resource Center (located to the west). In between the
Library and Learning Resource Center and Liberal Arts and Health Sciences buildings there is an
open, grass covered courtyard area gently sloping to the southwest. A fire access road runs
parallel with the Liberal Arts and Health Sciences buildings along the northeastern end of the
buildings, situated at a higher topographic level than the grass covered open area. The project
site generally slopes to the southwest. Sloped walkways and stairways are located around the
buildings.
According to the U.S. Geological Survey (USGS, 1993) 7½-Minute Richmond Topographic
Quadrangle map, the existing ground elevation at the site ranges between about 70 and 100 feet
above mean sea level. The coordinates at the center of the planned new science center location
are approximately:
Latitude: 37.969664° N
Longitude: -122.336584° W
PURPOSE AND SCOPE OF SERVICES
The purpose of our geologic and seismic hazards assessment is to identify potential geologic and
seismic hazards and conditions that could adversely impact development of the proposed new
science center or restrict its overall use. Our scope of services included a site reconnaissance by
a Certified Engineering Geologist (CEG), review of readily available published geotechnical data
and unpublished site-specific geologic and seismic evaluations, and the subsurface exploration

20181569.001A/PLE17R67540 Page 3 of 20 October 20, 2017 © 2017 Kleinfelder
and laboratory data obtained during our concurrent geotechnical engineering investigation. The
objectives of this report are the identification and assessment of potential geologic and seismic
hazards at the site in accordance with the requirements of the current California Code of
Regulations, Title 24, 2016 CBC using guidelines outlined by the CGS. In addition to these
requirements, this report has been prepared in accordance with the guidelines established in the
following documents:
• California Department of Conservation, Division of Mines and Geology (DMG, currently
known as the California Geological Survey [CGS]) Special Publication 117A (Guidelines
for Evaluating and Mitigating Seismic Hazards);
• CGS Note 41 (Guidelines for Reviewing Geologic Reports)
• DMG Special Publication 42 (Fault-Rupture Hazard Zones in California);
• DMG Note 42 (Guidelines to Geologic/Seismic Reports);
• DMG Note 44 (Recommended Guidelines for Preparing Engineering Geologic Reports);
• CGS Note 48 (Checklist for the Review of Engineering Geology and Seismology Reports
for California Public Schools, Hospitals, and Essential Services Buildings); and
• DSA IR A-4.13 (Geohazard Report Requirements: 2013 & 2016 CBC).
Specifically, our scope of services included the following:
• Review of the regional and local geologic and seismic setting of the site and surrounding
area, including research and review of available geologic/seismic reports published by the
USGS and the CGS, and a review of available geologic and geotechnical site-specific
studies performed by Kleinfelder.
• Performing a reconnaissance of the site and adjacent areas by our CEG.
• Reviewing subsurface geotechnical soil borings and geologic trench data including depth
to groundwater, from the published literature and site-specific previous geotechnical
investigations.
• Preparing this Geologic and Seismic Hazards Assessment report for the site that covers
the checklist items in CGS Note 48, and which presents the conclusions and results of our
study. The report may include the following:
a) A site vicinity map;
b) A site plan and geology map
c) An area geologic map;
d) A regional geology map;
e) A geologic cross section(s);
f) Regional fault and historic seismicity map;

20181569.001A/PLE17R67540 Page 4 of 20 October 20, 2017 © 2017 Kleinfelder
g) A description of regional geology, area geology, and nearby seismic sources
(faults);
h) Discussion of the site location as it pertains to the Alquist-Priolo Earthquake Fault
Zone pertaining to liquefaction and slope stability;
i) A description of the site’s seismicity;
j) Conducting a site specific ground motion analysis; and
k) Conclusions regarding:
1. Fault-related ground surface rupture;
2. Seismically-induced ground failures including liquefaction, lateral spreading, and
dynamic compaction;
3. Expansive soils, collapsible, peaty, or compressible soils;
4. Presence of undocumented fill soils;
5. Slope stability and landslides (seismically-induced or otherwise);
6. Flooding, tsunami-related hazard, and seiches;
7. Naturally-occurring asbestos;
8. Radon gas; and
9. Soil corrosion.
Our current scope excluded an assessment of pipeline locations within 1,500 feet of the project
site. Our evaluation also specifically excluded the assessment of environmental spills and
hazardous substances at the site.
20181569.001A/PLE17R67540 Page 5 of 20 October 20, 2017 © 2017 Kleinfelder
2 GEOLOGIC SETTING
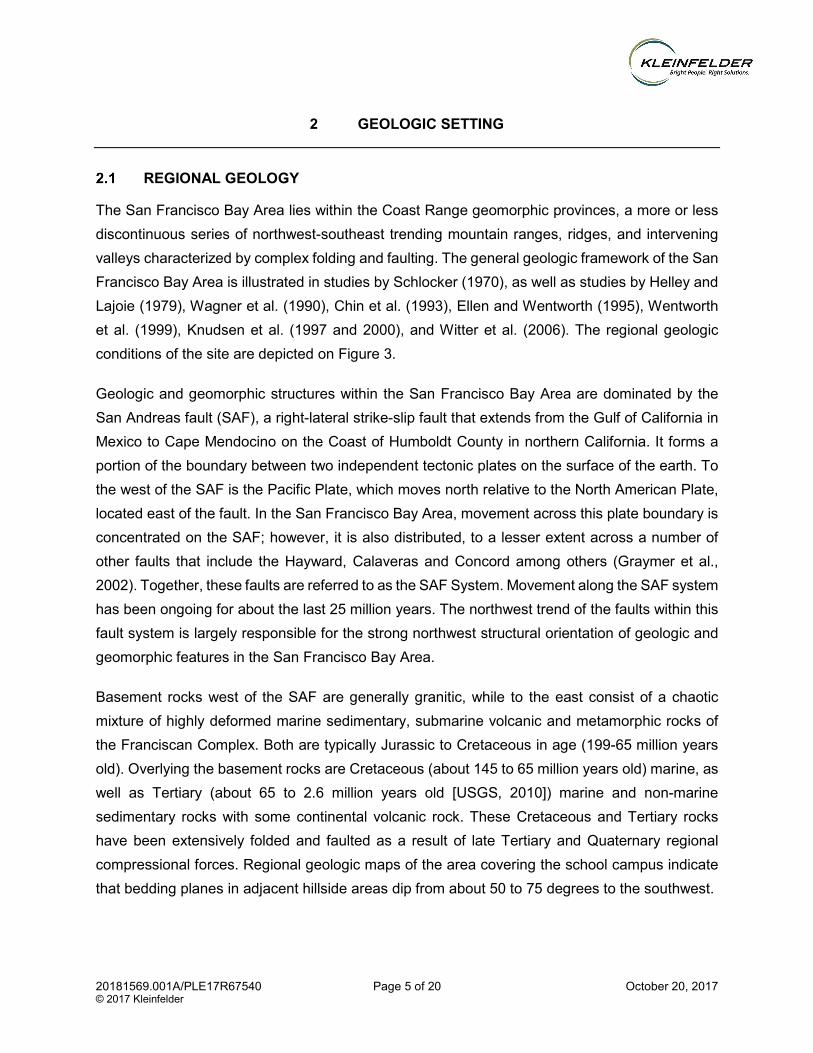
REGIONAL GEOLOGY
The San Francisco Bay Area lies within the Coast Range geomorphic provinces, a more or less
discontinuous series of northwest-southeast trending mountain ranges, ridges, and intervening
valleys characterized by complex folding and faulting. The general geologic framework of the San
Francisco Bay Area is illustrated in studies by Schlocker (1970), as well as studies by Helley and
Lajoie (1979), Wagner et al. (1990), Chin et al. (1993), Ellen and Wentworth (1995), Wentworth
et al. (1999), Knudsen et al. (1997 and 2000), and Witter et al. (2006). The regional geologic
conditions of the site are depicted on Figure 3.
Geologic and geomorphic structures within the San Francisco Bay Area are dominated by the
San Andreas fault (SAF), a right-lateral strike-slip fault that extends from the Gulf of California in
Mexico to Cape Mendocino on the Coast of Humboldt County in northern California. It forms a
portion of the boundary between two independent tectonic plates on the surface of the earth. To
the west of the SAF is the Pacific Plate, which moves north relative to the North American Plate,
located east of the fault. In the San Francisco Bay Area, movement across this plate boundary is
concentrated on the SAF; however, it is also distributed, to a lesser extent across a number of
other faults that include the Hayward, Calaveras and Concord among others (Graymer et al.,
2002). Together, these faults are referred to as the SAF System. Movement along the SAF system
has been ongoing for about the last 25 million years. The northwest trend of the faults within this
fault system is largely responsible for the strong northwest structural orientation of geologic and
geomorphic features in the San Francisco Bay Area.
Basement rocks west of the SAF are generally granitic, while to the east consist of a chaotic
mixture of highly deformed marine sedimentary, submarine volcanic and metamorphic rocks of
the Franciscan Complex. Both are typically Jurassic to Cretaceous in age (199-65 million years
old). Overlying the basement rocks are Cretaceous (about 145 to 65 million years old) marine, as
well as Tertiary (about 65 to 2.6 million years old [USGS, 2010]) marine and non-marine
sedimentary rocks with some continental volcanic rock. These Cretaceous and Tertiary rocks
have been extensively folded and faulted as a result of late Tertiary and Quaternary regional
compressional forces. Regional geologic maps of the area covering the school campus indicate
that bedding planes in adjacent hillside areas dip from about 50 to 75 degrees to the southwest.

20181569.001A/PLE17R67540 Page 6 of 20 October 20, 2017 © 2017 Kleinfelder
The inland valleys, as well as the structural depression within which the San Francisco Bay is
located, are filled with unconsolidated to semi-consolidated continental deposits of Quaternary
age (about the last 2.6 million years). Continental surficial deposits (alluvium, colluvium, and
landslide deposits) consist of unconsolidated to semi-consolidated sand, silt, clay, and gravel
while the Bay deposits typically consist of very soft organic-rich silt and clay (Bay mud) or sand.
AREA AND SITE GEOLOGY
Geologic maps emphasizing bedrock formations in the vicinity of the site have been prepared by
Weaver (1949), Sheehan (1956), Wagner (1990), Dibblee (1980), Graymer et al. (1994), and
Crane (1995) among others. Weaver (1949), Dibblee (1980), and Graymer et al. (1994) mapped
the bedrock as Tertiary age (Late Miocene to Pliocene) Orinda Formation. Sheehan (1956),
however, mapped the Tertiary strata near Point Pinole as undifferentiated Contra Costa Group
following the suggestion of Savage, Ogle, and Creely (1951). Wagner (1978) mapped exposures
of the undifferentiated Contra Costa Group in the vicinity of the site as the “Garrity Member.”
Graymer et al. (1994) described the Orinda Formation as non-marine, conglomerate, sandstone
and siltstone with abundant rock clasts that have been derived from the Franciscan Complex and
other Cretaceous age rocks. Wagner (1978) distinguished the “Garrity Member” from the Orinda
Formation and other members of the Contra Costa Group by the presence of significant quantities
of reworked Monterey formation detritus such as siliceous shale and chert.
Localized studies, which emphasize the Quaternary (younger than approximately 2.6 million years
old) geology in the general area of the site, have been prepared by Helley et al. (1979), Knudsen
et al. (1997), Helley and Graymer (1997), Graymer (2000) and Witter, et al. (2006). Generally, the
unconsolidated alluvial deposits of Pleistocene age are mapped along slightly elevated areas,
while the younger Holocene alluvial deposits are mapped blanketing level zones or young creek
channels and drainage courses. Based on information obtained from the extensive fieldwork at
the campus during previous fault trench studies, we mapped the level areas of the campus as
being underlain by Holocene basin deposits and Holocene fine- to coarse-grained channel
deposits near Rheem Creek. The Holocene deposits are presumably underlain by a thicker
sequence of older (Pleistocene age) alluvium that is underlain, in turn, by the terrestrial
sedimentary bedrock of the Garrity Member of the Contra Costa Group.
According to Graymer (2000), the project site is underlain by late Miocene Orinda formation (map
symbol Tor), as shown on Figure 4, Area Geology Map. The Orinda formation is described by
Graymer (2000) as distinctly to indistinctly bedded, non-marine, pebble to boulder conglomerate,
conglomeratic sandstone, coarse- to medium-grained lithic sandstone, and green and red
20181569.001A/PLE17R67540 Page 7 of 20 October 20, 2017 © 2017 Kleinfelder
siltstone and mudstone. Conglomerate clasts are subangular to well rounded, and contain a high
percentage of detritus derived from the Franciscan complex.
SITE RECONNAISSANCE
A Certified Engineering Geologist with our firm performed a site reconnaissance of the project
area during middle October 2017 and observed site conditions. The site and surrounding areas
are occupied by structures and appear to have been developed completely as part of the college
center as far back as the early 1990s on available aerial photographs. The Rheem Creek channel
appears to have been shifted southwestward slightly between 1939 and 1993. The area remained
essentially unaltered until the recent college center renovations.
SUBSURFACE CONDITIONS
The subsurface conditions described herein are based on the soil and groundwater conditions
encountered during the current and previous geologic and geotechnical investigations in the
vicinity of the site area. The project site subsurface consists mostly of fill and native soils underlain
by claystone. The fill was encountered in borings B-3 and B-4 measuring between about 8 to 13
feet and generally consisting of very stiff to hard sandy clays. The native soil consisted stiff sandy
clays interbedded with clayey sands and gravels, which in turn were underlain by weathered
claystone. The claystone was generally weak to strong, moderately to highly weathered, and highly
fractured.
Groundwater was not observed and encountered in our current borings. However, groundwater
was observed in our previous borings and fault trenches at depths of about 9 to 23 feet below the
ground surface. It should be noted that groundwater levels can fluctuate depending on factors such
as seasonal rainfall and construction activities on this or adjacent properties, and may rise several
feet during a normal rainy season.
The above is a general description of soil and groundwater conditions encountered in the borings
from this investigation and our experience at the campus. More detailed descriptions of the
subsurface conditions encountered are presented in the Boring Logs on Figures A-4 and A-7 in
Appendix A, and on the Boring Logs, and fault trenches from our previous investigations presented
in Appendix C.
20181569.001A/PLE17R67540 Page 8 of 20 October 20, 2017 © 2017 Kleinfelder
Soil and groundwater conditions can deviate from those conditions encountered at the boring
locations. If significant variations in the subsurface conditions are encountered during
construction, Kleinfelder should be notified immediately, and it may be necessary for us to review
the recommendations presented herein and recommend adjustments as necessary.

20181569.001A/PLE17R67540 Page 9 of 20 October 20, 2017 © 2017 Kleinfelder
3 FAULTING AND SEISMICITY
The faulting and seismicity of the site and surrounding areas, including a site-specific ground
motion analysis is discussed in Appendix E of this report.

20181569.001A/PLE17R67540 Page 10 of 20 October 20, 2017 © 2017 Kleinfelder
4 CONCLUSIONS - GEOLOGIC AND SEISMIC HAZARDS
Discussion and conclusions regarding specific geologic hazards, which could impact the site, are
included below. The hazards considered include: fault-related ground surface rupture,
seismically-induced ground failures (liquefaction, lateral spreading, and dynamic
compaction/seismic settlement), expansive soils, landslides, tsunami/seiches, flooding, naturally-
occurring asbestos, soil corrosion, radon gas, and existing fill.
FAULT-RELATED GROUND SURFACE RUPTURE
Much of the campus, including the project site, is located within an Alquist-Priolo Earthquake Fault
Zone, associated with the active Hayward fault. Evidence of fault creep across the campus has
been documented for several decades (CDMG, 1980) and was observed and mapped during
previous site reconnaissance and studies by our project CEG. Therefore, it is our opinion that the
potential for continued surface creep along the main fault trace located to the west/southwest of
the project site is high. Because the Hayward fault is known to be active and has been the locus
of historic earthquakes with associated ground rupture, the potential for future ground rupture
during an earthquake along active traces of this fault within the Contra Costa College campus
cannot be ruled out. However, based on historic performance, the knowledge that the main trace
is more than more than 400 feet to the southwest from the planned project site, and the knowledge
that the Hayward fault ground surface rupture is generally contained along the trace itself and
generally not extending for hundreds of feet laterally, we conclude that the potential for fault-
related ground surface rupture to impact the planned project is considered low.
SEISMICALLY-INDUCED GROUND FAILURE
4.2.1 Liquefaction and Lateral Spreading
Soil liquefaction is a condition where saturated, granular soils undergo a substantial loss of
strength and deformation due to pore pressure increase resulting from cyclic stress application
induced by earthquakes. In the process, the soil acquires mobility sufficient to permit both
horizontal and vertical movements if the soil mass is not confined. Soils most susceptible to
liquefaction are saturated, loose, clean, uniformly graded, and fine-grained sand deposits. If
liquefaction occurs, foundations resting on or within the liquefiable layer may undergo settlements.
This will result in reduction of foundation stiffness and capacities.

20181569.001A/PLE17R67540 Page 11 of 20 October 20, 2017 © 2017 Kleinfelder
The campus lies with the Richmond 7.5 Minute Quadrangle, which was partially mapped by CGS
during its ongoing effort to map landslide and liquefaction related hazards throughout the San
Francisco Bay Area. However, the campus does not lie within the area mapped by CGS. There
are no recorded signs of ground failures associated with past earthquakes in Northern California
within about 4 km of the project site (Youd and Hoose, 1978). No historic ground failures were
reported within approximately 6½ km of the site in the mapped results of Holzer (1998) as a result
of the 1989 M6.9 Loma Prieta earthquake.
Based on the subsurface data obtained from our previous and recent investigations at the
campus, the project site subsurface consists mostly of interbedded layers of firm to hard fine-
grained clayey soils underlain by bedrock. As a result, liquefaction potential at the site is
considered minimal due to the soil types encountered.
4.2.2 Dynamic (Seismic) Compaction
Another type of seismically-induced ground failure, which can occur as a result of seismic shaking,
is dynamic compaction, or seismic settlement. Such phenomena typically occur in unsaturated,
loose granular material or uncompacted fill soils. The subsurface conditions encountered in our
borings are not considered conducive to such seismically-induced ground failures since our
borings indicate the fill to be comprised mostly of lean to fat clay soils with sand. For this reason
we conclude that the potential for shaking related random ground cracking to affect the site and
surrounding areas is low.
Furthermore, recommendations have been provided in our concurrent geotechnical engineering
investigation (Kleinfelder, 2017) to address the presence of the reported undocumented fill.
EXPANSIVE SOILS
Based on the results of our concurrent field investigation and laboratory testing program, near-
surface soils located within the building site are low to highly expansive. Pertinent mitigation
measures addressing the potential presence of expansive soils at the site are presented in our
concurrent geotechnical investigation report (Kleinfelder, 2017) for the site.
EXISTING FILL
Fill measuring between 8 to 13 feet was encountered in our borings B-3 and B-4 which was
comprised of interbedded very stiff to hard sandy clays. Our concurrent geotechnical study
evaluated the presence of the noted undocumented fill and presented recommendations to
mitigate.

20181569.001A/PLE17R67540 Page 12 of 20 October 20, 2017 © 2017 Kleinfelder
LANDSLIDES
No landslides are mapped in the project area nor did we observe any slope creep or cracks.
Therefore, it is our opinion that the potential for seismically induced (or otherwise) landslides and
slope failure to occur at the proposed site is considered low.
Rheem Creek is located approximately 200 feet southwest of the project site. Small, shallow
localized creek bank sloughing or slumping may occur during a moderate to major seismic event,
especially if the slopes are saturated. We would not expect such failures to extend more than
approximately 10 feet from the current top of banks. The creek banks do appear to exhibit
evidence of soil creep and it is our opinion that soil creep will continue along these banks and
could affect any improvements within 10 feet of the top of banks if not mitigated.
TSUNAMIS, SEICHES, AND FLOODING
Flood hazards are generally considered from three sources:
• Seismically-induced waves (tsunami or seiche);
• Dam failure inundation; and
• Long-cycle storm events.
The site is located more than a mile southeast of the San Pablo Bay at an estimated elevation of
about 80 feet above mean sea level. The only historical account of tsunamis impacting the San
Francisco Bay area is the “Good Friday” earthquake of 1964 (generated off the coast of Alaska).
Run-up at the Golden Gate Bridge was measured at 7.4 feet from the Good Friday earthquake
and generally less further to the east. Ritter and Dupre (1972) indicate that the coastal lowland
areas, immediately adjacent to San Francisco Bay, are subject to possible inundation from a
tsunami with a run up height of 20 feet at the Golden Gate Bridge. Ritter and Dupre’s 1972 map
does not show the site area to be within an area that could become inundated by tsunami waves.
In addition, the California Emergency Management Agency (CalEMA) in concert with CGS and
the University of Southern California have prepared tsunami inundation maps for emergency
planning in 2009 and these maps indicate that tsunami generated waves will not reach the site
area due to its distance from the Bay and prominent water courses.
Based on the above-noted references, the site’s distance from the Bay, topographical elevation,
and the lack of historically damaging tsunamis and seiches, we judge that the potential for a
seismically-induced wave to impact the site should be considered negligible.

20181569.001A/PLE17R67540 Page 13 of 20 October 20, 2017 © 2017 Kleinfelder
The Association of Bay Area Governments (ABAG, 1995) prepared maps that show areas that
may be inundated by flood water if nearby dams are overtopped or fail catastrophically. According
to ABAG, the site could be inundated by 5 different dams. Based on these maps, the potential for
flooding to occur at the site due to nearby dam failure should be considered high.
The East Bay Municipal Utility District North Reservoir, a ground level covered structure, is located
approximately ½-mile northeast of the project site near Highland Elementary School. The San
Pablo Reservoir/Dam is location approximately 4½ miles southeast of the project site. If these
reservoirs were to fail during a seismic event, the project site would flood.
With respect to the 100-year storm events, the Federal Emergency Management Agency’s
(FEMA, 2009) Flood Insurance Rate Map, Community-Panel Number 06013C0227G, effective
date September 30, 2015, indicates that the site is located within Zone X, which is defined as
areas determined to be outside the 0.2% annual chance flood plain.
NATURALLY-OCCURRING ASBESTOS
The geologic units that underlie the site (Contra Costa Group, alluvium) are not generally known
to contain naturally occurring asbestos (NOA). However, the Contra Costa Group contains many
conglomerate beds which received sediment/clasts from Franciscan sources during its time of
deposition. Therefore, the presence of occasional clasts made up of rock types which may contain
NOA (such as serpentinite) cannot be ruled out. The closest mapped formation, which may
contain NOA is ultramafic rock located approximately 1½ miles to the southeast according to
Graymer et al. (1994) and Churchill and Hill (2000). It is our opinion that the potential for NOA to
impact the proposed development at the site is low.
SOIL CORROSION
Kleinfelder has completed laboratory testing to provide data regarding corrosivity of onsite soils.
The testing was performed by a State of California certified laboratory, CERCO Analytical of
Concord, California on a selected sample of the near-surface soils. Our scope of services does
not include corrosion engineering and, therefore, a detailed analysis of the corrosion test results
is not included in this report. A qualified corrosion engineer should be retained to review the test
results and design protective systems that may be required. Kleinfelder may be able to provide
those services.
20181569.001A/PLE17R67540 Page 14 of 20 October 20, 2017 © 2017 Kleinfelder
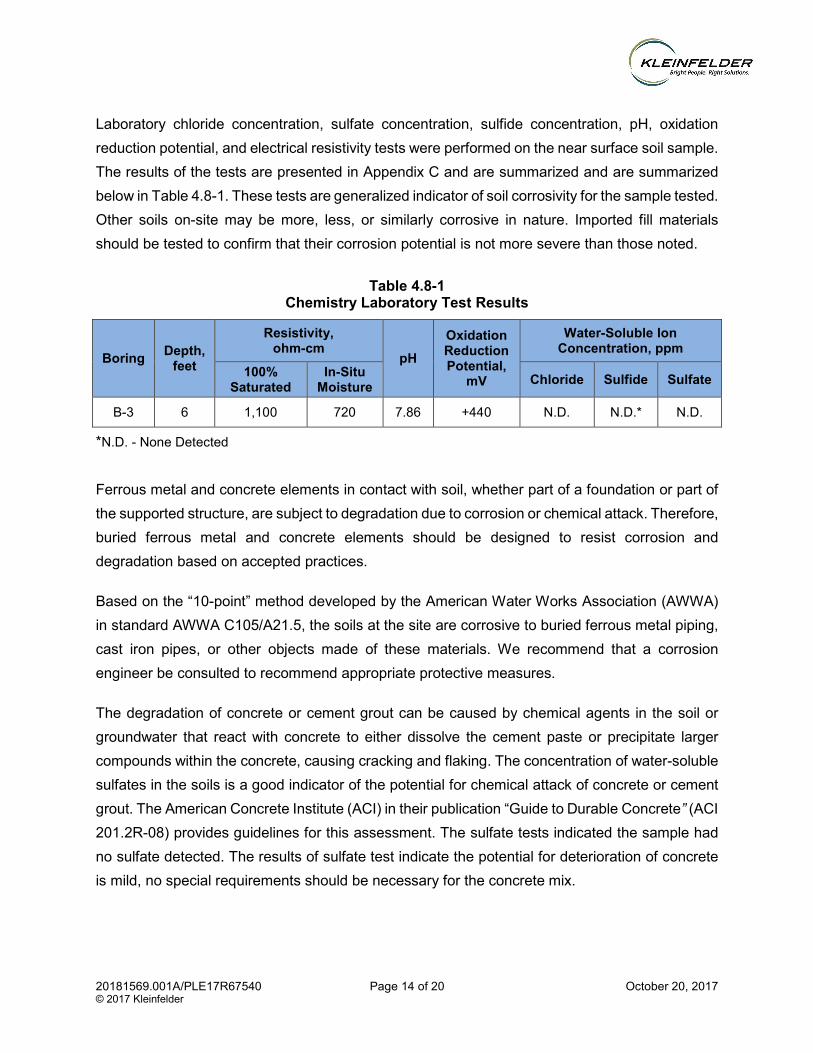
Laboratory chloride concentration, sulfate concentration, sulfide concentration, pH, oxidation
reduction potential, and electrical resistivity tests were performed on the near surface soil sample.
The results of the tests are presented in Appendix C and are summarized and are summarized
below in Table 4.8-1. These tests are generalized indicator of soil corrosivity for the sample tested.
Other soils on-site may be more, less, or similarly corrosive in nature. Imported fill materials
should be tested to confirm that their corrosion potential is not more severe than those noted.
Table 4.8-1 Chemistry Laboratory Test Results
Boring Depth,
feet
Resistivity, ohm-cm
pH
Oxidation Reduction Potential,
mV
Water-Soluble Ion Concentration, ppm
100% Saturated
In-Situ Moisture
Chloride Sulfide Sulfate
B-3 6 1,100 720 7.86 +440 N.D. N.D.* N.D.
*N.D. - None Detected
Ferrous metal and concrete elements in contact with soil, whether part of a foundation or part of
the supported structure, are subject to degradation due to corrosion or chemical attack. Therefore,
buried ferrous metal and concrete elements should be designed to resist corrosion and
degradation based on accepted practices.
Based on the “10-point” method developed by the American Water Works Association (AWWA)
in standard AWWA C105/A21.5, the soils at the site are corrosive to buried ferrous metal piping,
cast iron pipes, or other objects made of these materials. We recommend that a corrosion
engineer be consulted to recommend appropriate protective measures.
The degradation of concrete or cement grout can be caused by chemical agents in the soil or
groundwater that react with concrete to either dissolve the cement paste or precipitate larger
compounds within the concrete, causing cracking and flaking. The concentration of water-soluble
sulfates in the soils is a good indicator of the potential for chemical attack of concrete or cement
grout. The American Concrete Institute (ACI) in their publication “Guide to Durable Concrete” (ACI
201.2R-08) provides guidelines for this assessment. The sulfate tests indicated the sample had
no sulfate detected. The results of sulfate test indicate the potential for deterioration of concrete
is mild, no special requirements should be necessary for the concrete mix.

20181569.001A/PLE17R67540 Page 15 of 20 October 20, 2017 © 2017 Kleinfelder
Concrete and the reinforcing steel within it are at risk of corrosion when exposed to water-soluble
chloride in the soil or groundwater. Chloride tests indicated the sample had no chloride detected.
The project structural engineer should review this data to determine if remedial measures are
necessary for the concrete reinforcing steel.
RADON GAS
Radon gas is a naturally-occurring colorless, tasteless, and odorless radioactive gas that forms
in soils from the decay of trace amounts of uranium that are naturally present in soils. Radon
enters buildings from the surrounding soil through cracks or other openings in foundations, floors
over crawlspaces, or basement walls. Once inside a building, radon can become trapped and
concentrate to become a health hazard unless the building is properly ventilated to remove radon.
Long-term exposure to elevated levels of radon increases one’s risk of developing lung cancer.
The U.S. Environmental Protection Agency (EPA) recommends that all homes (or structures
intended for human occupancy) be tested for radon whatever their geographic location. The U.S.
EPA recommends that action be taken to reduce radon in structures with an average annual level
higher than four picocuries per liter (4.0pCi/l).
The California Department of Public Health services (2016) performed 52 tests within Zip Code
94806 (last updated on February 2016) where the school campus is located. Of the 52 tests, none
reported a minimum of four (4) picocuries per liter (pCi/L). The maximum results reported was 2.3
pCi/L.
The noted testing is not intended to represent the entire zip code area for determining which
buildings have excessive indoor radon levels. In addition to geology, indoor radon levels can be
influenced by local variability in factors such as soil permeability and climatic conditions, and by
factors such as building design, construction, condition, and usage. Consequently, building
specific radon levels can only be determined by indoor radon testing.
Based on the above information, consideration should be given to consult a radon specialist to
provide appropriate tests and recommendations to review this concern.
Additional information about radon gas can be found at the following websites:
California Department of Public Health – Indoor Radon Program:
https://www.cdph.ca.gov/Programs/CEH/DRSEM/Pages/EMB/Radon/Radon.aspx

20181569.001A/PLE17R67540 Page 16 of 20 October 20, 2017 © 2017 Kleinfelder
California Geological Survey-Mineral Resources Program:
http://www.conservation.ca.gov/cgs/minerals/hazardous_minerals/radon/Pages/Index.aspx
U.S. EPA: https://www.epa.gov/radon
VOLCANIC ACTIVITY
There are no known active volcanic sources within the region, therefore the potential for volcanic
hazards to impact this site are considered non-existent.
BEDROCK RIPPABILITY
Excavations can be performed by conventional earthmoving equipment. However, during site
grading, foundation and utility trench excavation, localized zones of strong to very strong bedrock,
resulting in hard digging, may be encountered. Contractor(s) and subcontractors should expect
hard drilling, digging, and excavating and should be prepared to use heavy ripping and excavating
equipment, including hydraulic hammers and/or hoe-ram equipment.
20181569.001A/PLE17R67540 Page 17 of 20 October 20, 2017 © 2017 Kleinfelder
5 REFERENCES
Bryant, W.A. and Hart, E.W., 1997, Fault-Rupture Hazard Zones in California: California Division
of Mines and Geology, Special Publication 42, 1997 revised edition.
Bryant, W.A. and Hart, E.W., 2007, Fault-Rupture Hazard Zones in California: California Division
of Mines and Geology, Special Publication 42, 2007 revised edition.
California Building Code, 2013, California Building Standards Commission.
California Department of Health services, 2016, California Radon Levels by Zip Code
California Division of Mines and Geology, 2000, Digital Images of Official Maps and Alquist-Priolo
Earthquake Fault Zones of California, Central Coast Region: California Division of Mines and
Geology, CD 2000-03.
California Geological Survey, 2008, Guidelines for Evaluating and Mitigating Seismic Hazards in
California: DMG Special Publication 117A.
California Department of Conservation Division of Mines and Geology, 1986, Guidelines for
Geologic/Seismic Reports, DMG Note 42.
California Department of Conservation Division of Mines and Geology, 1987, Guidelines for
Preparing Engineering Geologic Reports: DMG Note 44.
California Geological Survey, 2011, Checklist for the Review of Engineering Geology and
Seismology Reports for California Public Schools, Hospitals, and Essential Services
Buildings, CGS Note 48.
Chin, L.J., Morrow, J.R., Ross, R., and Clifton, E.H., 1993, Geologic Maps of Upper Cenozoic
Deposits in Central California: USGS Miscellaneous Investigations Series Map I-1943.
Churchill, R.K. and Hill, R.L., 2000, A General Location Guide for Ultramafic Rocks in California:
Areas More Likely to Contain Naturally Occurring Asbestos, Division of Mines and Geology,
DMG Open-File Report 2000-19.
Crane (1995), modified map by Dibblee, T.W., 1980, Preliminary geologic map of the Richmond
quadrangle, Alameda and Contra Costa Counties, California: scale 1:24000.
Dibblee, T.W., 1980, Preliminary Geologic Map of the Richmond Quadrangle, Alameda and
Contra Costa Counties, California: U.S. Geological Survey, Open-File Report OF-80-1100,
scale 1:24,000.

20181569.001A/PLE17R67540 Page 18 of 20 October 20, 2017 © 2017 Kleinfelder
Dibblee, T.W. and Minch, J.A., 2005, Geologic Map of the Richmond Quadrangle, Contra Costa
& Alameda Counties, California: Dibblee Geological Foundation, Dibblee Foundation Map DF-
147, scale 1:24,000.
Ellen, S.D., and Wentworth, C.M., 1995, Hillside Materials and Slopes of the San Francisco Bay
Region, California: U.S. Geological Survey Professional Paper 1357.
Federal Emergency Management Agency, September 30, 2015, Flood Insurance Rate Map,
Contra Costa County, California and Incorporated Areas, Map Number 06013C0227G, Panel
227 of 602.
Graymer, R.W., Jones, D.L., and Brabb, E.E., 1998, Geologic map of the Hayward fault zone,
Contra Costa, Alameda, and Santa Clara Counties, California: a digital database: U.S.
Geological Survey, Open-File Report OF-95-597, scale 1:50,000.
Graymer, R.W., Sarna-Wojcicki, A.M., Walker, J.P., McLaughlin, R.J., and Fleck, R.J., 2002,
Controls on timing and amount of right-lateral offset on the East Bay fault system, San
Francisco Bay region, California: Geological Society of America, Bulletin v.114, no.12, scale
1:1,111,000.
Graymer, R.W., 2000, Geologic Map and Map Database of the Oakland Metropolitan Area,
Alameda, Contra Costa, and San Francisco Counties, California: U.S. Geological Survey,
Miscellaneous Field Studies Map MF-2342, scale 1:50,000.
Graymer, R.W., Jones, D.L., and Brabb, E.E., 1994, Preliminary geologic map emphasizing
bedrock formation in Contra Costa County, California: U.S. Geological Survey, Open-File
Report OF-94-622, scale 1:75000.
Helley, E.J., Lajoie, K.R., and Burke, D.B., 1972, Geologic Map of Late Cenozoic Deposits,
Alameda County, California: U.S. Geological Survey, Miscellaneous Field Studies Map MF-
429, scale 1:62,500.
Helley, E.J., Lajoie, K.R., Spangle, W.E., Blair, M.L., and William Spangle & Associates, 1979,
Flatland Deposits of the San Francisco Bay region, California - Their Geology and Engineering
Properties, and Their Importance to Comprehensive Planning: U.S. Geological Survey,
Professional Paper 943, scale 1:125,000.
Helley, E.J. and Graymer, R.W., 1997, Quaternary geology of Contra Costa County, and
surrounding parts of Alameda, Marin, Sonoma, Solano, Sacramento, and San Joaquin
Counties, California: a digital database: U.S. Geological Survey, Open-File Report OF-97-98,
scale 1:100,000.
Jennings, C.W., 1977, State Geologic Map of California: Updated version by Gutierrez, C.,
Bryant, W., Saucedo, G., and Wills, C., 2012.
Jennings, C.W., Gutierrez, C., Bryant, W., Saucedo, G., and Willis, C., 2010, Geologic Map of
California: California Geological Survey, Geologic Data Map No. 2, Scale 1:750,000.

20181569.001A/PLE17R67540 Page 19 of 20 October 20, 2017 © 2017 Kleinfelder
Kleinfelder, 2008, Subsurface Fault Investigation in the Vicinity of the Existing Humanities
Building, Contra Costa College, San Pablo, California, dated February 20, 2008 (Project No.
86352/Report/PLE8R066).
Kleinfelder, 2009, Master Plan Seismic Study, Contra Costa College Campus, San Pablo,
California, dated July 15, 2009 (Project No. 80412/Report)
Kleinfelder, 2011, Re-Assessment of Fault-Related Exclusionary Boundaries Pertaining to
Habitable Structures for the Campus Center Project/New Student Activities Building Proposed
within the Contra Costa College Campus, San Pablo, California, dated March 24, 2011
(Project No. 112252/PWPortables/PLE11L027).
Kleinfelder, 2011, Geotechnical Investigation Report, Campus Center, Contra Costa College, San
Pablo, California, dated February 17, 2011 (Project No. 112252/PWGEO/PLE11R006).
Kleinfelder, 2013, Amendment to Master Plan Seismic Study, Contra Costa College Campus, San
Pablo, California, dated April 16, 2012 (Project No. 124348/SRO12R0273).
Kleinfelder, 2017, Geotechnical Engineering Investigation Report, C-4016 New Allied Science
Building, Contra Costa College, San Pablo, California, dated October 17, 2017 (Project No.
20181569.001A/PLE17R67485).
Knudsen, K.L., Noller, J.S., Sowers, J.M., and Lettis, W.R., 1997, Quaternary Geology and
Liquefaction susceptibility, San Francisco, California 1:100,000 Quadrangle: a digital
database: U.S. Geological Survey, Open-File Report OF-97-715, scale 1:100,000.
Knudsen, K.L., Sowers, J.M., Witter, R.C., Wentworth, C.M., and Helley, E.J.,, 2000, Preliminary
Maps of Quaternary Deposits and Liquefaction Susceptibility, Nine-County San Francisco Bay
Region, California: A Digital Database: U.S. Geological Survey, Open-File Report 00-444.
Page, B.M., 1966, Geology of the Coast Ranges of California, in Geology of Northern California:
California Division of Mines and Geology, Bulletin 190, pp 255-276.
Radbruch, Dorothy and Case, J.E., 1967, Preliminary Geologic Map and Engineering Geologic
Information, Oakland and Vicinity, California: U.S. Geological Survey, Open-File Report OF-
67-183, scale 1:24,000.
Ritter, J.R., and Dupre, W.R.,1972, Map Showing Areas of Potential Inundation by Tsunamis in
the San Francisco Bay Region, California, Misc. Field Studies Map MF-480, Basic Data
Contribution 52, S.F. Bay Region Environment and Resources Planning Study, U.S.
Geological Survey and U.S. Department of Housing and Urban Development.
Savage, D.E., Ogle, B.A., and Creely, S., 1951, Subdivision of vertebrate-bearing, Non-marine
Rocks in West-Central Contra Costa County, California (abs.): Geological Society of America
Bulletin, v. 62, no. 12, p. 1511.
Schlocker, Julius, 1971, Generalized Geologic Map of the San Francisco Bay Region, California:
U.S. Geological Survey, Open-File Report OF-71-246, scale 1:500,000.
20181569.001A/PLE17R67540 Page 20 of 20 October 20, 2017 © 2017 Kleinfelder
Sheehan, J.R., 1956, Structure and Stratigraphy of N.W. Contra Costa County, California:
University of California, Berkeley, unpublished Master’s Degree Thesis.
United States Geological Survey, 2010, Division of Geologic Time, US Geological Survey
Geologic Names Committee.
United States Geological Survey, 1993, Topographic Map of the Richmond 7½-Minute
Quadrangle, Scale 1:24,000.
Wagner, J.R., 1978, Late Cenozoic History of the Coast Ranges East of San Francisco Bay,
Richmond 7½-minute quadrangle, Unpublished Master’s Thesis, University of California,
Berkeley, scale: 1:24,000.
Wagner, D.L., Bortugno, E.J., and McJunkin, R.D., 1991, Geologic Map of the San Francisco-San
Jose quadrangle, California, 1:250,000: California Division of Mines and Geology, Regional
Geologic Map 5A, scale 1:250,000.
Weaver, C.E., 1949, Geology of the Coast Ranges Immediately North of the San Francisco Bay
region, California: Geological Society of America Memoir 35, 242 p.
Witter, R.C., Knudsen, K.L., Sowers, J.M., Wentworth, C.M., Koehler, R.D., Randolph, C.E.,
Brooks, S, K., and Gans, K.D., 2006, Maps of Quaternary Deposits and Liquefaction
Susceptibility in the Central San Francisco Bay Region, California: U.S. Geological Survey,
Open-File Report OF-2006-1037, scale 1:200,000.
Youd, T.L. and Hoose, S.N., 1978, Historic Ground Failures in Northern California Triggered by
Earthquakes: United States Geological Survey Professional Paper 993.

FIGURES
LIST OF ATTACHMENTS The following figures are attached and complete this appendix.
Figure Site Vicinity Map ................................................................................................... Figure 1
Site Plan and Geology Map.................................................................................... Figure 2
Regional Geology Map .......................................................................................... Figure 3
Area Geology Map ................................................................................................ Figure 4
Geologic Cross Sections A-A’ and B-B’ ................................................................. Figure 5

The information included on this graphic representation has been compiled from avariety of sources and is subject to change without notice. Kleinfelder makes norepresentations or warranties, express or implied, as to accuracy, completeness,timeliness, or rights to the use of such information. This document is not intended foruse as a land survey product nor is it designed or intended as a construction designdocument. The use or misuse of the information contained on this graphicrepresentation is at the sole risk of the party using or misusing the information.
CAD
FIL
E: W
:\201
8\20
1815
69.0
01A_
CC
CC
D_C
-401
6 G
eoSe
is\G
RAP
HIC
s\G
EOH
AZ\2
0181
569.
dwg
PLO
TTED
: 9
/7/2
017
4:45
PM
BY:
jeff
sala
N
FIGURE
DRAWN BY:
PROJECT NO.
CHECKED BY:
REVISED:
DATE:
SITE VICINITY MAP20181569
JDS
OK
09/07/2017
1
REFERENCE:
VICINITY MAP CREATED FROM DATA COMPILEDBY USGS US TOPO RICHMOND, CA.QUADRANGLE 7.5-MINUTE, 2015
SITE
0
SCALE IN FEET
3000 6000
SCALE: 1" = 3000'
CONTRA COSTA COLLEGENEW SCIENCE BUILDING
2600 MISSION BELL DRIVESAN PABLO, CALIFORNIA
CAMPUS
BOUNDARY

KCT-1 (2012)
T
-
1
(
2
0
0
3
)
T
-
4
(
2
0
0
3
)
T-2 (2003)
T-1
(2008)
TP-3
(2008)
TP-2
(2008)
TP-4
(2008)
T-2
(2008)
SA-1
(2007)
SA-2(2007)
KPT-1
(2012)
T-2A
(2003)
HLA
(1973c)
WCA
(Pre-1973)
HML&A
(1972a)
HML&A
(1972b)
KAT-3 (2005)
T-2 (2003)
T-3 (2003)
HLA
(1973a)
KEPT-2
(2012)
Library and Learning
Resource Center
Liberal
Arts
Physical
Sciences
Biological
Sciences
Humanities
Administrative
and Applied Arts
Health
Sciences
Student
Association
HLA
(1973f)
TP-1
(2008)
A
A'
R
H
E
E
M
C
R
E
E
K
Qa
C
A
M
P
U
S
D
R
I
V
E
B
B'
B-7
B-6
B-5
B-2
B-1
K-1
K-3
K-2
B-8
Tcc
NEW SCIENCE
BUILDING
B-4 (2017)
B-3 (2017)
B-1 (2017)
B-2 (2017)
APPROXIMATE FAULT TRENCH LOCATION
(report date in parentheses):
HARDING-LAWSON
ASSOCIATES (HLA) or (HML&A)
WOODWARD-CLYDE & ASSOCIATES
(WCA)
KLEINFELDER, INC.
EASTERN LIMIT OF APEFZ - by
California Geological Survey (CGS)
CAMPUS
BOUNDARY
APPROXIMATE CREEK LOCATION
APPROXIMATE INACTIVE FAULT
LOCATION
APPROXIMATE POTENTIALLY ACTIVE
FAULT LOCATION
APPROXIMATE GEOLOGIC CONTACT
(BASED ON GRAYMER, 2000)
A
A'
GEOLOGIC CROSS SECTION LINE
(See Figure 5 for cross section)
SOIL BORING
(BY KLEINFELDER, 2017)
K-3
B-8
SOIL BORING
(BY KLEINFELDER, 2004)
SOIL BORING
(BY KLEINFELDER, 2010)
B-4 (2017)
Qa
Tcc
QUATERNARY ALLUVIUM
GARRITY MEMBER, CONTRA
COSTA GROUP (TERTIARY)
LEGEND
EXCLUSION ZONE
AREAS NOT CLEARED OF
SECONDARY FAULT TRACES
(further investigation required)
HABITABLE STRUCTURE ZONE
0
100 10050
APPROXIMATE SCALE (feet)
The information included on this graphic representation has been compiled from a variety of sources and is
subject to change without notice. Kleinfelder makes no representations or warranties, express or implied,
as to accuracy, completeness, timeliness, or rights to the use of such information. This document is not
intended for use as a land survey product nor is it designed or intended as a construction design document.
The use or misuse of the information contained on this graphic representation is at the sole risk of the party
using or misusing the information.
CA
D F
IL
E: W
:\2
01
8\2
01
81
56
9\p
la
ns\S
IT
E P
LA
N.d
wg
L
AY
OU
T: F
2
PL
OT
TE
D: 1
0/2
0/2
01
7 1
0:4
8 A
M B
Y: g
ab
e g
om
ez
DRAWN BY
DATE:
PROJECT NO.
CHECKED BY
REVISED:
FIGURE
SITE PLAN AND
GEOLOGY MAP
20181569
JDS
OK
10/04/2017
2
CONTRA COSTA COLLEGE
NEW SCIENCE BUILDING
2600 MISSION BELL DRIVE
SAN PABLO, CALIFORNIA
Reference: Kleinfelder, 2017, Proposed Adjustment of Habitable Zone
Boundaries within the Campus of Contra Costa Community College,
San Pablo, California, dated August 24, 2017

0 50 100
SCALE MILES
REGIONAL GEOLOGIC MAP
3
© 2017, by Kleinfelder, Inc.
Site
N
EXPLANATION
of units in SF Bay Area
Cenozoic nonmarine Mesozoic Granitic rocks
Cenozoic marine Mesozoic Ultramafic rocks
Late Mesozoic shelf and slope
Late Mesozoic of the Franciscan Formation
Fault, dotted where concealed, arrows indicate direction of
movement
Map source: California Geological
Survey, 2002, Geologic Map of
California, California Department of
Conservation.
FILE NAME:
DRAWN BY:
CHECKED BY:
DRAWN:
PROJECT NO.
CA
D F
ILE
W:\2018\2
0181569.0
01A
_C
CC
CD
_C
-40
16 G
eoS
eis
\GR
AP
HIC
s\G
EO
HA
ZP
LO
TT
ED
: 07 S
EP
T 2
017,
www.kleinfelder.com
The information included on this graphic representation has been compiled from a variety of
sources and is subject to change without notice. Kleinfelder makes no representations or
warranties, express or implied, as to accuracy, completeness, timeliness, or rights to the use of
such information. This document is not intended for use as a land survey product nor is itdesigned or intended as a construction design document. The use or misuse of the information
contained on this graphic representation is at the sole risk of the party using or misusing the
information.
CONTRA COSTA COLLEGE
NEW SCIENCE BUILDING
2600 MISSION BELL DRIVE
SAN PABLO, CALIFORNIA
FIGURE20164720
SEPT 2017
P.H./J.S.
O.K.
REGIONAL GEOLOGIC MAP.ppt

MAP UNITS
ORINDA FORMATION (LATE MIOCENE)Tor
ALLUVIAL FAN AND FLUVIAL DEPOSITS (PLEISTOCENE)Qpaf
NATURAL LEVEE DEPOSITS (HOLOCENE)Qhl
ALLUVIAL FAN AND FLUVIAL DEPOSITS (HOLOCENE)Qhaf
2400600 12000
APPROXIMATE SCALE: 1 inch =
1200
The information included on this graphic representation has been compiled from a variety of sources and issubject to change without notice. Kleinfelder makes no representations or warranties, express or implied,as to accuracy, completeness, timeliness, or rights to the use of such information. This document is notintended for use as a land survey product nor is it designed or intended as a construction design document.The use or misuse of the information contained on this graphic representation is at the sole risk of the partyusing or misusing the information.C
AD F
ILE:
W:\2
018\
2018
1569
.001
A_C
CC
CD
_C-4
016
Geo
Seis
\GR
APH
ICs\
GEO
HAZ
\201
8156
9_2.
dwg
L
AYO
UT:
AR
EA G
EOPL
OTT
ED:
10/
2/20
17 9
:31
AM B
Y: je
ff sa
la
DRAWN BY
DATE:
PROJECT NO.
CHECKED BY
REVISED:
FIGUREAREA GEOLOGY MAP
NEW SCIENCE BUILDING2600 MISSION BELL DRIVESAN PABLO, CALIFORNIA
20181569
JDS
OK
09/07/2017
4
SITE
CONTRA COSTA COLLEGE
REFERENCE:
Graymer, R.W., 2000, Geologic Map and map database of the Oakland Metropolitan Area,Alameda, Contra Costa, And San Francisco Counties, California: U.S. Geological Survey,Miscellaneous Field Studies Map MF - 2342, scale 1:50,000.
1,200 feet

050
100
0 100HORIZONTAL DISTANCE (FEET)
ELEV
ATIO
N (F
EET)
B-1
B-3
AA'
SWNE
NORTHWEST
FACE
EXISTINGLIBERAL
ARTS BLDG
200
150
FIRE ACCESSROAD
NEW BLDGLIMITS
050
100
0 100HORIZONTAL DISTANCE (FEET)
ELEV
ATIO
N (F
EET)
B-2
B-4
BB'
SWNE
NORTHWEST
FACE
EXISTINGLIBERAL
ARTS BLDG
200
150
FIRE ACCESSROAD
NEW BLDGLIMITS
Qa
Tcc
QUATERNARY ALLUVIUM
GARRITY MEMBER, CONTRACOSTA GROUP (TERTIARY)
QaFILL
Qa
Tcc?? ? ?
QaFILL
Qa
? ???Tcc
NOTES:1. LOCATIONS ARE APPROXIMATE.
2. SEE FIGURE 2 FOR APPROXIMATE CROSS SECTION LOCATIONS.
3. THESE CROSS SECTIONS ARE FOR ILLUSTRATIVE PURPOSES ONLY ANDARE BASED ON OUR INTERPRETATION OF THE SUBSURFACE CONDITIONS.THESE CROSS SECTIONS SHOULD NOT BE USED FOR CONSTRUCTIONAND SHOULD BE CONSIDERED APPROXIMATE.
? CONTACT LINE
GROUND SURFACE
LEGEND
0100 10050
APPROXIMATE SCALE (feet)The information included on this graphic representation has been compiled from a variety of sources and issubject to change without notice. Kleinfelder makes no representations or warranties, express or implied,as to accuracy, completeness, timeliness, or rights to the use of such information. This document is notintended for use as a land survey product nor is it designed or intended as a construction design document.The use or misuse of the information contained on this graphic representation is at the sole risk of the partyusing or misusing the information.C
AD F
ILE:
W:\2
018\
2018
1569
.001
A_C
CC
CD
_C-4
016
Geo
Seis
\GR
APH
ICs\
GEO
HAZ
\SIT
E PL
AN.d
wg
L
AYO
UT:
SEC
TIO
NPL
OTT
ED:
10/
5/20
17 9
:19
AM B
Y: je
ff sa
la
DRAWN BY
DATE:
PROJECT NO.
CHECKED BY
REVISED:
FIGUREGEOLOGIC CROSS SECTIONA-A' AND B-B'
20181569
JDS
OK
10/04/2017
5CONTRA COSTA COLLEGENEW SCIENCE BUILDING
2600 MISSION BELL DRIVESAN PABLO, CALIFORNIA

APPENDIX A
Boring Logs
LIST OF ATTACHMENTS The following figures are attached and complete this appendix.
Figure
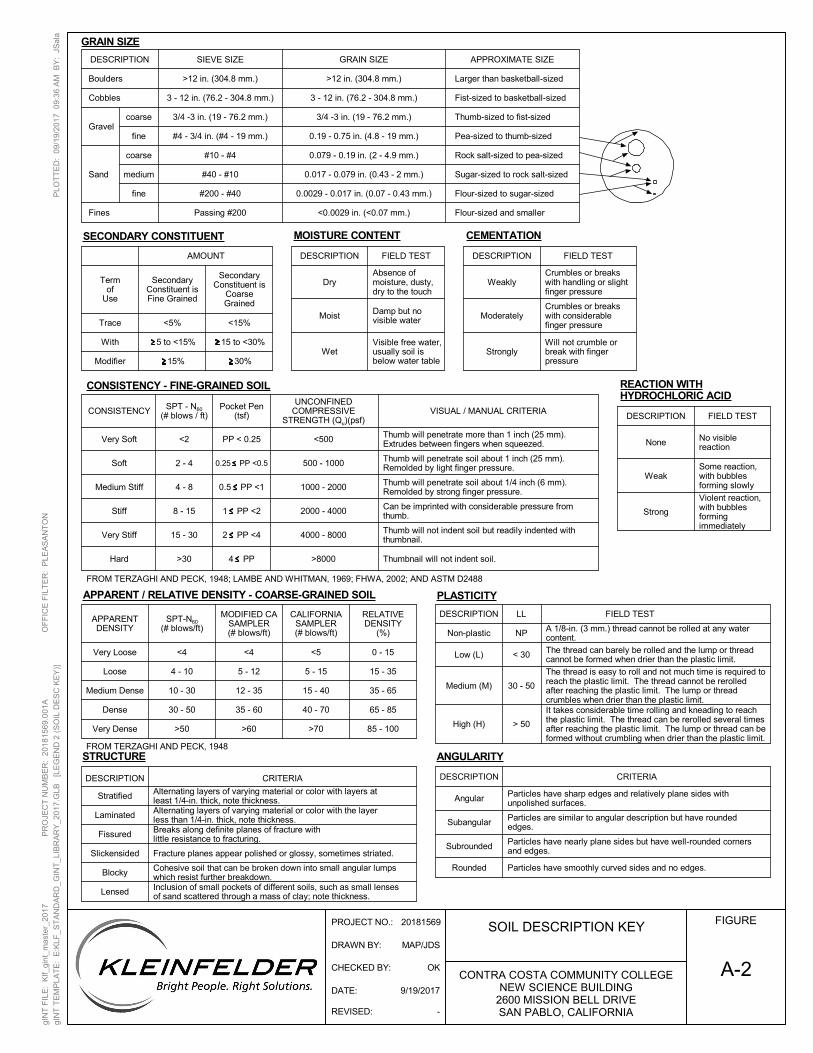
Graphics Key ...................................................................................................... Figure A-1
Soil Description Key ............................................................................................ Figure A-2
Rock Description Key .......................................................................................... Figure A-3
Log of Borings B-1 through B-4 ........................................................................... Figures A-4 through A-7

A-1
FIGURE
CONTRA COSTA COMMUNITY COLLEGENEW SCIENCE BUILDING
2600 MISSION BELL DRIVESAN PABLO, CALIFORNIA
The report and graphics key are an integral part of these logs. Alldata and interpretations in this log are subject to the explanations andlimitations stated in the report.
Lines separating strata on the logs represent approximateboundaries only. Actual transitions may be gradual or differ fromthose shown.
No warranty is provided as to the continuity of soil or rockconditions between individual sample locations.
Logs represent general soil or rock conditions observed at thepoint of exploration on the date indicated.
In general, Unified Soil Classification System designationspresented on the logs were based on visual classification in the fieldand were modified where appropriate based on gradation and indexproperty testing.
Fine grained soils that plot within the hatched area on thePlasticity Chart, and coarse grained soils with between 5% and 12%passing the No. 200 sieve require dual USCS symbols, ie., GW-GM,GP-GM, GW-GC, GP-GC, GC-GM, SW-SM, SP-SM, SW-SC, SP-SC,SC-SM.
If sampler is not able to be driven at least 6 inches then 50/Xindicates number of blows required to drive the identified sampler Xinches with a 140 pound hammer falling 30 inches.
ABBREVIATIONSWOH - Weight of HammerWOR - Weight of Rod
INORGANIC SILTS, MICACEOUS ORDIATOMACEOUS FINE SAND OR SILT
INORGANIC CLAYS-SILTS OF LOW PLASTICITY, GRAVELLYCLAYS, SANDY CLAYS, SILTY CLAYS, LEAN CLAYS
CL
CL-ML
_
_
_
GM
GC
GW
GP
GW-GM
GW-GC
_ _
_
CH
CLAYEY GRAVELS,GRAVEL-SAND-CLAY MIXTURES
GRAVELSWITH >
12%FINES
>
Cu 4 and1 Cc 3
WELL-GRADED GRAVELS,GRAVEL-SAND MIXTURES WITHLITTLE OR NO FINES
POORLY GRADED GRAVELS,GRAVEL-SAND MIXTURES WITHLITTLE OR NO FINES
WELL-GRADED GRAVELS,GRAVEL-SAND MIXTURES WITHLITTLE FINES
WELL-GRADED GRAVELS,GRAVEL-SAND MIXTURES WITHLITTLE CLAY FINES
POORLY GRADED GRAVELS,GRAVEL-SAND MIXTURES WITHLITTLE FINES
POORLY GRADED GRAVELS,GRAVEL-SAND MIXTURES WITHLITTLE CLAY FINES
SILTY GRAVELS, GRAVEL-SILT-SANDMIXTURES
CLAYEY GRAVELS,GRAVEL-SAND-CLAY-SILT MIXTURES
WELL-GRADED SANDS, SAND-GRAVELMIXTURES WITH LITTLE CLAY FINES
POORLY GRADED SANDS,SAND-GRAVEL MIXTURES WITHLITTLE CLAY FINES
SW
SW-SC
POORLY GRADED SANDS,SAND-GRAVEL MIXTURES WITHLITTLE FINES
Cu 4 and/or 1 Cc 3>
>
FIN
E G
RA
INE
D S
OIL
S(M
ore
than
hal
f of m
ater
ial
is s
mal
ler
than
the
#200
sie
ve)
INORGANIC SILTS AND VERY FINE SANDS, SILTY ORCLAYEY FINE SANDS, SILTS WITH SLIGHT PLASTICITY
ORGANIC CLAYS & ORGANIC SILTS OFMEDIUM-TO-HIGH PLASTICITY
INORGANIC CLAYS OF HIGH PLASTICITY,FAT CLAYS
>
Cu 6 and/or 1 Cc 3
>
_
SILTY SANDS, SAND-GRAVEL-SILTMIXTURES
CLAYEY SANDS, SAND-GRAVEL-CLAYMIXTURES
SW-SM
CLAYEY SANDS, SAND-SILT-CLAYMIXTURES
Cu 6 and1 Cc 3
SC-SM
Cu 4 and1 Cc 3
< _
ORGANIC SILTS & ORGANIC SILTY CLAYSOF LOW PLASTICITY
SILTS AND CLAYS(Liquid Limitless than 50)
SILTS AND CLAYS(Liquid Limit
greater than 50)
WELL-GRADED SANDS, SAND-GRAVELMIXTURES WITH LITTLE OR NO FINES
POORLY GRADED SANDS,SAND-GRAVEL MIXTURES WITHLITTLE OR NO FINES
MH
OH
ML
GC-GM
CO
AR
SE
GR
AIN
ED
SO
ILS
(M
ore
than
hal
f of m
ater
ial i
s la
rger
than
the
#200
sie
ve)
UNIFIED SOIL CLASSIFICATION SYSTEM (ASTM D 2487)
<
Cu 6 and1 Cc 3
GP-GM
GP-GC
_
_ _
INORGANIC CLAYS OF LOW TO MEDIUM PLASTICITY, GRAVELLYCLAYS, SANDY CLAYS, SILTY CLAYS, LEAN CLAYS
GRAPHICS KEY
<
>
<
<
>
CLEANSANDSWITH<5%
FINES
GR
AV
EL
S (
Mor
e th
an h
alf o
f coa
rse
frac
tion
is la
rger
than
the
#4 s
ieve
)
Cu 6 and/or 1 Cc 3>
<
<
SANDSWITH5% TO12%
FINES
SANDSWITH >
12%FINES
SA
ND
S (
Mor
e th
an h
alf o
f coa
rse
frac
tion
is s
mal
ler
than
the
#4 s
ieve
)
WELL-GRADED SANDS, SAND-GRAVELMIXTURES WITH LITTLE FINES
Cu 4 and/or 1 Cc 3>
CLEANGRAVEL
WITH<5%
FINES
GRAVELSWITH5% TO12%
FINES
OL
<
>
<
<
>
SP
SP-SM
SP-SC
SM
SC
< _<
>
STANDARD PENETRATION SPLIT SPOON SAMPLER(2 in. (50.8 mm.) outer diameter and 1-3/8 in. (34.9 mm.) innerdiameter)
CALIFORNIA SAMPLER(3 in. (76.2 mm.) outer diameter)
HOLLOW STEM AUGER
SOLID STEM AUGER
SHELBY TUBE SAMPLER
MODIFIED CALIFORNIA SAMPLER(2 or 2-1/2 in. (50.8 or 63.5 mm.) outer diameter)
BULK / GRAB / BAG SAMPLE
WASH BORING
SAMPLER AND DRILLING METHOD GRAPHICS
GROUND WATER GRAPHICS
OBSERVED SEEPAGE
WATER LEVEL (level after exploration completion)
WATER LEVEL (level where first observed)
WATER LEVEL (additional levels after exploration)
NOTES
DRAWN BY: MAP/JDS
CHECKED BY: OK
DATE: 9/19/2017
REVISED: -
PROJECT NO.: 20181569
gIN
T F
ILE
: K
lf_gi
nt_m
aste
r_20
17
P
RO
JEC
T N
UM
BE
R:
2018
156
9.0
01A
O
FF
ICE
FIL
TE
R:
PLE
AS
AN
TO
N
gIN
T T
EM
PLA
TE
: E
:KLF
_S
TA
ND
AR
D_G
INT
_LIB
RA
RY
_201
7.G
LB
[LE
GE
ND
1 (
GR
AP
HIC
S K
EY
) U
SC
S_S
TA
ND
AR
D]
PLO
TT
ED
: 09
/19/
201
7 0
9:3
6 A
M B
Y:
JSal
a
CALIFORNIASAMPLER(# blows/ft)
MODIFIED CASAMPLER(# blows/ft)
SPT-N60
(# blows/ft)
A-2
FIGURE
CONTRA COSTA COMMUNITY COLLEGENEW SCIENCE BUILDING
2600 MISSION BELL DRIVESAN PABLO, CALIFORNIA
The thread is easy to roll and not much time is required toreach the plastic limit. The thread cannot be rerolledafter reaching the plastic limit. The lump or threadcrumbles when drier than the plastic limit.It takes considerable time rolling and kneading to reachthe plastic limit. The thread can be rerolled several timesafter reaching the plastic limit. The lump or thread can beformed without crumbling when drier than the plastic limit.
30 - 50
> 50
Medium (M)
High (H)
RELATIVEDENSITY
(%)
APPARENTDENSITY
30 - 50
10 - 30
4 - 10
<4
>60
35 - 60
12 - 35
5 - 12
<4
>70
40 - 70
15 - 40
5 - 15
CONSISTENCY
<2
Moist
DESCRIPTION
Strongly
FIELD TEST
Alternating layers of varying material or color with the layerless than 1/4-in. thick, note thickness.
FIELD TEST
Absence ofmoisture, dusty,dry to the touch
Moderately
Will not crumble orbreak with fingerpressure
Pocket Pen(tsf)
Termof
Use
<5%
With
Modifier
5 to <15%
15%
Trace <15%
15 to <30%
30%
AMOUNT
>30
Very Soft
SOIL DESCRIPTION KEY
DESCRIPTION
Damp but novisible water
Boulders
Cobbles
coarse
fineGravel
Sand
Fines
GRAIN SIZE
>12 in. (304.8 mm.)
3 - 12 in. (76.2 - 304.8 mm.) Fist-sized to basketball-sized
3/4 -3 in. (19 - 76.2 mm.) Thumb-sized to fist-sized
0.19 - 0.75 in. (4.8 - 19 mm.) Pea-sized to thumb-sized
0.079 - 0.19 in. (2 - 4.9 mm.)#10 - #4
0.017 - 0.079 in. (0.43 - 2 mm.)
#200 - #40
coarse
fine
medium
SIEVE SIZE APPROXIMATE SIZE
Larger than basketball-sized>12 in. (304.8 mm.)
3 - 12 in. (76.2 - 304.8 mm.)
3/4 -3 in. (19 - 76.2 mm.)
#4 - 3/4 in. (#4 - 19 mm.)
Rock salt-sized to pea-sized
#40 - #10 Sugar-sized to rock salt-sized
0.0029 - 0.017 in. (0.07 - 0.43 mm.) Flour-sized to sugar-sized
Passing #200 <0.0029 in. (<0.07 mm.) Flour-sized and smaller
DESCRIPTION
SecondaryConstituent isFine Grained
SecondaryConstituent is
CoarseGrained
SPT - N60
(# blows / ft)
Soft
Stiff
Very Stiff
Hard
2 - 4
4 - 8
8 - 15
15 - 30
WeaklyCrumbles or breakswith handling or slightfinger pressure
Crumbles or breakswith considerablefinger pressure
UNCONFINEDCOMPRESSIVE
STRENGTH (Qu)(psf)VISUAL / MANUAL CRITERIA
<500
0.5 PP <1
1 PP <2
2 PP <4
4 PP >8000
4000 - 8000
500 - 1000
1000 - 2000
2000 - 4000
Rounded
Subrounded
Dry
WetVisible free water,usually soil isbelow water table
Thumb will penetrate more than 1 inch (25 mm).Extrudes between fingers when squeezed.
Thumb will penetrate soil about 1 inch (25 mm).Remolded by light finger pressure.
Thumb will penetrate soil about 1/4 inch (6 mm).Remolded by strong finger pressure.
Can be imprinted with considerable pressure fromthumb.
Thumb will not indent soil but readily indented withthumbnail.
Thumbnail will not indent soil.
Particles have nearly plane sides but have well-rounded cornersand edges.
Angular Particles have sharp edges and relatively plane sides withunpolished surfaces.
DESCRIPTION
Fissured
Slickensided
Blocky
Lensed
CRITERIA
Stratified
Laminated
Fracture planes appear polished or glossy, sometimes striated.
Alternating layers of varying material or color with layers atleast 1/4-in. thick, note thickness.
Breaks along definite planes of fracture withlittle resistance to fracturing.
Cohesive soil that can be broken down into small angular lumpswhich resist further breakdown.Inclusion of small pockets of different soils, such as small lensesof sand scattered through a mass of clay; note thickness.
Subangular
Particles have smoothly curved sides and no edges.
Particles are similar to angular description but have roundededges.
None
Weak
Strong
No visiblereaction
DESCRIPTION CRITERIA
A 1/8-in. (3 mm.) thread cannot be rolled at any watercontent.NPNon-plastic
The thread can barely be rolled and the lump or threadcannot be formed when drier than the plastic limit.< 30Low (L)
85 - 100
65 - 85
35 - 65
15 - 35
<5 0 - 15
Very Dense
Dense
Medium Dense
>50
Loose
Very Loose
FROM TERZAGHI AND PECK, 1948
LLDESCRIPTION FIELD TEST
Some reaction,with bubblesforming slowly
Violent reaction,with bubblesformingimmediately
DESCRIPTION FIELD TEST
PP < 0.25
0.25 PP <0.5
Medium Stiff
PLASTICITYAPPARENT / RELATIVE DENSITY - COARSE-GRAINED SOIL
MOISTURE CONTENTSECONDARY CONSTITUENT CEMENTATION
CONSISTENCY - FINE-GRAINED SOIL
FROM TERZAGHI AND PECK, 1948; LAMBE AND WHITMAN, 1969; FHWA, 2002; AND ASTM D2488
REACTION WITHHYDROCHLORIC ACID
ANGULARITYSTRUCTURE
GRAIN SIZE
DRAWN BY: MAP/JDS
CHECKED BY: OK
DATE: 9/19/2017
REVISED: -
PROJECT NO.: 20181569
gIN
T F
ILE
: K
lf_gi
nt_m
aste
r_20
17
P
RO
JEC
T N
UM
BE
R:
2018
156
9.0
01A
O
FF
ICE
FIL
TE
R:
PLE
AS
AN
TO
N
gIN
T T
EM
PLA
TE
: E
:KLF
_S
TA
ND
AR
D_G
INT
_LIB
RA
RY
_201
7.G
LB
[LE
GE
ND
2 (
SO
IL D
ES
C K
EY
)]P
LOT
TE
D:
09/1
9/20
17
09
:36
AM
BY
: JS
ala
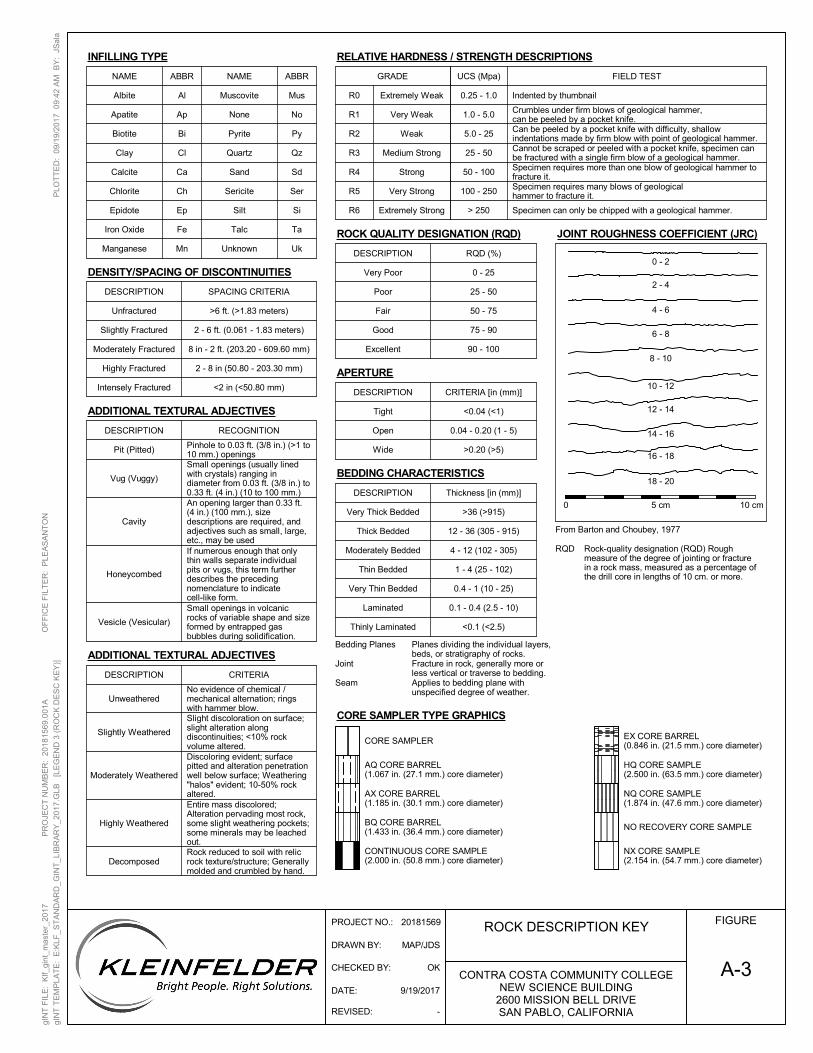
A-3
FIGURE
CONTRA COSTA COMMUNITY COLLEGENEW SCIENCE BUILDING
2600 MISSION BELL DRIVESAN PABLO, CALIFORNIA
None
Muscovite
Rock reduced to soil with relicrock texture/structure; Generallymolded and crumbled by hand.
Specimen requires more than one blow of geological hammer tofracture it.
Moderately Weathered
Slightly Weathered
Al R0
R1
R2
R3
R4
R5
R6
Can be peeled by a pocket knife with difficulty, shallowindentations made by firm blow with point of geological hammer.
>6 ft. (>1.83 meters)
2 - 6 ft. (0.061 - 1.83 meters)
8 in - 2 ft. (203.20 - 609.60 mm)
2 - 8 in (50.80 - 203.30 mm)
Honeycombed
Small openings in volcanicrocks of variable shape and sizeformed by entrapped gasbubbles during solidification.
Vesicle (Vesicular)
DESCRIPTION
Unweathered
Entire mass discolored;Alteration pervading most rock,some slight weathering pockets;some minerals may be leachedout.
Decomposed
Highly Weathered
RQD
Thick Bedded
Very Thin Bedded
Poor
Very Poor
RQD (%)
0 - 25
25 - 50
50 - 75
75 - 90
90 - 100
Intensely Fractured
SPACING CRITERIA
<2 in (<50.80 mm)
Fair
Good
Excellent
Rock-quality designation (RQD) Roughmeasure of the degree of jointing or fracturein a rock mass, measured as a percentage ofthe drill core in lengths of 10 cm. or more.
From Barton and Choubey, 1977
Bedding Planes
Joint
Seam
Planes dividing the individual layers,beds, or stratigraphy of rocks.Fracture in rock, generally more orless vertical or traverse to bedding.Applies to bedding plane withunspecified degree of weather.
Tight
Open
Wide
DESCRIPTION
DESCRIPTION
DESCRIPTION
0.04 - 0.20 (1 - 5)
>0.20 (>5)
<0.04 (<1)
CRITERIA [in (mm)]
Thickness [in (mm)]
>36 (>915)
12 - 36 (305 - 915)
4 - 12 (102 - 305)
1 - 4 (25 - 102)
0.4 - 1 (10 - 25)
0.1 - 0.4 (2.5 - 10)
<0.1 (<2.5)
Very Thick Bedded
Moderately Bedded
Thin Bedded
Laminated
Thinly Laminated
ABBR
Uk
Ta
Si
Ser
Sd
NAME
Mn
Fe
RECOGNITION
CRITERIA
Discoloring evident; surfacepitted and alteration penetrationwell below surface; Weathering"halos" evident; 10-50% rockaltered.
No evidence of chemical /mechanical alternation; ringswith hammer blow.
Extremely Weak
Very Weak
Weak
Medium Strong
UCS (Mpa)
0.25 - 1.0
1.0 - 5.0
FIELD TEST
Specimen can only be chipped with a geological hammer.
Specimen requires many blows of geologicalhammer to fracture it.
Cannot be scraped or peeled with a pocket knife, specimen canbe fractured with a single firm blow of a geological hammer.
ROCK DESCRIPTION KEY
Albite
Biotite
Epidote Ep
Ch
Ca
Cl
Ap
Strong
Very Strong
Extremely Strong
5.0 - 25
25 - 50
50 - 100
100 - 250
> 250
GRADE
Indented by thumbnail
Apatite
Clay
Calcite
Chlorite
Iron Oxide
Manganese
ABBR
Bi
NAME
Unknown
Talc
Silt
Sericite
Sand
Quartz
Pyrite
Qz
Py
No
Mus
Crumbles under firm blows of geological hammer,can be peeled by a pocket knife.
Slight discoloration on surface;slight alteration alongdiscontinuities; <10% rockvolume altered.
Pit (Pitted)
Small openings (usually linedwith crystals) ranging indiameter from 0.03 ft. (3/8 in.) to0.33 ft. (4 in.) (10 to 100 mm.)
DESCRIPTION
Unfractured
Slightly Fractured
Moderately Fractured
Pinhole to 0.03 ft. (3/8 in.) (>1 to10 mm.) openings
Vug (Vuggy)
DESCRIPTION
An opening larger than 0.33 ft.(4 in.) (100 mm.), sizedescriptions are required, andadjectives such as small, large,etc., may be used
Cavity
If numerous enough that onlythin walls separate individualpits or vugs, this term furtherdescribes the precedingnomenclature to indicatecell-like form.
Highly Fractured
CORE SAMPLER TYPE GRAPHICS
CORE SAMPLER
AQ CORE BARREL(1.067 in. (27.1 mm.) core diameter)
AX CORE BARREL(1.185 in. (30.1 mm.) core diameter)
BQ CORE BARREL(1.433 in. (36.4 mm.) core diameter)
CONTINUOUS CORE SAMPLE(2.000 in. (50.8 mm.) core diameter)
EX CORE BARREL(0.846 in. (21.5 mm.) core diameter)
NO RECOVERY CORE SAMPLE
NX CORE SAMPLE(2.154 in. (54.7 mm.) core diameter)
NQ CORE SAMPLE(1.874 in. (47.6 mm.) core diameter)
HQ CORE SAMPLE(2.500 in. (63.5 mm.) core diameter)
DENSITY/SPACING OF DISCONTINUITIES
5 cm0
4 - 6
6 - 8
2 - 4
8 - 10
10 cm
0 - 2
12 - 14
18 - 20
14 - 16
16 - 18
ADDITIONAL TEXTURAL ADJECTIVES
ROCK QUALITY DESIGNATION (RQD)
APERTURE
JOINT ROUGHNESS COEFFICIENT (JRC)
BEDDING CHARACTERISTICS
10 - 12
INFILLING TYPE
ADDITIONAL TEXTURAL ADJECTIVES
RELATIVE HARDNESS / STRENGTH DESCRIPTIONS
DRAWN BY: MAP/JDS
CHECKED BY: OK
DATE: 9/19/2017
REVISED: -
PROJECT NO.: 20181569
gIN
T F
ILE
: K
lf_gi
nt_m
aste
r_20
17
P
RO
JEC
T N
UM
BE
R:
2018
156
9.0
01A
O
FF
ICE
FIL
TE
R:
PLE
AS
AN
TO
N
gIN
T T
EM
PLA
TE
: E
:KLF
_S
TA
ND
AR
D_G
INT
_LIB
RA
RY
_201
7.G
LB
[LE
GE
ND
3 (
RO
CK
DE
SC
KE
Y)]
PLO
TT
ED
: 09
/19/
201
7 0
9:4
2 A
M B
Y:
JSal
a

109.7
108.8
115.8
approximately 2-inches of asphalt
Sandy Lean CLAY with Gravel (CL): low plasticity,yellowish brown, moist, stiff to very stiff, subrounded tosubangular gravel
olive brown, stiff to very stiff
Sandy Lean CLAY (CL): fine-grained sand, somegravel, medium plasticity, reddish yellow mottled, moist,very stiff
some angular claystone fragments, yellowish brown,hard
CLAYSTONE: fine-grained, medium plasticity,yellowish brown, moderately weathered, weak tomedium strong
moderately weathered, weak to medium strong,interbedded with siltstone
TXUU: c = 2.12 ksf
TXUU: c = 2.55 ksf
BC=579
BC=568
BC=61014
BC=121822
BC=223650/5"
BC=112950
BC=2950/3"
12"
12"
12"
12"
11"
12"
8"
18.9
19.1
14.0
BORING LOG B-1 FIGURE
A-4
1 of 2
LABORATORY RESULTS
Lithologic Description
PAGE:
FIELD EXPLORATION
BORING LOG B-1
Dry
Uni
t Wt.
(pcf
)
Pas
sing
#4
(%)
Pas
sing
#20
0 (%
)
Latitude: 37.96986° NLongitude: -122.33678° E
Approximate Ground Surface Elevation (ft.): 92.00 Surface Condition: Asphalt
Not Available
Gregg - #CA107979Drilling Co.-Lic.#:
Drilling Method:
Drilling Equipment:
8/11/2017
Cloudy Exploration Diameter:
Hammer Type - Drop: 140 lb. Auto - 30 in.
Logged By:
Date Begin - End:
Hor.-Vert. Datum:
Weather:
Drill Crew:
Truck Mounted M11
Approx. 6 in.
J. Anderson
Hollow Stem AugerPlunge: -90 degrees
Jeremy
Add
ition
al T
ests
/R
emar
ks
Blo
w C
ount
s(B
C)=
Unc
orr.
Blo
ws/
6 in
.
Poc
ket
Pen
(PP
)=
tsf
Liqu
id L
imit
Pla
stic
ity In
dex
(NP
=N
onP
last
ic)
CONTRA COSTA COMMUNITY COLLEGENEW SCIENCE BUILDING
2600 MISSION BELL DRIVESAN PABLO, CALIFORNIA
Dep
th (
feet
)
5
10
15
20
25
30
App
roxi
mat
eE
leva
tion
(fee
t)
90
85
80
75
70
65
60
Gra
phic
al L
og
Rec
over
y(N
R=
No
Rec
over
y)
US
CS
Sym
bol
Wat
erC
onte
nt (
%)
DATE: 9/19/2017
DRAWN BY: MAP/JDS
REVISED: -
PROJECT NO.: 20181569
CHECKED BY: OK
gIN
T F
ILE
: K
lf_gi
nt_m
aste
r_20
17
P
RO
JEC
T N
UM
BE
R:
2018
156
9.0
01A
O
FF
ICE
FIL
TE
R:
PLE
AS
AN
TO
N
gIN
T T
EM
PLA
TE
: E
:KLF
_S
TA
ND
AR
D_G
INT
_LIB
RA
RY
_201
7.G
LB
[__K
LF_
BO
RIN
G/T
ES
T P
IT S
OIL
LO
G]
PLO
TT
ED
: 10
/03/
201
7 0
1:3
9 P
M B
Y:
JSal
a
Sam
ple
Typ
e

CLAYSTONE: fine-grained, yellowish brown,moderately weathered, medium strong
- light brownish gray, slightly weathered, medium strongto strong
The boring was terminated at approximately 40.5 ft.below ground surface. The boring was backfilled withcement grout on August 11, 2017.
BC=2650
BC=4450/2"
Groundwater was not observed during drilling or after completion.GENERAL NOTES:The exploration location and elevation are approximate and wereestimated by Kleinfelder.
GROUNDWATER LEVEL INFORMATION:
2"
8"
BORING LOG B-1 FIGURE
A-4
2 of 2
LABORATORY RESULTS
Lithologic Description
PAGE:
FIELD EXPLORATION
BORING LOG B-1
Dry
Uni
t Wt.
(pcf
)
Pas
sing
#4
(%)
Pas
sing
#20
0 (%
)
Latitude: 37.96986° NLongitude: -122.33678° E
Approximate Ground Surface Elevation (ft.): 92.00 Surface Condition: Asphalt
Not Available
Gregg - #CA107979Drilling Co.-Lic.#:
Drilling Method:
Drilling Equipment:
8/11/2017
Cloudy Exploration Diameter:
Hammer Type - Drop: 140 lb. Auto - 30 in.
Logged By:
Date Begin - End:
Hor.-Vert. Datum:
Weather:
Drill Crew:
Truck Mounted M11
Approx. 6 in.
J. Anderson
Hollow Stem AugerPlunge: -90 degrees
Jeremy
Add
ition
al T
ests
/R
emar
ks
Blo
w C
ount
s(B
C)=
Unc
orr.
Blo
ws/
6 in
.
Poc
ket
Pen
(PP
)=
tsf
Liqu
id L
imit
Pla
stic
ity In
dex
(NP
=N
onP
last
ic)
CONTRA COSTA COMMUNITY COLLEGENEW SCIENCE BUILDING
2600 MISSION BELL DRIVESAN PABLO, CALIFORNIA
Dep
th (
feet
)
40
45
50
55
60
65
App
roxi
mat
eE
leva
tion
(fee
t)
55
50
45
40
35
30
25
Gra
phic
al L
og
Rec
over
y(N
R=
No
Rec
over
y)
US
CS
Sym
bol
Wat
erC
onte
nt (
%)
DATE: 9/19/2017
DRAWN BY: MAP/JDS
REVISED: -
PROJECT NO.: 20181569
CHECKED BY: OK
gIN
T F
ILE
: K
lf_gi
nt_m
aste
r_20
17
P
RO
JEC
T N
UM
BE
R:
2018
156
9.0
01A
O
FF
ICE
FIL
TE
R:
PLE
AS
AN
TO
N
gIN
T T
EM
PLA
TE
: E
:KLF
_S
TA
ND
AR
D_G
INT
_LIB
RA
RY
_201
7.G
LB
[__K
LF_
BO
RIN
G/T
ES
T P
IT S
OIL
LO
G]
PLO
TT
ED
: 10
/03/
201
7 0
1:3
9 P
M B
Y:
JSal
a
Sam
ple
Typ
e

110.8
118.9
approximately 2-inches of asphalt
Clayey SAND (SC): fine to medium-grained sand, lowplasticity, mottled yellowish brown, dry, medium dense
Lean CLAY (CL): medium plasticity, yellowish brown,moist, very stiff
CLAYSTONE: fine-grained, yellowish brown,moderately weathered to highly weathered, weak tomedium strong
reddish yellow, fragmented moderately weathered,weak to medium strong
olive brown, weak to medium strong
- yellowish brown with reddish brown stains, moderatelyweathered, intensely fractured medium strong
weak
medium-grained, yellow, moderately weathered, weak,highly fractured, interbedded with subrounded gravel
Very hard drilling
BC=101214
BC=171826
BC=161450/4"
BC=143650/5"
BC=2350
BC=131420
BC=111834
12"
6"
10"
2"
4"
2"
10"
11.3
9.5
BORING LOG B-2 FIGURE
A-5
1 of 2
LABORATORY RESULTS
Lithologic Description
PAGE:
FIELD EXPLORATION
BORING LOG B-2
Dry
Uni
t Wt.
(pcf
)
Pas
sing
#4
(%)
Pas
sing
#20
0 (%
)
Latitude: 37.96973° NLongitude: -122.33647° E
Approximate Ground Surface Elevation (ft.): 93.00 Surface Condition: Asphalt
Not Available
Gregg - #CA107979Drilling Co.-Lic.#:
Drilling Method:
Drilling Equipment:
8/11/2017
Cloudy Exploration Diameter:
Hammer Type - Drop: 140 lb. Auto - 30 in.
Logged By:
Date Begin - End:
Hor.-Vert. Datum:
Weather:
Drill Crew:
Truck Mounted M11
Approx. 6 in.
J. Anderson
Hollow Stem AugerPlunge: -90 degrees
Jeremy
Add
ition
al T
ests
/R
emar
ks
Blo
w C
ount
s(B
C)=
Unc
orr.
Blo
ws/
6 in
.
Poc
ket
Pen
(PP
)=
tsf
Liqu
id L
imit
Pla
stic
ity In
dex
(NP
=N
onP
last
ic)
CONTRA COSTA COMMUNITY COLLEGENEW SCIENCE BUILDING
2600 MISSION BELL DRIVESAN PABLO, CALIFORNIA
Dep
th (
feet
)
5
10
15
20
25
30
App
roxi
mat
eE
leva
tion
(fee
t)
90
85
80
75
70
65
60
Gra
phic
al L
og
Rec
over
y(N
R=
No
Rec
over
y)
US
CS
Sym
bol
Wat
erC
onte
nt (
%)
DATE: 9/19/2017
DRAWN BY: MAP/JDS
REVISED: -
PROJECT NO.: 20181569
CHECKED BY: OK
gIN
T F
ILE
: K
lf_gi
nt_m
aste
r_20
17
P
RO
JEC
T N
UM
BE
R:
2018
156
9.0
01A
O
FF
ICE
FIL
TE
R:
PLE
AS
AN
TO
N
gIN
T T
EM
PLA
TE
: E
:KLF
_S
TA
ND
AR
D_G
INT
_LIB
RA
RY
_201
7.G
LB
[__K
LF_
BO
RIN
G/T
ES
T P
IT S
OIL
LO
G]
PLO
TT
ED
: 10
/03/
201
7 0
1:4
0 P
M B
Y:
JSal
a
Sam
ple
Typ
e

CLAYSTONE: fine-grained, yellowish brown,moderately weathered to highly weathered, weak tomedium strongfine-grained, light brownish gray, weak to mediumstrong, highly fractured
The boring was terminated at approximately 41 ft.below ground surface. The boring was backfilled withcement grout on August 11, 2017.
BC=92950/5"
BC=2150
Groundwater was not observed during drilling or after completion.GENERAL NOTES:The exploration location and elevation are approximate and wereestimated by Kleinfelder.
GROUNDWATER LEVEL INFORMATION:
3"
BORING LOG B-2 FIGURE
A-5
2 of 2
LABORATORY RESULTS
Lithologic Description
PAGE:
FIELD EXPLORATION
BORING LOG B-2
Dry
Uni
t Wt.
(pcf
)
Pas
sing
#4
(%)
Pas
sing
#20
0 (%
)
Latitude: 37.96973° NLongitude: -122.33647° E
Approximate Ground Surface Elevation (ft.): 93.00 Surface Condition: Asphalt
Not Available
Gregg - #CA107979Drilling Co.-Lic.#:
Drilling Method:
Drilling Equipment:
8/11/2017
Cloudy Exploration Diameter:
Hammer Type - Drop: 140 lb. Auto - 30 in.
Logged By:
Date Begin - End:
Hor.-Vert. Datum:
Weather:
Drill Crew:
Truck Mounted M11
Approx. 6 in.
J. Anderson
Hollow Stem AugerPlunge: -90 degrees
Jeremy
Add
ition
al T
ests
/R
emar
ks
Blo
w C
ount
s(B
C)=
Unc
orr.
Blo
ws/
6 in
.
Poc
ket
Pen
(PP
)=
tsf
Liqu
id L
imit
Pla
stic
ity In
dex
(NP
=N
onP
last
ic)
CONTRA COSTA COMMUNITY COLLEGENEW SCIENCE BUILDING
2600 MISSION BELL DRIVESAN PABLO, CALIFORNIA
Dep
th (
feet
)
40
45
50
55
60
65
App
roxi
mat
eE
leva
tion
(fee
t)
55
50
45
40
35
30
25
Gra
phic
al L
og
Rec
over
y(N
R=
No
Rec
over
y)
US
CS
Sym
bol
Wat
erC
onte
nt (
%)
DATE: 9/19/2017
DRAWN BY: MAP/JDS
REVISED: -
PROJECT NO.: 20181569
CHECKED BY: OK
gIN
T F
ILE
: K
lf_gi
nt_m
aste
r_20
17
P
RO
JEC
T N
UM
BE
R:
2018
156
9.0
01A
O
FF
ICE
FIL
TE
R:
PLE
AS
AN
TO
N
gIN
T T
EM
PLA
TE
: E
:KLF
_S
TA
ND
AR
D_G
INT
_LIB
RA
RY
_201
7.G
LB
[__K
LF_
BO
RIN
G/T
ES
T P
IT S
OIL
LO
G]
PLO
TT
ED
: 10
/03/
201
7 0
1:4
0 P
M B
Y:
JSal
a
Sam
ple
Typ
e

94.7
49
Sandy Lean CLAY (CL): medium plasticity, olivebrown, moist, very stiff, (FILL)
Lean CLAY with Sand (CL): medium plasticity, olivebrown, moist, very stiff, (FILL)
Sandy Lean CLAY (CL): medium plasticity, yellowishbrown, moist, stiff
Clayey SAND (SC): non-plastic to low plasticity,yellowish brown, moist, loose
CLAYSTONE: fine-grained, olive brown, weak tomedium strong, interbedded with siltstone
light gray, medium strong to strong
moderately to slightly weathered, weak, highly fractured
TXUU: c = 1.25 ksf
BC=3813
BC=4812
BC=247
BC=445
BC=204250/5"
BC=4050/5"
BC=202526
27
33
12
18
12"
11"
12"
12"
11"
11"
12"
SC
26.8
BORING LOG B-3 FIGURE
A-6
1 of 2
LABORATORY RESULTS
Lithologic Description
PAGE:
FIELD EXPLORATION
BORING LOG B-3
Dry
Uni
t Wt.
(pcf
)
Pas
sing
#4
(%)
Pas
sing
#20
0 (%
)
Latitude: 37.96965° NLongitude: -122.33695° E
Approximate Ground Surface Elevation (ft.): 80.00 Surface Condition: Grass
Not Available
Gregg - #CA107979Drilling Co.-Lic.#:
Drilling Method:
Drilling Equipment:
8/18/2017
Overcast Exploration Diameter:
Hammer Type - Drop: 140 lb. Auto - 30 in.
Logged By:
Date Begin - End:
Hor.-Vert. Datum:
Weather:
Drill Crew:
D42
Approx. 6 in.
J. Anderson
Hollow Stem AugerPlunge: -90 degrees
Jeremy and Leo
Add
ition
al T
ests
/R
emar
ks
Blo
w C
ount
s(B
C)=
Unc
orr.
Blo
ws/
6 in
.
Poc
ket
Pen
(PP
)=
tsf
Liqu
id L
imit
Pla
stic
ity In
dex
(NP
=N
onP
last
ic)
CONTRA COSTA COMMUNITY COLLEGENEW SCIENCE BUILDING
2600 MISSION BELL DRIVESAN PABLO, CALIFORNIA
Dep
th (
feet
)
5
10
15
20
25
30
App
roxi
mat
eE
leva
tion
(fee
t)
75
70
65
60
55
50
Gra
phic
al L
og
Rec
over
y(N
R=
No
Rec
over
y)
US
CS
Sym
bol
Wat
erC
onte
nt (
%)
DATE: 9/19/2017
DRAWN BY: MAP/JDS
REVISED: -
PROJECT NO.: 20181569
CHECKED BY: OK
gIN
T F
ILE
: K
lf_gi
nt_m
aste
r_20
17
P
RO
JEC
T N
UM
BE
R:
2018
156
9.0
01A
O
FF
ICE
FIL
TE
R:
PLE
AS
AN
TO
N
gIN
T T
EM
PLA
TE
: E
:KLF
_S
TA
ND
AR
D_G
INT
_LIB
RA
RY
_201
7.G
LB
[__K
LF_
BO
RIN
G/T
ES
T P
IT S
OIL
LO
G]
PLO
TT
ED
: 10
/03/
201
7 0
1:4
0 P
M B
Y:
JSal
a
Sam
ple
Typ
e

CLAYSTONE: fine-grained, olive gray, weak
olive, medium strong
The boring was terminated at approximately 41.5 ft.below ground surface. The boring was backfilled withcement grout on August 18, 2017.
BC=182730
BC=173650/5"
Groundwater was not observed during drilling or after completion.GENERAL NOTES:The exploration location and elevation are approximate and wereestimated by Kleinfelder.
GROUNDWATER LEVEL INFORMATION:
12"
BORING LOG B-3 FIGURE
A-6
2 of 2
LABORATORY RESULTS
Lithologic Description
PAGE:
FIELD EXPLORATION
BORING LOG B-3
Dry
Uni
t Wt.
(pcf
)
Pas
sing
#4
(%)
Pas
sing
#20
0 (%
)
Latitude: 37.96965° NLongitude: -122.33695° E
Approximate Ground Surface Elevation (ft.): 80.00 Surface Condition: Grass
Not Available
Gregg - #CA107979Drilling Co.-Lic.#:
Drilling Method:
Drilling Equipment:
8/18/2017
Overcast Exploration Diameter:
Hammer Type - Drop: 140 lb. Auto - 30 in.
Logged By:
Date Begin - End:
Hor.-Vert. Datum:
Weather:
Drill Crew:
D42
Approx. 6 in.
J. Anderson
Hollow Stem AugerPlunge: -90 degrees
Jeremy and Leo
Add
ition
al T
ests
/R
emar
ks
Blo
w C
ount
s(B
C)=
Unc
orr.
Blo
ws/
6 in
.
Poc
ket
Pen
(PP
)=
tsf
Liqu
id L
imit
Pla
stic
ity In
dex
(NP
=N
onP
last
ic)
CONTRA COSTA COMMUNITY COLLEGENEW SCIENCE BUILDING
2600 MISSION BELL DRIVESAN PABLO, CALIFORNIA
Dep
th (
feet
)
40
45
50
55
60
65
App
roxi
mat
eE
leva
tion
(fee
t)
40
35
30
25
20
15
Gra
phic
al L
og
Rec
over
y(N
R=
No
Rec
over
y)
US
CS
Sym
bol
Wat
erC
onte
nt (
%)
DATE: 9/19/2017
DRAWN BY: MAP/JDS
REVISED: -
PROJECT NO.: 20181569
CHECKED BY: OK
gIN
T F
ILE
: K
lf_gi
nt_m
aste
r_20
17
P
RO
JEC
T N
UM
BE
R:
2018
156
9.0
01A
O
FF
ICE
FIL
TE
R:
PLE
AS
AN
TO
N
gIN
T T
EM
PLA
TE
: E
:KLF
_S
TA
ND
AR
D_G
INT
_LIB
RA
RY
_201
7.G
LB
[__K
LF_
BO
RIN
G/T
ES
T P
IT S
OIL
LO
G]
PLO
TT
ED
: 10
/03/
201
7 0
1:4
0 P
M B
Y:
JSal
a
Sam
ple
Typ
e

16
Lean Fat CLAY with Sand (CL): medium to highplasticity, olive brown, moist, hard, (FILL)
Lean CLAY with Sand (CL): medium plasticity, olivebrown, moist, hard, (FILL)
increase in sand content, very stiff, organics, brickfragments
with gravel and brick at 11.5 feet
Clayey GRAVEL with Sand (GC): dark brown, moist,medium dense, fine to coarse gravel
Clayey SAND with Gravel (SC): medium tocoarse-grained, olive brown, moist, medium dense
Sandy CLAYSTONE: fine-grained, olive, weak tomedium strong, moderately weathered, interbeddedwith siltstone
medium strong
medium strong to strong
The boring was terminated at approximately 31 ft.below ground surface. The boring was backfilled withcement grout on August 18, 2017.
BC=111316
PP=4-4.5+
BC=91223
PP=4.5
BC=91112
PP=1.5-1.75
BC=171812
BC=202725
BC=183348
BC=2750/5"
43 28
Groundwater was not observed during drilling or after completion.GENERAL NOTES:The exploration location and elevation are approximate and wereestimated by Kleinfelder.
GROUNDWATER LEVEL INFORMATION:
11"
12"
12"
12"
BORING LOG B-4 FIGURE
A-7
1 of 1
LABORATORY RESULTS
Lithologic Description
PAGE:
FIELD EXPLORATION
BORING LOG B-4
Dry
Uni
t Wt.
(pcf
)
Pas
sing
#4
(%)
Pas
sing
#20
0 (%
)
Latitude: 37.96953° NLongitude: -122.33673° E
Approximate Ground Surface Elevation (ft.): 80.00 Surface Condition: Grass
Not Available
Gregg - #CA107979Drilling Co.-Lic.#:
Drilling Method:
Drilling Equipment:
8/18/2017
Overcast Exploration Diameter:
Hammer Type - Drop: 140 lb. Auto - 30 in.
Logged By:
Date Begin - End:
Hor.-Vert. Datum:
Weather:
Drill Crew:
D42
Approx. 6 in.
J. Anderson
Hollow Stem AugerPlunge: -90 degrees
Jeremy and Leo
Add
ition
al T
ests
/R
emar
ks
Blo
w C
ount
s(B
C)=
Unc
orr.
Blo
ws/
6 in
.
Poc
ket
Pen
(PP
)=
tsf
Liqu
id L
imit
Pla
stic
ity In
dex
(NP
=N
onP
last
ic)
CONTRA COSTA COMMUNITY COLLEGENEW SCIENCE BUILDING
2600 MISSION BELL DRIVESAN PABLO, CALIFORNIA
Dep
th (
feet
)
5
10
15
20
25
30
App
roxi
mat
eE
leva
tion
(fee
t)
75
70
65
60
55
50
Gra
phic
al L
og
Rec
over
y(N
R=
No
Rec
over
y)
US
CS
Sym
bol
Wat
erC
onte
nt (
%)
DATE: 9/19/2017
DRAWN BY: MAP/JDS
REVISED: -
PROJECT NO.: 20181569
CHECKED BY: OK
gIN
T F
ILE
: K
lf_gi
nt_m
aste
r_20
17
P
RO
JEC
T N
UM
BE
R:
2018
156
9.0
01A
O
FF
ICE
FIL
TE
R:
PLE
AS
AN
TO
N
gIN
T T
EM
PLA
TE
: E
:KLF
_S
TA
ND
AR
D_G
INT
_LIB
RA
RY
_201
7.G
LB
[__K
LF_
BO
RIN
G/T
ES
T P
IT S
OIL
LO
G]
PLO
TT
ED
: 10
/03/
201
7 0
1:4
0 P
M B
Y:
JSal
a
Sam
ple
Typ
e

APPENDIX B
Laboratory Results
LIST OF ATTACHMENTS The following figures are attached and complete this appendix.
Figure Laboratory Test Result Summary ......................................................... Figure B-1
Atterberg Limits .................................................................................... Figure B-2
Triaxial Compression Tests ................................................................. Figures B-3 thru B-5
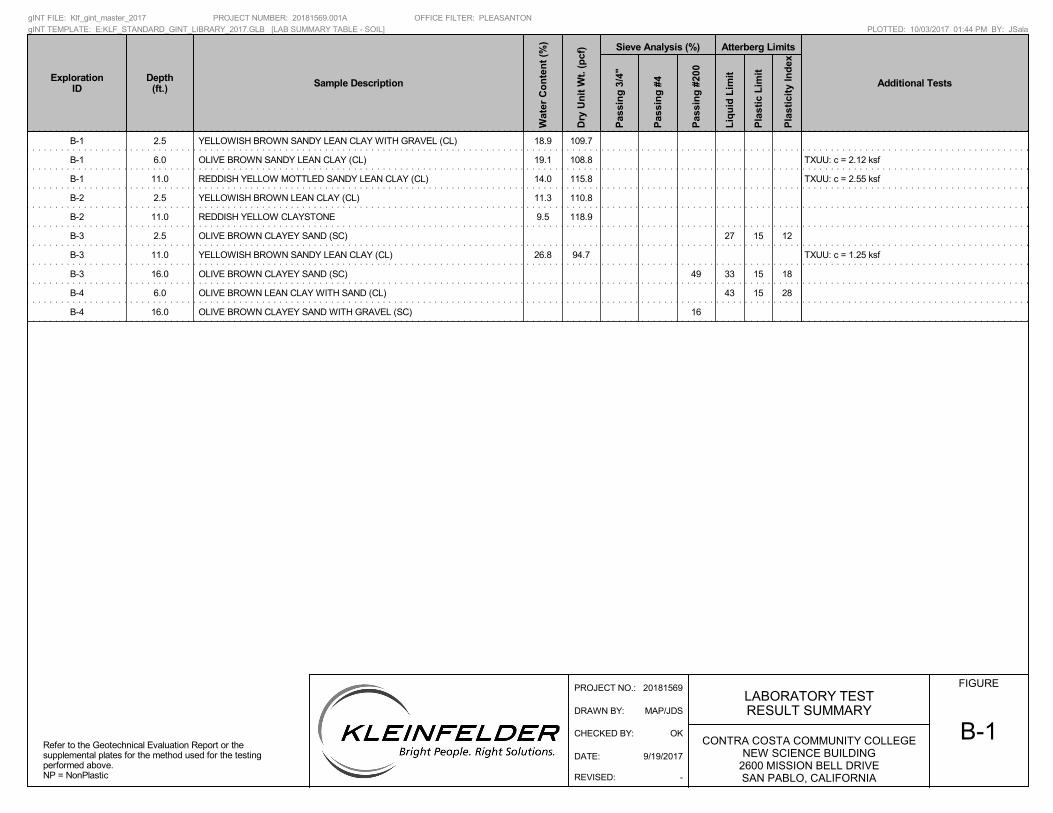
B-1 2.5 YELLOWISH BROWN SANDY LEAN CLAY WITH GRAVEL (CL) 18.9 109.7
B-1 6.0 OLIVE BROWN SANDY LEAN CLAY (CL) 19.1 108.8 TXUU: c = 2.12 ksf
B-1 11.0 REDDISH YELLOW MOTTLED SANDY LEAN CLAY (CL) 14.0 115.8 TXUU: c = 2.55 ksf
B-2 2.5 YELLOWISH BROWN LEAN CLAY (CL) 11.3 110.8
B-2 11.0 REDDISH YELLOW CLAYSTONE 9.5 118.9
B-3 2.5 OLIVE BROWN CLAYEY SAND (SC) 27 15 12
B-3 11.0 YELLOWISH BROWN SANDY LEAN CLAY (CL) 26.8 94.7 TXUU: c = 1.25 ksf
B-3 16.0 OLIVE BROWN CLAYEY SAND (SC) 49 33 15 18
B-4 6.0 OLIVE BROWN LEAN CLAY WITH SAND (CL) 43 15 28
B-4 16.0 OLIVE BROWN CLAYEY SAND WITH GRAVEL (SC) 16
Pla
stic
ity
Ind
ex
Depth(ft.)
Atterberg Limits
Liq
uid
Lim
it
Sample Description
Pla
stic
Lim
it
Wat
er C
on
ten
t (%
)
Dry
Un
it W
t. (
pcf
)
ExplorationID Additional Tests
Refer to the Geotechnical Evaluation Report or thesupplemental plates for the method used for the testingperformed above.NP = NonPlastic
FIGURELABORATORY TESTRESULT SUMMARY
B-1
Pas
sin
g 3
/4"
Sieve Analysis (%)
Pas
sin
g #
4
Pas
sin
g #
200
CONTRA COSTA COMMUNITY COLLEGENEW SCIENCE BUILDING
2600 MISSION BELL DRIVESAN PABLO, CALIFORNIA
gINT FILE: Klf_gint_master_2017 PROJECT NUMBER: 20181569.001A OFFICE FILTER: PLEASANTON
gINT TEMPLATE: E:KLF_STANDARD_GINT_LIBRARY_2017.GLB [LAB SUMMARY TABLE - SOIL] PLOTTED: 10/03/2017 01:44 PM BY: JSala
CHECKED BY: OK
DRAWN BY: MAP/JDS
REVISED: -
DATE: 9/19/2017
PROJECT NO.: 20181569

0
10
20
30
40
50
60
0 10 20 30 40 50 60 70 80 90 100 110
ATTERBERG LIMITS
LL PL PIPassing#200
B-2
Exploration ID Depth (ft.)
16
15
15
15
NM
49
NM
2.5
16
6
CL-ML
LIQUID LIMIT (LL)
PLA
ST
ICIT
Y IN
DE
X (
PI)
CL or OL
"U" L
INE
ML or OL4
7
MH or OH
"A" L
INE
CH or OH
Testing perfomed in general accordance with ASTM D4318.NP = NonplasticNM = Not Measured
Sample Description
B-3
B-3
B-4
27
33
43
12
18
28
OLIVE BROWN CLAYEY SAND (SC)
OLIVE BROWN CLAYEY SAND (SC)
OLIVE BROWN LEAN CLAY WITH SAND (CL)
FIGURE
CONTRA COSTA COMMUNITY COLLEGENEW SCIENCE BUILDING
2600 MISSION BELL DRIVESAN PABLO, CALIFORNIA
Chart Reference: ASTM D2487
DATE: 9/19/2017
DRAWN BY: MAP/JDS
REVISED: -
PROJECT NO.: 20181569
CHECKED BY: OK
gIN
T F
ILE
: K
lf_gi
nt_m
aste
r_20
17
P
RO
JEC
T N
UM
BE
R:
2018
156
9.0
01A
O
FF
ICE
FIL
TE
R:
PLE
AS
AN
TO
N
gIN
T T
EM
PLA
TE
: E
:KLF
_S
TA
ND
AR
D_G
INT
_LIB
RA
RY
_201
7.G
LB
[_K
LF_A
TT
ER
BE
RG
(A
ST
M)]
PLO
TT
ED
: 09
/19/
201
7 1
0:1
9 A
M B
Y:
JSal
a
For classification of fine-grained soilsand fine-grained fraction of coarse-grainedsoils.

c = ksf Specimen Shear Picture
1
Diameter, in DO 2.39
Height, in HO 5.69
Water Content, % ωO 19.1
Dry Density, lbs/ft3 g
do 108.8
Saturation, % SO 97
Void Ratio eO 0.519
Minor Principal Stress, ksf s3 0.36
Maximum Deviator Stress, ksf 4.25
Time to (s1-s3)max, min tf 14.33
4.19
Ultimate Deviator Stress, ksf na
Rate of strain, %/min 'ε 1.00
Axial Strain at Failure, % εf 14.33
Description of Specimen: Olive Brown Sandy Lean Clay (CL)
Amount of Material Finer than the No. 200, %: nm
LL: nm PL: nm PI: nm GS: 2.65 Assumed Undisturbed Test Method: ASTM D2850
Membrane correction applied
Remarks: nm= not measured, na = not applicable
Project No.:
Date:
Logo Here Entry By: CP
Checked By: CP
File Name: HL10558
Deviator Stress @ 15% Axial Strain, ksf (s1-s3)15%
(s1-s3)ult
Total
2.12
2C
6.0
9/8/17
Initia
l
(s1-s3)max
Specimen No.
Normal Stress, σ, ksf
FIGURE
B-3
9/11/17
20181569
CONTRA COSTA COMMUNITY COLLEGE
NEW SCIENCE BUILDING
2600 MISSION BELL DRIVE
SAN PABLO, CALIFORNIA
Shear
Str
ess,
Τ,
ksf
2601 Barrington Ct, Hayward, CA 94545
Axial Strain, ε, %
Devia
tor
Str
ess,
σ1-σ
3,
ksf
Specimen Type:
Boring:
Sample:
Depth, ft:
TRIAXIAL COMPRESSION
TEST (UU)
Test Date:
B-1
0.00
0.50
1.00
1.50
2.00
2.50
3.00
3.50
4.00
4.50
0.0 5.0 10.0 15.0 20.0
Specimen 1
0.00
1.00
2.00
3.00
4.00
5.00
6.00
7.00
8.00
9.00
10.00
0.00 2.00 4.00 6.00 8.00 10.00 12.00 14.00 16.00 18.00 20.00
Total

c = ksf Specimen Shear Picture
1
Diameter, in DO 2.43
Height, in HO 5.67
Water Content, % ωO 14.0
Dry Density, lbs/ft3 g
do 115.8
Saturation, % SO 87
Void Ratio eO 0.428
Minor Principal Stress, ksf s3 0.65
Maximum Deviator Stress, ksf 5.10
Time to (s1-s3)max, min tf 12.33
5.05
Ultimate Deviator Stress, ksf na
Rate of strain, %/min 'ε 1.00
Axial Strain at Failure, % εf 12.33
Description of Specimen: Brown Lean Clay with Sand (CL)
Amount of Material Finer than the No. 200, %: nm
LL: nm PL: nm PI: nm GS: 2.65 Assumed Undisturbed Test Method: ASTM D2850
Membrane correction applied
Remarks: nm= not measured, na = not applicable
Project No.:
Date:
Logo Here Entry By: CP
Checked By: CP
File Name: HL10558
Deviator Stress @ 15% Axial Strain, ksf (s1-s3)15%
(s1-s3)ult
Total
2.55
3C
11.0
9/8/17
Initia
l
(s1-s3)max
Specimen No.
Normal Stress, σ, ksf
FIGURE
B-4
9/11/17
20181569
CONTRA COSTA COMMUNITY COLLEGE
NEW SCIENCE BUILDING
2600 MISSION BELL DRIVE
SAN PABLO, CALIFORNIA
Shear
Str
ess,
Τ,
ksf
2601 Barrington Ct, Hayward, CA 94545
Axial Strain, ε, %
Devia
tor
Str
ess,
σ1-σ
3,
ksf
Specimen Type:
Boring:
Sample:
Depth, ft:
TRIAXIAL COMPRESSION
TEST (UU)
Test Date:
B-1
0.00
1.00
2.00
3.00
4.00
5.00
6.00
0.0 5.0 10.0 15.0 20.0
Specimen 1
0.00
1.00
2.00
3.00
4.00
5.00
6.00
7.00
8.00
9.00
10.00
0.00 2.00 4.00 6.00 8.00 10.00 12.00 14.00 16.00 18.00 20.00
Total
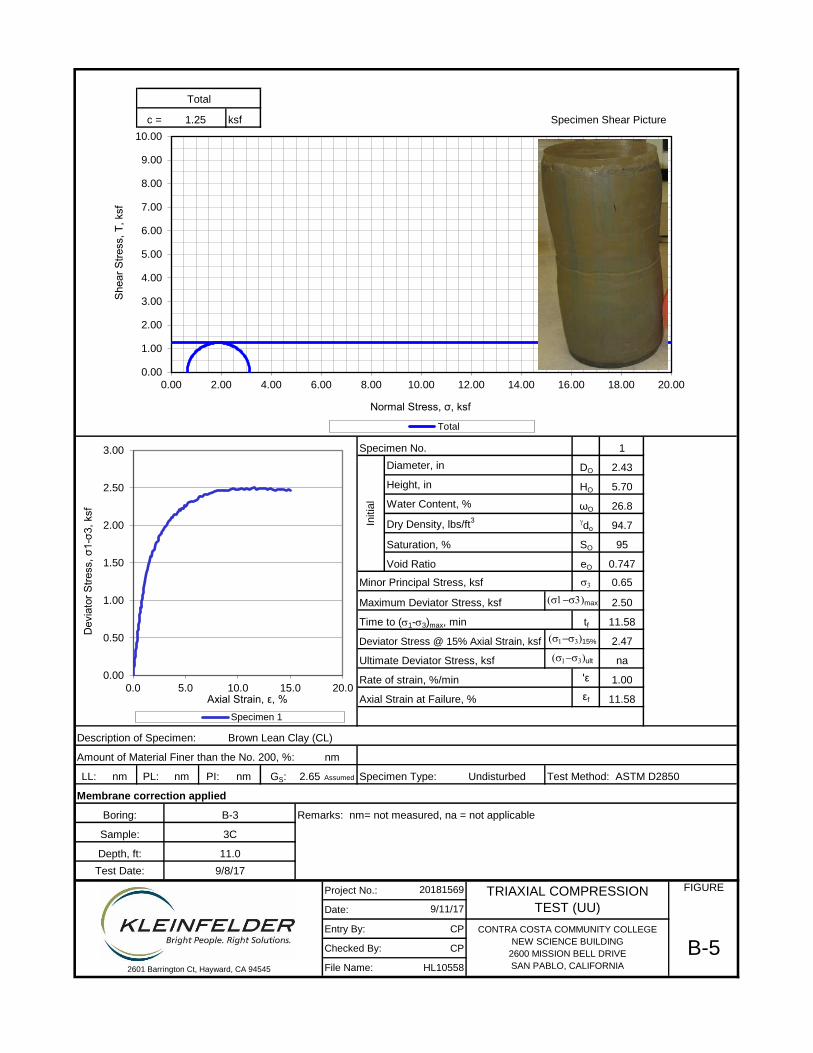
c = ksf Specimen Shear Picture
1
Diameter, in DO 2.43
Height, in HO 5.70
Water Content, % ωO 26.8
Dry Density, lbs/ft3 g
do 94.7
Saturation, % SO 95
Void Ratio eO 0.747
Minor Principal Stress, ksf s3 0.65
Maximum Deviator Stress, ksf 2.50
Time to (s1-s3)max, min tf 11.58
2.47
Ultimate Deviator Stress, ksf na
Rate of strain, %/min 'ε 1.00
Axial Strain at Failure, % εf 11.58
Description of Specimen: Brown Lean Clay (CL)
Amount of Material Finer than the No. 200, %: nm
LL: nm PL: nm PI: nm GS: 2.65 Assumed Undisturbed Test Method: ASTM D2850
Membrane correction applied
Remarks: nm= not measured, na = not applicable
Project No.:
Date:
Logo Here Entry By: CP
Checked By: CP
File Name: HL10558
Deviator Stress @ 15% Axial Strain, ksf (s1-s3)15%
(s1-s3)ult
Total
1.25
3C
11.0
9/8/17
Initia
l
(s1-s3)max
Specimen No.
Normal Stress, σ, ksf
FIGURE
B-5
9/11/17
20181569
CONTRA COSTA COMMUNITY COLLEGE
NEW SCIENCE BUILDING
2600 MISSION BELL DRIVE
SAN PABLO, CALIFORNIA
Shear
Str
ess,
Τ,
ksf
2601 Barrington Ct, Hayward, CA 94545
Axial Strain, ε, %
Devia
tor
Str
ess,
σ1-σ
3,
ksf
Specimen Type:
Boring:
Sample:
Depth, ft:
TRIAXIAL COMPRESSION
TEST (UU)
Test Date:
B-3
0.00
0.50
1.00
1.50
2.00
2.50
3.00
0.0 5.0 10.0 15.0 20.0
Specimen 1
0.00
1.00
2.00
3.00
4.00
5.00
6.00
7.00
8.00
9.00
10.00
0.00 2.00 4.00 6.00 8.00 10.00 12.00 14.00 16.00 18.00 20.00
Total

APPENDIX C
Boring Logs and Trench Logs from Previous Kleinfelder Studies
Kleinfelder, 2003, Subsurface Fault Investigation, Proposed Addition to the Student
Activities Building
Kleinfelder, 2004, Geotechnical Investigation Report, Student Activities Building Addition
Kleinfelder, 2007, Subsurface Fault Investigation at the Existing Student Activities Building
Kleinfelder, 2008, Subsurface Fault Investigation in Vicinity of the Existing Humanities
Building
Kleinfelder, 2011, Geotechnical Investigation Report, Campus Center

Kleinfelder, 2003, Subsurface Fault Investigation, Proposed Addition to the Student Activities Building
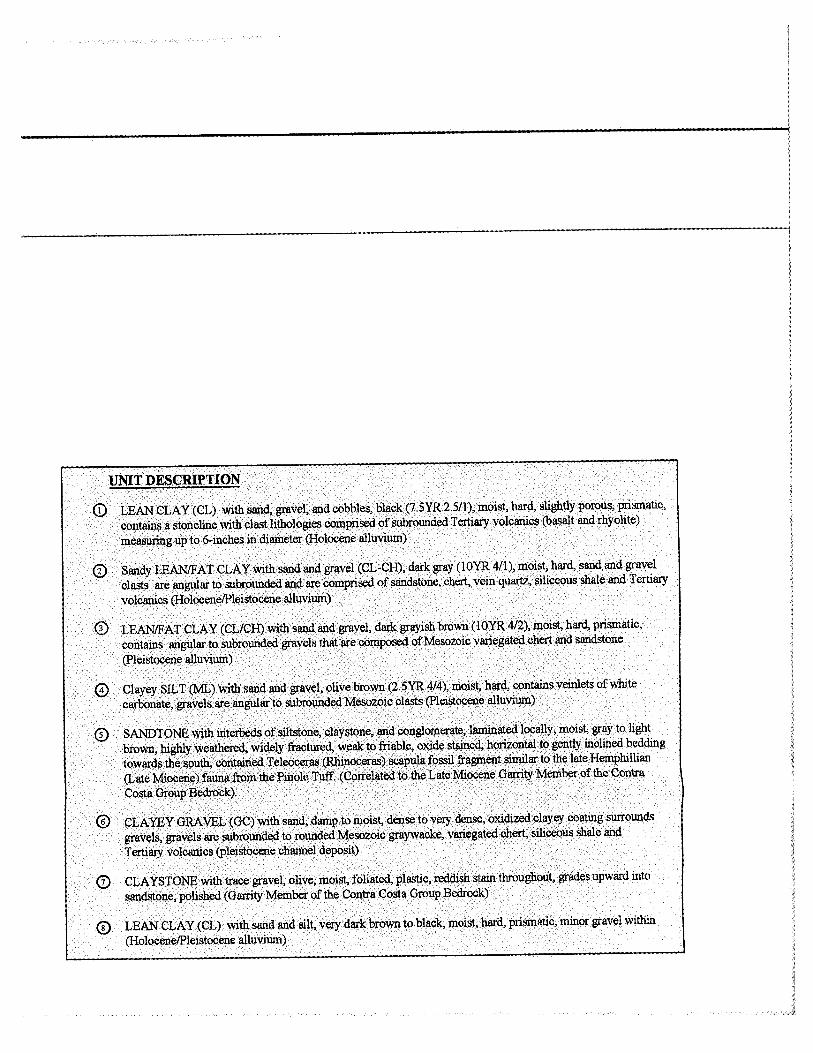

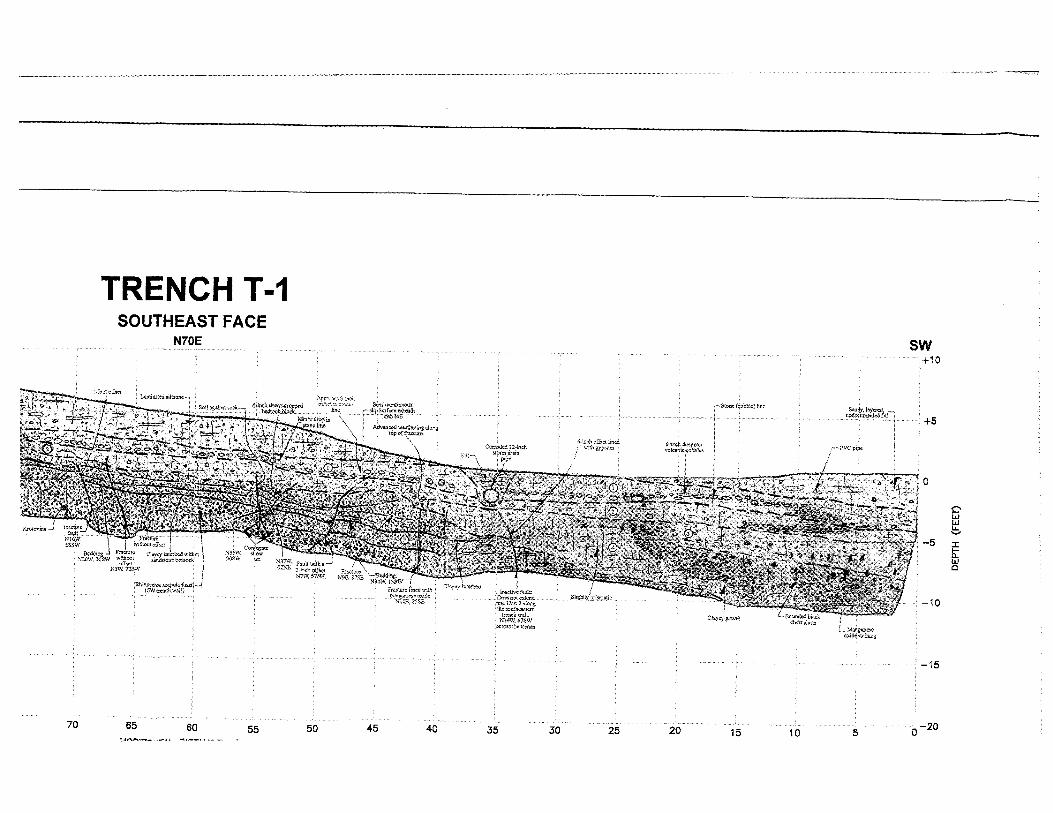
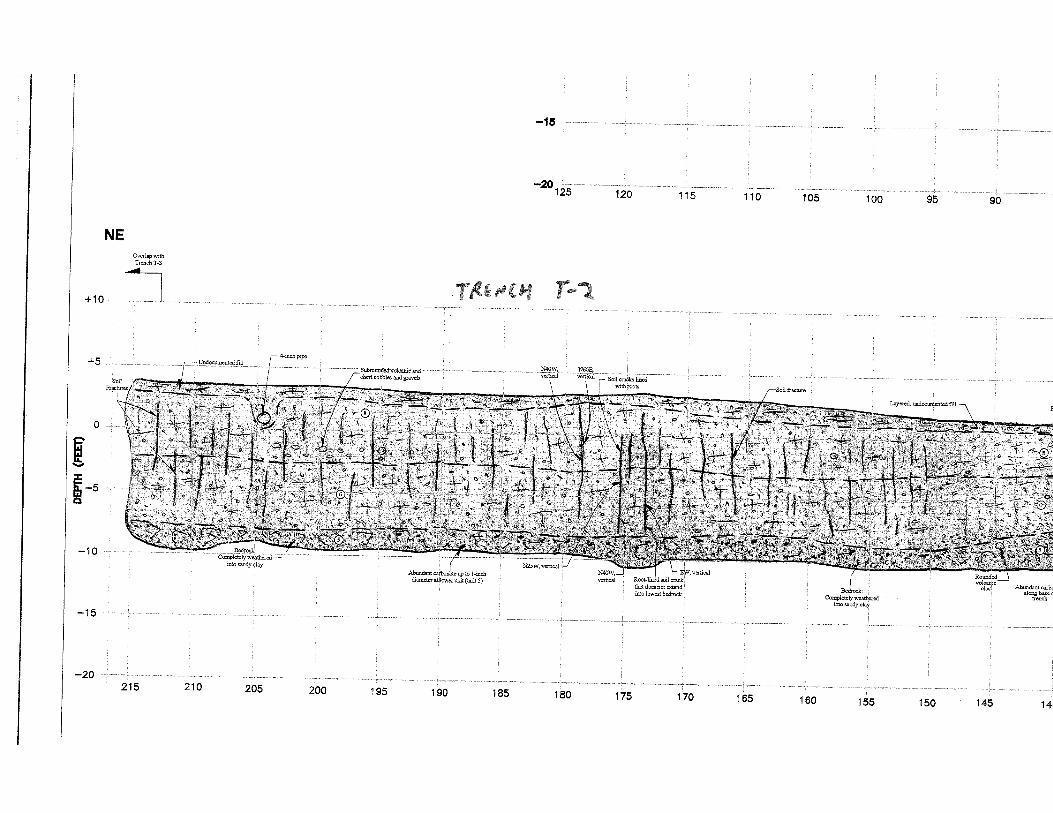
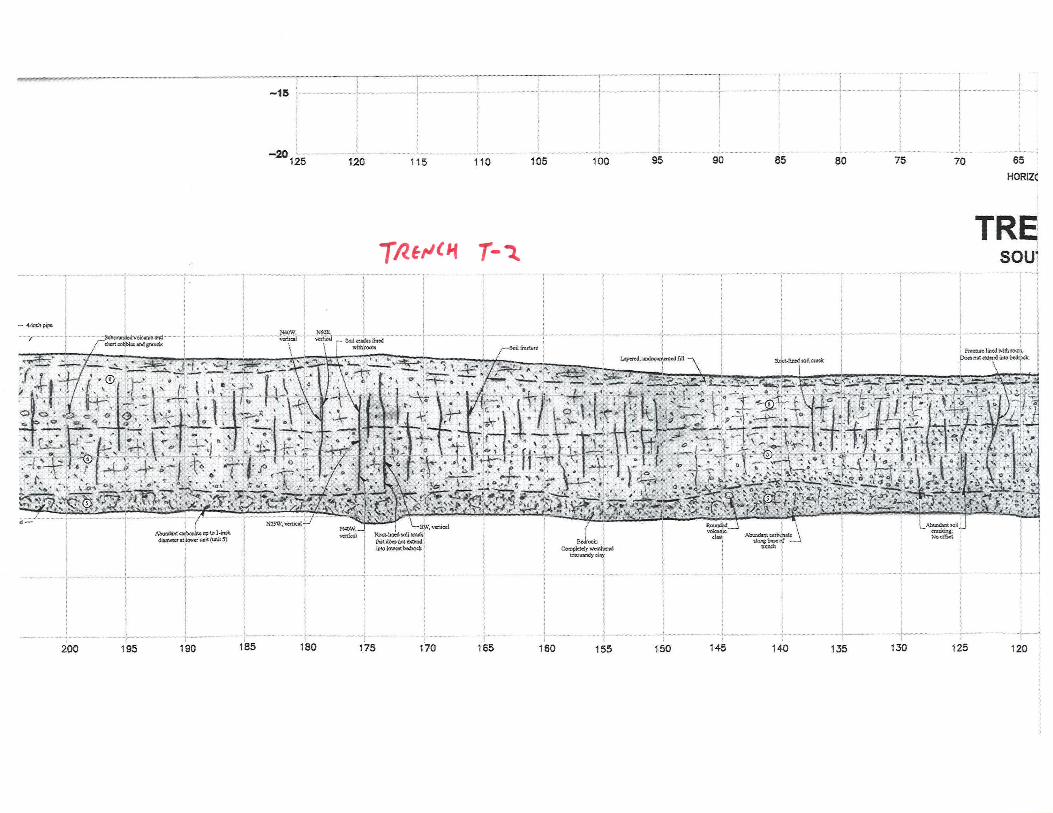

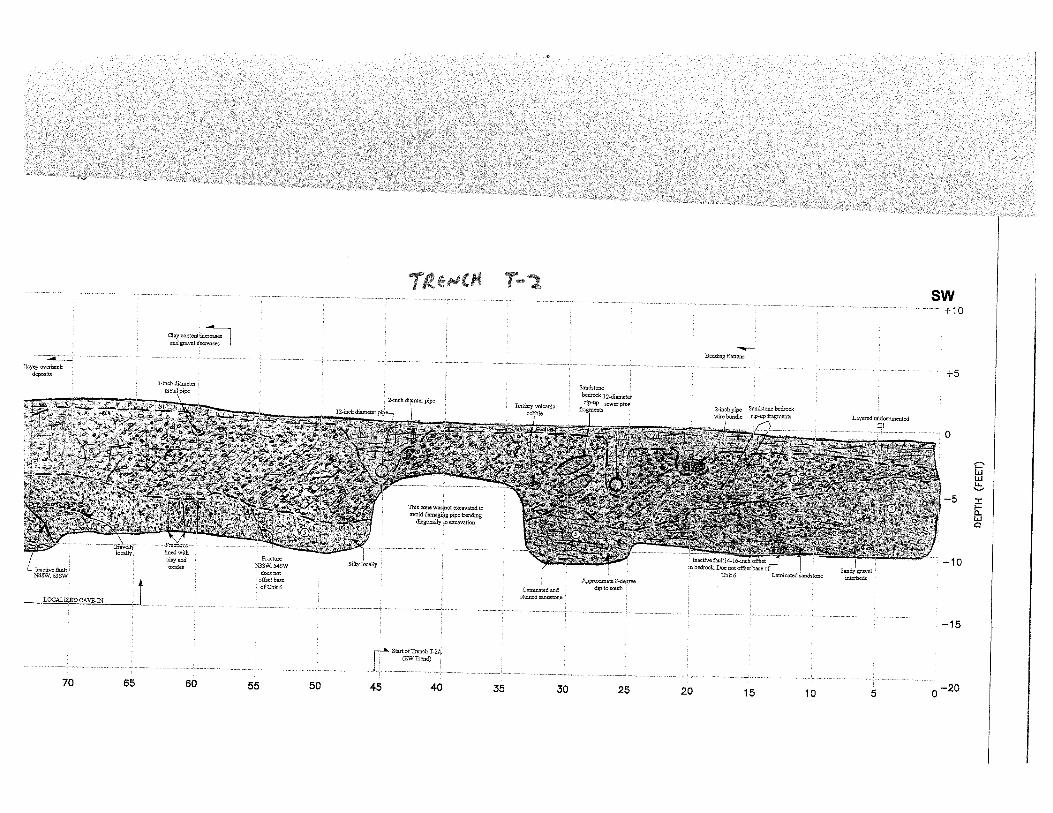
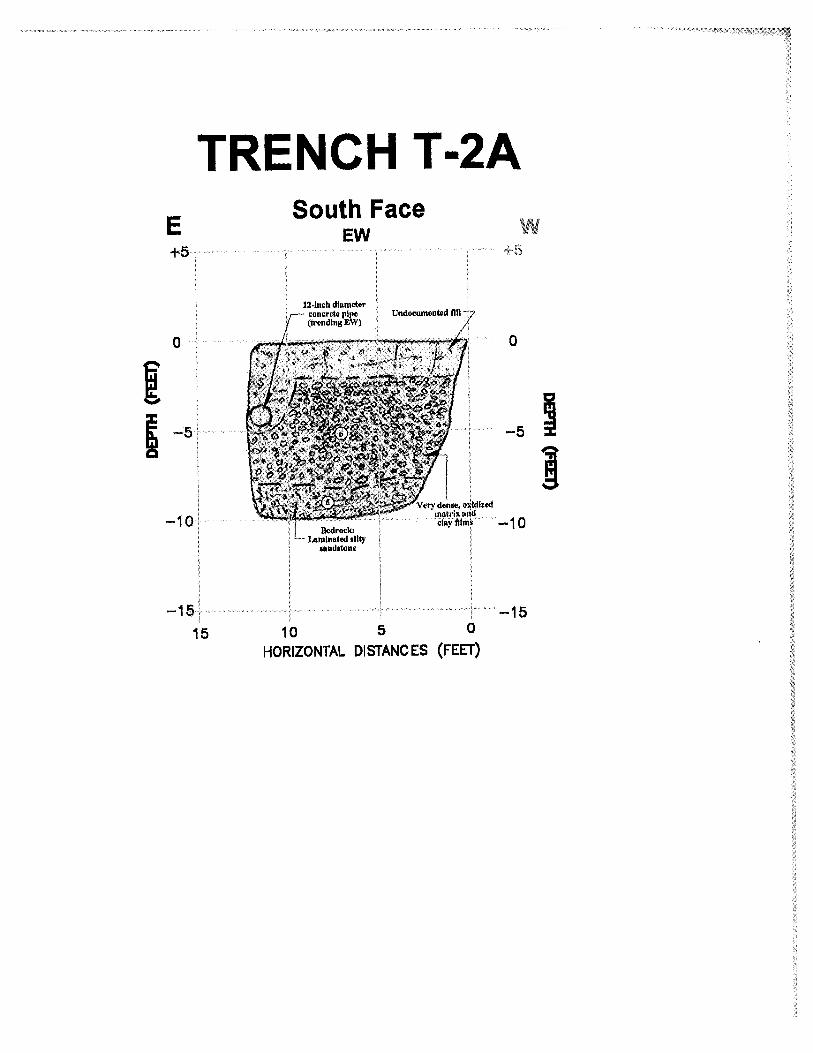

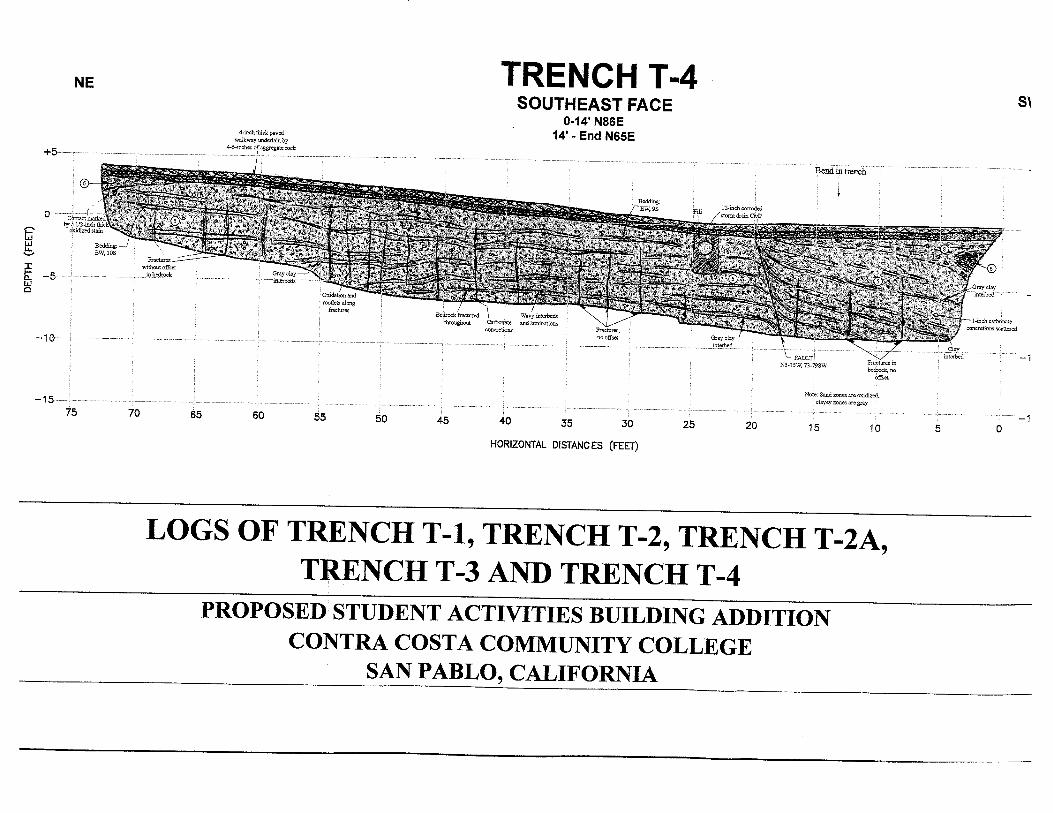

Kleinfelder, 2004, Geotechnical Investigation Report, Student Activities Building Addition

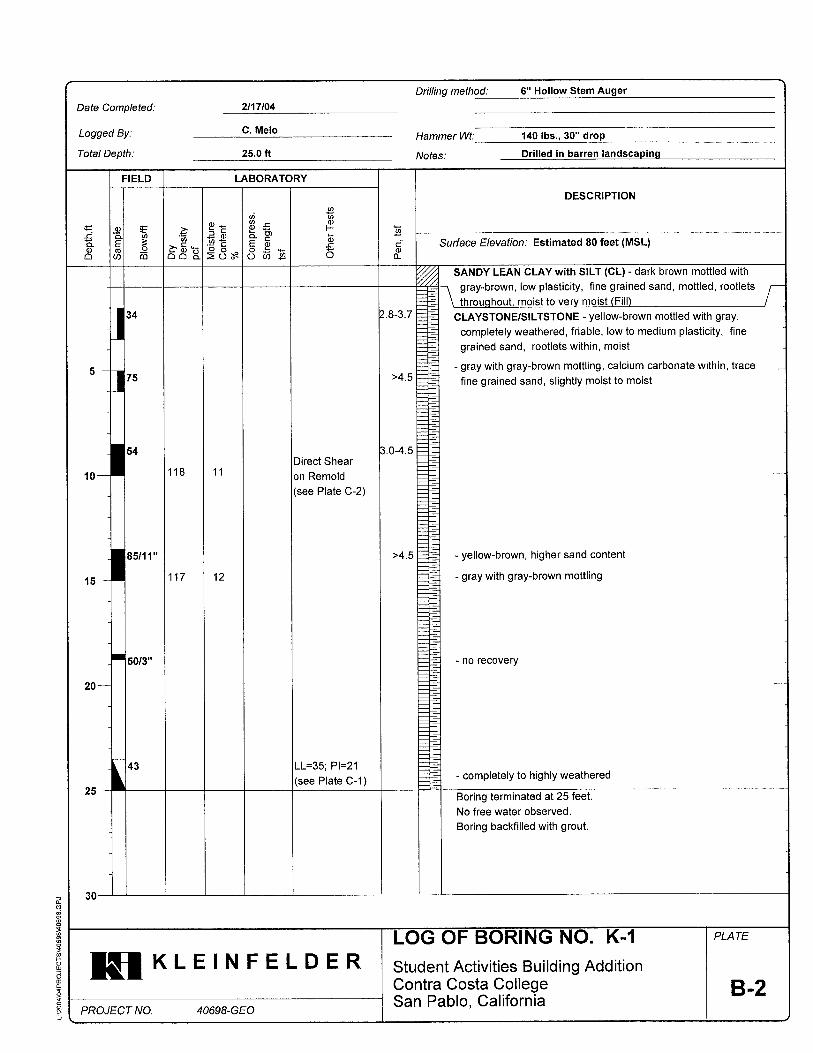

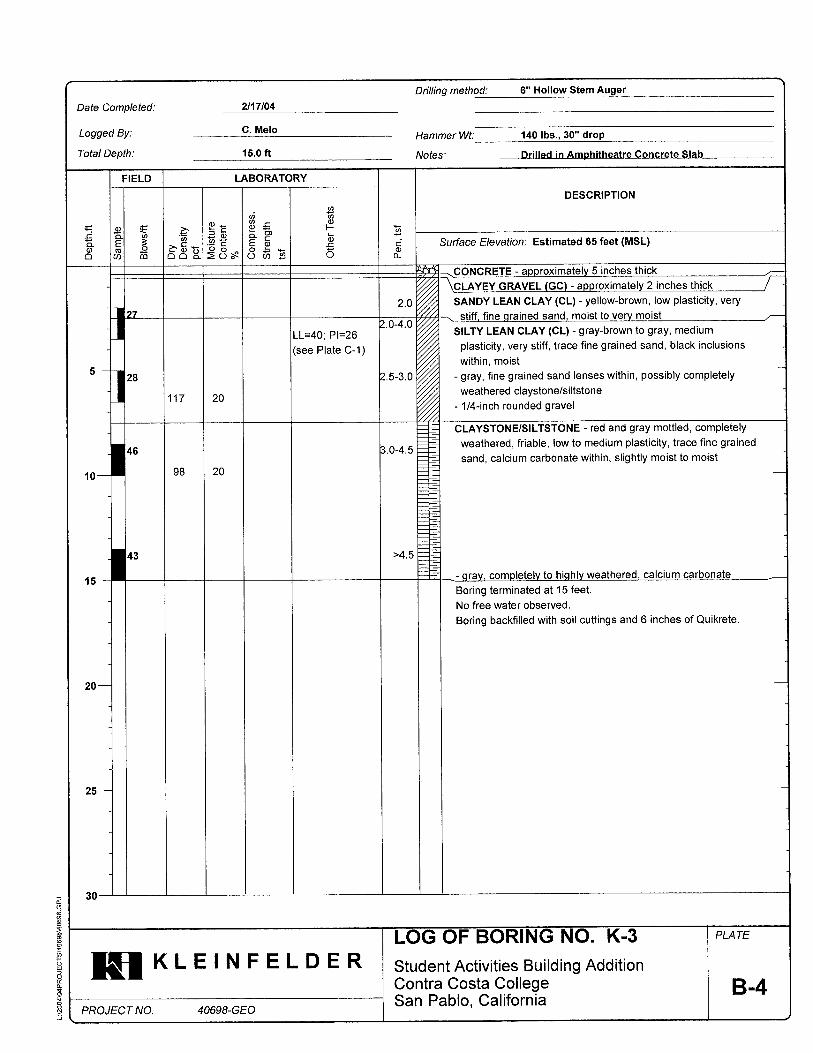

Kleinfelder, 2007, Subsurface Fault Investigation at the Existing Student Activities Building
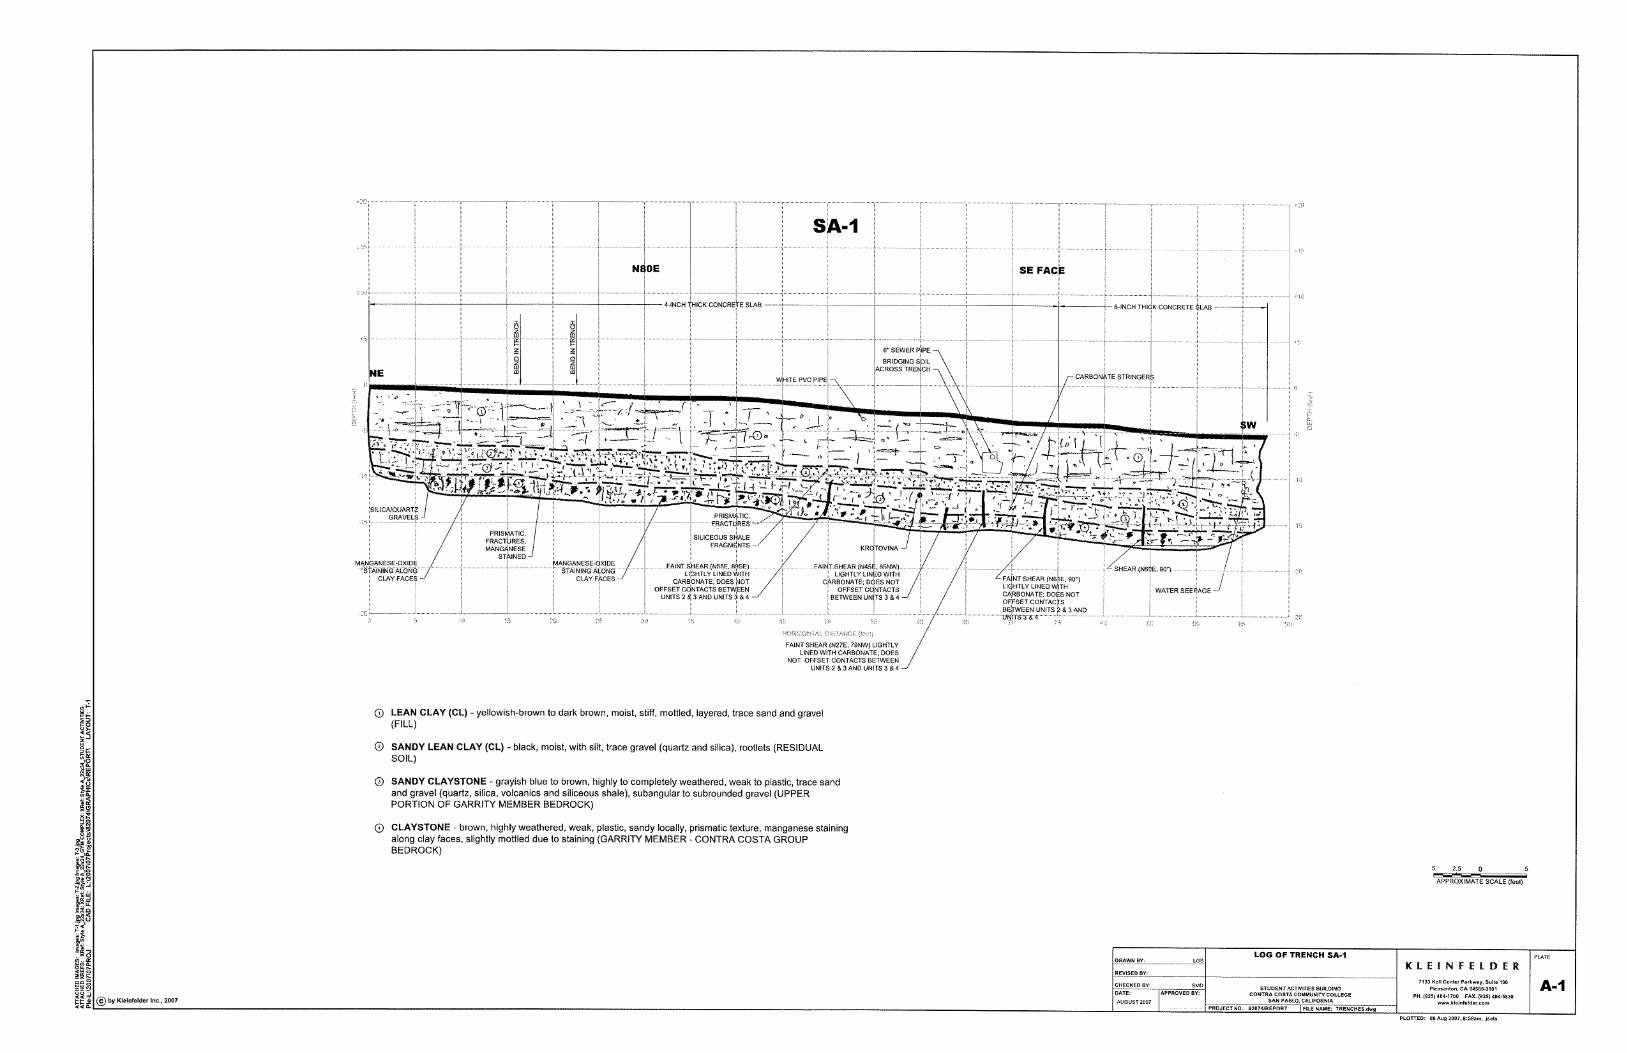


Kleinfelder, 2008, Subsurface Fault Investigation in Vicinity of the Existing Humanities Building


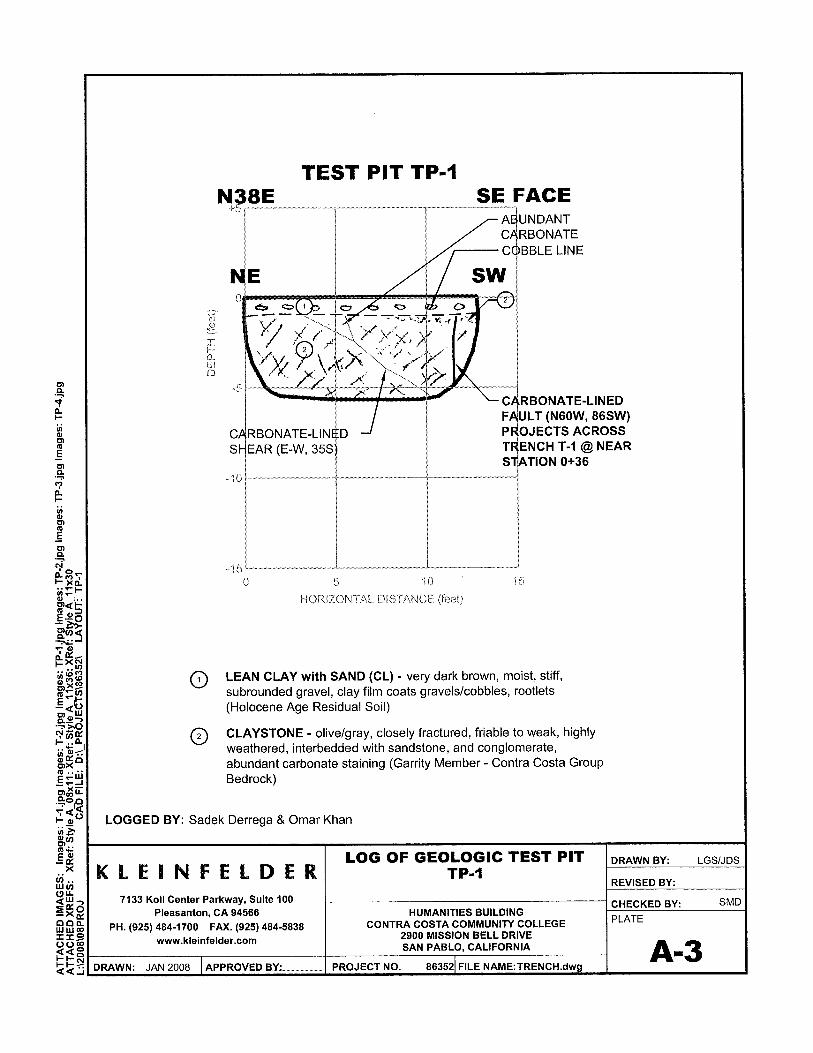
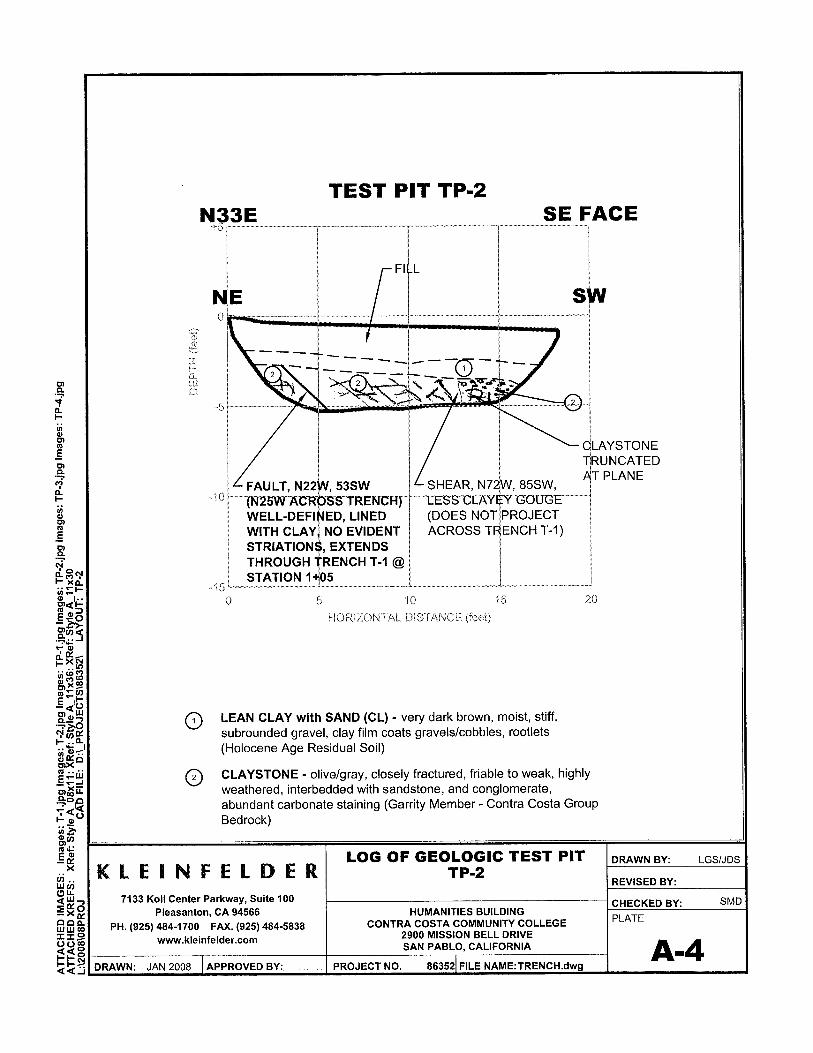


Kleinfelder, 2011, Geotechnical Investigation Report, Campus Center

Modified California Sampler 2.5 inch O.D., 2.0 inch I.D.
Inorganic fat clays (high plasticity).
Notes:
The lines separating strata on the logs represent approximate boundariesonly. The actual transition may be gradual. No warranty is provided as tothe continuity of soil strata between borings. Logs represent the soilsection observed at the boring location on the date of drilling only.
Blow counts represent the number of blows a 140-pound hammer falling 30inches required to drive a sampler through the last 12 inches of an 18 inchpenetration, unless otherwise noted.
LLPI%-#200R-ValueSECPHITXCONSOLDS
Inorganic elastic silts, micaceous or diatomaceousor silty soils.
Greater than 6.0 feet2.0 to 6.0 feet8.0 inches to 2.0 feet2.5 to 8.0 inches0.75 to 2.5 inchesLess than 0.75 inches
Silty gravels, silty gravel with sand mixture.
Standard Penetration Split Spoon Sampler 2.0 inch O.D., 1.4 inch I.D.
California Sampler, 3.0 inch O.D., 2.5 inch I.D.
GC
GM
PEN
TV:Su
112252
0745,5/31
HIGHLY ORGANIC SOILS
SILTSANDCLAYS
PROJECT NO.
PLATE
BEDDING OR LAYERING
VERY THICK OR MASSIVETHICKTHINVERY THINLAMINATEDTHINLY LAMINATED
8/5
/20
10
6:1
1:4
2 P
M
Well-graded gravels or gravel with sand,little or no fines.
Poorly-graded gravels or gravel with sand,little or no fines.
SILTSANDCLAYS
LIQUID LIMITPLASTICITY INDEXSIEVE ANALYSIS (MINUS #200 SCREEN)RESISTANCE VALUESAND EQUIVALENTCOHESION (PSF)FRICTION ANGLETRIAXIAL SHEARCONSOLIDATIONDIRECT SHEAR
DESCRIPTION
GRAVELANDGRAVELLY
IDLTRMAJOR DIVISIONS
Organic silts and organic silt-clays of low plasticity.
Bulk Sample
ML
101 Method (Modified Pitcher Barrel)
Approximate water level observed in boring followingdrilling. Time recorded in reference to a 24-hour clock.
Approximate water level first observed in boring. Timerecorded in reference to a 24-hour clock.
CONTRA COSTA COLLEGE
CAMPUS CENTER
SAN PABLO, CALIFORNIA
Clayey sand.
COARSEGRAINEDSOILS
Pocket Penetrometer reading, in tsf
Torvane shear strength, in ksf
B-1
SC
ID
Silty sand.
SW
Key to Test DataPhysical Properties Criteria for Rock Descriptions
Clayey gravels, clayey gravel with sand mixture.
Inorganic silts and very fine sands, rock flour or clayeysilts with slight plasticity.
Inorganic lean clays of low to medium plasticity, gravellyclays, sandy clays, silty clays.
WEATHERING
FRESH - No visible sign of rock material weathering; perhaps slightdiscoloration on major discontinuity surfaces.
SLIGHTLY WEATHERED - Discoloration indicates weathering ofrock material and discontinuity surfaces. All the rock materialmay be discolored by weathering and may be somewhat weakerthan in its fresh condition.
MODERATELY WEATHERED - Less than half of the rock material isdecomposed and/or disintegrated to a soil. Fresh or discoloredrock is present either as a discontinuous framework or ascorestones.
HIGHLY WEATHERED - More than half of the rock material isdecomposed and/or distintegrated to a soil. Fresh or discoloredrock is present either as a discontinuous framework or ascorestones.
COMPLETELY WEATHERED - All rock material is decomposedand/or disintegrated to a soil. The original mass structure is stilllargely intact.
CL
OL
Greater than 4.0 feet2.0 to 4.0 feet0.2 to 2.0 feet0.05 to 0.2 feet0.01 to 0.05 feetLess than 0.01 feet
GP
X 100
VERY WIDELY FRACTUREDWIDELY FRACTUREDMODERATELY FRACTUREDCLOSELY FRACTUREDINTENSELY FRACTUREDCRUSHED
FRACTURE SPACING
Organic clays of medium high to high plasticity.
DESCRIPTIONMAJOR DIVISIONS
PLASTIC - Can be remolded with hands.
FRIABLE - Can be crumbled between fingers or peeled by pocket knife.
WEAK - Can be peeled by a knife with difficulty, shallow indentations made byfirm blow with point of geological hammer.
MEDIUM STRONG - Cannot be scraped or peeled with a pocket knife, specimencan be fractured with a single firm blow of geological hammer.
STRONG - Specimen requires more than one blow of geological hammer tofracture it.
VERY STRONG - Specimen withstands several blows of geological hammerwithout breaking.
EXTREMELY STRONG - Specimen can only be chipped with a geologicalhammer.
RQD (Rock Quality Designation) =
STRENGTH
MH
SANDANDSANDY
Peat and other highly organic soils.
UNIFIED SOIL CLASSIFICATION SYSTEM
Shelby Tube 3.0 inch O.D.
GW
Pitcher Barrel
Continuous Rock Core
ROCK AND SOIL LEGEND
SPPoorly-graded sands or gravelly sands, littleor no fines.
Well-graded sands or gravelly sands, little orno fines.
FINEGRAINEDSOILS
(Length of Solid Core Pieces 4" or Longer)(Total Length of Core Run)
CH
OH
Pt
SM
0800,5/31
LTR

LAMINATED
0.75 to 2.5 inches
VERY WEAK - Crumbles under firm blows with a point of geological hammer, can be peeled by pocket knife
2.0 to 4.0 feet
W5 -
W4 -
CONGLOMERATE
THINLY LAMINATED
SHEARED ROCKS
VERY THIN
VERY THICK OR MASSIVE
EXTREMELY STRONG - Specimen can only be chipped with a geological hammer.
WEAK - Can be peeled by a knife with difficulty, shallow indentations made by firm blow with point of geological hammer.
VERY WIDELY FRACTURED
WIDELY FRACTURED
Greater than 6.0 feet
2.0 to 6.0 feet
8.0 inches to 2.0 feet
SAN PABLO, CALIFORNIA
Greater than 4.0 feet
WEATHERING INDEX
CONTRA COSTA COLLEGE
CAMPUS CENTER112252
Less than 0.01 foot
EXTREMELY WEAK - Indented by thumbnail
CRUSHED
R2 -
R1 -
R0 -
VERY STRONG - Specimen withstands several blows of geological hammer without breaking.
VOLCANIC FLOWS
SLIGHTLY WEATHERED - Discoloration indicates weathering of rock material and discontinuity surfaces. All the rockmaterial may be discolored by weathering and may be somewhat weaker than in its fresh condition.
W3 -
SANDSTONE
COMPLETELY WEATHERED - All rock material is decomposed and/or disintegrated to a soil. The original massstructure is still largely intact.
GRAPHIC ROCK SYMBOLS
0.2 to 2.0 feet
SHALE OR CLAYSTONE CHERT SERPENTINITE
STRENGTH INDEX
MODERATELY FRACTURED
2.5 to 8.0 inches
SILTSTONE
Less than 0.75 inches
R6 -
FRACTURE SPACING
PLUTONIC
MEDIUM STRONG - Cannot be scraped or peeled with a pocket knife, specimen can be fractured with a single firm blowof geological hammer.
W2 -
W1 -
CLOSELY FRACTURED
8/5
/20
10
6:1
0:3
1 P
M
PROJECT NO.
PLATEROCK CLASSIFICATION SYSTEM
INTENSELY FRACTURED
BEDDING OR LAYERING
THIN
THICK
FRESH - No visible sign of rock material weathering; perhaps slight discoloration on major discontinuity surfaces.
HIGHLY WEATHERED - More than half of the rock material is decomposed and/or disintegrated to a soil. Fresh ordiscolored rock is present either as a discontinuous framework or as corestones.
STRONG - Specimen requires more than one blow of geological hammer to fracture it.R4 -
R3 -
METAMORPHIC ROCKSPYROCLASTIC
B-2
0.01 to 0.05 foot
0.05 to 0.2 foot
R5 -
MODERATELY WEATHERED - Less than half of the rock material is decomposed and/or disintegrated to a soil. Freshor discolored rock is present either as a discontinuous framework or as corestones.

ASPHALT CONCRETE - approximately 1.5 inches thick
CLAYSTONE - light olive green, slightly moist to moist, highly
weathered to decomposed, weak, low to medium plasticity
(GARRITY MEMBER - Contra Costa Group Bedrock)
- red brown
- light brown
Boring terminated at approx. 14 feet below ground surface.
No free water observed.
Boring backfilled with cement grout and capped with asphalt
patching.
3.5-4.0
>4.5
>4.5
>4.5
14.1113
26
49
50/6"
50/6"
Ø= 34 Degrees;
C= 100 psf
(See Plate D-7)
PLATE
Pe
n,
tsf
pcf
Notes: Surface Condition: Asphalt
Co
mp
ress.
%Co
nte
nt
B-3
5
10
15
20
25
30
35
De
nsity
Blo
ws/f
t
112252
Sa
mp
le
Dry
Str
en
gth
Surface Elevation:
SAN PABLO, CALIFORNIA
LOG OF BORING NO. B- 1
Drilling method:
Logged By: O. Khan
Total Depth:
PROJECT NO.
De
pth
,ft
DESCRIPTION
CAMPUS CENTER
Hammer Wt:
7/26/10
140 lbs., 30" drop
Approximately 14.0 ft
CONTRA COSTA COLLEGE
LABORATORY
Mo
istu
re
Oth
er
Te
sts
tsf
FIELD
Date Completed: 4" Flight Auger
Driller: Hillside Geotectnical
Estimated ~91 feet (MSL)
L:\2
01
1\1
1P
RO
JE
CT
S\1
12
25
2-C
ON
TR
A C
OS
TA
CO
LL
EG
E\1
12
25
2-C
C C
OL
LE
GE
CA
MP
US
CE
NT
ER
.GP
J
1/2
0/2
01
1 1
0:5
3:1
0 A
M

LEAN CLAY (CL) - brown to dark brown, dry to moist, hard,
low to medium plasticity, trace fine grained gravel, rootlets
(POSSIBLY FILL)
- very hard, increase in fine gravel
GRAVELLY LEAN CLAY (CL) - dark olive brown, moist, firm,
medium plasticity, fine grained gravel
LEAN CLAY (CL) - olive, wet, firm, medium plasticity, trace
fine gravel and fine grained sand, mottled with manganese
oxide staining
POORLY-GRADED SAND with GRAVEL (SP) - brown, wet,
medium dense, medium to coarse grained sand, fine gravel
(white quartz, chert)
SILTY CLAYSTONE - olive, highly weathered, weak to plastic,
trace fine grained sand (GARRITY MEMBER - Contra Costa
Group Bedrock)
- moist
Boring terminated at approx. 30 feet below ground surface.
Perched water encountered at apprximately 13.5 feet.
Backfilled with cement grout.
>4.0
>4.5
2.0
1.0
10.8
23.5
119
104
43
49
35
18
39
28
50-5"
11.39
@ 6.0%
Corrosivity
(See Appendix E)
Consolidation
Test
(See Plate D-8)
PLATE
Pe
n,
tsf
pcf
Notes: Surface Condition: Landscape
Co
mp
ress.
%Co
nte
nt
B-4
5
10
15
20
25
30
35
De
nsity
Blo
ws/f
t
112252
Sa
mp
le
Dry
Str
en
gth
Surface Elevation:
SAN PABLO, CALIFORNIA
LOG OF BORING NO. B- 2
Drilling method:
Logged By: O. Khan
Total Depth:
PROJECT NO.
De
pth
,ft
DESCRIPTION
CAMPUS CENTER
Hammer Wt:
7/26/10
140 lbs., 30" drop
Approximately 30.0 ft
CONTRA COSTA COLLEGE
LABORATORY
Mo
istu
re
Oth
er
Te
sts
tsf
FIELD
Date Completed: 4" Flight Auger
Driller: Hillside Geotectnical
Estimated ~77 feet (MSL)
L:\2
01
1\1
1P
RO
JE
CT
S\1
12
25
2-C
ON
TR
A C
OS
TA
CO
LL
EG
E\1
12
25
2-C
C C
OL
LE
GE
CA
MP
US
CE
NT
ER
.GP
J
2/1
8/2
01
1 9
:39
:49
AM
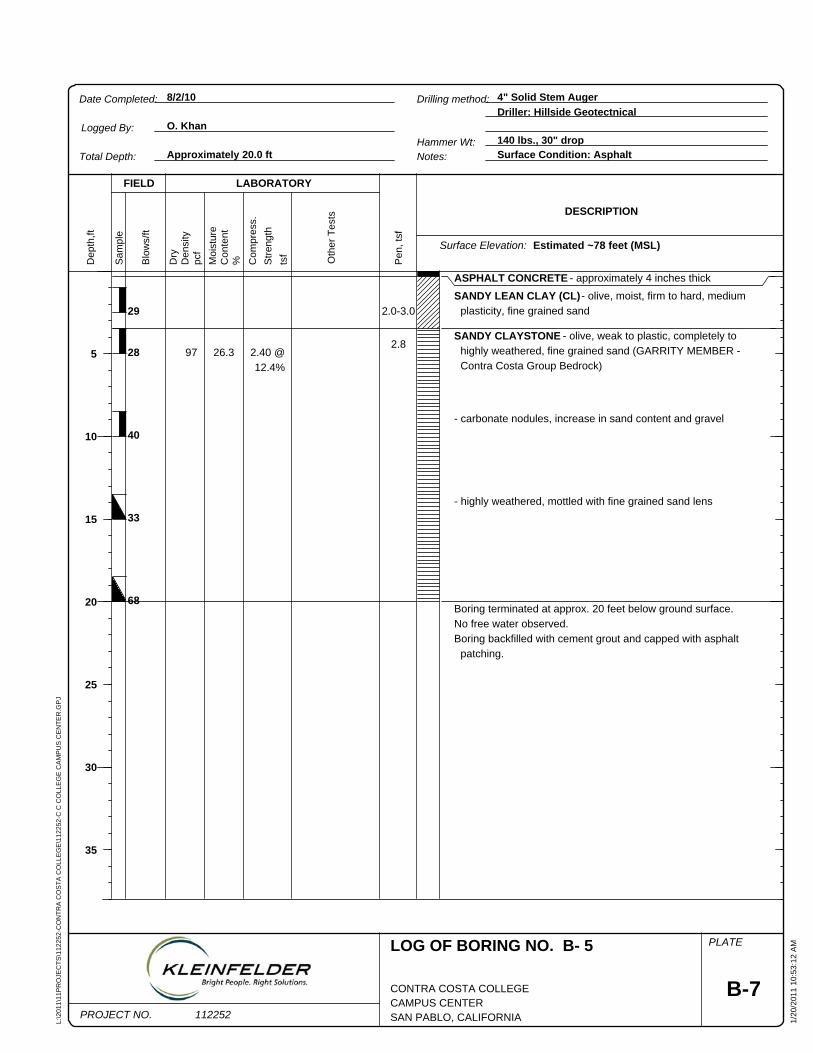
ASPHALT CONCRETE - approximately 4 inches thick
SANDY LEAN CLAY (CL) - olive, moist, firm to hard, medium
plasticity, fine grained sand
SANDY CLAYSTONE - olive, weak to plastic, completely to
highly weathered, fine grained sand (GARRITY MEMBER -
Contra Costa Group Bedrock)
- carbonate nodules, increase in sand content and gravel
- highly weathered, mottled with fine grained sand lens
Boring terminated at approx. 20 feet below ground surface.
No free water observed.
Boring backfilled with cement grout and capped with asphalt
patching.
2.0-3.0
2.826.397
29
28
40
33
68
2.40 @
12.4%
PLATE
Pe
n,
tsf
pcf
Notes: Surface Condition: Asphalt
Co
mp
ress.
%Co
nte
nt
B-7
5
10
15
20
25
30
35
De
nsity
Blo
ws/f
t
112252
Sa
mp
le
Dry
Str
en
gth
Surface Elevation:
SAN PABLO, CALIFORNIA
LOG OF BORING NO. B- 5
Drilling method:
Logged By: O. Khan
Total Depth:
PROJECT NO.
De
pth
,ft
DESCRIPTION
CAMPUS CENTER
Hammer Wt:
8/2/10
140 lbs., 30" drop
Approximately 20.0 ft
CONTRA COSTA COLLEGE
LABORATORY
Mo
istu
re
Oth
er
Te
sts
tsf
FIELD
Date Completed: 4" Solid Stem Auger
Driller: Hillside Geotectnical
Estimated ~78 feet (MSL)
L:\2
01
1\1
1P
RO
JE
CT
S\1
12
25
2-C
ON
TR
A C
OS
TA
CO
LL
EG
E\1
12
25
2-C
C C
OL
LE
GE
CA
MP
US
CE
NT
ER
.GP
J
1/2
0/2
01
1 1
0:5
3:1
2 A
M
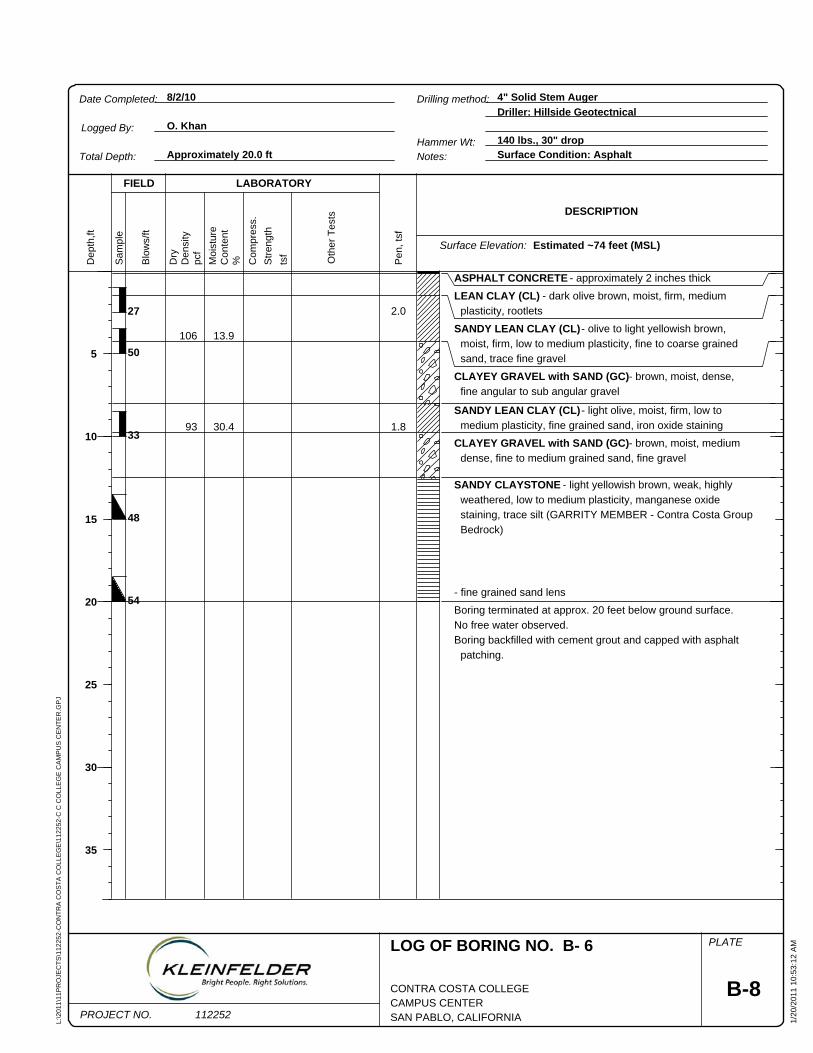
ASPHALT CONCRETE - approximately 2 inches thick
LEAN CLAY (CL) - dark olive brown, moist, firm, medium
plasticity, rootlets
SANDY LEAN CLAY (CL) - olive to light yellowish brown,
moist, firm, low to medium plasticity, fine to coarse grained
sand, trace fine gravel
CLAYEY GRAVEL with SAND (GC) - brown, moist, dense,
fine angular to sub angular gravel
SANDY LEAN CLAY (CL) - light olive, moist, firm, low to
medium plasticity, fine grained sand, iron oxide staining
CLAYEY GRAVEL with SAND (GC) - brown, moist, medium
dense, fine to medium grained sand, fine gravel
SANDY CLAYSTONE - light yellowish brown, weak, highly
weathered, low to medium plasticity, manganese oxide
staining, trace silt (GARRITY MEMBER - Contra Costa Group
Bedrock)
- fine grained sand lens
Boring terminated at approx. 20 feet below ground surface.
No free water observed.
Boring backfilled with cement grout and capped with asphalt
patching.
2.0
1.8
13.9
30.4
106
93
27
50
33
48
54
PLATE
Pe
n,
tsf
pcf
Notes: Surface Condition: Asphalt
Co
mp
ress.
%Co
nte
nt
B-8
5
10
15
20
25
30
35
De
nsity
Blo
ws/f
t
112252
Sa
mp
le
Dry
Str
en
gth
Surface Elevation:
SAN PABLO, CALIFORNIA
LOG OF BORING NO. B- 6
Drilling method:
Logged By: O. Khan
Total Depth:
PROJECT NO.
De
pth
,ft
DESCRIPTION
CAMPUS CENTER
Hammer Wt:
8/2/10
140 lbs., 30" drop
Approximately 20.0 ft
CONTRA COSTA COLLEGE
LABORATORY
Mo
istu
re
Oth
er
Te
sts
tsf
FIELD
Date Completed: 4" Solid Stem Auger
Driller: Hillside Geotectnical
Estimated ~74 feet (MSL)
L:\2
01
1\1
1P
RO
JE
CT
S\1
12
25
2-C
ON
TR
A C
OS
TA
CO
LL
EG
E\1
12
25
2-C
C C
OL
LE
GE
CA
MP
US
CE
NT
ER
.GP
J
1/2
0/2
01
1 1
0:5
3:1
2 A
M

LEAN CLAY (CL) - dark brown, moist, firm, mottled, low to
medium plasticity, trace fine grained sand, fine subangular
gravel, rootlets (FILL)
- soft
LEAN CLAY (CL) - greenish gray, moist, firm, medium
plasticity, trace fine gravel
SANDY LEAN CLAY (CL) - light yellowish brown, moist, firm,
low to medium plasticity, fine grained sand, manganese oxide
staining, higher sand content with depth
GRAVELLY LEAN CLAY (CL) - dark yellowish brown, moist,
hard, low plasticity, iron oxide staining, fine subrounded to
rounded gravel (chert and quartz)
- increase in gravel and sand content
Boring terminated at approx. 19.5 feet below ground surface.
No free water observed.
Boring backfilled with cement grout.
1.0
0.5
1.0
27.6
17.1
95
110
14
14
24
39
50/4"
0.99 @
15.0%
PLATE
Pe
n,
tsf
pcf
Notes: Surface Condition: Lawn
Co
mp
ress.
%Co
nte
nt
B-9
5
10
15
20
25
30
35
De
nsity
Blo
ws/f
t
112252
Sa
mp
le
Dry
Str
en
gth
Surface Elevation:
SAN PABLO, CALIFORNIA
LOG OF BORING NO. B- 7
Drilling method:
Logged By: O. Khan
Total Depth:
PROJECT NO.
De
pth
,ft
DESCRIPTION
CAMPUS CENTER
Hammer Wt:
8/2/10
140 lbs., 30" drop
Approximately 19.5 ft
CONTRA COSTA COLLEGE
LABORATORY
Mo
istu
re
Oth
er
Te
sts
tsf
FIELD
Date Completed: 4" Solid Stem Auger
Driller: Hillside Geotectnical
Estimated ~73 feet (MSL)
L:\2
01
1\1
1P
RO
JE
CT
S\1
12
25
2-C
ON
TR
A C
OS
TA
CO
LL
EG
E\1
12
25
2-C
C C
OL
LE
GE
CA
MP
US
CE
NT
ER
.GP
J
2/7
/20
11
1:3
9:5
0 P
M
LL=36; PI=21
(See Plate D-1)
Corrosivity
(See Appendix E)

ASPHALT CONCRETE - approximately 6 inches thick
GRAVELLY MATERIAL - approximately 6 inches thick
(Possibly Aggregate Base)
SANDY LEAN CLAY (CL) - dark gray to yellowish brown, firm,
low to medium plasticity, fine grained sand, trace fine gravel
(FILL)
LEAN CLAY (CL) - light gray, moist, firm, medium plasticity
- grayish brown, soft to firm, trace fine grained sand
- dark yellowish brown, firm to hard, manganese oxide staining
SILTY SAND (SM) - yellowish brown, wet, medium dense to
dense, fine grained sand
- angular coarse gravel (Volcanic Clasts)
Boring terminated at approx. 20 feet below ground surface.
Boring backfilled with cement grout and capped with asphalt
patching.
1.5-1.8
1.3-1.8
1.5-2.0
2.5
30.0
22.3
96
103
18
20
18
39
43
1.61 @
15.0%
Passing
-#200=23%
14:10
PLATE
Pe
n,
tsf
pcf
Notes: Surface Condition: Asphalt
Co
mp
ress.
%Co
nte
nt
B-10
5
10
15
20
25
30
35
De
nsity
Blo
ws/f
t
112252
Sa
mp
le
Dry
Str
en
gth
Surface Elevation:
SAN PABLO, CALIFORNIA
LOG OF BORING NO. B- 8
Drilling method:
Logged By: O. Khan
Total Depth:
PROJECT NO.
De
pth
,ft
DESCRIPTION
CAMPUS CENTER
Hammer Wt:
8/2/10
140 lbs., 30" drop
Approximately 20.0 ft
CONTRA COSTA COLLEGE
LABORATORY
Mo
istu
re
Oth
er
Te
sts
tsf
FIELD
Date Completed: 4" Solid Stem Auger
Driller: Hillside Geotectnical
Estimated ~65 feet (MSL)
L:\2
01
1\1
1P
RO
JE
CT
S\1
12
25
2-C
ON
TR
A C
OS
TA
CO
LL
EG
E\1
12
25
2-C
C C
OL
LE
GE
CA
MP
US
CE
NT
ER
.GP
J
2/7
/20
11
1:3
9:5
1 P
M

APPENDIX D
Corrosion Results


APPENDIX E
Site-Specific Seismic Analysis

20181569.001A/PLE17R67540 Page E-1 of E-12 October 20, 2017 © 2017 Kleinfelder
APPENDIX E
SEISMIC HAZARD ANALYSIS ____________________________________________________________________________
INTRODUCTION
This Appendix presents the results of our site-specific seismic hazard analysis per ASCE 7-10
(ASCE 2010) and Chapter 16A of 2016 California Building Code for the New Science Building
project at Contra Costa Community College in San Pablo, California. The subsurface soil
conditions used in this study were obtained from our current geotechnical investigations at the
project site. Since the mapped S1 value is greater than 0.75g, a site-specific ground motion hazard
analysis is required per Section 1616A.1.3 of 2016 CBC.
The purpose of this seismic hazard analysis is to develop site-specific ground motion criteria in
terms of peak ground accelerations and response spectral accelerations for the subject site by
using a seismic source model (proximity to active faults, major historical earthquakes, and
regional seismicity) and subsurface soil conditions at the site. The response spectrum is a
graphical representation relating the maximum response of a single degree of freedom, elastic
damped oscillator with different fundamental periods to dynamic loads. Site-specific spectrum for
any given return period represents earthquake ground motions consistent with the seismic source
model and the local site response. Specifically, our scope of services includes the following:
Literature review of available geologic and seismic setting of the area and developing a site-specific seismic source model.
Estimating the average shear wave velocity in the upper 100 feet (Vs30) of the site based on the results of the field explorations.
Classification of the site per Chapter 20 of ASCE 7-10.
Performing site-specific probabilistic and deterministic seismic hazard analyses (PSHA and DSHA) to obtain spectral accelerations for 2% probability of exceedance in 50 years and for 84th percentile deterministic per Chapter 21 of ASCE 7-10.
Developing site-specific response spectra for the MCER and the DE per Chapter 21 of ASCE 7-10 for damping value of 5%.
Developing site-specific ground motion parameters (SMS, SM1, SDS, and SD1) per Section 21.4 of ASCE 7-10.
Estimating site-specific PGAM per Section 21.5 of ASCE 7-10.
Report preparation of the results of the site-specific seismic hazard analyses.
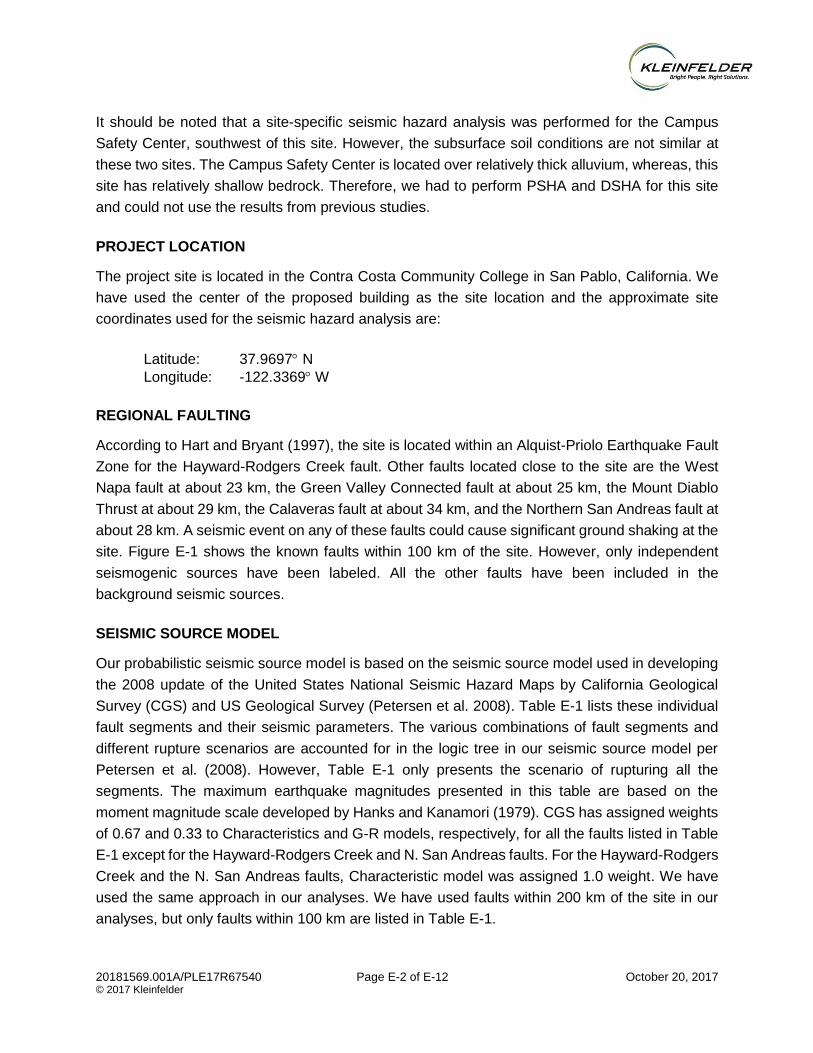
20181569.001A/PLE17R67540 Page E-2 of E-12 October 20, 2017 © 2017 Kleinfelder
It should be noted that a site-specific seismic hazard analysis was performed for the Campus
Safety Center, southwest of this site. However, the subsurface soil conditions are not similar at
these two sites. The Campus Safety Center is located over relatively thick alluvium, whereas, this
site has relatively shallow bedrock. Therefore, we had to perform PSHA and DSHA for this site
and could not use the results from previous studies.
PROJECT LOCATION
The project site is located in the Contra Costa Community College in San Pablo, California. We
have used the center of the proposed building as the site location and the approximate site
coordinates used for the seismic hazard analysis are:
Latitude: 37.9697 N
Longitude: -122.3369 W
REGIONAL FAULTING
According to Hart and Bryant (1997), the site is located within an Alquist-Priolo Earthquake Fault
Zone for the Hayward-Rodgers Creek fault. Other faults located close to the site are the West
Napa fault at about 23 km, the Green Valley Connected fault at about 25 km, the Mount Diablo
Thrust at about 29 km, the Calaveras fault at about 34 km, and the Northern San Andreas fault at
about 28 km. A seismic event on any of these faults could cause significant ground shaking at the
site. Figure E-1 shows the known faults within 100 km of the site. However, only independent
seismogenic sources have been labeled. All the other faults have been included in the
background seismic sources.
SEISMIC SOURCE MODEL
Our probabilistic seismic source model is based on the seismic source model used in developing
the 2008 update of the United States National Seismic Hazard Maps by California Geological
Survey (CGS) and US Geological Survey (Petersen et al. 2008). Table E-1 lists these individual
fault segments and their seismic parameters. The various combinations of fault segments and
different rupture scenarios are accounted for in the logic tree in our seismic source model per
Petersen et al. (2008). However, Table E-1 only presents the scenario of rupturing all the
segments. The maximum earthquake magnitudes presented in this table are based on the
moment magnitude scale developed by Hanks and Kanamori (1979). CGS has assigned weights
of 0.67 and 0.33 to Characteristics and G-R models, respectively, for all the faults listed in Table
E-1 except for the Hayward-Rodgers Creek and N. San Andreas faults. For the Hayward-Rodgers
Creek and the N. San Andreas faults, Characteristic model was assigned 1.0 weight. We have
used the same approach in our analyses. We have used faults within 200 km of the site in our
analyses, but only faults within 100 km are listed in Table E-1.

20181569.001A/PLE17R67540 Page E-3 of E-12 October 20, 2017 © 2017 Kleinfelder
According to Petersen et al. (2008), characterizations of the Hayward-Rodgers Creek, the N. San
Andreas, and the Calaveras faults are based on the following fault rupture segments and fault
rupture scenarios:
• The Hayward-Rodgers Creek fault has been characterized by three segments and six rupture scenarios plus a floating earthquake. The three segments are the Rodgers Creek fault (RC), the Hayward North (HN), and the Hayward South (HS).
• The N. San Andreas fault has been characterized by four segments and nine rupture scenarios, plus a floating earthquake. The four segments are Santa Cruz Mountains (SAS), North Coast (SAN), Peninsula (SAP), and Offshore (SAO).
• The Calaveras fault includes three segments and six rupture scenarios, plus a floating earthquake. The three segments are southern (CS), central (CC), and northern (CN).
We have used all of the rupture scenarios for these faults as used by Petersen et al. (2008).
TABLE E-1: SIGNIFICANT FAULTS IN THE SEISMIC SOURCE MODEL
Fault Name Closest
Distance* (km)
Fault Length
(km)
Magnitude of Characteristic Earthquake **
Slip Rate
(mm/yr)
Hayward-Rodgers Creek 0 150 7.33 9.0
West Napa 23 30 6.70 1.0
Green Valley Connected 25 56 6.80 4.7
Northern San Andreas 28 473 8.05 17-24
Mount Diablo Thrust 29 25 6.70 2.0
San Gregorio - Connected 33 176 7.50 5.5
Calaveras 34 123 7.03 6-15
Great Valley 4b, Gordon Valley 39 28 6.80 1.3
Point Reyes 42 47 6.90 0.4
Great Valley 5, Pittsburg Kirby Hills 44 32 6.70 1.0
Greenville Connected 46 51 7.00 2.0
Hunting Creek-Berryessa 55 60 7.10 6.0
Monte Vista-Shannon 60 45 6.50 0.4
Great Valley 4a, Trout Creek 61 19 6.60 1.3
Great Valley 7 74 45 6.90 1.5
Maacama-Garberville 74 221 7.40 9.0
Great Valley 3, Mysterious Ridge 77 55 7.10 1.3
Collayomi 95 28 6.70 0.6
* Closest distance to potential rupture
** Moment magnitude: An estimate of an earthquake’s magnitude based on the seismic moment

20181569.001A/PLE17R67540 Page E-4 of E-12 October 20, 2017 © 2017 Kleinfelder
MAGNITUDE-FREQUENCY DISTRIBUTION
The earthquake probabilities for the faults and their segments were developed using a magnitude-
frequency relationship derived from the seismicity catalogs and the fault activity based on their
slip rates. In general, there are two models based on magnitude-frequency relationships. In the
first, earthquake recurrence is modeled by a truncated form of the Gutenberg-Richter (G-R)
(Gutenberg and Richter, 1956) magnitude-frequency relation given by:
Log(N) = a – b*M
where N(M) is the cumulative number of earthquakes of magnitude "M" or greater per year, and
"a" and "b" are constants based on recurrence analyses. The relation is truncated at the maximum
earthquake. In the G-R model, it is assumed that seismicity along a given fault or fault zones
satisfies the above equation. This model generally implies that seismic events of all sizes occur
continually on a fault during the interval between the occurrences of the maximum expected
events along the fault zone.
The second model, generally referred to as a Characteristic model (Schwartz and Coppersmith,
1984), implies that the time between maximum size earthquakes along particular fault zones or
fault segments is generally quiescent except for foreshocks, aftershocks, or low level background
activity.
We have used the Peterson et al. (2008) approach in our analyses, which used both the G-R and
the Characteristic models. A b-value of 0.8 is used for all the faults. The most likely a-values were
estimated for each seismic source based on the recurrence rates of earthquakes and events per
year associated with that seismic source as reported by Petersen et al. (2008).
HISTORICAL SEISMICITY
The project site is located in an area characterized by high seismic activity. A number of large
earthquakes have occurred within this area in the past years. Some of the significant nearby
events include the 1868 (M6.8) Hayward earthquake, the 2014 (M6.0) South Napa earthquake,
the 1906 (M7.9) “Great” San Francisco earthquake, the 1838 (M7) San Francisco Peninsula
earthquake, the 1865 (M6.4) Santa Cruz Mountains earthquake, the two 1903 (M5.5) San Jose
earthquakes, and the 1989 (M6.9) Loma Prieta earthquake. A study by Toppozada and Borcherdt
(1998) indicates an 1836 (M6.8) earthquake, previously attributed to the Hayward fault, occurred
in the Monterey Bay area and was of an estimated magnitude M6.2. During the 1989 Loma Prieta
earthquake on the San Andreas fault, several California Strong Motion Instrumentation Program
(CSMIP) stations in the area recorded free-field horizontal peak ground accelerations ranging
from 0.1 to 0.3 g (Thiel Jr., et al., 1990). During the South Napa earthquake, CSMIP stations in

20181569.001A/PLE17R67540 Page E-5 of E-12 October 20, 2017 © 2017 Kleinfelder
the area recorded free-field horizontal peak ground accelerations of less than 0.1g. Epicenters of
significant earthquakes (M>4.0) within the vicinity of the site are shown on Figure E-1.
BACKGROUND SEISMICITY
In addition to the individual seismogenic sources, we also allow for background seismicity that
accounts for random earthquakes between M 5 and 7 based on the methodology described by
Frankel et al. (1996). Using the seismic source model used by CGS/USGS, some of the local
faults in the area are not included in our analyses as independent seismogenic sources. However,
their seismicity has been included by allowing for background seismicity in our model. The a-
values are calculated using the method described in Weichert (1980). The hazard may then be
calculated using this a-value, a b-value of 0.9, minimum magnitude of 5, maximum magnitude of
7, and applying an exponential distribution as described by Hermann (1977).
SEISMIC HAZARD ANALYSIS
Based on the results of the field explorations for this project and using appropriate correlations
between penetration resistance and Vs and/or undrained shear strength and Vs, the site is
estimated to have average shear wave velocity in the upper 100 feet (VS30) varies from about
1,050 feet/sec (320 m/s) in boring B-3 to about 1,475 (450 m/s) in boring B-2, thus making this
site as Site Class D (i.e., Stiff soil) on one side to Site Class C (soft rock) on the other based on
Table 20.3-1 of ASCE 7-10. Conservatively, we have assumed VS30 of 320 m/s for this site, thus
making it Site Class D. We used Caltrans procedure in estimating VS30 for this site (Caltrans,
2012).
According to ASCE 7-10, the MCER is defined as the most severe earthquake effects determined
for the orientation that results in the largest maximum response to horizontal ground motions and
with adjustment for targeted risk as defined by ASCE 7-10. In addition, according to ASCE 7-10,
the MCER is defined as the lesser of: (1) 2 percent probability of being exceeded in 50 years
(return period of about 2,475 years) adjusted for risk factors and for the maximum direction; and
(2) greater of 84th percentile (median + 1 standard deviation) deterministic values (adjusted for
the maximum direction) from the controlling fault and deterministic lower limit (DLL) of Figure
21.2-1 of ASCE 7-10. The DE is defined as two-thirds of the MCER. In addition, for site-specific
response spectra, procedures provided in Chapter 21 of ASCE 7-10 should be used and the
design spectral accelerations at any period from site-specific analyses should not be less than
the 80 percent of the code spectrum based on SDS and SD1 values from Chapter 11, ASCE 7-10.
Both probabilistic and deterministic seismic hazard analyses were used to estimate the spectral
accelerations for the MCER. These analyses involve the selection of appropriate predictive
relationships to estimate the ground motion parameters, and, through probabilistic and
deterministic methods, determination of peak and spectral accelerations.

20181569.001A/PLE17R67540 Page E-6 of E-12 October 20, 2017 © 2017 Kleinfelder
Ground Motion Prediction Equations (GMPE)
Site-specific ground motions can be influenced by the styles of faulting, magnitudes of the
earthquakes, and local soil conditions. The GMPEs used to estimate ground motion from an
earthquake source need to consider these effects. Many GMPEs have been developed to
estimate the variation of peak ground acceleration with earthquake magnitude and distance from
the site to the source of an earthquake.
We have used Boore and Atkinson (2008), Campbell and Bozorgnia (2008), and Chiou and
Youngs (2008) NGA-West 1 GMPEs, as these three were used in developing 2008 USGS
National Seismic Hazard Maps. All of these GMPEs use an estimate of the average shear wave
velocity in the upper 100 feet (VS30) of the soil profile in the analysis. Based on the results of our
field investigation, a VS30 of 320 m/s was used in the analyses. Some of these GMPEs also require
inputs for depth in meters to a layer with Vs value of 1,000 m/s (Z1.0) and depth in km to the layer
with Vs value of 2,500 m/s (Z2.5) to account for deep soil basin effects. Since the site is not located
in any known deep soil basin, we used the default (minimum) values in our analysis. Spectral
acceleration values were obtained by averaging the individual hazard results. These GMPEs
provide mean values of ground motions associated with magnitude, distance, site soil conditions,
and mechanism of faulting. The uncertainty in the predicted ground motion is taken into
consideration by including a magnitude dependent standard error in the probabilistic analysis.
Probabilistic Seismic Hazard Analysis
A probabilistic seismic hazards analysis (PSHA) procedure was used to estimate the peak and
spectral ground motions corresponding to 2 percent probability of exceedance in 50 years. The
PSHA approach is based on the earthquake characteristics and its causative fault. These
characteristics include such items as magnitude of the earthquake, distance from the site to the
causative fault, and the length and activity of the fault. The effects of site soil conditions and
mechanism of faulting are accounted for in the GMPE(s) used for the site.
The theory behind seismic risk analysis has been developed over many years (Cornell, 1968,
1971; Merz and Cornell, 1973), and is based on the "total probability theorem" and on the
assumption that earthquakes are events that are independent of time and space from one
another. According to this approach, the probability of exceeding PE(Z) at a given level of ground
motion, Z, at the site within a specified time period, T, is given by
PE(Z) = 1 - e -(Z)T
where (Z) is the mean annual rate of exceedance of ground motion level Z. Different probabilities
of exceedance may be selected, depending on the level of performance required.

20181569.001A/PLE17R67540 Page E-7 of E-12 October 20, 2017 © 2017 Kleinfelder
The PSHA can be explained through a four-step procedure as follows:
1. The first step involves identification and characterization of seismic sources and probability
distribution of potential rupture within the sources. Usually, uniform probability distributions
are assigned to each source. The probability distribution of site distance is obtained by
combining potential rupture distributions with source geometry.
2. The second step involves characterization of seismicity distribution of earthquake recurrence.
An earthquake recurrence relationship such as Gutenberg-Richter recurrence is used to
characterize the seismicity of each source.
3. The third step involves the use of GMPEs in assessing the ground motion produced at the
site by considering the applicable sources and the distance of the sources to site. The
variability of GMPEs is also included in the analysis. The effects of site soil conditions and
mechanism of faulting are accounted for in these GMPEs.
4. The fourth and the last step involve combining all of these uncertainties to obtain the
probability of ground motion exceedance during a particular time period.
A simplified mathematical expression for these steps is provided below:
dMdrrMzSaPrfMfMNzSar
M
Mm
rmi
Nsource
i
i
ii),|()()()()(
0
min
1
max
min
Where (Sa>z) is the mean annual rate of a spectral acceleration (Sa) exceeding a test value (z);
Nsource is the number of seismic sources; Ni(Mmin) is the rate of earthquakes with magnitude greater
than Mmin on the ith seismic source; fm,i(M) is the probability distribution of earthquake magnitude
(M) of the ith source; fr,i(r) is the probability distribution of the fault rupture location (r); and
P(Sa>z|M,r) is the probability that Sa is greater than the test value (z) given the M and r.
We have used the computer program EZ-FRISK version 8.00 beta (Risk Engineering, 2015) for
our probabilistic analysis. Horizontal response spectral values for the 2 percent in 50-year
probability of exceedance were calculated using the probabilistic analysis approach described
above. Elastic response spectral values were calculated for a damping factor of 5 percent of
critical.
Deterministic Seismic Hazard Analysis
The deterministic seismic hazard analysis (DSHA) approach is also based on the characteristics
of the earthquake and the causative fault associated with the earthquake. These characteristics
include such items as magnitude of the earthquake and distance from the site to the causative

20181569.001A/PLE17R67540 Page E-8 of E-12 October 20, 2017 © 2017 Kleinfelder
fault. The effects of site soil conditions and mechanism of faulting are also accounted for in the
GMPE for this site. Per ASCE 7-10, the 84th percentile deterministic site-specific spectral
acceleration values at the site were estimated for the Hayward-Rodgers Creek fault (M7.33),
which is the controlling fault for this site. Since the site is located within an A-P zone, we used a
distance of 0 km in our analysis.
DETERMINATION OF SITE-SPECIFIC HORIZONTAL MCER AND DE RESPONSE SPECTRA
To develop the site-specific spectral response accelerations, we first obtained the general seismic
design parameters based on the site class, site coordinates and the risk category of the building
using the USGS online tool (http://geohazards.usgs.gov/designmaps/us/application.php). These
values are summarized in Table E-2.
TABLE E-2: GENERAL GROUND MOTION PARAMETERS BASED ON ASCE 7-10
PARAMETER VALUE ASCE 7-10 REFERENCE
SS 2.478g Fig 22-1
S1 1.030g Fig 22-2
Site Class D Table 20.3-1
Fa 1.00 Table 11.4-1
Fv 1.50 Table 11.4-2
CRS 0.988 Fig 22-3
CR1 0.969 Fig 22-4
SMS 2.478g Eq. 11.4-1
SM1 1.545g Eq. 11.4-2
SDS 1.652g Eq. 11.4-3
SD1 1.030g Eq. 11.4-4
PGA 0.960 Fig 22-7
Fpga 1.00 Table 11.8-1
PGAM 0.960 Eq. 11-8-1
As discussed earlier, the MCER response spectrum is developed by comparing probabilistic,
deterministic, DLL, and 80% of the code values. These NGA GMPEs present the spectral
accelerations in terms of geometric mean values of the rotated two horizontal ground motions. To
estimate both the deterministic and probabilistic the spectral accelerations in the direction of the
maximum horizontal response at each period from geometric mean values, we have used the
scale factors as used by USGS. To obtain spectral acceleration values in the maximum direction,
a factor of 1.1 for periods of 0.2s and less, a factor of 1.3 for period of 1.0s and greater were used.

20181569.001A/PLE17R67540 Page E-9 of E-12 October 20, 2017 © 2017 Kleinfelder
Linear interpolation was used between 1.1 and 1.3 for periods between 0.2s and 1.0s. In addition,
the probabilistic spectrum was adjusted for targeted risk using risk coefficients CRS and CR1. CRS
and CR1 were estimated from Figures 22-3 and 22-4 of ASCE 7-10 and they are 0.988 and 0.969,
respectively. CRS is applied on periods of 0.2s or less and CR1 is applied on periods of 1.0s or
greater and linear interpolation in between.
Site-specific deterministic (84th percentile) spectrum for the Hayward-Rodgers Creek fault is
compared with the DLL spectrum per Figure 21.2-1 of ASCE 7-10 on Figure E-2. Spectral values
are also compared in Table E-3 for some specific periods. Figure E-2 and Table E-3 show that
for all practical purposes the controlling deterministic values are governed by the 84th percentile
site-specific deterministic spectrum for entire range of periods of up to 5.0 seconds. Therefore,
the deterministic values are controlled by the site-specific deterministic spectrum.
TABLE E-3: COMPARISON OF SPECTRAL ACCELERATION (G)
Period (s) Deterministic
Max Rot DLL
Probabilistic Max Rot Risk Adj
DE 80% Code DE
PGA (0.01) 1.030 0.600 1.282 0.687 0.529
0.2 1.891 1.500 2.769 1.387 1.322
0.3 2.298 1.500 2.913 1.532 1.322
0.5 2.398 1.500 2.851 1.599 1.322
1.0 1.942 0.900 2.086 1.295 0.824
2.0 1.104 0.450 1.121 0.736 0.412
Site-specific probabilistic spectrum is compared with the controlling deterministic spectrum on
Figure E-3. Spectral values are also compared in Table E-3 for some specific periods. Figure E-
3 and Table E-3 show that the probabilistic values are greater than the controlling deterministic
for periods of up to 2.0 seconds and then deterministic values are greater beyond that. Therefore,
site-specific MCER spectrum is developed by enveloping the controlling deterministic and
probabilistic spectra. The DE spectrum was developed by taking two-thirds of the MCER spectrum.
Comparison of the DE spectrum with the 80% of the code spectrum is shown on Figure E-4.
Spectral values are also compared in Table E-3 for some specific periods. Figure E-4 and Table
E-3 show that the DE spectrum is higher than the 80% of the code spectrum for all periods except
the periods between 0.02 and 0.15 seconds where the 80% of the code spectrum is greater.
Therefore, the recommended site-specific horizontal DE spectrum is developed by enveloping
two-thirds of the MCER spectrum and 80% of the code spectrum. Site-specific MCER spectrum is
taken as 1.5 times the DE spectrum. Figure E-5 shows the site-specific 5% damped DE and MCER
spectra. Site-specific horizontal spectral acceleration values in terms of g for the DE and MCER
are presented in Table E-4.
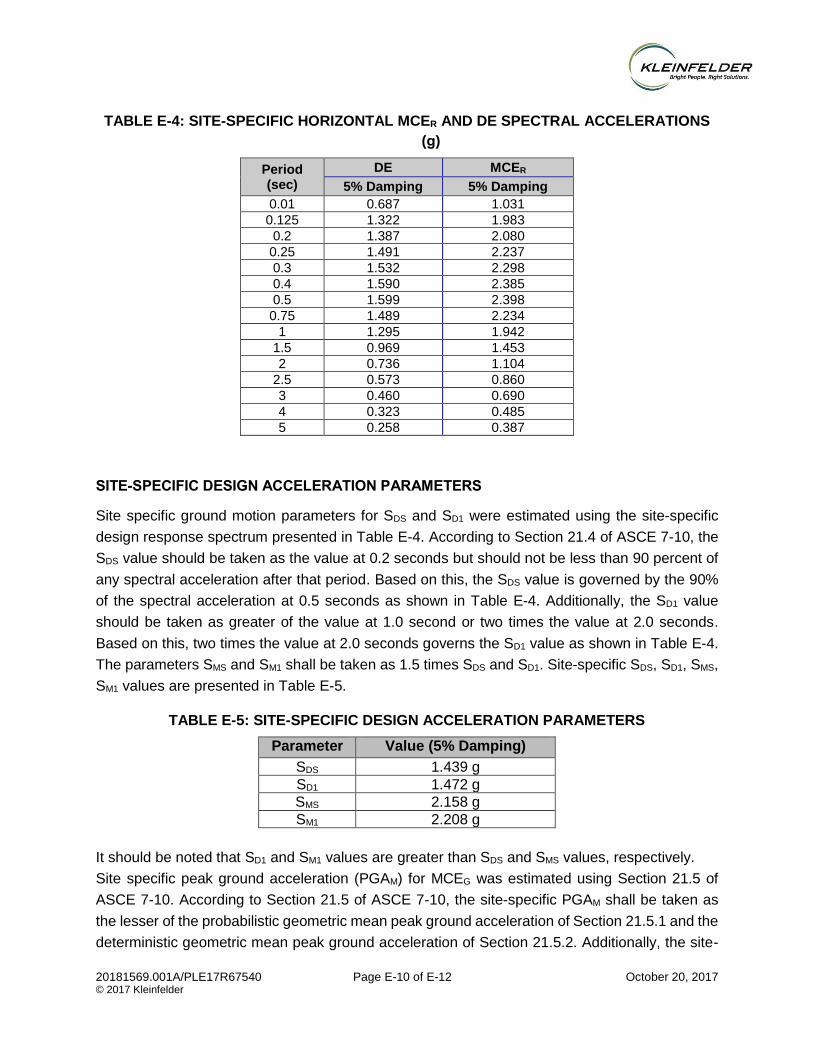
20181569.001A/PLE17R67540 Page E-10 of E-12 October 20, 2017 © 2017 Kleinfelder
TABLE E-4: SITE-SPECIFIC HORIZONTAL MCER AND DE SPECTRAL ACCELERATIONS
(g)
Period (sec)
DE MCER
5% Damping 5% Damping
0.01 0.687 1.031
0.125 1.322 1.983
0.2 1.387 2.080
0.25 1.491 2.237
0.3 1.532 2.298
0.4 1.590 2.385
0.5 1.599 2.398
0.75 1.489 2.234
1 1.295 1.942
1.5 0.969 1.453
2 0.736 1.104
2.5 0.573 0.860
3 0.460 0.690
4 0.323 0.485
5 0.258 0.387
SITE-SPECIFIC DESIGN ACCELERATION PARAMETERS
Site specific ground motion parameters for SDS and SD1 were estimated using the site-specific
design response spectrum presented in Table E-4. According to Section 21.4 of ASCE 7-10, the
SDS value should be taken as the value at 0.2 seconds but should not be less than 90 percent of
any spectral acceleration after that period. Based on this, the SDS value is governed by the 90%
of the spectral acceleration at 0.5 seconds as shown in Table E-4. Additionally, the SD1 value
should be taken as greater of the value at 1.0 second or two times the value at 2.0 seconds.
Based on this, two times the value at 2.0 seconds governs the SD1 value as shown in Table E-4.
The parameters SMS and SM1 shall be taken as 1.5 times SDS and SD1. Site-specific SDS, SD1, SMS,
SM1 values are presented in Table E-5.
TABLE E-5: SITE-SPECIFIC DESIGN ACCELERATION PARAMETERS
Parameter Value (5% Damping)
SDS 1.439 g
SD1 1.472 g
SMS 2.158 g
SM1 2.208 g
It should be noted that SD1 and SM1 values are greater than SDS and SMS values, respectively.
Site specific peak ground acceleration (PGAM) for MCEG was estimated using Section 21.5 of
ASCE 7-10. According to Section 21.5 of ASCE 7-10, the site-specific PGAM shall be taken as
the lesser of the probabilistic geometric mean peak ground acceleration of Section 21.5.1 and the
deterministic geometric mean peak ground acceleration of Section 21.5.2. Additionally, the site-

20181569.001A/PLE17R67540 Page E-11 of E-12 October 20, 2017 © 2017 Kleinfelder
specific PGAM shall not be taken as less than 80% of PGAM determined from Eq. 11.8-1. Based
on this procedure, the site-specific PGAM value is 0.936g and is controlled by the deterministic
results. Therefore, the associated earthquake magnitude is 7.3.
REFERENCES
ASCE, (2010), “Minimum Design Loads for Buildings and Other Structures,” ASCE Standard
ASCE/SEI 7-10.
Boore, D.M. and Atkinson, G.M. (2008), “Ground-Motion Prediction Equations for the Average
Horizontal Component of PGA, PGV, and 5%-Damped PSA at Spectral Periods between 0.01
s and 10.0 s,” Earthquake Spectra, 24 (1), pp. 99-138.
Caltrans, (2012). Methodology for Developing Design Response Spectrum for Use in Seismic
Design Recommendations, Caltrans Division of Engineering Services, Geotechnical Services,
pp. 26
Campbell, K.W. and Bozorgnia, Y. (2008), “NGA Ground Motion Model for the Geometric Mean
Horizontal Component of PGA, PGV, PGD and 5% Damped Linear Elastic Response Spectra
for Periods Ranging from 0.01 to 10s,” Earthquake Spectra, 24 (1), pp. 139-171.
Cao, T.Q., Petersen, M.D., and Reichle, M.S., (1996), Seismic Hazard Estimate from Background
Seismicity, Bulletin of the Seismological Society of America October 1996 vol. 86, no. 5, 1372-
1381
Chiou, B. S, and Youngs, R. R. (2008), “An NGA Model for the Average Horizontal Component
of Peak Ground Motion and Response Spectra,” Earthquake Spectra 24 (1), pp. 173-215.
Cornell, C.A. (1968), “Engineering Seismic Risk Analysis,” Bulletin of the Seismological Society
of America, Vol. 58, No. 5.
Cornell, C.A. (1971), “Probabilistic Analysis of Damage to Structures Under Seismic Loading,
Dynamic Waves in Civil Engineering,” London, Interscience.
Frankel, A.D., Mueller, C.S., Barnhard, T., Perkins, D.M., Leyendecker, E.V., Dickman, N.,
Hanson, S., and Hopper, M., (1996), “National Seismic Hazard Maps, June 1996
Documentation,” USGS Open File Report 96-532, Denver, CO.: available at web site:
http://geohazards.cr.usgs.gov/eq.
Frankel, A.D., Petersen, M.D., Mueller, C.S., Haller, K.M., Wheeler, R.L., Leyendecker, E.V.,
Wesson, R.L., Harmsen, S.C., Cramer, C.H., Perkins, D.M., and Rukstales, K.S. (2002),
“Documentation for the 2002 Update of the National Seismic Hazard Maps,” USGS Open File
Report 02-420, Denver, CO: available at website: http://pubs.usgs.gov/of/2002/ofr-02-
420/OFR-02-420.pdf
Gutenberg, B. and Richter, C.F. (1956), “Earthquake Magnitude, Intensity, Energy and
Acceleration,” Bulletin of the Seismological Society of America, Vol. 46, No. 2.

20181569.001A/PLE17R67540 Page E-12 of E-12 October 20, 2017 © 2017 Kleinfelder
Hanks, T.H. and Kanamori, H. (1979), “A Moment Magnitude Scale,” Journal of Geophysical
Research, Vol. 84, pp. 2348.
Hart, E.W. and Bryant, W.A. (1997), Fault-Rupture Hazard Zones in California: California Division
of Mines and Geology, Special Publication 42, 1997 revised edition.
Hermann, R.B. (1977), “Recurrence Relations,” Earthquake Notes, 48, 47-49.
International Code Council, 2016 California Building Code (CBC).
Kanamori, H. (1977), “The Energy Release in Great Earthquakes,” Journal of Geophysical
Research, Vol. 82, pp. 2981-2987.
Merz, H.L. and Cornell, C.A. (1973), “Seismic Risk Analysis Based on a Quadratic Magnitude-
Frequency Law,” Bulletin of the Seismological Society of America, Vol. 63, No. 6.
Petersen, Mark D., Frankel, Arthur D., Harmsen, Stephen C., Mueller, Charles S., Haller, Kathleen
M., Wheeler, Russell L., Wesson, Robert L., Zeng, Yuehua, Boyd, Oliver S., Perkins, David M.,
Luco, Nicolas, Field, Edward H., Wills, Chris J., and Rukstales, Kenneth S. (2008),
“Documentation for the 2008 Update of the United States National Seismic Hazard Maps,” U.S.
Geological Survey Open-File Report 2008–1128, 61 p.
Real, C.R., Toppozada, T.R., and Parke, D.L. (1978), Earthquake Catalog of California, January
1, 1900 to December 31, 1974, First Edition: California Division of Mines and Geology, Special
Publication 52.
Risk Engineering, Inc. (2015), “EZ-FRISKTM Online User’s Manual, EZ-FRISKTM Version 8.00,”
Risk Engineering, Inc., Boulder, Colorado.
Schwartz, D.P. and Coppersmith, K.J. (1984), “Fault behavior and characteristic earthquakes:
examples from Wasatch and San Andreas fault zones,” Journal of Geophysical Research, Vol.
89, pp. 5681-5698.
Seeburger, D. A. and Bolt, B. A. (1976), "Earthquakes in California, 1769-1927", Seismicity Listing
Prepared for National Oceanic and Atmospheric Administration, University of California,
Berkeley.
Toppozada, T.R. and Borchardt, G., (1998), Re-evaluation of the 1836 Hayward Fault and the
1838 San Andreas Fault Earthquakes: Bulletin of the Seismological Society of America, Vol.
88, No. 1, pp. 140-159.
Weichert, D.H., (1980), “Estimation of Earthquake Recurrence Parameters for Unusual
Observation Periods for Different Magnitudes,” Bull. Seismol. Soc. Amer., 70, 1337-1356.
Working Group on California Earthquake Probabilities, (2007), The Uniform California Earthquake
Rupture Forecast, Version 2, (UCERF 2): U.S. Geological Survey, Open File Report 2007-
1437.

Faulting LegendHistoric displacement (< 200 years)
Mapped Fault Location
Dashed where Approximated
! ! ! ! ! Concealed
Holocene displacement (< 11,000 years)Mapped Fault Location
Dashed where Approximated
! ! ! ! ! Concealed
Late Quaternary displacement (< 750,000 years)Mapped Fault Location
Dashed where Approximated
! ! ! ! ! Concealed
Quaternary displacement (< 1,600,000 years)Mapped Fault Location
Dashed where Approximated
! ! ! ! ! Concealed
Pre-Quaternary Geologic Structures (CGS, 2000)fault, approx. located
@@ fault, approx. located, queriedfault, certainfault, concealed
@@ fault, concealed, queried@@ fault, inferred, queried
ANSS EarthquakesMagnitude
4.0 - 4.9
5.0 - 5.9
6.0 - 6.9
7.0 - 7.9
8.0 - 8.9
@@
@@
@@
@@
@@
@@
@@
@@
@@
@@
@@
@@
@@
@@
@@
@@ @@@@
@@@@
@@
@@
@@
M
M
M
MM
M
M
M
M
MMM
M
M
MM
MM
M
M M
M
M
M
M
MMM
M
M
M
M
M
M
M
M
M
M
M
M
M
M
M
M
M
M
M
MM
FF
F
F F
F F
F
F
F
F
F
F
F
F
F
F
F
F
F
FF
F
F
F F
F
F
F
F
F
F
F
FF
F
F
F
F
F
F F
F F
FF
F
F
F
FF
F
F F
F
F
F
F
F
M
M
M
M
M
M
M
M
M
MMM
M
M
M
M
F
F
FF
F F
F
F
F
F
F
F
F
F
F
S
FFFF
!!
!!
!!!
!!
!!
!
!!
!!
!
!!
!
!!
!!
!!!
!!
!
!!
!
!!
!
!
!!
!!
!
!
!!
!
!!!
!
!
!
!
! ! !
!!
!!
!!
!
!!
!
!
!!
!!
!
!!
!
!!
!!
!
!!
!!!
!!
!!
!!
!!
!!
!
!!
!
!!
!
!!
!!!
!!
!!
!!
!!
!!
!
!!
!!
!!
!!
!!
!!
!!
!!
!!
!
!!
!!
!!
!
!
! ! ! !
!!
!!
!! !!
!!
!!
!!
!!
!
!!!
!!
!!
!!
!
!
!
!!
!!
!!
!!
!!
!
!!!
!
!
!
!!
!
!
!!
!!
!
!!
!!
!!
!!!
!!
!
!!
!
!!
!
!!
!
!
!
!!
!!
!!
!
!!
!
!!
!
!
!
!!
!!
!
!
!!
!!!
!!
!!
!
!!
!!
!!
!!
!!
!!
!
!
!
!! ! ! ! !
!!
!!
!!
!!
!!
!!
!!
!
!!
!!!
!
!
!!
!
!
!!
!
!!
!
!!
! !!
!
!!!
!
!
!!
!
!
!!!
!
!
!!
!
!
!!
!
!
!!!
!
!!
!
! !
!!
!!!!
!!
!
!!
!
!
!!! !!!
!!!
!!
!!
!!!
!!
!
!
!
!!
!!
!
!
!
!
!!
!
!!
!
!!
!
!
!!!
!!
!!
!
!!
!!
!!
!!
!
!!
!!
!
!!
!!
!!
!!
!!
!!
!!
!!
!!
!!
!!
!!
!
"
"
"
"
"
"
"
"
"
"
"
"
" "
"
"
"
"
"
"
"
""
"
"
"
"
"
"
"
"
"
"
"
" "
"
"
"
"
"
"
"
"
"
"
"
"
"
"
"
"
""
"
"
"
"
"
"
"
"
"
"
"
"
"
"
"
"
"
"
"
"
"
" ""
"
"
"
"
"
"
"
"
"
"
"
"
"
"
"
"
"""
"
"
""
" "
"
"
"
"
" "
"
""
"
"
"
"
"
" "
"
"
""
"
""
"
"
"
"
"
""
"
"
"
"
"
"
"
"" "
"
"
"
"
"
"
"
"
""
"
" "
""
"
"
"
"
""
"
"
"
"
"
"
"
"
"
"
"
"
" ""
"
"
"
"
"
"
"
"
"
"
"
"
"" "
"
"
"
""
""
"
""
"
"
"
"
"
"
"
"
"
"
"
""
"
"
"
"
"
"
"
"
"
"" "
""
""
"
"
"
"
"
"
"
"
"
"
"
"
"
"
"
"
"
"
"
"
"
"
"
"
"
"
"
""
"
"
""
"
" ""
"
"
"
"
"
"
""
"
"
"
"
"
"
"
"
"
"
"
"
"
"
"
" "" "
"
"
"
"
"
""
"
"
"
"
"
"
"
"
"
"
"
"
"
" "
"
" "
""
"
"
"
"
"
""
"
"
"
"
!.
!.
!.!.
!.
!.
!.
!.
!.
!.
!.
!.!.
!.
!.
!.
!.
!.
!.
_̂
Silver Creek Fault Zone
Fo
ot h
i l l s
Fa
ul t
Sy
st e
m
San Andreas
Rodgers Creek
San Andreas
Dewitt FaultRescue Fault
Waters Peak fault
Willows fault
Be
ar
Mo
un
t ai n
Fa
ul t
Zo
ne
Monte Vista fault
Zayante-Vergeles fault
Quien Sabe fault
Greenville fault
Hayward fault
Ortigalita fault
West Napa fault
Concord fault
Zayante-Vergeles fault
Hayward fault
Great Valley 4
Great Valley 3Monterey Bay - Tularcitos fault Zone
Calaveras fault
Calaveras fault
Sa
nG
r eg
or i o
Fa
ul t
Zo
ne
Hunting Creek
Berryessa fault system
Maacama fault zone
Vaca Fault ZoneDunnigan Hil ls Fault
Green Valley Faul t
Maidu East Fault
Spenceville Fault
Gillis Hill Fault
Great Valley 5
Great Valley 7
Great Valley 8
Mt. Diablo
Collayomi fault zone
Po int Reyes fau lt%2
SITE
110000
KKii ll
oo mmee tt
ee rrRR aa dd ii uu
ssWoodland
Santa Rosa
Napa
San Rafael Martinez
San FranciscoOakland
Stockton
RedwoodCity
Modesto
SanJose
SantaCruz
Sacramento
121°30'0"W
121°30'0"W
123°0'0"W
123°0'0"W
39°0'
0"N
39°0'
0"N
37°30
'0"N
37°30
'0"N
35 0 3517.5Kilometers
PROJECT NO.DRAWN:DRAWN BY:CHECKED BY:FILE NAME:www.kleinfelder.com
FIGURE
The information included on this graphic representation has been compiled from a variety of sources and is subject to change without notice. Kleinfelder makes no representations or warranties, express or implied, as to accuracy, completeness, timeliness, or rights to the use of such information. This document is not intended for use as a land survey product nor is it designed or intended as a construction design document. The use or misuse of the information contained on this graphic representation is at the sole risk of the party using or misusing the information.
Quaternary Faults (Bryant, 2005; USGS, 2009)
£
REGIONAL FAULT MAPAND EARTHQUAKE EPICENTERS
(1800 - OCTOBER 2017) E-120181569
03/02/17NPOK
20181569_ContraCosta.mxd
NEW SCIENCE BUILDING PROJECTCONTRA COSTA COMMUNITY COLLEGE
SAN PABLO, CALIFORNIA

www.kleinfelder.com
PROJECT NO.
DRAWN:
DRAWN BY:
CHECKED BY:
FILE NAME:
PLATE 20181569
10/10/17
M. Galouei
Z. Zafir
E-2
COMPARISON OF DETERMINISTIC
SPECTRA—5% DAMPING
NEW SCIENCE BUILDING PROJECT
CONTRA COSTA COMMUNITY COLLEGE
SAN PABLO, CALIFORNIA
FIGURE

www.kleinfelder.com
PROJECT NO.
DRAWN:
DRAWN BY:
CHECKED BY:
FILE NAME:
PLATE 20181569
10/10/17
M. Galouei
Z. Zafir
E-3
COMPARISON OF DETERMINISTIC
AND PROBABILISTIC SPECTRA
NEW SCIENCE BUILDING PROJECT
CONTRA COSTA COMMUNITY COLLEGE
SAN PABLO, CALIFORNIA
FIGURE
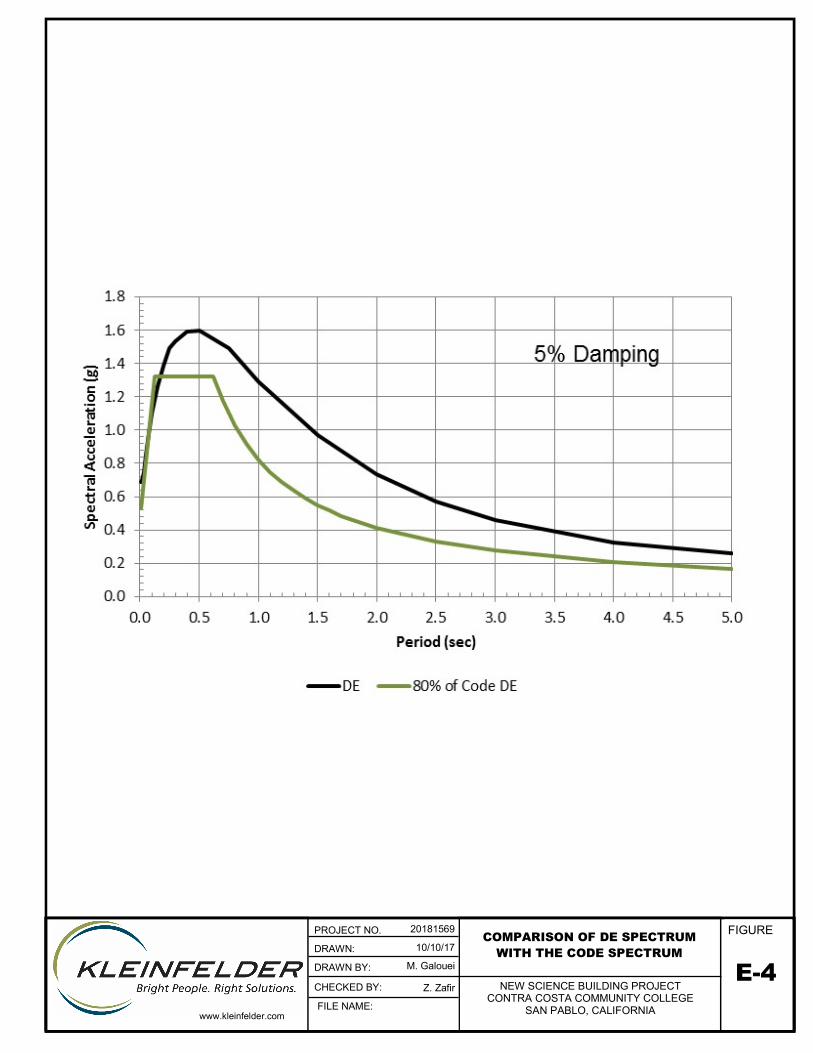
www.kleinfelder.com
PROJECT NO.
DRAWN:
DRAWN BY:
CHECKED BY:
FILE NAME:
PLATE 20181569
10/10/17
M. Galouei
Z. Zafir
E-4
COMPARISON OF DE SPECTRUM
WITH THE CODE SPECTRUM
NEW SCIENCE BUILDING PROJECT
CONTRA COSTA COMMUNITY COLLEGE
SAN PABLO, CALIFORNIA
FIGURE

www.kleinfelder.com
PROJECT NO.
DRAWN:
DRAWN BY:
CHECKED BY:
FILE NAME:
PLATE 20181569
10/10/17
M. Galouei
Z. Zafir
E-5
SITE-SPECIFIC RESPONSE
SPECTRUM—MCER AND DE
NEW SCIENCE BUILDING PROJECT
CONTRA COSTA COMMUNITY COLLEGE
SAN PABLO, CALIFORNIA
FIGURE