eprints.whiterose.ac.ukeprints.whiterose.ac.uk/...postprint_claytonhulme.docx · web viewthe...
TRANSCRIPT

1
Automatic Activation of Sounds by Letters Occurs Early in Reading Development,
but is not Impaired in Children with Dyslexia
Running head: AUTOMATIC ACTIVATION OF SOUNDS BY LETTERS

2
Abstract
The “automatic letter-sound integration hypothesis” (Blomert, 2011) proposes
that the decoding difficulties seen in dyslexia arise from a specific deficit in
establishing automatic letter-sound associations. We report the findings of two studies
in which we used a priming task to assess automatic letter-sound integration. In Study
1, children aged between 5 and 7 years were faster to respond to a speech-sound when
primed by a congruent letter, indicating that automatic activation of sounds by letters
emerges relatively early in reading development. However, there was no evidence of a
relationship between variations in the speed of activating sounds by letters and
reading skill in this large unselected sample. In Study 2, children with dyslexia
demonstrated automatic activation of sounds by letters, though they performed slowly
overall. Our findings do not support the theory that a deficit in “automatic letter-sound
integration” is an important cause of reading difficulties but do provide further
evidence for the importance of phonological skills for learning to read.

3
Introduction
A great deal of research has investigated the cognitive skills that predict
variations in early reading development. A range of phonological language skills
appear to provide the foundation for the development of decoding: specifically
phoneme awareness, rapid automatized naming and letter knowledge (Caravolas,
Lervåg, Defior, Málková, & Hulme, 2013; Lervåg, Bråten, & Hulme, 2009). Of these
three skills, the strongest evidence for a causal relationship is between phoneme
awareness (awareness of the sound structure of spoken words) and learning to decode
(Hulme & Snowling, 2014). Indeed, the dominant view, is that reading difficulties in
developmental dyslexia arise from a core deficit in phonology, possibly operating in
combination with other cognitive risk factors (Hulme & Snowling, 2014; Peterson &
Pennington, 2015).
In contrast to this view, a number of studies conducted by Blomert and his
colleagues (e.g. Blomert, 2011; Blomert & Froyen, 2010; van Atteveldt & Ansari,
2014) have proposed an alternative theory suggesting that a deficit in establishing
automatic associations between letters and speech-sounds is a specific causal risk
factor for dyslexia. For example, Blomert and Willems (2010) discussing a family risk
study of dyslexia write “we did not find any evidence for the claim that phonological
awareness deficits cause reading deficits. Instead, we found that problems in learning
letter–speech sound associations and integration characterize children at familial risk
for dyslexia”. This alternative claims that the phonological deficit in dyslexia is a
secondary consequence of problems learning to read (cf. Hulme, Caravolas, Málková,
& Brigstocke, 2005) and the primary cause is a deficit in cross-modal learning which
leads to problems in forming automatic associations between visual symbols (letters)
and phonological elements (phonemes).
4
This theory might be seen as an extension of the view that letter-sound
knowledge is critical for early reading development (Hulme, Bowyer-Crane, Carroll,
Duff, & Snowling, 2012; Melby-Lervåg, Lyster, & Hulme, 2012) and is delayed in
children with dyslexia (e.g. Torppa, Poikkeus, Laakso, Eklund, & Lyytinen, 2006).
However, according to the “automatic letter-sound integration hypothesis”, it is not
simply the process of learning letter-sound associations, but rather whether such
associations are learned to the point of being automatized that is crucial for
developing fluent and efficient reading. This proposal of impaired orthographic-
phonological connectivity in children with dyslexia is not entirely new (see Wimmer
& Schurz, 2010) and is consistent with the finding that knowledge of letters and
orthography influence performance on phonological tasks (Ehri & Wilce, 1980;
Castles & Coltheart, 2004). Evidence from training studies also supports the notion
that simply knowing letter-sound correspondences differs widely from achieving
integration (Widmann et al., 2012; Aravena et al. 2013).
The majority of evidence for the “automatic letter-sound integration
hypothesis” comes from functional magnetic resonance imaging (fMRI) and event
related potential (ERP) studies. In fMRI studies, typically developing readers
suppressed activation in response to mismatched (incongruent) letter-sound pairs as
compared to matching letter-sound pairs (Blau et al., 2010; Blau, van Atteveldt,
Ekkebus, Goebel, & Blomert, 2009), whereas children and adults with dyslexia failed
to suppress activation in response to incongruent letter-speech-sound pairs. This
failure to suppress activation (in left hemisphere regions responsible for speech
processing) has been interpreted as evidence of a failure to integrate letters with their
corresponding speech sounds in dyslexia; but it is notable that this evidence relates to
a failure to inhibit activation of mismatching letter-sound pairs, while arguably
5
patterns of facilitation for matching letter-sound pairs would be more relevant to the
processes involved in learning to read.
ERP studies have also suggested atypical (or developmentally delayed)
associations between letters and speech-sounds in children with dyslexia (Froyen,
Bonte, van Atteveldt, & Blomert, 2009; Froyen, Willems, & Blomert, 2011; Žarić et
al., 2014). These studies have employed a range of experimental designs; with the
original studies measuring letter-sound integration using a cross-modal mismatch
negativity (MMN) paradigm. In the traditional MMN paradigm a negative ERP
component is produced when a deviant auditory stimulus is presented following a
standard recurring auditory stimulus. In the cross-modal variant of this task, typical
11-year-old readers demonstrate cross-modal enhancement of the MMN
approximately 100-250ms after the presentation of an additional corresponding visual
letter which has been interpreted as evidence for early and automatic integration
(Froyen et al., 2009). In contrast, dyslexic readers of the same age were found to
demonstrate only late enhancement of the MMN around 600-750ms after stimulus
onset, suggesting that integration of letters and speech sounds was delayed in this
group (Froyen et al., 2011), as in younger beginner readers (Froyen et al., 2009). This
absence of “cross-modal enhancement” in children with dyslexia might have a variety
of explanations other than a deficit in “automatic letter-sound integration”, including
slowness in processing phonological information, or a general slowing of information
processing. Furthermore, the reliability of MMN measures in younger children is
questionable (e.g. Bishop, 2007) and more recent replications using the same cross-
modal paradigm have revealed evidence of cross-modal enhancement in children with
dyslexia, albeit reduced cross-modal enhancement in children with the most severe
reading impairment (Žarić et al., 2014).

6
There have been relatively few attempts to test the “automatic letter-sound
integration hypothesis” using behavioural measures. Existing studies report that
children with dyslexia are slower to match letters with their corresponding speech-
sounds and slower to decide whether letter-sound pairs are the same or different (Blau
et al., 2010; Žarić et al., 2014). However, it is unclear from these experiments whether
slower reaction times in the dyslexic group are attributable to a core phonological
deficit, rather than differences in “automatic letter-sound integration”. In line with this
suggestion, a wide range of experiments document impaired performance on
phonological tasks in children with dyslexia (e.g. Elbro, Borstrøm, & Petersen, 1998;
Griffiths & Snowling, 2002; Landerl, 2001; Litt & Nation, 2014). Any investigation
of the potential role of “automatic letter-sound integration” in dyslexia must,
therefore, control for the role of phonological processing. Furthermore, the
comparison of children with dyslexia with typically developing children of a similar
age does not control for the limited reading experience of the dyslexic group which
may be a sufficient explanation for any group differences (Nash et al., 2016).
Aside from these issues, it is well known that the comparison of extreme
groups (children with and without dyslexia) with relatively small sample sizes is
likely to overestimate effect sizes (Preacher, Rucker, MacCallum, & Nicewander,
2005), which may explain different patterns of results across studies (e.g. Blau et al.,
2010; Froyen et al., 2011; Žarić et al., 2014). As it is now widely accepted that
dyslexia simply represents the lower end of a continuous distribution of reading skills
in the population (Peterson & Pennington, 2015) it seems timely for this hypothesis to
be tested in a large unselected sample. If problems in “automatic letter-sound
integration” are a cause of dyslexia, then variations in the extent to which letters and

7
speech-sounds are integrated should be associated with individual differences in
children’s decoding ability in the general population.
To summarise, there is clear evidence that learning letter-speech sound
associations is crucial for learning to read. However, evidence for the “automatic
letter-sound integration hypothesis” of dyslexia is currently restricted to extreme
group studies using fMRI and EEG, which are limited by their small sample sizes, the
use of measures with unknown reliability and the failure to use adequate controls to
exclude a range of possible alternative explanations for the results obtained. Most
importantly, existing research has failed to control for the possible role of a
phonological deficit making it difficult to interpret the small number of existing
behavioural studies.
The current study tests the “automatic letter-sound integration hypothesis”
using a priming task in which a letter prime is followed by an auditory target. The
child’s task is simply to decide whether the auditory target is a speech or non-speech
sound. By comparing reaction times (RTs) on congruent trials where the letter prime
matches the speech-sound target, with baseline trials where a novel symbol is
presented, we can assess the extent to which children’s responses are facilitated by a
congruent letter prime. Children with highly automated letter-sound associations
should show greater facilitation (faster responses to the speech sound on congruent
than neutral baseline trials) than children who have not fully automated these
associations. The inclusion of an incongruent condition (where the visual prime is a
letter that does not correspond to the speech sound presented) will allow us to
determine whether the priming effect reflects “automatic” processing. According to
Posner and Snyder (2004) automatic processing is demonstrated by facilitation in the

8
absence of interference as automatic activation of a different (incongruent)
representation will not influence the processing of activated pathways.
Study 1
Our first study assesses “automatic letter-sound integration” in a large
unselected sample of typically developing children aged between 5-7 years. We
predict that children in this age range (who have received at least one year of formal
reading instruction) will demonstrate some level of automatic activation of sounds by
letters and so will be faster to identify a speech-sound following the presentation of a
congruent letter prime (compared to the presentation of an incongruent letter or an
irrelevant non-verbal symbol). If such an effect is demonstrated, we will be able to
assess whether individual differences in this effect are associated with individual
differences in reading ability. Children also completed measures of letter-sound
knowledge, phoneme awareness and Rapid Automatized Naming (RAN) so that the
predictive power of “automatic letter-sound integration” can be compared with these
well-established predictors of reading development.
Method
Participants. One hundred and fifty-five children (77 male, 78 female)
participated in the study (mean age = 6.5 years, range = 65 to 93 months). Children
were unselected for reading ability. Children from Year 1 and 2 were recruited from
8 primary schools in Greater London and North Yorkshire. Due to time constraints,
children from two primary schools were unable to complete all reading-related
measures (N=50; see Table 1 for details of missing data). Parents were provided with
information about the study and gave written consent for their child to take part. The
study was approved by UCL Research Ethics Committee.

9
Measures and procedure. Children were tested individually in two 20-
minute sessions; tasks were administered in a fixed order.
Reading. Children completed the timed word and non-word reading subtests
from the Test of Word Reading Efficiency (TOWRE; Torgesen, Wagner, & Rashotte,
1999) and the Single Word Reading Test (SWRT6-16; Foster, 2007) where they were
required to read aloud a list of words of increasing difficulty without time pressure.
Letter-sound knowledge. Children completed the letter-sound knowledge
subtest from the York Assessment of Reading for Comprehension (YARC; Hulme et
al., 2009). This test required children to say the sound corresponding to 32 letters and
digraphs.
Phoneme awareness. Children completed the phoneme deletion subtest from
the YARC (Hulme et al., 2009). In this test children were required to repeat a word
but to ‘take away a sound’ from it. For example “Can you say sheep? Can you say it
again without the /p/?”
Rapid Automatised Naming (RAN). Children completed the digit RAN
subtest from the Comprehensive Test of Phonological Processing (Wagner, Torgesen,
& Rashotte, 1999). This test required children to name two 9 x 4 arrays of 6 digits as
quickly and accurately as possible.
Letter-sound priming task. This task involved the successive presentation of a
visual letter prime and an auditory phoneme target. Figure 1 shows the structure of a
trial across the 3 experimental conditions. Children were required to decide on each
trial whether the auditory stimulus was a ‘real’ speech-sound or not. Fifty percent of
trials consisted of speech sounds; the other 50% of trials involved the presentation of
a non-speech sound. Response time (RT) was measured to the auditory stimuli
(speech/non-speech decision RT).
10
Auditory stimuli were recordings of the following 5 phonemes, duration in
milliseconds (ms) for each are reported in parentheses; /tə/ (293ms), /də/
(263ms), /və/ (428ms), /zə/ (413ms) and /dʒə/ (357ms). Non-speech versions of
these stimuli were created in Matlab by randomly assembling 5ms segments of the
original signal (Ellis, 2010). These non-speech sounds were identical in length, energy
and spectral composition but sounded completely unlike speech. Visual stimuli
consisted of letters and novel letter-like forms. Lower case letters corresponding to
the phonemes used were presented in Arial font (approximately 23 x 20mm). On 50%
of trials a letter was presented and on the other 50% of trials one of five novel letter-
like forms (adapted from Taylor, Plunkett, & Nation, 2011) was presented.
Stimuli were presented and responses recorded (speed and accuracy) using E-
Prime Software (version 2.0) using a Psychology Software Tools Serial Response Box
(SRB; model 200a) and a laptop running Windows 7. Auditory stimuli were presented
through headphones.
Children were instructed to attend to both the letter and speech-sound and
decide whether the sound was a ‘real’ speech-sound using “yes” and “no” response
keys on the response box. Before the task began children were familiarised with the
procedure in thirteen practice trials.
On each trial a centrally located fixation point was presented for 1000ms,
followed by the letter or non-letter stimulus, presented in black and appearing on a
white screen for 500ms. The auditory target was presented over headphones and its
onset was synchronous with the offset of the visual letter. Each trial was followed by
the visual prompt “Real sound?” Response times from the response box were
recorded from the onset of the auditory target. The experimenter monitored the child’s
performance, controlling the presentation of trials.

11
There were six conditions in the letter-sound priming task. In the congruent
condition, the prime and target were the same letter/sound. In the incongruent
condition the prime and target were not the same letter/sound. In the baseline
condition, the prime was a novel letter-like shape and the target was a speech-sound.
There were three additional control conditions to prevent children detecting the
relationship between primes and targets and generating expectancies. In these control
conditions the target was a non-speech sound. Novel symbols and scrambled speech-
sounds were yoked to create pseudo baseline, congruent and incongruent control
conditions.
There were 20 trials for each condition and each condition included four trials
of each pairing, apart from the incongruent condition where each letter prime was
presented once and paired with all other speech-sounds. There were 135 trials in total,
including 15 ‘catch’ trials to ensure children were attending to the screen. On catch
trials the same letters were presented in a black and white animal print (for example,
zebra stripes) and children were instructed to make a different response (using a
button on the response box).
Results
Means (and standard deviations) for all measures are shown in Table 1. All
measures showed a good range of scores, with the exception of letter-sound
knowledge which was at ceiling (49% of children achieved the maximum score) and
so this measure was excluded from subsequent correlation and regression analyses.
Letter-sound priming. Only correct responses are considered and outliers
were removed from the raw reaction time (RT) data. RT data from six participants
were excluded because their response accuracy was below 75%. In addition, there
were missing data for five participants (the task was not administered due to time
12
constraints). RTs over 5000ms were first removed as this was considered to reflect a
lapse in attention. A non-recursive outlier removal procedure was then used (Selst &
Jolicoeur, 1994). Over 90% of the RT data were included in the analyses.
Figure 2 shows the mean correct response times in each condition for the two
year groups, together with 95% within-subject confidence intervals (Morey, 2008) .
As expected Year 1 children responded more slowly than Year 2 children. Both
groups showed evidence of facilitation with RTs in the congruent condition being
faster than in the baseline condition. The Year 1 group showed slightly quicker RTs in
the incongruent condition compared to the baseline condition, whereas RTs in the
Year 2 group were slightly slower in the incongruent condition. To assess the
reliability of these differences, response times for the baseline, congruent and
incongruent conditions in Year 1 and 2 were compared using a mixed effects linear
model treating participants and items as crossed random effects. In this model the
difference between baseline and congruent, and baseline and incongruent RT were
represented by two dummy codes, and year group was represented by another dummy
code (Year 1 vs. Year 2).
Both groups showed facilitation: RTs in the congruent condition were
significantly faster than in the baseline condition for children in the Year 1 group
(marginal mean difference = -132.71 = [95% CI -171.37 -94.05], z = -6.73, p < .001;
d = .39) and Year 2 (marginal mean difference = -74.55 = [95% CI -102.56, -46.55], z
= -5.22, p < .001; d = .29). The size of this effect was significantly larger in the Year
1 group than Year 2 group (estimated difference = 58.26, z = 2.35, 95% confidence
interval = [-9.75, 106.76], p = .019). Further analysis confirmed that this interaction
reflects a scaling effect. Using z-scores generated for RTs in each year group revealed
a significant main effect of condition (F (2, 5) = 5.34, p = .0051), but no main effect

13
of year group (F (1, 5) = .00, p = .9601) and a non-significant interaction between
condition and year group (F (2, 5) = .17, p = .8421).
Neither group showed a significant difference between RTs in the baseline and
incongruent conditions (Year 1 marginal mean difference = -30.38 = [95% CI -68.94,
8.18], z = -1.54, p =. 123, d = .09; Year 2 marginal mean difference = 13.32 = [95%
CI -14.67, 41.30], z = 0.93, p =. 351, d = -.05).
Summary data for all conditions of the experiment, including the control
conditions where non-speech sounds were presented, are shown in Supplementary
table (S1). Accuracy in the control and experimental conditions is comparable (and
high). In the experimental trials RTs are faster on congruent trials than baseline trials
(responses to phonemes that match a preceding letter are faster compared to trials
where the phoneme is preceded by a novel letter-like form). As expected, however,
this effect is absent from the control conditions where corresponding scrambled
phonemes are presented. Interestingly, the fastest RTs in the control conditions are to
trials where a novel symbol precedes a scrambled phoneme. This suggests that when
children are presented with a real letter prime, they expect to hear a real speech-
sound, as opposed to a non-speech sound.
Correlations. Pearson correlations (and partial correlations controlling for
age) between variables for both year groups combined are shown in Table 2.
Measures of reading were very strongly correlated (r’s between .90 and .92) and so
reading factor scores were calculated using principal axis factoring. Age was
moderately correlated with all measures, and given that the two year groups showed
comparable letter-sound priming subsequent analyses focus on relationships in the
two groups combined after partialling out age.

14
Correlations between average RTs across the three priming task conditions
(baseline, congruent, incongruent) are strong indicating that these measures have
relatively good reliabilities. Correlations between children’s average RTs in each
condition and reading are weak, though significant and similar in magnitude across
the different measures.
Measures of facilitation and interference were calculated using residual scores
from regression analyses predicting congruent RT from baseline RT, and incongruent
RT from baseline RT. Measures of facilitation and interference show negligible
correlations with reading factor scores, RAN or phoneme deletion, after controlling
for age. The absence of any appreciable correlation between the degree of letter-
speech sound facilitation and reading fails to support the main prediction of the
“automatic letter-sound integration hypothesis”.
Predicting reading ability. Given that response times in all three conditions
of the letter-sound priming task correlated with reading, a regression model was used
to explore whether RT on the letter-sound priming task was a unique predictor of
reading ability above and beyond established predictors. This regression analysis was
computed for a sub-sample of 98 children with complete data across all measures.
Since all three RT measures correlated strongly with each other, and similarly with
the reading factor score, we used principal axis factoring with the three RT measures
to compute an RT factor score. This RT factor score showed a moderately strong
correlation with our Reading factor score (r = -.47) and even after controlling for age,
phoneme deletion and RAN (which predicted 72.71% of the variance in reading)
accounted for a small additional proportion of the variance in the reading factor
(1.29%; p = .035).
15
Discussion
We used a priming task to investigate whether typically developing children
show evidence of “automatic letter-sound integration”, and whether variations in this
skill are associated with variations in reading ability. According to the “automatic
letter-sound integration hypothesis”, associations between letters and speech-sounds
must become fully automated for children to achieve fluent reading (van Atteveldt &
Ansari, 2014). Children in our priming task were significantly quicker to decide
whether a sound was a speech or non-speech sound when primed by a congruent
letter. This demonstrates that there are strong associative links between printed letters
and the speech-sounds they represent and supports the view that letters become multi-
modal as a result of repeated exposure over time (Blomert, 2011).
The finding that children with just one year of reading experience demonstrate
evidence of automatic activation of sounds by letters contrasts with some claims from
earlier neuroimaging studies that integration emerges much later (i.e. integration is
more automatic but not yet “adult-like” in advanced readers with four years reading
instruction; Froyen et al., 2009). In our study, the priming task provides a behavioural
assessment of “automatic letter-sound integration”, and the only viable explanation
for the facilitation effect found (a visual letter speeds up responses to a matching
spoken letter sound) is that children have associative links in memory between visual
letters and their corresponding speech sounds.
One unexpected finding was that after RAN and phoneme deletion had been
accounted for, overall RT in the priming task was an additional predictor of reading
ability. This finding suggests that speeded responses in the speech/non-speech
discrimination task are a sensitive measure of the quality of a child’s underlying
phonological representations (Hulme & Snowling, 2014).

16
Study 2
The findings from Study 1 clearly challenge the “automatic letter-sound
integration hypothesis”, but do not rule out the possibility that children with severe
reading difficulties (dyslexia) might suffer from deficits in such a process. Study 2
uses the same letter-sound priming task to assess automatic activation of sounds by
letters in children with dyslexia.
Method
Participants. One hundred and thirty one children participated in the study.
There were 20 children with dyslexic difficulties aged between 9 and 11 years; 20
typically developing chronological age (CA) matched controls and 91 typically
developing reading-matched controls (RA) aged between 6 and 7 years. The dyslexic
group were recruited from specialist schools for children with dyslexia in North
London and Surrey. Fifteen children in this group had received a formal diagnosis of
dyslexia from an Educational Psychologist, the remaining five children in the dyslexic
group had reading and/or spelling standard scores 1.5 SD below average.
Data from 91 typically developing children in Study 1 were used to form the
RA control group. The CA matched group were recruited from mainstream schools in
Greater London. The study was approved by UCL Research Ethics Committee.
Measures and procedure. Children were tested individually on the following
measures in a 20-minute session. Tasks were completed in a fixed order.
Reading. Children in the dyslexic and CA matched groups completed the
Word Reading subtest from the Wechsler Individual Achievement Test II (WIAT II;
Wechsler, 2005). Children in the RA and CA matched groups completed the Single
Word Reading Task (SWRT 6-16; Foster, 2007). Both measures required children to

17
read aloud a list of words that became increasingly difficult. Age equivalent scores
allowed us to match dyslexic and typically developing children for reading ability.
Letter-sound priming task. The task used was identical to the priming task
described in Study 1.
Results
Means, standard deviations and tests of group differences for standardised
measures of reading and the priming task are shown in Table 3. There were no
significant group differences in accuracy on the priming task, however the dyslexic
and RA group were significantly slower than the CA group across all three conditions.
Letter-sound priming. RT data were treated as in Study 1. The mean correct
response times in each condition, together with 95% within-subject confidence
intervals (Morey, 2008) are shown for each group in Figure 3. It is clear that all three
groups show an identical pattern across conditions, with faster responses in the
congruent than baseline condition, but no appreciable slowing in the incongruent
condition. Contrary to the hypothesis that dyslexia is characterized by a deficit in
automatizing letter-sound associations, the dyslexic group show at least as large, or
possibly a larger, facilitation in the congruent condition. Overall, the RTs in dyslexic
group are considerably slower than in the chronological age matched group, and
roughly equal to those of children matched for reading age.
Response times for the baseline, congruent and incongruent conditions for the
three groups were compared using a mixed effects linear model treating participants
and items as crossed random effects. In this model the difference between baseline
and congruent, and baseline and incongruent RT were represented by two dummy
codes, and Group was represented by another pair of dummy codes (dyslexic vs. RA;
dyslexic vs. CA).

18
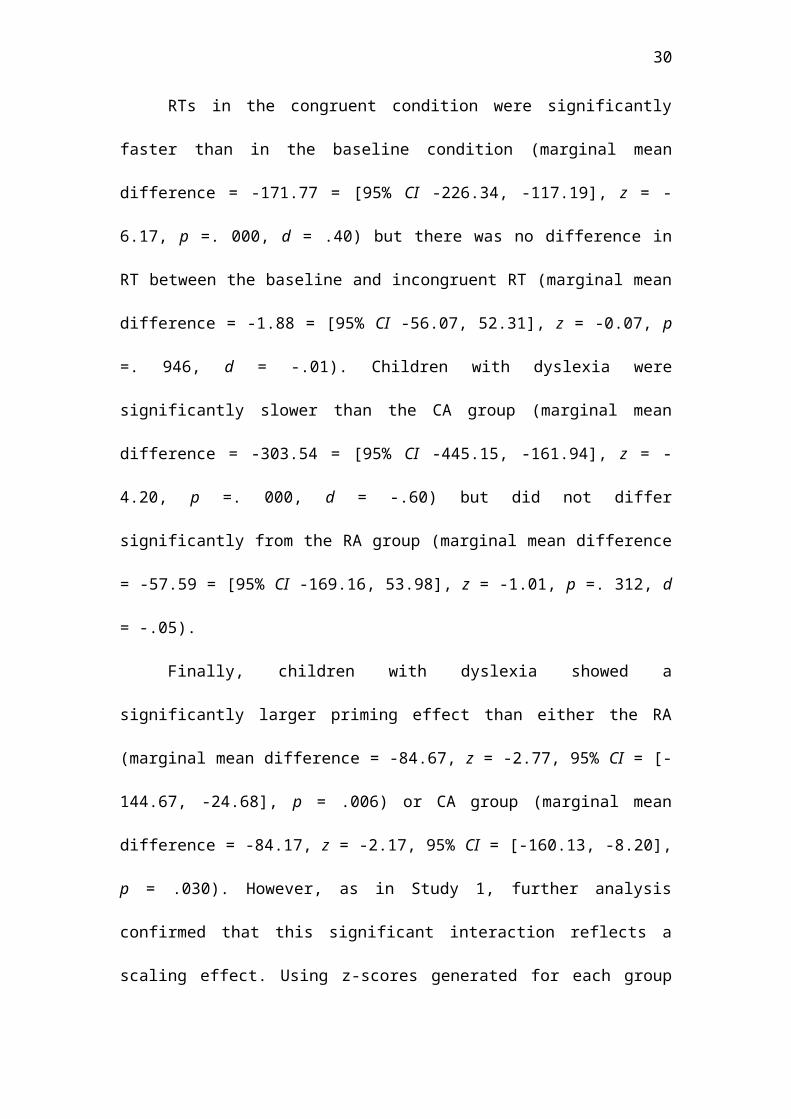
RTs in the congruent condition were significantly faster than in the baseline
condition (marginal mean difference = -171.77 = [95% CI -226.34, -117.19], z = -
6.17, p =. 000, d = .40) but there was no difference in RT between the baseline and
incongruent RT (marginal mean difference = -1.88 = [95% CI -56.07, 52.31], z = -
0.07, p =. 946, d = -.01). Children with dyslexia were significantly slower than the CA
group (marginal mean difference = -303.54 = [95% CI -445.15, -161.94], z = -4.20, p
=. 000, d = -.60) but did not differ significantly from the RA group (marginal mean
difference = -57.59 = [95% CI -169.16, 53.98], z = -1.01, p =. 312, d = -.05).
Finally, children with dyslexia showed a significantly larger priming effect
than either the RA (marginal mean difference = -84.67, z = -2.77, 95% CI = [-144.67,
-24.68], p = .006) or CA group (marginal mean difference = -84.17, z = -2.17, 95% CI
= [-160.13, -8.20], p = .030). However, as in Study 1, further analysis confirmed that
this significant interaction reflects a scaling effect. Using z-scores generated for each
group revealed a significant main effect of condition (F (2, 8) =6.55, p = .002) but no
main effect of group (F (2, 8) =. 01, p = .988) and a non-significant interaction
between condition and group (F (4, 8) =. 15, p = .961).
Summary data for all conditions of the experiment in Study 2, including the
control conditions where non-speech sounds were presented, are displayed in a
Supplementary table (S2). Accuracy in the control and experimental conditions is
comparable (and high) across the three groups. The overall pattern of RTs is
consistent across groups and with data from Study 1. While responses to phonemes
that match a preceding letter (congruent) are faster compared to trials where the
phoneme is preceded by a novel letter-like form (baseline), as expected this effect is
absent from the control conditions where corresponding scrambled phonemes are
presented. Furthermore, children with dyslexia show the same pattern as the two TD
19
groups; faster RTs in the control condition where a novel symbol precedes a
scrambled phoneme. We propose this difference is driven by a relative slowing in RT
when children are presented with a real letter prime followed by a scrambled
phoneme.
Discussion
In this study children with dyslexia, as well as both control groups, showed
priming. All groups of children were significantly faster to identify a speech sound
following the presentation of a congruent letter, compared to the presentation of a
novel symbol or incongruent letter. The present results, therefore, contradict previous
claims that dyslexia is characterised by a deficit in “automatic letter-sound
integration”. Further analyses showed that there was no significant difference in the
relative size of the priming effect across the three groups after accounting for group
differences in RT. However, there was evidence that children with dyslexia in our
study were significantly slower to identify the speech-sound compared to the CA
matched group. These slower responses in children with dyslexia suggest they found
making a decision about whether a target was a speech-sound harder than control
children.
General Discussion
A number of recent studies have proposed that reading difficulties in children
with dyslexia are caused by a deficit in “automatic letter-sound integration” (see van
Atteveldt & Ansari, 2014 for a review). We conducted two studies using a letter-
sound priming task to examine this hypothesis. The first showed that children with
just a year’s formal reading instruction show clear evidence of automatic activation of
sounds by letters: associative links between letters and their corresponding speech
sounds enabled children to process a speech sound more quickly. The second study,

20
using the same task, showed that children with dyslexia demonstrate automatic
activation of sounds by letters to at least as great an extent as either age-matched or
reading-ability matched control children. Our findings provide no support for the
theory that dyslexia is the result of a deficit in “automatic letter-sound integration”,
and have important implications for theories of reading development and reading
disorders.
The Relationship between “Automatic Letter-sound Integration” and Learning
to Read
It is well established that letter-sound knowledge is one of the best predictors
of early variations in word reading skill (Hulme et al., 2012; Hulme & Snowling,
2014; Melby-Lervåg et al., 2012) and children with dyslexia frequently show
difficulties in developing secure letter-sound knowledge (e.g. Thompson et al., 2015;
Torppa et al., 2006). The “automatic letter-sound integration hypothesis” suggests that
some children learn letter-sound correspondences to levels of perfect accuracy, but
fail to make such correspondences automatic. Such a putative failure to automate
letter-sound associations is claimed to be a proximal cause of problems in learning to
read. To quote van Atteveldt and Ansari (2014), “The crucial step in becoming literate
in an alphabetic script is therefore to automate the associations between letters and
speech sounds”. In this view, one major cause of dyslexia is a failure to “automate”
the links between letters and speech sounds, even when such letter sound relationships
have been learned to perfect levels of accuracy.
To test this hypothesis we require a robust measure of the extent to which
individual children possess automatic links between letters and sounds. The priming
task developed here provides such a measure, and has yielded some clear, if
surprising, results. Our first study showed that children within the first year of

21
learning to read show clear evidence of rapid access to speech sounds from their
corresponding letters (letter speech-sound priming) with meaningful differences
amongst children in the extent of such priming. However, after controlling for
differences attributable to age there was a negligible correlation between the degree of
letter-sound priming and children’s reading skills. It should be emphasised that given
the large sample size, we had high power to detect such an effect, even if it had been
small in magnitude. Our second study showed that children with severe reading
difficulties (dyslexia) show at least as much letter-sound priming as typically
developing children of the same age.
Study 1 also showed that overall RT in the letter-sound priming task (the
speed of deciding whether a sound was a speech-sound or not) was a weak but unique
predictor of reading ability. In line with this, in Study 2, children with dyslexia were
overall very slow on this task. These results suggest that the task of making speeded
judgements about whether a sound is speech or not, is a sensitive index of
phonological processing, and so related to reading ability.
Is Dyslexia Associated with a Deficit in “Automatic Letter-sound Integration”?
Previous evidence that deficits in “automatic letter-sound integration” are
important in dyslexia has come from neuroimaging studies, though recently published
studies have led to an increasingly complicated picture and there is currently no
generally accepted neural signature for “automatic letter-sound integration” (see
Kronschnabel, Brem, Maurer, & Brandeis, 2014; Nash et al., 2016; Žarić et al., 2014).
Unlike these neuroimaging studies, which are hampered by small sample sizes and
extreme group designs, Study 1 tested the “automatic letter-sound integration
hypothesis” in a large unselected sample while also assessing a range of phonological
skills that are known to be close correlates of reading ability. However, our measure

22
of letter-sound integration (facilitation in the letter-sound priming task) showed a
negligible correlation with reading ability, although overall speed of performance on
the speech sound judgement task, was a moderately strong correlate of reading ability.
Automatic Activation of Sounds by Letters
Our finding that children respond faster to a speech sound if it matches a
preceding letter clearly indicates that letters and their corresponding sounds have
become strongly associated in memory as a result of early literacy instruction.
Analysis of additional control conditions involving scrambled speech targets confirms
that this effect is unique to these learned associations. Whether this priming effect is
“automatic” is an important question. The idea of a process being automatic has a
long history in cognitive psychology (James, 1890) and is typically interpreted to
mean that a process occurs rapidly, efficiently and without conscious attention or
effort (Moors & De Houwer, 2006).
In evaluating automaticity, we can consider a ‘cost benefit analysis’ of the
data (Posner & Snyder, 2004). According to Posner and Snyder (2004) facilitation and
interference represent separate mechanisms; with facilitation an indicator of automatic
processing and interference signalling attentional processing. In other words,
automatically activated pathways facilitate the processing of related information,
whereas automatic activation of incongruent information will not result in an
inhibitory effect. In contrast, if attention is directed to the processing of information
(i.e. the participant is consciously attending to the relationship between letters and
speech-sounds) there will be a cost in response to incongruent information. Our
finding of facilitation, in the absence of inhibition, according to the arguments of
Posner and Snyder (2004), provides evidence that the facilitation effect reflects an
automatic process that is not under conscious control.

23
Previous work using similar cost-benefit analyses, reported evidence of
‘facilitation-without-cost’ in the rapid processing of non-predictive symbolic (arrow)
directional cues, whereas the presentation of gaze cues produced ‘facilitation-plus-
cost’ which was interpreted as an attentional effect (Langdon & Smith, 2005). That
the present study finds evidence of facilitation-without-cost following a non-
predictive prime (congruent trials occurred only 14% of the time) points strongly
towards automatic processing.
An alternative view is that facilitation and interference operate via a common
mechanism and that the presence of one predicts the other (Cohen Kadosh, Cohen
Kadosh, Henik, & Linden, 2008; Roelofs, van Turennout, & Coles, 2006). Following
this view, the absence of interference in the present study may reflect an issue with
the baseline and incongruent condition comparison. A limitation of using novel
symbols as “neutral” stimuli is that these symbols are also technically “incongruent”
with the speech-sound target. Thus, the absence of a difference between the baseline
and the incongruent condition may reflect similar processing of the mismatch between
visual prime and auditory target.
Phonological Skills and Learning to Read
It is now well established that in alphabetic languages variations in learning
to read are predicted by three distinct phonological skills: phoneme awareness, letter-
sound knowledge and Rapid Automatized Naming (RAN; Caravolas et al., 2012;
Furnes & Samuelsson, 2010; Hulme & Snowling, 2013). In Study 1 we included these
measures as predictors of reading ability. For children in this study letter-sound
knowledge was essentially at ceiling levels, reflecting the fact that the children had
been exposed to intensive, phonic reading instruction for at least a year in school.
However, our study replicates many earlier studies in showing that phoneme

24
awareness and RAN were powerful, and independent predictors of reading ability
(these 2 predictors alone accounted for some 68% of the variance in reading).
A novel finding in Study 1 was that the speed with which a child could
identify an isolated speech sound was an additional predictor of reading ability after
controlling for age, phoneme deletion and RAN. We suggest that this reflects aspects
of the quality or ease of access to phonological representations, which may in turn
predict individual differences in reading. The finding that children with dyslexia were
significantly slower to decide whether a sound was speech or not is in line with this
theory. However, it is not clear from our study whether performance is influenced by
the quality of, or ease of access to, phonological representations (cf. Boets et al.,
2013). An alternative view is that children with dyslexia may show quite general
slowing in reaction time tasks which is not specific to tasks involving phonological
judgements (Nicolson, 1994). Since we did not assess simple or choice RT in this
study we cannot evaluate the extent to which the slow RTs here reflect a general
slowing in information processing speed or a more specific effect on speed of
phonological processing. Further research is needed to disentangle these possibilities
and to clarify the nature of the phonological deficit in dyslexia.
Summary and Conclusions
The “automatic letter-sound integration hypothesis” claims that difficulties in
learning to read result from weakened associations between letters and speech-sounds
(e.g. Aravena, Snellings, Tijms, & van der Molen, 2013; Blau et al., 2010; Froyen et
al., 2011). Our findings provide no support for this theory. Children after one year of
reading instruction show clear evidence of automatic access to speech-sounds from
their corresponding letters but there was no meaningful relationship between the
degree of letter-sound integration and children’s reading skills. Furthermore, Study 2

25
found that children with dyslexia show letter-sound integration that is at least as
strong as that found in typically developing children of the same age.
An additional, and unexpected, finding from Study 1 was that the speed with
which a child could identify an isolated speech-sound was a unique predictor of
reading ability after controlling for age, phoneme awareness and RAN. We suggest
that speeded performance on this task may reflect aspects of the quality or ease of
access to speech representations. Results from our second study support this
interpretation, as children with dyslexia were significantly slower to identify the
speech-sound target, which may reflect impaired phonological processing in this
group. Together, these findings provide additional support for the importance of
phonological representations for learning to read.

26
References
Aravena, S., Snellings, P., Tijms, J., & van der Molen, M. W. (2013). A lab-
controlled simulation of a letter–speech sound binding deficit in dyslexia.
Journal Of Experimental Child Psychology, 115(4), 691-707.
Bishop, D. (2007). Using mismatch negativity to study central auditory processing in
developmental language and literacy impairments: where are we, and where
should we be going? Psychological Bulletin, 133(4), 651.
Blau, V., Reithler, J., van Atteveldt, N., Seitz, J., Gerretsen, P., Goebel, R., &
Blomert, L. (2010). Deviant processing of letters and speech sounds as
proximate cause of reading failure: a functional magnetic resonance imaging
study of dyslexic children. Brain, 133(3), 868-879.
Blau, V., van Atteveldt, N., Ekkebus, M., Goebel, R., & Blomert, L. (2009). Reduced
neural integration of letters and speech sounds links phonological and reading
deficits in adult dyslexia. Current Biology, 19(6), 503-508.
Blomert, L. (2011). The neural signature of orthographic–phonological binding in
successful and failing reading development. Neuroimage, 57(3), 695-703.
Blomert, L., & Froyen, D. (2010). Multi-sensory learning and learning to read.
International Journal of Psychophysiology, 77(3), 195-204.
Blomert, L., & Willems, G. (2010). Is there a causal link from a phonological
awareness deficit to reading failure in children at familial risk for dyslexia?
Dyslexia, 16(4), 300-317.
Caravolas, M., Lervåg, A., Defior, S., Málková, G. S., & Hulme, C. (2013). Different
patterns, but equivalent predictors, of growth in reading in consistent and
inconsistent orthographies. Psychological Science, 24(8), 1398-1407.
27
Caravolas, M., Lervåg, A., Mousikou, P., Efrim, C., Litavský, M., Onochie-
Quintanilla, E., . . . Mikulajová, M. (2012). Common patterns of prediction of
literacy development in different alphabetic orthographies. Psychological
Science, 0956797611434536.
Cohen Kadosh, R., Cohen Kadosh, K., Henik, A., & Linden, D. E. J. (2008).
Processing conflicting information: Facilitation, interference, and functional
connectivity. Neuropsychologia, 46(12), 2872-2879.
doi:https://doi.org/10.1016/j.neuropsychologia.2008.05.025
Elbro, C., Borstrøm, I., & Petersen, D. K. (1998). Predicting dyslexia from
kindergarten: The importance of distinctness of phonological representations
of lexical items. Reading Research Quarterly, 33(1), 36-60.
Ellis, D. (2010). Time-domain scrambling of audio signals in Matlab. web resource:
http://www.ee.columbia.edu/~dpwe/resources/matlab/scramble/.
Foster, H. (2007). Single word reading test 6-16. GL Assessment Limited.
Froyen, D. J., Bonte, M. L., van Atteveldt, N., & Blomert, L. (2009). The long road to
automation: neurocognitive development of letter–speech sound processing.
Journal of Cognitive Neuroscience, 21(3), 567-580.
Froyen, D. J., Willems, G., & Blomert, L. (2011). Evidence for a specific cross‐modal
association deficit in dyslexia: an electrophysiological study of letter–speech
sound processing. Developmental Science, 14(4), 635-648.
Furnes, B., & Samuelsson, S. (2010). Predicting reading and spelling difficulties in
transparent and opaque orthographies: A comparison between Scandinavian
and US/Australian children. Dyslexia, 16(2), 119-142.

28
Griffiths, Y. M., & Snowling, M. J. (2002). Predictors of exception word and
nonword reading in dyslexic children: The severity hypothesis. Journal of
Educational Psychology, 94(1), 34.
Hulme, C., Bowyer-Crane, C., Carroll, J. M., Duff, F. J., & Snowling, M. J. (2012).
The causal role of phoneme awareness and letter-sound knowledge in learning
to read combining intervention studies with mediation analyses. Psychological
Science, 23(6), 572-577.
Hulme, C., Caravolas, M., Málková, G., & Brigstocke, S. (2005). Phoneme isolation
ability is not simply a consequence of letter-sound knowledge. Cognition,
97(1), 1-11.
Hulme, C., & Snowling, M. J. (2013). Learning to read: What we know and what we
need to understand better. Child Development Perspectives, 7(1), 1-5.
Hulme, C., & Snowling, M. J. (2014). The interface between spoken and written
language: developmental disorders. Philosophical Transactions of the Royal
Society B: Biological Sciences, 369(1634), 20120395.
Hulme, C., Stothard, S., Clarke, P., Bowyer-Crane, C., Harrington, A., Truelove, E.,
& Snowling, M. (2009). YARC York Assessment of Reading for
Comprehension. University of York, Centre for Reading and Language: GL
Assessment.
James, W. (1890). The Principles of Psychology. New York: Henry Holt and
Company.
Kronschnabel, J., Brem, S., Maurer, U., & Brandeis, D. (2014). The level of
audiovisual print–speech integration deficits in dyslexia. Neuropsychologia,
62, 245-261.

29
Landerl, K. (2001). Word recognition deficits in German: More evidence from a
representative sample. Dyslexia, 7(4), 183-196.
Langdon, R., & Smith, P. (2005). Spatial cueing by social versus nonsocial directional
signals. Visual Cognition, 12(8), 1497-1527.
doi:10.1080/13506280444000805
Lervåg, A., Bråten, I., & Hulme, C. (2009). The cognitive and linguistic foundations
of early reading development: a Norwegian latent variable longitudinal study.
Developmental Psychology, 45(3), 764.
Litt, R. A., & Nation, K. (2014). The nature and specificity of paired associate
learning deficits in children with dyslexia. Journal of Memory and Language,
71(1), 71-88.
Melby-Lervåg, M., Lyster, S.-A. H., & Hulme, C. (2012). Phonological skills and
their role in learning to read: a meta-analytic review. Psychological Bulletin,
138(2), 322.
Moors, A., & De Houwer, J. (2006). Automaticity: a theoretical and conceptual
analysis. Psychological Bulletin, 132(2), 297.
Morey, R. D. (2008). Confidence intervals from normalized data: A correction to
Cousineau (2005). Reason, 4(2), 61-64.
Nash, H. M., Gooch, D., Hulme, C., Mahajan, Y., McArthur, G., Steinmetzger, K., &
Snowling, M. J. (2016). Are the literacy difficulties that characterize
developmental dyslexia associated with a failure to integrate letters and speech
sounds? Developmental Science, n/a-n/a. doi:10.1111/desc.12423
Nicolson, R. I. (1994). Reaction times and dyslexia. The Quarterly Journal of
Experimental Psychology Section A, 47(1), 29-48.
doi:10.1080/14640749408401142
30
Peterson, R. L., & Pennington, B. F. (2015). Developmental Dyslexia. Annual Review
of Clinical Psychology, 11(1), 283-307.
Posner, M. I., & Snyder, C. R. (2004). Attention and Cognitive Control. In D. A.
Balota & E. J. Marsh (Eds.), Cognitive Psychology: Key Readings (pp. 205-
223). New York, NY: Psychology Press.
Preacher, K. J., Rucker, D. D., MacCallum, R. C., & Nicewander, W. A. (2005). Use
of the extreme groups approach: a critical reexamination and new
recommendations. Psychological Methods, 10(2), 178.
Roelofs, A., van Turennout, M., & Coles, M. G. H. (2006). Anterior cingulate cortex
activity can be independent of response conflict in Stroop-like tasks.
Proceedings of the National Academy of Sciences, 103(37), 13884-13889.
doi:10.1073/pnas.0606265103
Selst, M. V., & Jolicoeur, P. (1994). A solution to the effect of sample size on outlier
elimination. The Quarterly Journal Of Experimental Psychology, 47(3), 631-
650.
Taylor, J., Plunkett, K., & Nation, K. (2011). The influence of consistency, frequency,
and semantics on learning to read: An artificial orthography paradigm.
Journal of Experimental Psychology: Learning, Memory, and Cognition,
37(1), 60.
Thompson, P. A., Hulme, C., Nash, H. M., Gooch, D., Hayiou‐Thomas, E., &
Snowling, M. J. (2015). Developmental dyslexia: predicting individual risk.
Journal of Child Psychology and Psychiatry.
Torgesen, J. K., Wagner, R. K., & Rashotte, C. (1999). TOWRE–2 Test of Word
Reading Efficiency.

31
Torppa, M., Poikkeus, A.-M., Laakso, M.-L., Eklund, K., & Lyytinen, H. (2006).
Predicting delayed letter knowledge development and its relation to grade 1
reading achievement among children with and without familial risk for
dyslexia. Developmental Psychology, 42(6), 1128.
van Atteveldt, N., & Ansari, D. (2014). How symbols transform brain function: A
review in memory of Leo Blomert. Trends in Neuroscience and Education,
3(2), 44-49.
Wagner, R. K., Torgesen, J., & Rashotte, C. (1999). Comprehensive test of
phonological processing (CTOPP). Pro-Ed, Austin, Texas.
Wechsler, D. (2005). Wechsler Individual Achievement Test (WIAT-II UK): Harcourt
Assessment.
Žarić, G., González, G. F., Tijms, J., van der Molen, M. W., Blomert, L., & Bonte, M.
(2014). Reduced Neural Integration of Letters and Speech Sounds in Dyslexic
Children Scales with Individual Differences in Reading Fluency. PLoS One,
9(10), 1-14.

32
Table 1. Descriptive statistics (means, standard deviations, and ranges) for all measures.
Measure N Mean St.Dev Min. Max.
Age (months) 155 78.77 7.59 65.39 93.43
Letter Sound Knowledge (LSK) (/32) 104 31.10 1.18 26 32.00
LSK standard score (SS) 104 110.50 9.35 84 124.00
Single Word Reading Task (SWRT)
(/60)153 26.81 11.21 2.00 48.00
SWRT SS 153 111.39 12.14 75.00 136.00
TOWRE Sight Word Efficiency
(SWE) (/104)150 45.40 17.34 3.00 78.00
TOWRE SWE SS 150 116.61 11.26 91.00 145.00
TOWRE Phonemic Decoding
Efficiency (PDE) (/63)148 23.55 11.87 1.00 48.00
TOWRE PDE SS 148 117.09 10.15 95.00 140.00
Reading factor score 148 0.08 0.93 -1.88 1.84
RAN total time (seconds) 105 46.42 12.79 26.00 89.00
RAN scaled score 105 10.80 2.03 6.00 16.00
Phoneme Deletion (/24) 105 15.34 5.32 3.00 24.00
Phoneme Deletion SS 105 110.77 12.16 70.00 137.00
Baseline accuracy (/20) 144 19.12 1.16 15.00 20.00
Congruent accuracy (/20) 144 19.11 1.12 15.00 20.00
Incongruent accuracy (/20) 144 19.24 0.96 16.00 20.00
.

33
Table 2. Pairwise correlations among measures.
Measures 1. 2. 3. 4. 5. 6. 7. 8.
1. Reading Factor Score - 0.67*** 0.63*** -0.07 0.02 -0.17* -0.17* -0.22**
2. RAN -.71*** - -0.44*** -0.04 -0.14 0.07 0.13 0.18
3. Phoneme Deletion .73*** -.53*** - 0.04 0.05 -0.09 -0.16 -0.13
4. Facilitation -.20* .05 -.09 - 0.49*** 0.51*** -0.09 0.23**
5. Interference -.11 -.05 -.07 .52*** - 0.53*** 0.27*** -0.11
6. Baseline RT -.39*** .21* -.30** -.55*** .56*** - 0.81*** 0.79***
7. Congruent RT -.35*** .24* -.32** .02 .34*** .84*** - .75***
8. Incongruent RT -.39*** .28** -.30** .31*** -.01 .82*** .79*** -
9. Age .57*** -.33** .50*** -.25** -.23** -.46*** -.39*** -.40***
Note: Partial correlations controlling for age are shown above the diagonal, and simple correlations are below the diagonal
*** = p <.001, ** = p <.01, * = p <.05.

34
Mean (SD)Dyslexic (N=19) CA (N=20) RA (N=90) F Group differences
Gender (M:F) 4:15 10:9 49:41 7.87* (χ2(2))Age (months) 121.36 (8.37) 121.29 (3.14) 82.37 (6.76) 471.62*** (DYS = CA) > RA
Single Word Reading Test (SWRT) 45.80 (5.18) 37.70 (5.14) 41.24*** CA > RA
SWRT SS 102.20 (9.47) 120.71 (8.48) 75.67*** CA < RASWRT Reading Age (RA;
months) 129.15 (22.06) 103.43 (11.16) 58.34*** CA > RA
WIAT Reading 94.84 (12.05) 105.00 (7.66) 10.78** CA > DYSWIAT Reading SS 90.25 (10.10) 99.75 (10.18) 8.78** CA > DYSWIAT Reading RA
(months) 104.00 (20.91) 128.40 (23.89) 12.60** CA > DYS
Baseline Accuracy 18.75 (2.10) 19.05 (1.19) 19.33 (0.94) .78 noneCongruent Accuracy 18.85 (1.90) 19.50 (0.83) 19.37 (0.89) .50 none
Incongruent Accuracy 19.00 (2.20) 19.45 (0.83) 19.49 (0.77) .06 noneTable 3. Mean (SD) age and scores on standardized measures of literacy and letter-sound priming task in the three groups.

35
Figure 1. The structure of a trial across the three main experimental conditions
36
Year 1 Year 20
200
400
600
800
1000
1200
1400
1600
Incongruent Baseline Congruent
Ave
rage
res
pons
e tim
e (m
s)
Figure 2. Average response times (and 95% CIs) for each condition of the letter-
sound priming task for Year 1 (N=76) and Year 2 (N=68).

37
Dyslexic CA RA0
200
400
600
800
1000
1200
1400
Incongruent Baseline Congruent
Ave
rage
res
pons
e tim
e (m
s)
Figure 3. Average response times (and 95% within-subject CIs) for each condition of
the letter-sound priming task for the three groups.

38
Acknowledgements
We would like to thank Imogen Long, Claire Sears and Gillian West for their
assistance with data collection and the families and children who took part.
Funding: This research was supported by a PhD Studentship from University College
London and ESRC Grant ES/L008270/1

39
Table S1. Descriptive statistics (means, standard deviations, and ranges) for all
conditions of the letter-sound priming task.
*Control 1 = novel symbol prime and nonverbal target
**Control 2 = letter prime and congruent scrambled sound
***Control 3 = letter prime and incongruent scrambled sound
Measure N Mean SD Min Max
Control 1* accuracy (/20) 146 19.43 0.85 17.00 20.00
Control 2** accuracy (/20) 146 19.15 1.01 16.00 20.00
Control 3*** accuracy (/20) 146 18.83 1.11 15.00 20.00
Control 1 average RT (ms) 146 1018.58 325.24 485.79 2126.95
Control 2 average RT (ms) 146 1070.68 310.66 611.28 2117.83
Control 3 average RT (ms) 146 1070.17 317.70 657.07 2042.05
Baseline accuracy (/20) 144 19.12 1.16 15.00 20.00
Congruent accuracy (/20) 144 19.11 1.12 15.00 20.00
Incongruent accuracy (/20) 144 19.24 0.96 16.00 20.00
Baseline average RT (ms) 144 1222.78 336.66 673.47 2198.55
Congruent average RT (ms) 144 1117.80 313.87 640.42 2230.94
Incongruent average RT (ms) 144 1213.26 310.62 732.63 2339.69

40
Table S2. Descriptive statistics (means, standard deviations, and ranges) for all
conditions of the letter-sound priming task for the three groups
Mean (SD)
Measure Dyslexic (N=19) CA (N=20) RA (N=90)
Control 1* accuracy (/20) 19.25 (1.25) 18.90 (1.59) 19.27 (1.00)
Control 2** accuracy (/20) 19.50 (0.69) 19.79 (0.42) 19.62 (0.69)
Control 3*** accuracy (/20) 19.05 (1.57) 18.95 (1.47) 18.78 (1.23)
Control 1 average RT (ms) 964.72 (210.77) 709.40 (168.97) 957.69 (19.27)
Control 2 average RT (ms) 879.12 (198.47) 674.67 (179.53) 912.34 (232.71)
Control 3 average RT (ms) 960.46 (287.91) 690.67 (164.28) 937.72 (205.15)
Baseline accuracy (/20) 18.75 (2.10) 19.05 (1.19) 19.33 (0.94)
Congruent accuracy (/20) 18.85 (1.90) 19.5 (0.83) 19.37 (0.89)
Incongruent accuracy (/20) 19 (2.20) 19.45 (0.83) 19.49 (0.77)
Baseline average RT (ms) 1159.81 (327.94) 851.16 (223.12) 1096.9 (232.14)
Congruent average RT (ms) 980.84 (268.29) 762.83 (189.71) 1008.47 (219.72)
Incongruent average RT (ms) 1153.41 (272.46) 862.24 (205.39) 1100.25 (229.42)
*Control 1 = novel symbol prime and nonverbal target
**Control 2 = letter prime and congruent scrambled sound
***Control 3 = letter prime and incongruent scrambled sound