weather effects on winter and fall waterfowl habitat … effects on winter and fall waterfowl...
TRANSCRIPT
Weather Effects on Winter and Fall Waterfowl Habitat in the Gulf Coast
Tara Rodgers, The University of Oklahoma Southern Climate Impacts Planning Program Intern
Stephen J. DeMaso, Monitoring Coordinator Gulf Coast Joint Venture [email protected]
Nicholas Enwright, GIS Specialist II Gulf Coast Joint Venture
OBJECTIVE The Gulf Coast Joint Venture (GCJV) desires an appropriate parameter that explains environmental influences on seasonal waterfowl habitat within agricultural landscapes of the GCJV region
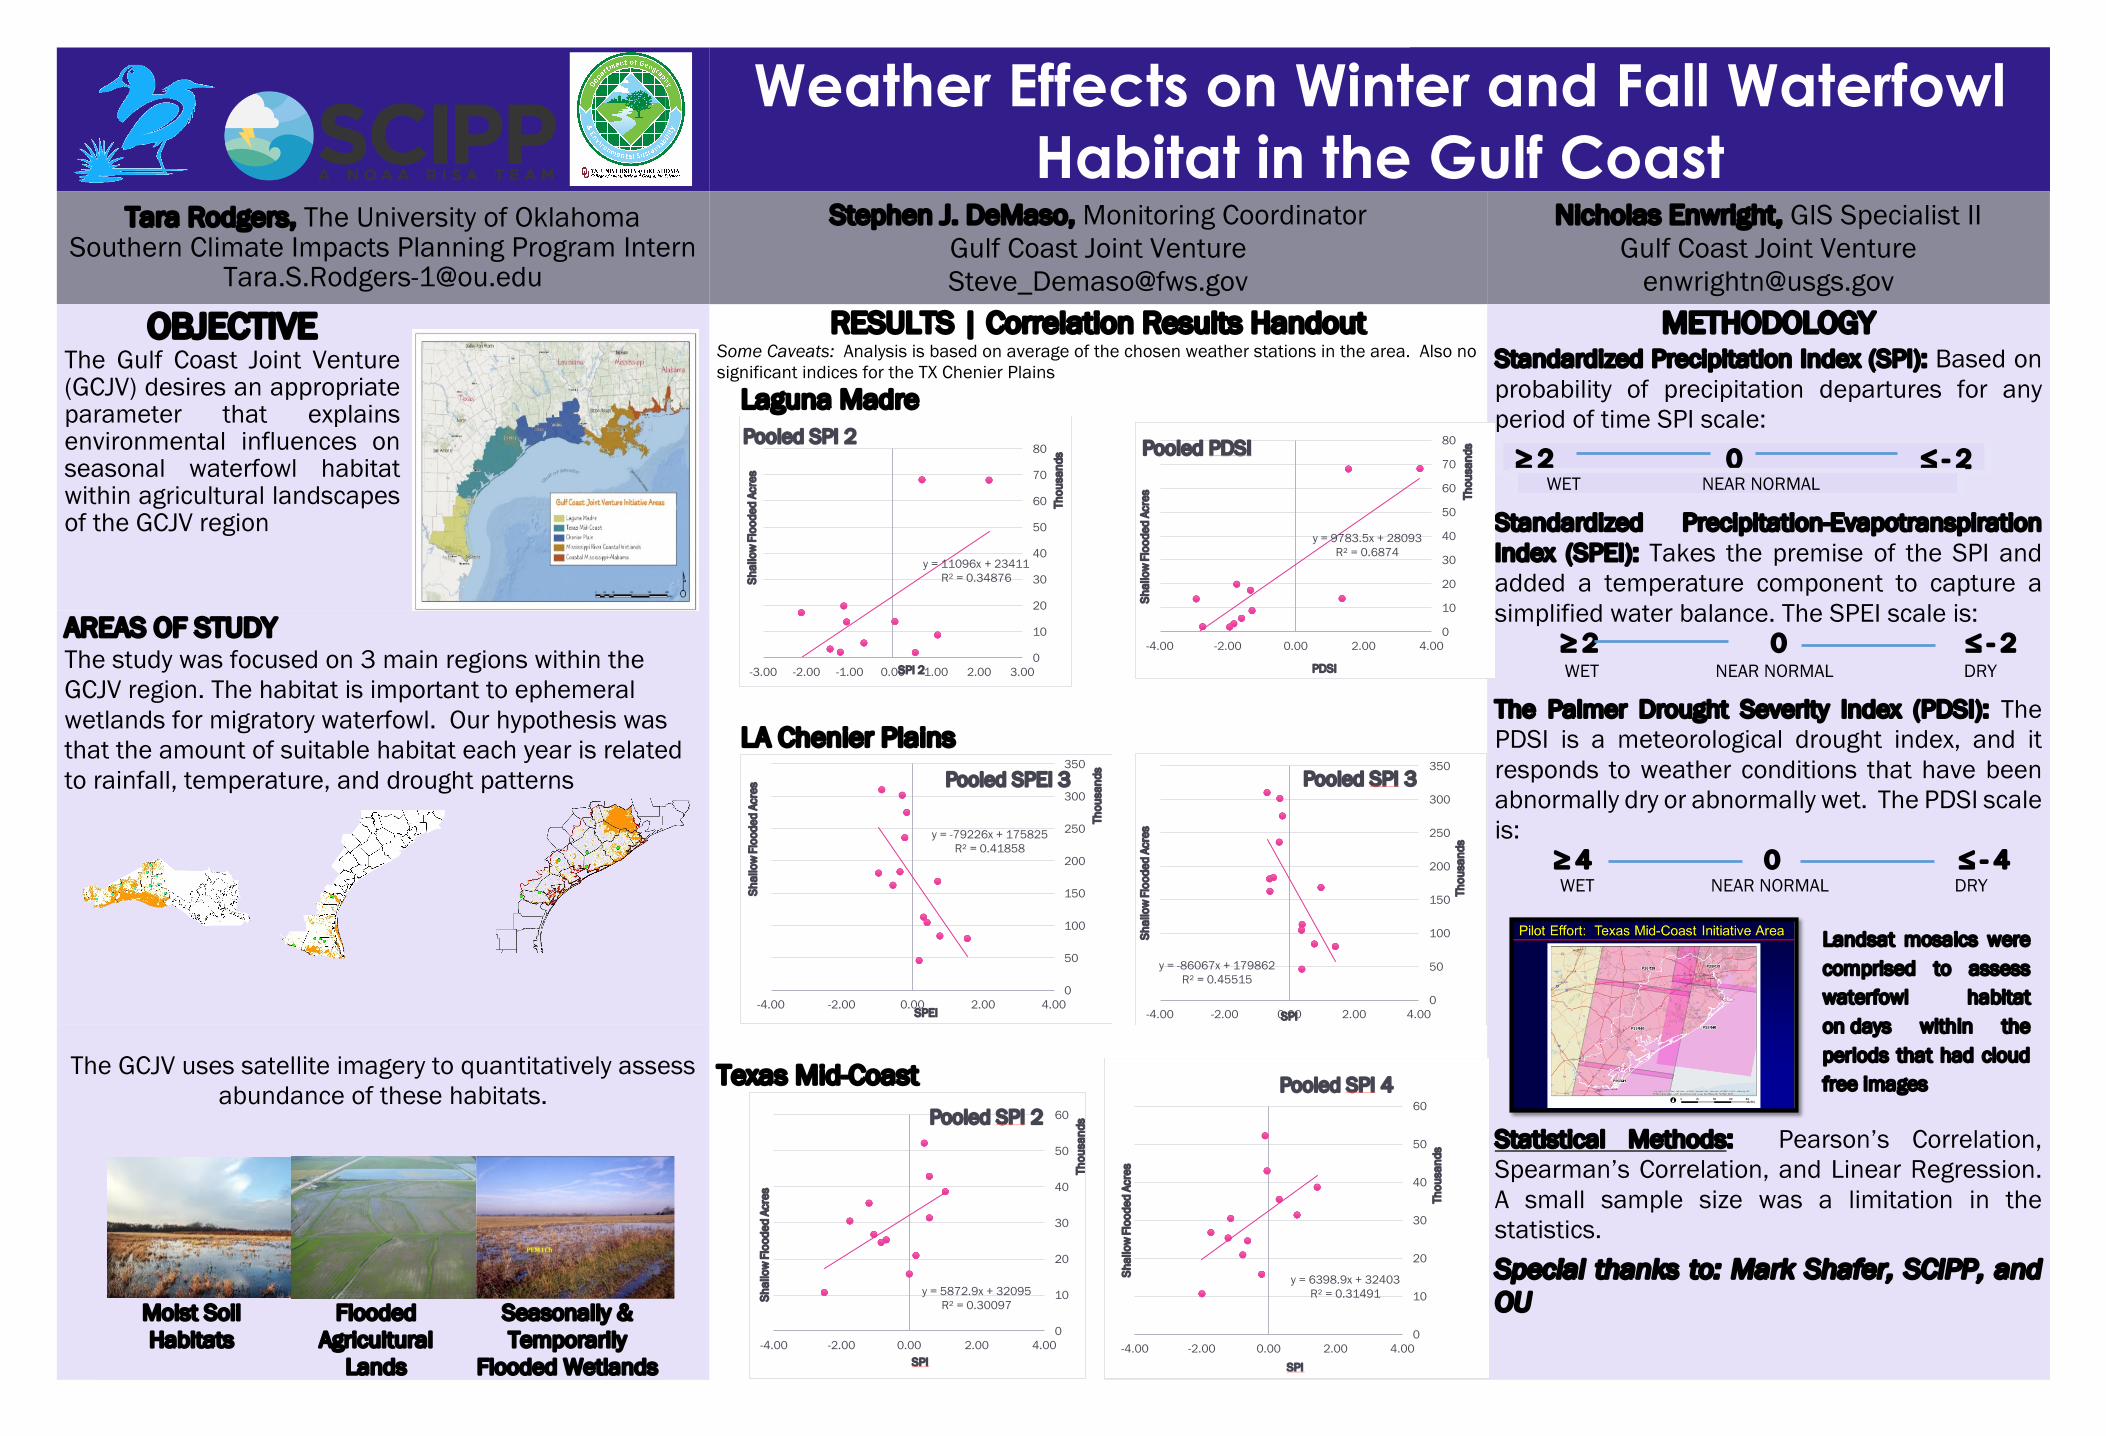
RESULTS | Correlation Results Handout Some Caveats: Analysis is based on average of the chosen weather stations in the area. Also no significant indices for the TX Chenier Plains
METHODOLOGY Standardized Precipitation Index (SPI): Based on probability of precipitation departures for any period of time SPI scale:
Standardized Precipitation-Evapotranspiration Index (SPEI): Takes the premise of the SPI and added a temperature component to capture a simplified water balance. The SPEI scale is: ≥ 2 0 ≤ - 2 WET NEAR NORMAL DRY
The Palmer Drought Severity Index (PDSI): The PDSI is a meteorological drought index, and it responds to weather conditions that have been abnormally dry or abnormally wet. The PDSI scale is: ≥ 4 0 ≤ - 4 WET NEAR NORMAL DRY
Statistical Methods: Pearson’s Correlation, Spearman’s Correlation, and Linear Regression. A small sample size was a limitation in the statistics. Special thanks to: Mark Shafer, SCIPP, and OU
Laguna Madre
AREAS OF STUDY The study was focused on 3 main regions within the GCJV region. The habitat is important to ephemeral wetlands for migratory waterfowl. Our hypothesis was that the amount of suitable habitat each year is related to rainfall, temperature, and drought patterns
LA Chenier Plains
The GCJV uses satellite imagery to quantitatively assess abundance of these habitats.
Moist Soil Habitats
Flooded Agricultural
Lands
Seasonally & Temporarily
Flooded Wetlands
Texas Mid-Coast
y = 11096x + 23411R² = 0.34876
0
10
20
30
40
50
60
70
80
-3.00 -2.00 -1.00 0.00 1.00 2.00 3.00
Shal
low
Flo
oded
Acr
es
Thou
sand
s
SPI 2
Pooled SPI 2
y = 9783.5x + 28093R² = 0.6874
0
10
20
30
40
50
60
70
80
-4.00 -2.00 0.00 2.00 4.00
Shal
low
Flo
oded
Acr
es Thou
sand
s
PDSI
Pooled PDSI
y = -79226x + 175825R² = 0.41858
0
50
100
150
200
250
300
350
-4.00 -2.00 0.00 2.00 4.00
Shal
low
Flo
oded
Acr
es
Thou
sand
s
SPEI
Pooled SPEI 3
y = -86067x + 179862R² = 0.45515
0
50
100
150
200
250
300
350
-4.00 -2.00 0.00 2.00 4.00
Shal
low
Flo
oded
Acr
es
Thou
sand
s
SPI
Pooled SPI 3
y = 6398.9x + 32403R² = 0.31491
0
10
20
30
40
50
60
-4.00 -2.00 0.00 2.00 4.00
Shal
low
Flo
oded
Acr
es
Thou
sand
s
SPI
Pooled SPI 4
y = 5872.9x + 32095R² = 0.30097
0
10
20
30
40
50
60
-4.00 -2.00 0.00 2.00 4.00
Shal
low
Flo
oded
Acr
es
Thou
sand
s
SPI
Pooled SPI 2
≥ 2 0 ≤ - 2 WET NEAR NORMAL DRY
Landsat mosaics were comprised to assess waterfowl habitat on days within the periods that had cloud free images