waterfowl conservation strategy for the playa lakes joint ...the purpose of the north american...
TRANSCRIPT
Waterfowl Conservation Strategy for the
Playa Lakes Joint Venture (draft 08 Jun 2005)
“To sustain abundant waterfowl populations by conserving landscapes, through partnerships that are guided by sound science”
A Contribution to the North American Waterfowl Management Plan
and the Playa Lakes Joint Venture Implementation Plan
by the Playa Lakes Joint Venture
Waterfowl Team
Jim Dubovsky, U. S. Fish and Wildlife Service Region 6 Jim Gammonley, Colorado Division of Wildlife
Helen Hands, Kansas Department of Wildlife and Parks Dave Haukos, U. S. Fish and Wildlife Service Region 2
Bill Johnson*, Texas Parks and Wildlife Kevin Kraai, Texas Parks and Wildlife
Marvin Kraft, Kansas Department of Wildlife and Parks Keith McKnight, Ducks Unlimited Inc.
Tim Mitchusson, New Mexico Game and Fish Department Mike O’Meilia, Oklahoma Department of Wildlife Conservation
Brian Sullivan**, Playa Lakes Joint Venture Rich Walters, Nebraska Game and Parks Commission
*Co-chair. **Co-chair and principle author.
A Working Group of the Playa Lakes Joint Venture Monitoring, Evaluation, and Research Team
2
Table of Contents List of Figures and Tables............................................................................................................... 3 Background, Purpose, and Intended Audience ............................................................................... 4 The PLJV in the Context of North American Waterfowl and Wetlands ........................................ 5 Approach for Developing Habitat Objectives................................................................................. 6 Step 1: Geographic Planning Areas ............................................................................................... 6 Step 2: Priority Species and Seasons ............................................................................................. 6 Step 3: Population Objectives........................................................................................................ 7 Step 4: Vital Rate Objectives......................................................................................................... 9 Step 5: Limiting Factors................................................................................................................. 9 Step 6: Habitat Objectives ............................................................................................................. 9 Step 7: Measuring Success........................................................................................................... 12 Monitoring and Evaluation ........................................................................................................... 12 Updating the Conservation Strategy ............................................................................................. 13 Afterword...................................................................................................................................... 13 Acknowledgments......................................................................................................................... 13 Literature Cited ............................................................................................................................. 13 APPENDIX A: Waterfowl Carrying Capacity Model for BCR18 Colorado .............................. 24 APPENDIX B: Waterfowl Carrying Capacity Model for BCR18 Kansas.................................. 25 APPENDIX C: Waterfowl Carrying Capacity Model for BCR18 Nebraska .............................. 26 APPENDIX D: Waterfowl Carrying Capacity Model for BCR18 New Mexico ........................ 27 APPENDIX E: Waterfowl Carrying Capacity Model for BCR18 Oklahoma............................. 28 APPENDIX F: Waterfowl Carrying Capacity Model for BCR18 Texas .................................... 29 APPENDIX G: Waterfowl Carrying Capacity Model for BCR19 Kansas.................................. 30 APPENDIX H: Waterfowl Carrying Capacity Model for BCR19 Oklahoma ............................ 31 APPENDIX I: Waterfowl Carrying Capacity Model for BCR19 Texas ..................................... 32 APPENDIX J: Assumptions Made in Developing This Conservation Strategy.......................... 33 APPENDIX K: PLJV Waterfowl Research Priorities ................................................................. 34
3
List of Figures and Tables Page Figures
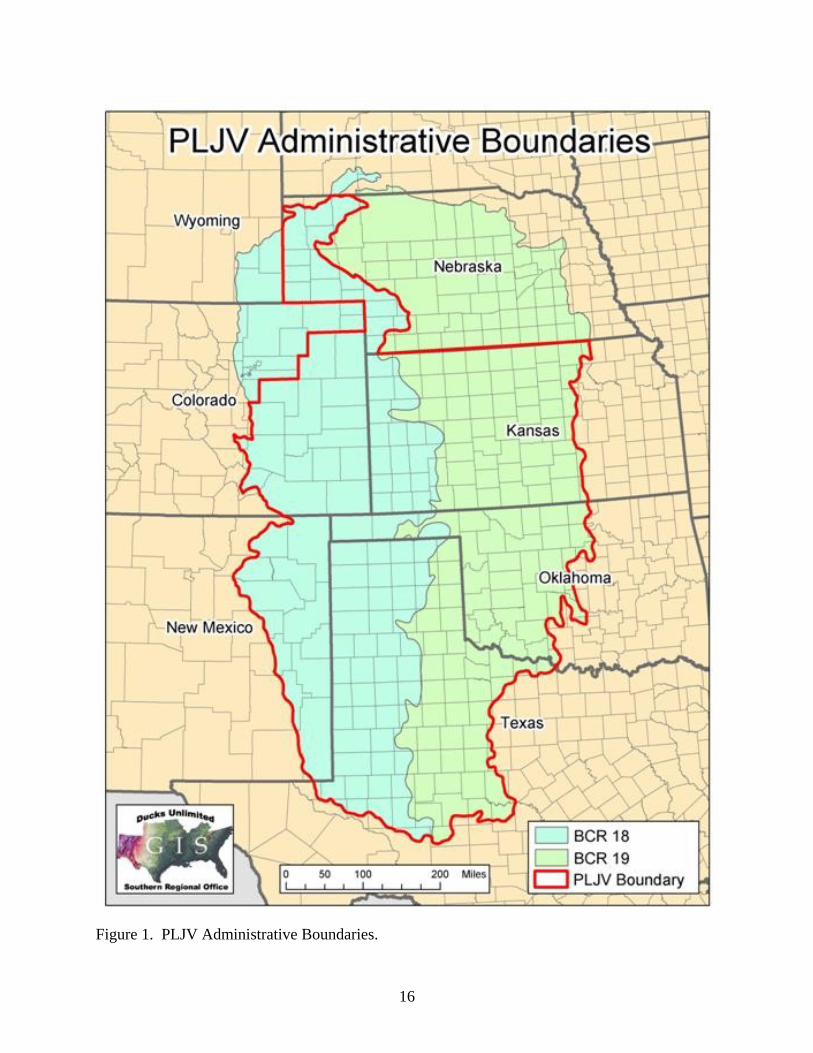
1. PLJV Administrative Boundaries. 17 Tables
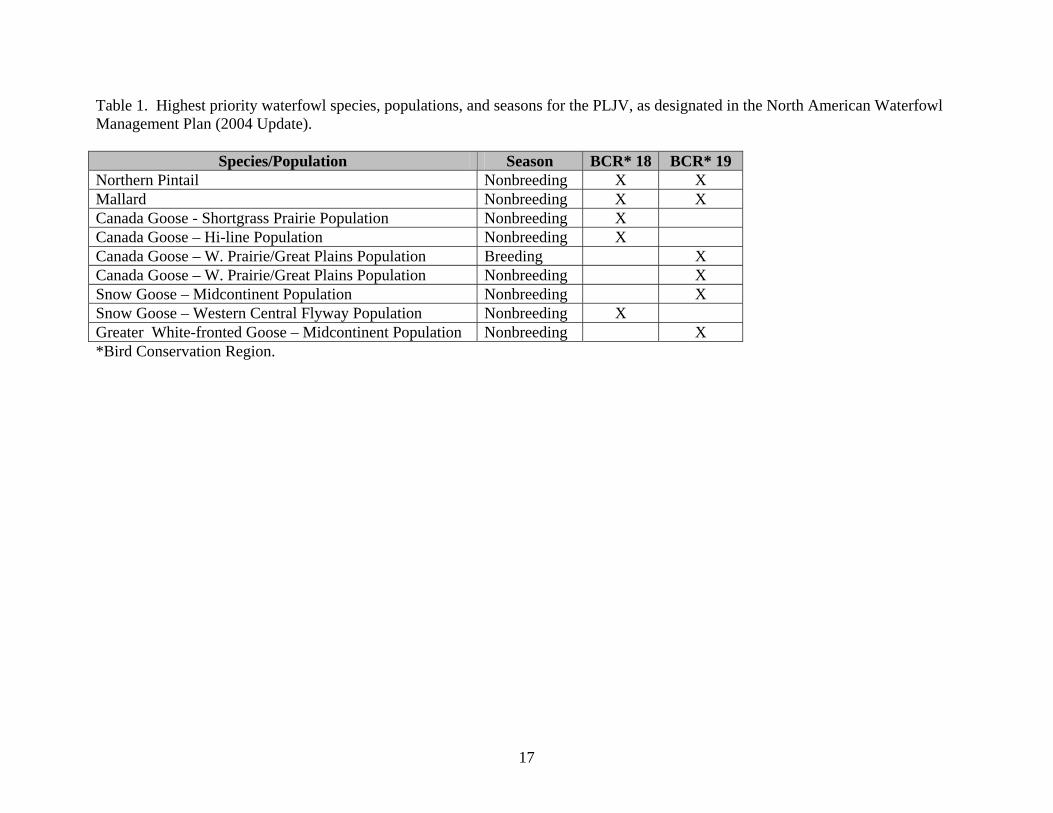
1. Highest priority waterfowl species, populations, and seasons for the PLJV, as designated in the North American Waterfowl Management Plan (2004 Update). 18
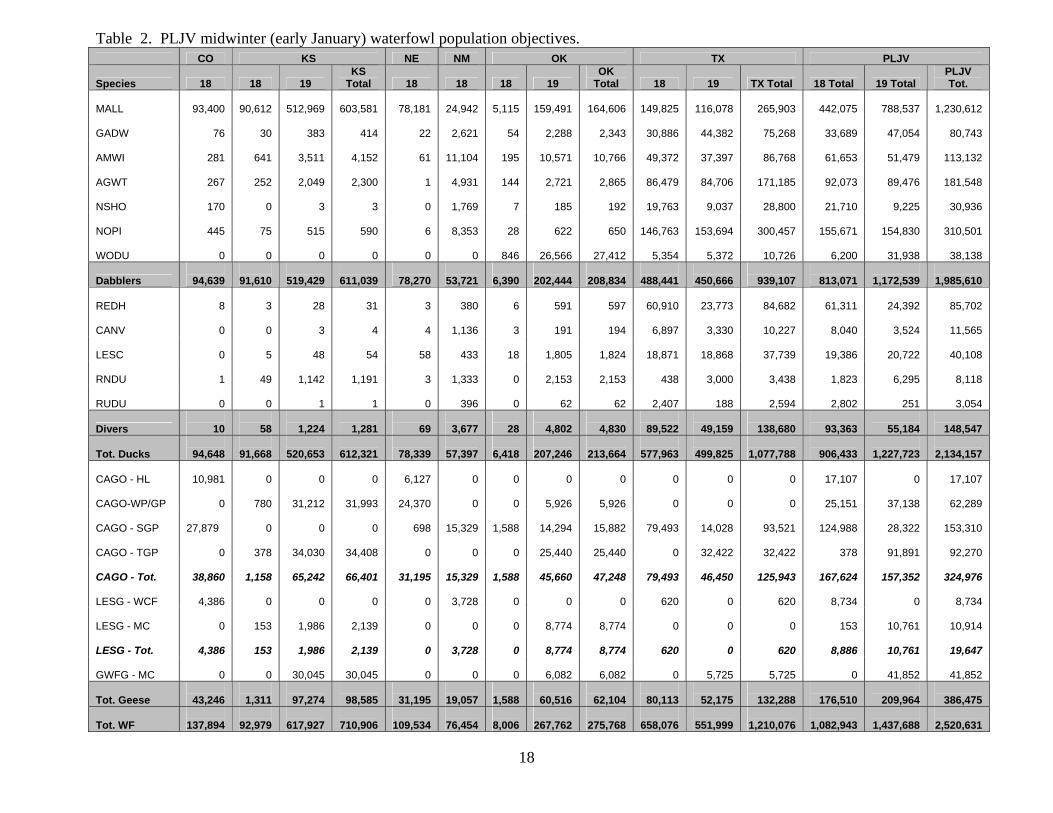
2. PLJV midwinter (early January) waterfowl population objectives. 19
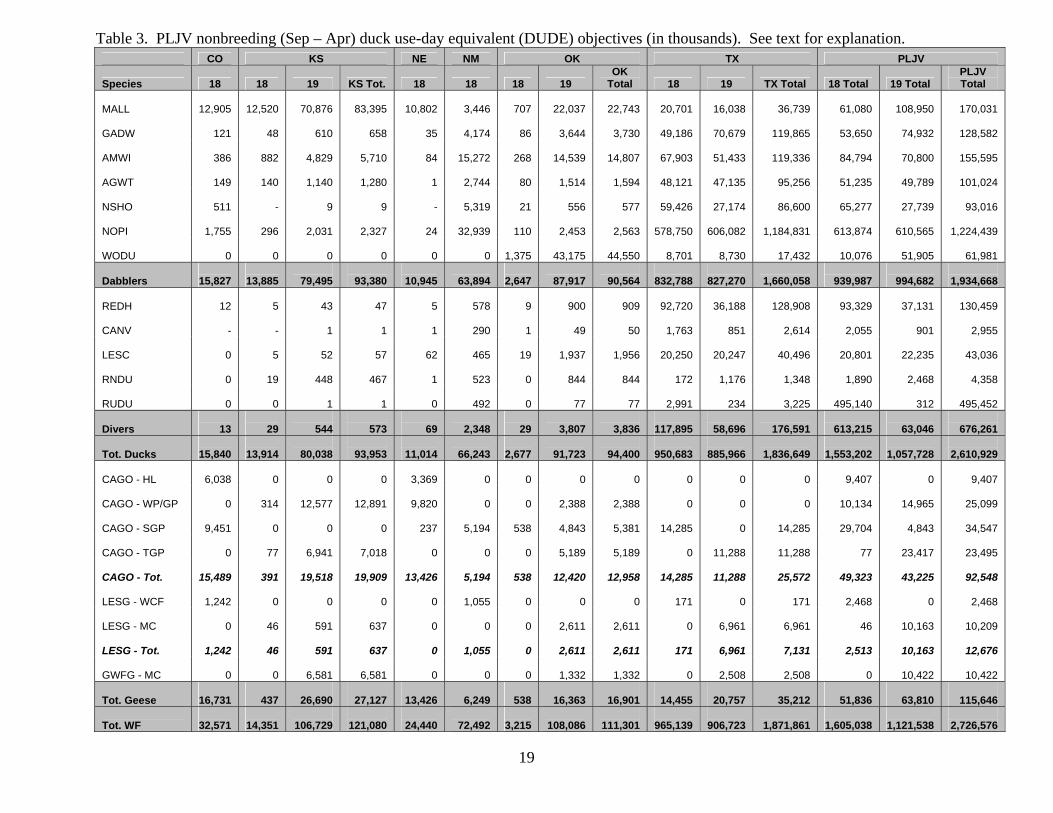
3. PLJV nonbreeding (Sep – Apr) duck use-day equivalent objectives. 20
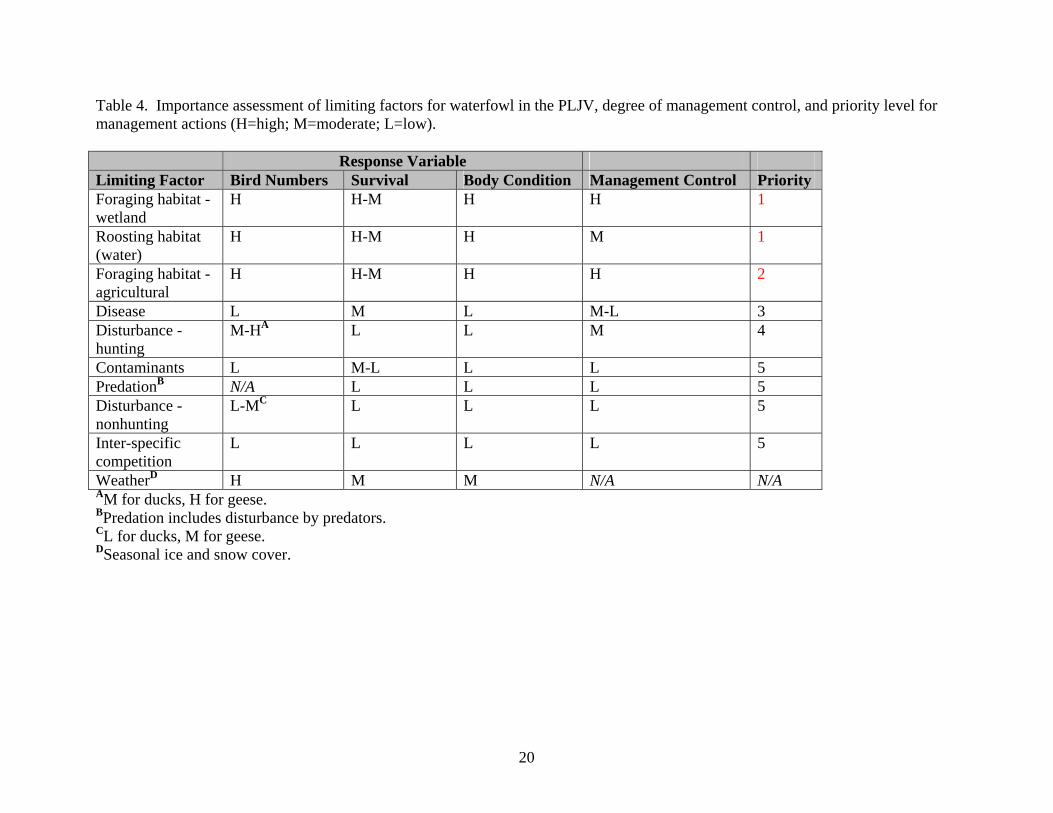
4. Importance assessment of limiting factors for waterfowl in the PLJV, degree of management control, and priority level for management actions. 21
5. Foraging and roosting habitat importance assessment for waterfowl
in the PLJV region. 22
6. Important waterfowl foraging habitats, energetic carrying capacity, threats, and trends. 23
7. Current carrying capacity of PLJV planning areas for waterfowl, habitat shortfalls, and total and annual habitat objectives. 24
4
Background, Purpose, and Intended Audience North American Waterfowl Management Plan The purpose of the North American Waterfowl Management Plan (NAWMP) is to sustain abundant waterfowl populations by conserving landscapes, through partnerships that are guided by sound science (USFWS 2004). Originally signed in 1986, the NAWMP guides waterfowl conservation by developing continental population objectives, identifying geographic regions of North America that contain habitat critical to sustaining waterfowl populations, and forming “Joint Ventures” in these areas to facilitate achieving Plan objectives. Joint Ventures are coalitions of governmental and nongovernmental wildlife conservation agencies and organizations that pool expertise and resources to conserve wetlands and associated habitats important to waterfowl and other birds. The original 1986 NAWMP was updated in 1994, 1998, and 2004 to address changing biological, sociological, and economic conditions influencing waterfowl status cooperative habitat conservation. The theme of the 2004 update is “Strengthening the Biological Foundation” to increase stakeholder confidence in Plan actions (USFWS 2004). Playa Lakes Joint Venture The Playa Lakes Joint Venture (PLJV) was formed in 1989 to implement the NAWMP in the Playa Lakes Region (PLR). The original PLR included northwestern Texas and portions of southeastern Colorado, southwestern Kansas, eastern New Mexico, and western Oklahoma. The PLJV originally developed waterfowl population and habitat objectives in 1994 for its Implementation Plan (PLJV 1994).
Since 1994 the PLJV has expanded geographically to include most of the Short-grass and Mixed-grass Bird Conservation Regions (BCRs) (Fig. 1), and expanded its focus to include all birds (PLJV 2004a). The PLJV updated its Implementation Plan in 2004 (PLJV 2004b); the adaptive approach to planning used by the PLJV requires maintaining up-to-date waterfowl population and habitat objectives. PLJV Waterfowl Team The PLJV Monitoring, Evaluation, and Research Team (MERT) formed a 12-member working group (Waterfowl Team; hereafter referenced as “team”) in 2003 to update and maintain its waterfowl population and habitat objectives. The team is comprised of waterfowl experts from all 6 PLJV states, USFWS Regions 2 and 6, Ducks Unlimited, Inc., and PLJV staff. State and federal members have migratory game bird regulatory and monitoring responsibilities for their respective agencies, and are affiliated with the Central Flyway Technical Committee. Two team members are members of the NAWMP Science Support Team (NSST), and 6 team members also serve on the PLJV’s MERT.
5
Goal, Purpose, and Intended Audience Our goal was to improve the biological foundation for PLJV waterfowl conservation actions by developing waterfowl objectives in a manner consistent with the guidance and needs of the NAWMP and the PLJV. Specifically, we developed (1) regional waterfowl population objectives that are stepped-down from continental objectives in the NAWMP, and (2) regional waterfowl habitat objectives that are linked biologically to continental population objectives. The purpose of this report is to provide detailed documentation of the procedures used to develop these objectives. The intended audience is biologists with technical orientation that are interested in the scientific underpinnings of PLJV waterfowl conservation objectives. This report serves as a technical companion document to the PLJV’s Implementation Plan (PLJV 2004b). The PLJV’s HABS (Hierarchical All Bird System) database stores the biological data used to model the current carrying capacity of the PLJV for waterfowl (see Appendices A-I). Waterfowl habitat objectives developed herein are included in the PLJV’s Area Implementation Plans.
The PLJV in the Context of North American Waterfowl and Wetlands The PLJV region lies entirely within the Central Flyway, and largely corresponds to BCRs 18 (Shortgrass Prairie) and 19 (Mixed-grass Prairie) in the Southern Great Plains region of the continent (Fig. 1). Most waterfowl species common to the Central Flyway use the region (e.g., see Bolen et al. 1989, Ringelman et al. 1989, Smith 2003). Waterfowl in the PLJV use a wide range of natural and man-made wetlands and upland, agricultural habitats for foraging and roosting. Importance of the various habitats is discussed later in this report. Within the PLJV, the NAWMP has identified 2 areas of continental significance to North American waterfowl: the playa lakes in the Texas panhandle and surrounding regions (largely corresponding to the original PLJV boundary), and the central Kansas marshes (USFWS 2004:15). The Cheyenne Bottoms and Quivera wetlands of central Kansas also are designated as wetlands of international importance under the RAMSAR convention. Based on available waterfowl migration chronology data (see below), the PLJV region is important to waterfowl primarily as a migration area, and secondarily as a wintering area (especially for Mallards and Canada Geese). Many waterfowl species also breed in the region, but at low densities compared to primary breeding areas (Ray et al. 2003). Given the importance of the region primarily as a migration and wintering area, our understanding of the annual life cycle needs of waterfowl suggest that the ability to acquire sufficient food to (1) meet daily energy requirements, and (2) gain body mass (i.e., acquire fat reserves) for migration, is of paramount importance for waterfowl in the PLJV (also see Limiting Factors section below).
6
Approach for Developing Habitat Objectives We used a bioenergetics approach to develop nonbreeding waterfowl habitat objectives, explained in detail in the sections below:
1. Determine planning scale (geographic areas). 2. Determine priority species and seasons. 3. Develop population (abundance) objectives:
a) midwinter abundance objectives b) bi-weekly abundance objectives for entire (fall – spring) nonbreeding season
4. Develop vital rate (i.e., population performance) objectives. 5. Determine limiting factors for #3-4. 6. Develop habitat objectives:
a) estimate energetic demands for nonbreeding waterfowl (total use-days & duck use-day equivalents)
b) determine important habitats and energetic carrying capacities per acre (i.e., define relationships between waterfowl abundance/vital rates and habitat characteristics)
c) measure habitats to determine current quantity d) model current landscape carrying capacity for nonbreeding waterfowl and
determine if habitat shortfalls exist e) describe conservation strategy to increase or maintain landscape carrying capacity
for waterfowl 7. Develop criteria for measuring success.
Step 1: Geographic Planning Areas
Geographic planning areas for this strategy are the BCR portions of states (e.g., BCR18-Texas) (n=9; see Fig. 1). Planning and implementation for waterfowl at this scale ensures (1) that the desired distribution of waterfowl and their habitats throughout the states and BCRs within the PLJV is achieved; (2) consistency with NAWMP geographic prioritization regions (i.e., BCRs – see Step 2 below); and (3) consistency with planning boundaries for other bird conservation initiatives.
Step 2: Priority Species and Seasons The 2004 NAWMP update prioritizes waterfowl species for conservation action for each BCR (USFWS 2004). For the PLJV (BCRs 18 and 19), highest priority duck species are Northern Pintails and Mallards, and highest priority goose species are Canada geese (Shortgrass Prairie, Hi-line, and Western Prairie/Great Plains Populations), Snow Geese (Western Central Flyway and Midcontinent Populations), and Greater White-fronted Geese (Midcontinent Population) (Table 1). In the PLJV, these goose populations are of concern due to overabundance, declining populations, or high regional responsibility, whereas duck species are of concern due to declining populations or societal importance (see USFWS 2004).
7
The only NAWMP breeding season priority for the PLJV was Canada Goose (Western Prairie/Great Plains Population). However, this goose population was a priority for the nonbreeding season also. As explained in other sections, we believe the PLJV region is far more important for nonbreeding than for breeding waterfowl, and we focus exclusively on the nonbreeding season for this planning initiative. Although the NAWMP did not indicate swans as a priority, both trumpeter and tundra swans likely are well below historical numbers in the PLJV. Of the 6 PLJV states, only Nebraska consistently hosts swans (nonbreeding trumpeters). We did not include swans in this iteration of PLJV waterfowl conservation planning, but may do so in the future. As described in the sections below, we sought to develop PLJV waterfowl objectives largely consistent with NAWMP guidance for species, population, and seasonal priorities. The bioenergetics approach we used allowed us to determine nonbreeding habitat needs and objectives not only for priority species, but also for non-priority species that obtain food resources from the same habitats.
Step 3: Population Objectives Step 3a - Midwinter abundance objectives Ducks To assist Joint Ventures with waterfowl conservation planning for the nonbreeding season, the NSST developed midwinter (early January) waterfowl population objectives (Koneff undated). For each species, county-level objectives were established by multiplying the average proportion of the total continental midwinter count in each state (1970s midwinter waterfowl survey data), by the average proportion of the statewide harvest occurring in each county (1970s waterfowl harvest survey data). This proportion was multiplied by the continental breeding population objective in the NAWMP, and then divided by 0.85 to account for winter-spring mortality. Counties were aggregated by BCRs and Joint Ventures to facilitate development of regional midwinter objectives. To develop PLJV midwinter objectives, we obtained county-level objectives from the NSST and aggregated them by BCRs and states, conforming to PLJV planning areas. PLJV midwinter duck population objectives for these planning units are shown in Table 2. This approach had limitations, likely due to anomalies in the midwinter survey and/or harvest data. For example, some species are missing (Blue-winged Teal, Common Goldeneye, Bufflehead). However, taken over all species and all planning areas, we believe these objectives are reasonable starting points for developing habitat objectives. The PLJV midwinter duck population objective is 2.1 million birds (Table 2), and is dominated by dabbling ducks, especially Mallards and Northern Pintails. Diving duck objectives represented a small (<10%) portion of total duck objectives (Tables 2, 3).
8
Geese NAWMP objectives for geese are presented by population, as defined in flyway management plans. However, population-specific winter survey and harvest data were not readily available to the NSST, which precluded developing population-specific midwinter goose objectives. Because we had access to population-specific winter survey data for the PLJV states, we did not use NSST midwinter goose objectives, but rather developed an alternative approach that did not rely on harvest data. We believe our approach is consistent with the NSST intent of developing regional objectives that are stepped-down from continental objectives, and better utilizes existing goose population objectives (from Central Flyway goose management plans) and monitoring data. For each goose population, we calculated the average proportion of the total population counted in each PLJV state during winter surveys (10-year averages of the midwinter waterfowl survey and the historical December goose survey). Data used corresponded to the decade in which the flyway management plan was written (generally 1980s or 1990s). This proportion was multiplied by the continental winter objective from the NAWMP, resulting in state-specific objectives for each goose population. State-specific objectives were allocated to BCRs 18 and 19 by the proportion of total state counts from each BCR (estimates provided by state biologists). This allowed us to develop winter objectives for each goose population for each geographic planning area (Table 2). The PLJV midwinter goose population objective is 386,000 birds (Table 2). Goose population objectives generally were lower than for dabbling ducks, but higher than for diving ducks (Tables 2, 3). Step 3b – Biweekly abundance objectives for the entire nonbreeding season Because the PLJV region is important to waterfowl during fall and spring migration, in planning for waterfowl habitat conservation it is important to understand how many waterfowl would be expected during other times of the nonbreeding season relative to the midwinter period. Therefore, in conjunction with midwinter objectives, we used available waterfowl migration chronology data to develop bi-weekly population objectives for September through April. For September through March, we used migration chronology data collected during aerial surveys of public lands and waters in the PLJV region of Kansas during 1973 – 2002. For most species we consider these data to be the best available for the region. For each species, we took the average count for each bi-weekly period, and divided the result by the average count for the midwinter (early January) period. This proportion was multiplied by the midwinter objective to obtain period objectives. Kansas data were not available for April, so for that month we used regional migration chronology data presented in Bellrose (1980). We sought to use the best available local migration chronology data for developing these period objectives. Therefore, for white-fronted geese in the BCR19 portion of Texas, we used migration chronology data from sightings of neck-banded birds presented in Anderson and Haukos (2003).
9
For brevity, bi-weekly population abundance objectives are not presented in this report. These are maintained by the PLJV for each planning area, and are available upon request.
Step 4: Vital Rate Objectives To address the question of how should waterfowl populations “perform” or “be influenced” while in the PLJV, we believe waterfowl abundance objectives should be complemented by vital rate objectives (survival, body condition, etc.). For example, it would not be prudent for managers to attract large numbers of birds to the PLJV region if survival rates are below levels needed to sustain continental population objectives. Ideally, regional vital rate objectives for nonbreeding waterfowl in the PLJV would be developed as part of broader, continental strategies, but no such strategy currently exists for any species under the NAWMP. Therefore, we elected to defer developing survival rate objectives. A body condition objective “to maintain body condition of waterfowl while in the PLJV” is established as part of the bioenergetics approach to developing habitat objectives (see Section 6 below).
Step 5: Limiting Factors Given the population abundance objectives described above, and our desire to develop meaningful vital rate objectives, we considered a range of factors thought to influence the abundance, survival, and body condition of nonbreeding waterfowl in the PLJV. Each factor was ranked according to perceived importance, and to the potential for management control (Table 4). These results, based on the expert opinion of the team, suggest that habitat (both for foraging and roosting) is the major factor limiting waterfowl abundance and vital rates in the PLJV. Team members felt there was a large gap in importance between the top 2 limiting factors (foraging and roosting habitat), and the third-ranked factor (disease; Table 4). We note that limiting factors previously considered of high importance by the PLJV, such as disease and contaminants (PLJV 1994), now are considered of lower importance. In large part this is thanks to research (e.g., Samuel et al. 2004) and management actions undertaken by PLJV partners. Waterfowl studies from the Texas PLR support the team’s conclusions. Waterfowl abundance (TPW unpubl. data) and Northern Pintail survival and body condition (Moon 2004) are higher during winters with more flooded playas. Guthery et al. 1984 demonstrated that the amount water on the landscape was the primary determinant of duck abundance.
Step 6: Habitat Objectives
Given our understanding of the importance of food energy to nonbreeding waterfowl, and our opinion that foraging habitat is a primary factor limiting waterfowl abundance, survival, and
10
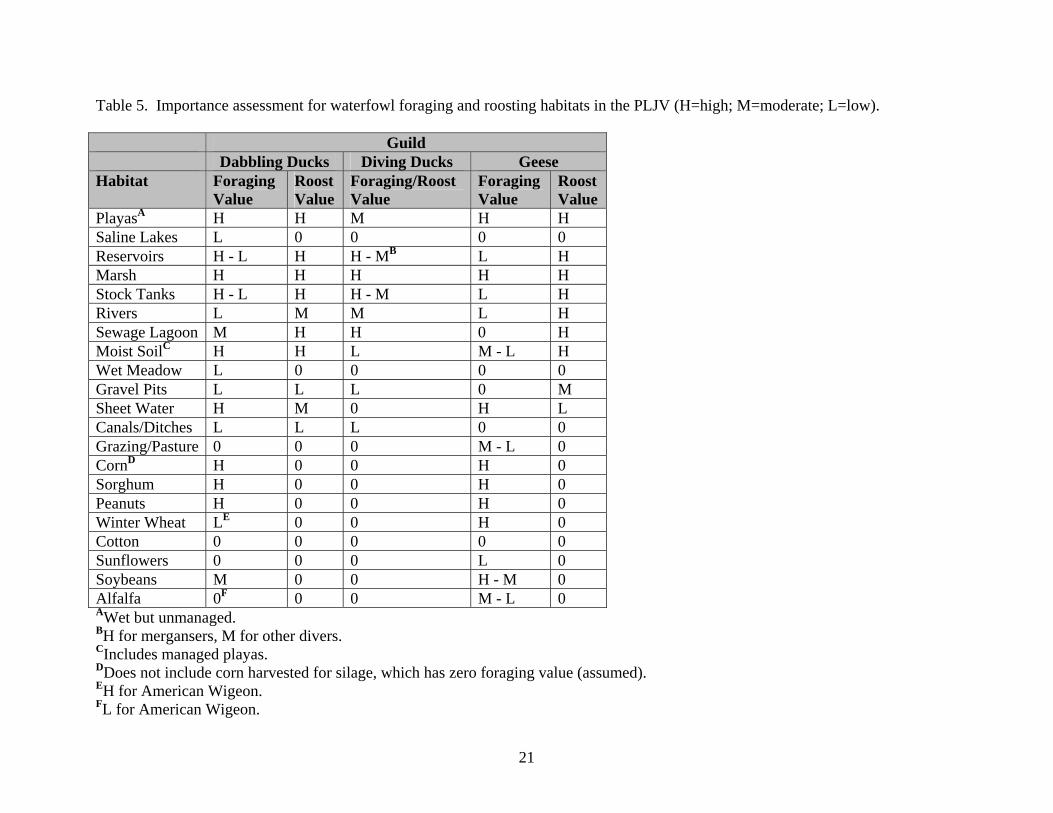
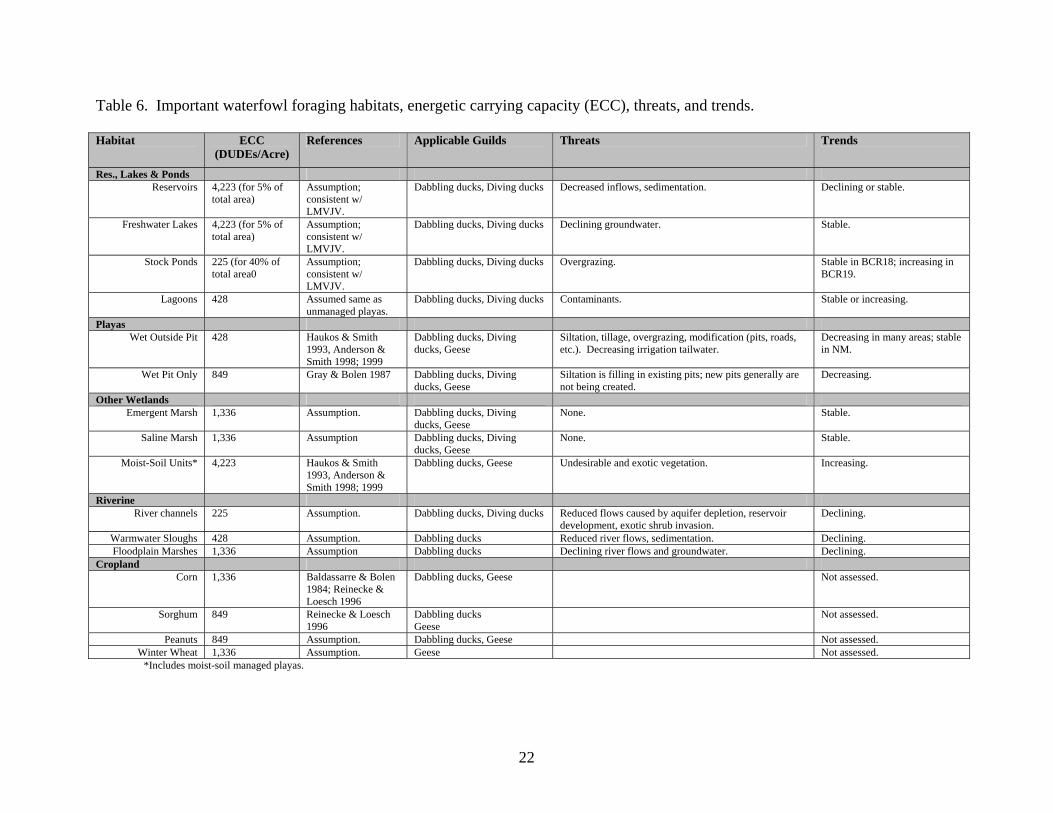
body condition in the PLJV, we used a bioenergetics approach to developing waterfowl habitat objectives. Step 6a - Estimate energetic demands for nonbreeding waterfowl (use-days & duck use-day equivalents) To estimate energetic demands of nonbreeding waterfowl in the PLJV, we first developed use-day objectives for each species and biweekly period. Period population objectives were simply multiplied by the number of days in the period. Next, because energetic carrying capacity (ECC) of waterfowl habitats often is expressed in units of energy sufficient to meet daily energy requirements of a Mallard-sized duck during winter (292 kcal/day; Prince 1979), we adjusted period use-days for each species based on the body size of the species relative to Mallards. Body mass of each species was divided by the body mass of Mallards (adult male data from Bellrose 1980). This factor was multiplied by the period use-day objective for each species to obtain “Duck Use-Day Equivalents” (DUDEs). E. g., American Green-winged Teal are 0.25 times as large as Mallards, so 100 American Green-winged Teal use-days become 25 DUDEs for bioenergetics planning. DUDEs were summed over all periods to give total nonbreeding (September – April) DUDE objectives (Table 3). For brevity, biweekly use-day objectives are not presented in this report. These are maintained by the PLJV for each planning area, and are available upon request. Step 6b - Determine important habitats and energetic carrying capacities per acre (i.e., define relationships between waterfowl abundance/vital rates and habitat characteristics) We listed habitats believed to be important for foraging and/or roosting waterfowl in the PLJV. We associated these habitats with applicable waterfowl guilds (dabbling ducks, diving ducks, and geese), and categorized them by importance based on the expert opinion of the team (Table 5). This exercise reinforced the importance of upland, agricultural habitats to foraging waterfowl in the PLJV in addition to wetlands, as demonstrated by several previous studies (e.g., Baldassarre and Bolen 1984). It also raised questions about the importance of juxtaposition of foraging and roosting habitats (see Guthery et al. 1984, Moon 2004). We selected a subset of these habitats for modeling the ECC of each planning area (Table 6). Selection criteria included foraging habitats of high or moderate importance to ducks and geese (Table 5). Only major habitats prevalent in large portions of the PLJV were considered. Minor habitats, or those of local importance, were not considered. In Table 6 we present the ECC of each habitat, and cite our sources of information. ECC is expressed as DUDEs/acre, and is based on (1) the energy requirement of a Mallard-sized duck for maintaining body condition during winter (292 kcal/day; Prince 1979), (2) the mass of seeds, leafy plant material, and invertebrates available for foraging birds in the habitat (as measured from field studies), and (3) the energy content of those foods (as measured from laboratory
11
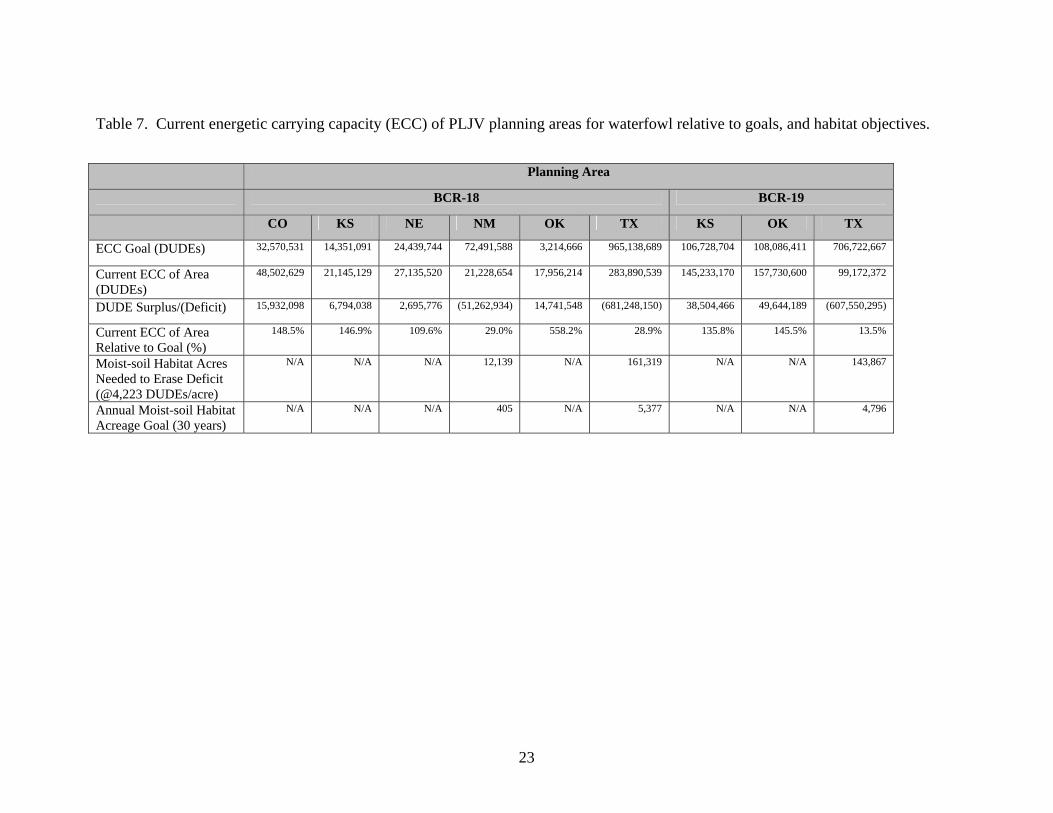
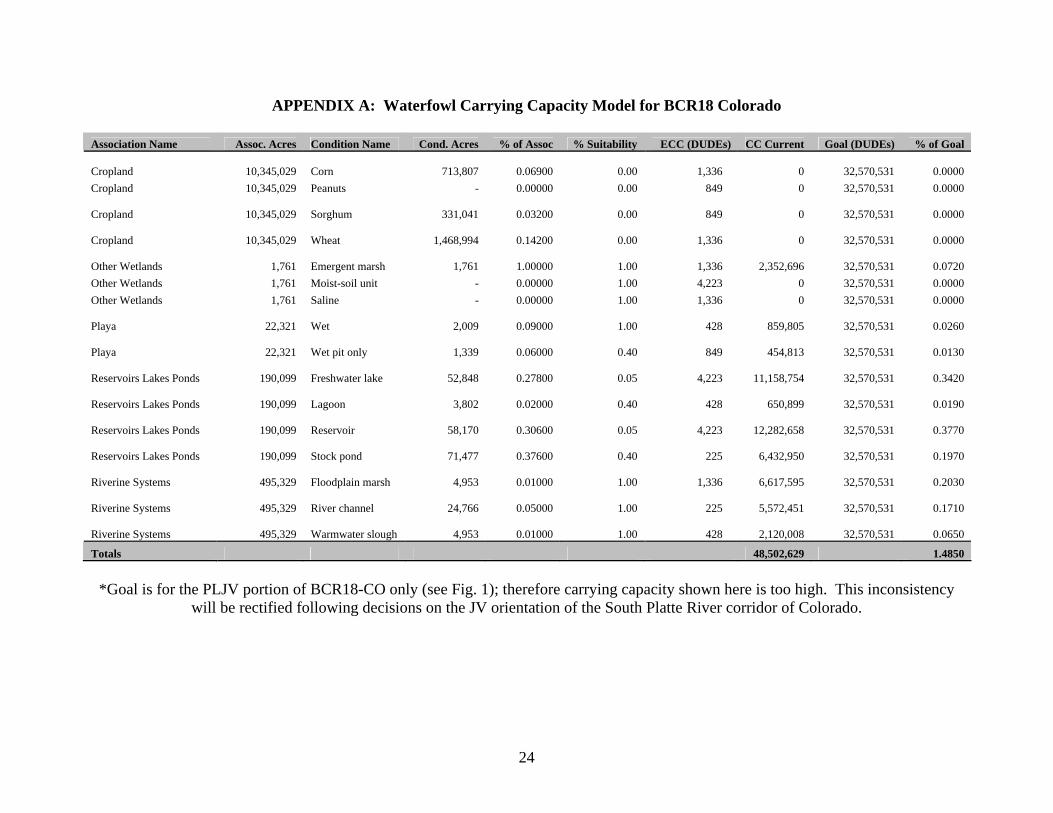
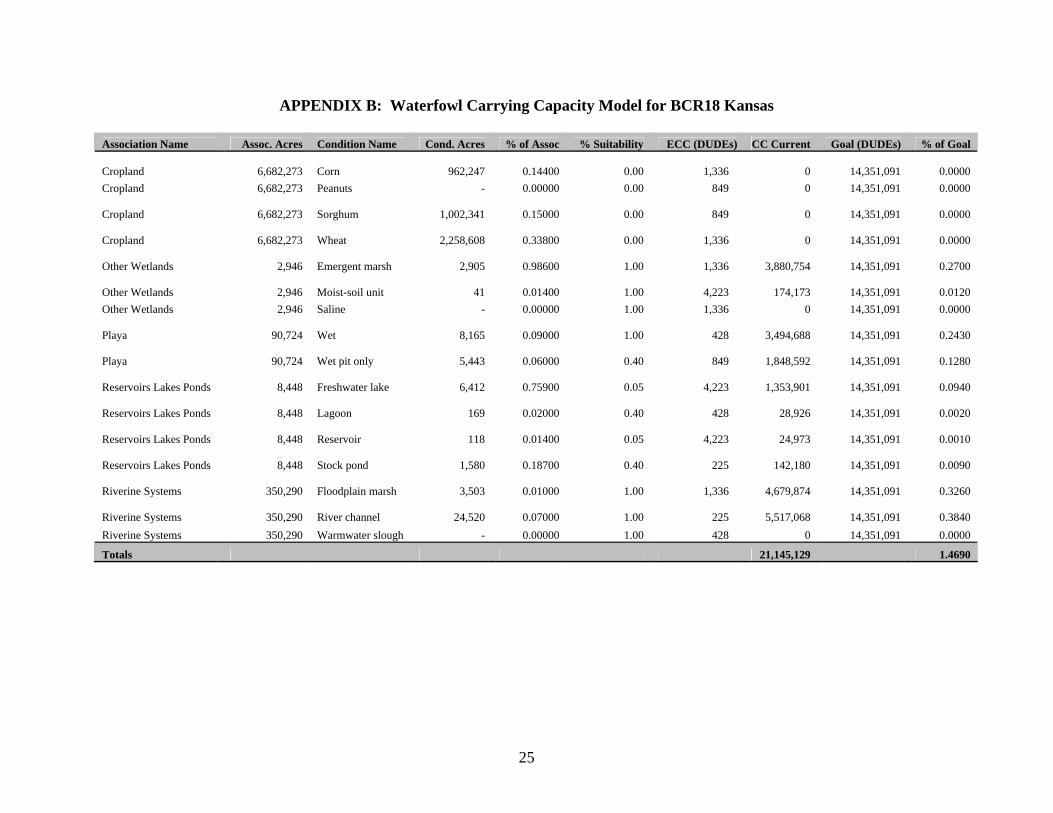
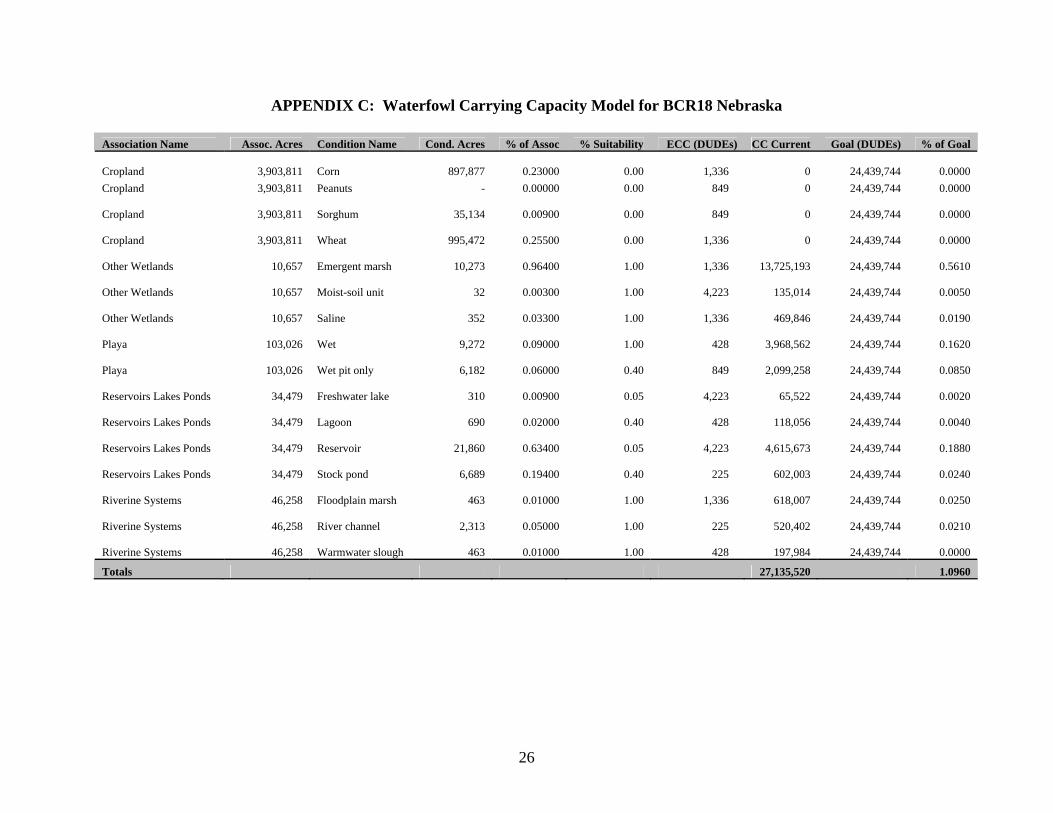
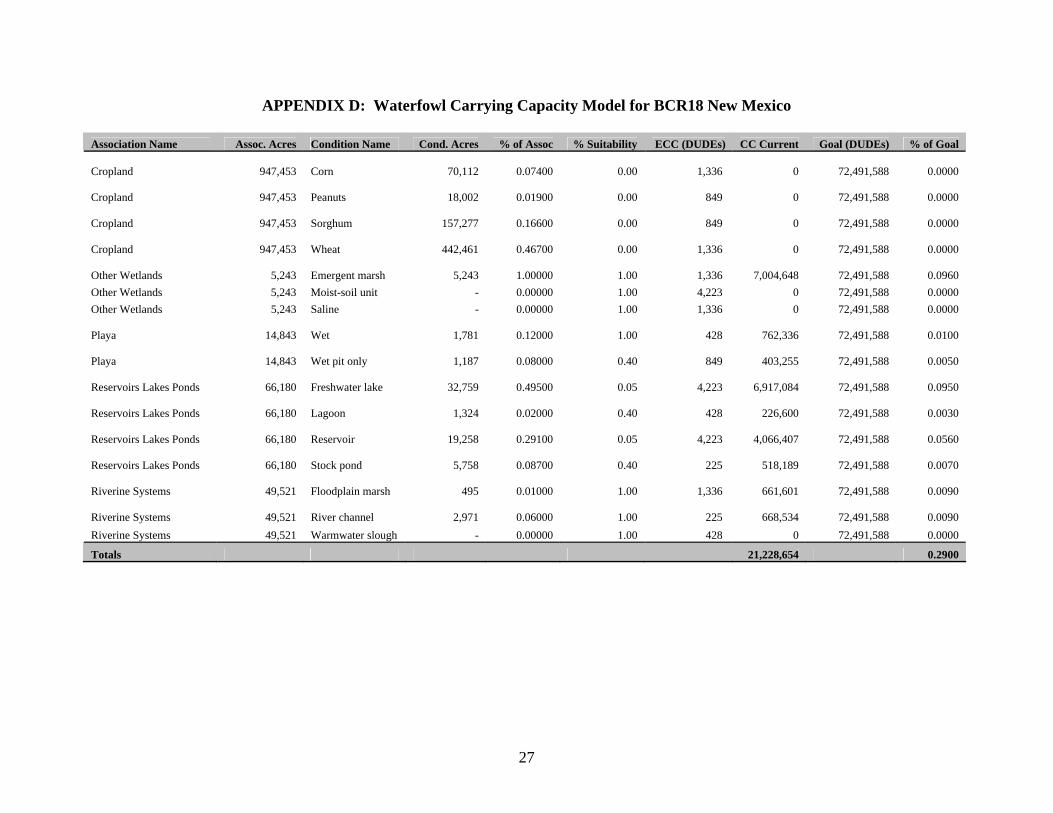
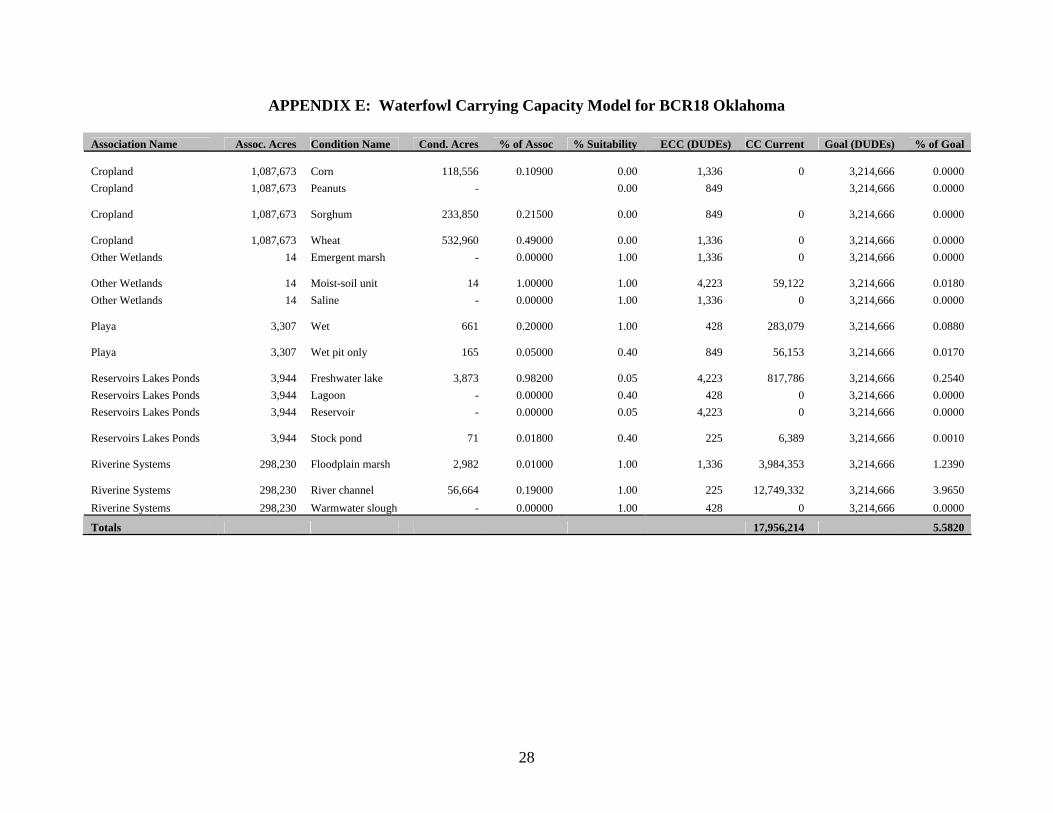
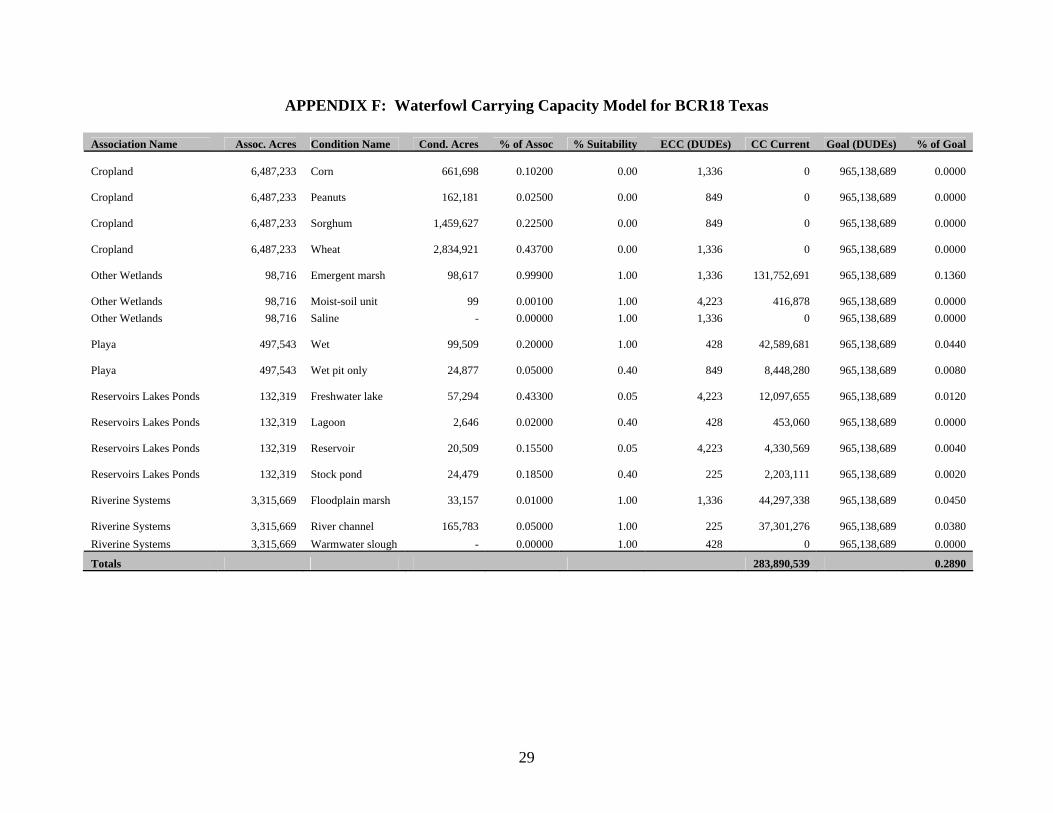
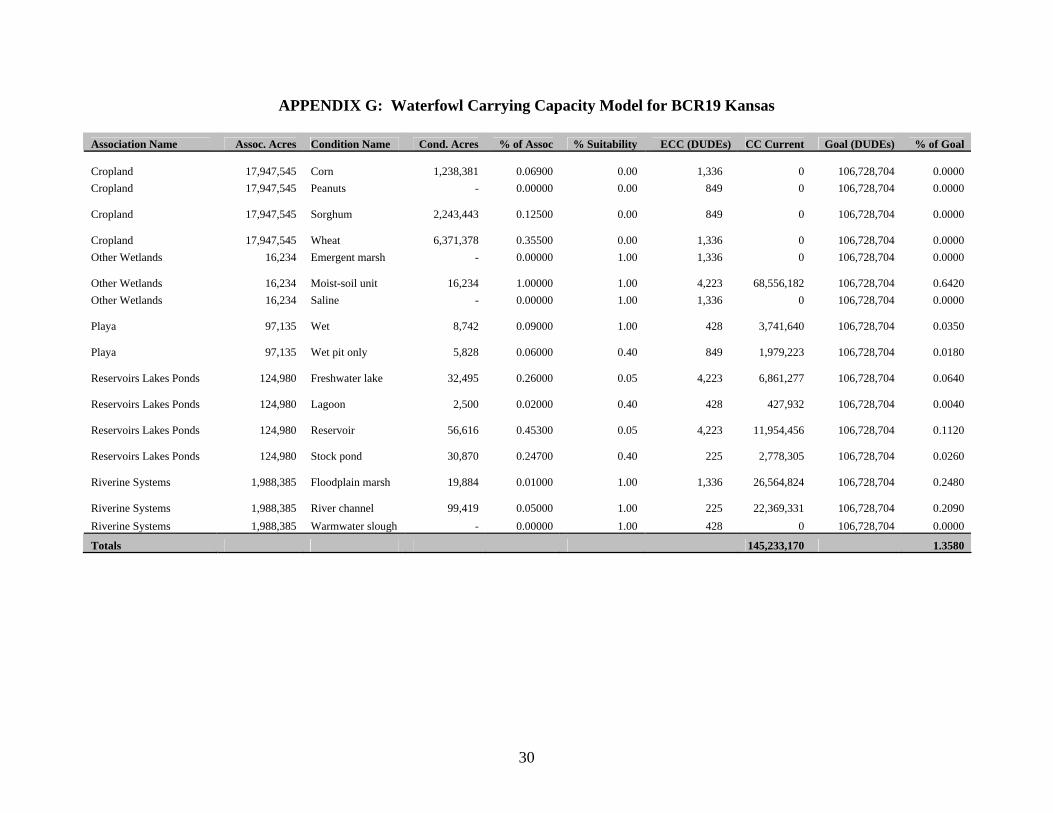
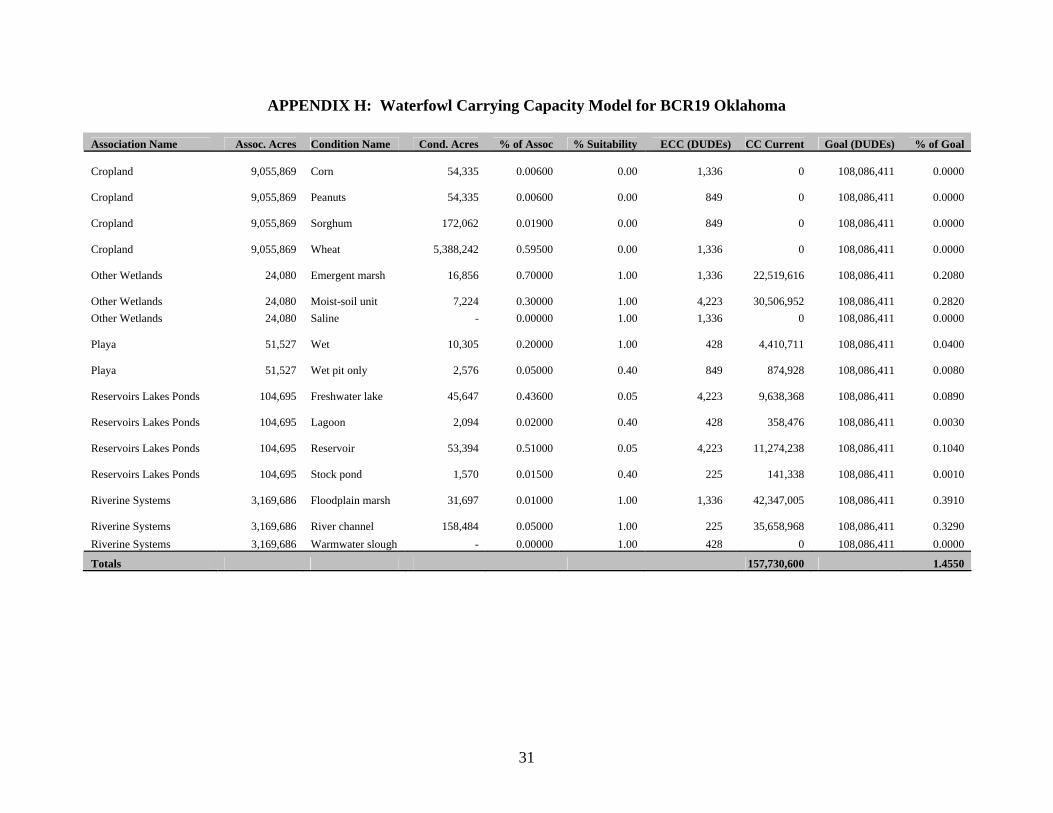
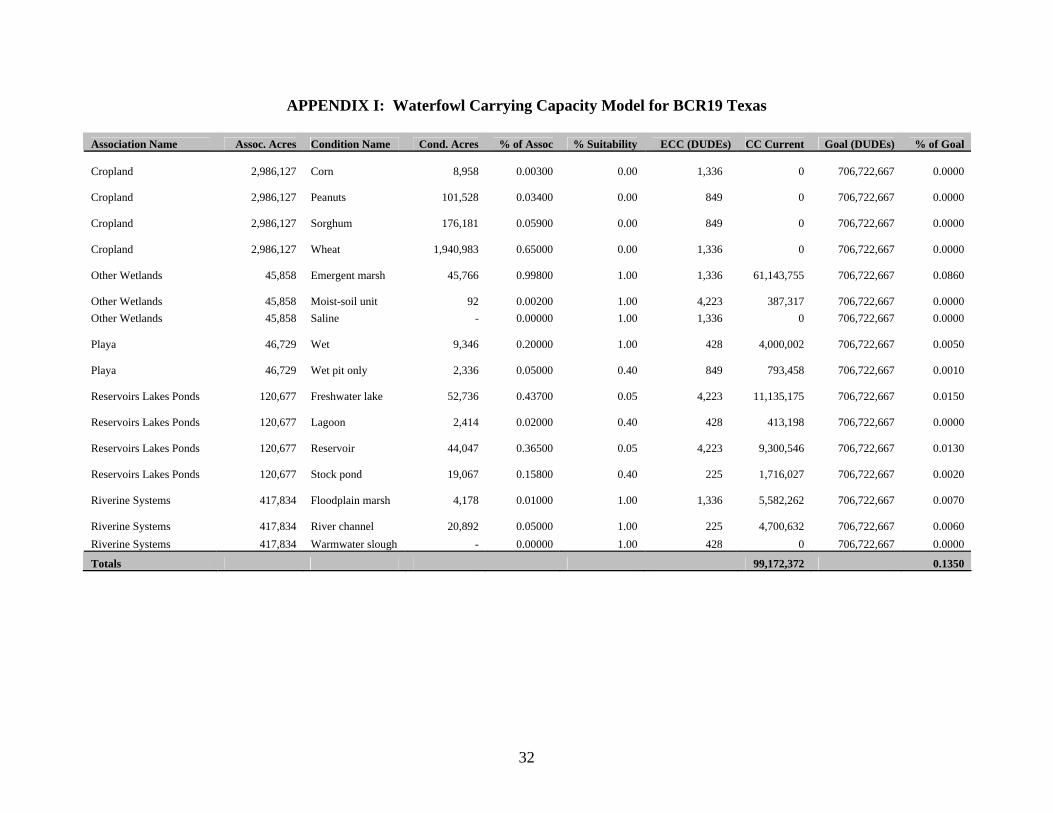
studies). ECC studies for some habitats are lacking, especially habitats containing important leafy plant material (e.g., pondweeds, winter wheat), so we made assumptions on ECC for some habitats. We also present threats and trends of these habitats, again based on the expert opinion of the team (Table 6). Step 6c - Measure habitats to determine current quantity Using available spatial data, agricultural statistics, and assumptions, we estimated the acreage of important waterfowl foraging habitats (described in Table 6) in each planning area. Habitat assessment procedures are described in detail in a companion technical document (PLJV 2004c). For some deepwater habitats (e.g., reservoirs, freshwater lakes, stock ponds, lagoons) we made assumptions on the proportion of the total habitat acreage that would be suitable depth for waterfowl foraging (see Table 6 and Appendices A-I). Mapping techniques used for playas (see PLJV 2004c) delineated acreage for the entire basins or “hydric footprints”, so we made assumptions the percentage of this acreage that would be available (wet), both within pits only and outside pits (littoral acreage), under average environmental conditions (average precipitation; see Appendices A-I). For all other habitats we assumed the acreage measured represented average environmental conditions, and would be fully available to foraging waterfowl. For example, we assumed National Wetlands Inventory maps for emergent marsh represent acreage during years of average precipitation and not abnormally dry or wet conditions. Step 6d - Model current landscape carrying capacity for nonbreeding waterfowl and determine if habitat shortfalls exist For this step we multiplied the acreage of each foraging habitat (adjusted for suitability and availability as described above) by the ECC per acre of the habitat, and summed over all habitats in a planning area. This figure was divided by the total energetic demands for waterfowl (total DUDEs) in the area to portray current “percent of goal” for carrying capacity. This can be interpreted as the amount of food energy available in the area, compared to the amount needed to support NAWMP population objectives. This analysis suggested that sufficient food resources are available to support NAWMP population objectives in 6 of the 9 planning areas. Apparently, food resources are substantially deficient in the southern portion of the PLJV (BCR18-NM, BCR18-TX, and BCR19-TX), where only approximately 15-30% of waterfowl energy demands could be supported. Food resources apparently are sufficient in the remainder of the PLJV; most areas in Colorado, Kansas, Nebraska, and Oklahoma can support approximately 110-150% of energy demands. The BCR18 portion of Oklahoma is the exception, where 558% of energy demands can be supported. For the 3 planning areas in New Mexico and Texas where foraging habitat was insufficient, we calculated food energy shortfall (expressed as DUDEs). Details of this analysis for each planning area are presented in Appendices A-I and summarized in Table 7.
12
Step 6e - Describe conservation strategy to increase or maintain landscape carrying capacity for waterfowl We recommend moist-soil management of wetlands (playas where possible) to alleviate foraging habitat shortfalls in New Mexico and Texas. Playa acreage in BCR19-Texas is insufficient to meet needs for additional managed habitat, so management of other wetland types will be needed. We justify this strategy as follows:
1. Moist-soil managed wetlands (including playas) can support more foraging use-days per acre than any other foraging habitat (Table 6), so emphasis on moist-soil management minimizes the number of wetland acres under management.
2. Moist-soil management of playas does not require expensive water control structures. 3. Due to the prevalence of groundwater pumping for cropland irrigation in the region,
many groundwater wells are located near playas and other wetlands. 4. Moist-soil managed wetlands will provide stable, predictable foraging habitat in most
years, which is desirable in the PLJV where wetlands often are unpredictable and ephemeral.
This strategy is consistent with recommendations of researchers who have advocated moist-soil management of wetlands for nonbreeding waterfowl in the PLJV (e.g., Anderson and Smith 1998, 1999; Moon 2004). Further, we recommend a 30-year implementation horizon for alleviating the foraging habitat deficits in New Mexico and Texas. Annual acreage objectives for new moist-soil habitat are provided in Table 7. For other planning areas in Colorado, Kansas, Nebraska, and Oklahoma where sufficient foraging habitat currently exists, we emphasize that habitat surpluses are not large (10-50% above objectives) and that we believe several important habitats are declining (Table 5). In these areas, conservation actions directed at long-term protection, restoration, and enhancement of important foraging habitats are strongly encouraged.
Step 7: Measuring Success
<to be completed>……But here is a thought: “When habitat in all PLJV planning areas is not limiting waterfowl from reaching NAWMP objective levels, and is not expected to be limiting in the future, because PLJV conservation actions are sufficient to offset any negative trends in important habitats.”
Monitoring and Evaluation
<to be completed> Appendix J – Assumptions? Appendix K – Research Priorities?
13
Updating the Conservation Strategy
This report represents the PLJV’s first attempt to step down waterfowl population objectives from continental objectives in the NAWMP, and its first attempt to incorporate habitat objectives that are linked biologically to population objectives. Numerous information gaps and uncertainties arose during this planning process, which required us to make assumptions and subjective decisions in developing waterfowl conservation objectives. Some of these information gaps likely will be addressed in future research (see previous sections), which will allow future improvements in PLJV waterfowl conservation planning. Also, further critical thinking and discussion about habitat conservation strategies will create a desire to revise these objectives. The PLJV’s biological planning is an ongoing initiative (see PLJV 2004a, b). Waterfowl conservation objectives should be updated and revised as new information becomes available, and as desired by partners. Finally, we encourage critical review of these objectives, and welcome suggestions for improving them. Please send comments to: Brian Sullivan, Biological Team Leader Tel. 303-926-0777 Playa Lakes Joint Venture [email protected] 103 E. Simpson St. Lafayette, CO 80026
Afterword Waterfowl population and habitat objectives in this report are intended to guide the PLJV in implementing the NAWMP. Achieving these objectives within the next 30 years will be a major undertaking, requiring greater commitments of human and fiscal resources in the future than has occurred in the past. We hope and expect that by adopting these objectives, PLJV partners are inspired to redouble their efforts towards waterfowl and wetlands conservation and management.
Acknowledgments
We thank Mark Koneff and Kammie Kruse (USFWS) for providing data to develop duck and goose population objectives, respectively. We also thank the professors at Texas Tech University, namely Eric Bolen, Fred Guthery, and Loren Smith (and their numerous students and associates), for their research and publications which enabled informed waterfowl conservation planning in the PLJV.
Literature Cited Anderson, J. T., and L. M. Smith. 1998. Protein and energy production in playas: implications
for migratory bird management. Wetlands 18(3):437-446.
14
Anderson, J. T., and L. M. Smith. 1999. Carrying capacity and diel use of managed playa wetlands by nonbreeding waterbirds. Wildl. Soc. Bull. 27(2):281-291.
Anderson, J. T., and D. H. Haukos. 2003. Breeding-ground affiliation and movements of
greater white-fronted geese staging in northwestern Texas. Southwest. Nat. 48(3):365-372.
Baldassarre, G. A., and E. G. Bolen. 1984. Field-feeding ecology of waterfowl wintering on the
southern high plains of Texas. J. Wildl. Manage. 48(1):63-71. Bolen, E. G., G. A. Baldassarre, and F. S. Guthery. 1989. Playa lakes. Pages 341-365 in L. M.
Smith, R. L. Pederson, and R. M. Kaminski, eds. Habitat management for migrating and wintering waterfowl in North America. Texas Tech University Press. 560pp.
Bellrose, F. C. 1980. Ducks, geese, and swans of North America. Gray, P. N., and E. G. Bolen. 1987. Seed reserves in the tailwater pits of playa lakes in relation
to waterfowl management. Wetlands 7:11-23. Guthery, F. S., S. M. Obenberger, and F. A. Stormer. 1984. Predictors of site use by ducks on
the Texas high plains. Wildl. Soc. Bull. 12:35-40. Haukos, D. A., and L. M. Smith. 1993. Moist-soil management of playa lakes for migrating and
wintering ducks. Wildl. Soc. Bull. 21:288-298. Koneff, M. Undated. Derivation of regional waterfowl population objectives from NAWMP
continental population objectives. USFWS unpublished report. Moon, J. A. 2004. Survival, movements, and habitat use of female Northern Pintails in the
Playa Lakes Region. M. S. thesis, Texas Tech Univ. 194pp. PLJV. 1994. Final Implementation Plan. 28pp. PLJV. 2004a. Master Plan, v. 2.0. 29pp. PLJV. 2004b. PLJV Implementation Planning Guide, v. 1.0. 38pp. PLJV 2004c. Habitat Assessment Procedures, v. 1.0. 17pp. Prince, H. H. 1979. Bioenergetics of postbreeding dabbling ducks. Pages 103-117 in T. A.
Bookout, editor. Waterfowl and wetlands – an integrated review. North Central Section of The Wildlife Society, Madison, Wisconsin.
Ray, J. D., B. D. Sullivan, and H. W. Miller. 2003. Breeding ducks and their habitats in the
High Plains of Texas. Southwest. Nat. 48:241-248.
15
Reinecke, K. J., and C. R. Loesch. 1996. Integrating research and management to conserve wildfowl (Anatidae) and wetlands in the Mississippi Alluvial Valley, U.S.A. Gibier Faune Sauvage, Game Wildl. 13:927-940.
Ringelman, J. K, W. R. Eddleman, and H. W. Miller. 1989. High plains reservoirs and sloughs.
Pages 311-340 in L. M. Smith, R. L. Pederson, and R. M. Kaminski, eds. Habitat management for migrating and wintering waterfowl in North America. Texas Tech University Press. 560pp.
Samuel, M. D., W. P. Johnson, D. J. Shadduck, and D. R. Goldberg. 2004. The role of snow
geese as carriers of avian cholera in the Playa Lakes Region. USGS unpubl. rept., 47pp. Smith, L. M. 2003. Playas of the Great Plains. University of Texas Press, Austin. 257pp. USFWS. 2004. North American Waterfowl Management Plan: Strengthening the Biological
Foundation. Strategic Guidance and Implementation Framework documents.
16
Figure 1. PLJV Administrative Boundaries.
17
Table 1. Highest priority waterfowl species, populations, and seasons for the PLJV, as designated in the North American Waterfowl Management Plan (2004 Update).
Species/Population Season BCR* 18 BCR* 19 Northern Pintail Nonbreeding X X Mallard Nonbreeding X X Canada Goose - Shortgrass Prairie Population Nonbreeding X Canada Goose – Hi-line Population Nonbreeding X Canada Goose – W. Prairie/Great Plains Population Breeding X Canada Goose – W. Prairie/Great Plains Population Nonbreeding X Snow Goose – Midcontinent Population Nonbreeding X Snow Goose – Western Central Flyway Population Nonbreeding X Greater White-fronted Goose – Midcontinent Population Nonbreeding X *Bird Conservation Region.
18
Table 2. PLJV midwinter (early January) waterfowl population objectives. CO KS NE NM OK TX PLJV
Species 18 18 19 KS
Total 18 18 18 19 OK
Total 18 19 TX Total 18 Total 19 Total PLJV Tot.
MALL
93,400
90,612
512,969
603,581
78,181
24,942
5,115
159,491
164,606
149,825
116,078
265,903
442,075
788,537
1,230,612
GADW
76
30
383
414
22
2,621
54
2,288
2,343
30,886
44,382
75,268
33,689
47,054
80,743
AMWI
281
641
3,511
4,152
61
11,104
195
10,571
10,766
49,372
37,397
86,768
61,653
51,479
113,132
AGWT
267
252
2,049
2,300
1
4,931
144
2,721
2,865
86,479
84,706
171,185
92,073
89,476
181,548
NSHO
170
0
3
3
0
1,769
7
185
192
19,763
9,037
28,800
21,710
9,225
30,936
NOPI
445
75
515
590
6
8,353
28
622
650
146,763
153,694
300,457
155,671
154,830
310,501
WODU 0 0 0 0 0 0
846
26,566
27,412
5,354
5,372
10,726
6,200
31,938
38,138
Dabblers
94,639
91,610
519,429
611,039
78,270
53,721
6,390
202,444
208,834
488,441
450,666
939,107
813,071
1,172,539
1,985,610
REDH
8
3
28
31
3
380
6
591
597
60,910
23,773
84,682
61,311
24,392
85,702
CANV
0
0
3
4
4
1,136
3
191
194
6,897
3,330
10,227
8,040
3,524
11,565
LESC 0
5
48
54
58
433
18
1,805
1,824
18,871
18,868
37,739
19,386
20,722
40,108
RNDU
1
49
1,142
1,191
3
1,333 0
2,153
2,153
438
3,000
3,438
1,823
6,295
8,118
RUDU 0 0
1
1 0
396 0
62
62
2,407
188
2,594
2,802
251
3,054
Divers
10
58
1,224
1,281
69
3,677
28
4,802
4,830
89,522
49,159
138,680
93,363
55,184
148,547
Tot. Ducks
94,648
91,668
520,653
612,321
78,339
57,397
6,418
207,246
213,664
577,963
499,825
1,077,788
906,433
1,227,723
2,134,157
CAGO - HL
10,981 0 0 0
6,127 0 0 0 0 0 0 0
17,107 0
17,107
CAGO-WP/GP 0
780
31,212
31,993
24,370 0 0
5,926
5,926 0 0 0
25,151
37,138
62,289
CAGO - SGP 27,879 0 0 0
698
15,329
1,588
14,294
15,882
79,493 14,028
93,521
124,988
28,322
153,310
CAGO - TGP 0
378
34,030
34,408 0 0 0
25,440
25,440 0 32,422
32,422
378
91,891
92,270
CAGO - Tot.
38,860
1,158
65,242
66,401
31,195
15,329
1,588
45,660
47,248
79,493
46,450
125,943
167,624
157,352
324,976
LESG - WCF
4,386 0 0 0 0
3,728 0 0 0
620 0
620
8,734 0
8,734
LESG - MC 0
153
1,986
2,139 0 0 0
8,774
8,774 0 0 0
153
10,761
10,914
LESG - Tot.
4,386
153
1,986
2,139 0
3,728 0
8,774
8,774
620 0
620
8,886
10,761
19,647
GWFG - MC 0 0
30,045
30,045 0 0 0
6,082
6,082 0 5,725
5,725 0
41,852
41,852
Tot. Geese
43,246
1,311
97,274
98,585
31,195
19,057
1,588
60,516
62,104
80,113
52,175
132,288
176,510
209,964
386,475
Tot. WF
137,894
92,979
617,927
710,906
109,534
76,454
8,006
267,762
275,768
658,076
551,999
1,210,076
1,082,943
1,437,688
2,520,631
19
Table 3. PLJV nonbreeding (Sep – Apr) duck use-day equivalent (DUDE) objectives (in thousands). See text for explanation. CO KS NE NM OK TX PLJV
Species 18 18 19 KS Tot. 18 18 18 19 OK
Total 18 19 TX Total 18 Total 19 Total PLJV Total
MALL
12,905
12,520
70,876
83,395
10,802
3,446
707
22,037
22,743
20,701
16,038
36,739
61,080
108,950
170,031
GADW
121
48
610
658
35
4,174
86
3,644
3,730
49,186
70,679
119,865
53,650
74,932
128,582
AMWI
386
882
4,829
5,710
84
15,272
268
14,539
14,807
67,903
51,433
119,336
84,794
70,800
155,595
AGWT
149
140
1,140
1,280
1
2,744
80
1,514
1,594
48,121
47,135
95,256
51,235
49,789
101,024
NSHO
511
-
9
9 -
5,319
21
556
577
59,426
27,174
86,600
65,277
27,739
93,016
NOPI
1,755
296
2,031
2,327
24
32,939
110
2,453
2,563
578,750
606,082
1,184,831
613,874
610,565
1,224,439
WODU 0 0 0 0 0 0
1,375
43,175
44,550
8,701
8,730
17,432
10,076
51,905
61,981
Dabblers
15,827
13,885
79,495
93,380
10,945
63,894
2,647
87,917
90,564
832,788
827,270
1,660,058
939,987
994,682
1,934,668
REDH
12
5
43
47
5
578
9
900
909
92,720
36,188
128,908
93,329
37,131
130,459
CANV
-
-
1
1
1
290
1
49
50
1,763
851
2,614
2,055
901
2,955
LESC 0
5
52
57
62
465
19
1,937
1,956
20,250
20,247
40,496
20,801
22,235
43,036
RNDU
0
19
448
467
1
523 0
844
844
172
1,176
1,348
1,890
2,468
4,358
RUDU 0 0
1
1 0
492 0
77
77
2,991
234
3,225
495,140
312
495,452
Divers
13
29
544
573
69
2,348
29
3,807
3,836
117,895
58,696
176,591
613,215
63,046
676,261
Tot. Ducks
15,840
13,914
80,038
93,953
11,014
66,243
2,677
91,723
94,400
950,683
885,966
1,836,649
1,553,202
1,057,728
2,610,929
CAGO - HL
6,038 0 0 0
3,369 0 0 0 0 0 0 0
9,407 0
9,407
CAGO - WP/GP 0
314
12,577
12,891
9,820 0 0
2,388
2,388 0 0 0
10,134
14,965
25,099
CAGO - SGP
9,451 0 0 0
237
5,194
538
4,843
5,381
14,285 0
14,285
29,704
4,843
34,547
CAGO - TGP 0
77
6,941
7,018 0 0 0
5,189
5,189 0
11,288
11,288
77
23,417
23,495
CAGO - Tot.
15,489
391
19,518
19,909
13,426
5,194
538
12,420
12,958
14,285
11,288
25,572
49,323
43,225
92,548
LESG - WCF
1,242 0 0 0 0
1,055 0 0 0
171 0
171
2,468 0
2,468
LESG - MC 0
46
591
637 0 0 0
2,611
2,611 0
6,961
6,961
46
10,163
10,209
LESG - Tot.
1,242
46
591
637 0
1,055 0
2,611
2,611
171
6,961
7,131
2,513
10,163
12,676
GWFG - MC 0 0
6,581
6,581 0 0 0
1,332
1,332 0
2,508
2,508 0
10,422
10,422
Tot. Geese
16,731
437
26,690
27,127
13,426
6,249
538
16,363
16,901
14,455
20,757
35,212
51,836
63,810
115,646
Tot. WF
32,571
14,351
106,729
121,080
24,440
72,492
3,215
108,086
111,301
965,139
906,723
1,871,861
1,605,038
1,121,538
2,726,576
20
Table 4. Importance assessment of limiting factors for waterfowl in the PLJV, degree of management control, and priority level for management actions (H=high; M=moderate; L=low). Response Variable Limiting Factor Bird Numbers Survival Body Condition Management Control Priority Foraging habitat - wetland
H H-M H H 1
Roosting habitat (water)
H H-M H M 1
Foraging habitat - agricultural
H H-M H H 2
Disease L M L M-L 3 Disturbance - hunting
M-HA L L M 4
Contaminants L M-L L L 5 PredationB N/A L L L 5 Disturbance - nonhunting
L-MC L L L 5
Inter-specific competition
L L L L 5
WeatherD H M M N/A N/A AM for ducks, H for geese. BPredation includes disturbance by predators. CL for ducks, M for geese. DSeasonal ice and snow cover.
21
Table 5. Importance assessment for waterfowl foraging and roosting habitats in the PLJV (H=high; M=moderate; L=low). Guild Dabbling Ducks Diving Ducks Geese Habitat Foraging
Value Roost Value
Foraging/Roost Value
Foraging Value
Roost Value
PlayasA H H M H H Saline Lakes L 0 0 0 0 Reservoirs H - L H H - MB L H Marsh H H H H H Stock Tanks H - L H H - M L H Rivers L M M L H Sewage Lagoon M H H 0 H Moist SoilC H H L M - L H Wet Meadow L 0 0 0 0 Gravel Pits L L L 0 M Sheet Water H M 0 H L Canals/Ditches L L L 0 0 Grazing/Pasture 0 0 0 M - L 0 CornD H 0 0 H 0 Sorghum H 0 0 H 0 Peanuts H 0 0 H 0 Winter Wheat LE 0 0 H 0 Cotton 0 0 0 0 0 Sunflowers 0 0 0 L 0 Soybeans M 0 0 H - M 0 Alfalfa 0F 0 0 M - L 0 AWet but unmanaged. BH for mergansers, M for other divers. CIncludes managed playas. DDoes not include corn harvested for silage, which has zero foraging value (assumed). EH for American Wigeon. FL for American Wigeon.
22
Table 6. Important waterfowl foraging habitats, energetic carrying capacity (ECC), threats, and trends. Habitat ECC
(DUDEs/Acre) References Applicable Guilds Threats Trends
Res., Lakes & Ponds Reservoirs 4,223 (for 5% of
total area) Assumption; consistent w/ LMVJV.
Dabbling ducks, Diving ducks Decreased inflows, sedimentation. Declining or stable.
Freshwater Lakes 4,223 (for 5% of total area)
Assumption; consistent w/ LMVJV.
Dabbling ducks, Diving ducks Declining groundwater. Stable.
Stock Ponds 225 (for 40% of total area0
Assumption; consistent w/ LMVJV.
Dabbling ducks, Diving ducks Overgrazing. Stable in BCR18; increasing in BCR19.
Lagoons 428 Assumed same as unmanaged playas.
Dabbling ducks, Diving ducks Contaminants. Stable or increasing.
Playas Wet Outside Pit 428 Haukos & Smith
1993, Anderson & Smith 1998; 1999
Dabbling ducks, Diving ducks, Geese
Siltation, tillage, overgrazing, modification (pits, roads, etc.). Decreasing irrigation tailwater.
Decreasing in many areas; stable in NM.
Wet Pit Only 849 Gray & Bolen 1987 Dabbling ducks, Diving ducks, Geese
Siltation is filling in existing pits; new pits generally are not being created.
Decreasing.
Other Wetlands Emergent Marsh 1,336 Assumption. Dabbling ducks, Diving
ducks, Geese None. Stable.
Saline Marsh 1,336 Assumption Dabbling ducks, Diving ducks, Geese
None. Stable.
Moist-Soil Units* 4,223 Haukos & Smith 1993, Anderson & Smith 1998; 1999
Dabbling ducks, Geese Undesirable and exotic vegetation. Increasing.
Riverine River channels 225 Assumption. Dabbling ducks, Diving ducks Reduced flows caused by aquifer depletion, reservoir
development, exotic shrub invasion. Declining.
Warmwater Sloughs 428 Assumption. Dabbling ducks Reduced river flows, sedimentation. Declining. Floodplain Marshes 1,336 Assumption Dabbling ducks Declining river flows and groundwater. Declining.
Cropland Corn 1,336 Baldassarre & Bolen
1984; Reinecke & Loesch 1996
Dabbling ducks, Geese Not assessed.
Sorghum 849 Reinecke & Loesch 1996
Dabbling ducks Geese
Not assessed.
Peanuts 849 Assumption. Dabbling ducks, Geese Not assessed. Winter Wheat 1,336 Assumption. Geese Not assessed.
*Includes moist-soil managed playas.
23
Table 7. Current energetic carrying capacity (ECC) of PLJV planning areas for waterfowl relative to goals, and habitat objectives. Planning Area
BCR-18 BCR-19
CO KS NE NM OK TX KS OK TX
ECC Goal (DUDEs) 32,570,531 14,351,091 24,439,744
72,491,588
3,214,666
965,138,689
106,728,704
108,086,411
706,722,667
Current ECC of Area (DUDEs)
48,502,629
21,145,129
27,135,520
21,228,654
17,956,214
283,890,539
145,233,170
157,730,600
99,172,372
DUDE Surplus/(Deficit) 15,932,098 6,794,038 2,695,776
(51,262,934)
14,741,548
(681,248,150)
38,504,466
49,644,189
(607,550,295)
Current ECC of Area Relative to Goal (%)
148.5% 146.9% 109.6% 29.0% 558.2% 28.9% 135.8% 145.5% 13.5%
Moist-soil Habitat Acres Needed to Erase Deficit (@4,223 DUDEs/acre)
N/A N/A N/A 12,139 N/A 161,319 N/A N/A 143,867
Annual Moist-soil Habitat Acreage Goal (30 years)
N/A N/A N/A 405 N/A 5,377 N/A N/A 4,796
24
APPENDIX A: Waterfowl Carrying Capacity Model for BCR18 Colorado
Association Name Assoc. Acres Condition Name Cond. Acres % of Assoc % Suitability ECC (DUDEs) CC Current Goal (DUDEs) % of Goal
Cropland 10,345,029 Corn
713,807 0.06900 0.00 1,336 0 32,570,531 0.0000 Cropland 10,345,029 Peanuts - 0.00000 0.00 849 0 32,570,531 0.0000
Cropland 10,345,029 Sorghum
331,041 0.03200 0.00 849 0 32,570,531 0.0000
Cropland 10,345,029 Wheat
1,468,994 0.14200 0.00 1,336 0 32,570,531 0.0000
Other Wetlands 1,761 Emergent marsh
1,761 1.00000 1.00 1,336 2,352,696 32,570,531 0.0720 Other Wetlands 1,761 Moist-soil unit - 0.00000 1.00 4,223 0 32,570,531 0.0000 Other Wetlands 1,761 Saline - 0.00000 1.00 1,336 0 32,570,531 0.0000
Playa 22,321 Wet
2,009 0.09000 1.00 428 859,805 32,570,531 0.0260
Playa 22,321 Wet pit only
1,339 0.06000 0.40 849 454,813 32,570,531 0.0130
Reservoirs Lakes Ponds 190,099 Freshwater lake
52,848 0.27800 0.05 4,223 11,158,754 32,570,531 0.3420
Reservoirs Lakes Ponds 190,099 Lagoon
3,802 0.02000 0.40 428 650,899 32,570,531 0.0190
Reservoirs Lakes Ponds 190,099 Reservoir
58,170 0.30600 0.05 4,223 12,282,658 32,570,531 0.3770
Reservoirs Lakes Ponds 190,099 Stock pond
71,477 0.37600 0.40 225 6,432,950 32,570,531 0.1970
Riverine Systems 495,329 Floodplain marsh
4,953 0.01000 1.00 1,336 6,617,595 32,570,531 0.2030
Riverine Systems 495,329 River channel
24,766 0.05000 1.00 225 5,572,451 32,570,531 0.1710
Riverine Systems 495,329 Warmwater slough
4,953 0.01000 1.00 428 2,120,008 32,570,531 0.0650
Totals 48,502,629 1.4850
*Goal is for the PLJV portion of BCR18-CO only (see Fig. 1); therefore carrying capacity shown here is too high. This inconsistency
will be rectified following decisions on the JV orientation of the South Platte River corridor of Colorado.
25
APPENDIX B: Waterfowl Carrying Capacity Model for BCR18 Kansas
Association Name Assoc. Acres Condition Name Cond. Acres % of Assoc % Suitability ECC (DUDEs) CC Current Goal (DUDEs) % of Goal
Cropland 6,682,273 Corn
962,247 0.14400 0.00 1,336 0 14,351,091 0.0000 Cropland 6,682,273 Peanuts - 0.00000 0.00 849 0 14,351,091 0.0000
Cropland 6,682,273 Sorghum
1,002,341 0.15000 0.00 849 0 14,351,091 0.0000
Cropland 6,682,273 Wheat
2,258,608 0.33800 0.00 1,336 0 14,351,091 0.0000
Other Wetlands 2,946 Emergent marsh
2,905 0.98600 1.00 1,336 3,880,754 14,351,091 0.2700
Other Wetlands 2,946 Moist-soil unit
41 0.01400 1.00 4,223 174,173 14,351,091 0.0120 Other Wetlands 2,946 Saline - 0.00000 1.00 1,336 0 14,351,091 0.0000
Playa 90,724 Wet
8,165 0.09000 1.00 428 3,494,688 14,351,091 0.2430
Playa 90,724 Wet pit only
5,443 0.06000 0.40 849 1,848,592 14,351,091 0.1280
Reservoirs Lakes Ponds 8,448 Freshwater lake
6,412 0.75900 0.05 4,223 1,353,901 14,351,091 0.0940
Reservoirs Lakes Ponds 8,448 Lagoon
169 0.02000 0.40 428 28,926 14,351,091 0.0020
Reservoirs Lakes Ponds 8,448 Reservoir
118 0.01400 0.05 4,223 24,973 14,351,091 0.0010
Reservoirs Lakes Ponds 8,448 Stock pond
1,580 0.18700 0.40 225 142,180 14,351,091 0.0090
Riverine Systems 350,290 Floodplain marsh
3,503 0.01000 1.00 1,336 4,679,874 14,351,091 0.3260
Riverine Systems 350,290 River channel
24,520 0.07000 1.00 225 5,517,068 14,351,091 0.3840 Riverine Systems 350,290 Warmwater slough - 0.00000 1.00 428 0 14,351,091 0.0000
Totals 21,145,129 1.4690
26
APPENDIX C: Waterfowl Carrying Capacity Model for BCR18 Nebraska
Association Name Assoc. Acres Condition Name Cond. Acres % of Assoc % Suitability ECC (DUDEs) CC Current Goal (DUDEs) % of Goal
Cropland 3,903,811 Corn
897,877 0.23000 0.00 1,336 0 24,439,744 0.0000 Cropland 3,903,811 Peanuts - 0.00000 0.00 849 0 24,439,744 0.0000
Cropland 3,903,811 Sorghum
35,134 0.00900 0.00 849 0 24,439,744 0.0000
Cropland 3,903,811 Wheat
995,472 0.25500 0.00 1,336 0 24,439,744 0.0000
Other Wetlands 10,657 Emergent marsh
10,273 0.96400 1.00 1,336 13,725,193 24,439,744 0.5610
Other Wetlands 10,657 Moist-soil unit
32 0.00300 1.00 4,223 135,014 24,439,744 0.0050
Other Wetlands 10,657 Saline
352 0.03300 1.00 1,336 469,846 24,439,744 0.0190
Playa 103,026 Wet
9,272 0.09000 1.00 428 3,968,562 24,439,744 0.1620
Playa 103,026 Wet pit only
6,182 0.06000 0.40 849 2,099,258 24,439,744 0.0850
Reservoirs Lakes Ponds 34,479 Freshwater lake
310 0.00900 0.05 4,223 65,522 24,439,744 0.0020
Reservoirs Lakes Ponds 34,479 Lagoon
690 0.02000 0.40 428 118,056 24,439,744 0.0040
Reservoirs Lakes Ponds 34,479 Reservoir
21,860 0.63400 0.05 4,223 4,615,673 24,439,744 0.1880
Reservoirs Lakes Ponds 34,479 Stock pond
6,689 0.19400 0.40 225 602,003 24,439,744 0.0240
Riverine Systems 46,258 Floodplain marsh
463 0.01000 1.00 1,336 618,007 24,439,744 0.0250
Riverine Systems 46,258 River channel
2,313 0.05000 1.00 225 520,402 24,439,744 0.0210
Riverine Systems 46,258 Warmwater slough
463 0.01000 1.00 428 197,984 24,439,744 0.0000
Totals 27,135,520 1.0960
27
APPENDIX D: Waterfowl Carrying Capacity Model for BCR18 New Mexico
Association Name Assoc. Acres Condition Name Cond. Acres % of Assoc % Suitability ECC (DUDEs) CC Current Goal (DUDEs) % of Goal
Cropland 947,453 Corn
70,112 0.07400 0.00 1,336 0 72,491,588 0.0000
Cropland 947,453 Peanuts
18,002 0.01900 0.00 849 0 72,491,588 0.0000
Cropland 947,453 Sorghum
157,277 0.16600 0.00 849 0 72,491,588 0.0000
Cropland 947,453 Wheat
442,461 0.46700 0.00 1,336 0 72,491,588 0.0000
Other Wetlands 5,243 Emergent marsh
5,243 1.00000 1.00 1,336 7,004,648 72,491,588 0.0960 Other Wetlands 5,243 Moist-soil unit - 0.00000 1.00 4,223 0 72,491,588 0.0000 Other Wetlands 5,243 Saline - 0.00000 1.00 1,336 0 72,491,588 0.0000
Playa 14,843 Wet
1,781 0.12000 1.00 428 762,336 72,491,588 0.0100
Playa 14,843 Wet pit only
1,187 0.08000 0.40 849 403,255 72,491,588 0.0050
Reservoirs Lakes Ponds 66,180 Freshwater lake
32,759 0.49500 0.05 4,223 6,917,084 72,491,588 0.0950
Reservoirs Lakes Ponds 66,180 Lagoon
1,324 0.02000 0.40 428 226,600 72,491,588 0.0030
Reservoirs Lakes Ponds 66,180 Reservoir
19,258 0.29100 0.05 4,223 4,066,407 72,491,588 0.0560
Reservoirs Lakes Ponds 66,180 Stock pond
5,758 0.08700 0.40 225 518,189 72,491,588 0.0070
Riverine Systems 49,521 Floodplain marsh
495 0.01000 1.00 1,336 661,601 72,491,588 0.0090
Riverine Systems 49,521 River channel
2,971 0.06000 1.00 225 668,534 72,491,588 0.0090 Riverine Systems 49,521 Warmwater slough - 0.00000 1.00 428 0 72,491,588 0.0000
Totals 21,228,654 0.2900
28
APPENDIX E: Waterfowl Carrying Capacity Model for BCR18 Oklahoma
Association Name Assoc. Acres Condition Name Cond. Acres % of Assoc % Suitability ECC (DUDEs) CC Current Goal (DUDEs) % of Goal
Cropland 1,087,673 Corn
118,556 0.10900 0.00 1,336 0 3,214,666 0.0000 Cropland 1,087,673 Peanuts - 0.00 849 3,214,666 0.0000
Cropland 1,087,673 Sorghum
233,850 0.21500 0.00 849 0 3,214,666 0.0000
Cropland 1,087,673 Wheat
532,960 0.49000 0.00 1,336 0 3,214,666 0.0000 Other Wetlands 14 Emergent marsh - 0.00000 1.00 1,336 0 3,214,666 0.0000
Other Wetlands 14 Moist-soil unit
14 1.00000 1.00 4,223 59,122 3,214,666 0.0180 Other Wetlands 14 Saline - 0.00000 1.00 1,336 0 3,214,666 0.0000
Playa 3,307 Wet
661 0.20000 1.00 428 283,079 3,214,666 0.0880
Playa 3,307 Wet pit only
165 0.05000 0.40 849 56,153 3,214,666 0.0170
Reservoirs Lakes Ponds 3,944 Freshwater lake
3,873 0.98200 0.05 4,223 817,786 3,214,666 0.2540 Reservoirs Lakes Ponds 3,944 Lagoon - 0.00000 0.40 428 0 3,214,666 0.0000 Reservoirs Lakes Ponds 3,944 Reservoir - 0.00000 0.05 4,223 0 3,214,666 0.0000
Reservoirs Lakes Ponds 3,944 Stock pond
71 0.01800 0.40 225 6,389 3,214,666 0.0010
Riverine Systems 298,230 Floodplain marsh
2,982 0.01000 1.00 1,336 3,984,353 3,214,666 1.2390
Riverine Systems 298,230 River channel
56,664 0.19000 1.00 225 12,749,332 3,214,666 3.9650 Riverine Systems 298,230 Warmwater slough - 0.00000 1.00 428 0 3,214,666 0.0000
Totals 17,956,214 5.5820
29
APPENDIX F: Waterfowl Carrying Capacity Model for BCR18 Texas
Association Name Assoc. Acres Condition Name Cond. Acres % of Assoc % Suitability ECC (DUDEs) CC Current Goal (DUDEs) % of Goal
Cropland 6,487,233 Corn
661,698 0.10200 0.00 1,336 0 965,138,689 0.0000
Cropland 6,487,233 Peanuts
162,181 0.02500 0.00 849 0 965,138,689 0.0000
Cropland 6,487,233 Sorghum
1,459,627 0.22500 0.00 849 0 965,138,689 0.0000
Cropland 6,487,233 Wheat
2,834,921 0.43700 0.00 1,336 0 965,138,689 0.0000
Other Wetlands 98,716 Emergent marsh
98,617 0.99900 1.00 1,336 131,752,691 965,138,689 0.1360
Other Wetlands 98,716 Moist-soil unit
99 0.00100 1.00 4,223 416,878 965,138,689 0.0000 Other Wetlands 98,716 Saline - 0.00000 1.00 1,336 0 965,138,689 0.0000
Playa 497,543 Wet
99,509 0.20000 1.00 428 42,589,681 965,138,689 0.0440
Playa 497,543 Wet pit only
24,877 0.05000 0.40 849 8,448,280 965,138,689 0.0080
Reservoirs Lakes Ponds 132,319 Freshwater lake
57,294 0.43300 0.05 4,223 12,097,655 965,138,689 0.0120
Reservoirs Lakes Ponds 132,319 Lagoon
2,646 0.02000 0.40 428 453,060 965,138,689 0.0000
Reservoirs Lakes Ponds 132,319 Reservoir
20,509 0.15500 0.05 4,223 4,330,569 965,138,689 0.0040
Reservoirs Lakes Ponds 132,319 Stock pond
24,479 0.18500 0.40 225 2,203,111 965,138,689 0.0020
Riverine Systems 3,315,669 Floodplain marsh
33,157 0.01000 1.00 1,336 44,297,338 965,138,689 0.0450
Riverine Systems 3,315,669 River channel
165,783 0.05000 1.00 225 37,301,276 965,138,689 0.0380 Riverine Systems 3,315,669 Warmwater slough - 0.00000 1.00 428 0 965,138,689 0.0000
Totals 283,890,539 0.2890
30
APPENDIX G: Waterfowl Carrying Capacity Model for BCR19 Kansas
Association Name Assoc. Acres Condition Name Cond. Acres % of Assoc % Suitability ECC (DUDEs) CC Current Goal (DUDEs) % of Goal
Cropland 17,947,545 Corn
1,238,381 0.06900 0.00 1,336 0 106,728,704 0.0000 Cropland 17,947,545 Peanuts - 0.00000 0.00 849 0 106,728,704 0.0000
Cropland 17,947,545 Sorghum
2,243,443 0.12500 0.00 849 0 106,728,704 0.0000
Cropland 17,947,545 Wheat
6,371,378 0.35500 0.00 1,336 0 106,728,704 0.0000 Other Wetlands 16,234 Emergent marsh - 0.00000 1.00 1,336 0 106,728,704 0.0000
Other Wetlands 16,234 Moist-soil unit
16,234 1.00000 1.00 4,223 68,556,182 106,728,704 0.6420 Other Wetlands 16,234 Saline - 0.00000 1.00 1,336 0 106,728,704 0.0000
Playa 97,135 Wet
8,742 0.09000 1.00 428 3,741,640 106,728,704 0.0350
Playa 97,135 Wet pit only
5,828 0.06000 0.40 849 1,979,223 106,728,704 0.0180
Reservoirs Lakes Ponds 124,980 Freshwater lake
32,495 0.26000 0.05 4,223 6,861,277 106,728,704 0.0640
Reservoirs Lakes Ponds 124,980 Lagoon
2,500 0.02000 0.40 428 427,932 106,728,704 0.0040
Reservoirs Lakes Ponds 124,980 Reservoir
56,616 0.45300 0.05 4,223 11,954,456 106,728,704 0.1120
Reservoirs Lakes Ponds 124,980 Stock pond
30,870 0.24700 0.40 225 2,778,305 106,728,704 0.0260
Riverine Systems 1,988,385 Floodplain marsh
19,884 0.01000 1.00 1,336 26,564,824 106,728,704 0.2480
Riverine Systems 1,988,385 River channel
99,419 0.05000 1.00 225 22,369,331 106,728,704 0.2090 Riverine Systems 1,988,385 Warmwater slough - 0.00000 1.00 428 0 106,728,704 0.0000
Totals 145,233,170 1.3580
31
APPENDIX H: Waterfowl Carrying Capacity Model for BCR19 Oklahoma
Association Name Assoc. Acres Condition Name Cond. Acres % of Assoc % Suitability ECC (DUDEs) CC Current Goal (DUDEs) % of Goal
Cropland 9,055,869 Corn
54,335 0.00600 0.00 1,336 0 108,086,411 0.0000
Cropland 9,055,869 Peanuts
54,335 0.00600 0.00 849 0 108,086,411 0.0000
Cropland 9,055,869 Sorghum
172,062 0.01900 0.00 849 0 108,086,411 0.0000
Cropland 9,055,869 Wheat
5,388,242 0.59500 0.00 1,336 0 108,086,411 0.0000
Other Wetlands 24,080 Emergent marsh
16,856 0.70000 1.00 1,336 22,519,616 108,086,411 0.2080
Other Wetlands 24,080 Moist-soil unit
7,224 0.30000 1.00 4,223 30,506,952 108,086,411 0.2820 Other Wetlands 24,080 Saline - 0.00000 1.00 1,336 0 108,086,411 0.0000
Playa 51,527 Wet
10,305 0.20000 1.00 428 4,410,711 108,086,411 0.0400
Playa 51,527 Wet pit only
2,576 0.05000 0.40 849 874,928 108,086,411 0.0080
Reservoirs Lakes Ponds 104,695 Freshwater lake
45,647 0.43600 0.05 4,223 9,638,368 108,086,411 0.0890
Reservoirs Lakes Ponds 104,695 Lagoon
2,094 0.02000 0.40 428 358,476 108,086,411 0.0030
Reservoirs Lakes Ponds 104,695 Reservoir
53,394 0.51000 0.05 4,223 11,274,238 108,086,411 0.1040
Reservoirs Lakes Ponds 104,695 Stock pond
1,570 0.01500 0.40 225 141,338 108,086,411 0.0010
Riverine Systems 3,169,686 Floodplain marsh
31,697 0.01000 1.00 1,336 42,347,005 108,086,411 0.3910
Riverine Systems 3,169,686 River channel
158,484 0.05000 1.00 225 35,658,968 108,086,411 0.3290 Riverine Systems 3,169,686 Warmwater slough - 0.00000 1.00 428 0 108,086,411 0.0000
Totals 157,730,600 1.4550
32
APPENDIX I: Waterfowl Carrying Capacity Model for BCR19 Texas
Association Name Assoc. Acres Condition Name Cond. Acres % of Assoc % Suitability ECC (DUDEs) CC Current Goal (DUDEs) % of Goal
Cropland 2,986,127 Corn
8,958 0.00300 0.00 1,336 0 706,722,667 0.0000
Cropland 2,986,127 Peanuts
101,528 0.03400 0.00 849 0 706,722,667 0.0000
Cropland 2,986,127 Sorghum
176,181 0.05900 0.00 849 0 706,722,667 0.0000
Cropland 2,986,127 Wheat
1,940,983 0.65000 0.00 1,336 0 706,722,667 0.0000
Other Wetlands 45,858 Emergent marsh
45,766 0.99800 1.00 1,336 61,143,755 706,722,667 0.0860
Other Wetlands 45,858 Moist-soil unit
92 0.00200 1.00 4,223 387,317 706,722,667 0.0000 Other Wetlands 45,858 Saline - 0.00000 1.00 1,336 0 706,722,667 0.0000
Playa 46,729 Wet
9,346 0.20000 1.00 428 4,000,002 706,722,667 0.0050
Playa 46,729 Wet pit only
2,336 0.05000 0.40 849 793,458 706,722,667 0.0010
Reservoirs Lakes Ponds 120,677 Freshwater lake
52,736 0.43700 0.05 4,223 11,135,175 706,722,667 0.0150
Reservoirs Lakes Ponds 120,677 Lagoon
2,414 0.02000 0.40 428 413,198 706,722,667 0.0000
Reservoirs Lakes Ponds 120,677 Reservoir
44,047 0.36500 0.05 4,223 9,300,546 706,722,667 0.0130
Reservoirs Lakes Ponds 120,677 Stock pond
19,067 0.15800 0.40 225 1,716,027 706,722,667 0.0020
Riverine Systems 417,834 Floodplain marsh
4,178 0.01000 1.00 1,336 5,582,262 706,722,667 0.0070
Riverine Systems 417,834 River channel
20,892 0.05000 1.00 225 4,700,632 706,722,667 0.0060 Riverine Systems 417,834 Warmwater slough - 0.00000 1.00 428 0 706,722,667 0.0000
Totals 99,172,372 0.1350
33
APPENDIX J: Assumptions Made in Developing This Conservation Strategy
<to be completed?>
34
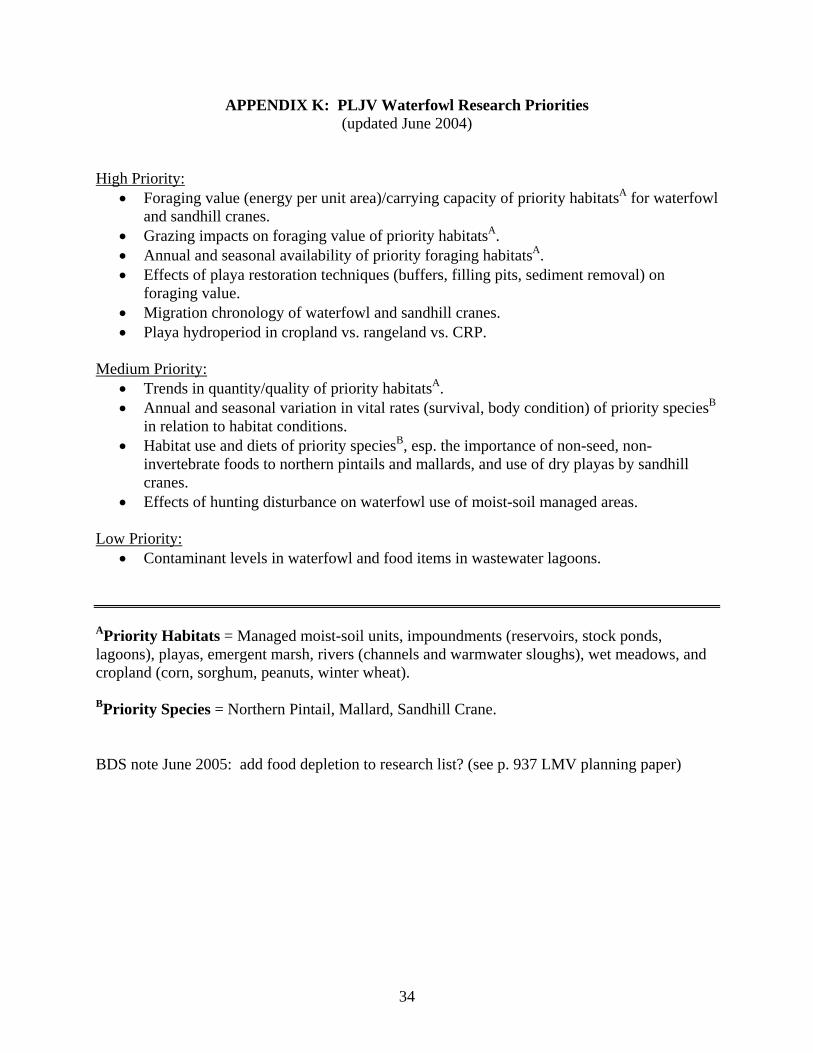
APPENDIX K: PLJV Waterfowl Research Priorities (updated June 2004)
High Priority:
• Foraging value (energy per unit area)/carrying capacity of priority habitatsA for waterfowl and sandhill cranes.
• Grazing impacts on foraging value of priority habitatsA. • Annual and seasonal availability of priority foraging habitatsA. • Effects of playa restoration techniques (buffers, filling pits, sediment removal) on
foraging value. • Migration chronology of waterfowl and sandhill cranes. • Playa hydroperiod in cropland vs. rangeland vs. CRP.
Medium Priority:
• Trends in quantity/quality of priority habitatsA. • Annual and seasonal variation in vital rates (survival, body condition) of priority speciesB
in relation to habitat conditions. • Habitat use and diets of priority speciesB, esp. the importance of non-seed, non-
invertebrate foods to northern pintails and mallards, and use of dry playas by sandhill cranes.
• Effects of hunting disturbance on waterfowl use of moist-soil managed areas. Low Priority:
• Contaminant levels in waterfowl and food items in wastewater lagoons. APriority Habitats = Managed moist-soil units, impoundments (reservoirs, stock ponds, lagoons), playas, emergent marsh, rivers (channels and warmwater sloughs), wet meadows, and cropland (corn, sorghum, peanuts, winter wheat). BPriority Species = Northern Pintail, Mallard, Sandhill Crane. BDS note June 2005: add food depletion to research list? (see p. 937 LMV planning paper)