water supply and wastewater systems ......water supply and wastewater systems master plan for the...
TRANSCRIPT

WATER SUPPLY AND WASTEWATER SYSTEMS MASTER PLAN
FOR THE BEKAA WATER ESTABLISHMENT
March 2013
INCEPTION REPORT
THIS DOCUMENT IS PREPARED BY DAI/KREDO UNDER THE LEBANON WATER AND WASTEWATER SECTOR SUPPORT PROGRAM (LWWSS) FUNDED BY USAID

WATER SUPPLY AND WASTEWATER SYSTEMS MASTER PLAN FOR THE BWE INCEPTION REPORT P-1211
MARCH 2013 PAGE 1 OF 67
INC
EP
TIO
N R
EP
OR
T
TABLE OF CONTENTS
1- INTRODUCTION AND SCOPE OF WORK ............................................................................................. 3
2- POPULATION PROJECTIONS ............................................................................................................... 4
2.1 POPULATION ESTIMATES ............................................................................................................ 4
2.2 POPULATION GROWTH ................................................................................................................ 5
3- WATER MANAGEMENT ......................................................................................................................... 6
3.1 WATER SOURCES ......................................................................................................................... 6
3.2 WATER NEEDS .............................................................................................................................. 7
3.3 EXISTING FACILITIES .................................................................................................................... 8
3.4 ADDITIONAL EXISTING STUDIES ................................................................................................. 9
3.5 WATER STORAGE ....................................................................................................................... 10
4- WASTEWATER MANAGEMENT .......................................................................................................... 16
4.1 WASTEWATER FLOW ................................................................................................................. 16
4.2 EXISTING AND PLANNED WASTEWATER TREATMENT PLANTS ........................................... 16
4.3 ADDITIONAL EXISTING STUDIES ............................................................................................... 22
5- IRRIGATION .......................................................................................................................................... 25
5.1 IRRIGATION PROJECTS ............................................................................................................. 25
5.2 WASTEWATER EFFLUENT REUSE IN IRRIGATION .................................................................. 27
5.3 PREPARATION OF THE SCOPE OF WORK ............................................................................... 27
6- EXISTING BWE FACILITIES: ASSETS DATABASE............................................................................ 29
7- GEOGRAPHICAL INFORMATION SYSTEM ........................................................................................ 30
7.1 IMPROVING GIS FUNCTIONALITY AND UPDATING DATABASE ............................................. 30
7.2 SUPPORT TO THE BWE .............................................................................................................. 30
8- ADDITIONAL INFORMATION GATHERED TO DATE ......................................................................... 31
9- WORK ORGANISATION ....................................................................................................................... 32
LIST OF TABLES TABLE 2.1: BEKAA POPULATION ACCORDING TO DIFFERENT SOURCES ............................................................... 4
TABLE 2.2: BEKAA POPULATION CALCULATED BASED ON CAS 2004 BUILDING CENSUS .................................... 4
TABLE 2.3: NUMBER OF BEKAA VOTERS ..................................................................................................................... 5
TABLE 3.1: AVERAGE FLOWS IN THE BEKAA SURFACE WATER COURSES ............................................................ 6
TABLE 3.2: GROUNDWATER USE IN THE BEKAA ........................................................................................................ 6
TABLE 3.3: SUMMARY OF BWE ASSETS ....................................................................................................................... 8
TABLE 3.4: DISTRIBUTION OF ASSETS PER ZONE (AS DEFINED BY BWE) .............................................................. 8
TABLE 3.5: PLANS RECEIVED FROM MEW CONCERNING POTABLE WATER PROJECTS ...................................... 9
TABLE 3.6: COMPLETED AND ONGOING WATER SUPPLY PROJECTS IN THE BEKAA (CDR) ................................ 9
TABLE 3.7: SURFACE WATER POTENTIAL FOR THE BEKAA .................................................................................... 10
TABLE 4.1: STATUS OF THE BEKAA TREATMENT PLANTS PLANNED BY THE CDR/MEW (MEW) ........................ 17
TABLE 4.2: WASTEWATER TREATMENT PLANTS FUNDED BY USAID (MEW) ........................................................ 17
TABLE 4.3: WASTEWATER TREATMENT PLANTS ACCORDING TO THE BWE 2012-2016 BUSINESS PLAN ...... 18
TABLE 4.4: WASTEWATER TREATMENT PLANTS ACCORDING TO THE BWE ASSETS ASSESSMENT
DATABASE ............................................................................................................................................... 19
TABLE 4.5: COMPLETED AND ONGOING WASTEWATER PROJECTS IN THE BEKAA (CDR) ................................ 21
TABLE 4.6: PLANS RECEIVED FROM MEW CONCERNING SEWER NETWORK PROJECTS ................................. 22
TABLE 5.1: LAND AND CROP INVENTORY FROM “RECENSEMENT GÉNÉRAL DE L’AGRICULTURE”
(FAO 1999)……………………………………………………………………………………………….……………26
LIST OF FIGURES FIGURE 3.1: FACILITIES DISTRIBUTION ...................................................................................................................... 11
FIGURE 3.2: WELLS AND SPRINGS CONDITION ........................................................................................................ 12
FIGURE 3.3: WATER TREATMENT FACILITIES ........................................................................................................... 13
FIGURE 3.4: PUMPING STATIONS AND CHLORINATORS CONDITION..................................................................... 14
FIGURE 3.5: WATER SUPPLY COMPLETED & ONGOING PROJECTS FROM CDR PROGESS REPORT - 2012 .... 15
FIGURE 3.6: WATER SUPPLY PROJECTS UNDER PREPARATION FROM CDR PROGESS REPORT - 2012 ......... 15
FIGURE 4.1: WASTEWATER TREATMENT PLANTS ACCORDING TO THE BWE ASSESSMENT DATABASE ........ 23
FIGURE 4.2: WASTEWATER COMPLETED, ONGOING & UNDER PREPARATION PROJECTS FROM CDR
PROGRESS REPORT – 2012 ................................................................................................................... 24

WATER SUPPLY AND WASTEWATER SYSTEMS MASTER PLAN FOR THE BWE INCEPTION REPORT P-1211
MARCH 2013 PAGE 2 OF 67
INC
EP
TIO
N R
EP
OR
T
PROPOSED TIMELINE
APPENDIX A:
A.1 POPULATION ESTIMATES FROM PREVIOUS STUDIES
A.2 NUMBER OF TOWNS AND VILLAGES IN THE BEKAA ACCORDING TO DIFFERENT SOURCES
A.3 TOWNS AND VILLAGES NAMES ACCORDING TO CDR & DGA
A.4 TOWNS AND VILLAGES NAMES ACCORDING TO CAS
A.5 POPULATION SURVEY QUESTIONNAIRE
A.6 WATER NEEDS IN THE BEKAA REGION FROM “ANALYSE DES STRATEGIES ET PROSPECTIVES DE L’EAU AU
LIBAN” – (PLAN BLEU-UNEP 2001)
A.7 WASTEWATER TREATMENT PLANTS FOR IN THE NORTH & SOUTH OF BEKAA FROM SIU-MRHE (2000)
A.8 WASTEWATER TREATMENT PLANT LOCATIONS FROM “MASTER PLAN STUDY TO LOCATE WASTE WATER
TREATMENT PLANTS IN BEKAA” (DAHNT 1994 - MINISTRY OF HOUSING AND COOPERATIVE)
APPENDIX B:
B.1 ROAD NETWORKS, SDATL, 2002
B.2 RAINFALL DISTRIBUTION MAP, PLASSARD, 1:200,000, 1971
B.3 GEOLOGICAL MAP, L. DUBERTRET, 1:50,000, 1945
B.4 HYDROLOGICAL MAP, TOPOGRAPHIC MAP DGA, 1:50,000, 1945
B.5 INDUSTRIES DISTRIBUTION IN THE BEKAA, SDATL, 2002
B.6 LAND USE, MOA, 1:20,000, 2001
B.7 SOIL MAP, GEZE, 1954
LIST OF ACRONYMS
BWE BEKAA WATER ESTABLISHMENT
CAS CENTRAL ADMINISTRATION OF STATISTICS
CDM CAMP DRESSER & MCKEE
CDR COUNCIL FOR DEVELOPMENT AND RECONSTRUCTION
DAI DEVELOPMENT ALTERNATIVES, INC.
DAHNT DAR AL HANDASAH NAZIH TALEB AND PARTNERS
DGA DIRECTORATE GENERAL OF THE ARMY
GIS GEOGRAPHIC INFORMATION SYSTEM
GIZ GERMAN AGENCY FOR INTERNATIONAL COOPERATION
IFES INTERNATIONAL FOUNDATION FOR ELECTORAL DISTRICTS
K&A KHATIB & ALAMI
LCWMC LEBANESE CENTER FOR WATER MANAGEMENT AND CONSERVATION
LRA LITANI RIVER AUTHORITY
LWWSS LEBANON WATER AND WASTEWATER SECTOR SUPPORT
MEW MINISTRY OF ENERGY AND WATER
MOA MINISTRY OF AGRICULTURE
USAID UNITED STATES AGENCY FOR INTERNATIONAL DEVELOPMENT

WATER SUPPLY AND WASTEWATER SYSTEMS MASTER PLAN FOR THE BWE INCEPTION REPORT P-1211
MARCH 2013 PAGE 3 OF 67
INC
EP
TIO
N R
EP
OR
T
1 INTRODUCTION AND SCOPE OF WORK
On December 1st, 2012 KREDO has been commissioned by DAI to carry out the project entitled
“Development of a Water Supply and Wastewater Systems Master Plan within the Service Area of
the Bekaa Water Establishment” as part of the USAID – Lebanon Water Wastewater Sector
Support Program (LWWSS). The project duration is sixteen months and it includes 9 major
deliverables spread between Month 2 and Month 16, in addition to brief monthly reports. The
present report is the Inception Report which is the first scheduled deliverable
The scope of the current study is to establish water supply and wastewater master plans in order to
support the Bekaa Water Establishment (BWE) decision-makers in the preparation of a rational
infrastructure development and capital investment plan for water supply, water distribution,
wastewater collection and wastewater treatment systems, as well as elements of an irrigation
system.
More specifically, the following activities are required:
- Review population projections used in different studies.
- Forecast population sizes and distribution. The number of inhabitants, residences, schools, and
industries will be included in the region covered in order to determine the average population
size for the year 2035 planning horizon.
- Collect existing water sources information springs, rivers, wells, etc.
- Collect existing studies concerning the water supply and distribution network in the project
area, as well as any existing master plans. Focus will be on recent and relevant studies.
- Collect information concerning water supply projects already executed in the last 20 years.
- Determine current and future water needs based on population projections for the year 2035.
- Make recommendations to improve the water supply system in accordance with the National
Water Strategy and the BWE 2012-2016 Business Plan and present these improvements in a
schedule of CAPE and OPEX along with their timing.
- Assess CAPEX needs for deploying water metering across BWE service area and recommend
implementation plan.
- Collect existing studies concerning wastewater treatment plants, sewer networks, and
proposed discharge points as well as any existing master plans. Focus will be on recent and
relevant studies.
- Collect information concerning wastewater treatment plants and sewer networks already
executed.
- Determine current and future wastewater flow quantities based on population projections for the
year 2035. The projected volumes of wastewater for every village and by region shall be
calculated.
- Make recommendations for improvements to the sewage system and wastewater treatment
plants according with the National Water Sector Strategy and the BWE 2012-2016 Business
Plan, and present these recommendations in a schedule of CAPE and OPEX along with their
timing.
- Evaluate funding mechanisms for all recommended actions.
- Collect existing irrigation water system information and prepare a detailed scope of work and
cost estimate for an Irrigation Water Master Plan.
- Improve the existing BWE GIS functionality, update the GIS database, and support the BWE in
the preparation of its annual business plan 2014 update.
The present report summarizes the information gathered and inception work to date and
establishes the framework to be adopted in the next phase in order to complete the required
master plan.

WATER SUPPLY AND WASTEWATER SYSTEMS MASTER PLAN FOR THE BWE INCEPTION REPORT P-1211
MARCH 2013 PAGE 4 OF 67
INC
EP
TIO
N R
EP
OR
T
2 POPULATION PROJECTIONS
2.1 Population Estimates
Population estimates are one of the essential elements in a successful master plan. Erroneous
population estimates will lead to inaccurate projections of water quantity needs and generated
wastewater flows which in turn will lead to a flawed solution scheme. Unfortunately, no population
census has been conducted in Lebanon since 1932. That has caused the government to rely on
estimates for any design or any project, albeit these estimates are sometimes based on some local
baseline information such as electrical connections, number of registered voters, some limited
population counts, etc. This has resulted in widely varying estimates from one study to the next. For
example, a study carried out by Dar Al Handasah Nazih Taleb and Partners (DAHNT) for the Ministry
of Housing and Cooperative in 1994 and entitled “Master Plan Study to Locate Waste Water Treatment
Plants in Bekaa” has estimated (based on data from literature and a field survey) the population of the
Bekaa to be 536,638 in 1980 and 873,972 in 1994 (Table A1); while the National Waste Management
Plan produced by Camp Dresser & McKee Inc. (CDM) in association with Khatib & Alami in 1982 has
estimated the Bekaa population in 1980 to be 480,447 and the update of the Master Plan by Khatib &
Alami (K&A) in 1994 estimated that year’s population to be 477,897. The K&A number is half the
estimate of the DAHNT study but would still be, if projected to 2011, considerably higher than the
number used in the Terms of Reference of this current project which specifies the current population of
the Bekaa to be around 516,000. It is understood that the current population estimate given in the TOR
is projected from the estimates of the CAS (Central Administration of Statistics), which places the
population of the Bekaa at about 489,865 in 2007 and uses a fixed 1.3% population growth factor for
all of Lebanon.
TABLE 2.1: BEKAA POPULATION ACCORDING TO DIFFERENT SOURCES
Population DAHNT Master
Plan
CDM/K&A Master Plan
Master Plan TOR
Calculated from CAS Building
Census (compounded
values per caza)
Calculated from Voters’
Turnout
Calculated from
Registered Voters
1980 536,638 480,447
1994 873,972 477,897
2004 609,173
2007 489,865
2009 479,870 908,694
2011 516,000 940,817
At a meeting held with the CAS Director General Dr. Maral Tutelian and her team, it was confirmed that
no population census exists for the Bekaa region, and that the figure estimated in 2007 was obtained
from an approximation at the level of the Mohafaza and hence there is no breakdown of this estimate by
caza or village. On the other hand, the CAS conducted a building census for all of Lebanon in 2004 and
the results published by caza. This census covered the number of buildings, dwellings, and commercial
facilities along with a host of other information among which building type, use, status, construction
date, unit surface area distribution, and type of occupancy. The following table lists the number of
dwellings (units) used for housing purposes (excluding units used solely for other purposes, empty
units, closed units, and units under construction) for each caza in the Bekaa. Also according to a 2004
CAS population characteristics survey, the average household size in the Bekaa was 4.58
(unfortunately, there is no specific number per caza). By multiplying the number of housing units with
the average household size, a rough estimate of the population by caza can be obtained (Table 2.2).
According to the literature accompanying the results of this census, the field work was collected on the
basis of geographical or cadastral units which sometimes coincide with the administrative limits of a
municipality or a town. Efforts are currently under way to obtain the information from the CAS by
geographical unit as population estimates per caza are of very limited use in the current master plan.
TABLE 2.2: BEKAA POPULATION CALCULATED BASED ON CAS 2004 BUILDING CENSUS
Caza Nb of housing units
2004
Population
2004
Zahle 41,729 191,119
West Bekaa 17,525 80,265
Baalbeck 57,732 264,413
Hermel 8202 37,565
Rachaya 7819 35,811
TOTAL 133,007 609,173
CAS has informed the Consultant that a study is currently underway to conduct a building census for a
handful of localities in the caza of Zahle. Similarly to the 2004 census, it will gather information on: the
number of buildings, the number of dwellings, water connections, sewer connections, and source of
water. An official letter has been sent to the CAS by the BWE authorizing that this information be
released to this Consultant.
It is important to note that there is no consensus on the number of towns and villages in the Bekaa.
Indeed different sources give widely varying numbers: the DAHNT study mentioned above lists 258; the
official CDR list 304; the CAS 212; the USAID 251 (however, this list contains some omissions, errors -
villages listed twice, misplaced villages misplaced-, and a large number of “disputed” villages); and the
TOR of the current study mention 330 (without listing them) out of which 240 are said to be connected

WATER SUPPLY AND WASTEWATER SYSTEMS MASTER PLAN FOR THE BWE INCEPTION REPORT P-1211
MARCH 2013 PAGE 5 OF 67
INC
EP
TIO
N R
EP
OR
T
to the BWE public water supply network (Tables A1 and A2 in Appendix A). In this study, the
towns/villages considered are based on the official cadastral map issued by the DGA. Moreover, there
is no consensus on the spelling of the towns/villages/localities names as they are translated from
Arabic. The spelling adopted in this study is that used by USAID for all its projects in Lebanon.
However, for information purposes, the different spellings used by the various Lebanese Authorities
(CDR, DGA, CAS) are listed in tables A3 and A4 and can be referred to in case any confusion
concerning the name of a village occurs.
The 2011 Electoral Districts in Lebanon report published by the IFES (International Foundation for
Electoral Districts) lists the following number of voters for the Bekaa, provided by the Ministry of Interior
and Municipalities:
TABLE 2.3: NUMBER OF BEKAA VOTERS
District Number of voters
(2011)
Number of voters
(2009) Turnout (2009) Turnout % (2009)
Baalbeck-Hermel 268,457 255,637 126,038 49.3
Zahle 160,091 158,005 91,848 58.1
West Bekaa -Rachaya 126,534 122,487 65,237 53.3
Total 555,082 536,129 283,123 52.8
The UNDP, in their report entitled “Selected Characteristics of the Population in Bekaa – 2004” has
listed the following population distribution by age:
Age Percentage of total population
Less than 15 years 28.1
15 – 24 years 21.1
25 – 44 years 29.6
45 – 64 years 15.7
Above 65 years 8.5
Accordingly, about 41% of the Bekaa population is not eligible to vote (the minimum age for voters’
eligibility in Lebanon is 21 years), and hence the total number of voters in principle would represent
59% of the population only. Knowing that a large number of registered voters do not actually live in the
Bekaa (having emigrated or living in another area in Lebanon), it is believed that the turnout number is
more indicative of the actual population, or at least the population still having residential ties in the
Bekaa. Hence assuming the turnout number represents 59% of the resident population would bring the
total number to 479,870. This estimation includes two major caveats that could potentially have
correcting effects: it assumes all voters who turned out for the elections live in the Bekaa or at least
have residences in the Bekaa; and it assumes all registered voters who did not vote do not live in the
Bekaa. Still the inaccuracies inherent in using voters’ turnout numbers as a basis for population
estimates are too substantial for this method to be viable.
A limited population survey to estimate the number of people residing in the Bekaa is being presently
conducted. Starting from the beginning of March 2013, a detailed questionnaire is being sent to as
many municipalities as possible in the study area. A copy of the questionnaire is included in Appendix A
(Table A5). In this questionnaire, the municipalities are asked to report the numbers of registered
people, as well as the number of residents in the city or village, the number of houses, hospitals,
schools, business shops, workshops, etc. As many of the localities are considered to be a summer
destination, the number of residents during the summer season will be reported. The questionnaire also
asks about the water sources of the community, the current method of wastewater disposal, and the
status of the existing sewer system (in case one exists). Once gathered, this information, along with the
figures provided by the CAS for the Zahle localities surveyed will be used as a benchmark to check the
population estimates and projections used in the other studies and found in the electoral lists, select
appropriate population figures, and infer suitable growth rates.
2.2 Population Growth
In the absence of relevant information that can be used to realistically predict population estimates
taking into account population movements and emigration as well as natural population growth, the
following rates have been used for other studies in Lebanon:
Population Annual Growth Rate
<1000 2.0%
1,000 to 5,000 2.15%
5,000 to 10,000 2.25%
>10,000 2.35%
These values are however higher than the flat rate of 1.75% adopted by the NWSS, and the BWE
Business Plan. In order to stay in line with the NWSS and the BWE, this growth rate value will be
adopted at this stage. However, once the results of the limited population survey and the additional
information requested from the CAS become available, this value will be reassessed and, if needed, a
new growth rate value adopted, in agreement with the BWE.
A report including all the population data gathered, projections, and recommended population estimates
will be issued at the end of May and submitted for approval.

WATER SUPPLY AND WASTEWATER SYSTEMS MASTER PLAN FOR THE BWE INCEPTION REPORT P-1211
MARCH 2013 PAGE 6 OF 67
INC
EP
TIO
N R
EP
OR
T
3 WATER MANAGEMENT
3.1 Water sources
The present master plan aims at presenting a scheme where a reliable water supply is provided to
residents within the BWE service area. To do so, all surface and ground water sources have to be taken
into account and their current exploitation scheme re-evaluated. A master plan that incorporates already
existing potable water systems and allocates water from appropriate surface or groundwater sources to
un-serviced or under-serviced areas will then be devised. Provisions shall be made in the master plan
to ensure that in each area an untapped water resource is still available after potable water allocation to
meet the irrigation water requirements that will be specified in the terms of reference of the irrigation
water master plan to be drafted as part of the current contract.
Information on water sources in Lebanon is scarce and inaccurate. According to the National Water
Sector Strategy (NWSS) prepared by the MEW in 2010-2011 the total flow in water courses is equal to
about 3,400 MCM for an average year, including the flow from both national and transboundary rivers.
The NWSS lists the following average flows in the Bekaa water courses:
TABLE 3.1: AVERAGE FLOWS IN THE BEKAA SURFACE WATER COURSES
Period
Average flows in water courses
(in MCM)
North Bekaa Central/South Bekaa
Entire year 480 830
May – October 240 240
July – October 155 115
September 38 27
The origin of these figures is unknown however it is worthwhile to note that the State and Trends of the
Lebanese Environment 2010 report gives an average annual volume of 275.54 MCM and 167.83 MCM
for the El-Assi and Litani rivers respectively, based on primary data obtained from the Litani River
Authority (LRA) from 2005 to 2009. These figures translate into a combined average annual volume of
443.37 MCM which is only about a third of the total average flow estimated by the MEW in its strategy.
Knowing that El-Assi and Litani rivers are by far the two main rivers in the Bekaa, a question mark
regarding the validity of all these figures has to be raised.
With the scarcity of surface water, the use of groundwater for water supply and irrigation has soared in
the last 20 years. Irrigation is the largest consumer of groundwater with about half the irrigation water
needs coming from wells. There are three types of wells in the Bekaa: public (registered wells under the
responsibility of the BWE); licensed private wells whose number keeps increasing continuously; and
illegal (undeclared) wells whose number is completely unknown, but thought to be in the several
thousands. The MEW Strategy lists the following values for the Bekaa:
TABLE 3.2: GROUNDWATER USE IN THE BEKAA
Type Number Water Use
Total yield (MCM/year) Water supply
(MCM/year) Irrigation
(MCM/year) Industry
(MCM/year)
Licensed private 2678 1.47 19.55 1.47 22.49
Illegal 4500 2.46 32.85 2.46 37.77
Public (registered) 135 55
A list of 140 wells owned by the BWE and 14 others owned by municipalities (or private) has been
provided, along with information regarding their coordinates, depth (varying from 20 to 670 m), pump
capacity, energy source, and status. Unfortunately, aside from a one-time reading for 20 of the 154
wells, no water flow information was provided.
A current project funded by UNDP entitled “Groundwater Assessment and Database” is being carried
out by the consortium ELARD-BURGEAP-IGIP-RIBEKA for the benefit of the MEW. It aims at
quantifying the national groundwater resources through a data collection and field assessment
campaign of groundwater resources across Lebanon. Both the LCWMC (Lebanese Center for Water
Management and Conservation) within the MEW and the ELARD have been contacted to obtain the
information collected to date for the Bekaa region. It was made clear though that the survey does not
cover illegal wells, and that the coverage of the registered private wells is not completely reliable as it
was very dependent on the well owner’s willingness to participate in the survey.
The major springs of the Bekaa are shown on the assets map in Figure 3.2 and on the Hydrological
Map in Appendix B. Information regarding flow rates is scarce, sporadic, and highly unreliable. Lately,
some information was obtained from the LRA regarding spring and river flows. The data is currently
being analysed and reduced.
A study entitled “Analyse des Stratégies et Prospectives de L’Eau au Liban” carried out for the UNEP-
Plan Bleu by Sélim Catafago and Bassam Jaber in 2001 gives the following figures for the available
quantities of water (excluding the Qaraoun lake):

WATER SUPPLY AND WASTEWATER SYSTEMS MASTER PLAN FOR THE BWE INCEPTION REPORT P-1211
MARCH 2013 PAGE 7 OF 67
INC
EP
TIO
N R
EP
OR
T
Lebanon - Average year 4.4 Billion m3 /year
Lebanon – Average year 1.13 Billion m3 for July to October
Bekaa – Average year 1.1 Billion m3/year
Bekaa – Average year 463.3 Million m3 for July to October
Lebanon – 10-yr drought year 2.7 Billion m3 /year
Lebanon – 10-yr drought year 0.7 Billion m3 /year for July to October
Bekaa - 10-yr drought year 405 Million m3
Bekaa - 10-yr drought year 286.6 Million m3 for July to October
*The source of this information is not included in the report.
The available quantity of water was described as the sum of the water from the springs exploited by the
administration, the river flows, and the groundwater pumped from public and private wells. It is
noteworthy that the figure for an average year in the Bekaa (1.1 Billion m3/year) is lower than the figure
provided by the NWSS as the flow in the Bekaa water courses alone (1.3 Billion m3/year).
The purpose of the Plan Bleu was to describe the prevailing situation, evaluate the steps carried out by
the Lebanese Government to address the problems and elaborate a new water strategy. It is not known
how much (or if any) of this study and its recommendations were taken into account by the recent
NWSS. For the purpose of this master plan, any data included in the report will be taken into
consideration. However, the strategy included in the report is considered to be superseded by the
NWSS.
3.2 Water needs
According to the 1982 National Waste Management Plan (CDM) water consumption rates were
projected to be equal to 320, 250, and 100L/capita per day for Beirut, Urban Areas, and Rural Areas,
respectively in 2000, and 350, 250, and 150 L/capita per day for Beirut, Urban Areas, and Rural Areas,
respectively in 2040. The MEW National Water Sector Strategy (NWSS) uses the following figures for a
moderate demand scenario in 2010:
160 L/capita/day for rural domestic demand;
180 L/capita/day for urban domestic demand;
30% of domestic demand for industrial demand (or 51 L/cap/d on average).
400 L/person/day for tourism demand;
9000 m3/ha/year for agriculture demand.
Their resulting total water demand forecasts for the moderate demand scenario (based on a moderate
population growth scenario) are as follows for the Bekaa:
493 MCM/yr for 2010 of which 405 MCM/yr for irrigation purposes (based on 45000 ha of irrigated
areas); and 612 MCM/yr for 2035.
In terms of water supply, it is listed at 409 MCM/yr for 2010, which results in a shortage of 84 MCM/yr.
About 50.3% of the 409 MCM/yr is supplied by surface water sources, 47.2% by groundwater sources,
and 2.5% by existing water storage.
The Plan Bleu (2001) gives different values for the Bekaa water shortages than the NWSS. According
to this report, the total yearly demand for the Bekaa is approximately 466 million m3 including potable
water, irrigation, and industry demands. The monthly distribution for water demand is tabulated (Table
A5), and the total demand for the dry months (July to October) adds up to 293 million m3. The water
demand was calculated based on the following assumptions: population of the Bekaa equal to 580000;
water consumption of 216 L/cap/day; total irrigated area equal to 33000 ha; irrigation water demand
equal to 8500 m3/ha/year; potable water system efficiency of 75%; and agricultural yield of 70%.
Comparing with the figures listed for the available water (which for the Bekaa apparently include the
yield from 4500 wells), the authors conclude that there is no shortage during a regular year and a 6.4
million m3 deficit only for the 10-year drought year. They acknowledge that the deficit is actually higher
since the potable water system efficiency is closer to 50% in reality. However since potable water in the
Bekaa only accounts for a small percentage of the water demand, their water shortages figures remain
much smaller than the ones currently listed by the MEW in their NWSS. Another discrepancy between
the two documents relates to the Bekaa total irrigated area: the Plan Bleu assumes there are 33000 ha
of irrigated land, while the NWSS bases its calculations on 45000 ha. This 12000 ha difference cannot
be explained by an extension of irrigated areas between 2001 and 2010.
In view of all these discrepancies, the water availability and demand figures will have to be validated
during the next phase of the study based on the population estimates, water demand, and actual
irrigated surface areas agreed upon with USAID and BWE. At this point, it is proposed to stay in line
with the recommendations of the latest BWE Business Plan. The latter gives the following range of
values for metered water usage in areas similar to those in Lebanon:
Based on the above mentioned data, the BWE decided to apply an aggregate norm for water demand
(i.e., no separate consideration is made for the different types of consumers), once connections are
metered and billed, of 180 l/c/d, which is the middle range of total values found in other similar
countries, but lower than the aggregate value of the NWSS which comes up to 221L/cap/day (domestic
and industrial). One of the reasons for this lower value being that the Business Plan aims at remaining
Household 90 – 120 L/cap/day
Commercial 25 – 30 L/cap/day
Institutional 15 – 20 L/cap/day
Industrial 30 – 40 L/cap/day
Total 160 – 210 L/cap/day

WATER SUPPLY AND WASTEWATER SYSTEMS MASTER PLAN FOR THE BWE INCEPTION REPORT P-1211
MARCH 2013 PAGE 8 OF 67
INC
EP
TIO
N R
EP
OR
T
conservative in terms of profitability and hence is concerned with not overstating sales once meters are
installed and billing is based on metered consumption.
Regarding irrigation, the current need will be evaluated based on the data collection and limited
stakeholders’ interviews that will be conducted as part of the present project. It is believed that once
meters are installed, farmers will not be using potable water for irrigation (as has been the case
sometimes so far) because of the prohibitive cost that would be incurred.
Concerning the projected urban domestic water demand over 25 years, the NWSS moderate scenario
gives the following values:
Year 2010 2015 2020 2025 2030 2035
Demand (L/cap/day) 180 174 167 176 185 195
The dip in the forecasted demand is a projected result of the water conservation measures to be
introduced (plumbing retrofits, high-efficiency toilets and showerheads, dual flush toilets, high-efficiency
cloth washers, complete retrofit of large commercial and industrial consumers, public awareness
campaigns, etc.) and a more conscious use of the water by the consumer after meters are installed.
Accordingly, in the present study the aggregate value for water demand for the year 2035 will be taken
as 195 L/cap/day at this stage, and corrected as needed based on the final adopted current water
demand figure.
3.3 Existing facilities
In 2010, the BWE has commissioned Liban Consult to undertake a complete inventory and field
evaluation of the assets under its jurisdiction (water transmission lines, pumping stations, water
treatment plants, chlorination systems, reservoirs, springs, and public wells) in view of preparing a state
of the art documentation of the water supply infrastructure including its valuation. The project, funded by
GIZ (German Agency for International Cooperation) covered 3000 km2 in surface area, 565 km of pipes,
and 461 facilities distributed as listed in Tables 3.3 and 3.4 below. In late February this database was
handed over to the Consultant who is currently assessing it as discussed in Chapter 6 of this report.
TABLE 3.3 SUMMARY OF BWE ASSETS
No. Designation Description Quantity
1 Ground water reservoirs Capacity from 25 to 6000 m3 215
2 Elevated tanks Capacity from 25 to 750 m3 27
3 Wells Depth from 20 to 500 m 150
4 Surface pumping stations Horizontal and VTP pumps 16
5 Transmission pipelines Ductile iron pipes DN 100 to 300 (in Km) 564.6
6 Water treatment plants Zahle and Falaoui 2
7 Water springs Natural springs 28
8 Chlorination systems 10 - 1000 g/h chlorinators 23
TABLE 3.4 DISTRIBUTION OF ASSETS PER ZONE (AS DEFINED BY BWE)
Location Divisions Wells Springs Water
treatment plants
Chlorination units
Pumping stations Reservoirs
Elevated tanks Total
Zahle
Zahle 8 3 1 1 2 11 0 26
Rayak 9 0 0 1 1 1 2 14
Chtoura 4 1 0 1 1 7 2 16
Baalbeck
Baalbeck 36 10 0 14 1 36 3 100
Deir Al Ahmar 6 5 0 1 1 29 0 42
Chmistar 9 0 1 0 2 32 1 45
North Bekaa
Laboue 16 1 0 3 1 21 2 44
Hermel 10 2 0 0 2 30 4 48
West Bekaa
Rachaya 21 0 0 0 0 14 4 39
Joub Jennine 16 5 0 0 2 14 6 43
Machghara 15 1 0 2 3 20 3 44
150 28 2 23 16 215 27 461
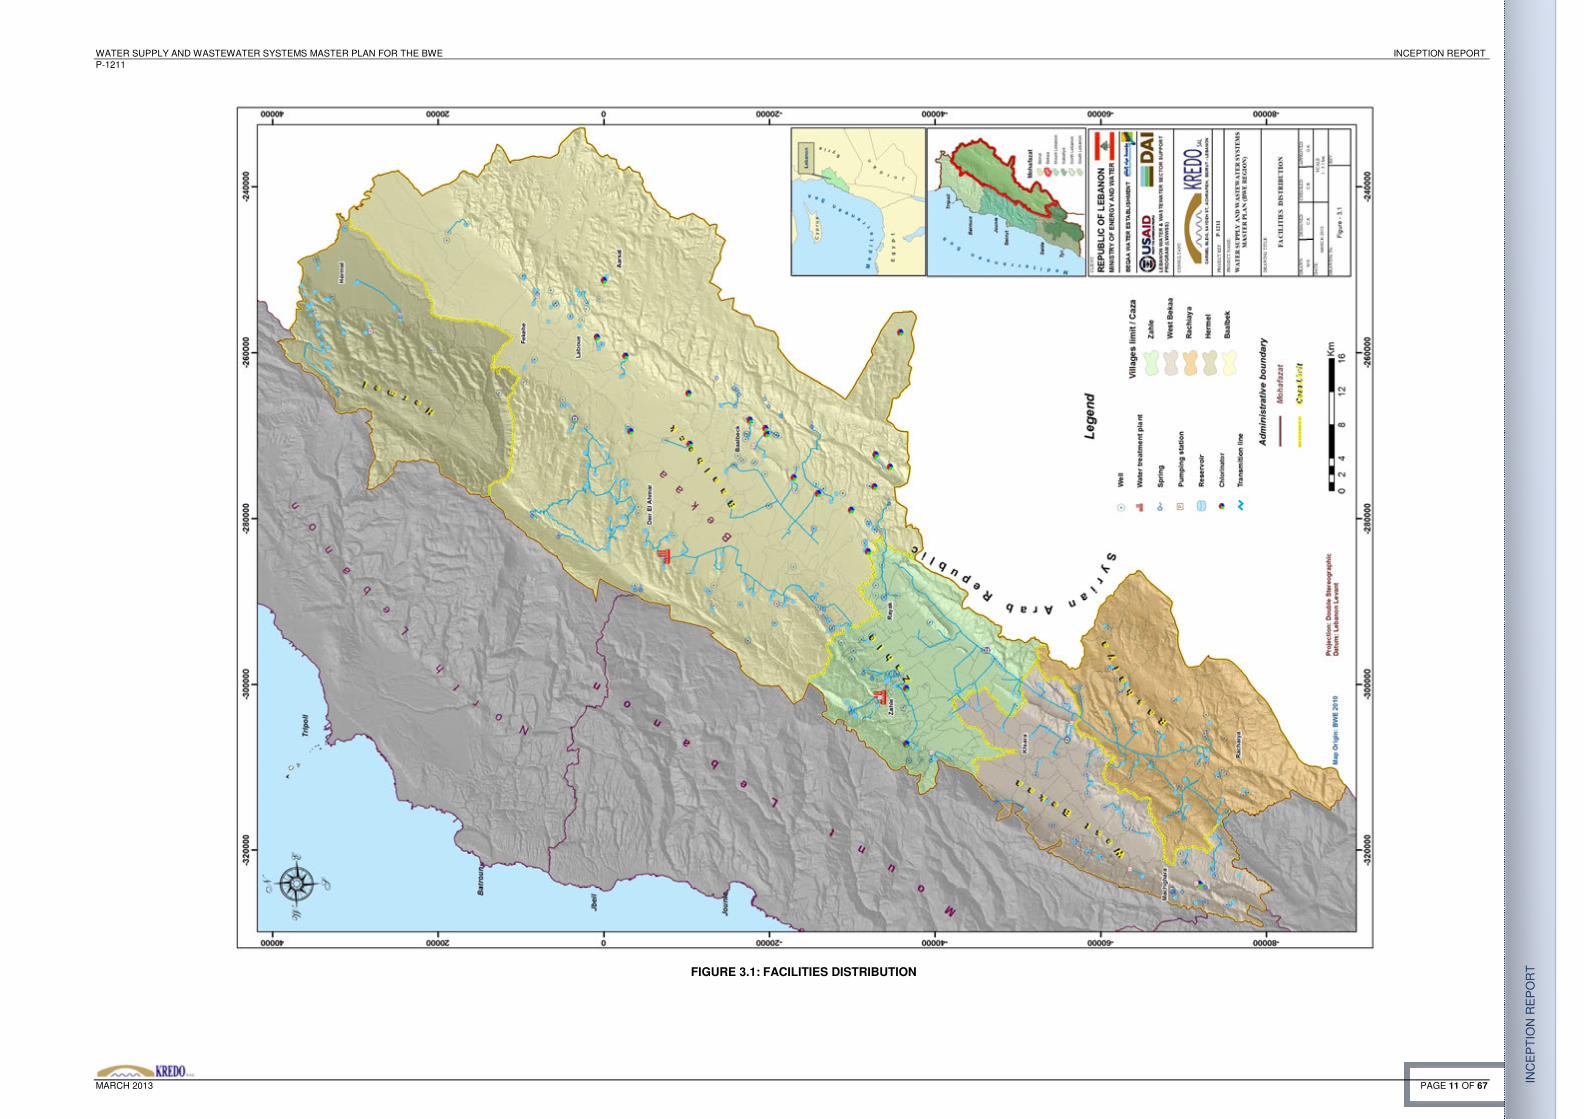
The information taken from the geodatabase is plotted on the Bekaa map in Figures 3.1 to 3.4. In order
to produce these figures, the BWE/GIZ database had to be reworked as the data was scattered and not
properly linked. The steps undertaken included: creating attribute tables by selecting fields of interest,
data classification, merging and verification of common data, appropriate linking of data to each other,
building templates, introducing symbology and shapefiles for all fields, etc.. Figure 3.1 shows the
locations of the various facilities, Figure 3.2 shows the conditions of the civil works for the wells and
springs as reported by BWE based on the field assessment, Figure 3.3 shows the water treatment
facilities along with the area of influence of the two existing water treatment plants, and Figure 3.4
shows the conditions of the civil works of the pumping stations and the chlorinators, also as reported by
WATER SUPPLY AND WASTEWATER SYSTEMS MASTER PLAN FOR THE BWE INCEPTION REPORT P-1211
MARCH 2013 PAGE 9 OF 67
INC
EP
TIO
N R
EP
OR
T
BWE based on the field assessment. The conditions were classified as either A (good), B (No data), C
(Worn), or D (Out of service). More details about the field assessment are included in Chapter 6.
Field visits to some of the facilities have been initiated (the two water treatment plants of Zahle and
Falaoui). The Consultant plans to select a few facilities of each type (wells, springs, reservoirs, elevated
tanks, chlorination units, and pumping stations) to visit. The selection will be based on criteria set once
the thorough review and evaluation of the BWE assets database, and especially the field reports for
each facility submitted by Liban Consult, are completed. For facilities that will not be visited, attempts
will be made to obtain any information missing in the database field report from the facility operator.
3.4 Additional existing studies
During the second week of March, the Consultant was able to secure from the MEW a set of plans
containing information about potable water networks in the Bekaa (Table 3.5). These plans, in either pdf
or AutoCad formats, however are not accompanied by any written documentation. Moreover, they are
not as-built drawings, but rather design drawings, and hence the actual status for these networks is not
known at this point. Efforts are currently underway to transform the information contained in these plans
into a format usable for this master plan, and to combine them into a single, coherent, and
comprehensive database. This task is expected to consume a substantial amount of time. Once
completed, validation of the contained information will have to be undertaken with the help of the BWE
in order to assess the status of each network (already built, planned to be built, or design abandoned).
TABLE 3.5: PLANS RECEIVED FROM MEW CONCERNING POTABLE WATER PROJECTS
Project Description Consultant
ETUDES DES SYSTEMES D'EAU POTABLE CAZAS DE BAALBECK - EL HERMEL Included villages: information not processed yet
Dar Al Handasah
N.T. (1999)
ALIMENTATION EN EAU POTABLE DE LA BEKAA OUEST: Included villages: Er Rafid, Er Raouda, Khirbet Rouha, Saghbine, Saghbine - Kefraya, Saouiri, Sohmor, Soultane Yaacoub Et Tahta - Haouch El Harime, Sultane Yaacoub El Faouqa - Aazze, Sultane Yaacoub El Faouqa - Sultane Yaacoub El Faouqa, Aazze - Joubb Jannine, Soultan Yaacoub El Faouqa, Deir Tahnich , Dahr El Ahmar, Yohmor El Beqaa, Ain Ez Zarka-Dahr Miri, Zillaya, Tell Znoub, Aana-Ammiq, Aana-Kefraya, Ammiq, Aana, Aanjar- El Khiara, Aazze, Aazze - Dahr El Ahmar, Dahr El Ahmar, Ain Et Tine, Aita El Foukhar, Pompage Aitanit -Regional Aitanit, Regional Aitanit -Regional Saghbine, Aanjar - El Marj, Ain Aarab, Baaloul, El Bire, Ed Dakoue, De Lala, Majdel Aanjar, Es Salamiye - Er Rachidiye, Tell Ez Zezea, Chamsine - Aanjar, Chamsine - Aanjar, El Khiara, Soultan Yaacoub El Tahta, Deir Ain Ej Jaouze, Kamed El Loz, Kefraya, Kfardenis, Libbaya, Machghara - Maidoun, Aanjar - Manara, Manara - Sultan Yaaqoub El Faoqa, El Marj, Mdouka, Bab Marea, El Mhaidthe, Dahr Miri - Aitanit, Dahr Miri - Machghara, Dahr Miri - Qelia, Dahr Miri - El Qaraaoun Aintanit, El Manara, Mazraat Souairi, Majdel Aanjar - Tell Ez Zaazea, Khribet Qanafar, El Qaraaoun, El Qaraaoun - Lala, El Qaraaoun - El Qaraaoun, Qelia
BTD (1997)
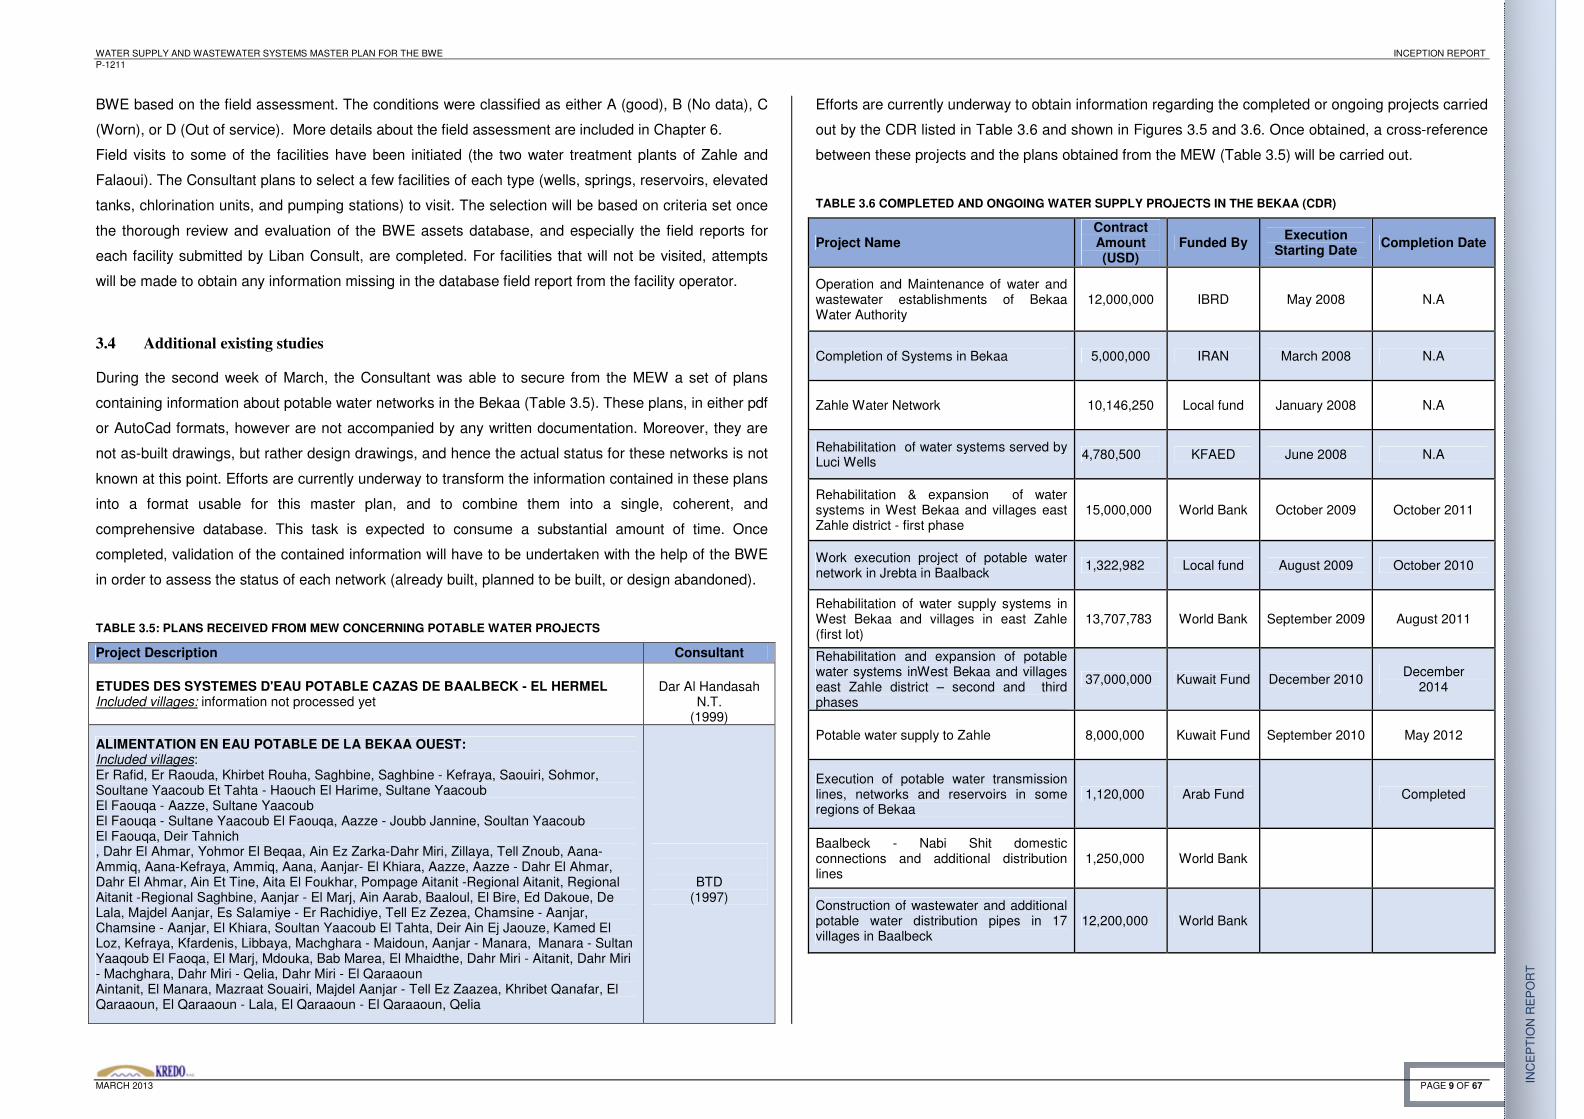
Efforts are currently underway to obtain information regarding the completed or ongoing projects carried
out by the CDR listed in Table 3.6 and shown in Figures 3.5 and 3.6. Once obtained, a cross-reference
between these projects and the plans obtained from the MEW (Table 3.5) will be carried out.
TABLE 3.6 COMPLETED AND ONGOING WATER SUPPLY PROJECTS IN THE BEKAA (CDR)
Project Name Contract Amount (USD)
Funded By Execution
Starting Date Completion Date
Operation and Maintenance of water and wastewater establishments of Bekaa Water Authority
12,000,000 IBRD May 2008 N.A
Completion of Systems in Bekaa 5,000,000 IRAN March 2008 N.A
Zahle Water Network 10,146,250 Local fund January 2008 N.A
Rehabilitation of water systems served by Luci Wells 4,780,500 KFAED June 2008 N.A
Rehabilitation & expansion of water systems in West Bekaa and villages east Zahle district - first phase
15,000,000 World Bank October 2009 October 2011
Work execution project of potable water network in Jrebta in Baalback 1,322,982 Local fund August 2009 October 2010
Rehabilitation of water supply systems in West Bekaa and villages in east Zahle (first lot)
13,707,783 World Bank September 2009 August 2011
Rehabilitation and expansion of potable water systems inWest Bekaa and villages east Zahle district – second and third phases
37,000,000 Kuwait Fund December 2010 December 2014
Potable water supply to Zahle 8,000,000 Kuwait Fund September 2010 May 2012
Execution of potable water transmission lines, networks and reservoirs in some regions of Bekaa
1,120,000 Arab Fund Completed
Baalbeck - Nabi Shit domestic connections and additional distribution lines
1,250,000 World Bank
Construction of wastewater and additional potable water distribution pipes in 17 villages in Baalbeck
12,200,000 World Bank
WATER SUPPLY AND WASTEWATER SYSTEMS MASTER PLAN FOR THE BWE INCEPTION REPORT P-1211
MARCH 2013 PAGE 10 OF 67
INC
EP
TIO
N R
EP
OR
T
Project Name Contract Amount (USD)
Funded By Execution Starting Date
Completion Date
Construction of wastewater and additional potable water distribution pipes in Baalebeck and Aaamshki
11,700,000 World Bank Completed
North Baalbeck + potable water supply - lot I & II 13,000,000 Local fund
Drilling and Equipping of water wells in Bekaa, South, Douier and Qlaile
Water supply for Yammouneh: dam + water supply pipes + water distribution pipes + 23 reservoirs + 2 artesian wells
11,900,000 IDB
Water supply for Oyoun Orghoch: water supply pipes + water distribution pipes + 18 reservoirs
7,800,000 IDB Completed
Baalbeck- Nabi Shit potable water supply & Baalbeck wastewater network 32,000,000 World Bank Completed
Execution of distribution lines and additional potable networks and domestic connections in Baalbeck, khodr , nabi shit and kherbe
4,900,000 IBC
Domestic Connections for regions covered by Yammouneh – Ouyoun orghosh potable water systems
6,500,000 Local fund Completed
Shmistar potable water supply 4,500,000 Local fund
Al- Yammouneh infrastructure: This project includes the construction of potable water supply and wastewater networks, in addition to a wastewater treatment plant.
3,960,000 IDB
Execution of irrigation works in Hermel region 1,000,000 Kuwait Fund
Installation of Potable water conveyer lines to Al-Bustan and Al- Harf 2,000,000 Kuwait Fund
Habilitation and expansion of potable water systems in Bekaa governorate ( North- West Bekaa)
13,400,000 Local fund
Rehabilitation of Water Networks in West Bekaa & villages in the East of Zahle and Rashaya Lot B & C
37,000,000 Kuwait Fund Planned Unknown
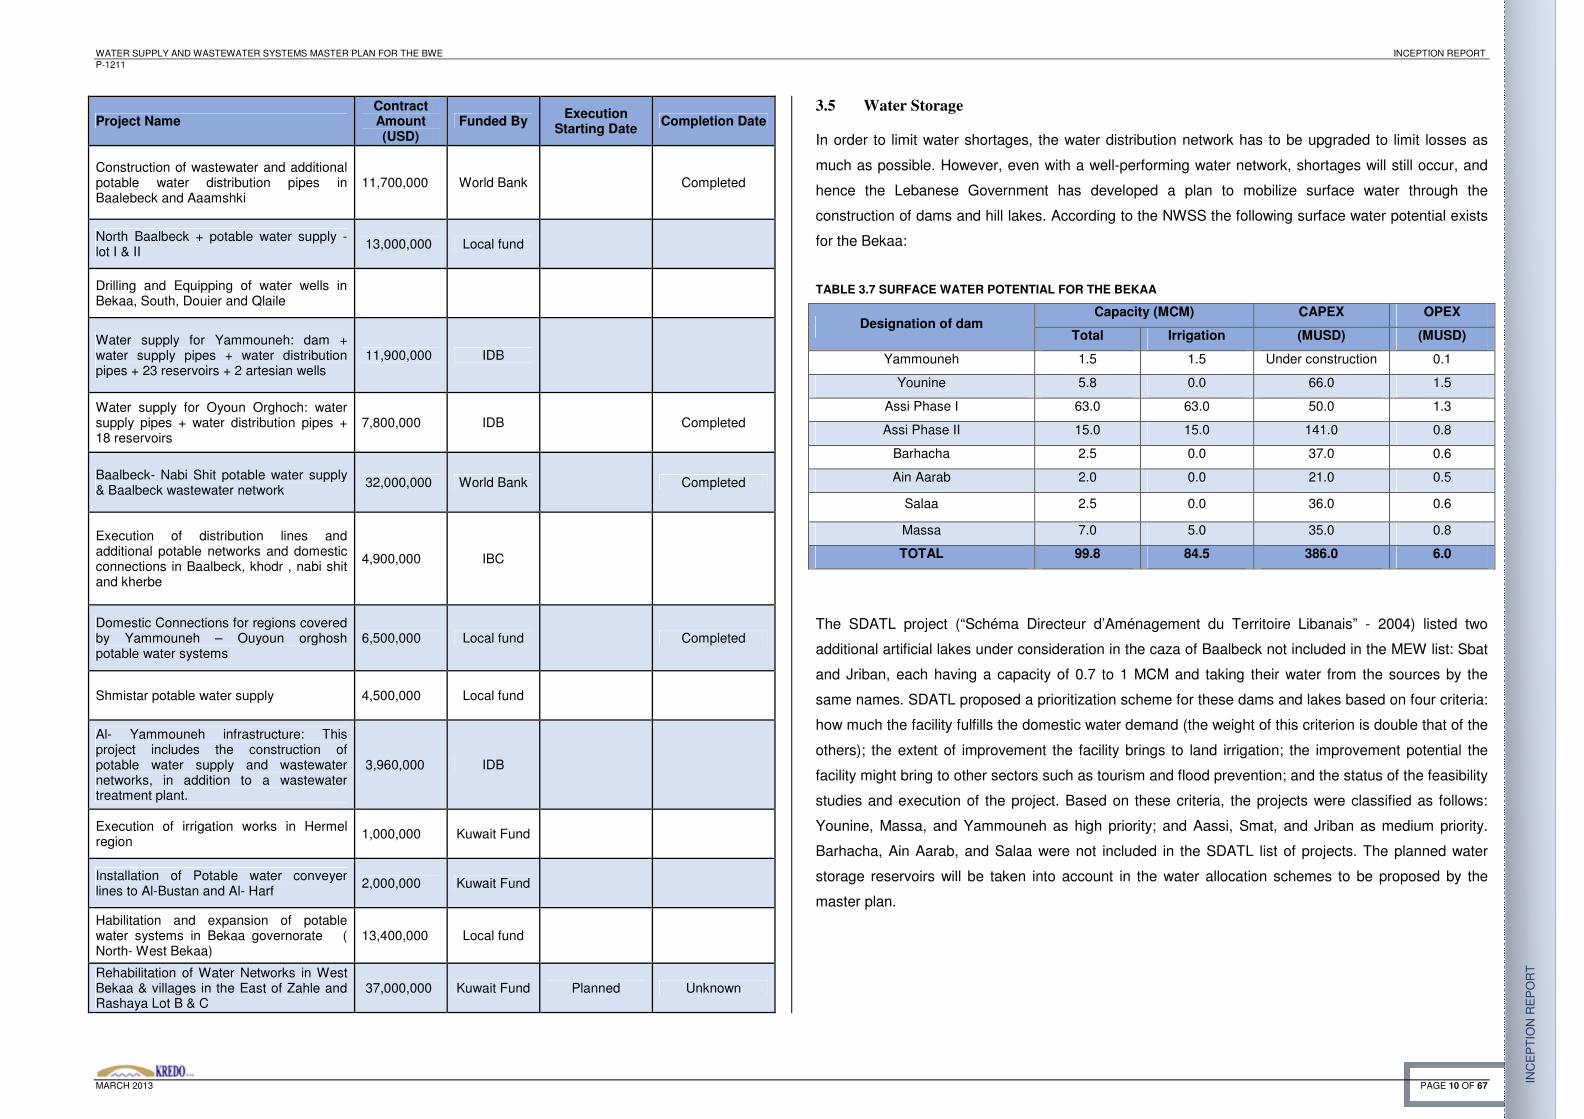
3.5 Water Storage
In order to limit water shortages, the water distribution network has to be upgraded to limit losses as
much as possible. However, even with a well-performing water network, shortages will still occur, and
hence the Lebanese Government has developed a plan to mobilize surface water through the
construction of dams and hill lakes. According to the NWSS the following surface water potential exists
for the Bekaa:
TABLE 3.7 SURFACE WATER POTENTIAL FOR THE BEKAA
Designation of dam Capacity (MCM) CAPEX OPEX
Total Irrigation (MUSD) (MUSD)
Yammouneh 1.5 1.5 Under construction 0.1
Younine 5.8 0.0 66.0 1.5
Assi Phase I 63.0 63.0 50.0 1.3
Assi Phase II 15.0 15.0 141.0 0.8
Barhacha 2.5 0.0 37.0 0.6
Ain Aarab 2.0 0.0 21.0 0.5
Salaa 2.5 0.0 36.0 0.6
Massa 7.0 5.0 35.0 0.8
TOTAL 99.8 84.5 386.0 6.0
The SDATL project (“Schéma Directeur d’Aménagement du Territoire Libanais” - 2004) listed two
additional artificial lakes under consideration in the caza of Baalbeck not included in the MEW list: Sbat
and Jriban, each having a capacity of 0.7 to 1 MCM and taking their water from the sources by the
same names. SDATL proposed a prioritization scheme for these dams and lakes based on four criteria:
how much the facility fulfills the domestic water demand (the weight of this criterion is double that of the
others); the extent of improvement the facility brings to land irrigation; the improvement potential the
facility might bring to other sectors such as tourism and flood prevention; and the status of the feasibility
studies and execution of the project. Based on these criteria, the projects were classified as follows:
Younine, Massa, and Yammouneh as high priority; and Aassi, Smat, and Jriban as medium priority.
Barhacha, Ain Aarab, and Salaa were not included in the SDATL list of projects. The planned water
storage reservoirs will be taken into account in the water allocation schemes to be proposed by the
master plan.
WATER SUPPLY AND WASTEWATER SYSTEMS MASTER PLAN FOR THE BWE INCEPTION REPORT P-1211
MARCH 2013 PAGE 11 OF 67
INC
EP
TIO
N R
EP
OR
T
FIGURE 3.1: FACILITIES DISTRIBUTION

WATER SUPPLY AND WASTEWATER SYSTEMS MASTER PLAN FOR THE BWE INCEPTION REPORT P-1211
MARCH 2013 PAGE 12 OF 67
INC
EP
TIO
N R
EP
OR
T
FIGURE 3.2: WELLS AND SPRINGS CONDITION

WATER SUPPLY AND WASTEWATER SYSTEMS MASTER PLAN FOR THE BWE INCEPTION REPORT P-1211
MARCH 2013 PAGE 13 OF 67
INC
EP
TIO
N R
EP
OR
T
FIGURE 3.3: WATER TREATMENT FACILITIES

WATER SUPPLY AND WASTEWATER SYSTEMS MASTER PLAN FOR THE BWE INCEPTION REPORT P-1211
MARCH 2013 PAGE 14 OF 67
INC
EP
TIO
N R
EP
OR
T
FIGURE 3.4: PUMPING STATIONS AND CHLORINATORS CONDITION

WATER SUPPLY AND WASTEWATER SYSTEMS MASTER PLAN FOR THE BWE INCEPTION REPORT P-1211
MARCH 2013 PAGE 15 OF 67
INC
EP
TIO
N R
EP
OR
T
FIGURE 3.5: WATER SUPPLY COMPLETED $ ONGOING PROJECTS FROM CDR PROGESS REPORT - 2012
FIGURE 3.6: WATER SUPPLY PROJECTS UNDER PREPARAION FROM CDR PROGESS REPORT - 2012

WATER SUPPLY AND WASTEWATER SYSTEMS MASTER PLAN FOR THE BWE INCEPTION REPORT P-1211
MARCH 2013 PAGE 16 OF 67
INC
EP
TIO
N R
EP
OR
T
4 WASTEWATER MANAGEMENT
4.1 Wastewater Flow
In the absence of measurements concerning the exact quantities of sewage flows which vary
substantially with the time of the day, of the week, and of the year the estimation of the sewage flow to
be adopted in the current study for the 2035 horizon year will be based on estimates of water
consumptions, as has been the case for previous similar studies in Lebanon. Usually, the amount of
generated wastewater is considered to be 85% of the domestic water consumption, with 10% added to
account for infiltration, and the total population used to calculate it is the actual population (household
and institutional) multiplied by a population equivalent factor in order to take into account commercial
and light industrial activities. Hence the wastewater generation rate proposed at this stage is 115
L/capita per day (based on an average domestic and institutional water demand rate of 123 L/capita per
day). If the final adopted water demand value is modified, this value will be modified accordingly. It is
worth noting that according to the list provided by the BWE regarding their existing or planned
wastewater treatment plants (Section 4.2 and Table 4.4), the value used for design varied between 68
and 182 L/capita per day.
4.2 Existing and Planned Wastewater Treatment Plants
In 1982, Camp Dresser & McKee Inc. (CDM) prepared the National Waste Management Plan for CDR,
which included a master plan for wastewater management for the entire country. The recommended
plan involved a staged approach aimed at achieving improvements to existing wastewater collection
systems and construction of collection systems for selected unsewered communities in order to reduce
environmental pollution and protecting watersheds. The recommended works included seven regional
coastal systems providing wastewater disposal through sea outfalls and 65 inland systems providing
secondary treatment.
In 1994, a pre-feasibility study entitled “Lebanon’s Staged Wastewater Program” was conducted by
Khatib & Alami for the Ministry of Environment with the aim of preparing a phased program for the
development of wastewater facilities throughout Lebanon. The treatment requirements were set out as
follows. For coastal areas, preliminary treatment should be provided with disposal of the pretreated
effluent through long sea outfalls. For inland areas, a number of possible treatment processes
depending on the size of the community to be served are identified. In effect, this study was an update
of the 1982 Master Plan, and aside from an updated population estimate, the most significant change
from the 1982 Master Plan was the higher priority given to the design and construction of sea outfalls in
order to protect the coastal area.
As part of its ongoing effort to plan for wastewater treatment plants, the Sector Implementation Unit
(SIU) which was part of the Ministry of Hydraulic and Electrical Resources (MRHE later changed to
MEW) issued in June 2000 a list of all the wastewater treatment plants planned, designed, or executed
in Lebanon along with its population equivalents, capacity, design horizon, projected cost, design firm,
and status of the project. The lists for the Bekaa are included in Appendix A.
The DAHNT study mentioned in section 2.1 above developed a scheme for wastewater collection and
conveyance and for plant locations for all the Bekaa regions. The study proposed two solutions: the first
consisted of providing a treatment plant for each village or for a number of neighboring villages; and the
second grouped an important number of villages in one plant. This scenario led to a decrease in the
number of treatment plants but to an increase in the network lengths. Both scenarios used either
stabilization ponds or extended aeration in terms of treatment method. The tables listing both proposals
are included in Appendix A.
For the last 19 years, the CDR and MEW have largely been following the recommendations of the 1982
and 1994 master plans as well as the SIU list and hence implementing wastewater treatment and
disposal projects according to the established schemes.
An extensive data collection campaign has been initiated to gather all information regarding the past,
current and planned wastewater treatment and sewer network projects in the Bekaa. The main sources
of information were the Council for Development and Reconstruction (CDR), the Ministry of Energy and
Water (MEW), and the Bekaa Water Establishment (BWE) who concentrate most of the wastewater
projects. Other entities involved in the field include a few nonprofit organizations, who are working in
collaboration with local municipalities to design and construct small to medium wastewater treatment
plants using international funding.
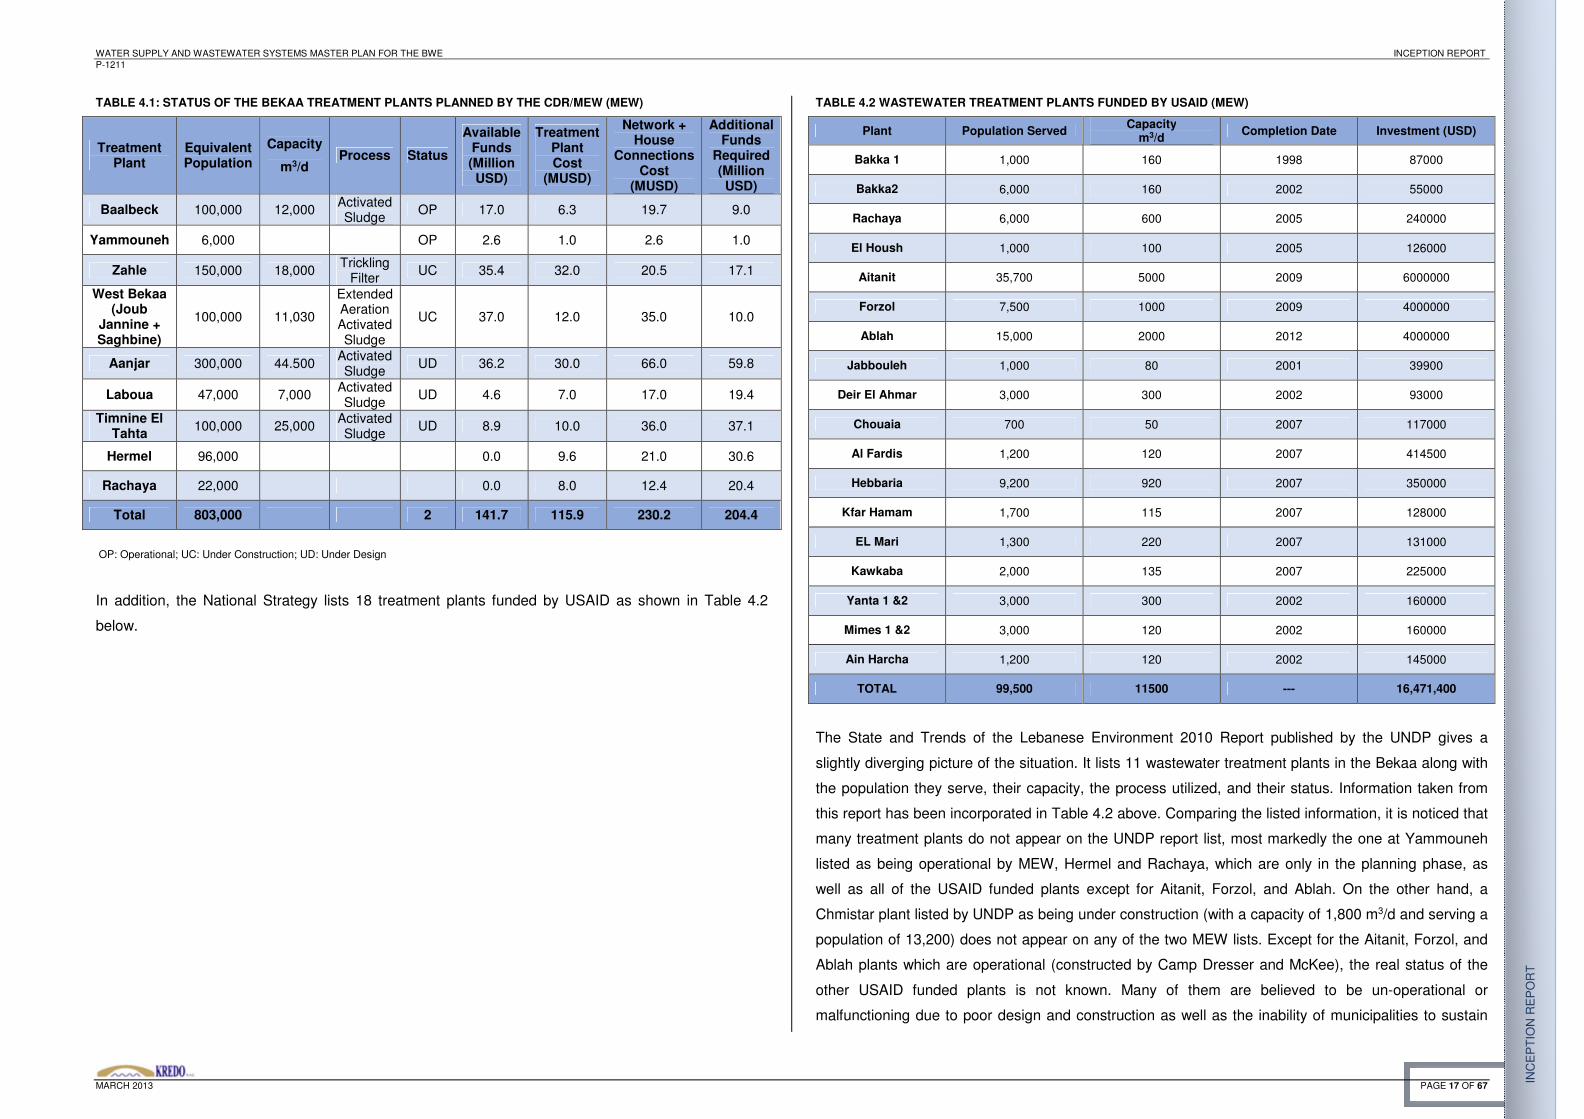
According to the National Strategy for the Wastewater Sector issued by the MEW in October 2012,
seven treatment plants have obtained partial funding in the Bekaa and hence are at various stages of
completion, while two plants require complete funding. These are listed in Table 4.1 below. The total
cost of each plant is the sum of the available funds and the additional required funds, and includes the
cost of the treatment plant, as well as that of the corresponding sewer network and house connections.
WATER SUPPLY AND WASTEWATER SYSTEMS MASTER PLAN FOR THE BWE INCEPTION REPORT P-1211
MARCH 2013 PAGE 17 OF 67
INC
EP
TIO
N R
EP
OR
T
TABLE 4.1: STATUS OF THE BEKAA TREATMENT PLANTS PLANNED BY THE CDR/MEW (MEW)
Treatment Plant
Equivalent Population
Capacity
m3/d Process Status
Available Funds (Million USD)
Treatment Plant Cost
(MUSD)
Network + House
Connections Cost
(MUSD)
Additional Funds
Required (Million USD)
Baalbeck 100,000 12,000 Activated Sludge OP 17.0 6.3 19.7 9.0
Yammouneh 6,000 OP 2.6 1.0 2.6 1.0
Zahle 150,000 18,000 Trickling Filter UC 35.4 32.0 20.5 17.1
West Bekaa (Joub
Jannine + Saghbine)
100,000 11,030
Extended Aeration Activated Sludge
UC 37.0 12.0 35.0 10.0
Aanjar 300,000 44.500 Activated Sludge UD 36.2 30.0 66.0 59.8
Laboua 47,000 7,000 Activated Sludge UD 4.6 7.0 17.0 19.4
Timnine El Tahta 100,000 25,000 Activated
Sludge UD 8.9 10.0 36.0 37.1
Hermel 96,000 0.0 9.6 21.0 30.6
Rachaya 22,000 0.0 8.0 12.4 20.4
Total 803,000 2 141.7 115.9 230.2 204.4
OP: Operational; UC: Under Construction; UD: Under Design
In addition, the National Strategy lists 18 treatment plants funded by USAID as shown in Table 4.2
below.
TABLE 4.2 WASTEWATER TREATMENT PLANTS FUNDED BY USAID (MEW)
Plant Population Served Capacity m3/d Completion Date Investment (USD)
Bakka 1 1,000 160 1998 87000
Bakka2 6,000 160 2002 55000
Rachaya 6,000 600 2005 240000
El Housh 1,000 100 2005 126000
Aitanit 35,700 5000 2009 6000000
Forzol 7,500 1000 2009 4000000
Ablah 15,000 2000 2012 4000000
Jabbouleh 1,000 80 2001 39900
Deir El Ahmar 3,000 300 2002 93000
Chouaia 700 50 2007 117000
Al Fardis 1,200 120 2007 414500
Hebbaria 9,200 920 2007 350000
Kfar Hamam 1,700 115 2007 128000
EL Mari 1,300 220 2007 131000
Kawkaba 2,000 135 2007 225000
Yanta 1 &2 3,000 300 2002 160000
Mimes 1 &2 3,000 120 2002 160000
Ain Harcha 1,200 120 2002 145000
TOTAL 99,500 11500 --- 16,471,400
The State and Trends of the Lebanese Environment 2010 Report published by the UNDP gives a
slightly diverging picture of the situation. It lists 11 wastewater treatment plants in the Bekaa along with
the population they serve, their capacity, the process utilized, and their status. Information taken from
this report has been incorporated in Table 4.2 above. Comparing the listed information, it is noticed that
many treatment plants do not appear on the UNDP report list, most markedly the one at Yammouneh
listed as being operational by MEW, Hermel and Rachaya, which are only in the planning phase, as
well as all of the USAID funded plants except for Aitanit, Forzol, and Ablah. On the other hand, a
Chmistar plant listed by UNDP as being under construction (with a capacity of 1,800 m3/d and serving a
population of 13,200) does not appear on any of the two MEW lists. Except for the Aitanit, Forzol, and
Ablah plants which are operational (constructed by Camp Dresser and McKee), the real status of the
other USAID funded plants is not known. Many of them are believed to be un-operational or
malfunctioning due to poor design and construction as well as the inability of municipalities to sustain

WATER SUPPLY AND WASTEWATER SYSTEMS MASTER PLAN FOR THE BWE INCEPTION REPORT P-1211
MARCH 2013 PAGE 18 OF 67
INC
EP
TIO
N R
EP
OR
T
the financial and technical requirements of operation and maintenance (USAID- Comprehensive Sector
Analysis Report, 2011).
Two additional official sources of information regarding wastewater treatment plants obtained lately,
namely the 2012-2016 BWE Business Plan and the BWE Assets Assessment Database list the
following (Table 4.3 and 4.4):
TABLE 4.3: WASTEWATER TREATMENT PLANTS ACCORDING TO THE BWE 2012-2016 BUSINESS PLAN
Area Size
(Population Equivalent)
Design capacity
(m3/day) Status
Baalbeck 89,000 12,000 Construction Completed and Partial Operation and maintenance (CDR). Hand-over to BWE expected in June 2012 1)
Aitanit 35,700 5,000 Construction Completed and Handed Over to Municipality (funding from USAID)
Fourzol 7,400 1,000 Construction Completed and Handed Over to Municipality (funding from USAID)
Joubb Jannine 77,000 10,500 Under Construction/Take Over CDR 2014
Zahle 120,000 18,000 Under Construction
Saqhbin 4,100 530 Under Construction/Take Over CDR 2014
Majdal/Anjar 275,000 44,500 Planning stage, four systems
Laboueh 53,000 7,000 Under Construction
Rachaya 6,000 600 Under Construction
Chmistar 13,200 1,800 Under Construction
Ablah 14,630 2,000 Under Construction/Take Over 2014 (funding from USAID)
Yammouneh < 5,000 <500
Construction Completed and outsourcing of operation and maintenance (CDR) until March 2011
Outsourcing of operation and maintenance with funding by MEW between March 2011 and June 2012
Total 700,030 103,430 ---
WATER SUPPLY AND WASTEWATER SYSTEMS MASTER PLAN FOR THE BWE INCEPTION REPORT P-1211
MARCH 2013 PAGE 19 OF 67
INC
EP
TIO
N R
EP
OR
T
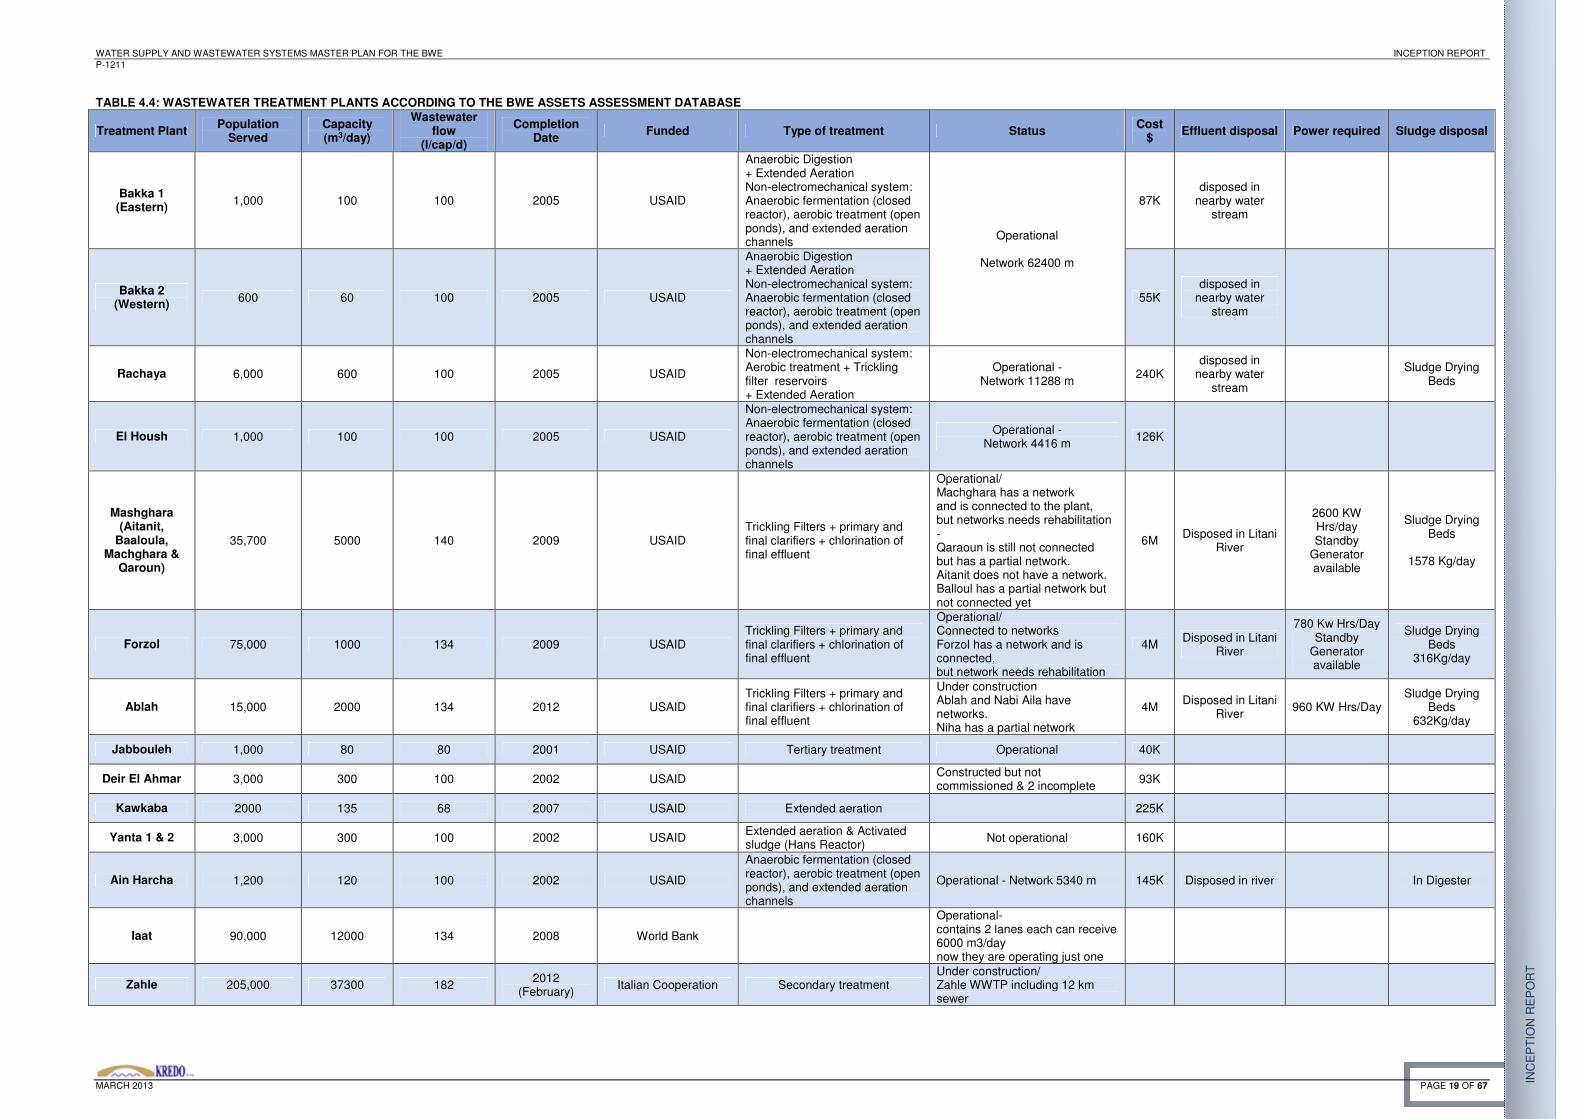
TABLE 4.4: WASTEWATER TREATMENT PLANTS ACCORDING TO THE BWE ASSETS ASSESSMENT DATABASE
Treatment Plant Population Served
Capacity (m3/day)
Wastewater flow
(l/cap/d)
Completion Date Funded Type of treatment Status Cost
$ Effluent disposal Power required Sludge disposal
Bakka 1 (Eastern) 1,000 100 100 2005 USAID
Anaerobic Digestion + Extended Aeration Non-electromechanical system: Anaerobic fermentation (closed reactor), aerobic treatment (open ponds), and extended aeration channels Operational
Network 62400 m
87K disposed in
nearby water stream
Bakka 2 (Western) 600 60 100 2005 USAID
Anaerobic Digestion + Extended Aeration Non-electromechanical system: Anaerobic fermentation (closed reactor), aerobic treatment (open ponds), and extended aeration channels
55K disposed in
nearby water stream
Rachaya 6,000 600 100 2005 USAID
Non-electromechanical system: Aerobic treatment + Trickling filter reservoirs + Extended Aeration
Operational - Network 11288 m
240K disposed in
nearby water stream
Sludge Drying Beds
El Housh 1,000 100 100 2005 USAID
Non-electromechanical system: Anaerobic fermentation (closed reactor), aerobic treatment (open ponds), and extended aeration channels
Operational - Network 4416 m 126K
Mashghara (Aitanit,
Baaloula, Machghara &
Qaroun)
35,700 5000 140 2009 USAID Trickling Filters + primary and final clarifiers + chlorination of final effluent
Operational/ Machghara has a network and is connected to the plant, but networks needs rehabilitation - Qaraoun is still not connected but has a partial network. Aitanit does not have a network. Balloul has a partial network but not connected yet
6M Disposed in Litani River
2600 KW Hrs/day Standby
Generator available
Sludge Drying Beds
1578 Kg/day
Forzol 75,000 1000 134 2009 USAID Trickling Filters + primary and final clarifiers + chlorination of final effluent
Operational/ Connected to networks Forzol has a network and is connected, but network needs rehabilitation
4M Disposed in Litani River
780 Kw Hrs/Day Standby
Generator available
Sludge Drying Beds
316Kg/day
Ablah 15,000 2000 134 2012 USAID Trickling Filters + primary and final clarifiers + chlorination of final effluent
Under construction Ablah and Nabi Aila have networks. Niha has a partial network
4M Disposed in Litani River 960 KW Hrs/Day
Sludge Drying Beds
632Kg/day
Jabbouleh 1,000 80 80 2001 USAID Tertiary treatment Operational 40K
Deir El Ahmar 3,000 300 100 2002 USAID Constructed but not commissioned & 2 incomplete 93K
Kawkaba 2000 135 68 2007 USAID Extended aeration 225K
Yanta 1 & 2 3,000 300 100 2002 USAID Extended aeration & Activated sludge (Hans Reactor) Not operational 160K
Ain Harcha 1,200 120 100 2002 USAID
Anaerobic fermentation (closed reactor), aerobic treatment (open ponds), and extended aeration channels
Operational - Network 5340 m 145K Disposed in river In Digester
Iaat 90,000 12000 134 2008 World Bank
Operational- contains 2 lanes each can receive 6000 m3/day now they are operating just one
Zahle 205,000 37300 182 2012 (February) Italian Cooperation Secondary treatment
Under construction/ Zahle WWTP including 12 km sewer
WATER SUPPLY AND WASTEWATER SYSTEMS MASTER PLAN FOR THE BWE INCEPTION REPORT P-1211
MARCH 2013 PAGE 20 OF 67
INC
EP
TIO
N R
EP
OR
T
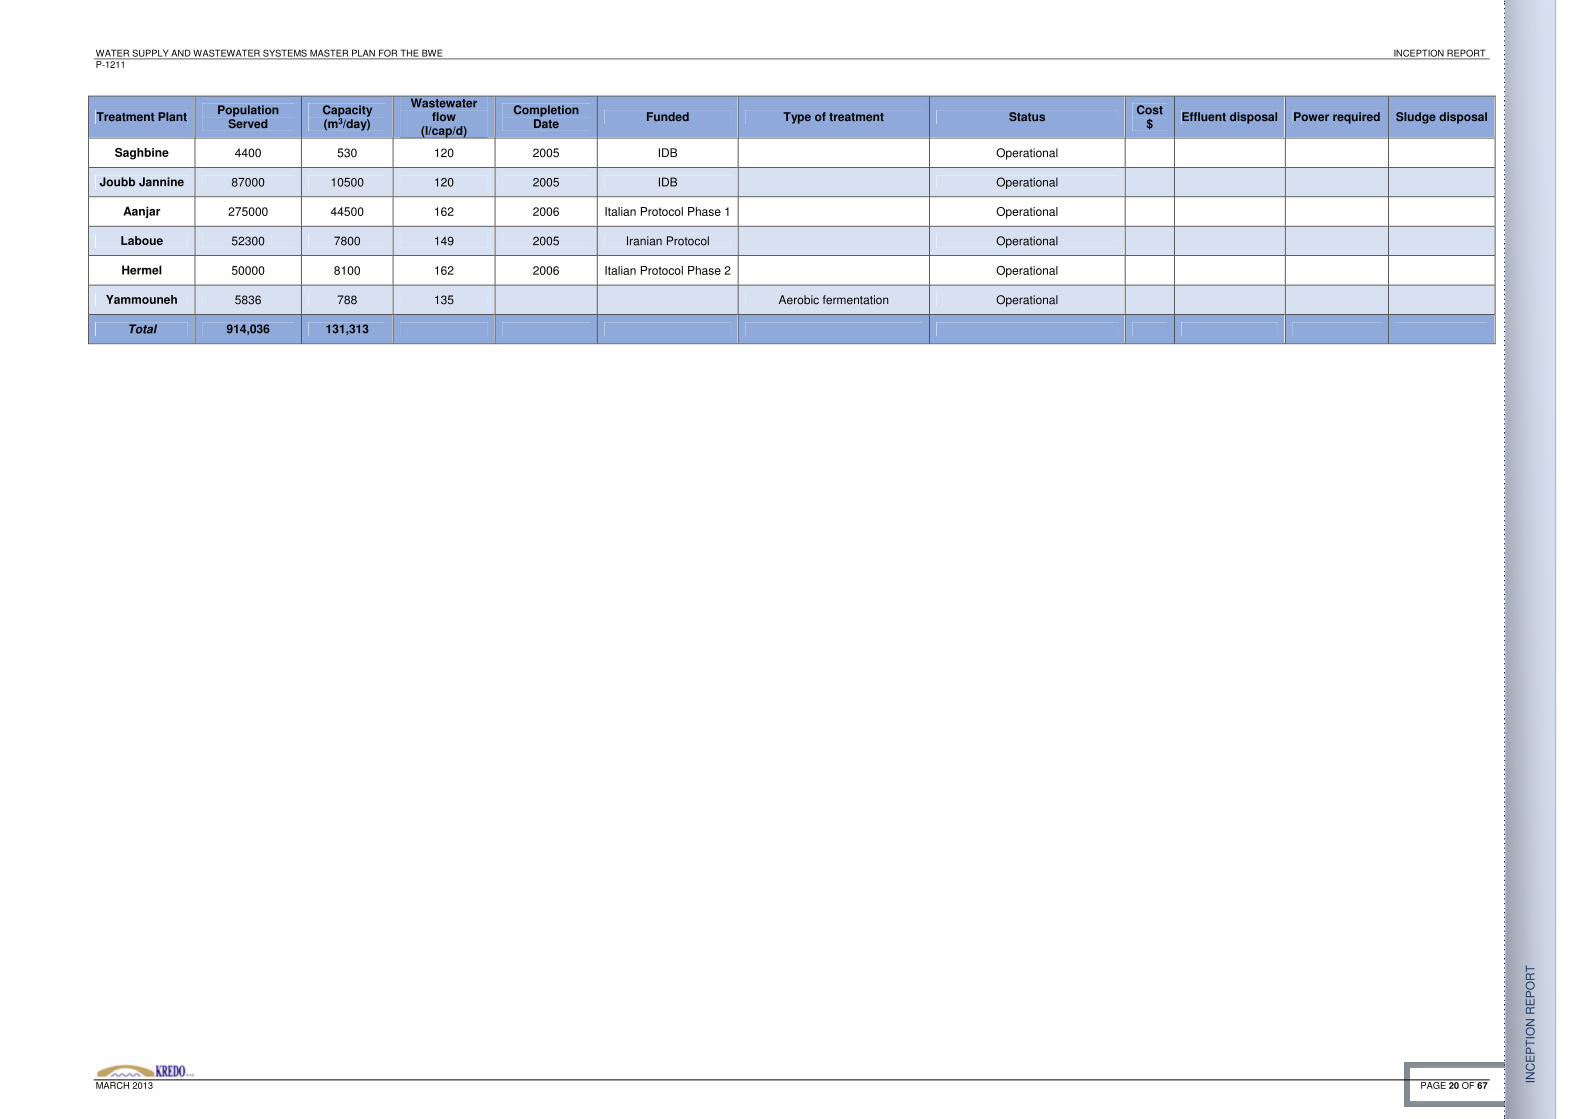
Treatment Plant Population Served
Capacity (m3/day)
Wastewater flow
(l/cap/d)
Completion Date
Funded Type of treatment Status Cost $
Effluent disposal Power required Sludge disposal
Saghbine 4400 530 120 2005 IDB Operational
Joubb Jannine 87000 10500 120 2005 IDB Operational
Aanjar 275000 44500 162 2006 Italian Protocol Phase 1 Operational
Laboue 52300 7800 149 2005 Iranian Protocol
Operational
Hermel 50000 8100 162 2006 Italian Protocol Phase 2 Operational
Yammouneh 5836 788 135 Aerobic fermentation Operational
Total 914,036 131,313

WATER SUPPLY AND WASTEWATER SYSTEMS MASTER PLAN FOR THE BWE INCEPTION REPORT P-1211
MARCH 2013 PAGE 21 OF 67
INC
EP
TIO
N R
EP
OR
T
Figure 4.1 shows the location of the wastewater treatment plants listed in the BWE database. Although
both tables 4.3 and 4.4 are issued by the BWE within the same time frame, the following discrepancies
are noted:
Bakka, El Housh, Jabbouleh, Deir El Ahmar, Kawkaba, Yanta, Ain Harcha, Hermel
Not mentioned in the Business Plan
Rachaya, Saghbine, Joubb Jannine, Laboue
Completion date: Plan: Under Construction Database: 2005
Zahle
Population served: Plan: 120,000 Database: 205,000 Capacity: Plan: 18,000 m3/day Database: 37,300 m3/day
Forzol: Population served: Plan: 7,400 (equivalent) Database: 75,000
Chmistar:
Not mentioned in Database
Anjar Completion date: Plan: Under Planning Database: 2006
As part of the current project, site visits have already been conducted by a KREDO engineer
(accompanied by the plant operator) at a number of wastewater treatment plants, namely Forzol, Iaat,
Ablah, Machghara, Saghbine, Joubb Jannine, Rachaya, Bakka (1 & 2), and Yanta (1 & 2). For each
plant collected information is summarized in a table and pictures are taken. This information along with
an evaluation of the plants will be included in the next report entitled “Wastewater System Assessment
Report”. Current efforts are concentrated on obtaining the design reports for all recent plants funded by
USAID and designed by CDM as well as all the documentation regarding the wastewater treatment
projects (completed or ongoing) carried out by the CDR (Table 4.5 and Figure 4.2). Partial information,
in the form of economic feasibility studies or environmental impact analysis studies, regarding some of
these projects, namely the Western Bekaa, Anjar, Qaraoun, and Hermel, has already been secured and
is currently under evaluation.
TABLE 4.5 COMPLETED AND ONGOING WASTEWATER PROJECTS IN THE BEKAA (CDR)
Project Name Contract Amount
(Million USD)
Funded by
Execution Starting Date
Completion Date
Construction of treatment plant and wastewater networks in central and northern Bekaa in the Litani basin
10.50 AFESD October 2013 December 2015
Construction of treatment plant and wastewater networks in Anjar, Majdal Anjar, Bar Elias, Mraijet, Marj, Chtoura and neighboring areas
41 Italian Protocol December 2015
December 2018
Completion of wastewater project in West Bekaa region 27 IBD December
2012 December
2014
Construction of treatment plant and wastewater networks in Rachaya and neighboring areas
30 Kuwait Fund May 2015 December 2018
Construction of treatment plant and wastewater networks in Laboue and neighboring areas
4.50 Iranian Protocol January 2012 August 2014
Construction of treatment plant and collector networks in Hermel and neighboring areas
20 Italian Protocol December 2013 June 2016

WATER SUPPLY AND WASTEWATER SYSTEMS MASTER PLAN FOR THE BWE INCEPTION REPORT P-1211
MARCH 2013 PAGE 22 OF 67
INC
EP
TIO
N R
EP
OR
T
4.3 Additional existing studies
During the third week of March, the Consultant was able to secure from the MEW a set of plans
containing information about sewer networks in the Bekaa (Table 4.6). These plans, in either pdf or
AutoCAD formats, however are not accompanied by any written documentation. Moreover, they are not
as-built drawings, but rather design drawings, and hence the actual status for these networks is not
known at this point. Efforts are currently underway to transform the information contained in these plans
into a format usable for this master plan, and to combine them into a single, coherent, and
comprehensive database. This task is expected to consume a substantial amount of time. Once
completed, validation of the contained information will have to be undertaken with the help of the BWE
in order to assess the status of each network (already built, planned to be built, or design abandoned).
TABLE 4.6: PLANS RECEIVED FROM MEW CONCERNING SEWER NETWORK PROJECTS
Project Description Lot Consultant
ETUDES DES SYSTEMES D'EAU POTABLE ET DES EAUX USEES CAZAS DE BAALBECK - EL HERMEL
Dar Al Handasah N.T. (1997)
Included villages: BednayelBeit-Chama, El-Aaquiyeh Et Haouch-Er-Rafqa, Kfar-Dabach, Qsarnaba, Temnine-El-Faouqa, Temnine-El-Tahta 1
Boudai, El-Hadet, Kfardane Et Jebaa, Nabi-Rchadeh Et Tleileh, El-Aallaiq , Ras-En-Nabaa Et Saaideh, Taraya, Mazraat-Beit-Slim , Mrah-El-Jamal Mrah-Bou-Brahim Et Mrah-El 2
Mrah-El-Aouja, Baalbeck, Bechouat, Blaiqa, Bessailet-El-Faouqa Et Bessailet-Et-Tahta, Btedaai, Mazraat-Beit-El-Ghoussain, Chaat Et Es-Soueidiyeh, Chlifa, Deir-El-Ahmar, Ez-Zarayeb, Flaoui , El-Hafir Et Karm-El-Hafir, Mchaitiyeh , Mrah-Maroun Et Qornet-Beit-Habchi, Mrah-Es-Saiyed Et Mazraat-Beit-Matar, Mrah-Semaane, Qalileh, El-Qerrami, Rasm-El-Hadeth Et Es-Soueid, Mrah-Soukkar , Mrah-El-Aassi Et Barqa, Ez-Zrazir
3
Amhaz, Aarsal, El-Ain, Halbata, Harbata, Jdaideh, El-Moqraq, En-Nabi-Osmane -Caza De Baalbeck, En-Nouqra, El-Qaa, Ras-Baalbeck, Taoufiqiyeh, Zabboud , El-Kharayeb Et Ouadi-El-Aaoss, 4
El-Hermel, El-Kouakh, El-Mansoura, Qanafez , Haouchariyeh , Mrah-Ed-Dallil Et Ez-Zekbi, El Qasr Et Sahlat-El-May, Ouadi-Er-Ratl 5
Kfardane and Jebaa, Nabi-Rchadeh, Tleileh, Taraya 1 & 2
WEST BEKAA REGION - WATER AND WASTEWATER PROJECT Note: master plan without any detail regarding networks inside villages
BTD (1997)

WATER SUPPLY AND WASTEWATER SYSTEMS MASTER PLAN FOR THE BWE INCEPTION REPORT P-1211
MARCH 2013 PAGE 23 OF 67
INC
EP
TIO
N R
EP
OR
T
FIGURE 4.1: WASTEWATER TREATMENT PLANTS ACCORDING TO THE BWE ASSESTS ASSESSMENT DATABASE

WATER SUPPLY AND WASTEWATER SYSTEMS MASTER PLAN FOR THE BWE INCEPTION REPORT P-1211
MARCH 2013 PAGE 24 OF 67
INC
EP
TIO
N R
EP
OR
T
FIGURE 4.2: WASTEWATER COMPLETED, ONGOING &UNDER PREPARATION PROJECTS FROM CDR PROGRESS
REPORT – 2012

WATER SUPPLY AND WASTEWATER SYSTEMS MASTER PLAN FOR THE BWE INCEPTION REPORT P-1211
MARCH 2013 PAGE 25 OF 67
INC
EP
TIO
N R
EP
OR
T
5 IRRIGATION
5.1 Irrigation projects
The area under the jurisdiction of the BWE in terms of irrigation lies north of the Litani river basin,
namely the northern part of the caza of Baalbeck and the caza of Hermel. All the other Bekaa areas
located within the Litani river basin are under the responsibility of the Litani River Authority. Efforts are
currently underway to identify studies that have been completed or are ongoing concerning the irrigation
water sector in that area mainly from the CDR and the Ministry of Agriculture. The information obtained
to date from the BWE is sketchy and incomplete. It includes a set of plans either in Autocad or pdf
format, or as a hard copy. While these maps include the layout of the irrigation canals or transmission
pipes, they lack crucial information such as the flowrate, and in some instances the water sources.
1- Yammouneh irrigation scheme (Autocad): This project is completed and as-built drawings
are provided for the network in the following villages: Flawi, Harika, Jaafar, Mrah El Kach,
Mrah El Sayed, Zarayeb, Bsaily, and Chlifa. The plans show a large water reservoir. The
total length is 12,767m.
2- Laboue irrigation scheme (pdf): Plans lack details. Only position of canals is provided. The
status of the project is not known but it was apparently executed in 2003.
3- Ras El Ain irrigation scheme (Autocad): The project is complete and as-built drawings are
provided for three main canals in Kallout, Westani, and Shimali, along with the size of the
area irrigated by each canal in hectares. However the data is incomplete as no details for
the canals are included. The project was executed in 2011.
4- Jroud El Hermel (hardcopy): The project was executed in 1996, with irrigation canals from
the following water sources: Ain Deleb, Ain Houda, Ain Alhawzalani, Ain Al Bahsat, Ain
Kaykab, Nabaa Jourat Touton, Ouadi Al Jouze, Ain Al Bakhourat, and Ain Obeid for the
villages of: Almaabour, Ain El Jaouzeh, Kaykab, Al Safsaf, Al Wardat, Al Maaboura, Al
Hmaira, Ain Al Bakhourat, Wahiba, Al Njassa, Maabour, Ain Al Wadi, Mazraat AIn Obeid,
Karm Sbait, Maabour, Ain Al Sawda, Nabaa Aldibat, Ain Al Jarfat, Aaroubat Al Naanaa in
the Jroud El Hermel. Another part was executed in year 2000, with irrigation canals from
the following water sources: El Ricci, Idahchariye, El Ouaqf, El Houwe, Bdeita, and Ras EL
Mal for the villages of: Bdeita, Iraniyeh, El Ouaqf, Hermel Ed Daiaa, Daoura, Mtolle .
5- Wady El Nousour (hardcopy): Project was executed in 2007. Plans show layout of pipes
(PE90) covering a total length of 1,000m and bringing water from the sources of Ain El
Mokl and Ain El Nsour.
6- Knayseh (hardcopy): The project is divided into two parts which were executed in 2006.
Part 1 with a total length of 3,300m consisted of irrigation pipes (PE110) bringing water
from Ain El Kabir and Ain El Marje in Knayseh, while Part 2 with a total length of 2,060m
consisted of irrigation pipes (PE90) bringing water from Ain El Bahsa, Ain EL Lezabe, and
Ain El Haramieh.
7- Ras El Assy (hardcopy): The project was executed in year 2000. It consists of irrigation
canals in Al Mouaalaka area in Ras El Assy.
The information included in the available documentation of these 7 schemes will be
transformed into a GIS format and included in the database.
A major project entitled “Feasibility studies for the rehabilitation and modernization of small and medium
irrigation schemes in Lebanon” was carried out by Jouzy & Partners in joint venture with Haskoning in
1997. The objective of this study was to provide a basis for the evaluation of the costs of rehabilitating
and modernizing some existing schemes and an analysis of the financial, economic and social
consequences of these works, with the aim to rank the schemes for each Mohafazat based on priority.
The area studied covered about 20,000 ha of currently irrigated land, distributed over all of Lebanon. In
the Bekaa, the scheme covered 6356 ha, distributed as follows: Rayak, Ali Nahri & surrounding: 800 ha,
Zahle & surrounding: 552 ha, Laboue: 1527 ha, Yahfoufa, Jenta, Serraain & surrounding: 2045 ha,
Ouadi Nahle & surrounding: 420 ha, Ouyoun Taktak: 100 ha, Marjhine and Jbab el Homr: 922 ha. For
each scheme, the following components were evaluated: sociological aspects, soil and land
classification, water resources, agronomical conditions, irrigation and rehabilitation works, and financial
and economic aspects. Of the Bekaa scheme selected, four fall under the jurisdiction of the BWE,
namely: Laboue, Ouadi Nahle, Marjhine, and Jbab El Homr. However, except for the Laboue scheme
which has been implemented, the status of the other Bekaa schemes is still unknown to the writer at
this point.
As listed in the NWSS (Table 3.7), two major irrigation projects are being planned or executed in the
Bekaa outside the jurisdiction of the LRA. These are the Yammouneh scheme with a 1.5 million m3/year
reservoir already under construction and the planned Assi scheme which will irrigate 6000 ha in its first
phase from a 63 million m3/year reservoir. Efforts are underway to secure the documentation for these
two projects. It is not known at this point whether the reservoir mentioned by the NWSS is the same one
already shown on the plans.
A survey entitled “Recensement Général de l’Agriculture” has been carried out by the Ministry of
Agriculture in 1997 and 1998. This survey gives an inventory of the land uses by type of crop for each
caza. The results for the Bekaa are listed in Table 5.1 below. The total land area in the Bekaa was
given as 151,157 ha. Subtracting from this area all the uncultivated lands (forests, abandoned lands,
fallow, others, etc.), the cultivated area adds up to 102,715 ha which is more than twice the irrigated
area taken into account by the NWSS (45,000 ha). There seems to be a discrepancy between the two
sources as based on the listed crops and their corresponding areas, it is extremely unlikely that 58,000
ha of these cultivated lands do not need irrigation. Efforts are currently underway to find out whether a
more recent survey exists for the Bekaa.

WATER SUPPLY AND WASTEWATER SYSTEMS MASTER PLAN FOR THE BWE INCEPTION REPORT P-1211
MARCH 2013 PAGE 26 OF 67
INC
EP
TIO
N R
EP
OR
T
TABLE 5.1: LAND AND CROP INVENTORY FROM “RECENSEMENT GÉNÉRAL DE L’AGRICULTURE” (FAO 1999)
Caza Cereals
(ha) Grains
(ha)
Vegetable Crops (ha)
Industrial Crops (ha)
Fruit Trees (ha)
Oilseeds (ha)
Olives (ha)
Fallow (ha)
Abandoned Land (ha)
Uncultivated Land (ha)
Forests (ha)
Other (ha)
Total (ha)
Zahle 3334.4 182.9 7021.0 5148.1 4332.4 591.1 71.4 149.4 692.4 840.8 38.9 138.7 22541.7
Baalbeck 17279.1 2200.4 12387.9 5565.0 13776.7 1527.7 899.6 4021.9 14292.2 10865.5 1837.7 453.9 85107.7
Hermel 3500.1 1030.1 2799.0 155.9 634.0 509.0 438.5 503.3 1693.6 6597.5 1182.7 71.5 19115.3
West Bekaa 4960.7 117.0 3431.4 4450.9 1924.0 148.5 1038.3 190.6 792.9 1263.3 81.4 114.0 18512.8
Rachaya 699.3 353.7 335.0 3.2 1089.8 82.0 696.5 214.8 1832.4 485.6 28.8 58.8 5879.9
SubTotal 29773.7 3884.0 25974.3 15323.2 21757.0 2858.3 3144.3 5080.0 19303.6 20052.6 3169.6 836.9 151157.4

WATER SUPPLY AND WASTEWATER SYSTEMS MASTER PLAN FOR THE BWE INCEPTION REPORT P-1211
MARCH 2013 PAGE 27 OF 67
INC
EP
TIO
N R
EP
OR
T
5.2 Wastewater effluent reuse in irrigation
The Terms of Reference of this study state that the recommended improvements to the wastewater
systems in the BWE service area should be consistent with the NWSS. On the subject of wastewater
reuse, the document entitled National Strategy for the Wastewater Sector (Resolution No. 35, date
17/10/2012) states the following:
“The strategy targets increases in reuse of treated effluent from zero percent in 2010 to 20% of treated wastewater by 2015, and 50% by 2020. Preliminary estimates indicate that at least 20 and 150 million cubic meters per year could be reused for irrigation purposes by 2015 and 2020, respectively. a. Specific studies of existing plants and of plants under implementation will be undertaken to
assess technical and economical reuse potential for each plant. The studies will evaluate infrastructure requirements and propose the appropriate investments and institutional arrangements.
b. Implementation of required infrastructure for re-use of treated wastewater (storage capacities, pumping stations, networks, etc.) will be undertaken.”
The MEW strategy published on the website states, under the “Strategic Roadmap” section:
“- Reuse of 20% of treated wastewater by 2015, and 50% by 2020. - Secondary treatment and reuse of all inland wastewater by 2020 and secondary treatment by 2020 of coastal wastewater where reuse is economically justified.”
There is a discrepancy between these two documents as the strategic roadmap adds that all inland
wastewater must be reused by 2020, while the wastewater strategy does not differentiate between
inland and coastal wastewaters in its requirement of a 50% reuse by 2020.
In the current study, a wastewater master plan will be proposed for the Bekaa along with a scope of
work for an irrigation water master plan in the area under the jurisdiction of the BWE.
In view of the above, several issues arise:
1- The percentage of wastewater to be reused has to be agreed upon.
2- While the wastewater master plan covers the whole of the Bekaa, the irrigation master
plan will only cover the area which is outside the jurisdiction of the LRA. Hence the BWE
cannot decide on a plan for a scheme concerning the reuse of the wastewater outside its
area of jurisdiction. As a substantial part of the Bekaa population lives in the LRA
governed area, the reuse of the wastewater from the plants servicing this population
cannot be devised without input from LRA.
3- As stated in the strategy (point a above), a specific study must be conducted for each
plant to evaluate its reuse potential. As wastewater reuse encompasses many technical
and economic issues (distance to areas to be irrigated, need for pumping, required
storage, fate of wastewater during winter months, required network, types of crops
present in the area of influence of the plant, etc.), it is unlikely that reuse would be an
economically feasible solution for all the Bekaa plants and hence a one-solution-fits-all
scheme whereby all wastewater has to be reused would not be advisable.
The above listed issues will have to be addressed during the course of the master plan study. For each
plant, the potential for reuse will be preliminarily assessed based on its specific conditions. For plants
where reuse is deemed to be a priori economically unfeasible, the potential for using the effluent for
groundwater recharge will be evaluated. This part of the study will be carried out in close collaboration
with the LRA.
A study entitled “Re-use of treated effluent and sludge at Iaat wastewater treatment plant” has been
carried out by the FAO in 2011. The objective of the study was to maximize the benefits from the re-use
of treated effluent and sludge and reduce its adverse impacts. The study outputs are: a soil report
summarizing soil conditions and types of crops that can be cultivated and irrigated with the treated
effluent; a pilot demonstration field for assessing the impact of the treated effluent and sludge on soil
quality and crop yield; proposed guidelines for the reuse of treated effluent and sludge; proposed
measures to enhance capacity of the technical personnel of the BWE and stakeholders for dealing with
wastewater reuse; and an awareness campaign for all stakeholders concerned with the re-use of
treated effluent and sludge. The conclusion of the soil report stated that the introduction of treated
wastewater will shift the land use from rain fed crops to irrigated agriculture which will incite farmers to
introduce new crops and intensive cropping. The quality of the treated wastewater was found to be
suitable for irrigation, but the study recommends a long-term follow-up to monitor the accumulation of
heavy metals in the soils irrigated with the treated effluent.
5.3 Preparation of the scope of work
In order to produce the scope of work that will allow the tendering process of an Irrigation Water Master
Plan, the following steps will be undertaken:
1- Determine the agricultural areas of Northern and Central Bekaa that have to be served
by the BWE. This task will be completed by interviewing the BWE staff and by reviewing
any existing official texts or laws related to this subject.
2- Divide the agricultural areas in irrigated, rainfed and fallow then determine if the latters
are classified by the MOA as areas that can be potentially cultivated.
3- Collect information on existing irrigation systems in the studied area, and identify
whether these systems are built by the MEW, the local NGOs, or by the private sector
such as farmers, cooperatives (with or without licenses from the MEW). This information
will be collected by interviewing the related official bodies responsible of the irrigation in
this area such as the MOA, MEW, etc.
WATER SUPPLY AND WASTEWATER SYSTEMS MASTER PLAN FOR THE BWE INCEPTION REPORT P-1211
MARCH 2013 PAGE 28 OF 67
INC
EP
TIO
N R
EP
OR
T
4- Conduct limited field investigations, in cooperation with local municipalities to complete
the collected information and assess its validity.
5- Conduct an investigation by interviewing a representative sample of water users to better
define the current use of water irrigation and whether their needs are being met or unmet
in the areas that can be practically served by the existing irrigation systems. The same
interview will ask about the cultivation of crops and variety, some agricultural techniques
and the irrigation methods used. The users sample will include farmers cultivating one or
more of the 5 to 6 major crops (grapes, wheat, etc.). These interviews will lead for a
better understanding of the water use efficiency and whether or not there is a possibility
to reduce irrigation water volumes needed.
6- Identify constraints and major deficiencies of the existing water irrigation systems that
decrease the provided water and thus prevent the systems from operating at their
maximum potential.
7- Prepare a detailed scope of work for a consultant that will develop an Irrigation Water
Master Plan for this area and suggest a budget for the completion of this task.

WATER SUPPLY AND WASTEWATER SYSTEMS MASTER PLAN FOR THE BWE INCEPTION REPORT P-1211
MARCH 2013 PAGE 29 OF 67
INC
EP
TIO
N R
EP
OR
T
6 EXISTING BWE FACILITIES: ASSETS DATABASE
As mentioned in section 3.3, the results of the survey of all water supply facilities owned or rented by
the BWE were handed over to the Consultant in late February. According to this project documentation
(dated June 2010), each facility was visited and a data sheet, which includes a description of the
general physical condition of the civil works and electromechanical equipment, filled. Photos were taken
for each facility. Water transmission lines were identified and described by the person in charge and the
maintenance crews of BWE. These data are mainly gathered and organized by the GIZ project, and fall
under two main categories: spatial and non-spatial data.
1. The non-spatial data can be categorized as follows:
a) Excel sheets: they are mainly field templates used to gather attribute information about
wells, springs, reservoirs, chlorination, flow meters. They include lists and specs of the
available facilities, estimated replacement cost of facilities, and description of wastewater
treatment plants (type of treatment, completion date, operated by, investment, cost of
operation, etc….)
b) Photos for all existing facilities (wells, pumping stations, reservoirs, etc…)
c) Pdf files showing the completed field templates for all gathered facilities.
d) Word documents: an Infrastructure Documentation report summarizing the methodology
used for data collection and the terminology for using Keys in building the facilities database;
and a Valuation report evaluating the economic value of all surveyed water supply facilities.
e) An access data base, where all the previous mentioned non spatial documents are gathered
in tables, queries, forms and reports
2. The spatial data can be categorized as follows:
a) Jpg files showing mainly drawing of the irrigation schemes
b) Pdf.files showing drawing for water supply networks and some sewer networks.
c) Autocad files showing as-built drawings of the water supply networks (pipelines,
transmission lines, valves, house connections) and some limited sewer system networks.
Also there are some drawings of the pumping stations, treatment plants, and some cross-
sections showing well casings.
d) GIS data: it is separated in its turn into two ordinary shapefiles as spaghetti models this
include: springs, wells, pumping stations, transmission lines etc. and geodatabase data. The
latter consists of the main facilities connected together with simple direct and indirect
relationships. This permits querying and identifying related entities. For instance when
identifying or querying a certain well all related sub network, transmission lines, reservoirs,
related village as well as existing chlorination system (if available) is gathered in one tabular
form.
It is quite obvious that a lot of time and effort have been expended by GIZ and the BWE in order to
gather all related information, structure them in a proper Access database, and implement the GIS
format. An assessment of this massive database is currently being undertaken, however, a preliminary
evaluation yielded the following comments:
At the GIS level:
1- A substantial part of the information is still missing spatial and attributal information. Some of
these data exist as Autocad drawing or pdf files and need to be properly transformed into GIS.
2- The GIS database is not usable in its current status as none of the existing GIS layers hold
related metadata. This makes it nearly impossible to evaluate and assess properly the data
because it lacks data source, the date it was generated, the methodology of transforming it to
GIS, the scale, spatial reference, etc..
3- A spatial shift between the Autocad data and the related GIS data in almost all layers was
noticed. This shift needs to be corrected.
4- Entities in the database are not connected properly and none of the system behaviors is
identified. This requires re- “cleaning” the data, building topologies and geometric networks,
and defining subtypes, relationship and behavior.
At the technical level:
1- Sewer networks are missing for all localities except for Baalbeck.
2- There are discrepancies in the GIS models: transmission network layouts for some villages are
different in the individual models from the global Bekaa GIS model.
3- Several plans are either scanned from hardcopies or available in PDF format. The scans are
not tied to a grid or a coordinate system and hence cannot be imported or digitized to proper
scale and georeference. These plans cannot be used for the purposes of this master plan.
4- Some values are present in the database but missing from the facility field sheets. For
example: spring maximum and minimum yields in the “Spring” sheets, pipe length in the
“Transmission Pipe Sheets”, well depth and pump specifications (HMT and Q) in the “Well &
Submersible Pump Sheets, etc. Efforts are underway to clarify the issue with the BWE.
5- Some information is missing from both the facility field sheets and the database such as the
average yield of springs for all springs, or other punctual information for specific facilities.
6- Some facility field sheets are missing from the geodatabase.

WATER SUPPLY AND WASTEWATER SYSTEMS MASTER PLAN FOR THE BWE INCEPTION REPORT P-1211
MARCH 2013 PAGE 30 OF 67
INC
EP
TIO
N R
EP
OR
T
7 GEOGRAPHICAL INFORMATION SYSTEM
7.1 Improving GIS functionality and updating database
A GIS system can be viewed as a database, which comprises all geometric elements of the
geographical space with specific geometric accuracy together with information i.e., in tabular form which
is related to geographic location. The GIS is associated by a set of tools, which ensure data
management, processing, analysis and presentation of results for information and related geographic
locations. To have a functional GIS system, the existing software hardware should be assessed in
addition to the staff capability in handling GIS technology. Usually, one of the optimal technologies for
operating the GIS applications that might be used is the tiered infrastructure. In the tiered infrastructure,
the IT system is partitioned into tiers or layers where each layer performs specific type functionality.
Using Business Logic Tier (n-tier infrastructure) will balance the work of the network over the server or
several different servers. Moreover, the GIS system environment should be based on three levels.
Level one is the GIS authors or creators; it is the BWE and the MEW and other related institutes. Level
two is the GIS Engine (server), where all GIS data are gathered and compiled, this will be the host
institute (BWE). The third level is the users and stakeholders of different types (staff, ministry engineers,
decision makers, etc.). The hardware technology should not only include the computer system within
the BWE offices but should cover all GIS mobile application that will facilitate onsite digital update and
upgrade of the information. Within this framework the status of the existing BWE system (hardware,
software and personnel) will be assessed and recommendations for upgrading and building capacities
along with cost estimates can then be defined.
Scattering and discrepancies are major obstacles that face the optimal utilization of data from different
aspects, and restrict related activities at the BWE. Therefore, there is an urge to update the existing
data and build a suitable, organized, systematical database where the three major datasets (water
supply, waste water, irrigation) and the related ancillary data (land cover use, updated road network,
digital elevation models, etc…) are stored and compiled in a geo-referenced spatial form. This will
include data collection and compilation, migration and conversion/standardization. All data will be
structured in one geodatabase having the three main entities (water supply, waste water and irrigation)
in a separate feature dataset. The later will insure the spatial referencing and will enable proper
database connections, establishing topologies and defining integrity GIS rules. Having this completed, a
geometric network between different feature classes of each dataset will be constructed. The geometric
network will be created from multiple point and line feature classes, all of which are part of the same
feature dataset. The point and line features acquire more behavior (like the ability to maintain
connectivity with one another) and become junction and edge features in a single, integrated dataset.
Examples of edges that would be utilized include drainage; transmission lines, irrigation pipes, while
junctions are places where the edges connect to each other or terminate, like wells, springs, reservoirs,
etc.
Moreover, metadata will be built for each spatial entity. This will not only help in providing information
about data availability within the BWE, but will help to interpret, use data and prevent spatial data
redundancy. The metadata will be formulated to meet the ISO requirements and will include quality,
source, data format and organization, collection schedule, uses, scale, precision, spatial references,
distribution mechanisms and other.
The spatial/ attribute data that will be collected and/or updated under the scope of work will include but
not restricted to: utilities (water supply, waste water and irrigation), land cover use, natural drainage
system, soil map, population and population distribution and density, urban agglomeration, springs,
wells reservoirs, existing and planned wastewater plants, digital elevation models, road networks, etc….
7.2 Support to the BWE
One of the major purposes of this study is to identify issues which should be the focus of future local
efforts in the development, expansion, or extension of the water supply and waste water master plan.
Thus, when the GIS system is completed it will allow all applications to connect to different kinds of
spatial data sources (SHP, info, tiger, CAD files, maps, images, etc.), database ( MYSQL, ORACLE,
Access) and help in identifying, querying, evaluating and executing different types of attributal and
spatial analysis.
The integration of attribute database with the spatial GIS data will permit annual evaluation and
assessment of the adequacy of the capacity of the existing water supply, and wastewater systems, a
search for opportunities for sharing facilities to either expand capacity or overcome deficiencies; an
identification of areas in the region which are experiencing new development which could require future
extensions or expansions of infrastructure facilities; and a listing of major problems or deficiencies
which should be addressed in the regional priorities.
On the other hand, the constructed GIS system will help in designing the intended irrigation master plan
and modeling current and future irrigation water demand based on existing information regarding
cropping patterns, irrigated areas, information on crop water requirements, in combination with
application and conveyance methods and leaching requirements given water quality. It will help in
identifying areas and land subdivision in terms of irrigated areas for each crop group, irrigation
methods, network maintenance, monthly net water requirements, crop yields, resources demands,
etc…
At the operational and maintenance level, wells, reservoirs, pumping stations, transmission lines,
valves, meters, treatment plants and other utility networks can be assessed depending on the type and
lifetime of the equipment/utility, its original value and the maintenance costs. Thus through the
continuous updating and upgrading of the GIS database system annual business plans could be
devised.
WATER SUPPLY AND WASTEWATER SYSTEMS MASTER PLAN FOR THE BWE INCEPTION REPORT P-1211
MARCH 2013 PAGE 31 OF 67
INC
EP
TIO
N R
EP
OR
T
8 ADDITIONAL INFORMATION GATHERED TO DATE
As part of the data collection campaign, a number of studies, background maps and information relevant
to the current project have already been obtained by KREDO. From these a number of maps and tables
have been extracted and processed (Appendix B). Their specific use will be defined in the next project
phase as the master plan starts taking shape.
- Geological maps at a 1: 50000 scale produced by Dubertret in the fifties to cover all Lebanon.
These maps were re-printed and made commercially available by L’Association Des Amis
d’Ibrahim-Aal.
- Topographical maps at the 1:20000 scale prepared by the DGA (Directorate General of the
Army) in 1962. These maps also show water bodies and sources.
- Pedological map: a 1:200000 scale soil type map produced for Lebanon by Bernard Gèze in
1952, and followed by an explanation note in 1956. The author identifies 41 pure soil units and
43 associations, 34 of which are issued from the mixing of 2 soils and 9 others from the mixing
of 3 soils. We are currently investigating whether a newer map has been produced in the last 10
years or so.
- Land cover plan: A 1:50000 land cover map has been produced for Lebanon by the FAO in
1991 using satellite imaging (later digitized by the MOE). This map however presents some
limitations as its use should always be coupled with field checks. We are currently investigating
whether newer land cover maps exist.
- Land use plan (1:20000) produced by the LNCSR (Lebanese National Council for Scientific
Research) and the MOA (Ministry of Agriculture) in 2001. To our knowledge, this is the most
recent land use map available for the Bekaa.
- Hydrogeological map: The latest national groundwater assessment that covers the entire
Lebanese territory was undertaken in 1970 by UNDP. Based on borings and pilot studies, it
issued a 1:200000 hydrogeological map for Lebanon in 1967, followed by a technical report in
1970 entitled “Liban Etude des Eaux Souterraines”. Although the study was quite
comprehensive and the methodology accurate, the information is outdated due to the ever
changing climatic conditions, soil use and land cover and water use regimes. As mentioned
above, the ongoing Groundwater Assessment and Database Project will hopefully provide more
updated information once completed by the end of 2013.
- Climatic conditions for Lebanon are available from the Atlas Climatique du Liban prepared by
the Lebanon Meteorological Service in 1966. Data used to prepare the Atlas were obtained from
various meteorological stations scattered around the country. Other sources of information are
also available such as the pluviometry map of Lebanon at a scale of 1:200,000 by Plassard
(1971), Ministry of Public Affairs - General Direction of Civil Aviation.
- A road network map for the Bekaa produced by Dar Al Handasah in 2005 and updated from
SDATL (Schéma D’Aménagement du Territoire Libanais, Diagnostic et Problématiques.
Rapport, CDR- Groupement DAR-IAURIF - 2002).
- Industries distribution in the Bekaa, surveyed as part of the SDATL project (2002).

WATER SUPPLY AND WASTEWATER SYSTEMS MASTER PLAN FOR THE BWE INCEPTION REPORT P-1211
MARCH 2013 PAGE 32 OF 67
INC
EP
TIO
N R
EP
OR
T
9 WORK ORGANISATION
An updated timeline for the different tasks to be accomplished is included hereafter. It is worth noting
that a delay in the original schedule of data collection and consequently in the field survey has occurred
due to a delay in receiving information from the BWE regarding its facilities and from other sources such
as the CDR, the CAS, and the MEW regarding planned or executed projects and various other data.
Presently, while a sizable amount of information still needs to be collected (requests have mainly been
placed to various parties and the Consultant is awaiting their reply), a substantial amount of information
has already been obtained and is currently being assessed and processed.

WATER SUPPLY AND WASTEWATER SYSTEMS MASTER PLAN FOR THE BWE INCEPTION REPORT P-1211
MARCH 2013 PAGE 33 OF 67
INC
EP
TIO
N R
EP
OR
T
PROPOSED TIMELINE

WATER SUPPLY AND WASTEWATER SYSTEMS MASTER PLAN FOR THE BWE INCEPTION REPORT P-1211
MARCH 2013 PAGE 34 OF 67
INC
EP
TIO
N R
EP
OR
T

WATER SUPPLY AND WASTEWATER SYSTEMS MASTER PLAN FOR THE BWE INCEPTION REPORT P-1211
MARCH 2013 PAGE 35 OF 67
INC
EP
TIO
N R
EP
OR
T

WATER SUPPLY AND WASTEWATER SYSTEMS MASTER PLAN FOR THE BWE INCEPTION REPORT P-1211
MARCH 2013 PAGE 36 OF 67
INC
EP
TIO
N R
EP
OR
T

WATER SUPPLY AND WASTEWATER SYSTEMS MASTER PLAN FOR THE BWE INCEPTION REPORT P-1211
MARCH 2013 PAGE 37 OF 67
INC
EP
TIO
N R
EP
OR
T

WATER SUPPLY AND WASTEWATER SYSTEMS MASTER PLAN FOR THE BWE INCEPTION REPORT P-1211
MARCH 2013 PAGE 38 OF 67
INC
EP
TIO
N R
EP
OR
T
APPENDIX A:
APPENDIX A:
A.1 POPULATION ESTIMATES FROM PREVIOUS STUDIES
A.2 NUMBER OF TOWNS AND VILLAGES IN THE BEKAA ACCORDING TO DIFFERENT SOURCES
A.3 TOWNS AND VILLAGES NAMES ACCORDING TO CDR & DGA
A.4 TOWNS AND VILLAGES NAMES ACCORDING TO CAS
A.5 POPULATION SURVEY QUESTIONNAIRE
A.6 WATER NEEDS IN THE BEKAA REGION FROM “ANALYSE DES STRATEGIES ET PROSPECTIVES DE L’EAU AU LIBAN” – (PLAN BLEU-UNEP 2001)
A.7 WASTEWATER TREATMENT PLANTS FOR IN THE NORTH & SOUTH OF BEKAA FROM SIU-MRHE (2000)
A.8 WASTEWATER TREATMENT PLANT LOCATIONS FROM “MASTER PLAN STUDY TO LOCATE WASTE WATER TREATMENT PLANTS IN BEKAA” (DAHNT 1994 - MINISTRY OF HOUSING AND
COOPERATIVE)

WATER SUPPLY AND WASTEWATER SYSTEMS MASTER PLAN FOR THE BWE INCEPTION REPORT P-1211
MARCH 2013 PAGE 39 OF 67
INC
EP
TIO
N R
EP
OR
T
A.1: Population estimates from previous studies
CAZA OF HERMEL
No. Town Name DAHNT
(1980)
DAHNT
(1994)
CDR
(1992)*
1 Bestane 500 810 50
2 Boueida 800 1,295
3 Brissa 300 486
4 Charbiné (Sh) 1,300 2,105 1,200
5 Chouaghir el Faouka 600 972 600
6 Chouaghir el Tahta 400 648
7 Daoura 70 114
8 Fissane 500 810 400
9 Haouch es sayed aali 300 486
10 Haret el Maaser 100 162
11 Hariqa 150 243
12 Hay Bdita 100 162
13 Hay El Hara 100 162
14 Hay el Ouaqf 100 162
15 Hermel 12,000 19,425 13,000
16 Hermel Jbab
17 Jmeira 100 162
18 Jouar el Hachich 500 810 300
19 Kharayeb 105 170
20 Koauakh 500
21 Maaïsra (El) 150 243
22 Maaser 150 243
23 Mazraart el Faqih 150 234
24 Mazraat Beit el Toch 200 324 50
25 Mazraat Soujod 100 162
26 Merjhine 150 243
27 Nahr el Aiin 300 486
28 Nasriye (en) 10
29 Ouadi el Faqra 300
30 Ouadi et Tourkman 300 486 400
31 Qanafez 175 284 300
32 Qasr 2,000 3,238 2,000
33 Qouakh 385 624 500
34 Ras Baalbeck el Gharbi 100 162 1,300
35 Sahet el Mai 150 243 60
36 Soueiss 225 365
37 Wadi Bnit 200 324
38 Wadi el Karm 200 324 10
39 Wadi el Nira 100 162
40 Wadi el Ratl 400 648 400
41 Zighrine 500 810 400
42 Zoueitini 1,250 2,024 200
Hermel Total Population 25,210 40,813 21,980
* Taken from Khatib & Alami Report ( Lebanon's Staged Wastewater Program, Year 1994)
CAZA OF BAALBECK
No. Town Name DAHNT
(1980)
DAHNT
(1994)
CDR
(1992)*
1 Aaddous 100 162
2 Aain Bnayé 100 162
3 Aain es Saa 100 162
4 Aalaq Tell 1,000 1,619
5 Aamichki 100 162
6 Aaqidieh 1,000 1,619
7 Aarsal 7,000 11,331 5,800
8 Ain (El) 5,000 8,094 3,400
9 Ain Bourdai 639 1,035 600
10 Ain el Jaouzé 100 162
11 Ain Es Saouda 65 106 50
12 Ainata 1,700 2,752 900
13 Amhazié 0 1,200
14 Baalbeck 52,000 84,173 25,300
15 Bajjajé (El) 200 324 50
16 Barqa 910 1,474 500
17 Bechouat 650 1,053 500
18 Bednayel 7,000 11,331 3,500
19 Beit Chama 1,200 1,943
20 Beit Mcheik 1,000 1,619 500
21 Beliqa 57 93 50
22 Boudai 3,000 4,857 2,100
23 Britel 5,000 8,094 3,000
24 Btedaai 590 956 400
25 Chaaibé 100 162
26 Chaat 3,500 5,666 2,000
27 Chlifa 1,200 1,943 1,400
28 Chmistar 8,000 12,950 5,500
29 Dar el Wasseaa 1,000 1,619 50
30 Deir el Ahmar 4,340 7,026 3,600
31 Deir Mar Maroun 100 162
32 Douris 1,415 2,291 1,900
33 Fekehe 3,000 4,857 2,800
34 Flaoue 1,000 1,619 500
35 Hadet (El) 1,900 3,076 1,600
36 Halbata 700 1,134 400
37 Ham 300 486 200
38 Haouch Barada 420 680 400
39 Haouch ed Dahab 69 112 50
40 Haouch en Nabe 1,000 1,619 200
41 Haouch er Rafqa 3,000 4,857 1,200
42 Haouch Snaid 120 195 70
43 Haouch Tell Safiyé 600 972 400
44 Harbata 2,500 4,047 1,200
45 Harfouche 180 292 30
46 Hizzine 430 697 400

WATER SUPPLY AND WASTEWATER SYSTEMS MASTER PLAN FOR THE BWE INCEPTION REPORT P-1211
MARCH 2013 PAGE 40 OF 67
INC
EP
TIO
N R
EP
OR
T
CAZA OF BAALBECK
No. Town Name DAHNT
(1980)
DAHNT
(1994)
CDR
(1992)*
47 Hortaala 1,500 2,429 1,800
48 Iaat 3,000 4,857 2,200
49 Jabboulé 100 162 200
50 Jdeidé 2,000 3,238 1,900
51 Jebaa 300 486 50
52 Jenta 900 1,457
53 Kfar Dabach 400 648 200
54 Kfardaane 800 1,295 700
55 Khoder (El) 600 972 500
56 Khraibé (El) 300 486 300
57 Kneissé 1,065 1,724 900
58 Laboué 2,500 4,047 3,000
59 Maaraboun 800 1,295 400
60 Machaitiye 30
61 Majdaloun 600 972
62 Maqné 2,120 3,432 1,800
63 Masnaa Bednayel 400
64 Mazraat Beit Matar 300 486 50
65 Mazraat Beit Slaibi 160 259
66 Mazraat ed Dallil 130 211
67 Mazraat es Syad 130 211 50
68 Moqraq 400 648 200
69 Mousraye
70 Nabha 2,200 3,562 1,300
71 Nabi Chbat (En) 120 195 90
72 Nabi Chit (En) 6,000 9,713 3,200
73 Nabi Osmane (En) 1,800 2,914
74 Nabi Rchad 100 1,619 600
75 Nahlé 3,000 4,857 2,000
76 Ouadi el Aaoss 50
77 Qaa (El) 5,000 8,094 3,500
78 Qaa Baayoun
79 Qaa Jouar Maqiye
80 Qaa Ouadi El Khanzer
81 Qarha 400 648 200
82 Qasrnaba 2,500 4,047 1,700
83 Qeddam 1,500 2,429 500
84 Qlaile (el) 30
85 Ram (El) 800 1,295 400
86 Ras Baalbeck 3,200 5,180 4,000
87 Ras el Aassi 150 243 20
88 Riha 660 1,069 500
89 Saaidé 750 1,215 300
90 Safra 410 664 400
91 Sbouba
92 Seraaine el Gharbieh/ Hallanieh
93 Seraaine el Tahta 1,280 2,072 1,200
CAZA OF BAALBECK
No. Town Name DAHNT
(1980)
DAHNT
(1994)
CDR
(1992)*
94 Serraain el Faouka 2,000 3,238 1,400
95 Sifri 250 405
96 Slouqi
97 Talia 940 1,522 900
98 Taoufiqié 500 810 800
99 Taraya 3,000 4,857 2,200
100 Taybeh (Et) 1,200 1,943 500
101 Temnine el Faouqa 2,000 3,238 1,500
102 Temnine el Tahta 4,000 6,475 2,700
103 Tfail 190 308
104 Wadi Faara 450 729 50
105 Yahfoufa 700 1,134 200
106 Yammouné 1,200 1,943 800
107 Younine 5,000 8,094 3,200
108 Zabboud 480 777 400
109 Zraieb 300 486 1,200
110 Zrazir 270 438 400
Baalbeck Total Population 193,840 316,473 121,470
* Taken from Khatib & Alami Report ( Lebanon's Staged Wastewater Program, Year 1994)

WATER SUPPLY AND WASTEWATER SYSTEMS MASTER PLAN FOR THE BWE INCEPTION REPORT P-1211
MARCH 2013 PAGE 41 OF 67
INC
EP
TIO
N R
EP
OR
T
CAZA OF ZAHLE
No. Town Name DAHNT
(1980)
DAHNT
(1994)
CDR
(1992)*
1 Aanjar/Haouch Moussa 6,400 10,360 10,500
2 Ablah 3,200 5,180 900
3 Ain Kfar Zabad 1,300 2,105 2,000
4 Ali en Nahri 5,500 8,903 1,700
5 Barr Elias 12,000 19,425 8,000
6 Betyas 100 162
7 Bouarej 1,200 1,943 700
8 Chebrqieh 100 162 500
9 Chtaura No.23 No.23 500
10 Dalkaniye 500
11 Deir el Ghazal 810 1,312 600
12 Deir Zanoun 250 405 10
13 Delhamiye 700 1,134
14 Faaour 1,000 1,619
15 Fourzol (El) 2,600 4,209 900
16 Haouch el Ghanam 48 78
17 Haouch es Siyadi 100 162
18 Haouch Handari 100 162
19 Haouch Qaissar 90 146 10
20 Hay el Fikani 700 1,134 200
21 Hazerta 3,500 5,666 700
22 Hoshmosh 40 65
23 Janta 300
24 Jdita 7,000 11,331 5,000
25 Jlala 600
26 Kfar Zabad 1,800 2,914 1,900
27 Ksara 2,000
28 Maallaqa 6,600 10,684
29 Maallaqa Aradi
30 Majdel Aanjar 6,000 9,713 4,200
31 Maksé 500 810
32 Massa 1,100 1,781 200
33 Mazraa (El) 100 162
34 Mraijat (El) 1,750 2,833 1,100
35 Nabi Ayla 1,200 1,943 400
36 Nasireh 100 162
37 Nasriye 350 567 200
38 Nasriyet Rizk
39 Niha 600 972 800
40 Ouadi Ed Dellem 100 162 300
41 Qaa er Rim 1,500 2,429 1,000
42 Qabb Elias 16,200 26,223 10,000
43 Qoussaya 1,000 1,619 200
44 Quommol 200 324
45 Raite 1,500 2,429 500
46 Ramtaineh 100 162
47 Raouda 450 729
48 Rayak- Haouch Hala 8,000 12,950 6,400
CAZA OF ZAHLE
No. Town Name DAHNT
(1980)
DAHNT
(1994)
CDR
(1992)*
49 Saadnayel 5,500 8,903 1,200
50 Taalabaya - Jalala 14,000 22,662 2,100
51 Taanayel (Deir) 200 324
52 Tell el Akhdar 100 162 50
53 Terbol 3,300 5,342 1,800
54 Touaite 150 234
55
Zahlé 100,000 161,870 90,100
Aradi
Al-Rassieh
Barbara
Haouch El-Oumara Aradi
Haouch El-Oumara
Haouche Al-Zaraan
Mar Antonios
Mar Elias
Mar Gerios
Medan
Ouadi El-Aarayech 1,100
Saidet Al Najda 3,000
56 Zebdol 100 162 400
Zahlé Total Population 219,238 356,890 156,470
* Taken from Khatib & Alami Report ( Lebanon's Staged Wastewater Program, Year 1994)

WATER SUPPLY AND WASTEWATER SYSTEMS MASTER PLAN FOR THE BWE INCEPTION REPORT P-1211
MARCH 2013 PAGE 42 OF 67
INC
EP
TIO
N R
EP
OR
T
CAZA OF WEST BEKAA
No. Town Name DAHNT
(1980)
DAHNT
(1994)
CDR
(1992)*
1 Ain El Tine (2) 600 972 700
2 Ain Zebdé 1,050 1,700 1,100
3 Aaitanit 2,000 3,238 2,400
4 Aammiq 550 891 200
5 Aana 800 1,295 500
6 Baaloul 1,350 2,186 1,200
7 Bab Mareh 450 729 400
8 Dakoué (El) 600 972 200
9 Deir Ain ej Jaouzé 60 98 20
10 Deir Tahnich 40 65 20
11 Fadar El Faouka 600
12 Fadar El Tahta 400
13 Ghazze 3,000 4,857 900
14 Hammara (Manara) 1,300 2,105 1,600
15 Harimet es Soghra
16 Haouch El Harime 1,025 1,660 1,100
17 Jeziré (El) 100 162
18 Joubb Jannine 6,500 10,522 5,500
19 Kamed el Loz 3,000 4,857 2,500
20 Kefraiya 850 1,376 900
21 Khiara (El) 1,250 2,024 200
22 Khirbet Qanafar 3,000 4,857 3,500
23 Lala 2,110 3,416 2,000
24 Libbaya 1,270 2,056 1,600
25 Loussa 150 243 400
26 Machghara 10,000 16,187 6,500
27 Maidoun 450 729 200
28 Manara 1,200 1,943 1,400
29 Mansoura 1,500 2,429 1,200
30 Marj (El) 2,980 4,824 1,900
31 Ouaqf (El) 100 162
32 Qaraaoun (El) 5,000 8,094 4,500
33 Qelia 1,200 1,943 600
34 Raouda
35 Saghbine 3,000 4,857 3,500
36 Sohmor 3,500 5,666 2,100
37 Saouiri 1,700 2,752 2,000
38 Sltan Yaqoub El Aradi
39 Sltan Yacoub el Fouqa 1,600 2,590 700
40 Sltan Yaqoub el Tahta 1,000 1,619 300
41 Tell Ez Zaazaa
42 Tell Znoub 450 729 300
43 Yohmor el Beqaa 1,880 2,914 1,100
44 Zellaya 400 648 200
West Bekaa Total Population 67,015 108,367 54,440
* Taken from Khatib & Alami Report ( Lebanon's Staged Wastewater Program, Year 1994)
CAZA OF RACHAYA
No. Town Name DAHNT
(1980)
DAHNT
(1994)
CDR
(1992)*
1 Aaiha 1,400 2,267 1,900
2 Aain Arab 800 1,295
3 Aakabe (El) 1,000 1,619 1,700
4 Ain Aata 1,200 1,943 1,300
5 Ain Horche 760 1,231 800
6 Aita El Foukhar 1,200 1,943 2,300
7 Bakka 750 1,215 500
8 Bakkifa 750 1,215 800
9 Beit Lahia 700 1,134 700
10 Bire (El) 1,300 2,105 1,500
11 Dahr el Ahmar 700 1,134 2,100
12 Deir el Aachayer 500 810 500
13 Ezzé (Aazzi) 0 2,000
14 Haloua 185 300 200
15 Haouch El Qinnaabe 780 1,263 600
16 Kaoukaba 300 486 400
17 Kfar Qouq 1,200 1,943 1,400
18 Kfardenis 750 1,215 500
19 Kfarmechki 1,140 1,846 1,600
20 Khirbet Rouha 1,200 1,943 1,500
21 Majdel Balhiss 1,000 1,619 300
22 Mazraat Deir el Aachayer 100 162 60
23 Mazraat Jaafar 100 162 30
24 Mazraat Salsata 100 162
25 Mdoukha 1,000 1,619
26 Mhaidthé (El) 1,000 1,619 300
27 Nabaat 10
28 Qennabé 100 162 200
29 Rachaiya 5,500 8,903
30 Rachaya el Faouka 1,100
31 Rachaya El Kouasbe' 900
32 Rachaya el Wadi 2,000 3,238
33 Rafid (Er) 1,200 1,943 1,800
34 Tannoura 600 972 400
35 Yanta 1,100 1,781 1,500
Rachaya Total Population 30,415 51,249 26,900
* Taken from Khatib & Alami Report ( Lebanon's Staged Wastewater Program, Year 1994)

WATER SUPPLY AND WASTEWATER SYSTEMS MASTER PLAN FOR THE BWE INCEPTION REPORT P-1211
MARCH 2013 PAGE 43 OF 67
INC
EP
TIO
N R
EP
OR
T
A.2: Number of towns and villages in the Bekaa according to different sources
No. of Towns as per
Source CNRS
Caza Name CDR DGA
Zahle 62 62
West Bekaa 41 41
Baalbek 113 116
Hermel 57 61
Rachiaya 31 31
Total 304 311
No. of Towns as per
Source Dar Al Handasah K&A
Caza Name 1980/ 1994 1992
Zahle 50 25
West Bekaa 38 35
Baalbek 98 81
Hermel 40 21
Rachiaya 32 29
Total 258 191
A.3: Towns and villages names according to CDR & DGA
Town Name as per
Source CNRS
No. Caza Name CDR DGA
1 Zahle Zahle Zahle
2 Zahle Hawch Al Oumara Haouch el Oumara
3 Zahle Hawch Al Sayyade Haouch el Sayade
4 Zahle Hawch Al Zaraina Houch ez Zaraane
5 Zahle Karak Nouh Karak Nouh
6 Zahle Madinat Al Sinaiyat MADINAT AL SINA'IYAT
7 Zahle Mealaka Maalaqa
8 Zahle Wady Al Arayech Ouadi el Aarayech
9 Zahle Ablah Ablah
10 Zahle Bar Elias Bar Elias
11 Zahle Bouwarej Bouarej
12 Zahle Bayyadat Bayyadat
13 Zahle Terbol Terbol
14 Zahle Ta'labaya Taalabaya
15 Zahle Te'nayel Taanayel
16 Zahle Tall el Akhdar Tall el Akhdar
17 Zahle Tal Al Amara TAL AL AMARA
18 Zahle Twayte Touaite
19 Zahle Jdita Jdita
20 Zahle Jlala Jlala
21 Zahle Hzarta Hazerta
22 Zahle Hechmoch Hechmech
23 Zahle Hakl Hammana Hakl Hammana
24 Zahle Hawch Hala Houch Hala
25 Zahle Hawch Al Ghanam Houch El-Ghanam
26 Zahle Hawch Kayssar Qeisser
27 Zahle Hawch Mandarah Haouch el Mendara
28 Zahle Hay Al Fikany Hai el Fikani
29 Zahle Dalhamiyeh Dalhamiye
30 Zahle Deir Zanoun Deir Zenoun
31 Zahle Deir Al Ghazal Deir el Ghazal
32 Zahle R'yte Raite
33 Zahle Riyak Rayak
34 Zahle Zebdol Zebdol
35 Zahle Sa'dnayel Saadnayel
36 Zahle Chabrakiyet Tabet Chabrakiyet Tabet
37 Zahle Chtoura Chtaura
38 Zahle Chamssine Chamssine
39 Zahle Dahr Al Ballite Dahr Blait

WATER SUPPLY AND WASTEWATER SYSTEMS MASTER PLAN FOR THE BWE INCEPTION REPORT P-1211
MARCH 2013 PAGE 44 OF 67
INC
EP
TIO
N R
EP
OR
T
Town Name as per
Source CNRS
No. Caza Name CDR DGA
40 Zahle Dahr Al Harf Dahr al Harf
41 Zahle Ali Al Nahry Aali en Nahri
42 Zahle Anjar Aanjar
43 Zahle Ain Kafar Zabad Ain Kfar Zabad
44 Zahle Ferzol Fourzol
45 Zahle Kaal Rime Qaa er Rim
46 Zahle Kob Elias Qabb Elias
47 Zahle Kamel Qommol
48 Zahle Kssara Ksara
49 Zahle Kfar Zabad Kfar Zabad
50 Zahle Kousaya Koussaya
51 Zahle Masna Masnaa
52 Zahle Massa Massa
53 Zahle Majdel Anjar Majdel Anjar
54 Zahle Mazraet Zahle Mazraat el Mehqane
55 Zahle Mrayjat Mreijat
56 Zahle Maksseh Meksi
57 Zahle Nassriyet Nassriyet
58 Zahle Nassriyet Rezk Nasriye
59 Zahle Naby Ayla Nabi Aila
60 Zahle Na'ssate Na'ssate
61 Zahle Niha Niha
62 Zahle Wady Al Delm Ouadi ed Deloum
63 West Bekaa Jeb Jannine Joub Janine
64 West Bekaa Saghbine Saghbine
65 West Bekaa Bab Mare' Bab Maraa
66 West Bekaa Ba'loul Baaloul
67 West Bekaa Tal Zanoub Tall Znoub
68 West Bekaa Tal Zanoub Al Jadid Tall Znoub ej Jdide
69 West Bekaa Tal Al Zazaa Tal al Za'za'a
70 West Bekaa Hawch Al Harimeh Houch el Harime
71 West Bekaa Hawch Ammik Houch Aammiq
72 West Bekaa Kherbet Kanafar Khirbet Qanafar
73 West Bekaa Khayara Khiara
74 West Bekaa Dakkouh Dakoue
75 West Bekaa Deir Tahnich Deir Tahnich
76 West Bekaa Deir ain Al Jawzeh Deir Ain ej Jaouze
77 West Bekaa Zlaya Zellaya
78 West Bekaa Sohmor Sohmor
79 West Bekaa Sa'louk Houch es Saalouk
80 West Bekaa Soltane Ya'koub Al Tahta Soultane Yaaqoub el Tahta
Town Name as per
Source CNRS
No. Caza Name CDR DGA
81 West Bekaa Soltane Ya'koub Al Fawka Soultane Yaaqoub el Faouqa
82 West Bekaa Chaberkiyet 'Ammik Chebreqiye
83 West Bekaa Swayry Souairi
84 West Bekaa Ana Aana
85 West Bekaa Ammik Aammiq
86 West Bekaa Aytanite Aitanit
87 West Bekaa Ain Al Tineh Ain et Tine
88 West Bekaa Ain Zebdeh Ain Zebde
89 West Bekaa Ghazzeh Ghazze
90 West Bekaa Kar'oun Qaraoun
91 West Bekaa Kellaya Qillaya
92 West Bekaa Kamed Al Lawz Kamed el Laouz
93 West Bekaa Kefraya Kafraiya
94 West Bekaa Lala Lala
95 West Bekaa Lbaya Libbaya
96 West Bekaa Loussiya Loussia
97 West Bekaa Marj El Marj
98 West Bekaa Machghara Machgara
99 West Bekaa Manara Ou Hammara Manara ou Hammara
100 West Bekaa Mansourat Mansoura
101 West Bekaa Maydoun Meidoun
102 West Bekaa Yohmor Yohmor
103 West Bekaa Istabl Istabl
104 Baalbek Baalbek Baalbek
105 Baalbek I'ate Iaat
106 Baalbek Bted'y Betdaai
107 Baalbek Bjajeh Bejjaje
108 Baalbek Bednayel Baalbek Bednayel
109 Baalbek Barkeh Barqa
110 Baalbek Britale Britel
111 Baalbek Bechwat Bechouat
112 Baalbek Bsayleh Al Tahta Bsayleh al Tahta
113 Baalbek Bsayleh Al Fawka Bsayleh al Fawka
114 Baalbek Bouday Boudai
115 Baalbek Beit habchi Beit Habchi
116 Baalbek Beit Chama Beit Chama
117 Baalbek Beit Mchik Beit Mchik
118 Baalbek Temnine Al Tahta Tammine et Tahta
119 Baalbek Temnine Al Fawka Tamnine El Faouqa
120 Baalbek Toufikiyeh Toufiqiye
121 Baalbek Jeba Jabaa
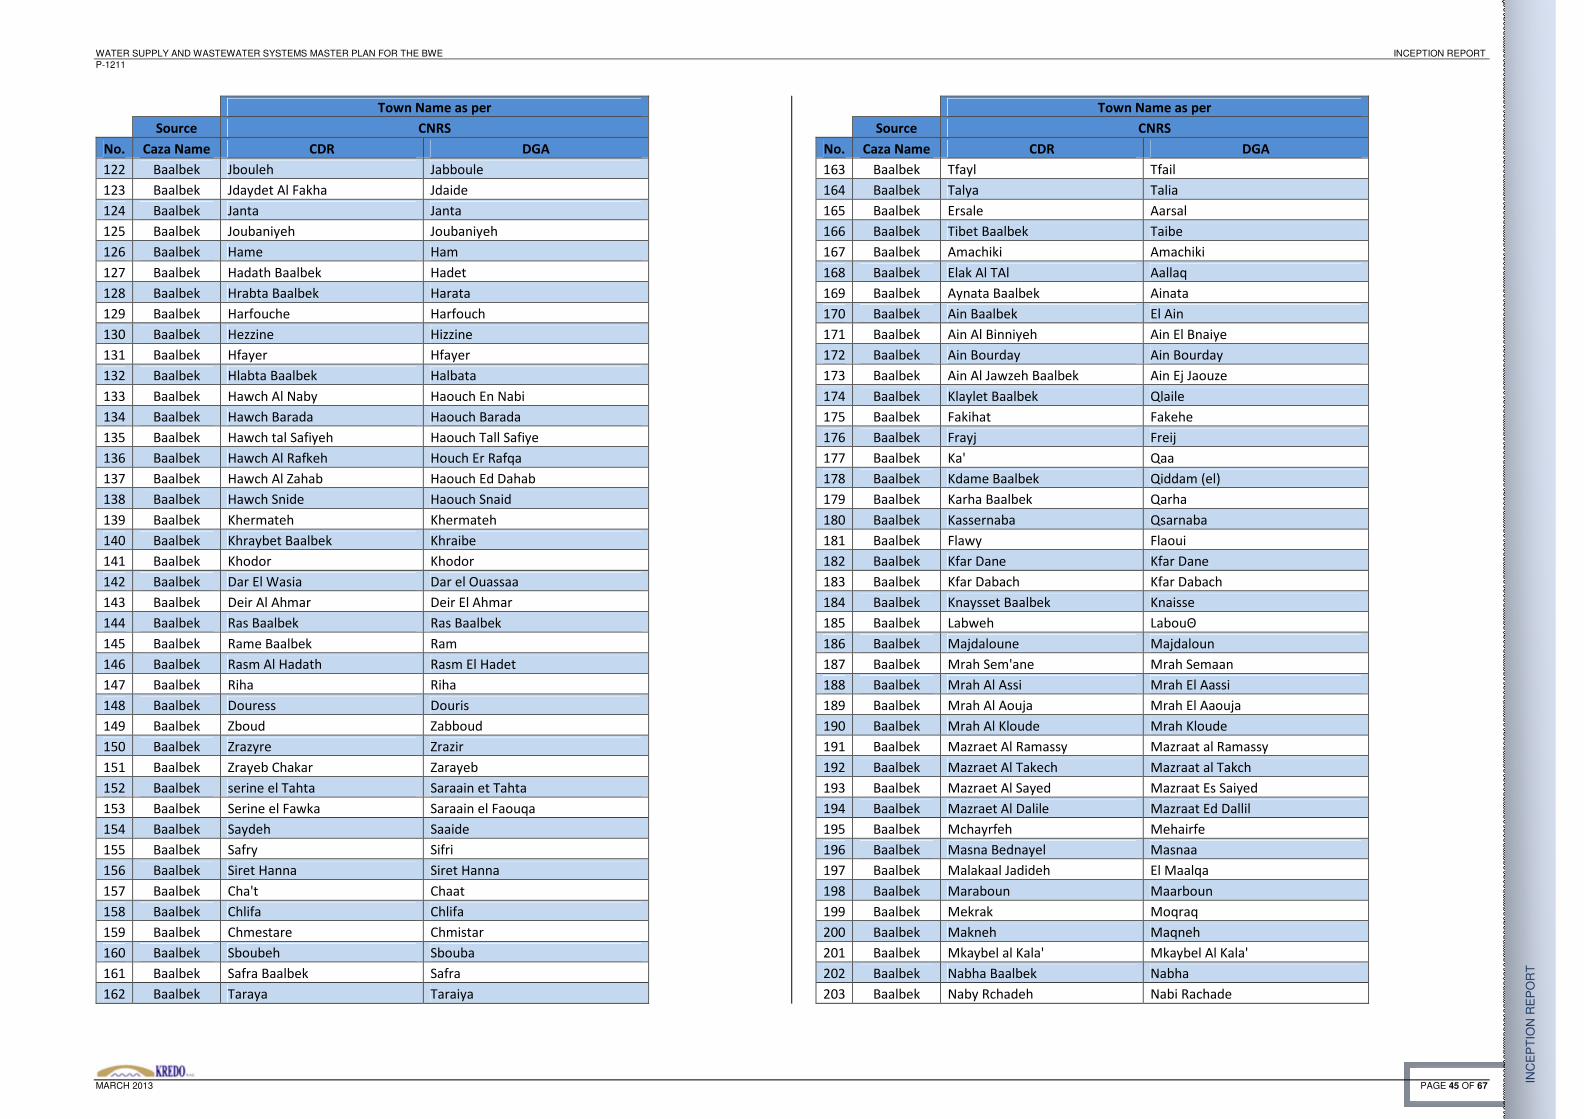
WATER SUPPLY AND WASTEWATER SYSTEMS MASTER PLAN FOR THE BWE INCEPTION REPORT P-1211
MARCH 2013 PAGE 45 OF 67
INC
EP
TIO
N R
EP
OR
T
Town Name as per
Source CNRS
No. Caza Name CDR DGA
122 Baalbek Jbouleh Jabboule
123 Baalbek Jdaydet Al Fakha Jdaide
124 Baalbek Janta Janta
125 Baalbek Joubaniyeh Joubaniyeh
126 Baalbek Hame Ham
127 Baalbek Hadath Baalbek Hadet
128 Baalbek Hrabta Baalbek Harata
129 Baalbek Harfouche Harfouch
130 Baalbek Hezzine Hizzine
131 Baalbek Hfayer Hfayer
132 Baalbek Hlabta Baalbek Halbata
133 Baalbek Hawch Al Naby Haouch En Nabi
134 Baalbek Hawch Barada Haouch Barada
135 Baalbek Hawch tal Safiyeh Haouch Tall Safiye
136 Baalbek Hawch Al Rafkeh Houch Er Rafqa
137 Baalbek Hawch Al Zahab Haouch Ed Dahab
138 Baalbek Hawch Snide Haouch Snaid
139 Baalbek Khermateh Khermateh
140 Baalbek Khraybet Baalbek Khraibe
141 Baalbek Khodor Khodor
142 Baalbek Dar El Wasia Dar el Ouassaa
143 Baalbek Deir Al Ahmar Deir El Ahmar
144 Baalbek Ras Baalbek Ras Baalbek
145 Baalbek Rame Baalbek Ram
146 Baalbek Rasm Al Hadath Rasm El Hadet
147 Baalbek Riha Riha
148 Baalbek Douress Douris
149 Baalbek Zboud Zabboud
150 Baalbek Zrazyre Zrazir
151 Baalbek Zrayeb Chakar Zarayeb
152 Baalbek serine el Tahta Saraain et Tahta
153 Baalbek Serine el Fawka Saraain el Faouqa
154 Baalbek Saydeh Saaide
155 Baalbek Safry Sifri
156 Baalbek Siret Hanna Siret Hanna
157 Baalbek Cha't Chaat
158 Baalbek Chlifa Chlifa
159 Baalbek Chmestare Chmistar
160 Baalbek Sboubeh Sbouba
161 Baalbek Safra Baalbek Safra
162 Baalbek Taraya Taraiya
Town Name as per
Source CNRS
No. Caza Name CDR DGA
163 Baalbek Tfayl Tfail
164 Baalbek Talya Talia
165 Baalbek Ersale Aarsal
166 Baalbek Tibet Baalbek Taibe
167 Baalbek Amachiki Amachiki
168 Baalbek Elak Al TAl Aallaq
169 Baalbek Aynata Baalbek Ainata
170 Baalbek Ain Baalbek El Ain
171 Baalbek Ain Al Binniyeh Ain El Bnaiye
172 Baalbek Ain Bourday Ain Bourday
173 Baalbek Ain Al Jawzeh Baalbek Ain Ej Jaouze
174 Baalbek Klaylet Baalbek Qlaile
175 Baalbek Fakihat Fakehe
176 Baalbek Frayj Freij
177 Baalbek Ka' Qaa
178 Baalbek Kdame Baalbek Qiddam (el)
179 Baalbek Karha Baalbek Qarha
180 Baalbek Kassernaba Qsarnaba
181 Baalbek Flawy Flaoui
182 Baalbek Kfar Dane Kfar Dane
183 Baalbek Kfar Dabach Kfar Dabach
184 Baalbek Knaysset Baalbek Knaisse
185 Baalbek Labweh LabouΘ
186 Baalbek Majdaloune Majdaloun
187 Baalbek Mrah Sem'ane Mrah Semaan
188 Baalbek Mrah Al Assi Mrah El Aassi
189 Baalbek Mrah Al Aouja Mrah El Aaouja
190 Baalbek Mrah Al Kloude Mrah Kloude
191 Baalbek Mazraet Al Ramassy Mazraat al Ramassy
192 Baalbek Mazraet Al Takech Mazraat al Takch
193 Baalbek Mazraet Al Sayed Mazraat Es Saiyed
194 Baalbek Mazraet Al Dalile Mazraat Ed Dallil
195 Baalbek Mchayrfeh Mehairfe
196 Baalbek Masna Bednayel Masnaa
197 Baalbek Malakaal Jadideh El Maalqa
198 Baalbek Maraboun Maarboun
199 Baalbek Mekrak Moqraq
200 Baalbek Makneh Maqneh
201 Baalbek Mkaybel al Kala' Mkaybel Al Kala'
202 Baalbek Nabha Baalbek Nabha
203 Baalbek Naby Rchadeh Nabi Rachade

WATER SUPPLY AND WASTEWATER SYSTEMS MASTER PLAN FOR THE BWE INCEPTION REPORT P-1211
MARCH 2013 PAGE 46 OF 67
INC
EP
TIO
N R
EP
OR
T
Town Name as per
Source CNRS
No. Caza Name CDR DGA
204 Baalbek Naby Sabate Nabi Sbat
205 Baalbek Naby Chite Nabi Chit
206 Baalbek Naby Osmane Nabi Osmane
207 Baalbek Nahleh Nahle
208 Baalbek Yahfoufeh Yahfoufa
209 Baalbek Yammouneh Yammoune
210 Baalbek Younaine Younine
211 Baalbek Hourta'la Haour Taala
212 Baalbek Mrah El Harfouch Mrah EL Harfouch
213 Hermel Hermel Hermel
214 Hermel Berghoch Berghoch
215 Hermel Brayj Al Hermel Bray
216 Hermel Hay Bdita Bdita
217 Hermel Brissa Brissa
218 Hermel Bestane Al Hermel Boustane
219 Hermel B'oule Boule
220 Hermel Beit Hira Beit Hira
221 Hermel Bouwaydet Hermel Bouaida
222 Hermel Tal Al Hermel Tall El far
223 Hermel Jware Al Hachiche Jouar El Hachich
224 Hermel Jawz Jawz
225 Hermel Haret Al M'aysyre Haret El Maasser
226 Hermel Hariket Al Hermel Hariqa
227 Hermel Hmayret Al Hermel Hmaire
228 Hermel Hawch Beit Isma'l Hawch Beit Ismail
229 Hermel Hawch Al Sayyed Ali Haouch Es Saiyad Aali
230 Baalbek Khrayeb Al Hermel Kharayeb
231 Baalbek Ras Al 'Assy Ras al Assy
232 Hermel Zeghrine Zighrine
233 Hermel Zkiyeh Mrah Ez Zakbe
234 Hermel Zwaytini Zouaitini
235 Hermel Swayssy Souaisse
236 Hermel Sahleite Al Maa Salhat El Ma
237 Hermel Chrbine Al Hermel Charbine
238 Hermel Chwaghyre Al Tahta Chouaghir
239 Hermel Ain Al Jadideh Al He Ain al Jadideh
240 Hermel Faara Faara
241 Hermel Fissane Fissane
242 Hermel Kasser Qasr
243 Hermel Knafez Qanafez
244 Hermel Kwakh Kouakh
Town Name as per
Source CNRS
No. Caza Name CDR DGA
245 Hermel Mrah Bou Kamar Al Dine Mrah Bou Kamar al Dine
246 Hermel Mrah Beit "Elou Mrah Beit Aalaoui
247 Hermel Mrah Al Sayyade Mrah es Siyaid
248 Hermel Mrah Al Chaeb Mrah Ech Chaab
249 Hermel Mrah Al 'Abbas Mrah Aabbas
250 Baalbek Mrah Al Abed Mrah El Aabed
251 Hermel Mrah Al Mechref Mrah El Mouchref
252 Hermel Mrah Al Magher Mrah El Mougher
253 Hermel Mrah Nawass Mrah Naaouas
254 Hermel Mrah Yassine Mrah Yassine
255 Hermel Mrah Al Ain Mrah El Ain
256 Hermel Mazraet Beit Al Tac Mazraat Beit Et Tachm
257 Hermel Mazraet Al Fkyh Mazret al Fkyh
258 Hermel Mazraet Sajed Mrah Sejoud
259 Hermel Me'aser Al Hermel Maaisr
260 Hermel Mansouret Al Hermel Mansoureh
261 Hermel Mnayra Mnaira
262 Hermel Nassriyet Al Hermel Nasriye
263 Hermel Wady Bnyte Quadi Bnit
264 Hermel Wadi Al Terkmane Ouadi et Tourkmane
265 Hermel Wady Al Ratel Ouadi Er Ratle
266 Baalbek Wady A'lass Ouadi el Oss
267 Hermel Wady Al Karem Quadi el Karm
268 Hermel Wady Al Nyreh Ouadi en Nayra
269 Hermel Haouchariye Haouchariye
270 Hermel Mazraet et Talle Mazraat Et Talle
271 Hermel Mrah El Dalil Mrah El Dalil
272 Hermel Mrah Al Qraita Mrah el Qraita
273 Hermel Zighrine Et Tahta Zighrine Et Tahta
274 Rachiaya Rachaya Al Wady Rachaiya
275 Rachiaya Baka Bakka
276 Rachiaya Bkifa Bakkifa
277 Rachiaya Beit Lahya Beit Lahia
278 Rachiaya Byret Bire
279 Rachiaya Tannourah Tannoura
280 Rachiaya Helwet Haloua
281 Rachiaya Hawch Rachaya Haouch
282 Rachiaya Kherbet Rouha Khirbet Rouha
283 Rachiaya Deir Al Achayer Deir el Aachayer
284 Rachiaya Rfyde Rafid
285 Rachiaya Dahr Al Ahmar Dahr el Ahmar

WATER SUPPLY AND WASTEWATER SYSTEMS MASTER PLAN FOR THE BWE INCEPTION REPORT P-1211
MARCH 2013 PAGE 47 OF 67
INC
EP
TIO
N R
EP
OR
T
Town Name as per
Source CNRS
No. Caza Name CDR DGA
286 Rachiaya Akbet Aaqbe
287 Rachiaya Ayta Al Foukhare Aita el Foukhar
288 Rachiaya Ayha Aaiha
289 Rachiaya Ain Harcha Ain Hircha
290 Rachiaya Ain Arab Ain Aarab
291 Rachiaya Ain Ata Ain Aata
292 Rachiaya Kanabeh Qnaabe
293 Rachiaya Kfar Danisse Kfar Danis
294 Rachiaya Kfar Kouk Kfar Qouq
295 Rachiaya Kfar Mechki Kfar Mechki
296 Rachiaya Kawkaba Kaoukaba
297 Rachiaya Majdel Balhisse Majdel Balhis
298 Rachiaya Mhaydsset Mhaidse
299 Rachiaya Mdoukha Mdoukha
300 Rachiaya Marj Al Samah Marj es Simah
301 Rachiaya Mazraet Ja'far Mazraat Jaafar
302 Rachiaya Mazraet Deir Al Achaer Mazraat Dier el Aachayer
303 Rachiaya Mazraet Al Chmis Mazret Al Chmis
304 Rachiaya Yanta Yanta
305 Baalbek Mhattat Ras Baalbeck
306 Baalbek Aayoun Orghoush
307 Baalbek Qalaat BakdΓch
308 Hermel Ouadi Faara
309 Hermel Mrah Houssain Taane
310 Hermel AaqabΘ
311 Hermel Jisr el Aassi
A.4: Towns and villages names according to CAS
Town Name as per
Source CAS
No. Caza Name DGA
1 Zahle Zahleh
2 Zahle Zahleh El Midane
3 Zahle Zahleh Haouch Ez Zaraaneh
4 Zahle Zahleh Mar Mikhayel
5 Zahle Zahleh Mar Gerges
6 Zahle Zahleh Er Rassiyeh
7 Zahle Zahleh El Berbara
8 Zahle Zahleh Karak Nouh
9 Zahle Zahleh El Maallaqa
10 Zahle Zahleh Mar Antonios
11 Zahle Zahleh Maallaqa Aradi
12 Zahle Zahleh Haouch El Oumara Aradi
13 Zahle Zahleh Saydet En Najat
14 Zahle Karmeh (Qommol)
15 Zahle Zahleh Haouch El Oumara
16 Zahle Zahleh Aradi
17 Zahle Tall Chiha
18 Zahle Zahleh Mar Elias
19 Zahle Fourzol
20 Zahle Haql Hammana
21 Zahle Touayteh (Zahleh)
22 Zahle Dahr El Harf
23 Zahle Nabi Ayla
24 Zahle Hazerta
25 Zahle Ablah
26 Zahle Qaa Er Rim
27 Zahle Niha (Zahleh)
28 Zahle Ksara
29 Zahle Mazraat Er Remtaniyeh
30 Zahle Ain El Ghmiqa
31 Zahle Nabaa El Aassal (Remtaniyeh)
32 Zahle Ouadi El Aarayech
33 Zahle Jalala
34 Zahle Chtaura
35 Zahle Biyada (Zebdoul)
36 Zahle Naassat
37 Zahle Zebdoul
38 Zahle Makseh
39 Zahle Taalabaya

WATER SUPPLY AND WASTEWATER SYSTEMS MASTER PLAN FOR THE BWE INCEPTION REPORT P-1211
MARCH 2013 PAGE 48 OF 67
INC
EP
TIO
N R
EP
OR
T
Town Name as per
Source CAS
No. Caza Name DGA
40 Zahle Jdita
41 Zahle Dahr Es Souane (Jdita)
42 Zahle Dahr El Blayet
43 Zahle Taanayel
44 Zahle Saadnayel
45 Zahle Qabb Elias
46 Zahle Sahret El Qach
47 Zahle Haouch Mandra
48 Zahle Sraij
49 Zahle Mrayjat (Zahleh)
50 Zahle Bouarej
51 Zahle Chebrqiyet Tabet
52 Zahle Haouch Es Siyadeh
53 Zahle Ouadi Ed Delm
54 Zahle Ras El Ain (Ouadi Ed Delm)
55 Zahle Tcheflek Qiqano
56 Zahle Haouch Ed Dibs
57 Zahle Haouch Qayssar
58 Zahle Deir Zenoun
59 Zahle Barr Elias
60 Zahle Mazraat Zahleh
61 Zahle Tcheflik Eddeh Haouch
62 Zahle Tall El Akhdar
63 Zahle Aanjar (Haouch Moussa)
64 Zahle Chemsine
65 Zahle Bitias (Aanjar)
66 Zahle Kaboussiyeh (Aanjar)
67 Zahle Youghoun Oulouk (Aanjar)
68 Zahle Khodr Beik (Aanjar)
69 Zahle Haji Hbila (Aanjar)
70 Zahle Ouaqf (Aanjar)
71 Zahle Masnaa (Majdel Aanjar)
72 Zahle Majdel Aanjar
73 Zahle Nasriyeh (Zahleh)
74 Zahle Riyaq
75 Zahle Haouch Hala
76 Zahle Sahm Et Taoubeh
77 Zahle Aali En Nahri
78 Zahle Haouch El Ghanam
79 Zahle Tall El Aamara
80 Zahle Hoshmosh
Town Name as per
Source CAS
No. Caza Name DGA
81 Zahle Deir El Ghazal
82 Zahle Qoussaya
83 Zahle Nasriyet Rizk
84 Zahle Raait
85 Zahle Haret El Fikani
86 Zahle Terbol (Zahleh)
87 Zahle Qarqoud
88 Zahle Massa
89 Zahle Ain Kfar Zabad
90 Zahle Dalhamiyeh (Zahleh)
91 Zahle Faaour
92 Zahle Kfar Zabad
93 West Bekaa machghara
94 West Bekaa ain et tineh (b-g)
95 West Bekaa aaytanit
96 West Bekaa bab mareaa
97 West Bekaa deir ain ej jaouzeh
98 West Bekaa saghbine
99 West Bekaa loussia
100 West Bekaa ain zebdeh
101 West Bekaa khirbet qanafar
102 West Bekaa nabaa el khrayzat
103 West Bekaa kefraiya (b -g)
104 West Bekaa aana
105 West Bekaa deir tahniche
106 West Bekaa mansoura (b-g)
107 West Bekaa haouch aammiq
108 West Bekaa saalouk
109 West Bekaa aammiq (b-g)
110 West Bekaa jird aammiq
111 West Bekaa chebrqiyet aammiq
112 West Bekaa maydoun
113 West Bekaa joubb jannine
114 West Bekaa lala
115 West Bekaa kamed el laouz
116 West Bekaa tall znoub
117 West Bekaa tall znoub jdideh
118 West Bekaa baaloul (b-g)
119 West Bekaa ghazzeh
120 West Bekaa soultan yaaqoub
121 West Bekaa soultan yaaqoub et tahta

WATER SUPPLY AND WASTEWATER SYSTEMS MASTER PLAN FOR THE BWE INCEPTION REPORT P-1211
MARCH 2013 PAGE 49 OF 67
INC
EP
TIO
N R
EP
OR
T
Town Name as per
Source CAS
No. Caza Name DGA
122 West Bekaa tall ez zaazeaa
123 West Bekaa khiara
124 West Bekaa qaraaoun
125 West Bekaa soultan yaaqoub aradi
126 West Bekaa manara (hammara) ( b-g)
127 West Bekaa khiara el aatiqa
128 West Bekaa dakoueh
129 West Bekaa haouch el harimeh
130 West Bekaa jazira (b-g)
131 West Bekaa ouaqf (b-g)
132 West Bekaa saouiri
133 West Bekaa sohmor
134 West Bekaa harimeh es soughra
135 West Bekaa libbaya
136 West Bekaa marj (b-g)
137 West Bekaa yohmor (b-g)
138 West Bekaa zilaya
139 West Bekaa qelaya
140 West Bekaa raouda (istabel)
141 Baalbek baalbek
142 Baalbek chraouneh
143 Baalbek ras el ain (baalbek)
144 Baalbek maqassed
145 Baalbek camp wavel
146 Baalbek ain bourday
147 Baalbek douris
148 Baalbek iaat
149 Baalbek aaddous
150 Baalbek aamchki
151 Baalbek haouch tall safiyeh
152 Baalbek taybeh (baalbek)
153 Baalbek nahleh
154 Baalbek majdaloun
155 Baalbek haouch barada
156 Baalbek maqneh
157 Baalbek haouch ed dahab
158 Baalbek ain siyaa chadoura
159 Baalbek saaideh
160 Baalbek jebaa
161 Baalbek kfar dane
162 Baalbek mazraat ed dhour
Town Name as per
Source CAS
No. Caza Name DGA
163 Baalbek nabi rchadeh
164 Baalbek ain es saouda
165 Baalbek ouadi el assouad
166 Baalbek mazraat qold es sabaah
167 Baalbek masnaa ez zohr
168 Baalbek hadath (baalbek)
169 Baalbek mrah es sirghane
170 Baalbek siret hana
171 Baalbek ras baalbek es sahel
172 Baalbek fekeheh
173 Baalbek jdaidet el fekeheh
174 Baalbek ain (baalbek)
175 Baalbek ain baalbek haret ech chmaliye h
176 Baalbek ain baalbek haret el qobliyeh
177 Baalbek bajjajeh
178 Baalbek jabbouleh
179 Baalbek nabi osmane
180 Baalbek haouarteh
181 Baalbek khirbet haouarteh
182 Baalbek ras baalbek ech charqi
183 Baalbek mrah rafi
184 Baalbek maallaqet ej jdideh
185 Baalbek khirbet daoud (aarsal)
186 Baalbek khirbet et tineh
187 Baalbek khirbet younine
188 Baalbek aarsal haret ech chmaliyeh
189 Baalbek aarsal haret el qobliyeh
190 Baalbek aarsal
191 Baalbek laboueh
192 Baalbek taoufiqiyeh
193 Baalbek zabboud
194 Baalbek qaa baalbek
195 Baalbek ras el aassi
196 Baalbek ain ez zarqa
197 Baalbek deir mar maroun (baalbek)
198 Baalbek daouret en naml
199 Baalbek hlabta
200 Baalbek moqraq
201 Baalbek nouqra
202 Baalbek qaa ouadi el khanzir
203 Baalbek khirab ed dmaneh

WATER SUPPLY AND WASTEWATER SYSTEMS MASTER PLAN FOR THE BWE INCEPTION REPORT P-1211
MARCH 2013 PAGE 50 OF 67
INC
EP
TIO
N R
EP
OR
T
Town Name as per
Source CAS
No. Caza Name DGA
204 Baalbek qaa baayoun
205 Baalbek sbouba
206 Baalbek hay el mathaneh
207 Baalbek harbata
208 Baalbek qaa jouar maqiyeh
209 Baalbek faqrat
210 Baalbek nabha el qeddam
211 Baalbek aayoun orghoush
212 Baalbek nabha ed damdoum
213 Baalbek mrah el khaoukh (nabha ed damdoum)
214 Baalbek souaneh (nabha ed damdoum)
215 Baalbek harfouch
216 Baalbek aaiara
217 Baalbek qalileh (nabha)
218 Baalbek nabha el mehfara
219 Baalbek rasm el hadeth
220 Baalbek chaat
221 Baalbek qarha (baalbek)
222 Baalbek ram (baalbek)
223 Baalbek joubbaniyeh
224 Baalbek khourmata
225 Baalbek younine
226 Baalbek deir el ahmar
227 Baalbek qerrami
228 Baalbek bessailet et tahta
229 Baalbek bessailet el faouqa
230 Baalbek mrah el aaouja (deir el ahmar)
231 Baalbek mrah beit el qazah
232 Baalbek mchayrfeh
233 Baalbek mchaitiyeh
234 Baalbek kneisseh (baalbek)
235 Baalbek bechouat
236 Baalbek zrazir
237 Baalbek beit es stayteh
238 Baalbek beit habchi
239 Baalbek safra (bechouat)
240 Baalbek blaiqa
241 Baalbek mrah semaane
242 Baalbek mrah el aaouja (barqa)
243 Baalbek barqa
244 Baalbek mrah soukkar
Town Name as per
Source CAS
No. Caza Name DGA
245 Baalbek mrah el aassi
246 Baalbek riha
247 Baalbek dar el ouassaa
248 Baalbek marmagha
249 Baalbek beit bou slaybi
250 Baalbek mrah bou chahine
251 Baalbek mazraat beit el ghoussain
252 Baalbek btedaai
253 Baalbek aaynata (baalbek)
254 Baalbek maqial el qalaa
255 Baalbek mrah el qloud
256 Baalbek yammouneh
257 Baalbek bednayel (baalbek)
258 Baalbek masnaa (bednayel)
259 Baalbek louayzeh (qsarnaba)
260 Baalbek qsarnaba
261 Baalbek temnine el faouqa
262 Baalbek beit chama
263 Baalbek fraij
264 Baalbek mazraat beit taqch
265 Baalbek haouch er rafqa
266 Baalbek mousrayeh
267 Baalbek slouqi
268 Baalbek temnine et tahta
269 Baalbek aaqidiyeh
270 Baalbek kfar dabach
271 Baalbek mazraat beit slaybi
272 Baalbek chmistar
273 Baalbek haouch en nabi
274 Baalbek haouch snaid
275 Baalbek mazraat al souaydane
276 Baalbek taraya
277 Baalbek serraaine el faouqa
278 Baalbek serraaine et tahta
279 Baalbek talia
280 Baalbek hizzine
281 Baalbek sifri
282 Baalbek khodr (baalbek)
283 Baalbek nabi chit
284 Baalbek jenta
285 Baalbek yahfoufa

WATER SUPPLY AND WASTEWATER SYSTEMS MASTER PLAN FOR THE BWE INCEPTION REPORT P-1211
MARCH 2013 PAGE 51 OF 67
INC
EP
TIO
N R
EP
OR
T
Town Name as per
Source CAS
No. Caza Name DGA
286 Baalbek haour taala
287 Baalbek brital
288 Baalbek khreibeh (baalbek)
289 Baalbek mazraat beit mchaik
290 Baalbek mrah oum aali
291 Baalbek mazraat beit mchaik (bouday)
292 Baalbek mrah el ahmar
293 Baalbek zarayeb choukr
294 Baalbek mrah beit aassaf
295 Baalbek mrah beit slim
296 Baalbek hafayer
297 Baalbek mazraat er remassa
298 Baalbek bouday
299 Baalbek zarayeb (baalbek)
300 Baalbek aallaq et tell
301 Baalbek mazraat ed dallil
302 Baalbek zribet es sabha
303 Baalbek mazraat et tout
304 Baalbek flaoueh
305 Baalbek mrah ej jaddaoui
306 Baalbek mrah bou brahim
307 Baalbek maaraboun
308 Baalbek ham
309 Baalbek ain el bounaya
310 Baalbek mazraat beit matar
311 Baalbek mrah najib
312 Baalbek chlifa
313 Baalbek mazraat es sayed
314 Baalbek chaaibeh
315 Baalbek nabi chbat
316 Baalbek ain ej jaouzeh (baalbek)
317 Baalbek tfail
318 Hermel hermel
319 Hermel bdayta
320 Hermel brayj (hermel)
321 Hermel daoura (hermel)
322 Hermel hermel ed daiaa
323 Hermel hermel el ouaqf
324 Hermel kouakh
325 Hermel mrah ez zekbi
326 Hermel mansoura (hermel)
Town Name as per
Source CAS
No. Caza Name DGA
327 Hermel qanafez
328 Hermel tall el far
329 Hermel aaqabeh (hermel)
330 Hermel bouayda (hermel)
331 Hermel chouaghir et tahta
332 Hermel chouaghir el faouqa
333 Hermel jisr el aassi
334 Hermel sahlat el may
335 Hermel nasriyeh (hermel)
336 Hermel qasr (hermel)
337 Hermel beit et tachm
338 Hermel beit hira
339 Hermel haouch beit ismail
340 Hermel haouch es sayed aali
341 Hermel mrah ech charqi
342 Hermel mrah el gharbi
343 Hermel mchaa marjhine
344 Hermel souaydiyeh
345 Hermel jaouz
346 Hermel zighrine el hermel
347 Hermel barghach
348 Hermel haret el maasser
349 Hermel mrah en naouas
350 Hermel ouadi er ratl
351 Hermel mrah el moghr
352 Hermel ouadi el karm (hermel)
353 Hermel ouadi et tourkmane
354 Hermel mrah ez zouaitineh
355 Hermel baaoul (hermel)
356 Hermel mrah yassine
357 Hermel mazraat el fqih
358 Hermel mazraat sejoud (hermel)
359 Hermel mrah beit aallaou
360 Hermel mrah bou qamar ed dine
361 Hermel mrah ech chqif
362 Hermel mrah es siyad
363 Hermel mrah aabbas
364 Hermel mrah el mechref
365 Hermel mrah chnayn
366 Hermel ras aaqabet er ratl
367 Hermel charbine el hermel

WATER SUPPLY AND WASTEWATER SYSTEMS MASTER PLAN FOR THE BWE INCEPTION REPORT P-1211
MARCH 2013 PAGE 52 OF 67
INC
EP
TIO
N R
EP
OR
T
Town Name as per
Source CAS
No. Caza Name DGA
368 Hermel marjhine
369 Hermel mrah es souaisseh
370 Hermel brissa
371 Hermel jouar el hachich
372 Hermel ain ej jdideh (hermel)
373 Hermel beit es semmaqa
374 Hermel hmaireh (hermel)
375 Hermel mrah ras el ain
376 Hermel fissane
377 Hermel hariqa (hermel)
378 Hermel mazraat et talleh
379 Hermel boustane (hermel)
380 Hermel mrah el aarab
381 Hermel mrah ech chmis
382 Hermel ras baalbek el gharbi
383 Hermel kneisseh (ras baalbek el gharbi)
384 Hermel ouadi en nayra
385 Hermel qorrayti
386 Hermel mrah el qorneh
387 Hermel ouadi bnit
388 Hermel ras baalbek ouadi faara
389 Hermel qalaat bakdach
390 Hermel mrah ed dahr
391 Hermel ouadi faara
392 Hermel faara
393 Hermel mrah el mahlisseh
394 Hermel mrah el aaqabeh
395 Hermel mrah ez zouarib
396 Hermel hermel jbab
397 Hermel bou sawaya
398 Hermel biyout el hajj hsain
399 Hermel biyout es souh
400 Hermel jouret el mzar
401 Hermel biyout aaouad
402 Hermel biyout er rouais
403 Hermel mdaouesh
404 Hermel beit aallaou
405 Hermel beit aallam
406 Hermel maaysra (hermel)
407 Hermel kharayeb (hermel)
408 Hermel mrah ech choaab
Town Name as per
Source CAS
No. Caza Name DGA
409 Hermel ouadi el aaoss
410 Hermel mrah el aabd
411 Rachiaya rachaiya el ouadi
412 Rachiaya rachaiya el faouqa
413 Rachiaya rachaiya el kaouasbeh
414 Rachiaya rachaiya el midane
415 Rachiaya marj es samah
416 Rachiaya mazraat el faqaa
417 Rachiaya aaqabet rachaiya
418 Rachiaya mazraat jebb farah
419 Rachiaya mazraat aaz el aarab
420 Rachiaya aayha
421 Rachiaya bakkifa (rachaiya)
422 Rachiaya dahr el ahmar
423 Rachiaya beit lahia
424 Rachiaya tannoura
425 Rachiaya kfar qouq
426 Rachiaya kfar denis
427 Rachiaya mhaiydseh (rachaiya)
428 Rachiaya kaoukaba bou aarab
429 Rachiaya ain horcheh
430 Rachiaya khirbet rouha
431 Rachiaya kfar michki
432 Rachiaya mazraat ech chamisseh
433 Rachiaya rafid (rachaiya)
434 Rachiaya haouch el qinnaabeh (rachaiya)
435 Rachiaya mazraat jaafar
436 Rachiaya qinaabeh
437 Rachiaya bireh (rachaiya)
438 Rachiaya mazraat aazzi
439 Rachiaya ain aarab (rachaiya)
440 Rachiaya ain aata
441 Rachiaya majdel balhis
442 Rachiaya bakka
443 Rachiaya mdoukha
444 Rachiaya mazraat ain qeniyeh
445 Rachiaya yanta
446 Rachiaya mazraat el qalyoun
447 Rachiaya deir el aachayer
448 Rachiaya mazraat selsata
449 Rachiaya aayta el foukhar

WATER SUPPLY AND WASTEWATER SYSTEMS MASTER PLAN FOR THE BWE INCEPTION REPORT P-1211
MARCH 2013 PAGE 53 OF 67
INC
EP
TIO
N R
EP
OR
T
Town Name as per
Source CAS
No. Caza Name DGA
450 Rachiaya bayader el aadas
451 Rachiaya heloueh (rachaiya)
452 Rachiaya nabi safa
453 Rachiaya toultata
A.5: Population Survey Questionnaire
- Caza :
- Town :
(or Village(s) within Municipality):
- Name of Mayor :
- Nb of registered inhabitants :
- Nb of Residents in summer :
- Nb of Residents in winter :
- Nb of dwellings :
- Nb of restaurants :
- Nb of clubs :
- Nb of hotels :
(Total hotel rooms) :
- Nb of touristic complexes :
(Number of Chalets & Apartments rented seasonally) :
- Nb of NGOs :
- Nb of hospitals :
(Total Number of Beds) :
- Nb of dispensaries :
- Nb of industrial plants & shops :
- Nb of fuel stations :
- Nb of commercial facilities :
- Nb of car repair shops :
- Nb of industrial zones: actual & projected within the Municipality:

WATER SUPPLY AND WASTEWATER SYSTEMS MASTER PLAN FOR THE BWE INCEPTION REPORT P-1211
MARCH 2013 PAGE 54 OF 67
INC
EP
TIO
N R
EP
OR
T
- Is there a master plan at the Urban Planning Directorate that encompasses the
municipality:
Yes No
Number of
Students Type
Number of
Schools
- Population Expansion :
Number of building permits within last 10 years :
Nb of housing projects planned :
- Nb of subscribers with Electricité du Liban :
- Nb of subscribers with BWE :
- Potable Water Sources :
Network Well Spring
Please provide a Description of the network & its status (size of pipes, network extent, etc….)
- Status of Wastewater in the Municipality:
Septic Tank Treatment Plant Sewer Network Other
Please provide a Description of the sewer network (size of pipes, network extent, etc….). If there is a
treatment plant, provide the name of the authority responsible for its execution, the execution date, and
the discharge location (river, valley, etc…)
- Irrigation water source:
Canal Network Well Spring
Please describe the irrigation network and its status (size of canals, pipes, extent of network, etc….)
Remarks:
Date Signature of Mayor

WATER SUPPLY AND WASTEWATER SYSTEMS MASTER PLAN FOR THE BWE INCEPTION REPORT P-1211
MARCH 2013 PAGE 55 OF 67
INC
EP
TIO
N R
EP
OR
T
A.6: Water Needs in m³ for the Bekaa Region from “Analyse des stratégies et prospectives de l’eau au Liban” – (Plan Bleu-UNEP 2001)
Table A.7: Wastewater Treatment Plants for in the North & South of Bekaa from SIU-MRHE (2000)
Wastewater Treatment Plants for in the North of Bekaa
Code Caza Region / Village Population equivalent
Capaciy m3/day
Horizon Design Office Niveau de
l'étude Treatment
level Cost treatment
USD Land cost USD
Total cost USD
Authority Financing
1401 Hermel Madaech 3,354 500 2020 DAH-NT Plan Direct. Secondaire 570,000 50,000 670,000 MRHE 1402 Hermel Beit Ismail 106,284 10932 2020 DAH-NT Plan Direct. Secondaire 5,420,000 500,000 5,920,000 MRHE 1403 Hermel El Boustan 9,648 989 2020 DAH-NT Plan Direct. Secondaire 1,100,000 100,000 1,200,000 MRHE 1501 Baalbek Baalbeck 88,660 12412 2005 HH Détaillé Secondaire 4,790,000 800,000 5,590,000 MRHE 1503 Baalbek Chlifa 67,874 9500 2020 DAH-NT Plan Direct. Secondaire 3,870,000 350,000 4,220,000 MRHE 1504 Baalbek Mrah Abiad 40,230 4515 2020 DAH-NT Plan Direct. Secondaire 2,780,000 150,000 2,930,000 MRHE 1505 Hermel Mrah El-Dahar 2,858 275 2020 DAH-NT Plan Direct. Secondaire 510,000 45,000 760,000 MRHE 1506 Baalbek Laboue 59,980 7800 2020 DAH-NT Détaillé Secondaire 3,600,000 400,000 4,000,000 CDR 1510 Baalbek Maaraboun 3,727 383 2020 DAH-NT Plan Direct. Secondaire 600,000 60,000 660,000 MRHE 1511 Baalbek Yammouneh 5,840 632 2020 DAH-NT Plan Direct. Secondaire 810,000 90,000 900,000 MRHE 1512 Baalbek Ainata 3,870 398 2020 DAH-NT Plan Direct. Secondaire 630,000 70,000 700,000 MRHE 1513 Baalbek Harfouch 62,966 6709 2020 DAH-NT Plan Direct. Secondaire 3,780,000 420,000 4,200,000 MRHE 1514 Baalbek Aarsal 46,287 4,967 2020 DAH-NT Plan Direct. Secondaire 3,050,000 340,000 3,390,000 MRHE 1515 Baalbek Qaa 10,526 1144 2020 DAH-NT Plan Direct. Secondaire 1,170,000 130,000 1,300,000 MRHE
GRAND TOTAL
512,104 61,156
32,680,000 3,505,000 36,440,000

WATER SUPPLY AND WASTEWATER SYSTEMS MASTER PLAN FOR THE BWE INCEPTION REPORT P-1211
MARCH 2013 PAGE 56 OF 67
INC
EP
TIO
N R
EP
OR
T
Wastewater Treatment Plants for in the South of Bekaa
Code Caza Region / Village Equivalent population
Capacity m3/day
Horizon Design Office Type of study
Treatment level
Treatment cost USD
Land cost USD Total cost
USD Authority Financing
1401 Hermel Madaech 3,354 500 2020 DAH-NT MasterPlan Secondaire 570,000 17,000 670,000 MRHE 1402 Hermel Beit Ismail 106,284 10932 2020 DAH-NT MasterPlan Secondaire 5,420,000 531,000 5,920,000 MRHE 1403 Hermel El Boustan 9,648 989 2020 DAH-NT MasterPlan Secondaire 1,100,000 48,000 1,200,000 MRHE 1501 Baalbek Baalbeck 88,660 12412 2005 HH Detailed Secondaire 4,790,000 887,000 5,590,000 MRHE 1502 Zahlé Timnine Tahta 366,500 42000 2020 DAH-NT/MM MasterPlan Secondaire 12,090,000 2,566,000 12,540,000 MRHE 1503 Baalbek Chlifa 67,874 9500 2020 DAH-NT MasterPlan Secondaire 3,870,000 339,000 4,220,000 MRHE 1504 Baalbek Mrah Abiad 40,230 4515 2020 DAH-NT MasterPlan Secondaire 2,780,000 201,000 2,930,000 MRHE 1505 Hermel Mrah El-Dahar 2,858 275 2020 DAH-NT MasterPlan Secondaire 510,000 29,000 760,000 MRHE 1506 Baalbek Laboue 59,980 7800 2020 DAH-NT Detailed Secondaire 3,600,000 480,000 4,000,000 CDR 1510 Baalbek Maaraboun 3,727 383 2020 DAH-NT MasterPlan Secondaire 600,000 30,000 660,000 MRHE 1511 Baalbek Yammouneh 5,840 632 2020 DAH-NT MasterPlan Secondaire 810,000 47,000 900,000 MRHE 1512 Baalbek Ainata 3,870 398 2020 DAH-NT MasterPlan Secondaire 630,000 39,000 700,000 MRHE 1513 Baalbek Harfouch 62,966 6709 2020 DAH-NT MasterPlan Secondaire 3,780,000 441,000 4,200,000 MRHE 1514 Baalbek Aarsal 46,287 4,967 2020 DAH-NT MasterPlan Secondaire 3,050,000 463,000 3,390,000 MRHE 1515 Baalbek Qaa 10,526 1144 2020 DAH-NT MasterPlan Secondaire 1,170,000 105,000 1,300,000 MRHE 1601 Zahlé Zahlé 206,600 37000 2015 Franceshetti Prog. conc. Secondaire 8,680,000 - 9,730,000 CDR Italy 1602 Zahlé El Marj 180,000 25200 2015 BTD Prog. conc. Secondaire 7,560,000 1,080,000 8,400,000 CDR 1605 Zahlé Delhamieh 21,500 2590 2020 M. Mezher MasterPlan Secondaire 1,810,000 215,000 2,010,000 MRHE 1606 Zahlé Kfar Zabad 31,600 3800 2020 M. Mezher MasterPlan Secondaire 2,370,000 316,000 2,630,000 MRHE 1701 Bekaa west Joub Jannin 71,600 10700 2015 BTD Detailed Secondaire 4,080,000 501,000 4,320,000 MRHE 1702 Bekaa west Qaraoun 24,000 3600 2015 BTD Detailed Secondaire 1,940,000 168,000 2,130,000 MRHE Italy 1703 Bekaa west Saghbine 4,100 600 2015 BTD Detailed Secondaire 640,000 41,000 680,000 MRHE 1704 Bekaa west Deir Tahnic 5,000 800 2015 BTD MasterPlan Secondaire 740,000 50,000 840,000 MRHE 1705 Bekaa west Sohmor 4,800 720 2015 BTD Detailed Secondaire 710,000 48,000 810,000 MRHE 1706 Bekaa west Yohmor 6,000 900 2015 BTD MasterPlan Secondaire 810,000 60,000 910,000 MRHE 1707 Bekaa west Kellaya 1,200 144 2015 BTD MasterPlan Secondaire 310,000 12,000 360,000 MRHE 1708 Bekaa west Zellaya 300 36 2015 BTD MasterPlan Secondaire 140,000 3,000 170,000 MRHE
GRAND TOTAL 1,435,304 189,246 74,560,000 8,717,000 81,970,000

WATER SUPPLY AND WASTEWATER SYSTEMS MASTER PLAN FOR THE BWE INCEPTION REPORT P-1211
MARCH 2013 PAGE 57 OF 67
INC
EP
TIO
N R
EP
OR
T
A.8: Wastewater Treatment Plant locations from “Master Plan Study to Locate Waste Water
Treatment Plants in Bekaa” (DAHNT 1994 – Ministry of Housing and Cooperative)

WATER SUPPLY AND WASTEWATER SYSTEMS MASTER PLAN FOR THE BWE INCEPTION REPORT P-1211
MARCH 2013 PAGE 58 OF 67
INC
EP
TIO
N R
EP
OR
T

WATER SUPPLY AND WASTEWATER SYSTEMS MASTER PLAN FOR THE BWE INCEPTION REPORT P-1211
MARCH 2013 PAGE 59 OF 67
INC
EP
TIO
N R
EP
OR
T

WATER SUPPLY AND WASTEWATER SYSTEMS MASTER PLAN FOR THE BWE INCEPTION REPORT P-1211
MARCH 2013 PAGE 60 OF 67
INC
EP
TIO
N R
EP
OR
T
APPENDIX B:
APPENDIX B:
B.1 ROAD NETWORKS, SDATL, 2002
B.2 RAINFALL DISTRIBUTION MAP, PLASSARD, 1:200,000, 1971
B.3 GEOLOGICAL MAP, L. DUBERTRET, 1:50,000, 1945
B.4 HYDROLOGICAL MAP, TOPOGRAPHIC MAP DGA, 1:50,000, 1945
B.5 INDUSTRIES DISTRIBUTION IN THE BEKAA, SDATL, 2002
B.6 LAND USE, MOA, 1:20,000, 2001
B.7 SOIL MAP, GEZE, 1954
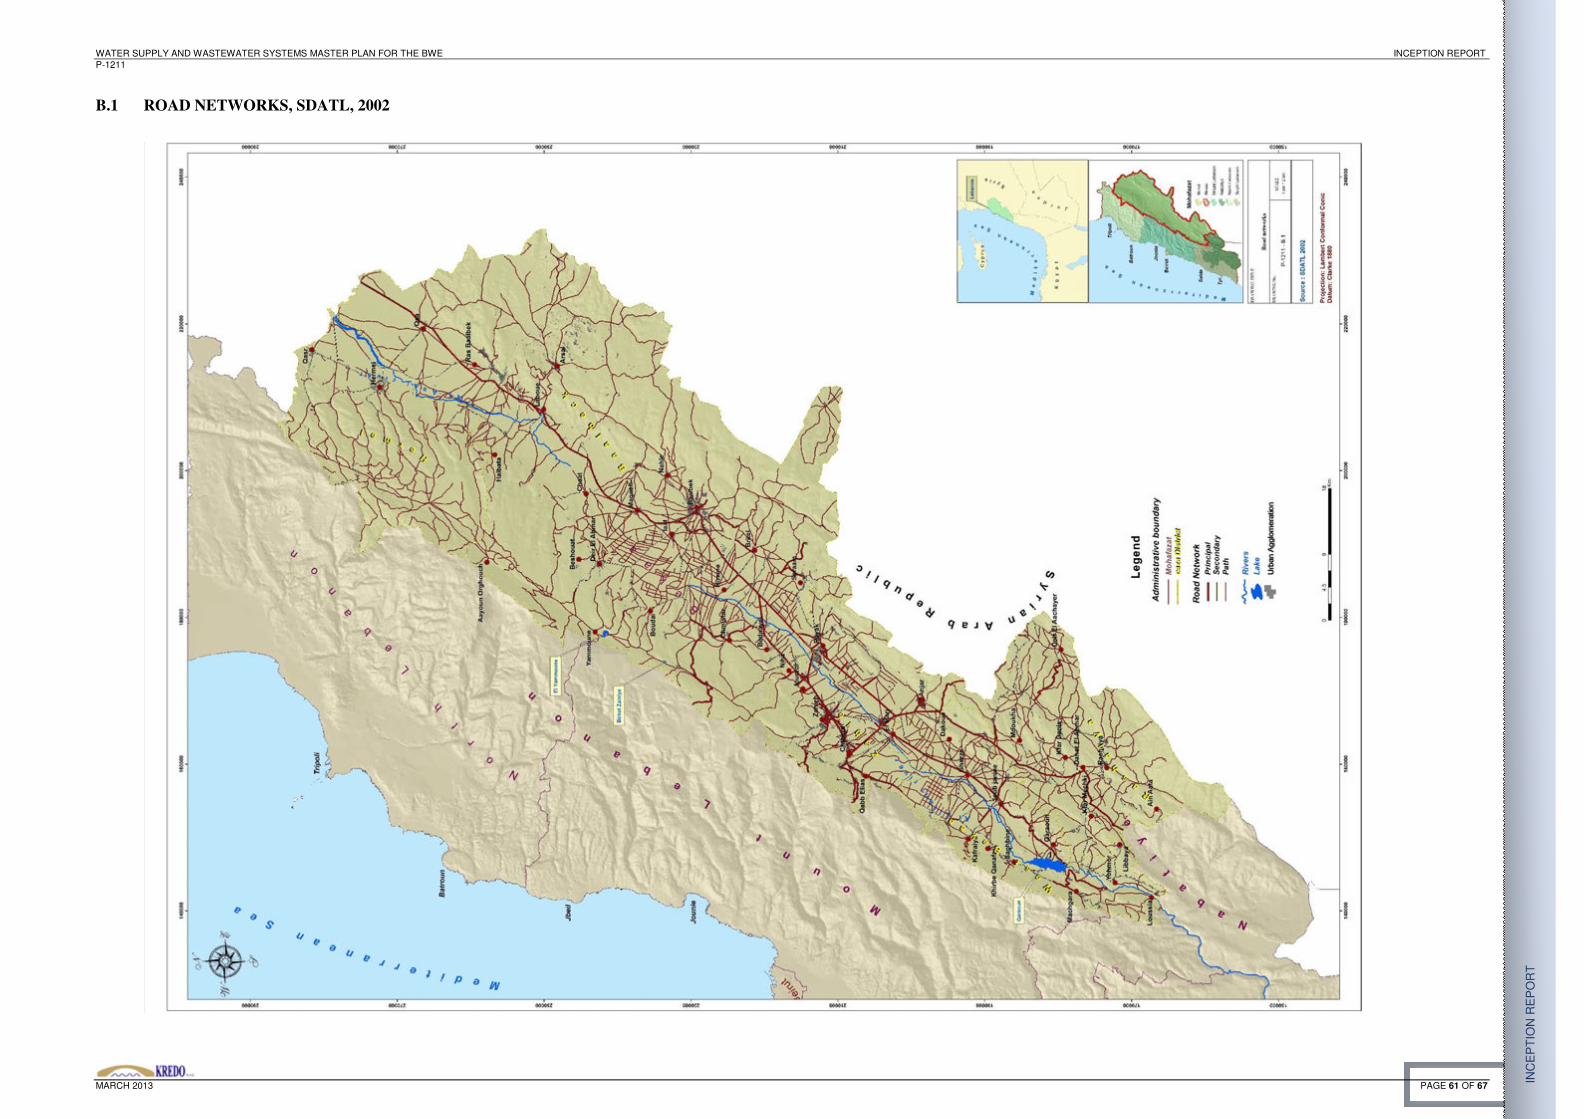
WATER SUPPLY AND WASTEWATER SYSTEMS MASTER PLAN FOR THE BWE INCEPTION REPORT P-1211
MARCH 2013 PAGE 61 OF 67
INC
EP
TIO
N R
EP
OR
T
B.1 ROAD NETWORKS, SDATL, 2002
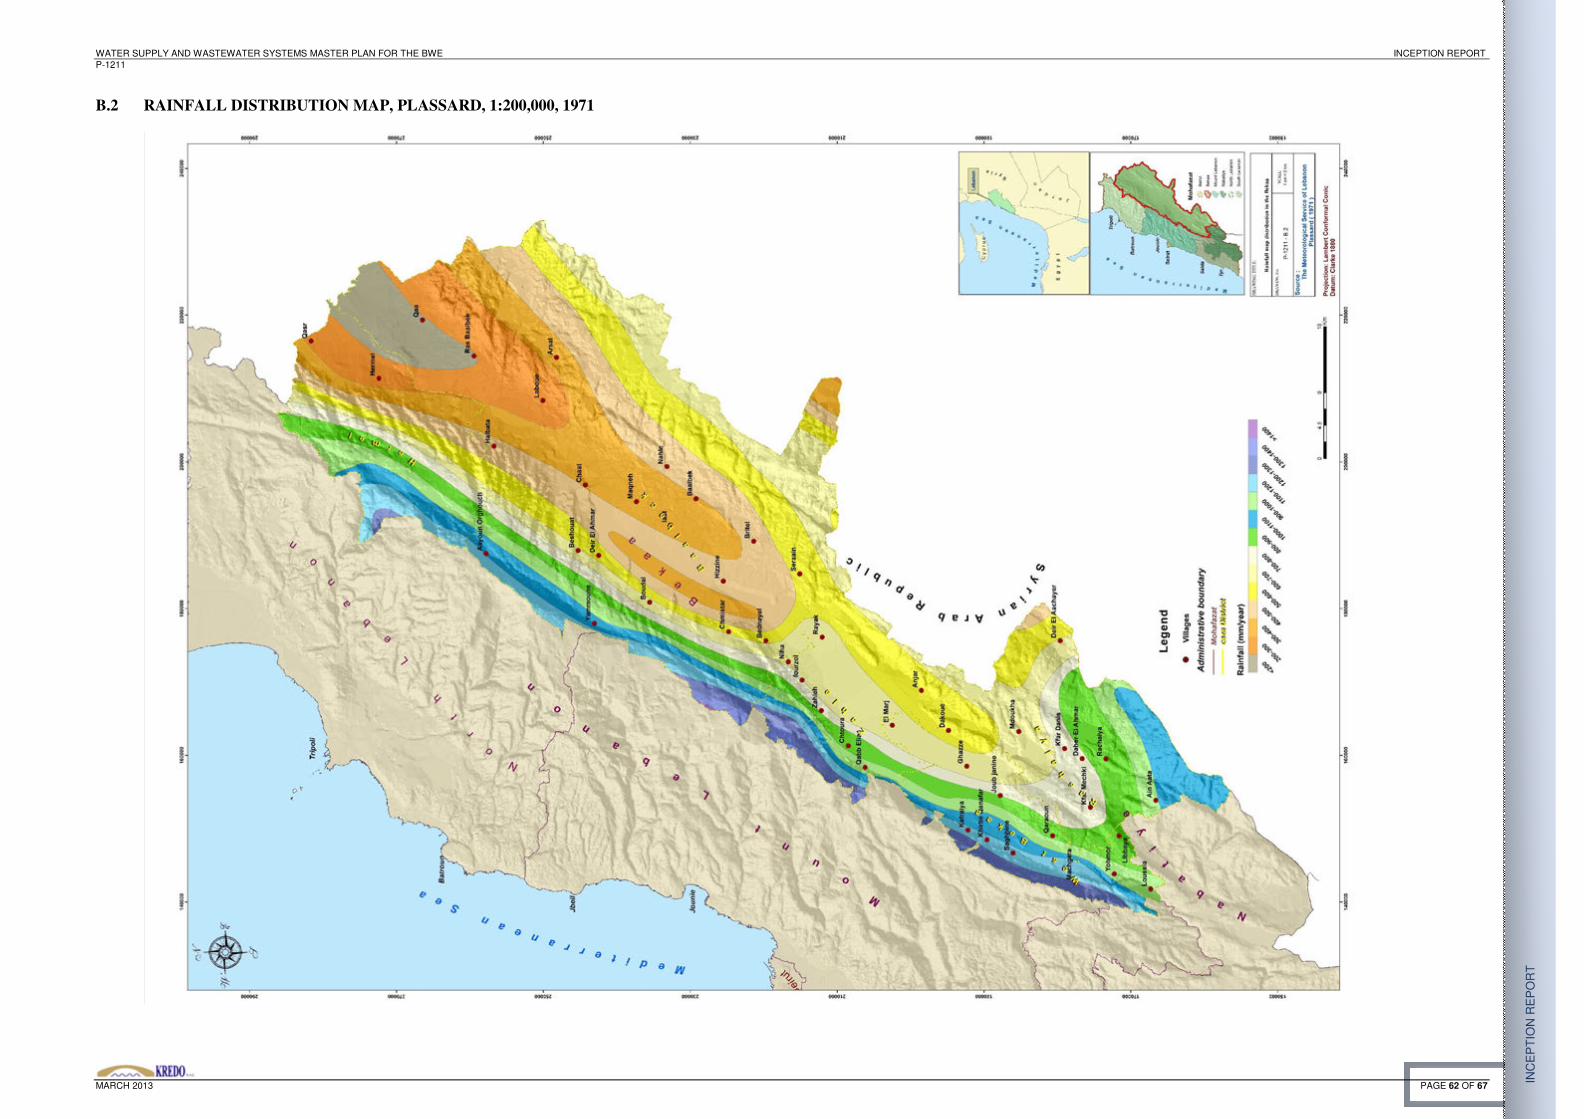
WATER SUPPLY AND WASTEWATER SYSTEMS MASTER PLAN FOR THE BWE INCEPTION REPORT P-1211
MARCH 2013 PAGE 62 OF 67
INC
EP
TIO
N R
EP
OR
T
B.2 RAINFALL DISTRIBUTION MAP, PLASSARD, 1:200,000, 1971

WATER SUPPLY AND WASTEWATER SYSTEMS MASTER PLAN FOR THE BWE INCEPTION REPORT P-1211
MARCH 2013 PAGE 63 OF 67
INC
EP
TIO
N R
EP
OR
T
B.3 GEOLOGICAL MAP, L. DUBERTRET, 1:50,000, 1945

WATER SUPPLY AND WASTEWATER SYSTEMS MASTER PLAN FOR THE BWE INCEPTION REPORT P-1211
MARCH 2013 PAGE 64 OF 67
INC
EP
TIO
N R
EP
OR
T
B.4 HYDROLOGICAL MAP, TOPOGRAPHIC MAP DGA, 1:50,000, 1945

WATER SUPPLY AND WASTEWATER SYSTEMS MASTER PLAN FOR THE BWE INCEPTION REPORT P-1211
MARCH 2013 PAGE 65 OF 67
INC
EP
TIO
N R
EP
OR
T
B.5 INDUSTRIES DISTRIBUTION IN THE BEKAA, SDATL, 2002

WATER SUPPLY AND WASTEWATER SYSTEMS MASTER PLAN FOR THE BWE INCEPTION REPORT P-1211
MARCH 2013 PAGE 66 OF 67
INC
EP
TIO
N R
EP
OR
T
B.6 LAND USE, MOA, 1:20,000, 2001

WATER SUPPLY AND WASTEWATER SYSTEMS MASTER PLAN FOR THE BWE INCEPTION REPORT P-1211
MARCH 2013 PAGE 67 OF 67
INC
EP
TIO
N R
EP
OR
T
B.7 SOIL MAP, GEZE, 1954