vodafone group plc results - welcome to vodafone · vodafone group plc results 17 may 2016 for the...
TRANSCRIPT

Vodafone Group Plc Results
17 May 2016
For the year ended 31 March 2016
1

Information in this presentation relating to the price at which
relevant investments have been bought or sold in the past or the
yield on such investments cannot be relied upon as a guide to the
future performance of such investments.
This presentation does not constitute an offering of securities or
otherwise constitute an invitation or inducement to any person to
underwrite, subscribe for or otherwise acquire or dispose of
securities in any company within the Group.
This presentation contains forward-looking statements within the
meaning of the US Private Securities Litigation Reform Act of 1995
which are subject to risks and uncertainties because they relate to
future events. Some of the factors which may cause actual results
to differ from these forward-looking statements are discussed on
the final slide of this presentation.
Disclaimer
This presentation also contains non-GAAP financial which the
Group’s management believes is valuable in understanding the
performance of the Group. However, non-GAAP information is not
uniformly defined by all companies and therefore it may not be
comparable with similarly titled measures disclosed by other
companies, including those in the Group’s industry. Although
these measures are important in the assessment and
management of the Group’s business, they should not be viewed
in isolation or as replacements for, but rather as complementary
to, the comparable GAAP measures.
Vodafone, the Vodafone Speech Mark, the Vodafone Portrait,
Vodacom and M-Pesa are trademarks of the Vodafone Group. The
Vodafone Rhombus is a registered design of the Vodafone Group.
Other product and company names mentioned herein may be the
trademarks of their respective owners.
2

Group Chief Executive Vittorio Colao
Business review

Financial performance • Return to full year service revenue +1.5% and EBITDA +2.7% growth
• Q4 Group service revenue +2.5%; underlying +1.8%
• Stabilisation in Europe, Q4 service revenue +0.5%
• Strong execution continues in AMAP, Q4 service revenue accelerated to +8.1%
• Good cost control, raising synergy targets for KDG and Ono
• Full year guidance met: EBITDA £11.9 billion and free cash flow £1.0 billion on guidance basis
All growth rates shown in this document are organic unless otherwise stated
Full year highlights
Strategic progress and commercial momentum • Successful completion of Project Spring build
• Significant improvement in net promoter score: leader in 13/21 markets, improving in 15 markets
• Driving data: 47m 4G customers +126%, 73m 3G data users in emerging markets, data volumes +71%
• Enterprise continues to outperform peers, FY 15/16 +2.1%
• Unified communications: record fixed broadband growth, 30m EU households on-net NGN, strategic agreements in
Netherlands and Italy; 21% of Group revenues from fixed
4

Vodafone’s strategy
A converged communications leader
Core footprint
Number 1 or 2 in mobile
Four growth engines
1. Data
2. Fixed
3. Emerging markets
4. Enterprise Unified communications
Path to
Deeper and stronger
in existing markets – Organic investment
– Spectrum
– Acquisitions
Leading data network quality
in 15/20 markets
UC assets in all key markets
Service revenue
Q4 13/14
(4.0)%
Q4 15/16
2.5%
Europe,
Africa and India
5

Vodafone’s strategy: substantial investments
1. Accrued capital expenditure
2. Renewals and acquisitions
3. Internet of Things (‘IoT’) previously called Machine-to-Machine
Last 3 years
Capex1 (o/w £19bn
Project Spring)
102,000 new high capacity backhaul
links for improved data
experience
203,000 new and upgraded base stations to improve coverage and quality
£24.1bn
16 circles in India with 3G/4G
to increase data quality
17 markets have 800/700 spectrum for 4G (vs. 4 in 2013)
Spectrum
and licences2
£7.7bn
KDG, Ono, Hellas Online,
Cobra acquired leading fixed and IoT3 companies to become a fully converged operator
Acquisitions
£14.7bn £47bn
Total
6

Vodafone strategy: key programmes
7
FY 13 /14 Verizon Wireless disposal
PROJECT SPRING
CUSTOMER EXPERIENCE:
CARE
FIT FOR GROWTH / ZBB

Enhancing the customer experience: Project Spring
Mobile
Enterprise
Fully modernised network
Fixed
1. Targeted urban areas
2. IoT Global SIM available in over 200 countries
3. Points of Presence
Broad reach
Single RAN sites EU 4G coverage India 3G coverage1
Enhanced customer experience
Europe AMAP
Dropped call rate
Sept 2013 Mar 2016
Homes reached
with own NGN
Converged service in all key markets
Sept 2013 Mar 2016
Fixed broadband
customers
Enhanced capability
Countries IoT platform
available2
IP-VPN PoPs3
Sept 2013 Mar 2016
97k 212k
32%
87%
83%
95% 76%
91% 1.3% <0.9%
268
171 30 22
13.4m
6.9m 30m
14m
3G/4G data sessions >3Mbps
8

Enhancing the customer experience: CARE
Connectivity that is reliable and secure
Always in control
Reward loyalty Easy access
Network satisfaction guaranteed
Cost control with no surprises
Extra rewards and service
Always available, ask only once
EU & US roaming included in new Red tariffs
50% discount on prepaid value bundles
In-store experts providing technical expertise
30 day satisfaction guarantee
9

Enhancing the customer experience: NPS leadership
SP
(4.7)
(3.1)
(2.3)
2.0
FY 12/13 FY 13/14 FY 14/15 FY 15/16
18.6 17.9 17.6 17.0 17.0 16.7
16.2 16.4
14.6
16.4
13.9 15.4
Q2 13/14 Q4 13/14 Q2 14/15 Q4 14/15 Q2 15/16 Q4 15/16
Consumer contract Enterprise
Europe churn reducing
Consumer NPS (Group average) Difference to best competitor
Consumer NPS
EG IN IT SA TU
• Leading in 13/21 markets representing ~60% of revenue
GH PT GR CZ HU MT RO
10
(%)
(points)

Driving growth: data
Increasing penetration of 4G customers (m)
20.7 24.2
30.1 34.8
46.8
15.9 18.9
24.3 28.1
33.4
Q4 14/15 Q1 15/16 Q2 15/16 Q3 15/16 Q4 15/16
Group
Europe • 50% of Europe data is 4G
• EU average smartphone usage 1.1GB 1
• 5.1m new users in Turkey, India and Albania in Q4
1. iOS and Android
2. AMAP
Higher ARPU at lower unit prices ‘More for more’ in Germany (April 2016)
Unlimited EU roaming
Extra 1GB
LTE max
€44.99 €39.99
Other moves:
• Italy (Sept 2015)
• Spain (April 2016)
• UK (May 2016)
44.7 54.0
61.6 67.8 72.5 2.0 2.2
2.4 2.9
9.2
Q4 14/15 Q1 15/16 Q2 15/16 Q3 15/16 Q4 15/16
4G
3G
Strong data adoption in emerging markets 3G and 4G data users (m) as a % of total data users
• Data volumes +82%1
• Average smartphone usage 745MB 1,2 (+41%)
46% 40%
52% 55%
63%
18
21
Contract 3G to 4G Prepaid 2G to 3G
Monetising data growth South Africa ARPU uplift from device migration (%)
• Average data usage 590MB (+43%); web applications and streaming
11

0.0
2.1
(0.8)
4.4
0.3 1.3
FY 14/15 FY 15/16
Total Enterprise
Fixed
Mobile
Organic service revenue growth (%)
Project Spring achievements Financial performance
268 PoPs (+57%)
in 70 countries
Cloud & Hosting in
12 countries
IoT platform in
30 countries1
One Net2 in
30 countries
FY 15/16
• Fixed: IP-VPN +8.0%
• Mobile: customers +7.4%, ARPU -7.7%
• VGE service revenue +5.9%
• IoT service revenue +29%; 38m connections +37%
1. IoT Global SIM available in over 200 countries 2. One Net for SMEs, Corporates and multinationals 12
Driving growth: enterprise

Fixed broadband net adds Homes reached with NGN broadband1 Spain churn4
289 264
230
414 416 393
228
322
382
426
Q4 14/15 Q1 15/16 Q2 15/16 Q3 15/16 Q4 15/16
Broadband o/w NGN
• Record fixed net adds; – 13.4m broadband users, 6.4m NGN
• 9.5m TV customers – UK and Italy launch in 2016
• 21% of revenue from fixed
(000s)
(m)
Expanding reach Building scale
41
62 66 69 72
26 26 27 29 30
Q4 14/15 Q1 15/16 Q2 15/16 Q3 15/16 Q4 15/16
Total On-net
1. Europe
2. Fixed access to premises and mobile backhaul
3. Including CWW and international links
4. Cohort analysis at March 2016. Differs from reported churn which includes converged customers
• 48% household coverage in Europe – o/w 41% on-net
– +246,000km1,2 of fibre since Sept 13,
Group total now 1 million km3
Lowering churn via convergence
21%
10%
Mobile only Convergent
Italy churn4 (%)
-11ppt
26%
14%
Mobile only Convergent
(%)
-12ppt
• 2.9m converged service customers
13
Driving growth: fixed and convergence

Convergence: strengthening strategic positions
Italy: NGN agreement with Enel Netherlands: JV with Ziggo
Market leading TV platform
90% cable
coverage
Market leading 4G
99%
coverage
A stronger
converged operator
Italian homes reached with NGN
• Enel: cost effective roll-out of FTTH to 224 cities
(7.5m households) by 2020
• FTTC roll-out (2.7m to date)
• Metroweb access continues (0.9m to date)
• Merger expected around end 2016
• NPV of synergies €3.5bn
• Integration planning underway
8.4
~14
~17-21
VOD reach today Enel deal C&D (rural) areas
(m)
14

Data sessions >3Mbps
(%)
137
104
245
196
49
93 70 66
105
134
Q4 14/15 Q1 15/16 Q2 15/16 Q3 15/16 Q4 15/16
(3.5
Ex. KDG)
(1.2) (1.8)
(0.4)
1.6
Q4 14/15 Q1 15/16 Q2 15/16 Q3 15/16 Q4 15/16
0.72
0.45
Q4 13/14 Q4 15/16
Germany: improved network and commercial execution
1. 8.0% after one-off from reclassification of CPE revenue from non-service revenue to service revenue
Network and NPS Commercial performance Financial results Dropped call rate
(%)
• Mobile revenue +0.3% (Q3 -1.7%) – consumer contract +1.2% (Q3 +0.2%)
– Enterprise -3.3%; ARPU pressure
• Fixed revenue +3.8% (Q3 +1.7%)
– KDG +9.3%1 (Q3 +7.0%), DSL declining
• FY ‘16 EBITDA +2.1%; margin 32.6%
– M&A synergies, A&R efficiency
• Fixed remains strong; DSL net adds
+39k (Q3 +9k); KDG stable at +96k
• Higher mobile churn in indirect
channels
• Consumer contract ARPU stabilising – -2.3% (Q3 -3.9%)
• Record low dropped call rate; leading
voice quality
• 4G coverage 87%; +10ppts YoY
• Network rating: P3 #2, NPS #2
Mobile contract
Fixed
76
85
Q4 13/14 Q4 15/16
Service revenue growth (%) (000s) Customer net adds
15

2
6 7
10
12
Q4 14/15 Q1 15/16 Q2 15/16 Q3 15/16 Q4 15/16
Network and NPS Commercial performance Financial results
(99) (76)
(36) (15)
5
46 43 24
38 63
Q4 14/15 Q1 15/16 Q2 15/16 Q3 15/16 Q4 15/16
(4.1)
(2.0) (2.0)
(0.3)
1.3
Q4 14/15 Q1 15/16 Q2 15/16 Q3 15/16 Q4 15/16
Italy: network leadership supporting return to growth
• Mobile revenue +1.6% (Q3 +0.1%) – Consumer prepaid ARPU +12.6%
• Fixed revenue -0.2% (Q3 -2.5%) – increased store sales and brand association
• FY ‘16 EBITDA +3.1%; margin 33.5% – revenue decline offset by cost saving
• 3.6m NGN homes passed – Enel: fibre access on competitive terms
• Leading mobile network;
4G coverage 95%
• Network rating: P3 #1, NPS #1
• Consumer mobile continues to improve – MNP1 -67k vs. -351k in FY ‘15
• Fixed momentum remains strong – 50% of gross adds taking fibre
(total base: 297k)
– prices remain under pressure
16
Mobile contract
Fixed
Customer net adds Customer network perception Relative score (gap to best competitor)
(%) (000s) (points) Service revenue growth
1. Mobile Number Portability

Network and NPS Commercial performance Financial results Dropped call rate Service revenue growth
(0.6)
0.2
(0.5)
(0.7)
(0.1)
(0.8)
Q4 14/15 Q1 15/16 Q2 15/16 Q3 15/16 Q4 15/16
0.78% 0.75% 0.77% 0.70%
0.65%
0.65% 0.61% 0.58%
0.48% 0.45%
Q4 14/15 Q1 15/16 Q2 15/16 Q3 15/16 Q4 15/16
UK
London
UK: leading network in London, enterprise improved
1. Ofcom basis, Vodafone basis 84%
• Mobile revenue -1.9% (Q3 -1.0%) – OOB spend, 08XX regulation, higher churn
• Fixed revenue +5.5% (Q3 +0.2%) – strong carrier and improved execution
• FY ‘16 EBITDA +1.2%; margin 20.9% – lower A&R on improved channel mix,
opex savings
• Contract net adds impacted by billing
system migration issues
• Q4 churn: – consumer contract 18.9% (+1.1ppt)
– enterprise: 16.5% (-1.2ppt)
• 7.0m 4G customers, +0.7m QoQ
• Consumer broadband: 38k customers
• Dropped call rate improving, further
progress expected
• 4G coverage 91%1, 99.5% in London
• Network rating: Overall NPS #3, o/w
Enterprise #1
49
83 90 94
1 2 4 5 14
20
Q4 14/15 Q1 15/16 Q2 15/16 Q3 15/16 Q4 15/16
Reported
Q4 ex. carrier effect
17
(%) (000s) (%) Customer net adds
Mobile contract
Fixed

Customer net adds
Network and NPS Commercial performance Financial results Customer network perception Relative score (gap to best competitor)
Service revenue growth (%) (000s)
(7.8
Ex. Ono)
(5.5)
(2.0) (3.1) (3.2) (3.3)
1.0 0.7 0.6
Q4 14/15 Q1 15/16 Q2 15/16 Q3 15/16 Q4 15/16
14
54
92 83
105
34 41
28
79
64
Q4 14/15 Q1 15/16 Q2 15/16 Q3 15/16 Q4 15/16
2 2
0 0
3
Q4 14/15 Q1 15/16 Q2 15/16 Q3 15/16 Q4 15/16
Spain: market leading NPS and brand consideration
• ARPU trends stabilising
• Strong customer growth – contract mobile +3%, fixed +8%
• FY ‘16 EBITDA +4.2%; margin 25.2% – cost control, handset financing benefit and
Ono synergies offset higher content costs
• Dropped call rate -24% to 0.44%, 91%
4G coverage
• Network rating: P3 #1, NPS #1
• Fibre: 8.5m homes passed
– supportive of new regulated fibre access
terms
• Strong commercial momentum – 5.4m 4G customers
– Vodafone One: 1.5m users; 1.1m TV users
• Football content rights secured
• Ono: 100% of synergies secured – now targeting €300m by year 4
(NPV €2.8bn)
(points)
18
Service revenue growth
Mobile contract
Fixed
Reported
Ex. handset financing
Network and NPS Commercial performance Financial results
15 12
26
20
29
Q4 14/15 Q1 15/16 Q2 15/16 Q3 15/16 Q4 15/16
(2.0)
2.8 3.0
7.2 6.5 5.3
10.7 8.3
10.7 10.2
Q4 14/15 Q1 15/16 Q2 15/16 Q3 15/16 Q4 15/16
1.8 1.9 2.0
2.5
3.1
Q4 14/15 Q1 15/16 Q2 15/16 Q3 15/16 Q4 15/16
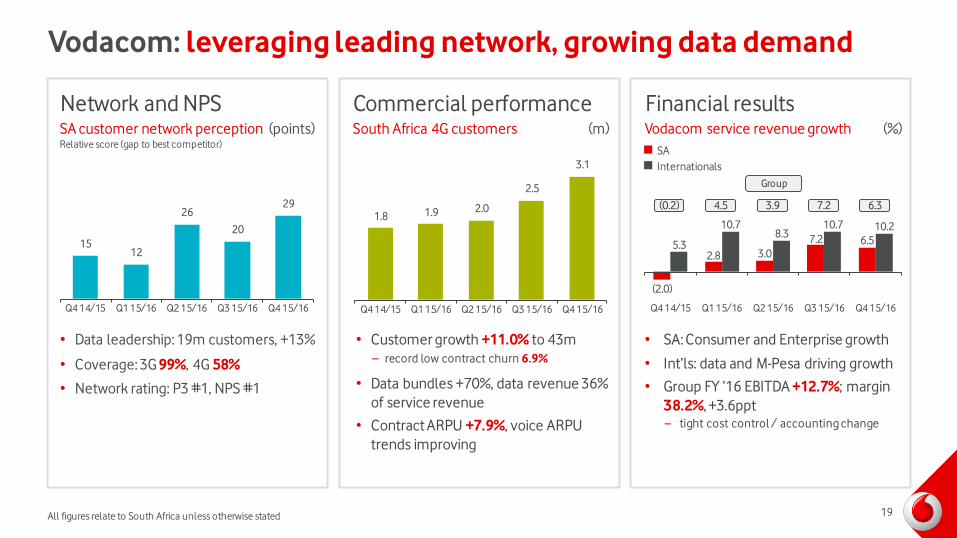
Vodacom: leveraging leading network, growing data demand
All figures relate to South Africa unless otherwise stated
• SA: Consumer and Enterprise growth
• Int’ls: data and M-Pesa driving growth
• Group FY ‘16 EBITDA +12.7%; margin
38.2%, +3.6ppt – tight cost control / accounting change
• Customer growth +11.0% to 43m
– record low contract churn 6.9%
• Data bundles +70%, data revenue 36%
of service revenue
• Contract ARPU +7.9%, voice ARPU
trends improving
• Data leadership: 19m customers, +13%
• Coverage: 3G 99%, 4G 58%
• Network rating: P3 #1, NPS #1
(0.2) 4.5 3.9 7.2 6.3
Group
19
(%) (m) (points) South Africa 4G customers SA customer network perception Relative score (gap to best competitor)
Vodacom service revenue growth
SA
Internationals

• Moderation in price competition – voice prices -7% (Q3 -10%) +1% QoQ
– data prices -9% (Q3 -16%)
• FY ‘16 EBITDA +4.1%; growth and opex
savings, mitigated by regulatory
impacts
• Total net adds +4.3m, quality
improving: – 54% smartphone penetration (PY 44%)2
– avg. 3G usage ~800MB (4x 2G)
• Focusing 4G on high value circles
– 4G circles account for 45% of data
revenues, >60% by year end
• 3G coverage 95%1, Spring target met
• +40k 3G sites since Sep 2013 to 55k
• Network rating: NPS #1, #2 in sites
Network and NPS Commercial performance Financial results
11.7
6.9 5.6
2.3 5.3
1.5
4.6 5.3
5.3
4.9
Q4 14/15 Q1 15/16 Q2 15/16 Q3 15/16 Q4 15/16
19.4 22.1
23.8 25.9
27.4
Q4 14/15 Q1 15/16 Q2 15/16 Q3 15/16 Q4 15/16
India: re-accelerating; voice stabilisation, data growth
1. In targeted urban areas
2. In the four metro circles
3. Regulatory factors include MTRs, service tax, roaming price caps and other items
10.2
7.6
10.9 11.5
Underlying
growth 13.1
33% 30%
36% 38%
41%
2
(1)
(2)
0
1
Q4 14/15 Q1 15/16 Q2 15/16 Q3 15/16 Q4 15/16
Reported
Regulatory impact 3
20
3G customers 3G % of data users
Customer network perception Relative score (gap to best competitor)
(%) (m) (points) Service revenue growth

Other key markets
• Contract net adds +325k,
• Data: revenue +89%,
volumes +129%
• Fixed broadband +83k
• 4G launched; 4.6m users
Turkey Netherlands Egypt Portugal
• 4G users +0.5m to 2.0m
• Increased convergence
price pressure
• JV agreement with Ziggo
• Market share leader 40%
• Data: revenue +37%,
volumes +73%
• Strong broadband +26k
and mobile contract
growth
• 2.4m HH fibre reach
Q4
service revenue
+22.3%
Q4
service revenue
-1.3%
Q4
service revenue
+11.2%
Q4
service revenue
+3.5%
Network
NPS rank1
Commercial
performance (in Q4)
Financial
results
1. Turkey; consumer NPS 21

What’s next: Vodafone strategy 2020
• Mobile 4G+/5G
• Converged
• Virtualised / Cloud based
• Best in class service
• Digital marketing and care
• Leader/co-leader in each
market
• Efficient & agile
organisation
FY 13/14 Verizon Wireless disposal
PROJECT SPRING
CUSTOMER EXPERIENCE:
CARE
FIT FOR GROWTH / ZBB
22

Group Chief Technology Officer Johan Wibergh
Technology roadmap

24
Our vision for 2020
CLOUD
Gigabit Vodafone
4G+/5G
Internet
of Things
Fiberisation

Our strategy to maintain leadership
Mobile Fixed IT
• Video everywhere
• High speed
• Low latency
• Internet of Things
• Gigabit speed
• Rapid deployment for Enterprise
• Flexible and agile
• Low cost systems
• Digital company
Cloud
Services
Leverage scale advantage through Cloud technologies
Converged services
25

2020 technology goals
Mobile Fixed IT
• 5G launched and 3G shutdown in Europe
• >95% of sites with fibre in
European cities1
• All 4G sites with NB-IoT2
• DOCSIS 3.1
• FTTH enabled with Next
Generation PON
• Virtual CPE
• Transform to converged modern billing & CRM
• 50% Time-to-market
improvement
• Vendors reduced by two thirds
Cloud
Services
• 50% network functions virtualised, supported by Software Defined Networks
• End-to-end service provisioning time reduced <1 week
• 65% IT applications in the Cloud through Vodafone Cloudstore
Cloud-based TV available for all markets
Customer journeys across all digital channels
26 1. European cities >100k population
2. Narrow Band Internet of Things

Group Chief Financial Officer Nick Read
Financial review
27
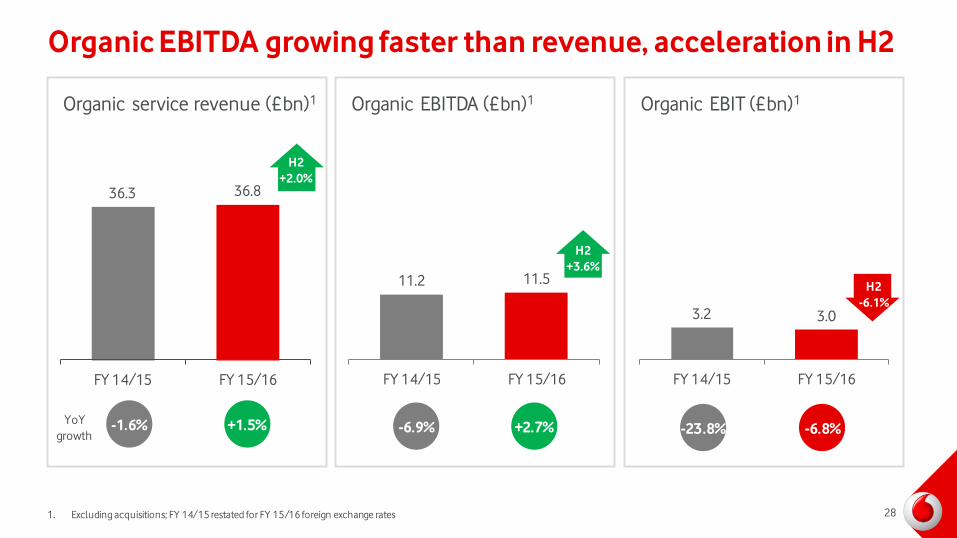
11.2 11.5
FY 14/15 FY 15/16
Organic EBITDA growing faster than revenue, acceleration in H2
36.3 36.8
FY 14/15 FY 15/16
+1.5%
Organic service revenue (£bn)1 Organic EBITDA (£bn)1 Organic EBIT (£bn)1
3.2 3.0
FY 14/15 FY 15/16
YoY
growth -1.6%
H2
+2.0%
+2.7% -6.9%
H2
+3.6%
-6.8% -23.8%
H2
-6.1%
28 1. Excluding acquisitions; FY 14/15 restated for FY 15/16 foreign exchange rates

22.3 21.3
11.2
7.7 6.3
5.3 3.5
2.4 1.6 1.3 0.6 0.2
(0.1) (1.3)
Turkey Ghana Egypt Romania Vodacom India Portugal Ireland Germany Italy Spain Greece UK NL
Broad based underlying service revenue improvement
Q4 15/16 organic service revenue (%)
FY 15/16 organic service revenue (%)
1. Underlying growth excludes leap year benefit and accounting reclassifications
2. Excluding impact of handset financing
Group +2.5%
(underlying +1.8%) 1
+19.7 +18.1 +8.9 +5.6 +5.4 +5.0 +0.3 +1.9 -0.4 -0.8 -0.3 -0.2 -0.3 +0.3
29
2

Quality of revenues improving
Absolute organic service revenue growth YoY (£bn)
(0.4)
0.8
0.1
(0.1)
FY 14/15 FY 15/16
Retail
Wholesale1
Drivers of improvement
• Greater emphasis on
branded channels
• Strong fixed line
performance
• Disciplined approach
to MVNOs
1. Wholesale includes MVNO, Carrier Services and visitor revenue, excludes incoming revenues 30

14%
35%
26%
5%
12%
4% 4%
Resilience of our European service revenue
1. Includes wholesale, visitor and other revenue
2. Includes Carrier Services
Consumer fixed
Strong commercial momentum, growing market share
Mobile incoming
Other1
FY 15/16
+3.4%
-0.3%
+0.5%
-4.4%
-7.6%
-4.3% +1.6%
Enterprise2
Unique global scale and multiple pillars of growth Consumer mobile
contract in-bundle
Monetising data and upselling customers via ‘more for more’
Consumer mobile contract out-of-bundle
Consumer prepaid
Stabilising through successful commercial execution and 2nd brands
MTR and MVNO
contribution significantly reduced
31

Delivering operational leverage – Fit for Growth
FY 15/16 cost base
Support costs
£1.3bn
Subsidy and commission
£6.4bn
Sales,
marketing,
distn and care
£4.6bn
Other
£0.3bn
(excl. interconnect)
Centralised procurement
and Shared Services
ZBB / productivity
targeting
M&A synergy capture
Scope: Total Fit for Growth costs
£23.1bn + capex
Commercial efficiency
Customer costs
£11.0bn
Direct costs
£5.5bn
Direct cost optimisation
Technology costs
£5.0bn
Network & IT transformation
32

Delivering operational leverage – Fit for Growth
Channel
productivity
and quality
Lower
subsidies2
36%
60%
Mobile gross adds1
(branded channels)
Group broadband net adds
15%
17%
19%
21%
23%
Q1
14/15
Q2
14/15
Q3
14/15
Q4
14/15
Q1
15/16
Q2
15/16
Q3
15/16
Q4
15/16
1.3m
FY 15/16
+5ppt
+3ppt
+11%
-75%
Increasing
online
penetration
My Vodafone app 36% +11ppt
FY 16/17 target: 60%
European A&R intensity falling Efficiency improvements
1. Direct channel share of consumer contract gross adds
2. Average mobile subsidy per gross add
Commercial efficiency
33

FY 15/16
Technology opex (£bn)
FY 15/16 FY 20/21
5.5%
3.5 - 4.0%
To become ‘as modern in IT as we are in networks’ Project Spring build complete
IT (cost & capex) as a % of revenue
Delivering operational leverage – Fit for Growth
5.0
Incremental Project
Spring costs (FY 14-16)
+£0.3bn Project Spring
annualised
+£0.2bn
Network and IT transformation
34
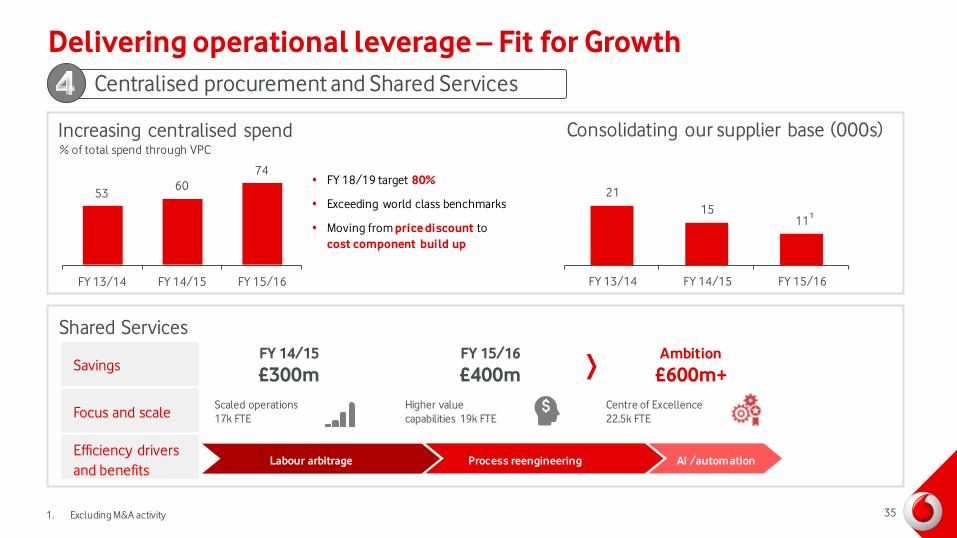
53 60
74
FY 13/14 FY 14/15 FY 15/16
% of total spend through VPC
Increasing centralised spend
21
15 11
FY 13/14 FY 14/15 FY 15/16
Consolidating our supplier base (000s)
Shared Services
1. Excluding M&A activity
Savings Ambition
£600m+
Scaled operations
17k FTE
Higher value
capabilities 19k FTE
• FY 18/19 target 80%
• Exceeding world class benchmarks
• Moving from price discount to
cost component build up
FY 15/16
£400m
FY 14/15
£300m
Focus and scale
Efficiency drivers
and benefits
Centre of Excellence
22.5k FTE
Delivering operational leverage – Fit for Growth
1
Labour arbitrage Process reengineering AI /automation
35
Centralised procurement and Shared Services
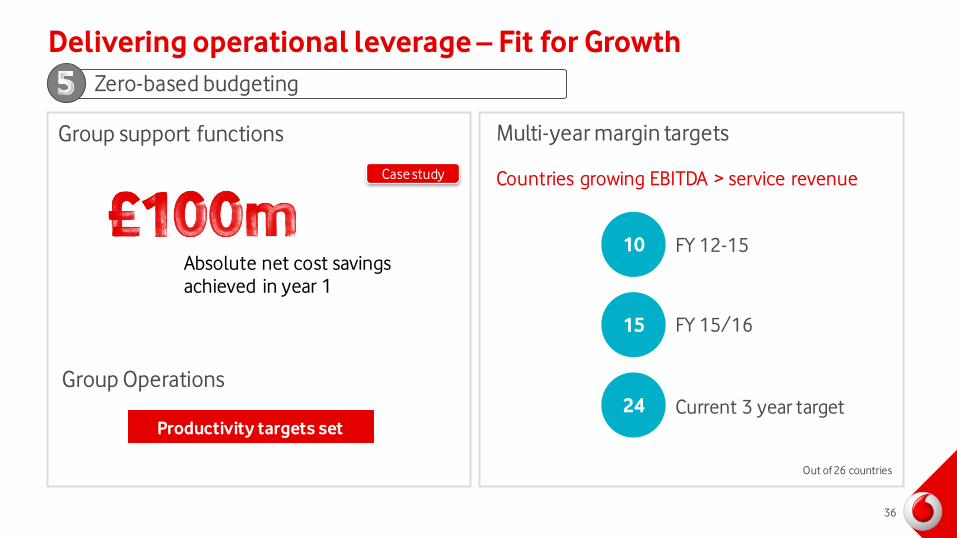
Group support functions
Absolute net cost savings
achieved in year 1
FY 12-15
FY 15/16
Current 3 year target
Multi-year margin targets
Delivering operational leverage – Fit for Growth
Countries growing EBITDA > service revenue
10
15
24
Out of 26 countries
Group Operations
Productivity targets set
Zero-based budgeting
36
Case study
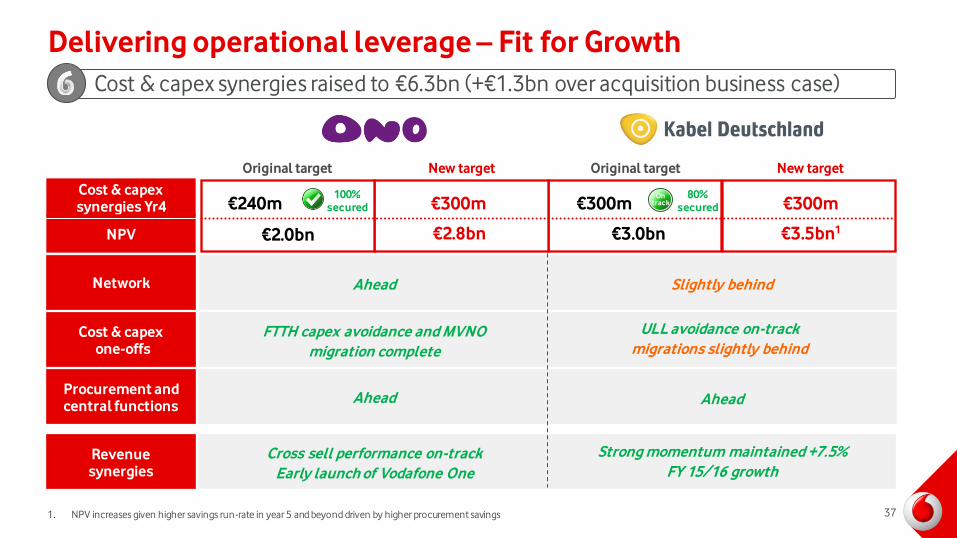
€240m
Original target New target
€300m
€2.8bn
100%
secured €300m
Original target New target
€300m
€3.5bn1
80%
secured
Cost & capex synergies Yr4
Procurement and central functions
Revenue synergies
Ahead
FTTH capex avoidance and MVNO
migration complete
Ahead
Cross sell performance on-track
Early launch of Vodafone One
Slightly behind
ULL avoidance on-track
migrations slightly behind
Strong momentum maintained +7.5%
FY 15/16 growth
Ahead
Cost & capex one-offs
Network
Delivering operational leverage – Fit for Growth
Cost & capex synergies raised to €6.3bn (+€1.3bn over acquisition business case)
37
On track
NPV €2.0bn €3.0bn
1. NPV increases given higher savings run-rate in year 5 and beyond driven by higher procurement savings

Composition of organic FY EBITDA growth
FY 15/16 FY 14/15 Improvement
EU mobile contract net adds (000s) 1,826 1,209 +617
Fixed broadband net adds (000s) 1,324 928 +396
Consumer contract churn 18.1% 18.7% 0.6ppt
Enterprise churn 16.1% 16.9% 0.8ppt
11.2
0.5 0.1
(0.2) (0.1)
11.5
Organic FY 14/15
EBITDA
Gross margin Customer costs Technology costs Support costs Organic FY 15/16
EBITDA
(£bn)
38

Broad based EBITDA improvements across our top markets
(300) (250) (200) (150) (100) (50) - 50 100 150 200
ES
IT
DE
SA
UK
IN
Absolute organic EBITDA growth YoY (£m)
FY 14/15
-7% YoY
c.-£800m
FY 15/16
+2.7% YoY
c.+£300m
39

Investing to sustain leading network quality & growth
Spring base case
13 - 14%
Capital intensity (% of revenue)
Mobile
Fixed
New Post-Spring target
‘Mid-teens’ Drivers:
Mobile
EU: further 4G densification /
preparing to lead in 5G
• >95% sites with fibre in
European cities
AMAP: accelerate 4G expansion
Fixed
Gigabit technology leader
• New fibre footprint expansion
(Southern Europe)
• Rapid DOCSIS 3.1 deployment
• Customer success led CPE
IT
Transformation
40

Free cash flow reflecting Project Spring investment
FY 15/16
(£m)
FY 14/15
(£m)
EBITDA 11,612 11,915
Capital expenditure (8,599) (9,197)
Working capital (386) (121)
Net interest (1,026) (994)
Taxation (689) (758)
Dividends received1 67 224
Dividends to non-controlling interests (223) (247)
Other2 257 266
Free cash flow 1,013 1,088
1. Principally relating to Safaricom (Safaricom and Indus in FY 14/15)
2. Relates to cash movements on share based payments and disposal of capital assets
• Project Spring investment complete
• Underlying effective tax rate 28.8%, medium-term rate now expected to be mid-20s
41

Our Balance sheet is robust
22.3 5.0
3.0
(2.8)
1.7 29.2
Mar 2015 Spectrum Dividends paid Convertible issue Other/FX Mar 2016
Headroom created and life of facilities extended
BBB+
credit rating
Actions:
• Mandatory convertible bonds (£2.9bn)
- aligning with VZW loan notes
• €6bn of EMTN bonds raised
- avg. life 6.6yrs, weighted avg. interest cost of 1.55%
• Continued focus on portfolio management
Balance sheet movement (£bn)
Net debt / EBITDA
Average cost
of net debt
Average life
of debt 6.3yrs
4.7%
FY 15/16
2.5x
1
1. Incudes the cost of future coupon payments 42

(0.4)
FY 15/16
reported EBITDA
FX / ladder FY 15/16
(rebased)
Roaming,
content, HF,
MVNO
Project Spring
technology
costs
FY 15/16
(restated)
Underlying
growth
FY 16/17
Guidance
Guidance for FY 16/17
1. Guidance for FY 16/17 is based on our current assessment of the global macroeconomic outlook and assume foreign exchange rates of €1: £0.79 €1:INR 76.4, €1:ZAR 16.5, €1:TRY 3.2
and €1:EGP 9.8. It excludes the impact of licences and spectrum payments, material one-off tax-related payments, restructuring costs and any fundamental structural change to the
Eurozone, including a potential decision by the United Kingdom to leave the European Union. It also assumes no material change to the current structure of the Group.
Organic EBITDA growth of 3% - 6%
Free cash flow of at least €4bn
(0.6)
3-6%
1.3-1.8
14.8
0.5 15.3
14.4
15.7-16.2
FY 16/17 EBITDA drivers (€bn)
Guidance1 for FY 16/17
(0.3)
43

1. FCF: Operating free cash flow after cash flows in relation to taxation, interest, dividends received from associates and investments and dividends paid to non
controlling shareholders in subsidiaries, but before restructuring costs and licence and spectrum payments.
2. FY 15/16 dividend per share of €14.48c/share (based off year end FX rate of 1.2647 €/£)
We intend to grow the dividend
FY 16/17
FCF guidance1
Project Spring
working capital Underlying
FY 16/17
FCF guidance1
Current
dividend
Future
growth
Spectrum
Minimum Average Maximum
3x FY ‘16
dividend2
Dividend cover (€bn) Management long term incentives aligned to FCF1 growth (€bn)
‘At least €4bn’
FY 16/17 3 year cumulative
13.8
18.8
16.3
44

Summary
45
• Project Spring build completed
• NPS leadership improved
• Record fixed broadband growth
• Strategic position enhanced
in Italy / Netherlands
• Group service revenue +1.5%, Europe
stabilised
• Organic EBITDA growth faster than
revenues (+2.7%)
• Dividend per share +2.0% to 11.45p
• Customer ‘CARE’
• Monetise data growth, ‘More4More’
• Technology roadmap
• Engage regulators, Incumbent
re-monopolisation risk
• Efficiency and margin expansion
• Portfolio optimisation;
India IPO
• Shareholder returns
FY 15/16 achievements Priorities FY 16/17 and beyond

Q&A
46

Appendix
48

Project Spring | Mobile build programme 108% delivered
Build progress from Sept 2013 to March 2016 March 2016 delivery against Sept 2013 targets
Europe
• 4G outdoor coverage +55ppt to 87% (target 91%)
• Single RAN +40ppt to 93% (target 97%)
• High capacity backhaul +25ppt to 90% (target 98%)
AMAP
• 3G/4G outdoor coverage (excl. India) +10ppt to 85%
(target 84%)
• 4G coverage +36ppt to 37% (excl. India)
• India 3G coverage in targeted urban areas now 95%
(target 95%) + additional circles
• Single RAN +29ppt to 58% (target 51%)
• High capacity backhaul +28ppt to 63% (target 52%)
Target Delivered
4G sites 77,000 76,000
3G sites 73,000 77,000
2G sites 47,000 50,000
Single RAN 106,000 115,000
High capacity backhaul
87,000 102,000
49

Customer experience progress since Sept 13 Voice quality improvements since Sept 13
98.8
99.8 99.8 99.9
Q2
13/14
Q4
14/15
Q2
15/16
Q4
15/16
Project Spring | Mobile customer experience targets achieved
Europe
• 4G live in all 13 markets; 4G+ live in 12 markets
• Data sessions >3Mbps +15ppt to 91% (target 90%)
AMAP
• 4G live in 8 markets; 4G+ live in 5 markets
• HD Voice live in 8 markets
Call Setup Success (%) Dropped Call Rate (%)
0.90
0.59 0.60 0.46
Q2
13/14
Q4
14/15
Q2
15/16
Q4
15/16
Target: <0.50
Target: >99.2
1.30
1.02 0.99 0.86
Q2
13/14
Q4
14/15
Q2
15/16
Q4
15/16
98.2
99.2 99.4 99.3
Q2
13/14
Q4
14/15
Q2
15/16
Q4
15/16
Dropped Call Rate (%) Call Setup Success (%)
Target: >99.0
Target: <1.00
50

Project Spring KPIs
UK Germany
Commercial impact
4G customers (m) 5.5 6.5 6.9 7.9
Contract churn (%) 13.8% 15.5% 16.2% 15.4%
Contract mobile ARPU (EUR) 25.9 25.7 25.4 24.9
Average smartphone data usage
(MB) 593 632 685 764
Deployment and experience
Q1
15/16
Q2
15/16
Q3
15/16
Q4
15/16
4G % outdoor population coverage 68% 75% 79% 84%
% of data sessions >3Mbps 86% 87% 89% 89%
% of dropped calls 0.75% 0.77% 0.70% 0.65%
% homes reached by owned NGN - - - -
% of targeted stores refitted 55% 70% 81% 88%
Commercial impact
4G customers (m) 4.0 5.3 6.3 7.0
Contract churn (%) 15.8% 15.6% 16.9% 17.9%
Contract mobile ARPU (GBP) 26.6 26.4 26.1 25.9
Average smartphone data usage
(MB) 1,014 1,183 1,363 1,389
Deployment and experience
Q1
15/16
Q2
15/16
Q3
15/16
Q4
15/16
4G % outdoor population coverage 78% 81% 84% 87%
% of data sessions >3Mbps 82% 82% 84% 85%
% of dropped calls 0.54% 0.58% 0.48% 0.45%
% homes reached by owned NGN 35% 35% 35% 35%
% of targeted stores refitted 28% 39% 49% 50%
51

Project Spring KPIs
Deployment and experience
Q1
15/16
Q2
15/16
Q3
15/16
Q4
15/16
4G % outdoor population coverage 88% 91% 94% 95%
% of data sessions >3Mbps 94% 92% 94% 94%
% of dropped calls 0.60% 0.62% 0.53% 0.46%
% homes reached by owned NGN 5% 7% 10% 13%
% of targeted stores refitted 94% 96% 97% 97%
Deployment and experience
Q1
15/16
Q2
15/16
Q3
15/16
Q4
15/16
4G % outdoor population coverage 78% 80% 86% 91%
% of data sessions >3Mbps 83% 81% 86% 87%
% of dropped calls 0.58% 0.60% 0.50% 0.44%
% homes reached by owned NGN 46% 46% 47% 49%
% of targeted stores refitted 30% 34% 40% 41%
Commercial impact
4G customers (m) 2.7 4.0 5.0 6.5
Prepaid churn (%) 32.4% 32.1% 32.2% 30.3%
Prepaid mobile ARPU (EUR) 11.4 12.2 12.7 12.4
Average smartphone data usage
(MB) 981 1,254 1,313 1,461
Commercial impact
4G customers (m) 3.3 4.3 4.8 5.4
Contract churn (%) 18.1% 20.1% 19.6% 18.7%
Contract mobile ARPU (EUR) 20.1 20.5 19.6 18.8
Average smartphone data usage
(MB) 1,097 1,063 1,254 1,537
Spain Italy
52

Project Spring KPIs
Deployment and experience
Q1
15/16
Q2
15/16
Q3
15/16
Q4
15/16
3G % outdoor population coverage
(targeted urban areas) 91% 94% 94% 95%
% of data sessions (>400kbps) 74% 75% 79% 83%
% of dropped calls 1.02% 1.08% 1.03% 0.93%
% of targeted stores refitted 45% 55% 64% 67%
Deployment and experience
Q1
15/16
Q2
15/16
Q3
15/16
Q4
15/16
4G % outdoor population
coverage 41% 47% 54% 58%
% of data sessions >3Mbps 85% 86% 86% 86%
% of dropped calls 0.67% 0.49% 0.40% 0.40%
% of targeted stores refitted 76% 80% 83% 87%
Commercial impact
3G customers (m) 22.1 23.8 25.9 27.4
Prepaid mobile ARPU (INR) 149 144 141 144
Average data usage
(MB) 357 393 438 454
Commercial impact
4G customers (m) 1.9 2.0 2.5 3.1
Contract mobile ARPU (ZAR) 381 393 409 404
Average smartphone data usage
(MB) 501 541 569 588
Vodacom (South Africa) India
53

Homes reached with NGN (m)
Significant high speed NGN broadband reach in key markets
54
14
4
9
2 1
10
5
24
0.2 1
DE IT ES UK PT NL
Wholesale NGN
Own NGN
59% 29% 49% 83% 47% 26%
Population coverage

Service revenue bridge
55
• M&A and one-off items relates primarily to £0.4bn of service revenue from Ono,
HOL and Vodafone Automotive offset by the UK ladder settlement / other (£0.1bn)
38,497
(2,129)
245 960
(737)
53
(208)
254 224 37,159
FY 14/15
reported
service
revenue
FX M&A and one
off items
In-bundle Out of
bundle
Incoming MTR Fixed line and
carrier
Other FY 15/16
reported
service
revenue
(£m)

FY 15/16
(£m)
FY 15/16
(%)
FY 14/15
(£m)
FY 14/15
(%)
Europe
Service revenue (56) (0.2) (154) (0.6)
EBITDA - (36)
AMAP
Service revenue (152) (1.4) (146) (1.3)
EBITDA (40) (67)
Group
Service revenue (208) (0.6) (300) (0.8)
EBITDA (40) (103)
Voice MTR impact
56

Profit
FY 15/16
(£m)
FY 14/15
(£m)
Adjusted operating profit1 3,117 3,507
Net financing costs (1,824) (853)
Taxation (162) (703)
Deferred taxation (3,207) 5,468
Customer & brand amortisation2 (979) (1,269)
Restructuring costs (236) (157)
Impairment loss (450) -
Profit for the year from discontinued operations - 57
Other (77) (133)
Profit for the year (3,818) 5,917
Non controlling interests (206) (156)
(Loss)/Profit attributable to owners of parent (4,024) 5,761
1. Now reported excluding the impact of restructuring costs, significant one-off items and amortisation of acquired intangible customer bases and brand intangible assets
2. Customer amortisation relate primarily to Italy (FY 15/16 £319m, FY 14/15 £443m), KDG (FY 15/16 £325m, FY 14/15 £465m) and On o (FY 15/16 £207m, FY 14/15 £183m) 57

Adjusted EPS reconciliation
FY 15/16
(£m)
FY 14/15
(£m)
Reported
growth (%)
(Loss)/Profit attributable to owners of parent (4,024) 5,761
Taxation 3,194 (5,334)
Net financing costs 449 (437)
Customer & brand amortisation 979 1,269
Non controlling interests (17) (21)
Restructuring costs 236 157
Impairment loss 450 -
Profit for the year from discontinued operations - (57)
Other 77 133
Adjusted profit for the year 1,344 1,471
Weighted average shares (m)1 26,692 26,489
Adjusted EPS (p) 5.04 5.55 (9.2)
58 1. Note: Excluding the issuance of £2.9 billion of mandatory convertible bonds in February, the weighted average basic and fully diluted share count for the year was 26.542 billion; £2.754
billion of these bonds were classified as equity after taking into account the cost of future coupon payments

Adjusted earnings impacted by Project Spring
1. Reported excluding the impact of restructuring costs, significant one-off items and amortisation of acquired intangible customer bases and brand intangible assets
Note: Excluding the issuance of £2.9 billion of mandatory convertible bonds in February, the weighted average basic and fully dil uted share count for the year was 26.542
billion; £2.754 billion of these bonds were classified as equity after taking into account the cost of future coupon payments
FY 15/16
(£m)
FY 14/15
(£m)
Reported
growth (%)
EBIT1 3,073 3,570 (13.9)
Share of results from associates 44 (63)
Adjusted operating profit1 3,117 3,507 (11.1)
Net financing costs (1,375) (1,290)
Taxation (175) (569)
Non controlling interests (223) (177)
Adjusted earnings1 1,344 1,471
Adjusted earnings per share1 5.04p 5.55p (9.2)
Full year dividend per share 11.45p 11.22p 2.0%
59

Taxation
FY 15/16
(£m)
FY 14/15
(£m)
Taxation 3,369 (4,765)
Deferred tax assets (3,207) 2,127 Deferred tax following revaluation
of investments in Luxembourg
Recognition of deferred tax assets - 3,341 Recognition of deferred tax asset
for losses in Luxembourg
Amortisation of deferred tax assets (423) (439)
Other 436 305
Adjusted tax expense 175 569
Effective tax rate 15.1% 29.4%
60

Financing costs
61
FY 15/16
(£m)
FY 14/15
(£m)
Net financing costs (1,824) (853)
Mark to market (gains)/losses 247 134
Potential interest on tax 15 (4)
Non-EPS FX revaluation 455 (437)
Underlying net financing costs (1,107) (1,160) Primarily favourable FX movements YoY
FX 86 160
Capitalised interest (179) (142)
Other (20) 221
Adjusted underlying net financing costs (1,220) (921)
Average net debt (25,864) (19,814)
Adjusted underlying net financing costs as
a percentage of net debt 4.7% 4.7%

Cost of debt
Currency Closing Gross
Debt (£bn)
Closing Net
Debt (£bn)
EUR 26.0 18.1
USD 11.4 2.9
GBP 2.4 (3.5)
INR 6.6 6.5
Other 0.5 5.2
Total 46.9 29.2
FY ‘16
£bn
FY ‘15
£bn
Average gross debt 39.4 32.4
Average cash and short term investments (13.5) (12.6)
Average net debt 25.9 19.8
Adjusted underlying net financing costs as a
percentage of gross debt
3.1% 2.8%
Adjusted underlying net financing costs as a
percentage of net debt
4.7% 4.7%
62

More information
www.vodafone.com/investor
2016 upcoming dates Visit our website for more information
For definitions of terms please see www.vodafone.com/content/index/investors/glossary
Q1 results
22 July
@VodafoneIR
Follow us on Twitter
+44 (0) 7919 990 230
Contact us
Annual report
3 June
AGM
29 July
63

Forward-looking statements
64
This presentation, along with any oral statements made in connection therewith, contains
“forward-looking statements” within the meaning of the US Private Securities Litigation
Reform Act of 1995 with respect to the Group’s financial condition, results of operations
and businesses and certain of the Group’s plans and objectives.
In particular, such forward-looking statements include, but are not limited to: statements
with respect to: expectations regarding the Group’s financial condit ion or results of
operations; expectations for the Group’s future performance generally; expectations
regarding the Group’s operating environment and market conditions and trends;
intentions and expectations regarding the development, launch and expansion of
products, services and technologies; growth in customers and usage ; expectations
regarding spectrum licence acquisit ions; and expectations regarding, EBITDA, free cash
flow, capital expenditure, and foreign exchange movements.
Forward-looking statements are sometimes, but not always, identified by their use of a
date in the future or such words as “will”, “anticipates”, “aims”, “could”, “may”, “should”,
“expects”, “believes”, “intends”, “plans” or “targets” (including in their negative form). By
their nature, forward-looking statements are inherently predictive, speculative and involve
risk and uncertainty because they relate to events and depend on circumstances that may
or may not occur in the future. There are a number of factors that could cause actual
results and developments to differ materially from those expressed or implied by these
forward-looking statements. These factors include, but are not limited to, the following:
changes in economic or polit ical conditions in markets served by operations of the Group;
greater than anticipated competit ive activity; the impact of investment in network capacity
and the deployment of new technologies, or the rapid obsolescence of existing
technology; higher than expected costs or
capital expenditures; slower than expected customer growth and reduced customer
retention; changes in the spending patterns of new and existing customers; the Group’s
ability to expand its spectrum position or renew or obtain necessary l icences; the Group’s
ability to execute its strategy; changes in foreign exchange rates and interest rates; the
Group’s abilit y to realise benefits from entering into partnerships or joint ventures and
entering into service franchising and brand licensing; unfavourable consequences to the
Group of making and integrating acquis itions or disposals; changes to the regulatory
framework in which the Group operates; the impact of legal or other proceedings against
the Group or other companies in the mobile telecommunications industry; loss of suppliers
or disruption of supply chains or unfavourable developments in the availabilit y or prices of
commodities and raw materials; developments in the Group’s financial condit ion and other
factors that the Board takes into account when determining levels of dividends; the Group’s
ability to satisfy working capital and other requirements; changes in statutory tax rates or
profit mix; and/or changes in tax legislation or final resolution of open tax issues.
Furthermore, a review of the reasons why actual results and developments may differ
materially from the expectations disclosed or implied within forward-looking statements
can be found under the headings “Risk Factors” and “Other Information – Forward-looking
statements” in our half year financial report for the six months ended 30 September 2015
which can be found on the Group’s website (vodafone .com/investor). All subsequent
written or oral forward-looking statements attributable to the Company, to any member of
the Group or to any persons acting on their behalf are expressly qualified in their entirety by
the factors referred to above. No assurances can be given that the forward-looking
statements in or made in connection with this presentation will be realised. Subject to
compliance with appl icable law and regulations, Vodafone does not intend to update these
forward-looking statements and does not undertake any obligation to do so.