vital statistics of the united states, 1966 · pdf filevital statistics of the united states,...
TRANSCRIPT
/ VITAL STATISTICS OF THE UNITED STATES
_ 1966
U.S. DEPARTMENT OF HEALTH, EDUCATION, AND WELFARE
PUBLIC HEALTH SERVICE
HEALTH SERVICES AND MENTAL HEALTH ADMINISTRATION NATIONAL CENTER FOR HEALTH STATISTICS
Washington: 1969
For sale by the Superintendent of Dacummts, U.S. Government Printing Offic8 W&~ingtm, D.C. 20402 - Prim $3.00 ,‘.
I 3 ‘. VOLUME III-MARRIAGE AND DIVORCE

NATIONAL CENTER FOR HEALTH STATISTICS
THEODORE D. WOOLSEY, Director
PHILIP S. LAWRENCE, Sc.D., Associate Director
OSWALD K. SAGEN, PH.D.., Assistant Director for Health Statisfics Development
WALT R. SIMMONS, M.A., Assistant Direcfor for Research and Scienti/ic Developmrn~
ALICE M. WATERHOUSE, M.D., Medical Consultant
JAMES E. KELLY,D.D.S., Dental Advisor
EDWARD E. MINTY, Executive Officer
MARGERY R. CUNNINGHAM, Inform&m O//icer
DIVISION OF VITAL STATISTICS
ROBERT D. GROVE, Ph.?.,, Director
ROBERT A. ISRAEL, MS., Deputy Director
ROBERT A. ISRAEL, M.S., ActingL Cbie/, Mortality Statistics Branch
JOHN E. PATTERSON, Chic/, Nntality Statistics Branch
LOREN E. CHANCELLOR, Chief, Registration Methods Branch
ALICE M. HETZEL, Cbiel, Marriage and Divorce Statistics Bmncb
ARNE B. NELSON, M.A., Chief. Vital Records Survey Branch
MICHAEL J. ZUGZDA, Chief, Statistical Resources Section

VITAL STATISTICS OF THE UNITED STATES, 1966 VOLUME III-MARRIAGE AND DIVORCE
A brief summary of the contents for each section is listed below for the convenience of the reader. A complete table of contents is shown at the beginning of each section and is identified by a narrow black edge which can be located easily by fanning rhe pages. Each section is paged independently, using the section number as the identifying prefix.
Section 1. Marriages
For the United States: National trend data. Marriage totals and rates for each State, division, and region. Marriage totals for each county or county equivalent. Monthly marriage totals for each State, division, and region.
For the marriage-registration area: Marriages classified by major demographic characteristics of bride and groom and by characteristics of marriages performed in each partici- pating State; marriage rates specific for sex, age, and marital status.
Section 2. Divorces
For the United States: National &end data. Divorce totals and rates for each State, division, and region. Divorce totals for each county or county equivalent. Trend of national totals of children involved in divorce.
For the divorce-registration area: Divorces classified for each participating State by major demographic characteristics of husband and wife, characteristics of their marriage, and number of children.
Section 3. Technical Appendix
Historical and contemporary sources of marriage and divorce statistics, de- sign of the samples of marriages and divorces and annulments, variability of sample estimates, and uniformity and completeness of the reporting forms and the collected data. Tables of population estimates used as bases for rates.

Guide to tables in Section I-M&iages
[Data are for marriages occurri
TABLE: 1
PAGE: 1
Geographic area: Divisions-----------------------
Marriage-registration area------
Regions-------------------------
Registration States-------------
All States----------------------
United States-------------------
F966----------1-----------------
Type of entry: Number of mrriages-------------
Marriage Tat==------------------
Percentage distributim---------
Characteristics: Age at marriage- _-_-_---_----_--
5-year age groups------------
10-year age gr0ups--------------
First and third quartiles-------
Mean or median age or both------
Colar---------------------------
Marriage order: All marriages-----------------
First marriages---------------
Month marriage was performed----
Previous marital status---------
Resident status-----------------
; in the United States. Data for geographic aram m-n ho nlma nf nrnlrm--l 6
I I I I I I I I
5 6
10 11 13 14'
5 6
17. 3 4 5 6
i 7 8 9 10 11 12 .13 15 16
14 4= 5 6 15 16
l! 2 3 4' 5 7
I I I I
7 8 9
10 11 12 13 14
+ 14 15 16 I I I I I I I
15 16
15 16’
8
7 8 9 14
11 12 15 16
12 14 15
9 11 12 14 15
11 12 15 16
4 6 12
7 8 10 16
13
'Total of 22 selected States. ?United States only. 4With percent changes from preceding year.
3Marriage-registration area only. 5Witb and without seasonal adjustments.

Guide to tables in Section 1-EtJarriages-Con.
Month marriage was parformed------------
Previous marital status---------------
Resident status-------
[Frequencies only. Data'are for marriages occurring in the United States in 1966. place of occurrence]
Geographic aree: counties--------------
Marriage-registration area-----------------
Registration States--- 17 24 25
All states -_----------
united States---------
Characteristics: Age at marriage:
Single-year age @-oups----------
5-year age groups---
10-year age groups--
Color-----------------
Day of week marriage was performed--------
Marriage order: All merriages-------
First.marriages-----
Remarriages---------
'For brides only. 'For grooms only.
Data for geographic areas are by
-28 -29
-26 -26
28 29
28
28
28

Guide to tables in Section 2-Divorces
[Da'& are for divorces and annulments occurring in the United States. Data for geographic areas are by place of
TABLE: 2
PAGE: 2
Geographic area: Divisi~s-----------------------------------------------------
Divorce-registration a~ea------------------------------------~
. . Regrstratlon states-------------------------------------------
&if-d States-------------------------------------------------
Type of entry: Average number of children per decree-------------------------
Number of annulments and percent of total divorces and an*ulments-------------T--------------------------------------
Number of children involved in divorces and annulments--------
Number of divorces and annulments-----------------------------
Percentage distribution of divorces and annulments------------
Rates per 1,l)oo population------------------------------------
Rates per 1,000 children under 18 years of age----------------
Rates oer 1.000 married women 15 vears of aae and over--------
Characteristics:
Median age at time of decree and at time of marriage----------
Nuder of children report8d-----------------------------------
-
-1 -2
-5 -6
2
2
2
12
1
2 -
I
-
-
-
L
1’ 2
1’ 2
I!
-3 -4
-7 -8
3
4
3
4
3
3
3
4
3
-
4
'With percent changes from preceding year. *Median duration.

Guide to tables in Section 2-Divorces-Con.
I [Frequencies only. data are for divorces and annulments occurring in the United States in 1966. Data for geographic areas are bv place of occurrence
TABLE: 2 -11 -12
t+ PAGE: 2 1 -101 -11
Geographic area: Counties----------------------------------------------------------
l-l- Divorce-registration area-----------------------------------------
I+
Registration States----------------------------------------------- 11 12
United States-----------------------------------------------------
Characteristics: Age at time of dec=ee--------------------------------------------- 11
*ge at t-me of marriage------------------------------------------- 12
Dm-j--on of marriage----------------------------------------------
Month marriage performed------------------------------------------
Number of this marriage at time of decree-------------------------
-
13
13 -
-
-
-
13 -

Guide to tables in Section 3-Technical Appendix
Central files of records established--------
collection of data, 1867-1966---------------
Growth of marriage- and divarce- registration aTeas-------------------------
p&&at-on data-----------------------------
Sample specificetions and estImate.3: Number of sample records------------------
Estimated number of events----------------
Sampling late6----------------------------
Sampling errors of estimates--------------
'Marriages. ZDivorces.
5' 72
5' 72
5! 72
6' a2
Symbols Used in Tables
Data not a~&&-- ------ --- -------------------- ---
Category not q,p&&,le ________________----------- . . .
Q”aniityzero----------------------:------------- -
QuantitymoretbanO but less tbanO.O5------------- 0.0
Figure does not meet standards of reliability or precision-------------------------------------- *

Sectiofz 1 Maniages ‘.I a ;, ..” -:: . Table ;_ ,_.. I ‘,.Z Page
l-l. Estimated number of marriages and marriage rates. with percent changes from preceding year: United States, 192&66, and marriage-registration area, 1957-66---------:------ l-5
1-2. Estimated, marriage rates per, 1,000 men and women 15 years of age and over: United JJa&, 1941)-6fj--~ .-,- l____ -. --,- r _-_-____________, _ ____ _ ______----____-____-_________ l-5
1-3. Estimated .marriage. rates, per $000 unmarried women 15 years of age and over and 15- 44 years of age: United States, 1940-66 ---____ --r-.---Y--------- ___________________ l-5
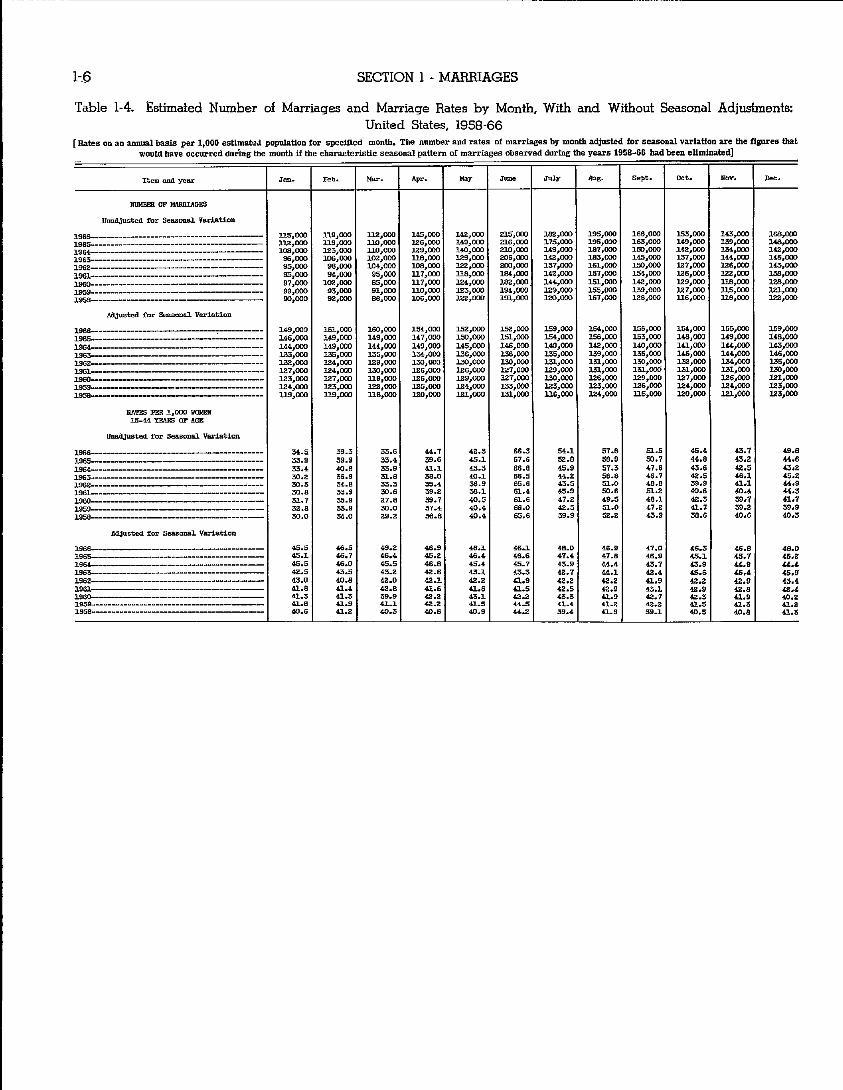
l,-4, ~st~mated..mu-nber, tof .marriages and marriage.rates,by month, with and without seasonal adjusmmtg: TJGt@,$tates, 1958-66-----------7---------------- _____-_____ - ______-_ 1-6,
1-5. Marriages and,marriage rates; United States,‘each region, division, and State, 1962-66-- l-7
.I _ l-6. Marriages by month: United States, marriage-registration area, each region, division,
,&State, 1966--?-1--r,-------------------------------------------------------- l-8
. . l-7. Marriage rates b&previous marital status and age: Marriage-registration area, 1966--- l-9
‘i :. . - : .._. 1-8. Median and first andt$rd quartiles of age at marriage for brides and for grooms, by
previous marital,,status of each partner: Marriage-registration area, 1966------------ l-9 ‘. .,,..
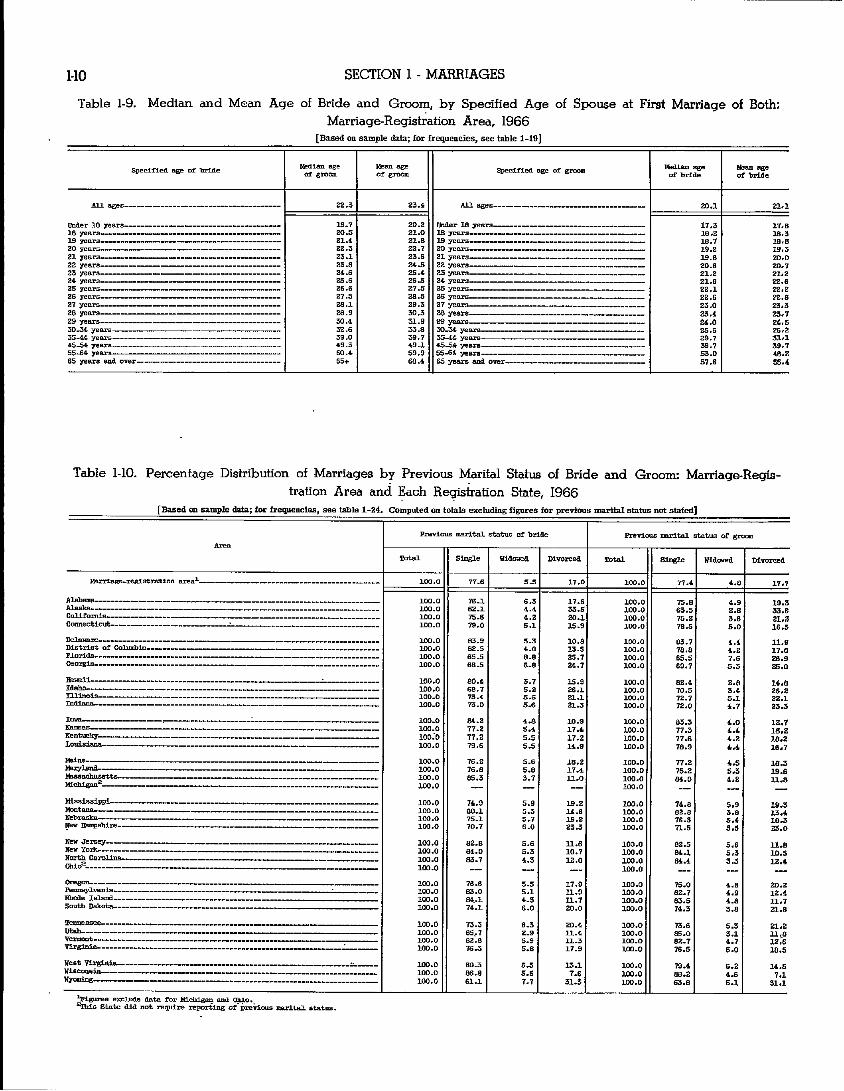
1,9. _ Median and.. mean age of bride and groom, by specified age of spouse at first marriage of both: Marriage-registration area, 1966 _______ ----_---_-_-----_-_--- ___-______-____ l-10
l-10. Per&&age distribution dof marriages by previous marital status of bride and groom: Marriage-registrat$xf area and each registration State, 1966-----------------------i l-10 ..
I l-11. Percentage distribution of marriages by marriage .order of bride and groom by color: Marriage-registration area and each registration State, i966---------------:-------- l-11
1-121 Percentage distribution ‘of marriages by month marriage performed, by marriage order and color of bride and groom: Marriage-registration area, 1966---------L----------- 1-11
,’
l-13: Percentage distribution.of marriages by resident status of bride and.&oom in State where -married: Marriage-registration area and each registration State, 1966--------------- l-12
: 1-14. Percentage distribution of all marriages, first marriages, and remarriages of bride and
groom by age at m,a&iage, and median age: Total of 22 selected States, 1957-66------- 1-13 r L 1-15. Marriages by marriage order,.age, and color of bride and groom: Marriage-registration
;irea, 1966--------------------------------------------------------------------- l-14 - .’
1-16. Remarriages by age, previous, marital status, and color of bride and groom: Marriage- registrationarea,1966----------------------------------------;----------------- l-14
_’
-_
l-l

:‘&ble Page
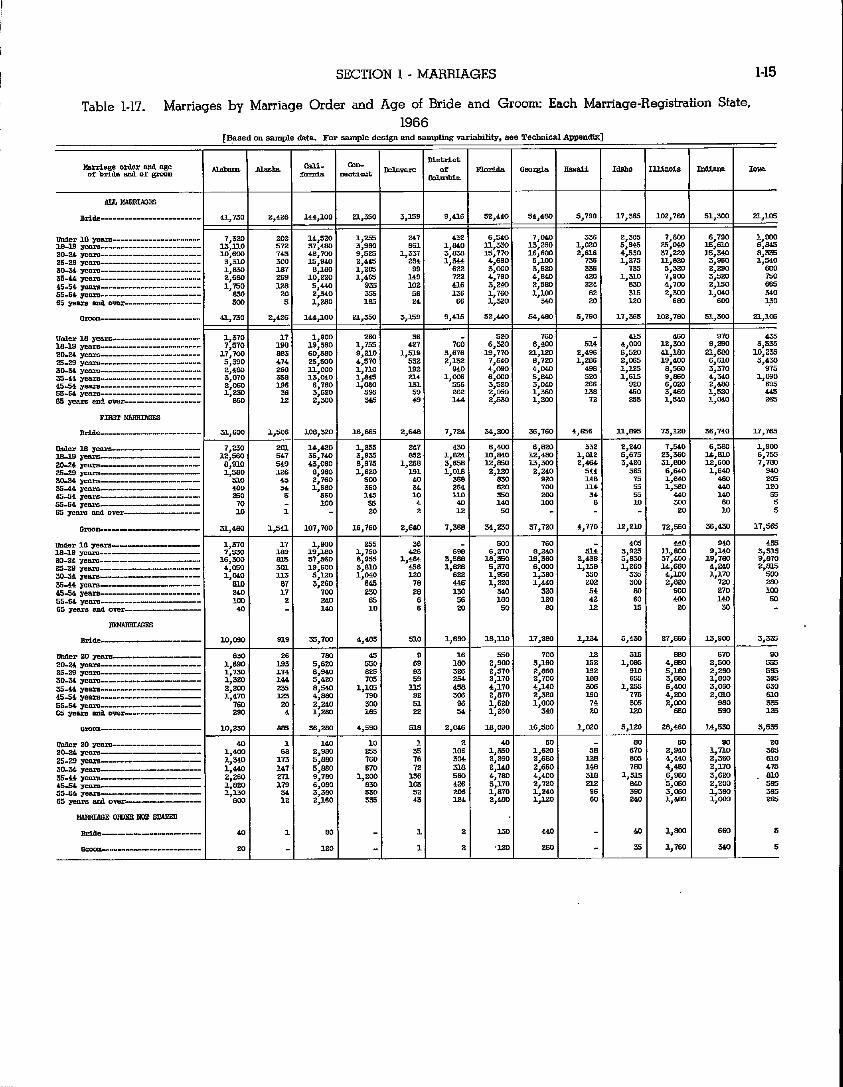
l-17. Marriages by marriage order and age of bride and groom: Each marriage-registration State. 1966--------------------------------------------------------------------- l-15
l-18. Marriages by age of bride, by age of groom: Marriage-registration area, 1966---------- l-18
1-19. First marriages of both bride and groom, by age of bride, by age of groom: Marriage- registration area,1966----------------------------------------------------------- l-18
l-20. Marriages by age and previous marital status of bride, by age of groom (all grooms and single grooms): Marriage-registration area, 1966--------------------------------- 1-19
l-21. Marriages by age and previous marital status of groom, by age of bride (all brides and singie brides): Marriage-registration area, 1966---------------------------------- l-20
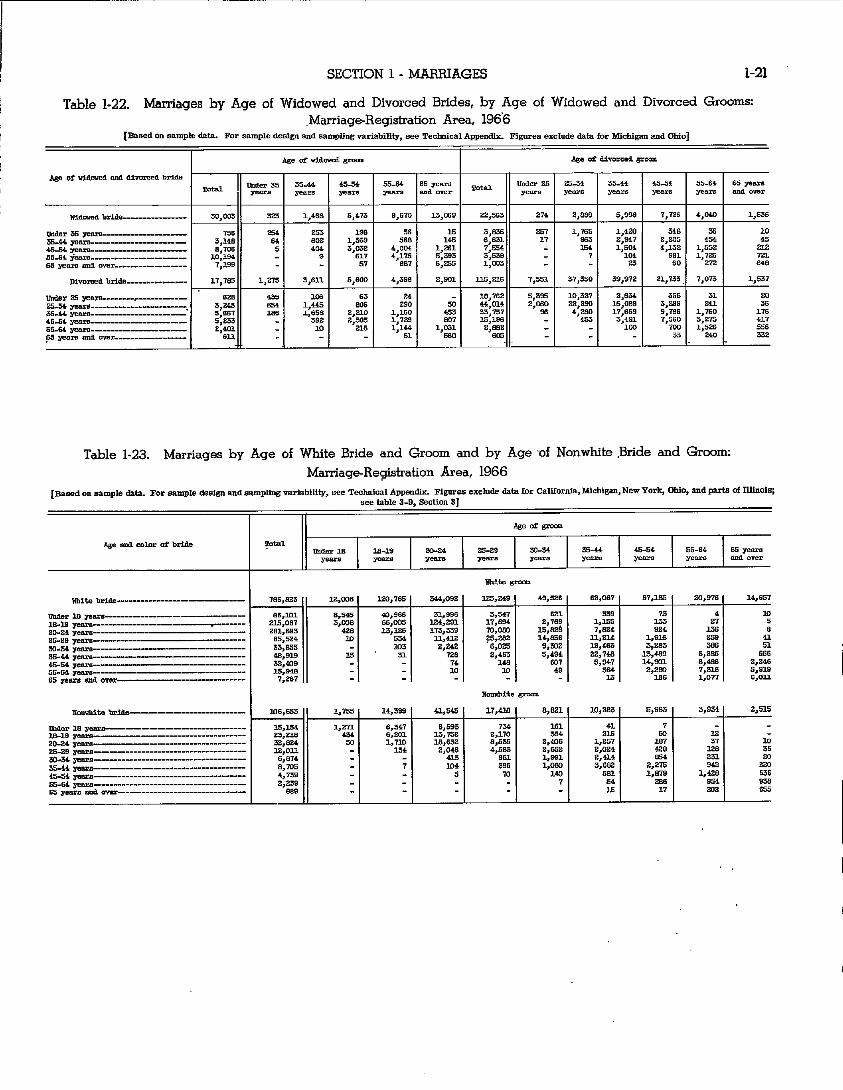
l-22. Marriages by age of widowed and divorced brides, by age of widowed and divorced grooms: M~riage-regis~ation area, 1966 ________________________________________ l-21
l-23. Marriages by age of white bride and groom and by age of nonwhite bride and groom: Ma~iage-regis~ation area, 1966------------------------------------------------- l-21
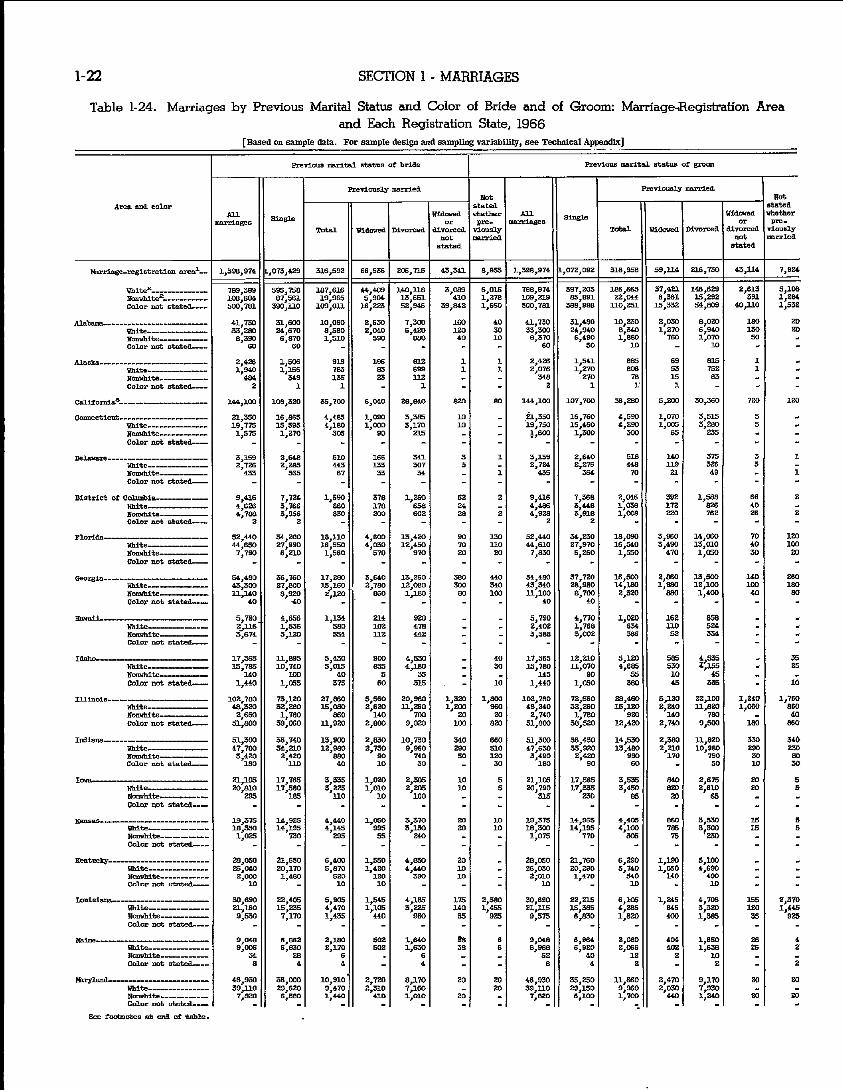
l-24. Marriages by previous marital status. and color of bride and of groom: Marriage- registration area and each registration State, 1966---------------------------------- l-22
l-25. Marriages by, number of this marriage of bride and of groom: Marriage-registration area ad each r-@s~ation State, 1966------- ____________________________________ -- l-24
i-,26. Marriages by previous marital status ofwhiteandnonwhite brides and grooms: Marriage- registration area, 1966--------------------------------------------------------- l-24
1-27. Marriages by marriage- order and age of bride and groom, by month marriage per- &me& M~ri~ge-registration area, 1966 ____ - ___________ - _______________-_-_- -__- l-25
l-28. Marriages by marriage order and color of bride and groom, by month marriage perform& M~riag®istration area, 1966 ____________________________________ - l-26
l-29. Marriages by day of week marriage performed: Marriage-registration area and each regis~ation State, 1966---------------------------------------------------------- l-26
l-30. Marriages by resident status of bride and of groom in State where married: Marriage- registration area’ and each registration State, 1966---------------------------------- l-27
1-31. Marriages by marriage order and age of bride and groom, by resident status of bride and groom in State where married: Marriage-registration area, 1966-------------- 1-28
l-32. Marriages by marriage order and age of bride and groom, by resident status in State where married: Marriage-registration area, 1966---------------------------------- l-30
l-33, Marriages by previous marital status of bride a and groom, by resident status in State where married: Marriage-registration area and each registration State, 1966--------- 1-31
l-34. Marriages: United States, each State and county, 1966------------i------------------ l-36
l-2
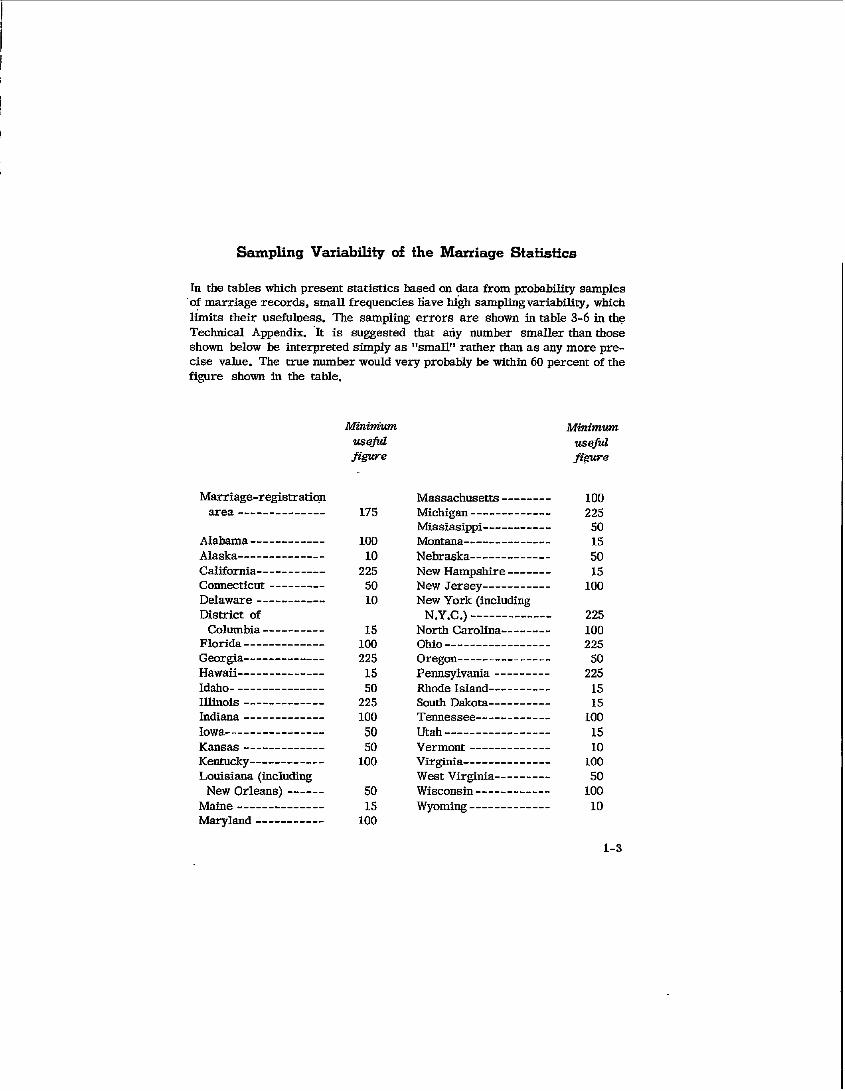
Sampling Variability of the Marriage Statistics
In the tables which present statistics based on data from probability samples ‘of marriage records, small frequencies have high samplingvariability, which limits their usefulness. ‘Ihe sampling errors are shown in table 3-6 in the Technical Appendix. ‘It is suggested that any number smaller than those shown below be interpreted simply as “small” rather than as any more pre- cise value. The true number would very probably be within 60 percent of the figure shown in the table.
Marriage-registration area-----------
Alabama ____________ Ala&a--------------
California-- _________
Connecticut --------- Delaware _ _ _ _ _ _ _____ District of
Columbia - - -_ ---_-_ Florida - _ - _ --- _- -_ -_ Georgia-- __ ___ __ ___- Hawaii- - _ _ - _ ___ _ - ___ Id&,- _ _ _ _ ___ ____ __ _ Illinois -_- -_________ In&ma - _ __ ____ _ _ ___ Iowa--- _ _ ___- _______ Kansas _ _ _ _ __ ___ ___ _ Kentucky -_-__-__ _ _ _ _ Louisiana (including
New Orleans) ------ Maine _ ____ _____ __ _ _ Maryland _ _ __ _ _ _ _ _ _ _
usejul f&ewe
175
100 10
225 50 10
15 100 225
15 50
225 100 50 50
100
50 15
100
Massachusetts -------- Michigan - - - _ _-_ _ - ___ _ M&&ssippi---- _______ Montana- ----_ _- - _-_- _ N&-a&a _____________ New Hampsbire------- New Jersey ___________ New York (including
N.y.C.)--------- North Carolina-------- Ohio -_ - _ -_____ ___ _ _ _ _ Oregon---------------
Pennsylvania --------- Rhode IsIand---------- South Dakota---------- TeMessee------------ lJt&----------- Vermont ___________ __ Virginia-- _ ____ _ _ _ _ _ _ _ West Virginia--------- Wisconsin --- - - -- - - -- - Wyoming _ ___ _ _ _ _ _ _ __ _
Minimwn useful f&we
100 225
50 15 50 15
100
225 100 225
50 225 15 1.5
100 15 IO
100 50
100 10
l-3

SECTION 1 - MARRIAGES l-5
Table 1-1. Estimated Number of Marriages and Marriage Rates With Percent Changes From Preceding Year: United States, 1920-66, and Marriage-Registration Area, 1957-66
Table 1-2. Estimated Marriage Rates Per 1,000 Men and Women 15 Years of Age and Over: United States, 1940-66
Table 1-3. Estimated Marriage Rates Per 1,000 Unmarried
Women 15 Years of Age and Over and 15-44 Years of Age: United States, 1940-66
l-6 SECTION 1 - MARRIAGES
Table l-4. Estimated Number of Marriages and Marriage Rates by Month, With and Without Seasonal Adjustments: United States, 1958-66

) ,
SECTION 1 - MARRIAGES l-7
Table l+j. Marriages and Marriage Rates: United States, Each Region, Division, and State, l962:66 [Data are counts of marriages performed supplied by states exceet as noted. Ffrmres differ from those shown in tables based on sample data. Rate8 per 1,000 population
New a@sna: Malne--------------------------------------------------- *e” &Q)paWre---- -_________--_--___--________________ Yap-------------------------------------- Wnasach”s&ti -___ - ______________________________________ Rhode Tsl~d-------------------------------------------- Oolmectinrt---------------------------------------------

l-8 SECTION 1 - MARRIAGES
Table l-6. Marriages by Month: United Statei, Marriage-Registration Area, Each Region, Division, and State, 1966
‘LTorthcast: mev ~~2----------.------------------------- Midale pitlnntic-----.----------------------
mrtil central: East ll.arth cent----------------------------------- wesr mrth ceot-----------------------------
“l_-. srmth ~-~~c----.------------------------ mst south central------------------------------- west south cent-------------------------------
paeiFle------.-.----------------------------------
nevsoslana;
nliooio-----.--.-------------------------- Michi@G _I___________ ---_------ ---- -- “isCmsla---------------------------------
xeti llorth central: larmesota (NR)--.-------------------------------- I------------------------------------------- mssnul (~,.--.------------------------------- ml.tt, rdwtg (Iw)---------------------------------- south Daltotk--------------------------------- ~~raaksr--.---------------------------------- ~~BI------------------------------------------
Bmltb Atlantic: Delavlue-.-.----------------------------------- ~~------------------------------------ District Of Columbia-----.----,------------ v&#nLb--------- -_-______ - ____- -_---- west Virginia-.------------------------------------ ml+& -ink---------------------------------- south camlina (NR)--------------------------------- Gro------------------------------------ IlO~da-------------------------------------
EiGL .Zouth c-“wal i KpducI(y:’ _________________-------------------------- T ~,.Fryt-------------------------------------- Illx~*-------------------------------------- Ml~rlr=r~~---------------------------------
west south centlalz *rhnsaa (NR)----------------------------------- -sisna-------------------------------- m (m.) _____-_- ---- _--___ - -_----_ -_--___-_ l&as (AR)-----------------------------------
IWUI~~: ~---.------------------------------ Tdahe------------------------------------ wycmlq+- __-_---_-_---- ---- ------I------------- C&m.a&~ (~---------------------------- llepr WC.2 (iq&-------- -----------1_- .&r~Zmla (~1R)------------------ --------
Nevd2 (NM--------- -___-______-___-----
SECTION 1
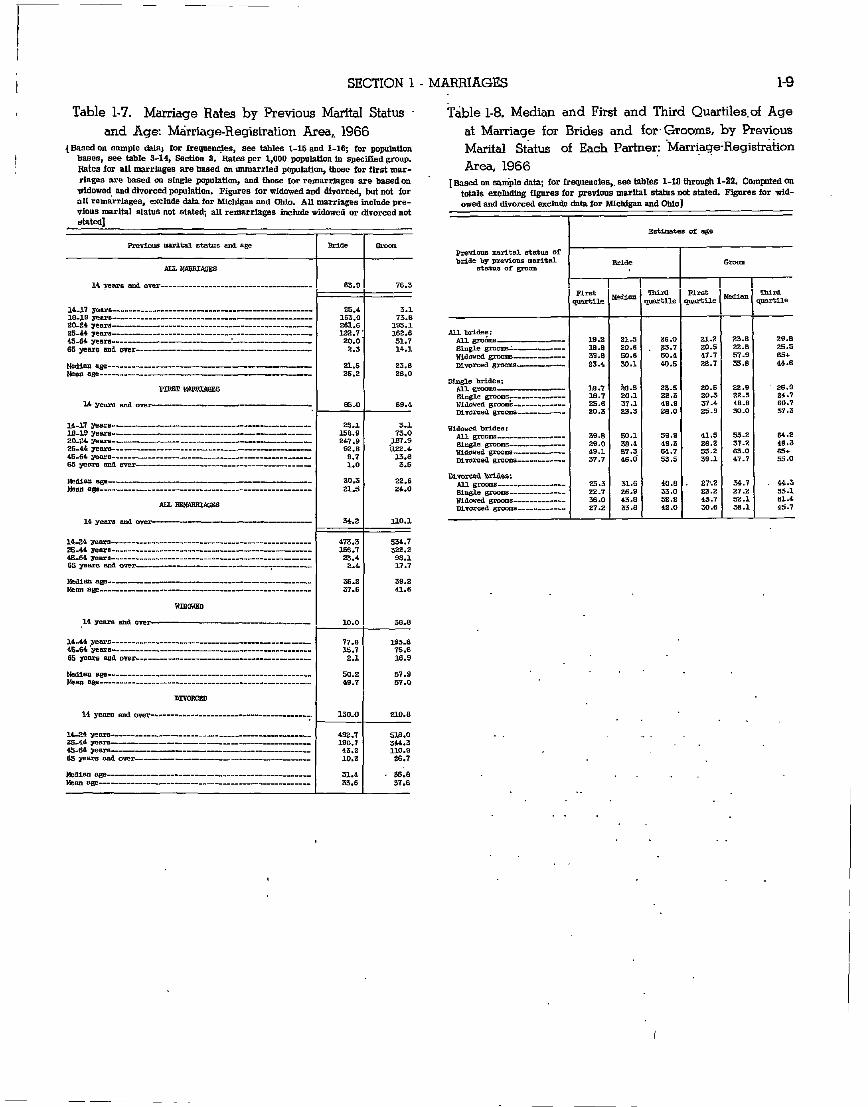
Table 1-7. Marriage Rates by Previous Marital Status and Age: Mkiage-Registration Area,. 1966
Qroom z 63.9 76.3
MAFWAGES l-9
?.dble l-8. Median and First and Third Quartiles.of Age at Marriage for Brides and for Grooms, by Previous Marital Status of Each Partner: ‘Marriaqe-Registkon
l-10 SECTION 1 - MARRIAGES
Table 1-9. Median and Mean Age of Bride and Groom, by Specified Age of Spouse at First Marriage of Both: Marriage-Registration Area, 1966
[Basedcmsample data; forfreq"encies,see tame l-191
Table I-10. Percentage Distribution of Marriages by Previous Marital Status of Bride and Groom: Marriage-Regfs- tration Area and Each Regikation State, 1966
[Basedm sample data; forfreq,encies,see table 1-X Computeda" btah excludingfigures forpre"imzs mar‘talstatismtstated]

SECTION 1 - MARRIAGES l-11
Table l-11. Percentage Distribution of Marriages by Marriage Order of Bride and Groom, by Color:
Marriage-Registration Area and Each Registration State, lb66
Table 1-12. Percentage Distribution of Marriages by Month Marriage Performed,’ by- Marriage Order and Color of Bride and Groom: Marriage-Registration Area, i966

1-12 SECTION 1 - MARRIAGES
Table l-13. Percentage Distriiution of Marriages by Resident Status of Bride and Groom in State mere Married: Marriage-Registration Area and Each Registration State, 1966
Maraape-re&lstratim Bre&--- ____ --_-
11IBb---------------------------- *Ins*&---.-----.-.-.---------------------- calil~-------.---------------------- cwnect~~-------------------------
Delevare---.---.----------------------- Didrt.3 c.* c*umMa----~-- _--- ------ P-~.----.----------------------- ao~t&---.---.-.-.-------------------
Horaii.------.-.---------------------
IlllnoiS------------------------- ~-----------------------------
~------.-------..------------------- -~.--.----------------------- Kent.* ----- ---------------- rK.uiS~ -------- ---- ----- ----__-
~--------.-----.------------ ml.¶llL------ _____- -----_- ___-_-- Harrachusetts-------------------------- I&au@&------ ________ -_--_-----_-
Mis~rallippr-.-------------------------- Mu---.---------------------------- AeblBi6~----------------------------- neu Bampshire--------.L-----------------
llev ~-=--.-------_--------------- lk” lo.lr-.--------------------~-- NOorth cam-----------------------
-_
- -_ _- -_
- --
--
_- -_
__ __
_- -- -- -
_- _- _-
_- _-
_-
_-
_- __
.- _-
__ ._ __
80.7 3.1 3.3
5.0 . . .
:::
7.0 5.9 1.1 3.1
. . . 3.4
2,”
:::
2:
2::
2:
3.7
::; 3.3
23” 2.4 2.3
2::
2:
2: 6.9 3.3
8.6 3.1 4.4

SECTION 1 - MARRIAGES
Table 1-14. Percentage Distribution of All Marriages, First Marriages, and Remarriages of Bride and Groom by Age at Marriage, and Median Age: Total of 22 Selected States, 1957-66
“nau. 20 ye------------------------------ 2021 YE--------------------------- 2529 ye-------------------------------------- 3051 ~ycBeQ-------------------------------------- 3Lu yenln------_~_~~~~~~~~~~~~~~~~~~~~~~~~~~-I~~-- 4564 yeoyB--------------------------------- 65 years en* cver-lr- ____ --------------
mde I---------- -------__----- _______. 1W.C

SECTION 1 - MAKEUAGES
Table I-15. Marriages by Marriage Order, Age, and Color of Bride and Groom: Marriage-Registration Area, 1966 [Based cm sampte data. For sampte .iesi!gl and sampling variability, see Technical
Appendix. Figures by eotor exclude data for California, Michigan, New York, 0th. and part.9 Of Itttnois. These data are blctded ti CDkm not stated; see table
Table 1-16. Remarriages by Age, Previous Marital Status, and Color of Bride and Groom: Marriage-Registration Area, 1966
SECTION 1 - MARRIAGES l-15
Table 1-17. Marriages by Marriage Order and Age of Bride and Groom: Each Marriage-Registration State. 1966

l-16 SECTION 1 - MARRIAGES
Table 1-17. Marriages by Mamiage Order and Age of Bride and Groom: Each Marriage-Registration State, 1966~Con.

SECTION 1 - MARRIAGES 1-17
Table 1-17. Marriages by Marriage Order and Age of Bride and Groom; Each Marriage-Registration State, 1966~Con.
zu)
I.00
50
m : ::zl

1-18 SECTION 1 - MARRIAGES
Table l-18, Marriages by Age of Bride, by Age of Groom: Marriage-Registration Area, 1966 pasea on sample data. Par sample desigo and sampliog variability, 888 Technical Appendix]
Table 1-19. Fist Marriages of Both Bride and Groom, by Age of Bride, by Age of Groom: Marriage-Registration Area, 1966
[Based or, sample &Lx For sample design and sampliog wriahilitg, 808 Technical Apper&]
28 -B
29 em Y
2
Y
I

SECTION 1 - MARRIAGES 1-19 I I Table l-20. Marriages by Age and Previous Marital Status of Bride, by Age of Groom (All Grooms and Single
under 20 y~B------------------------------- 2024 yeas.-..--.-.-_------------------- 25.29 years ___-__- ----- _----_ - --___----- --
15.54 ;years----..----.------------------- SS~Glr yeam _--- ------ -1-_-------1----
Under 25 years-.-.-,--..------------ P524 yolll‘a------------------------
,5-s* yelvb--m-----------ms- -_-_- - 6564 yeas---------------------------- 85 reara end oyer-------------------------
Under 20 ~=------------------------------

l-20 SECTION 1 - MARRIAGES
Table 1-21. Marriages by Age and Previous Marital Status of Groom, by Age of Bride (All Brides and Single Brides): Marriage-Registration Area, 1966
SECTION 1 - MARRIAGES 1-21
I Table l-22. Marriages by Age of Widowed and Divorced Brides, by Age of Widowed and Divorced Grooms: Marriage-Registration Area, 196’6
I [Based on sample data. Far sample design ad sampling “ariabilitg, see TechoiEsl *ppendix. Figures exCf”de data for MfChigal and Ohio]
I Table l-23. Marriages by Age of White Bride and Groom and by Age .of Nonwhite ,Bride and Groom:
Marriage-Registration Area, 1966
l-22 SECTION 1 - MARRIAGES
Table l-24. Marriages by F+evious Marital Status and Color of Bride and of Groom: Marriage-Registration Area and Each Registration State, 1966
miability, see Technical Appendix]
White------. Pkmwhite~----.---. CDlDr not state*-.-
Kan~s.--------------------- bnwe-------. Ilrmuhite------. color not atate*-.
~~~-----.--.------------- white----------- ,Imhi*c------- cdcm not statea--.
white--------. ,wrlvhite ------- - color not stateL--
~~---------.-.------- white------- NCUlWMte-------- color not stnted--.

i
SECTION 1 - MARRIAGES
Tale l-24. l&rrhges by Previous Marital Status and Color of Bride and of Groom: Marriage-Registrationation Area and Each Registration State, 1966-Con.
[eased a, sample data. mr sample d&g and sampling rariabilitg, see Technical Appendix]
r r

l-24 SECTION l- MARRIAGES
Table l-25. Mar&ages by Number of This Marriage of Bride and of Groom: Marriage-Registration Area and Each
Table 1.26 ‘Marriages by Previous Marital Status df White and Nonwhite Brides and Grooms: Marriage-Registration &a, 1966

SECTION 1 - M&AGES l-25
‘Table l-27. Marriaqes -by Marriage Order and Age of Bride and Groom, by Month Marriage Performed: Marriage-Regisiratfon Area, 1966
s-ML--------------------------------------~ 65 yeara and oyerlll---l------l---_ -------_
-
55-M ~ysara-------------------------------- 65 mare and over---------------------------------
lJtlda%. 20 mpJ.yB __-___-_- -- -_-__ - _______-_ - -_--__-- 8044 yes------------------------------------- ~~9 yew* ~~~~~~-~~-~~~--lll~-I__ I-..- _________.-
55-a ye~----.---------------------------------------~ 65 pars aad - ----------------_I - -1--____11-
-mAor-
_.
.

1-26 SECTION I- MARRIAGES
Table 1-28, ,Marriages by Marriage Order and Color of Bride and Groom, by Month Marriage Performed:
Table 1-29: Marriages by Day of Week Marriage Performed: Marriage-Registration Area and Each Registration State,
luea
~-gistratiGn are&---------------
Illabamh..--...----------------------------
*slrar---.---.------------------------------- caliwallin-~- ------ ---_--- -I---------
COnnectLeut-.-------------------------------
De-~---------------------------------- IdBtdet of Col~la------.----.--------------
Georsia-.-.-.-.--------------------------------
--.-.---.------------------------ ~---.-.--.---------------------- nlhoin ---------- - --_--- - ---- - -1-----1-1 ““-----------------------------------
TOUk--.---.-.-----.------------------------- KBnBQ~----------------------------------- Keotuclp;------------------------------ -siaoa------------------------------
Hanlana--- ------_---_---------_ ------------ *~6*~6ett6----------------------------- ~ehlgan---.-------------------------------
~LiBSlae*pp~-.-.--.--~-----------------------

(
SECTION 1 -. MARRIAGES l-27
! ,‘Table l-301 M&ages by Resident Status of Bride and of Groom in State Where .Married: Martiage-Registr?tidn
[Base
All -rrages
d a -
1
- T
t
r

l-28 SECTION l- MARRIAGES
Table 1-31. Marriages by Marriage Order and Age of Bride andGroom, by Resident Status of Bride and Groom in State Where Married: Marriage-Registration Area, 1966
1-d
Uasriageaaerandogeofbrlaedgram
w&%%xaus
=---.--.----.------------------
ml&r la years----------- -----I------ la IBM--------------------------- 19 ~~----.------------------------- 20 yeB~---------------------------- 21 ---1-111--11 years---------- 22 year& ___-- ----------A----------
25 ~-.-------------------------------- 24 years---.-.------------------------- 25 ~--------------------------------------- z% years- __-_ ----------------- 2,yF-----------------------------
..28 yxaYe------------ ---- ---- ----I-
29 yT*r~---.-..------------------------------ 3051 ye~vs--------------------------- 3544 ye~6------------------------ &55511 yeas----------------------------- 55.64 yeare----------------------- 65 yF*rn and -r------------I---_------
or-.--.-------------------------
UMer 18 yea----------------------- la years------------------------------ 19 ~----------------------------- 20 ~yeIv6--------------------------------- 21 ~------------------------------ 22 yeQpe------------------------------
PjFars----.---------.----------- 24 ------ -- years---------------- 25 yeoies------------------------------------ 26 years------------------------------ 2, yeare------------------------------- 28 FOG-------------------_----------
~-----_-----I_____-__-_---- --- S&34 years---------------------------- 3544 yelv~---------------------------- 455-y ye------------------------. 5564 yesl.i --__ -------------- ---_- --_- 65 yeal.8 and mh-----------------
FIWI-
Bllde-----------.---------------
er la yeas---------------------- 7.8 yeB~---------------------------- 19 ~~~-------------------------------- 20 Ears-.---------------------..----------- zl yeQpD------------------------------ 22 FBpa----------------------------
23 Fars---------.----------------------- 24 years----.-------------------.--..-.-- 25 ~Brs-------------------------------- 26 years -------I-- - --_- -------- 2, ~-----I---------I------------------ 28 yeers---- --_-- -~-----~-----~
29 ~------------------------------ 3L31 years------------------------------- %A4 yeara----.-.---------------------- 45.54 ye~~----.-..------------------ 55* yenrs---------.-.------------ 65 yeam and we=-----------------------
on------- _-__ -----_-- ____-
‘h&r La years ------------- --_----- la ye*.3- ____ ------~~~--------~ 19 yeo=B--------------------------------- M ycare----.--.,.----.-------------------- 21 ye-------------------------- ze ~yeare-------------------------
23 F-------.---------------------- 7.4 FarB--------.----------------------- 25 yeara---.----------------------------- 26 ye-.-.-----.------------------------- 27 ~yeara--.-.------------------------- z.s,yeara------------------
19 ;years.---------------------------- 3034 years----------------------------- 55A4 yeQFS---.------.-.------------- 45.54 Fan-------------..-------------- 55-m years--- _-__ --__--_----_-_--_- 65 Y.3e.m ana over---- ---_ --------

SECTION 1 - MARFiiAGES 1-29
Table 1-31. Marriages by Marriage Order and Age of Bride and Groom, by Resident Status of Bride and Groom in State Where Married: Marriage-Registration Area, 1966-Con.

l-30 SECTION 1 - MARRIAGES
Table l-32. Marriages by Marriage Order and Age of Bride and Groom, by Resident Status in State Where Married: Marriage-Registratid Area, 1966
-
T

I SECTION 1 - MARRIAGES l-31
Table l-33. Marriages by Previous Marital Status of Bride and Groom, by Resident Status in State Where Married: Marriage-Registration Area and Each Registration State, 1966
Dlwm~------------------------- Widnre& or aivmwsd not ststea---
First rmri-iage or remarriage not stares---------------------------
wr-d----------------r--------- myoma------------------------- “i&wed or aivurced not state*---
First lonrrlsge or -age not atatea----------------------------
met pmn.jnpn ------------------- A~ogea----~-----------------
.._-__- D~-ced------.---------------- Hidwca OF wmrcea not stated--
tint nL9rriage m remarriage not ~tot~d--------------------------
~-ed----------------------- Uideved or divorce* not *t.Ed---
m.rst narriage or -:sge “0% BtBteb--------------------------

1-32 SECTION 1 - MARRIAGES
Table l-33. Marriages by Previous Marital Status of Bride and Groom, by Resident Status in State Where Married: Marriage-Registration Area and Each Registration State, 1%X-Con,
I-.-d t=, =-de d=+=. For =@JPk d=ien and Sampling V=iabiW, see Techtdcal Amen& F‘mres for widowed and dhmeed exehde data ior Michigan a,,d Ohio; ,,,eae dab
First msrriases------------------ up*--------------------
rndouc~---------.---------- ~~-----------~~~~ “ldoued. m ai-ed not state&-
- n,amlae or.reranew not state,? --------- ------_-
WidlrveP or di-ea not stated-- Pirat -gs or remarriage not
stated--------------------
Fillit %mlTuge~----------------. Rwarrisgee ---_______-__ - ________
“i-d---------------------- M~ed---------~~~~ mw m avmrcea not stat-
Wst.marringem~nd sfat~---------------------
wet ~---------- _-__ n-s--- ------ ---_
Flmt narr&es---------- llmurlagea--------- _-__
Wan------------------ mvm.cea----------------. Hianvea or diwrcea not *tea--
First l?alriage or l-sadap not sts*8a-----------------------

I SECTIdN 1 - MARRIAGES .I-33,
Table l-33. Marriages by Previous Marital Status of Bride and Groom, by Resident Status’ in State Where Married: Marriage-Registratibn Area and Each Registration State, 1966-Con.
[Based on sample data. For smpti design and sampling varb.b~~~, see ‘Technical An?xndix. ~immes far widawed’aad divorced exclude data for Michiganand Ohio; these data
First marriages------------------- R~~eB-----------------------
Hi-d-------------------------
II ?srmmA
Bride-------------------,-.

l-34 SECTION 1 - MARRIAGES
Table l-33. Marriages by Previous Marital Status of Bride and Groom, by Resident Status in State Where Married:
Marriage-Registration Area and Each Registration State, 1966-Con. [Based or. sample data. For Sam&de design and Sam~E variabilty, see Technical *ppelvli% Figares far wi&d and divorced exe,ude data ior aficldgsn and ado; these dptrl
Dm~--------------------
Pirot -ws---------e RWMIQgSS _________ -__- ____ -_
D1v~~sa-------------------
!4idoxed or dlvmred 1Dt stated-- FIrat manlage or I -ge mt
atsted---------------------
mms!a
D1~~~Eed----------------------- uiaoved or dimmed not stated---
‘irS+d marriage or remarriage not statea-----------------------
mt lmmiages--- _-_- -___-- Remarriages ___-- --_-- -___ ---
“ldolrrdr----------------- m%.x-cea- __-_ ------------- wiaovea or divDrced not *ted-
First marrlsge or remerringc not q teted----------l-------------
‘*St -ages-------------------- ,~asea----------------------
W~doued-------------------- Diymced-------------------- W*anvea or divnrcea not Etated---
‘*St marrim m -Ke not
First -IQge*------------------
Rages--------------------
“iawe&---- _________- ----
Diwreed----------------------
.Lrst mnrriagea- ____-_ ---_-- l~~ge5---------------------
Widared----------------------- D~(VEe~------------------------
wMoweb or aimred not at&d--- ‘rrstmaniqeor~liagenc.t atat&---------------- - 20
2,160 80
lrst marrlngcs ---___ --___--___ emmaage* ----- ----___-___
D1-ed------------------------- “ianwe& or divorced not atatea-.-
ir* maniage or b?.rrisge not stated--------------------

[ SECTION 1 - MARRIAGES 1-35
Table l-33. Marriages by Previous Marital Status of Bride and Groom, by Resident Status in State Where Married: Marriage-Registration Area and Each Registration State, 1966-Con.
[Based on aample data. For sample desik?t and samplir!s variability, see Technical Appendix. Figures for widowed and dfvorced ~xcluda data for Mbhfgan and Ohio; these data
l-36 SECTION 1 - MARRIAGES
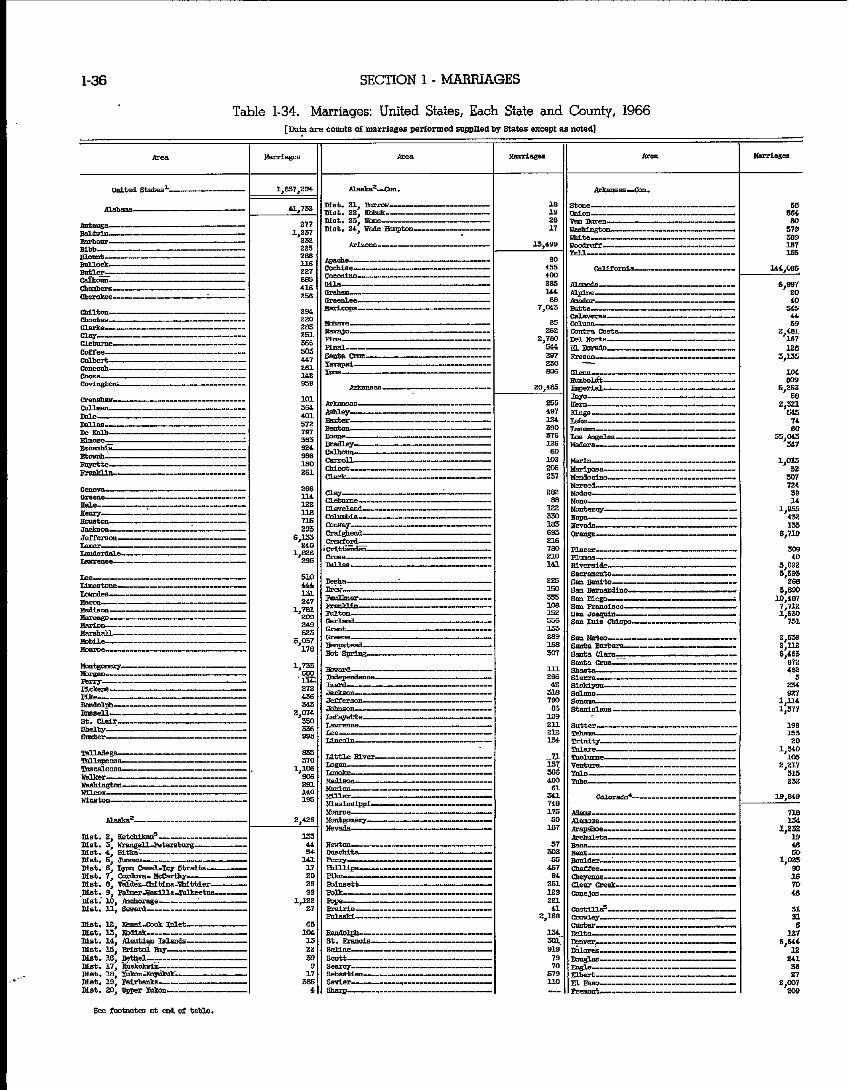
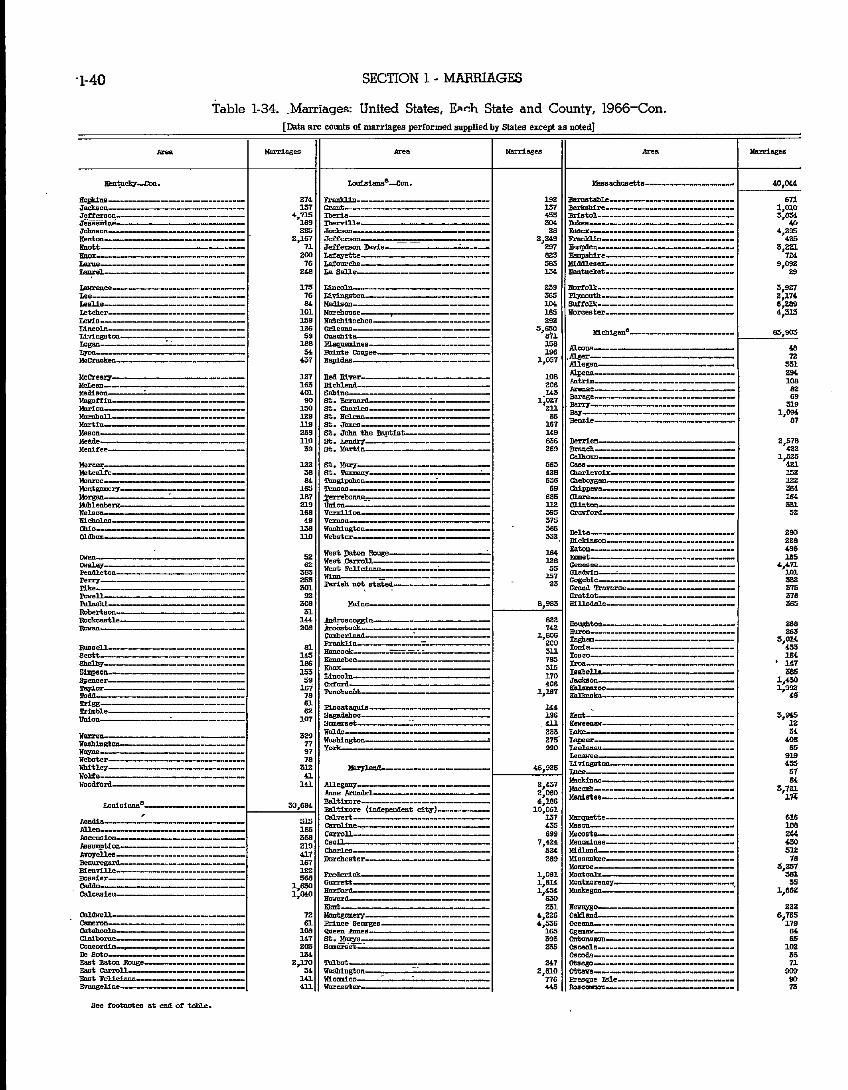
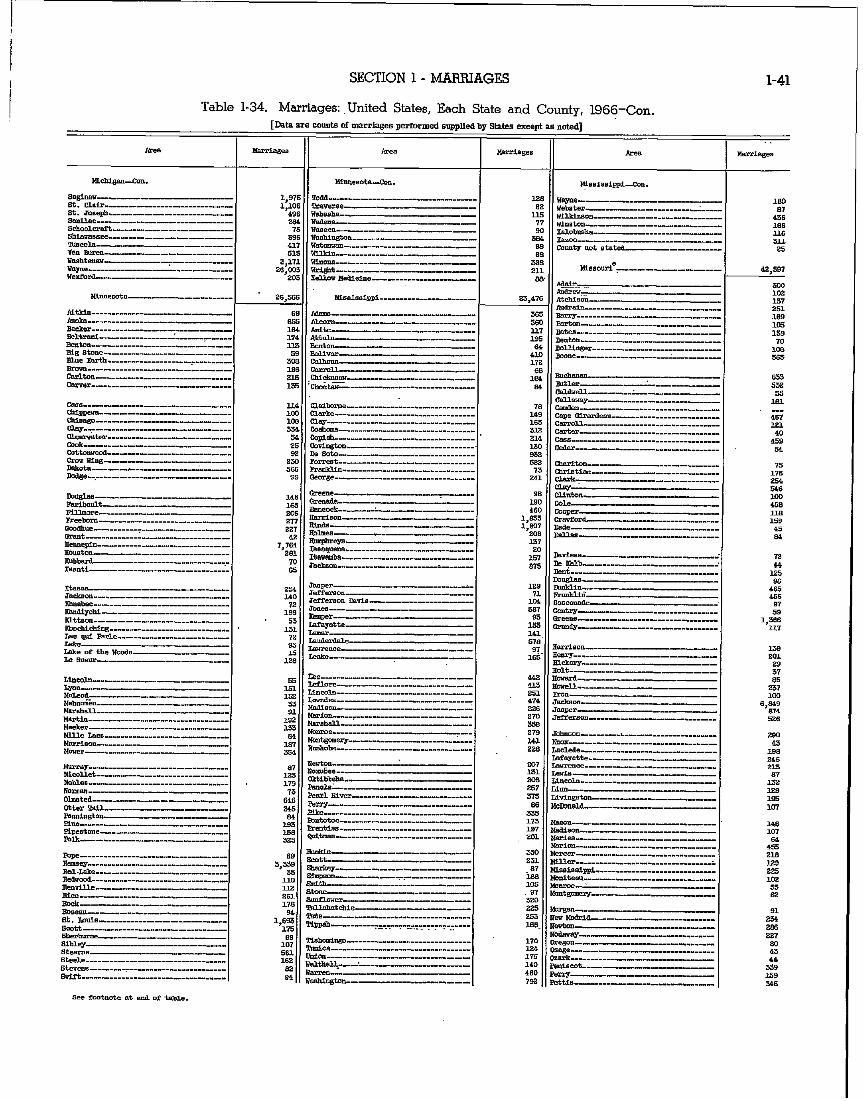
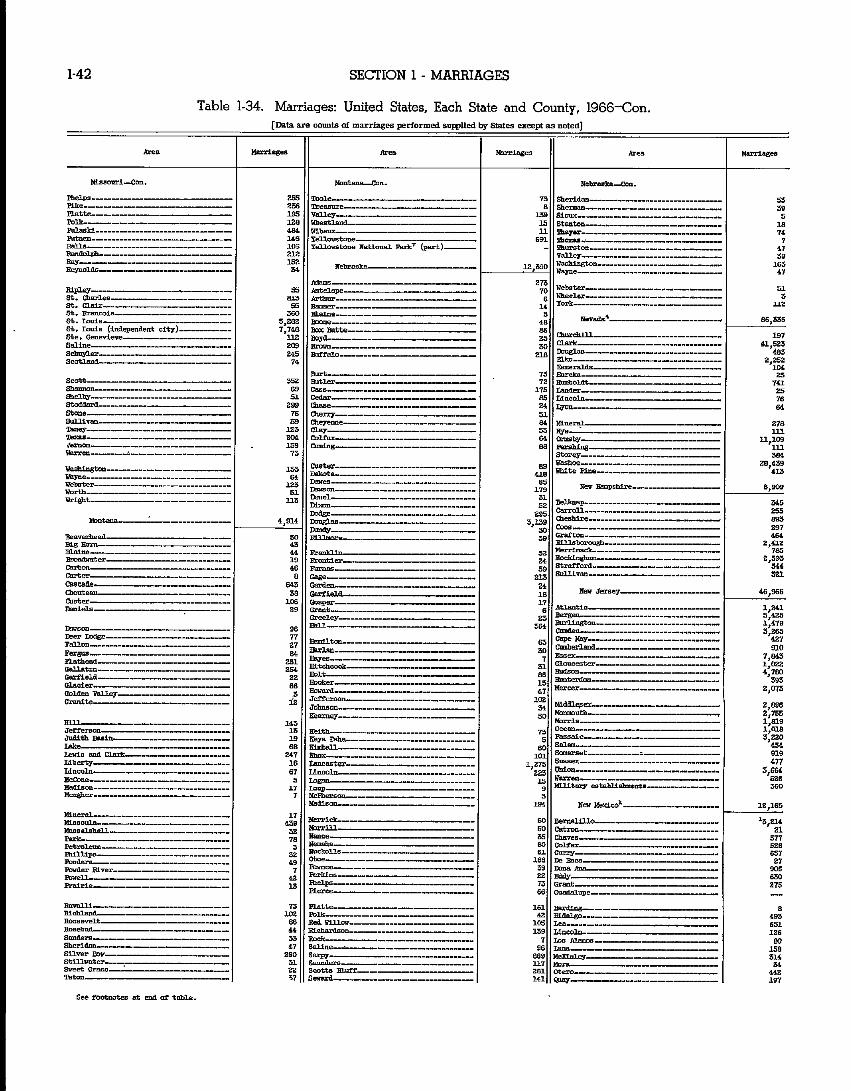
Table l-34. Marriages: United States, Each State and County, 1966
g 11 z------ ---- ArkaoaaP.~--- ------- -- L
-II
c-*~--------------------- 748 115 ~-..-.----.--.-.------------- 50 ~88--------------------rl-
107 ~~-----.---.-.------------
22L a1 m.tiuns-------------------- II 2,168 -~-------------.------
I.?+. ~~a---------------.--------- 301 ~wer,---------.-----------
II 919 ~~.---.--------.-,--------

SECTION 1 - MARRIAGES 1-37
Table l-34. Marriages: United States, Each State and County, 1966-Con.
I
EiL3WL.h--- __-_- ------__- I(ent..--------------------- New castle----.--------.--------- 8uBllex---------------------------- 1
----------------------------- -IL----------- -____--- Rltnrrm------------- ---_-

SECTION 1 - MARRIAGES
Table l-34. Marriages: United States, Each State and County, 1966-Con. [Data are ?.ounts of mvrhges performed wppUed by States except as noted]
w&ter--.-- ---------- UkeLer------ ______ ---- ____ ate---------------------- Ybitfleld----.--------------- Wilcor--~---~-~~--- ------- y.!&‘- _------- ----
------- pmta------------
no Knr,e--------.---- ----I- ,g KaLlkehee---------- --I---
g Ken&n-~----~----...------ mu ___- -----_-
~ Tab------- ---__- 887 Ie saLle----~~---~~--
7hWXUCe------ ---------- 215 IIee----------------- 43 I,iiogstm---------------
II 6 m-- ---1----1-1----- 726
64 Esc~--------m--mm-s 2M
II %$cxemy-.---------- -------
15 -on-------------------
Eli ---------------- plntt- __I^ - -I--- -- -----
371 Ean&l~---------------~---
/I
xMmnL-----.---------~ 33 Rock Island------------
643 3% mall...------------
~~=------------------- _----------------
cloy_--= _-____ -__--- cu0t.m ---- ------ -----
II -aoB----------------------- ( 31,217
;I Geese------------------- ~05 II nIsad,l*m--------- __-_ ------ ,3 Hancocr------------.--------------

SECTION 1 - MARRIAGES
I Table l-34. Marriages: United States, Each State and County, 1966-Con.
lllvdill ---------------_----_________I_ 1
!8nbae,csr--- ____ -----_----- -On-----.-------------- ~oholl=l--.---.----------- HILla--------.-------- Nitty-.--.---.--.------------ ~~~-----.-.----.------------
O’Bllm-------- __--______ Ooceola.----.------------------ Fqe--------- ---_ -_- ____ Palo Alto-----.------------------ ~~~..----.---...------------ FOEPhOdBB ----- ---------- EWL--- -_-- ----_---_---- Potta~~~~e------------------ -slllelr-----.-.----------------- ~-..---.------------------
Gill --.-------------~I
g II
I,%llcoln---- -_-_ ----__---- _-__ Ilnn---.------------------ .ff ~~------------------------------
JI -Io11--------------------------- 109 Hart.- -_-- ---_----------
171 35 Hendersm-L ------1-1--1-1--- ,d Ee!Jly------..----- ___- --- 95 arelrman-..-..-..--;------------
l-39
SECTION 1 - MARRIAGES
Table l-34. .Marriages: United States, Each State and County, 1966-Con. [Data are ca”nb of marriages performed supplied by States except 8s noted]
K-=-8- bzca
I
aopblne------ ----I .TC,CbO~--------------- ---- Jeff-on -----1_--1 .TGi-- --- JL,banon-------------- I[eotm---------- RMtt------------
------------I--- IalReL------------
larrenee----.----------------- Lee-------------------
Ieteher--------------------- I.?WiS -___ --- _-_- --- __--_- Lincoln-- ______ ------- ~vingstcm -___ --_----_--_- L2gaL--.----2~--- ____-
Metcaife---------------~ MoNme-------~------- Mmtgcmery~-----~--------- KargeJL------.-L------ Mullenbern- -------- ~=elnrm------------------ ~icholae-----------.--------
meMY- ------ Fe?alewll- ----- ----------- perry-----------?---- *ke ------- ------_ mh-ell----------- RllasH-~----~-------~~~ Robertaon _---I---- I-~- R.x!exstLe--- ------- --- Ravan----------------
149
--- II 836 Ben?en-.- ---- _______ __ 269 mea*-------- --__ - _---_
24, maego- ----_---_-----_-----I- 2,610 ottaua---.---....-------------
175 Resquc ~------.--.-----..-------- 445 ll F.oaccamlon- -------I--- - --II I-
SECTION 1 - MARRIAGES
Table l-34. Marriages: -United States, Each State and County, 1966-&n.
1-41
1-42 SECTION 1 - MARRIAGES
Table l-34. Marriages: United States, Each State and County, 1966~Con.
PhelDS ------ --- PIlrL ----- -------. Plstte---------.-----. polh I------ -----.
putnem-- ____ -____ --_. Rslls----------------------- nMaD~#b---------~-~--I Fap----------~--~---- Repwlas----------
Flpley---------..------ St. Lharles---------. St. clair-- ---__ --__-- _-__ --_. St. ReacOle-------------.
“* e4 “~e~~------------------------~ 55 Nye------------.------ 64 omay~---------.---. 88 II Fershiw-~--------.-- ____.
py Ellnteldno I--- - -_-- ---_--- -___.

SECTION 1 - MARRIAGES
Table I-34. Marriages: United States, Each State and County, 1966-Con.
l-43

SECTION 1 - MARRIAGES
Table l-34. Marriages: United States, Each State and County, 1966-Con.
90 168 795 85 267 133
II ottavo-------- -___ - pawiie..~~~~------ ----- Pqne------ -1----- Httsbnvg ___- -- __-- -_----- Rmtotas -_-- ------------ Fwewdmle-----------
Z36 Alsbmataha-- --_----- 268 Iloge Eaus--.---.------ 167 742 w -___- - __-__ -----
sue -__- -_-_----_- w3 sepc.3
1219 -~~ 5ll w -___- --------------
4220 676 II mlsa __-_-_ ---- ---- ---
299 u-,l----A----- 2,774 -as&i&--------
II --------
6ps wooda-------- -_-------- lb= wooavmzd-- __----_-----
-, II F.iY (ae~-------------- 235 117 ~~---------------
u,elnkee-------- ---I-- -
awDtav?~----------~~-~---
clmarmo---- __-- ----------
cle--- -___I-- -- ---- --
cosl----------------.------
Wmsncbe---.-.-----------------
big------_.---.-----------
cr&.---- ----_I -__-1---
K%&o- l_----- .T-On-r----L----- Jetlcrsrm-- -111- ---- &hda--~~,------,- I
11 Ibcolo- _--_-_ ---------7 5i
%
[II
Ibultnomh -__-- ---- ------_-- ; R,lk--l----~-~~----- i Fh5lnen---- _-__I---_

SECTION 1 - MARRIAGES
-34. Marriages: United States, Each State and County, 1966-&n.
27 E.7 De ml--- _____-__ -_---_-_ 34 II mcksm --I---_ ------ -___-
____ - -_-. ----_-
~-----------------------

SECTION 1 - MARRIAGES
Table l-34. Marriages: United States, Each State and County, 1966-Con.
apron---------.-.------- DreEg ---- -- --_- --._--_-_- Grlmee -I-_ ----_-------- Oua&lu~ ---_ -------_-___ Hale-.------------------------ -----------.--.----------------- ~~*------.------.-------- Hansfoti-------------- -------------- EPA%!&---------- _________
H-BOLI----------------- BartleY ------- -----_---- ~----------.-.-.--.---- Hays -------- ------_-_- Hoophill----------- alto----------.------- ~~----------------------
Bood-------------_--------~~ m$&LE--------------~ Harutan-------------------- ~-----------------~-- Budsp&h ---- -------- ____ --__
Kent----------.------------ k -----------_ --___ Kimble--------.--------------
----------L---- stM ------ __-_- S%-nS-- ---_-___ St&w&--- ---_-____ s-~----~~----- _____ SynIR-------------------- svl*er------------------

SECTION 1 - MARRIAGES
Table l-34. Marriages: United States, Each State and County, 1966-Con.
l-47

SECTION 1 - MARRIAGES
‘Table l-34. Marriages: United States, Each State and County, 1966-Con.
~.-------I.-----.--------- St. Croix---- --_--- --_--_--__- saulr-.--------------------~ 8-l--------.-.----------- shavMo..-------~-------
W~sconsin~.
105 wauahara------.--------- 262 wlooebago------~-~--~~--- 293 wocd-----------
2z -Ug-----------. A
,dlwagicon. g ale-----.-----.--------------
Ei*COh ------ ---_--_--__- ___- *226 mtN,na-------.-.-~-~-- NlOtUCSlX ------ ---_- _-_-__ 3 696 Rpy-----------------------. .

Section Z. Divorces Table . Page
2-l . Estimated number of divorces and annulments and rates, with percent changes from pre- ceding year: Unit&States, 1920-66----------------------------------------------- 2-5
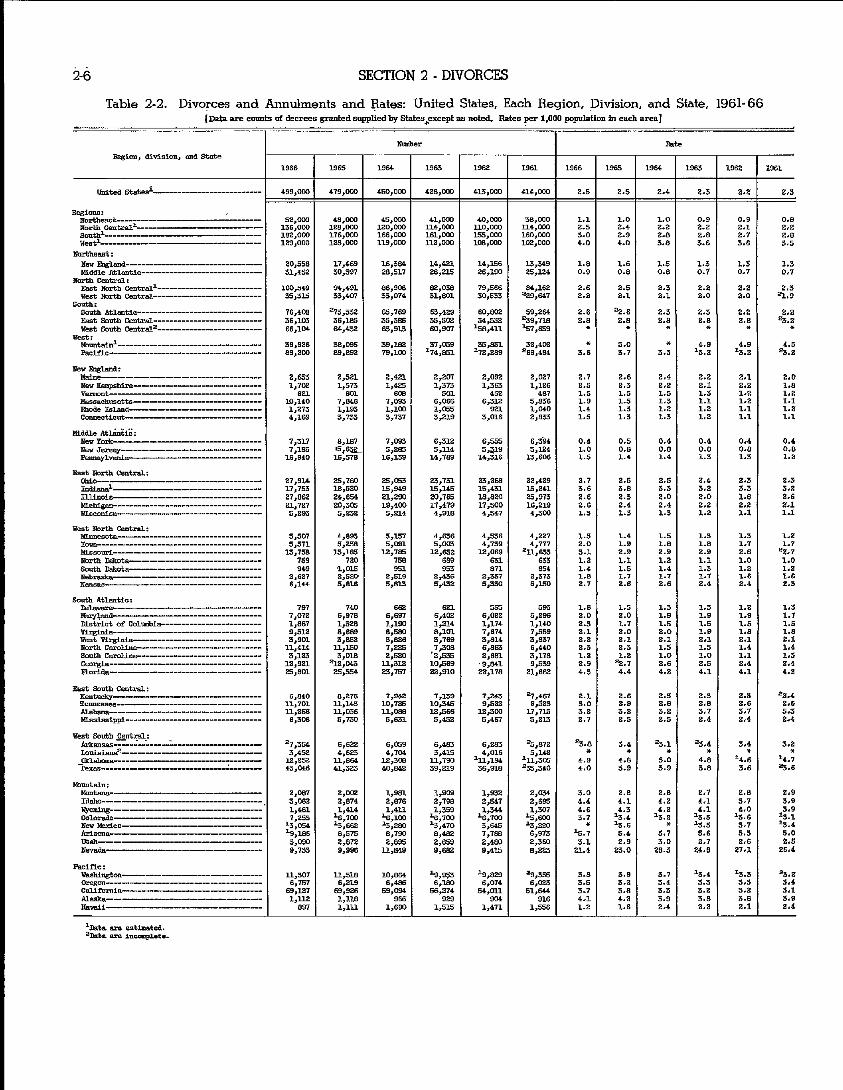
2-2. Divorces and annulments and rates: United States, each region, division, and State, 1961-66------------------------------------------------------------------------ 2-6
2-3. Reported annulments: United States, each region, division, and State, 1961-66----------- 2-7
2-4. Median ages of divorced husband and wife at time of decree and at time of marriage: Divorce-registration area and each registrationstate, 1966-------------------------- 2-8
2-5. Percentage distribution of divorces and annulments by duration of marriage: Divorce- registration area and each registration State, 1966---------------------------------- 2-8
2-6. Median duration of marriage prior to divorce or annulment: Divorce-registration area ad each re@&-ation State, 1966 ________________________________________--------- 2-8
2-7. Divorces and annulments by color of husband by color of wife: Divorce-registration area, 1966--------------------------------------------------------------------------- 2-g
2-8. Estimated number of children involved in divorces and annulments: Divorce-registration area ad each registration State, 1966 ________________________________________----- 2-9
2-9. Estimated number of children involved in divorces and annulments: United States, 1953-66------------------------------------------------------------------------ 2-g
2-10. Percentage distribution of divorces and annulments by number of children reported: Divorce-registration area and each registration State, 1966------------------------- 2-9
2-11. Divorces and annulments by age of husband and wife at time of decree: Divorce-registra- tion area ad each registration State, 1966 ---------------------------------------.-- 2-10
2-12. Divorces and annulments by age of husband and wife at marriage: Divorce-registration area ad each registration State, 1966--- ___________________________ ________-_---__ 2-11
2-13. Divorces and annulments by race of husband andwife: Divorce-registration area and each r-gisaationstate, 1966---------------------------------------------------------- 2-12
2-14. Divorces and annulments by number of this marriage of husband and wife at time of de- cree: Divorce-registration area and each registration State, 1966-------------------- 2-12
2-l

Table Page
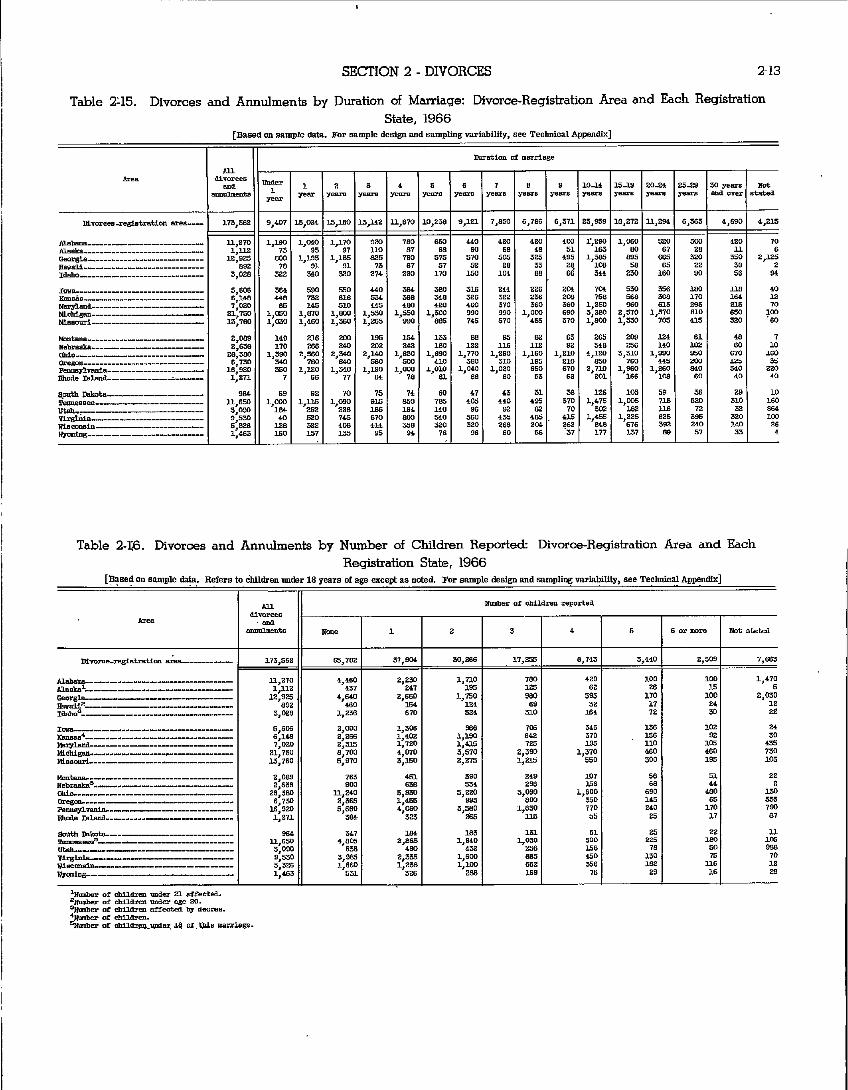
2-15. Divorces and annulments by duration of marriage: Divorce-registration area and each re@seation State, 1966---------------------------------------------------------- 2-13
2-16. Divorces and annulments by number of children reported: Divorce-registration area and each re@swa&n State, 1966----------------------------------------------------- 2-13
2-17. Divorces and annul.ments by duration of marriage and number of children reported: Divorce-registration area and each registration State, 1966-------------------------- 2-14
2-18. Divorces and annulments by month marriage performed: Divorce-registration area and each r-@stration State, 1966----------------------------------------------------- 2-15
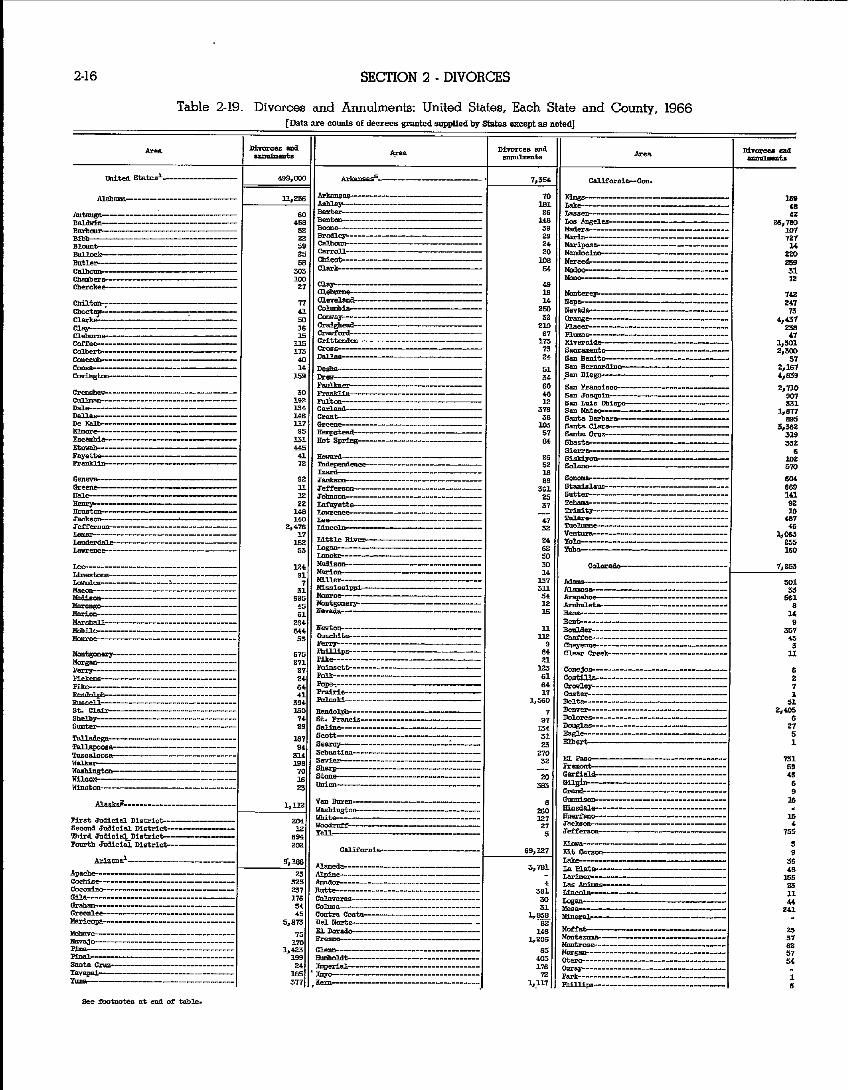
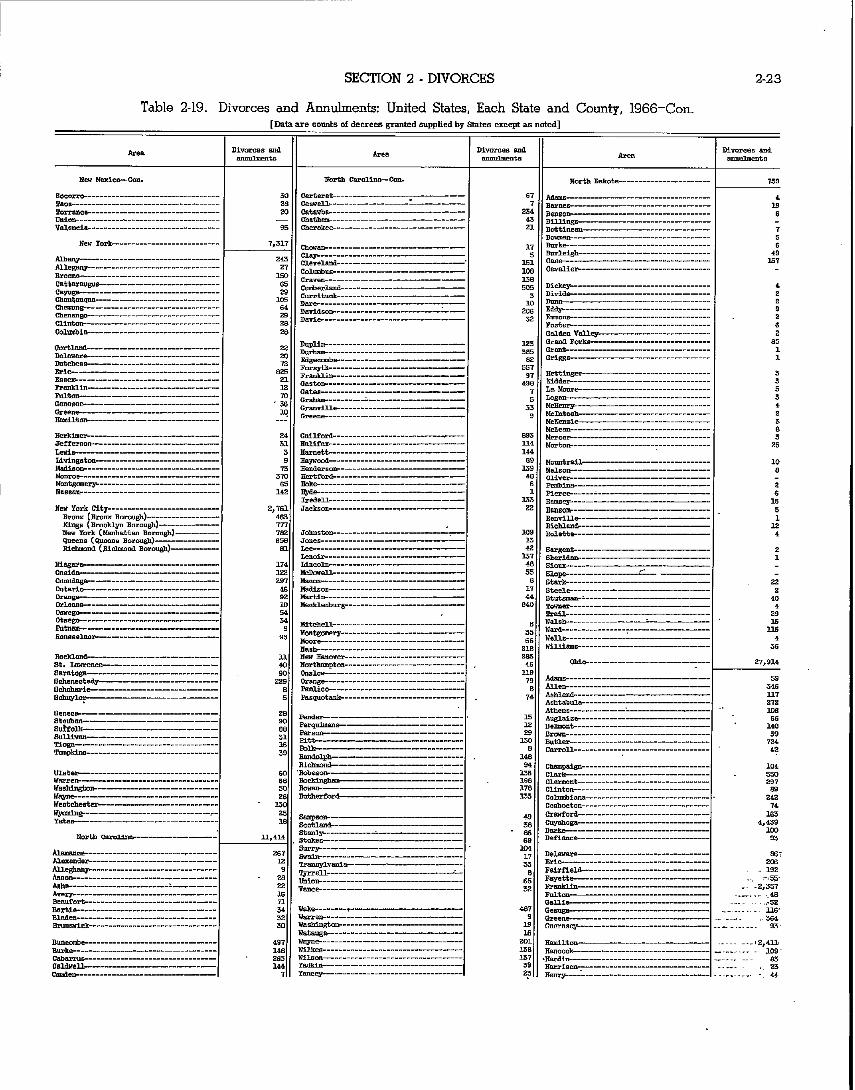
2-19. Divorces and annulments: United States, each State and county, 1966------------------- 2-16
2-2

Sampling Variability of the. Divorce Statistics
In the tables which present statistics based on data from probability samples of divorce records, small frequencies have high sampling variability, which limits their usefulness. The sampling errors are shown in table 3-8 in the Technical Appendix. It is suggested that any number smaller than those shown below be interpreted simply as “small” rather than as any more pre- cise value. The true number would very probably be within 60 percent of the figure shown in the table.
Divorce-registration area-------------
*coma--------- *lash - - ---------- Georgia _ ___-___ ___ Hawaii _ ___ ___ _ _ _ _ _ I&ho- _ _ _- ________ _ &!a ___- ---- ------ Kansas ------------ Maryland ___ ___ - _ _ _
Michigan -_--_-_--_
Missouri ___--__--_
100
100 10 50 10 15 15 15 50
100 50
Montana-------------- 15 Nebraska------------- 15 &o _____ -_ _ _________ 100 Oregon--------------- 50 Pennsylvania --------- 100 Rhode Island---------- 10 South Dakota---------- 10 Te~essee-------- 50 “,&---mmmmmm----es 15 Virginia- _ _ _ _ __ _ _ _ _ _ _ _ 50 Wiscons~ ___-_-_-__-- 15 Wyoming - _ - - - - - - - - - - - 10
2-3

SECTION 2 -_ DIVORCES 2-5
Table 2-1. Estimated Number df Divorces and Annulments and Rates, With Percent Changes From Preceding Year:
United States, i920-6.6
.__--- ____ -___ zi I~--I--:--
zo4,wo ____-__---- 165,ccc --_----__-__---_ lea.,Z41 1931-.------..--.-.---- w&w3
-2 -k 19 -2h.O 19 .-.-II 19”“-------------------- , -,“_”
i-6 SECTION 2 - DIVORCES
Table 2-2. Divorces and Annulments and &&es: United States, Each Region, Division, and State, 1961-66 [Data are eamlts ai decrees granted supplied by states,excep* as nokL Rates per 1,0(H) pplrlaam in ewsl area]
west mrth central: 1I1IulesotB--------------------------------
Mount*: ~dsnn-------------------------------
~~aaha--------------------------------------
Rlik: wa*~~~----------------------------- Oregon -__-_-_-________________ --- ____ -__ calliornis----------------------------------
f

SECTION 2 - DIVORCES
Table 2-3. Reported Annulments: United States, Each Region, Division, and State, 196-l-66
2-7
MLddle !6k&9ntle: mf York-------------------------- l+3v J~Bey------------------------------ ~-~~-a.-------------------------
Fast North cedral: mo------.---~--- -I---------
-BUS------------.------------------- nicugao-.--- ___________-------_- - ------ ~~~rnoein----.---------------------------
uest North central: )limesots~-~---~- ----I_ - ------------- ~a.------------------------------ Miss-----.------------------------- North IxllmtB----------------------- Bauth -b--------.-.-.---.-------- N~~aska-.------------.------------------
lieat Bouti central: ~-sS---------.-.--------------------- louisiaoa=--._----------------------- Mohona---------------------------------

218 SECTION 2 - DIVORCES
Table 2-4. Median Ages of Divorced Husband and Wife at Time of Decree and at Time of Marriage:
Divorce-Regiskration Area and Each Registration State, 1966 [Baaed on sample data; far freqomcies, see t&k 2-11 and Z-121
I I I I
‘Table 2-5. Percentage Distribution of Divorces and Annulments by Duration of Marriage: Divorce-Registration Area
and Each Registration State, 1966 paaedooj3ample data; for 6”2wencles, Bee table Z-15]
Table 2-6. Me&an Dwation of Marriage Prior to Divorce or Annulment: Divorce-Registration Area and Each Registration State, 1966
pasea cm sample data; tar frequencies, see table ?.-15. E.cxlians comptea ml data by single years]
d!iZZ INian rndiao
Area Area dylati0~ %yz2=
dUCP.t.iC.U =m--hEe Ama in y-
m rmrriaga in pars

DIVORCES SECTION 2
Table 2-7. Divorces and Annulments by Color of Husk
band by Color of Wife Divorce-Registration Area,
1966
Table 2-9. Estimated Number of Children Involved in Divorces and Annulmenk United States, 1953-66
[For 1980-86, estimated from frequencies baaed on sample; for OtheC years, e&i- mated from total counts]
Tot--.---.----------------- 113,562 91,126
Hi=
tic----.---.----.--------- 41,163 sop33 ~~~~...-.---.----------------- 9,818 270 Irot st~~.ted---.-------.------ 12,521 351
Table 2-10. Percentage Distribution of Divorces and Annulments by Number of Children Reported: ‘Divorce- Registration Area and Each Registration State, 1966
[Based on sample data; for frequencies, see table Z-Id. Refers to chlldres m&r 18
years of age except as noted]
Table 2-8. Estimated Number of Children Involved in Divorces and Annulments: Divorce-Registration Area and Each Registration State, 1966
[Rdern to chlld~n under 18 YSWS oi age.except +s norea. Estimated from frequuen- cb?s based on sample which are shorn m table 2-161
5
-
2.1 =
1.0
::: 1.9 2.6
2.4 2.5 1.7
2:
2.7 2.6
::4 1.5 2.1
2.6
2: 1.4 3.4 2.0
-
~~.-.-.-.-.----------- Hauaue--.--------------- Iad-----------------
south Dohoto----.-.-.-.-.- ~ermenae=----------------- Utah--------------------- vi*.--------- wiBconnin..---..------------ wvDmina------;-------------

2-10 SECTION 2 - DIVORCES
Table 2-11. Divorces and Annulments bv Aae of Husband and Wife at Time of Decree: Divorce-Registration Area
BmaABD
Itivorce-re*tratin aTea---
Alabarns--------------------- ~------------ Deaqia-------------- -i----------------------- ~aaho--.------------------
mnsBd-------..---------- ~-------------------- organ-------------------- m%nuri------ _____ -_-_-_
~~------------------- blosha-------------------- Gem.&----- ____ -------- 2lavaii---------------------- Idaho--------------------------
loun----------------------- lansss-------..-------- M%l.&9d--- ____ -__--_- _____ Igchl~---------------------- ~Ls6oupI---------------------
Neblashk------------- ob10-------------------------- Oregon------------------- pennaU~~------------------ moae Island---------------------

SECTION 2 - DIVORCES 211
Table 2-12. Divorces and Annulments by Age of Husband and Wife at Marriage: Divorde-Registration Area and Each Registration State, 1966
IBased on saxwle data. For samrrle de&m and samlrlinr mriabilitrr. see Technical Awendixl
-~--..--..----------------------- uarylana -----------_-________________I__ tahigan. ----------_ ------ _______-_ HIIIIIOuh---------------------------
Ileb~---------------------------- cQID---------.------------------ oTrgo------------------------ X+lUWl-*-- --------- --_--_-- ____ Rbcde ~--.------------------
unnko-------.----.------------
Oe0- --1-_1- - _-___-__-_____-__

2-12 SEC’MON 2 - DIVORCES
Table 2-13. Divorces and Annulments by Race of Husband and Wife: Divorce-Registration Area and Each Registration State, 1966
r~ased on sam~k data. FCW sample design and sampling variahilitg, see Technical A-b1
I
Divol.zere&btzatim are- -------------
Table 2-14. Divorces and Annulments by Number df This Marriaqe of Husband and Wife at Time of Decree: ,Divorce-
Registration Area and Each Registration State, 1966 rBased on sample data. Far sample design and sampling variabilitg, see’Technical A~~endlxl
I
SECTION 2 - DIVORCES
Table 2115. Divorces and Annulments by Duration of Marriage: Divorce-Registration Area and Each Registration State, 1966
2 ,[email protected] .L.
Table 2-X6. Divorces and Annulments by Number of Children Reported: Divorce-Registration Area and Each Registration State, 1966
L8 rears of age except 88 noted. For sample design and sampling varia!$Xy, see Te+ical App~dix] ler I i-r
mwrce~regiotration ------I-
*w __-_-__--_-_ ------- -_----- -
51flIif -_-__ - ______ --- ------------I--
m&~ ____II______- ------------
loya---------...-.----------------- Kanaaac--..-.--------------- --- ------- ---- _-_- -_---__-_

2-14 SECTION 2 - DIVORCES
Table 2-17. Divorces and Annulments by Duration of Marriage and Number of Children Reported: Divorce-Registra- tion Area and Each Registration State, 1966
Refers to chimen muleI !8 Years of age except as noted Far sample design and s:
maer 1 year-------- 1-2 pars---------- 54 palm---------- 53 par%-------- 10-14 yearm------ --- 15 years am cmer~~----.. ric5 ststea---.--------
TotaL.-----------
Under 1 yesI ---_ -_-_-___ l-2 yuvs---------------- 54 Years--~-~~~~---;-- 5-9 yes,rB------------- Ku4 years---------.--- 15 yeara aad m?%-..~---- Not stat& I---- --_--_
1
1 lz 4 2 2 2
maer I yeal-.--------
I
15 L-2 5-9 5&yeme--;- yema years--------- Yenrez-----.--- TmbL----- ad over--.----- ______
loA4yee.m I--- --_---_-_
_ mt *+a---------
p, LZyears------- _____ 1 4 2 2
* IO-l4 3-4yealn uoaer years-.------ 1 yeaL--------. ---- --- __-_ 5-9yemn- -I---- -_---
15 yewzs and ml--------- 2 ‘mtstaree -----_ --__-_
f
Emmm”rn
30 ToteL------- --__
Unaer 1 year----p-- 12 1-2 ----- Years- --__ 4 3-4 ----- ---_--_ Years- 6 5-9 years----------- 2 1O-l~ yeare----------- 4 15 and Years over--.-- _____ 2 Ilet stated ---I_ -___---

SECTION 2 - DIVORCES 2-15
Table 2-17. Divorces and Annulments by Duration of Marriage,and Number of Children Reported:. Divorce-Registra- tion Area and Each Registration State, 1966-Con.
EXODEISum)
-l-------------
m&p1 year ___-__ ---- -----
1-2 yenrs -_-_- -- ___--------
l&am. 1 yea.----------------- I-2 -~---------------------- J-4 yB~~--------------------
Table 2 -18. Divorces and Annulmentsby Month Marriage Performeck Divorce-Registration’Area and Each.Registrationz State, 1966 State, 1966
-
SECTION 2 - DIVORCES
Unit& ststesl --------I-- 499,ooo
HI
US------.----------------
---------------------------- n,256 ~~aa------------------------- BahlegL-------- ____ -_- ____
Table 2-19. Divorces and Annulments: United States, Each State and County, 1966 [Data are count8 of decrees granted supplied by States exce~i as noted1
I
159 Dr------------------------------ F--------------------------
30 ~---------------------------- 192 ~tour------------------------- I34 Garlsnd--------------------------- 146 Grant,-------------------------- u, Greene--------.-------------------
95 H~Btesb----------------------- 131 Bat s-------.------------------ 445
=aark-------------------------------- 92 =acksmr---------------------------- u JefPaamr--------------------------- 12 J~arm------------------------------ 22 abbe------------------------
l4a --~--------------.-------- 140 see----.----.------------
2,476 m-- ___----I------
,” I,i+tl,e ~~--------------------- 53 gag--------------------------
T-“~e---_-_-----_-_---------------
~81 SC&t----------
II
searq--------------------------------- 21 sebBstiQo-------------------------
7,354
--I
ca.wm~~-crm.
27 Kings- I--------------- -_- __-_____ -- ~-----------------------------------
1z ~~eh-------------------------------- l,$s angucsr ---__--_-_-_---___ - -__-_--_
39 Madera----------------------------------
z Marin--------------------------------- -~~--------------------------------
L Hi-------------------------.-.. added---------------------------------
54 ~-------------------------------- I*me-------------------------------.-
49
z Mmrt-------------.------------------ ~~~~---------------------------------
250 ~~lld~----------------------.----------.
,E orange--------------------------------- -er--------------------------------- ~-~---------------------------------
1; Rtvere~de-----------------------------
E s-~~--------------------.------- San BEnit-----------------------------
2 San Baby------------------------- +k Diet------------------------------
2: San Fraociace---------------------------
3: San Joey--------------------------.. sul J,tim Iki-------------------------- sm Gwen----------------------------
l% Gents B~~lu~------------------------ S&a clsrs--------------------------
57 snota rru~------------------------ e4 Ghar---------------------------------
Sims-----------------------------
2 Sip-------------------------- So------------------------------
ii soMmDr--------------------------------- 36L stBnis-------------------------------
suttfn---------------------------------.- ;; T=~--------------------------------
7 pinitr--------------------------------- ---------------------------------
JZ ~--------------------------- vedura--------------------------
E yoLo--------------------------.------ p”~re------------------------------------
50 3011 C-~------------------------- 7,253

SECTION 2 - DIVORCES
Table 2-19. Divorces and Annulments: United States, Each State and County, 1966-Con.
2-17
:ed]
AreP. Area
(km@n--cm.
Jaapsr--------------------------- Jet-f Dav1G--------------------------- Jeffersmr- -I-------- ------- J-6----------------------------. Jam--------------------------- ,ln”eo--- ------- Lee-- ---_--__ - -____ ~----------------------------. -ef------------------------------ -enB-----------------------~
plerf*----------- ___-______ - Pl~e----------------------------~--
38 chathap----------------------------- 5,j -~ohooebe~--------------------
930 Qatto---------------------
I/
1,,9, ~-~~~---------------------------- B Clarke----------------------------- 68 ------------------------------ 56 98 clsJrt---------------------------
II clinch--------------------------------
110 eobh---------------------------- <e coiiee---------------------------
5,004
II --~~
c&&t& _-__- -- -_---_ --- __--_------- 51 crib------------------------- 22 Crnb----------------------------
W&i-illt --------_--- - -_----__---- --_
ol**--- _____I_-_-------_-_-________
oulf-------------------------------
Bamilt--------------------------
Hardy-----------------------
~~---------------------------
Her”----------------------------
Alghlaads---------------------------
Billsborough- ----___- -- --__-----_- -_
Halmap------------------------------
Lcmb~------------------------
pnmB----------------------------
k&l- ___-_-___-____-___- ----__-.
h&&-- ________- -------_-__--. Mgga------------------------- ,imr---------------------------.--- ,asolr-------------------------
k,-p.- ----1--1------------------ --_- Libcrtr-------------------------- Madi~mr-------------------------------
Mnnntcr---.----------.---------------- MariM---------------------------------- wartin ---- -I- -_---_-- - ___-- -_------ Honmc---------------------------- lPaaaau -------------- --- -_-_-_-- ---- -goal*---------------------------- Dkse*obec-----------;---------------- oT8ngc------------------------------- Da==--------------------------------- palm Besrh----------------------------
101 l,OU
ll
&*m --------_----- - --_---------I- -in------------------------------
l39 ------------------------------ pin-------------------------- ~~--------------------------------- &tr,al$. _------_-_-_-_----__- - _---___- -_ nt. ~ohna------------------------------ et. IN,&- _---_-I__ -__- ___------__---

2-18 SECTION 2 - DIVORCES
Table 2-19. Divorces and Annulments: United States, Each State and County, 1966-Con.
-~---------------------------- ~-------------------- KMlWZl-~~- ___- ----- ________ ~~------------------------- ms perce---.------.----------- onei~---.----.-.------------------ owhee -I-------------- ---__-- -__- P~tte---------------------------- !?WV ----------- ---__-_---_-_- shoah-------------------------
~(m--.--------------------------- win Faua---.----- _____l____l_l v--.------------------------------ Waft-.---.----------------------- Y-tone Natid Pa& (pat ,-- --
rl.lindk----~---~--~--.
Adamk.------------------- - -------- --_---__-___ ------.---.-----------------
~-----------.----------- Bureau---------.----------------- ------.----------------- carrall----..----------------- CaBB-------------------------- cbampsil* ------_____ -__-- -_-_-_- ----
27,862
~gameN------.----.---------- t4mgalb _____ --_-- ----__-__-_- - _______ EOUltH.e-------- ____ - ______ Cal,% ------ ------------ ~-------------------------- ---------------.--------...
El&L- ----- --------_--- _____
Pope-- ------- ------_-__-_-_-_ mekL--------------~~-~- pun----------------------- ~------------------- I(lchland---------.--------------- Rock TsIBOa------....-..----------- St. clsll--- ---_____ - -___ --__- ______ ~----.------------------
GtephensaL ---------_-__ ----- --_-- TsleueU----------..---------- uaton-.------------------------- Y&m ------I---_ ---_--_ wabaah--------------------------
Waahi~----------------------- w--------- ______ A _____
auea---------------------- B.l%tlOlCSZW~------~--~~~~~~-~ Bento~---------.-..----------------- ~~--------..-.------------- Boone-------------------------- B---------------.----------- -~---------..------------ cask-----------.-..------------ ~-------.-----------------------
Cl@&. ------- --- __________ -_-___-___ Qid---- __--_- --_-------- ------------------------- Davlees.----------------------------- Deal-------.----------------- Decatur--------- ____ -__---- De I(alb-------------- Delasare-----.-------------- Dubma----------------------- i3BhrL-~---~--~-.~--~~-- _____
758 48
II Johnaca-- ----I----- -----_-___-_
4 Rhmr-.-.-.-.--.--.--------------- 33 ~~f~~~~-.-----------------.-----
~----.-.-----.-----..-.---------- 61 ----------------------------------- J la o---------------------------
-nee-------------------------- ;; mdiawa.-- -------------_-------
,g -~-------------------------- M?asdl---.-------- -_----_ - __-_-
z Martib---------------------------- 715 Itlami-----.----.-.----------------- 27 nsmroe--------------------------
~~game~-------.---------------- ; xorgam whoa------------------------- __-- -- -_-_--_-- - _--- -------
2 I(oble------------------------------- Ohio-----.------------------------ 4 orrmse-----------.-------------------
E ouelr----------....-------.---------------
748 Parhe--------.-.---.----------------- 740 p---------.------------------- 31 purp--------------------------------
porter----.---------------------- Pokey_----------------------------
503 Allaehi--------------------------- 23 put---------------------------- 9 ~~----_--.---------------------
25 nrp~-.---.-.--.----------------- 12 ~---.-----.-------.----------------
127 330 ,z 9% 8COtt------------------------------- Joel------------------------
89 -~-------------------------- Spencer- ------------------- - ------ Sag..--..-.-.-------------.-------.----
42 steu------.-...------------------.-- P-3 SuuivalL--- -__-_-_- ------ ----- -- 36 svltzer-----.--------------------- 4s l9ppxance--.------~-- _-----
ii: 145 ~~~~-----.--.----------------- 794 Use-----.-------.------------------- 22 vanaer~---------------------------
yunilli--.-------------------------- vigo---._----_------------------
17,zi3 ua------------------------------ - w--------------------------------
55 u-~------------------------.-----
2 :: w**------ __------------__-__ w--.------.------------------------
195 ups----..-.--.------------------ f
: vhi----------------------------- whitl~-------------------------
138

SECTIdN 2 - DIVORCES
Table 2-19. Divorces and Annulments: Unite& States, Each State and County, 1966-Con.
Area
Tnro-con.
B”C”& “lst*--------------------------.
____
M~ilo”---------------------------------- “*aska----------------------------------
loa 21 Ba*eLI---------------------------------- II llJ BadBemsn---------------------------------
12 15
II
&p,&uE _______-___-_-___-__------------ 116 Rice----.--.----------------------------- E? RFlev--------..-.------------------------
q, Russa --______-_________________________
23. 8alinp--.---...------------------~~-~-~-
2-19

Z-20 SECTION 2 - DIVORCES
Table 2-19. Divorces and Annulments: United States, Each State and County, 1966-Con.
hr~er------------------..------------- pmdletoh- ____________________--- ---- pam ____-_________-_ - -_----------------
-a-*P ___-________________ -
[Data are counts of decrees granted supplted Lv :

SECTION 2 - DIVORCES
Table 2-19. Divorces and Annulments: United States, Each State and County, 1966-Con. :ed]
Are*
Minnesota-Con.
B*tr& ____________________------------- Defog------------------------------” Big titans------------------------------- Blue Earth------------------------------ Bmm-------------------------------..
-__Iv
m -___-_-_____---_-_-_----------------- cle-.ter-------------------------~---- cook-------------------------------------
Llow&* _________________________________ I)unKlin----.-.--------------------------
&.-: __-______________-_--------------~ Reynolds---------------------------------

2-22 SECTION 2 - DIVORCES
B0~---------------------------------- shnnnon-------------------------------.- ~~~----------------------------------- ~------------------------------.--- 8tane------------------------------------ ---------.--------------------.----- Taz.ey _________________ - ___________---. z- ale-------------------------------.- vemrm--------------------------------- w-.-------------------...------------
Table 2-19. Divorces and Annulments: United States, Each State and County, 1966~Con. [Data are cmnt6 of decrees granted Bvppliea by states except as noted]
Big ---------------.-.--------------.-- Blaine---------------------------------- ~~=------------------------------ ~~-----------------------------------
~~~.--.-.-.-.-.----------------------- Pow&r RiMr--.-.--..-.-.-.------------- pavell-.----------.---------~---------- prairie-----------.----------------------
l
z II FranBlln ___________________________ -- G pmntier-------------------------------
:: -II
Ihuass----,---------------------------- m _____________ - _____ - _____________ - Garden.----.----.---------------------.
.- ~~
/I
Hoolre=-‘------------------------------- 4 .~---------------------------------- 2 JeifelSM---------------------------- 6 Jason--------------------------------
KII m =ersey_------------------------
)(iddle------------------.-....--.-.--- u ~~-------------------------------
/I~- - -s--------------.---------------------
Is oceluI-----------------------------------
SECTION 2 - DIVORCES
Table 2-19. Divorces and Annulments: United States, Each State and County, 1966-Con.
2-23
unloP----------^------.------------.- v*encia- ----------__________-------.--.
. I chsut~------------..----------.---
ch~a-----~----------------------------
Chenango--------.-.-------------.-...--
Clint--------------------------------.-
-::I Johnston---- ___________ -__- __-_-__ I ____ I

SECTION 2 - DIVORCES
Table 2-19. Divorces and Annulments: United States, Each State and County, 1966-Con.
es cuntonl--------------------------- 49 co~-~--------------------------
123 II cnndmd---------------------------
a*
:: II
~er~d-------------------------- ma--- ________________- - __________
ME DelByBrr---------------------------------
3:
II
mdc Ullrmd------------------- 26 m 8rldol--------------------------- 192 KMt.----------------------------------
“$+ Ipi& __-_------------------------- - ~~--------------------.-----

SECTION 2 - DIVORCES
Table 2-19. Divorces and Ann&nents: United States, Each State and Co&y, 1966-Con.
2-25
B0ut.h Ce.Tommam.
LWTp--.-- -_--I-------------- - ---- Jasper-.-------------------------- Kersba”--------.----------------- ~Eootcr----------------------------- Lnlm”S _-_------------ - ---________---_ - me------------------------------ L.dngton -___-_---___-_- - -----__------_ NCaomiC!S ------------------_-_________ Marlon-.---.--------------------- bosom.--.---------.------------
Nevberry--------------------------- Oconee-.-.----.-------------------- oranseburs------------------------- plckcno-.-.------.---------------- Rlehlond---.-----.------------------ Baluda---------------------------- spnrtnnburs-.----------------------- Gumter-------- _-_-_-_--_-___ -___ Unite---..------.-.------------------ u1u~IMs~=------------.
WUe.-----.-.---------------------- Ihr~~ialO-.------------------------- Butt=------------------------------- mmpbl3. I----- --_----_-- ____--_--_-_
marlea NIxI------.-.----------- -~----------------------------- cley-------------.------------------ -“stO”-------------------- Cr)reon--------------------------- FYBter------------------------ Daylsoll--------------------------------- my---.- --_- - ---_---_-__ -_--_----
icy-.-----.------------------------
mvglw _I------ ------ ___-_-_ - -____ ~--------------------- mll RLyer-.-.-.---.-.------------------
Bar&ii? __--_ - __-_-__-____--------_______ -..----------.----------------- -On----------------------------
Harains _______-_ ---_-_- -_-_______-_- Hu*~hcn-.------------------------ Hutchinoon-.-.-.---------------------

2-26 SECTION 2 - DIVORCES
Table 2-19. Divorces and Annulments: United States, Each State and County, 1966-Con.
Tesas-Cm.
woe*--------------------------------- 5:: Wise------------------------------------- 63 “Ed---------------------.--------------- 7e
Bar---------------------------------- -is.----..-.--------------------------
Hophins- _____________ --- ______ ________
Houatcn--------------------------------
.7&l- D*r.----..----------------------
Jim -------------------------------
Jim weLlb----------------------------
Jam-----------------------------
chesterTield--------------------.--------- 221 claim---------------------------------- 1z __I_
Mc~cb------~--~------~~-~-~--~-~-~
M&m*--- _--_______ - _______________
Martin---------------------------------
“a~------------------------------------

SECTION 2 - DIVORCES
Table 2-19. Divorces and Annulments: United States, Each State and County, 1966-&n.
2-27
Isle ol- Wife---------------------------- JolneO ci~---.-----.-------------------- King and &em _____ - ___________________. King Deorge----.-.---..-.-..--.-----. King H1LuIM----------------------------. Kebbi=-------------------------------.
or~ge-~-------------------------------- Page --___________________________________
Prince E&ma --_---_-__---__-____-------. RinEe oe~e---------------------------. Prince Hilli~-------------------------~
Price-.-...-.---------------------------- hine----------------------------------- 2-i Riehland--------------------------------- Roes------------------------------------ 2::

2-28 SECTION 2 - DIVORCES
Table 2-19. Divorces and Annulments: United States, Each State and County, 1966-Con, [Data are counts Of decrees granted .sioppkd by states except as noted]
I
WiSCOMin-CWh
:: “~~--------------------------- “arrpaca--------..-..---.---------- 48 “lrmebego------------------------------ 2-2 wwd--------------.-----------------

Page
Sour-es of data------------------------ .3-3 Registration areas ___________________ 3-3
Standard certificates----------------- 3-3 Nationwide counts ____________________ 3-4 Characteristics of marriages and di-
vorces ____________________________ 3-6
Sample design _____-_-___-,______________ 3-8 Obtaining the records---------------- 3-8 Sampling procedures----------------- 3-8
Estimating procedures------------------ 3-9 Area totals--------;----------------- 3-9
Page
Frequencies------------------------- 3-9 percents and rates ------ --- ------- --- 3-9 Alloc&ons- _ _ __ _ _ _ _ _ _ -- - -_ - _ -_ _- _ _ __ 3-9 Children involved in divorces--------- 3-9
Sampling errors------------------------ 3-10
Nonsampling errors ___---------_--____ - 3-10 Incomplete reporting----------------- 3-10 Other sourcesoferror--------------- 3-11
Symbols used in tables------------------ 3-11
Figure
3-l. Standard Record ofMarriage------------------------------------------------------ 3-4
3-Z. Standard Record of Divorce or Annulment------------------------ ---- - -------------- 3-5
3-3. Areas participating in the marriage-registration area and thosemaintaining central files: United States,1966-------------------------------------------------------------- 3-6
3-4. Areas participating in the divorce-registration area and those maintaining central files: United States, 1966------------------------------------~------------------------- 3-7
Table
3-l. Sources of marriage and divorce data: United States, 1867-1966----------------------- 3-12
3-2. Years central files of marriage and divorce records were established and years admitted to the marriage- and divorce-registration areas: 1966---------:-------------------- 3-13
3-3. Selected items of statistical information on marriage records of marriage-registration States: 1966-------------------------------------------------------------------- 3-14
3-4. Selected items of statistical information on divorce or annulment records of divorce- registration States: 1966-------------------------------------------------------- 3-14
3-5. Marriage sample-sampling rates and sample size: Marriage-registr&ion area and each registration State, 1966--------------------------------------------------------- 3-15
3-1

Table Page
3-6. Marriage sample-sampling error of estimated frequency expressed as percentage of area total: Marriage-registration area and each registration State, 1966-------------- 3-15
3-7. Divorce sample-sampling rates and sample size: Divorce-registration area and each registration State, 1966---------------------------------------------------------- 3-16
3-8. Divorce sample-sampling error of estimated frequency expressed as percentage of area total: Divorce-registration area and each registration State, 1966-------------------- 3-16
3-9. Percent of marriages not stated for specified characteristics: Marriage-registration area ad each registrationState;1966------------------------------------------------- 3-17
3-10. Percent of divorces and annulments not stated for specified characteristics: Divorce- registration area and each registration State, 1966--------------------------------- 3-18
3-11. Population of marriage- and divorce-registration areas, 1957-66---------------------- 3-18
3-12. Estimates of the total resident population of the United States: 1920-66----------------- 3-18
3-13. Estimates of the total resident population of the United States, each region, division, and State: July 1, 1966-------------------------------------------------------------- 3-19
3-14. Estimates of the unmarried resident population 14 years of age and over, by age, marital status, and sex: Marriage-registration area, July 1, 1966--------------------------- 3-19
3-2

SECTION 3. TECHNICAL APPENDIX
SOURCES OF DATA
Marriage and divorce statistics currently are based on Information from two sources: (1) complete counts of events obtained from all States and (2) samples of marriage and divorce certificates obtained from States meeting certain reporting criteria.
Complete counts of marriages-and divorces are pro- vided annually by State and local officials by county; mar- riages are also reported by month of occurrence. From these counts, totals are derived and rates computed for publication for each State, geographic division, and region, the United States, andthe marriage-registration area (MRA). Totals but not rates are published for the divorce-regis- tration area (DRA).
Tbe sample records are selectedfrommicrofilmcopies of the original certificates received from the registration offices of States and areas comprising the MRA and the DRA. The statistical information ontheserecords, including data on the characteristics of marriages and divorces and the persons involved in them, are edited, classified, placed on punchcards, transferred to tape for computer processing, and tabulated in the National Center for Health Statistics (NCHS) .
Marriage and divorce statistics for the United States and for the registration areas are limited to events occur- ring during the year and registered within the specified area. Tabulations for States and other areas are by place of occurrence. Events occurring to nonresidents are in- cluded, marriages or’ divorces of members of the Armed Forces or other U.S. nationals that occur outside the United States are excluded. Us%ed Sfates refers to the 50 States and the District of Columbia. Alaska has been included in the U.S. tabulations since 1959 and Hawaii since 1960. Be- cause of economy measures data reported for Puerto Rico and the Virgin Islands for 1966 were not processed and do not appear in this volume as they have in reports for past years.
Sources of marriage and divorce data since 1867 are shown in table 3-1; a description of these sources can be found in Section 7, Volume III, ‘yital Statistics of the United States, 1960.
Registration areas
Registration areas for the collection of marriage and divorce statistics were established in 1957 and 1958, re- spectively. Similar in concept to the registration areas de- veloped earlier to promote national natality and mortality
statistics, they included States with adequate programs for collecting marriage and divorce statistics. Criteria for participation in the registration areas are
1. A central file of marriage or divorce records in the State office.
2. A statistical report form conforming closely in content to the Standard Record of Marriage (figure 3-l) or Standard Record of Divorce or Annulment (figure 3-2) issuedby the Public Health Service.
3. Regular reporting to the State office by all local areas in which marriages or divorces are recorded.
4. Agreement on tests for completeness and accuracy of marriage or divorce registration to be carried out in cooperation with NCHS.
When established the MRA included 28 States and, in addition, allofNewYorkexceptthecityof New York, Alaska, Hawaii, Puerto Rico, and the Virgin Islands. The DRA in- cluded 14 States, Alaska, Hawaii, and the Virgin Islands. Table 3-2 shows when States and independent areas estab- lished central files and when they began participating in the MRA and DRA.
In 1966, as in 1965. 38 States, theDistrict of Columbia, Puerto Rico, and the Virgin Islands constituted the MRA (figure 3-3) and 22 States andtheVirginIslands made up the DRA (figure 3-4). Two independent registration areas, New Orleans and the city of New York, were part of the MRA in 1966. New Orleans and the rest of the State of Louisiana have participated in the MRA since it was established. New York State was a charter member, but the city of New York did not participate in the MRA until 1965. In 1966 neither the two cities nor the remainder of the States of Louisiana and New York was participating in the DRA. In the statistical tabulations ma&age-registration area refers only to the 38 States (including the two cities with independent regis- tration) and the District of Columbia; divorce-registration area refers to the 22 States.
Marriages in the MRA accounted for 76 percent of all marriages in the United States in 1966 and divorces in the DRA for 35 percent of all divorces.
Standard certificates
The Standard Record of Marriage and the Standard Record of Divorce or Annulment, issued by the Public Health Service, serve as the principal means of attaining
3-3

3-4 SECTION 3 - TECHNICAL APPENDIX
FIGURE 3-l
uniformity in coritent of documents used to collect infor- mation on marriages and divorces in the United States. These model reporting forms, prepared in close col- laboration with the Public Health Conference on Records and Statistics, were first recommended to the States in 1954 for adoption January 1, 1955, and in 1966 were still in use without revision.
Each State and independent registration area determines the form and content of its vital records. Consequently the records vary in certain details. Although modified in each State as required by particular needs or by special pro- visions of the State vital statistics law, the marriage and divorce records df most States in the MRA and DRA con- form closely to the standard records.
Table 3-3 lists the items appearing on the Standard Record of Marriag: and shows which Stares had the items
on their forms in 1966. Table 3-4 shows the same infor- mation for the Standard Record of Divorce or Annulment.
Nationw’ide .count,s
In 1966 the total counts of marriages werefurnished from central files of marriage records for the 44 States maintaining them and for the District of Columbia. Counts for the five boroughs of the city of New York were supplied by the New York city clerk. In the areas without central files the counts were obtained from surveys conducted by registration officials. State officials reported for Arizona, Oklahoma, Washington, andfor somecountiesinNewMexico. County officials in Colorado, Nevada, and in a few New Mexico counties reported totals directly to NCHS on a monthly basis. Because of incomplete reporting for New

SECTION 3 - TECHNICAL APPENDIX 3-5
FIGURE 3-2 r
Mexico from both sources, data for that State were esti- mated.
The number of marriage licenses issued rather than the number of marriages performed was reported for a few areas-Colorado, Kentucky, Nevada, Washington, and some counties in Arizona. Marriages performed were reported for the remaining counties. in Arizona and for the other 45 States. The number of marriage licenses issued is usually 1 or 2 percent greater than the number of marriages per- formed. (See page 2-1, Section 2, Volume I. Vital Statistics of the United States, 1959.1 Georgia,-Massachusetts, and Michigan reported marriages performed by county where license was issued.
Total counts of divorces and annulments werefurnished from central files of the 40 States maintaining them and from the District of Columbia. (Although Kentucky and Louisiana
maintain-central files, counts for a few counties of Kentucky and some parishes’ of Louisiana were obtained by NCHS directly from local officials.) For States without central files of divorce records (Arizona, Colorado, Indiana, Minnesota, Nevada, New Mexico, Oklahoma, Texas, Wash- ington, and West Virginia) State officials conducted special surveys to obtain county totals.
Totals for .a few counties could not be obtained from either State or local officials. One county each in Arkansas, Georgia, and Missouri did not report marriages; only in- complete counts for a few counties were obtained from New Mexico. Divorces and annulments were not reported for one county or more in the following States: Arkansas (Z), Colo- rado (l), Georgia (4). Hawaii (l), Kentucky (l), Louisiana (34 parishes), Michigan (2), Montana (2), New Mexico (3). North Dakota (5). South Carolina (2). South Dakota (a), and

3-6 SECTION 3 - TECHNICAL APPENDIX
FlWRE 3-3
AREAS PARTICIPATING IN THE MARRIAGE-REGISTRATION AREA AND THOSE
MAINTAINING CENTRAL FILES: UNITED STATES,. 1966
Utah (2). The national total of marriages includes estimates for all counties in New Mexico, and the national total of di- vorces and annulments includes estimates for the three counties of New Mexico and the 34 parishes of Louisiana that did not report. Estimates of county divorce totals for Indiana were made hy State officials. Estimates prepared by NCHS assume that the rate in nonreporting areas of the State was the same as that for reporting areas.
Characteristics of marriages and divorces
Statistical information on characteristics of marriages and divorces is provided by the States participating in the registration areas. Items that are adequately reported are processed from the sample records of each State.
For marriages in 1966 these items include place (State) of marriage, month and day of marriage, and the following items relating to characteristics of bride and groom: place
(State) of residence, date of birth or age, race, number of this marriage, and marital status prior to this marriage.
For divorces the items include place (State) of divorce, month of divorce, number of children, month and year of marriage (from which duration of marriage is obtained), and the following items relating to husband and wife: date of birth or age, race, and number of this marriage.
Certain items previously coded and tabulated were dropped from the 1966 processing as a result of program reduction. For marriages the deleted items were type of ceremony and State of birth of bride and groom. For divorces State of residence of husband and wife, State of marriage, to whom decree was granted, legal grounds for decree, and identity of plaintiff were deleted.
Most of the items tabulated for marriages in 1966 were well reported by nearly allthe States in the MRA. The mar- riage forms of all participating States contained anitem for either age at marriage or date of birth or both items. The

SECTION 3 - TECHNICAL APPENDIX
AREAS PARTICIPATING IN THE DIYORCE-REGISTRATION AREA AND THOSE
MAINTAINING CENTRAL FILES: UNITED STATES, 1966
race or color item was on the records of all States except California, Michigan, NewYork, andohio. Theitemappeared on the Illinois form but was optional and was completed on less than one-half of the records. Forms for four States (Idaho, Kansas, Maryland, and Oregon) did not ask for the number of this marriage but did includeanitem on previous marital status. Forms for two States (Ohio and Michigan) requested information about the number of previous mar- riages of each person but not about themarital status of the previously married. Although not tabulated, the county or minor civil division directly below the county level where the marriage was performed was reported by all but four of the States in the MRA (California, Florida, Kansas, and Maryland).
With the addition of NewYorkandMichiganto the States dropping the race or colpr item from their marriage records, race or color was stated for less than two-thirds of the
marriages performed in the MRA during 1966. The proportion of marriages for which race or color was not stated in- creased from 22.3 percent in 1965 to 35.8 percent in 1966.
The six States that did not ask for both “previous marital status” and “number of times previously married” show a proportion of records with the missing item not stated equal to or slightly greater than the proportion of remarriages for that State rather than the 100 percent not stated to be expected. This comes about because for first marriages either of these two items can be determined from the other item. That is, if the individual is designated as single (marital status), the number of times previously married can be classified as “0,” and, similarly, if the number of times previously married is stated as “0.” the individual can be classified as single (marital status). Con- sequently when either item is missing, it has to be classified as not reportable only for the remarriages.

3-8 SECTION 3 - TECHNICAL APPENDIX
Of the items tabulated for divorces in 1966. date and place (State) where the decree was granted, number of children involved, date of marriage, and date of birth or age at time of decree were on the forms of all DRA States. All DRA States except Ohio included the raceitem, and only Nebraska did not have number of this marriage. However, several of these items were very poorly reported for at least half of the States. Date of birth (or age at divorce), age at marriage, and number of this marriage were entered on less than half of the records from several States and on only a very small proportion of the records fcom Alabama, Michigan, South Dakota, and Wyoming. Race alsowaspoorly
‘reported. Stated on less than half of therecords for several States, the item was reported on only about 10 percent of the Michigan records and 27 percent of the Wyoming records.
Tables 3-3 and -4 and 3-9 and -10 show which of se- lected items appear on the records of the registration States and how well they are reported by each State.
SAMPLE DESIGN
Obtaining the records
Each year the States participating in the MRA and the DRA prepare microfilm copies of their records which are purchased by NCHS. Further processing steps, including sample selection, code punching. verification, andtabulation, are carried out by NCHS.
For marriages the records refer to all marriagesper- formed in 1966 within the 38 MRA States and the District of Columbia. For divorces the records refer to all decrees of absolute divorce and annulment that were granted during 1966 within the 22 DRA States.
Interlocutory divorce decrees for all States which grant them except Utah are included among the records for the year in which they were granted. Inmost cases, interlocutory divorces become final automatically after the lapse of a certain period of time. Thus those granted late in 1965 did not become final until 1966, and those granted during the latter part of 1966 will not become final until sometime in 1967. It is possible that some interlocutory decrees never become final because of death or reconciliation, but it is believed that the number of such cases is very small. In Utah the divorce record is filed with the State in the year the interlocutory decree becomes final.
Sampling procedures
‘Ihe marriage sample was designed to yield estimates of State totals as well as frequency distributions. These estimates were made for the MRA and for each State in the registration area. A sampling rate was designated for each MRA State so that the selected sample for it would consist of at least 2,500 records. Fivedifferentsamplingrates were used: all records, l/Z, l/5, l/10, and l/20. The overall ratio for the MRA in 1966 was l/8.
SanQling procedures for the divorce sample p’arallel those for tbe marriage sample. A samplingrate was selected
so that the sample for each DRA Statewould contain at least 1,000 records. Four different sampling rates were used: all records, l/Z, l/5. and l/10. Overall, about l/4 of the records were selected for the DRA sample in 1966.
Although each State’s records were sampled independ- ently, each group of States with the same sampling rate was treated as a stratum for computing sampling errors. ~sti- mated sampling errors for the MRA and theDRA States are likely to be somewhat larger thanthosethatmight have been computed using each State as a stratum.
The sampling rates, numbers of events, and sample cases by State for 1966 are shown intables 3-5 (marriages) and 3-7 (divorces).
Sampling of marriage and divorce records for States in the registration areas was initiated in 1960. For earlier years data on characteristics had been compiled from pre- designed tables submitted by the States. The 1966 sample is an extension of the sampling procedures used each year since 1960. However, there have been several major modf- fications since that year. .
1. In 1963 tbe size of both the marriage and divorce samples was increased greatly over that of prior years: for mar- riages it was almost tripled and for divorces about doubled. Using substantially the same sample design, the expansion was accomplished by increasing the sample selection rates and the minimum sample size for each State. In 1964 the marriage sample was again increased by raising the minimum sample size for six States. The divorce sampIe was also enlargedbyincreasingthesam- pling rates for Ohio and Missouri. The higher sampling rates significantly reduced sampling errors.
2. Beginning with 1964 copies of all marriage records (except for samples selected and reported for New York and the District of Columbia) and of all divorce records from the registration areas have been inspected and the sample selected in NCHS. In prior years the sample had been selected in the State offices. This change in pro- cedure resulted in more uniform control over sampling procedures and specifications and in more detailed in- formation about the type of nonsampling errors described in a later section of this appendix.
3. In 1960 the sampling program was nationwide: it included States not in the MRA and the DRA as well as those that were. Since 1960 only records of States in the MRA and DRA have been sampled. Thus some of the national and regional data available for 1960 are not available for later years.
4. Additional States have been admitted to the registration areas since 1960. In 1961 Indiana, Massachusetts, and the District of Columbia were admitted to the MRA and Michigan and Missouri to the DRA. Ohio and Rhode Island were added to the DRA in 1962 and 1963, respectively. Illinois and North Carolina were admitted to the MRA in 1964, and West Virginia andthecityof New York were added in 1965. No States entered either the MRA or the DRA in 1966.
SECTION 3 - TECHNICAL APPENDIX
ESTIMATING PROCEDURES
Area totals
The figures obtained from complete counts of events furnished by the State and local offices differ slightly from the estimated totals based on sample data. When possible, major differences between the sample totals and the in- dependent counts for each reporting State are reconciled before the sample data are weighted and tabulated.
For marriages in 1966 the complete count and the sample estimate differed by less than 2 percent for all States in the MRA except Utah, where the total basedonthe sample count was 8 percent above the independent count. This difference could not be satisfactorily explained and no adjustment was made.
Similarly for all States inthe DRA except Utah the com- plete count of divorces and the sample estimate differed by less than 2 percent. The sample for Utah was 26 percent below the expected number of records. For this State the missing records appear as “not stated” in the tabulation of divorces by detailed characteristics.
Frequencies
Procedures for estimating frequency distributions for various characteristics were similar for the marriage and divorce samples. Frequencies were estimated in two steps.
1. Each sample case was assigned a weight which was the reciprocal of the sampling ratio used to select the case. If a marriage record was selected from a State with a sampling ratio of l/10, that record.was assigneda weight of 10; whereas if 100 percent of the records were proc- essed from a State, each record was assigneda weight of 1.
2. Tabulated counts consisted of summing the weights of the records. Thus each frequency distribution such as age at marriage of first-married brides is a sum of the weighted sample cases included.
The weights for all sample records are identical within each State. However, as shown in tables 3-5 and 3-7, the weights for marriage records vary from 1 to 20 and those for divorce records from 1 to 10 among the registration States. Therefore any two approximately equal subtotals may have different sampling errors, varying with the pro- portion of cases from each stratumincludedintbe estimate.
Percents and rates
Percents shown in the tables in Sections 1 and 2 were computed from data excluding numbers of not stated cases. Rates appearing in these tables were based on population estimates developed by the U.S. Bureau of the Census (tables 3-11 through 3-14). The population estimates refer to July 1, 1966, and include Armed Forces stationed in the United States but exclude the Armed Forces abroad.
A’lloca+ions
Because States in the DRA vary radically in the extent to which items are reported on the divorce records, no allocations were made prior to tabulation of the divorce data. On the marriage records, values were allocated for’ages of brides and grooms and date of marriage. These items have been reported with 99 percent or more completeness since 1960.
The allocation procedures used were the same as in previous years’and were as follows:
1. When the age of only one partner was reported, the age of the other was allocated as follows:
Allocated age of groom = 1.14 (age of bride) - 0.35
Allocated age of bride = 0.88 (age, of groom) + 0.31’
2. If tbe ages of both partners were not reported and neither partner was widowed, ages allocated to each were those of the last preceding couple with neither partner widowed.
3.. If the ages of both partners were not given and one or both partners were widowed, ages allocated to each were those of the last preceding couple with both partners widowed.
4. If month of marriage was not given, it was allocated sequentially from January through December.
5. If day of marriage was not reported, it was allocated sequentially from 1 through 28.
Children involved in divorces
Procedures for estimating the number of children re- ported in divorce suits presented a special problem. The number of children was estimated for each registration State, the DRA, and the United States. In order to obtain a State total, the category “children not stated” was first distributed to reflect the distribution of divorces bynumber of children reported. Then the estimatednumber of divorces with a givennumber of children was multiplied by the number of children per divorce (that is, the number of divorces in- volving one child was multiplied by 1, the number involving two children was multiplied by 2, and so forth). The sum of the products is the estimated number of children of di- vorced parents in a given registration State. The sum of State estimates for participating States is the estimate for the DRA .
To obtain national estimates for 1965 and 1966, the average number of children per decree was computed for the 16 States that have asatisfactorydegreeof completeness of reporting children (Alaska, Hawaii, Idaho, Iowa, Kansas, Michigan, Missouri, Montana, Nebraska, Ohio, Oregon, South Dakota, Tennessee, Virginia, Wisconsin, and Wyoming) and the national divorce total was multiplied by this average. This method was also used to revise figures for the yesrs

3-10 SECTION 3 - TECHNICAL APPENDIX
1961 through 1964that had been estimated by using a different method. Hence data for these years shown in table 2-9 (Section 2) differ from figures appearing in Volume III of Vital Statistics of the United States for years prior to 1965.
SAMPLING ERRORS
Each estimate based on a sampie has a sampling error ( m ) except statistics for States where all records were used. Since all cases were selected with known probabilities, the sampling error of each estimate can becomputed. The sam- pling errors shown in tables 3-6 and 3-8 are the amounts which, when added to and subtracted from the estimated frequency or percent, give the interval within which the actual quantity being estimated would lie in approximately two out of three samples of equal size. For example, if the sample estimate of the number of wives under 20 years of age at the time of divorce in 1966is 15,000, and if the sam- pling error for this estimate is 320, the probability is about Z/3 that this sample estimate is plus or minus 320 of the true total and about 95/100 that this estimate is plus or minus two sampling errors (640) of the true total.
To make comparisons of sampling errors between registration Srate.s with widely varying totals of marriages or divorces, the sampling errors shown for frequencies are expressed as percents of State or registration area totals. The sampling error for an estimated percent based on tie total number of events can be computed by dividing the sam- pling error shown for the frequency by the total number of events reported for the area. As an example of the procedure, suppose the number of nonwhite marriages in Alabamato be 8,390, or 20 percent of the total for the State. The sampling error shown in table 3-6forthisfrequencyis 245. By adding and subtracting 245 from 8,390, we obtain theinterval 8,145 to 8,635; the chances are about 68 out of 100 that the actual number of nonwhite marriages is in this interval. In order to obtain the sampling error for 20 percent itself, we divide 245 by the State total, 41,730, with a resulting sampling error of 0.6 percent. Thus the chances are about 68 out of 100 that the actual percent of nonwhite marriages in Alabama falls between 19.4 and 20.6.
The standard error of a proportion which is based on a subgroup in a State may be represented by the following formula
where: Py is the proportion the denominator is of the total marriages of the Stare; P, is the proportion the numerator is of the State total; Sit is the standard error of the de- nominator; S,* is the standard error of the numerator; and N is the total number of marriages for the State. Use of this equation can best be described by an example. Suppose for the State of Alabama that 25 percent of the nonwhite brides were aged 15-19 years and we want to approximate the standard error of this proportion. Suppose also that the estimated number of nonwhite marriages for the entireState
was 8,390 and that 2,100 of allbrides were aged 15-19 years. All nonwhite marriages. represent 20 percent (P,), and 2,100 is 5 percent (p,) of the 41,730 (N) marriages in Alabama during 1966. From table 3-6 we find that for Alabama the standard error of 8,390 is 245 (S;) and of 2,100 is 133(sJ Substituting these values into the for- mula we bbtain
s.2s, ,d (.2of (13312 - (.d ( 245)‘= o.o14
(.20)2 (41,730)
Therefore the chances are about 68 in lOOthat the true pro- portion is between .236 and .264, or 23.6 and 26.4 percent.
To determine if two proportions are significantly dif- ferent, we divide the difference by the square root of the sum of the squares of their standard errors. If the quotient of this division is greater than 2, the probability that the difference between the two figures is due to chance is less than 1 in 20. To illustrate, suppose we wish to compare the proportion of nonwhite marriages in the 15-19 age group for Alabama and Louisiana. Assume thattheproportions were 0.25 with standard error .014 for Alabama and 0.30 with standard error .016 for Louisiana. Divisionofthedifference by the square root of the sum of the squares of the standard errors gives us
(.30 -.25)
This value is greater than 2, and so the difference between the two proportions can be assumed to be significant.
NONSAMPLING ERRORS
In addition to the sampling errors described above, there are several other sources of variation, most of which are little affected by the size or design of the sample. For ex- ample, items may- be. missing from reporting forms and therefore not reportable; items that do appear on a form may be vague and ambiguous; responses may be incorrect, unreadable, or missing; data may be submitted on outdated record forms; records may be erroneously included in the microfilm files sent to NCHS, or the editing or coding in- structions may be inadequate to cover all cases.
For most of the data available from 1960 onward, the completeness and year-to-year consistency are evidence of the basic reliability and coverage of the marriage- and divorce-registration systems. Futhermore, several of the States are currently working to improve their registration practices in order to enter the registrationareas. Some are achieving higher levels of completeness and adequacy of reporting than those currently in the MRA or the DRA. This is particularly true in the case of divorces.
Incomplete reporting
Nonresponse errors in marriage and divorce data arise from two sources: (1) An item may not be included on the reporting form (not reportable), or (2) although the item

may be on the form, there may be no response or the re- sponse may be illegible (not completed). Regarding the second source of nonresponse, somereportingforms include items that are badly worded and do not elicit responses sufficiently precise to be classified. Sometimes whena State revises its form to include additional items, copies of the old form are used by registration offices until a supply of the new version is received. The items not included on the old forms are tabulated as “not completed.”
Data presented in tables 3-9 and 3-10 show the pro- portions of not stated cases for specified characteristics of marriages and divorces for 1966. The proportions “not reportable” and “not completed” are shown separately for both the MRA and the DRA. Footnotes to entries under the characteristics identify the specific reporting areas for which au item was not reportable. Not completedcases were estimated hy subtracting the not reportable responses from all nonresponses. Not completed cases weretypically blank; but illegible responses and cases of records not received were also included in this category as well as some re- sponses that were inappropriate. For example, numbers were written on some sample records insteadof the specific previous marital status of the bride and groom. Checks of problems as they arose yielded evidence of only scattered instances of such responses. A major proportion of the not stated cases for marriages were due to the absence of items on some of the reporting forms. In contrast, the majority of not stated items on records of divorce and annulment arose from lack of response to some of the items requested on the reporting forms.
For divorces, items of personal information have typi- cally been less complete than legal items and information about the marriage. One possible explanation of the incom- pleteness of personal items is that in several States the local court official responsible for filing the form is not empowered to require’ completion of the reporting form but can only secure information from transcripts of court pro- ceedings on the case.
Other 8ource6 of error
Inconsistent responses.-Inconsistency between entries for related items on the certificates occurs occasionally for hoth marriages and divorces. When age and date of birth are both reported, ‘they do not always agree. Previous marital status is sometimes not consistent with number of times married or number of this marriage. These differences are arbitrarily reconciled before tabulation.
SECTION 3 - TECHNICAL APPENDIX 3-11
Ambzwzcs wording of items.-Some of the items are worded so that they do not yield information easily classified in standardized categories. Some briefly worded items ac- tually require additional questions on the part of the local recorder in order to obtain the detailed information sought. This type of error occurs most frequently in connection with items requesting geographic place names (residence, place of marriage, and place of birth) and those requesting data about previcus marfiages.
&%rofiZm errors.-Errors in the arrangement of the records recei;eci on microfilm in NCHS sometimes occur when numbers on the records are out of sequence, missing, or duplicated or when records that are not part of the uni- verse being sampled are erroneously included in the file. A standardized order of records such as the one used for birth and deatb records has not yet been developed for microfilming the marriage and divorce records. In one area, permanent State files of marriage records are arranged by the date licenses are issued rather than by a number assigned to licenses actually used. Thus marriages occurring in any. one year may have been included in files for earlier years. Special arrangements to locate and microfihntheserecords are made by NCHS each year.
Also, any records of marriages occurring in earlier or later years interspersed with records for the current data year are eliminated.
Processing .Z?JWWS.-All coding is verified; taped data are edited for impossible codes and for inconsistencies. Instances of impossible codes and inconsistencies in infor- mation about previous marriages are rechecked to the records. This editing and rechecking indicated only negli- gible coding errors in the 1966 data.
SYMBOLS USED IN TABLES
Data not avail&,le----- __ _ _ _ _-__ _ __ __ __ ____ __ _ _ _ _ _ _ _
Category not applicable---------------- ______ -__- ...
Quantity zero----- ____ -_-___-___- __________ - __-_ _
Quantity more than 0 but less than O-OS------------ 0.0
Figure does not meet standards of reliability or precision-------------------------------------- +

3-12 SECTION 3 - TECHNICAL APPENDIX
Table 3-1. Sources of Marriage and Divorce Data: United States, 1867-1966

SECTION .3 - TECHNICAL APPENDIX 3-13
Table 32. Years Central Files of Marriage and Divorce Records Were Established and Years Admitted to the
Junbama _-,---_-- -- -_-_-_- -I-
Illaaka----.----------------
~mn--~l----- 1----1
Mango--------------------
chl5gqnl**-.--- --I-------- Jx,l!JIna.J ___-___- -_---_--_--
oonne=ticllt..-----------------
alavarr _----- -- -_-_-_-_ ----
District m Collna~ -------- ---- Plorids----.-..----------------- Dsa-.-.--.-----------.-----
II
~~~~sr&.-.---------------------- -Aerraak----.-----.--------------- Ifew BBmpsbire _______-l_---l------- llew aroey---------------------
BW -clh---------.----.------ Be” Ycwk (excl. lr.Y.C.)------------
me” York..qlty ----I--------- North c- _Il__--_______--i gorth Dahotk-----.-.-.-.---------
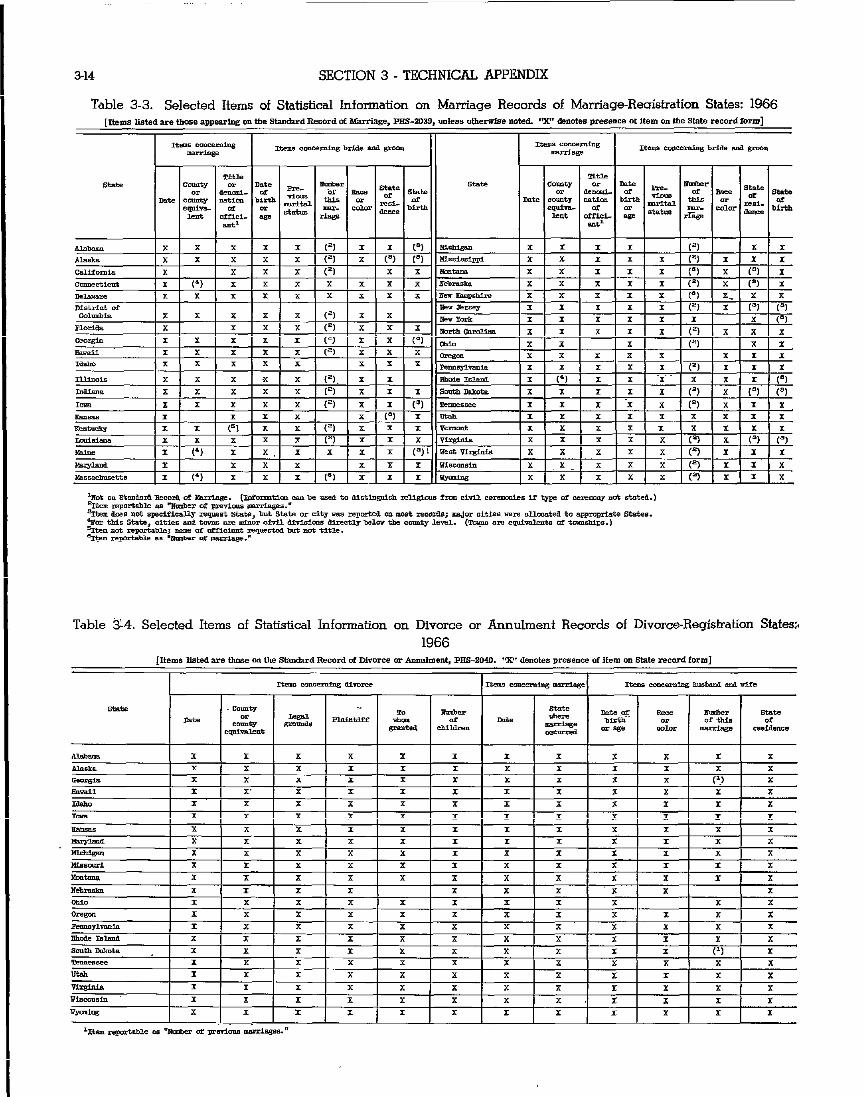
3-14 SECTION 3 - TECHNICAL APPENDIX
Table 3-3. Selected Items of Statistical Information on Marriage Records of Marriage-Reaistration States: 1966
x x x x x x x x
SEE
x x x x (9 x x x x x Y
x x x x x x x
IEEE
x x x x x x x x x x x x
Table 34. Selected Items of Statistical Information on Divorce or Annulment Records of Divorce-Registration States:+ 1966

SECTION 3. - TECHNICAL APPENDIX 3-15.
I Table 3-5. Marriage Sample.4ampling Rates and Sample Size: Marriage-Registration Area and Each Registration’ State,
-as--------------------------------- loui~onoz----------------------------
Table 3-6. Marriage Sample-Sampling Error of Estimated Frequentiy Expressed as Percentage of Area Total: Marriage-Registration Area and Each Registration State, 1966
[Figures for Alaska, mlavme, Vermo”t, and vrptling have no sampling errors since aa reccds were tabulated] II
Are0 1
~ag*regiatrat.tcm area--------------
84 15
. . .
/
32 11
..*
102 16
. . . x.1
F6 . . .
I52 24
. . . 166
L . . .
59 9
. . .
:: IO
. . . -
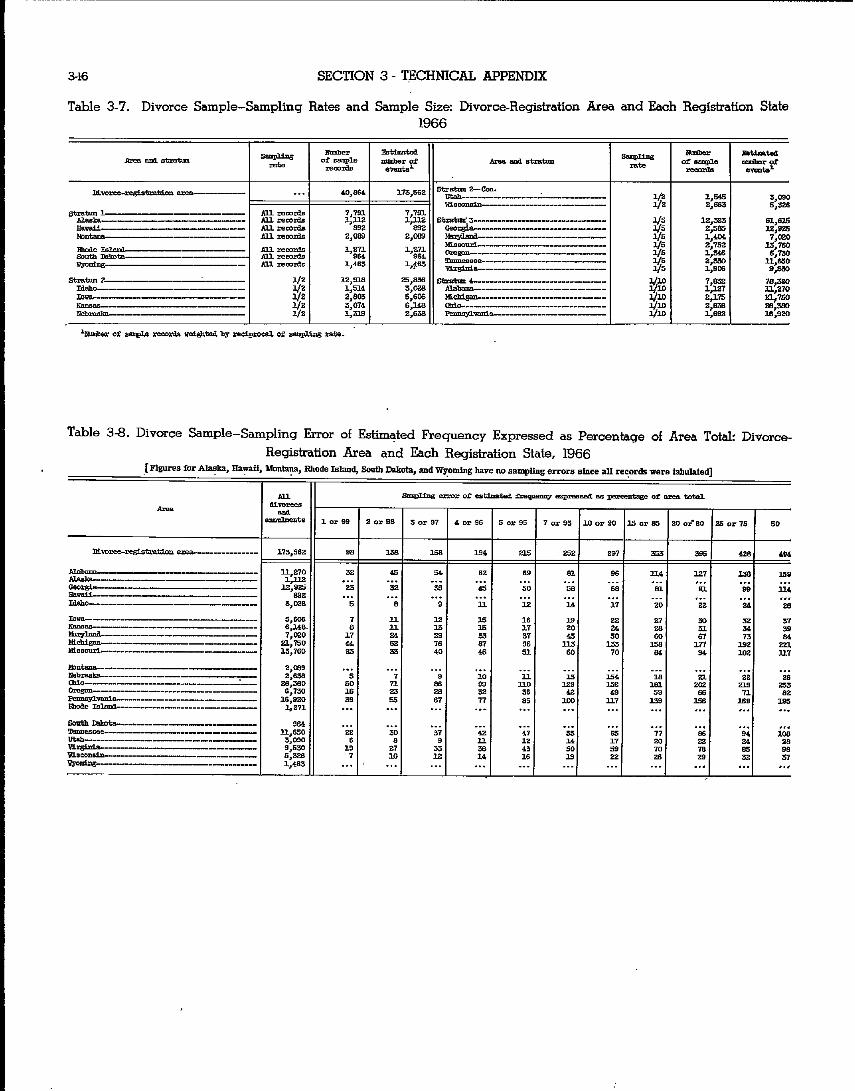
3-16 SECTION 3 - TECHNICAL APPENDIX
Table 3-7. Divorce Sample-Sampling Rates and Sample Size: Divorce-Registration Area and Each Registration State
&rmm 1-------------------- ~--------------------------
Isx,ie Ble.wi- __-__ ------_-- south IaD----- ____ ------
7,791 I,% S~~.3--------------------------
/I ~a------------------------
2,089 -iEd-- _____________ ---- -------
E tzzz 7,191 v- Au records 892
Au ~co* z,oes
- % Ebb ‘>g ‘,~~ us------.-------------- olsgcm--- ----- -- ---- ------- All rem* 1,485 =,+
II Tarc,eB88& ------------ ----- l%a&,ra&----------------
Table 3-8. Divorce Sample-Sampling Error of Estimqted Frequency Expressed as Percentage of Area Total: Divorce- Registration Area and Each Registration State, 1966
[Figures far A’“k% -+f, kfonta?a, Rhode IAIvJ, South lkktda. and Wycmfn~ have 00 sampling errors since alI recmds IV’BTB tabnhted]
IuBbama---------------------- Alasba-- ------ ---_-___---- _____ ~--.-.----------------- Haaail-----.-.-------------------- Ida0 I------ -----_--_-- -__-__
Ioyb --I------ -------_---_- Kena- ---II---- -------_-----_-
mlUU& 1------1-1--- - ___-_--_- ---
MLcbigan--------- --___________I__
~lesolul--------------------------------

SECTION 3 - TECHNICAL APPENDIX
Table 3-9. Percent of Marriages Not Stated for Specified Characteristics: Marriage-Registration Area and l&h Registration Siate,. 1966
[Baaed 6” sample data]
~aabo-.-l-.l--.--.----------------.I----------------------
UumiS -------_-_-_-_-___--____________ --_- ___-_-- ------
0.0 0.0 - _ - - - -

3-18 SECTION 3 - TECHNICAL APPENDIX
Table 3-10. P¢ of Divorces and Annulments Not Stated for Specified Chqacteristics: Divorce-Registration Area
and.Each Registration State, 1966
lr
m~-~~st.ration aren=---~--------
mt repartsble------- ----- - ----------- *ot completed--------------------------
Alab---.-.--------.-----------------------
Gee----------------------------------------- ~-.-------------------------------------------- T-------------------------------------------- loua----------------------------------------------- -116----------;---------------------------- ~~------------.------------------------------ HLchlgan------------------------------------ I(Ls~--------------------------------------
-. ~~------------------------------------ lreh.aska _____- ---_---_---- ___-____- ----_ ~a.--------------~---- _-__ --_-- c%egon-~- ____ -_-_---_-- ___-__ --------- Etmlsyhmni&---.------ -__--__ --------- Rlode T6~--------------------------------------- savtll na!aka--------~--.--~~~-..---~~--~ ~s6ee------------------------------------- ut*------------------------------------- y1----------------------------------- WlSmfllil~---------------------------------- l+m%ng--- _--_ -__-- _______--______- -------~----
Table 3-11. Population of Marriage- .and Divorce- Registration Areas, 1957-66
[Populath enumerated as of April 1 for 1960 and estimated as of July 1 for a” other gears. Fiies include Armed Forces stationed in the area. The MRA was es-
1, 1958,
Table 3-12. Estimates of the Total Resident Population of the United States: 1920-66
[Poptitton enumerated k9 of April1 for ISdO, 1950, and 1980 and estinmrted asof Ju,y 1 for all other wars. Firmrea include Armed Forces stationed In the United 6tates]
, _- 194571,m lsm-.-~~~-~-~.~.~- 188,658,003 .lsEJ--.----.---.- l&5,@3o,aoo
II
El%------ ____ -_-- 185,051,cm I%,-----.--.--.- 179,323,176 1936-....-..-.........-
‘11tl,655,wo 1925---------------- 146,093,000 Is%--------------- 145,446,ox 19p---------- 140,054,cco 1922----.--~..-- 132,+81,m l%L---------- 13z,B85,m x920-------..--.... =-v%~

SECTION 3 - TECHNICAL APPENDIX 3-19,
Table 3-13. E&mates of the Total Resident Population of the United States, Each Region, Division, and State: July 1, 1966
h
mdtca *tntca--------------------------------
R&on0 nra ditioiono: ~rtheaat----.---------------------------------------
Rev Englae- _____I_____________- - __-_--- - --_---_____-_ cmd2.e A-~~-----------------------------------
K.&h 08ntnrl--------------------------------------------- mt No* ~~.--------------------------------- weat No* cantral----------------------------------------
8oU~--------.------.-------------------------------- Bauth AtL8nticI-.-------.------------------------ pant Bouth cent----------------------------------- weot south ceht----.-----.----------------------
w~t---------------------------------------------------- libuntain---------------------------------------------- DISC--------------------------------------
Neu F%?&ul& Ilaine------------------------------------------- New ~ablre------.-------------~------------------ yerrmnt-.------------------------------------ ~saEhusette-------------------------------------------- mule TV----------------.--------------------- oonneEtl~-------------------------------------
l&l&ale Atla0tt.x NW Yore.--.------.--------------------------- new JBrBBy-----------.------------------------------------ Fauny~~---~-------~-- _--- -----_----_
EBet “pl central: ~~-------------------------------------- -anOr--.----------------------------------- -ia-------------------------------------- ML~gan------------------------------------ bum--------------------------------------
“es* Norm central: ~a-----.----.------------------------------- -------------------------------------------- MkQUd- _____-_ - _-___- - -___ -------- -_______ -___- mr!Jl Dslmta-----.-.----------------------.------------ enIda rn!mh--- ______ - ___-____- ---_-- ---_- - _---_--- - ~~-~--------------------------------------------- -aa-----------------------------------------------
Bouth A-e: -nUe--------..-..------------------------------------ haFylaod- --_---_--__-__-_ - ______ - _______ -- __________-_- mstrht Of rmumbis-.------------~----------------- W~~------------------------------------------------ west Vista-------------------------------------- Kol.bh camlln& -_-_ --.A ---__________ ---- ____ -__- ______ Gouti ------------------------------i--------------- ~~0.-.-.---------------------------------------------- ~~~-.---..----------------.--
Fasti south cell- ~~“~-.-.--..--..-------------------------------------- Tenncasee--------------------.-...1.-.-.------------------ wb----.--.---.-------------------------------------- MLs&stppi --_-_-_ ---__---__----_-------- ---___--_--
west e.mtb - Rae-------------------------------------- ~~d-----.--------------------;-------------------- ~-.------------------------------------------- fpuas------------------------;---------------------------
MXLU- -ana.-.-.----------------------------~--------------- ~---------------------------------------------------- wyLmim&- -_-----__ --- --_- - ---- ----_-- ---- ----_-- ~~--------------------------------------------------- Aeu -m--------..---------------------------------- ddaOn&-----------..-------------------------------- vtah------------------------------------------------- N=----------------------------~---------------------
peCif9.C “a~~--.---------------~------------------------- wn _-__ -_- -_-_ ---------- ____-___ - -__--_ -- ----- - onli,fomia _______-_ -- _-__ -_------ ---__- - ____ - ___-_____ Alnalm.---.---.-.-------------------------------------- Hnuoil-----------------------------------------------------
801uu?: U.S. - ox- the -, - mlNhtin rcm%*s,
Table g-14. Estimates of the Unmarried Resident Pop- ulation 14 Years of Age and Over. by Age, Marital Status, and Sex: Marriage-Registration Area, July, 1, 1966

t “. 9. GolTRNMENT PRINTING OFFICE : 1979 0 - 379-193