vision 2025 challenges and opportunities 2025 – challenges and opportunities ... portugal oporto...
TRANSCRIPT
Polyester Chain Scenario in New Normal Environment
YJ Kim
PCI Xylenes & Polyesters Asia Sdn Bhd
VISION 2025 – CHALLENGES AND
OPPORTUNITIES 5TH INDIANOIL PETROCHEMICAL CONCLAVE 4th February 2016 MUMBAI INDIA

Polyester Chain Scenario in New Normal Environment
Demand drivers of polyester fibre and PET
PTA Landscape Changes-how much longer for those under financial duress?
What is supporting Asian PX margins?
MEG Oversupply-who is at risk?

0
20
40
60
80
100
120
2013 2014 2015 2016 2017 2018
Mil
lio
n m
t
Wool Cotton Cellulosic F+S Acrylic
Polyester Staple Polyester Filament Nylon F+S Polypropylene F+S
Global Fibre Mill Consumption

World Polyester Production 2014-2020
Global polyester polymer
production increased 4.9% in
2015.
Since the 2008/09 recession the
global polyester market has grown
at a healthy 6.3% annual rate.
Mid-term growth forecast is
constrained by slowing economy
globally and markets mature.
For 2016-2017 period, the growth
rates for staple is only 3.1% per
year while filament is expected at
5.5%, and PET at5.5% per annum. 71%
72%
73%
74%
75%
76%
77%
78%
79%
80%
0
20
40
60
80
100
2014 2016 2018 2020
Mill
ion T
onnes
Staple Filament
PET Resin Film
Other Resins Chip
Utilisation (RHS)

Polyester Production Growth 2016-18
5.2%
18.4%
5.3%
10.9%
4.5% 4.9%
0%
2%
4%
6%
8%
10%
12%
North America South America Total Europe Middle East/Africa
Asia/Far East World

2014 2015 2016 2017 2018
Staple 15,565 16,044 16,532 16,957 17,507
Filament 30,054 31,823 33,750 35,402 36,583
Total Fibre 45,619 47,867 50,282 52,359 54,089
PET Resin 19,386 20,182 21,031 22,258 23,614
Film 3,526 3,825 4,122 4,392 4,578
Other Resins 2,001 2,060 2,181 2,383 2,465
Polymer Production 65,465 68,606 72,119 75,706 79,155
Polymer Capacity 85,573 89,203 92,629 95,660 100,152
Polymer Utilisation Rate 74.2% 74.6% 75.5% 76.6% 76.6%
Polymer Production Growth 3.5% 4.9% 5.1% 5.0% 4.7%
PSF 1.7% 2.9% 3.2% 3.1% 3.7%
PFY 4.5% 5.9% 6.0% 4.9% 4.4%
PET 5.3% 3.1% 5.2% 5.8% 6.1%
World Polyester Forecast (thousand tonnes) 2014-2018

In 2016, China is forecast to
produce 40 million tonnes of
polyester polymer, 43 million
tonnes including recyclate.
From 2017 onwards, growth is
expected to fall below 5% level,
moderating towards 4.4% to 2020.
Old assets are weeded out starting
significantly from 2014, continue
into 2016.
The pains of this capacity
reorganisation should end by
2018. 76%
77%
78%
79%
80%
81%
82%
83%
0
10
20
30
40
50
60
2014 2016 2018 2020
Mill
ion
To
nn
es
Staple Filament
PET Resin Film
Other Resins Chip
Utilisation (RHS)
China Polyester Production 2014-2020

2014 2015 2016 2017 2018
Staple 9,568 9,836 10,072 10,354 10,623
Filament 21,631 23,245 24,811 26,175 27,407
Total Fibre 31,199 33,081 34,883 36,529 38,030
PET Resin 5,981 5,990 5,998 6,209 6,520
Film 1,133 1,313 1,513 1,653 1,760
Other Resins 258 284 320 437 479
Polymer Production 34,991 37,000 38,968 40,852 42,567
Polymer Capacity 44,244 46,222 48,548 50,749 53,082
Polymer Utilisation Rate 78.5% 79.4% 79.6% 79.6% 79.3%
Polymer Production Growth 5.1% 5.7% 5.3% 4.6% 4.1%
PSF 0.7% 2.8% 2.4% 2.8% 2.6%
PFY 5.6% 7.5% 6.7% 5.5% 4.7%
PET 12.2% 0.2% 0.1% 3.5% 5.0%
China Polyester Forecast (thousand tonnes) 2014-2018

Rebalancing Stage : Reduce production growth rate to 3.4%
from 9.2% in 12th Plan through cancellation of new projects,
lowering capacity utilisation.
Optimisation Stage : Scrap old capacities. Encourage large
scale companies to fully integrate with refineries → Hengyi,
Hengli, Rongsheng, Shenhong, Sanfangxiang.
Development Stage : Appropriately recover the growth pattern
in a self-sufficient market environment.
China 13th five year plan 2016-2020 (synthetic fibres tasks)

India textile mill consumption
0
2,000
4,000
6,000
8,000
10,000
12,000
14,000 2000
2001
2002
2003
2004
2005
2006
2007
2008
2009
2010
20
11
2012
2013
2014
2015
2016
2017
2018
'00
0 to
nn
es
Wool
Acrylic
Polypropylene
Nylon staple
Nylon carpet filament
Nylon industrial + other fil
Nylon textile filament
Cellulosic
Polyester staple
Polyester other filament
Polyester industrial filament
Polyester textile filament
Cotton

India Polyester Forecast (Thousand Tonnes)
2014 2015 2016 2017 2018
Staple 1,310 1,400 1,590 1,720 1,720
Filament 3,055 3,365 3,667 3,970 3,970
Total Fibre 4,365 4,765 5,257 5,690 5,690
PET Resin 968 982 1,250 1,362 1,362
Film 410 480 540 600 600
Other Resins 10 10 10 11 11
Polymer Production 5,493 5,963 6,757 7,327 7,327
Polymer Capacity 7,735 8,488 8,887 8,912 8,912
Polymer Utilisation Rate 71% 70% 76% 82% 82%
Polymer Production Growth 7.8% 7.1% 6.0% 6.8% 6.5%
PSF 6.5% 5.0% 4.7% 4.5% 4.3%
PFY 5.7% 3.5% 5.8% 6.0% 6.2%
PET 22.5% 18.1% 4.7% 8.9% 8.0%

Global polyester demand growth forecast in 2016-2017 is lowered
to 5%. Industrial and technical applications contribute to growth
although in small volume.
When China becomes fully integrated from refinery to apparel by
2020, “China Inside” scenario is fulfilled.
Various trade agreements to benefit from preferential duty is vital
to sustainable growth. Textile shift to Vietnam in progress.
‘Make in India’ policy is set to attract investments both from local
and foreign fabric and apparel producers, pending the speed of
infrastructure construction.
Polyester Outlook

2014 2015 2016 2017 2018 2019 2020
60%
62%
64%
66%
68%
70%
72%
74%
76%
78%
80%
30
40
50
60
70
80
90
100
Mill
ion
To
nn
es
Total Production Capacity Utilisation Rate
World PTA Supply Demand
Capacity flat to 2017; older
plants phased out.
Global PTA utilisation rates in
2016 begin to recover to 76%.
Capacity will get built where
there is a reason e.g., JBF
where captive consumption
makes a plant worthwhile.
Middle East market becomes
increasingly competitive as India
starts to see over capacity.

2014 2015 2016 2017 2018 2019 2020
60%
62%
64%
66%
68%
70%
72%
74%
76%
78%
80%
30
35
40
45
50
55
60
65
70
75
80
Mill
ion
To
nn
es
Total Production Capacity Utilisation Rate
Capacity rationalisation accelerates pace to balance 17 mmt surplus.
Asia PTA Supply Demand
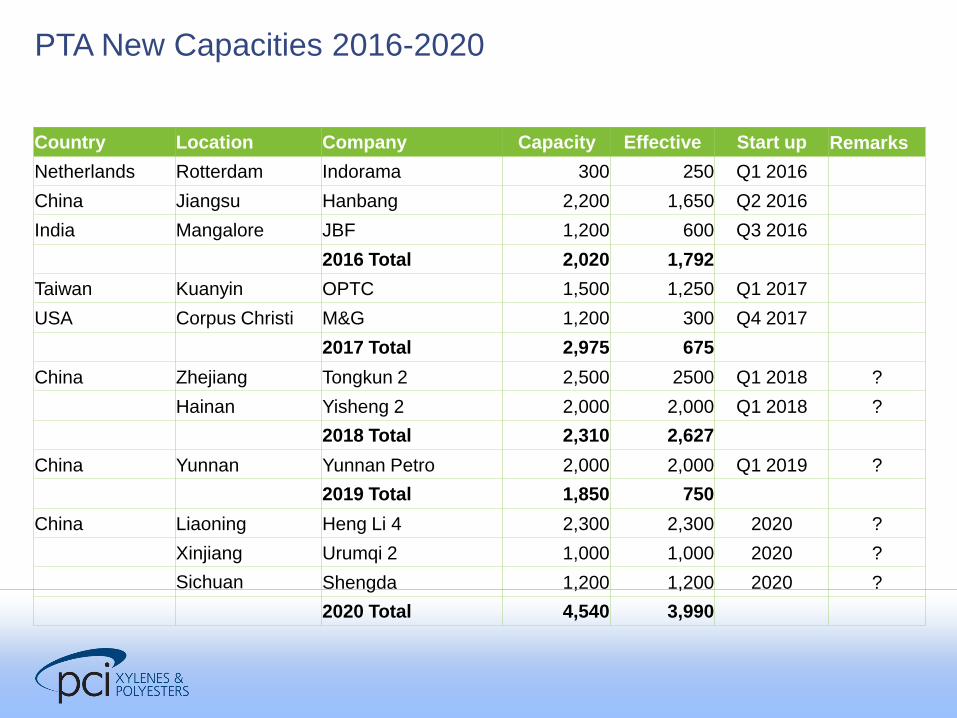
Country Location Company Capacity Effective Start up Remarks
Netherlands Rotterdam Indorama 300 250 Q1 2016
China Jiangsu Hanbang 2,200 1,650 Q2 2016
India Mangalore JBF 1,200 600 Q3 2016
2016 Total 2,020 1,792
Taiwan Kuanyin OPTC 1,500 1,250 Q1 2017
USA Corpus Christi M&G 1,200 300 Q4 2017
2017 Total 2,975 675
China Zhejiang Tongkun 2 2,500 2500 Q1 2018 ?
Hainan Yisheng 2 2,000 2,000 Q1 2018 ?
2018 Total 2,310 2,627
China Yunnan Yunnan Petro 2,000 2,000 Q1 2019 ?
2019 Total 1,850 750
China Liaoning Heng Li 4 2,300 2,300 2020 ?
Xinjiang Urumqi 2 1,000 1,000 2020 ?
Sichuan Shengda 1,200 1,200 2020 ?
2020 Total 4,540 3,990
PTA New Capacities 2016-2020

(000 tons) 2014 2015 2016
Capacity (a) 58,755 67,262 68,363
Production 46,212 48,838 51,052
Nameplate Utilisation 78.7% 72.6% 74.7%
Idled Capacity Est.(b) 8,700 14,200 15,990
Net Capacity (a)-(b) 50,055 53,062 52,373
Consumption 44,374 46,665 49,011
Forecast Utilisation 88.7% 87.9% 93.6%
◄ 16 million tonnes idled in Asia in 2016 are subjected to rationalisation.
◄ Majority of idled assets are highly likely to stay down.
◄ Dragon Aromatic explosion will keep Xianglu PTA down for extended period.
◄ Many capacity additions already shelved for 2017 onward.
Asia PTA Effective Utilisation

2014 2015 2016 2017 2018 2019 2020
50%
55%
60%
65%
70%
75%
80%
85%
90%
95%
100%
2
3
4
5
6
7
8
9
Mill
ion
To
nn
es
Total Production Total Consumption Capacity Utilisation Rate
New investments in 2015 will push out 1 million tonnes of imports, hitting
Korea hard and likely to catalyse restructuring in NE Asia
India PTA Supply Demand

1. Consumption Growth : New business context will be based
on moderate recovery. Will India lead the next growth after
China?
2. Margin : Competitive environment sets narrow margin for
next 2 years before reinvestment return is justified.
3. Trade : Asian producers look to Vietnam, USA, Europe as
China and India switch to net exporters.
4. Consolidation : Many distressed assets will emerge as losses
accumulate.
PTA Changing Landscape 2016-17: Production Discipline

2014 2015 2016 2017 2018 2019 2020
60%
65%
70%
75%
80%
85%
90%
30
35
40
45
50
55
60
65
Mill
ion
To
nn
es
Total Production Capacity Utilisation Rate
World Paraxylene Supply Demand

76%
78%
80%
82%
84%
86%
88%
90%
-2.0
-1.0
0.0
1.0
2.0
3.0
4.0
5.0
6.0
2014 2015 2016 2017 2018 2019 2020
Mill
ion
To
nn
es
North America South America
Europe Middle East/Africa
Asia/Far East Utilisation (RHS)
11 new paraxylene units
started 2013-2014, increasing
competitive supply.
North America and European
asset closure and idling in
progress.
Periods of tightness with
plentiful nameplate capacity?
Accumulated outages in Asia
totalling some 4 to 4.5 million
tonnes, either due to economics
or incidents.
Rate of new unit additions
now likely to keep headline
utilisation ‘lower for longer’.
China is the ‘wild card’.
World Paraxylene Capacity Growth 2014-2020
MT
% 2.5
4.7
4.5
10.8 3.5
7.2 3.3
5.9

Paraxylene Capacity Expansion 2016 - 2018
Country Location Company Capacity Start-up
Portugal Oporto GALP Energia -135 -135
India Jamnagar Reliance Industries 4 2,250 1,312
China Hainan, Yangpu Sinopec Hainan Refining 2 800 67
2016 Total 2,915 1,244
Saudi Arabia Rabigh PetroRabigh 1,340 1,000
Pakistan Mouza Kund, Balochistan Byco Oil Pakistan Ltd 92 92
2017 Total 1,432 1,092
Vietnam Nghi Son Nghi Son Petrochemical 600 450
China Fujian, Quanzhou Sinochem 750 400
Saudi Arabia Jizan Saudi Aramco 1,000 250
2018 Total 2,250 1,000
LATEST: Pertamina just announced $5.5bn refinery expansion at Cilacap +22kbpd to 370kbpd – incl
hydrocracker, additional PX and propylene

2014 2015 2016 2017 2018 2019 2020
60%
65%
70%
75%
80%
85%
90%
0
5
10
15
20
25
30
Mill
ion
To
nn
es
Total Production Capacity Consumption Utilisation Rate
China Paraxylene Supply Demand

China Paraxylene Net Trade
-16,000
-14,000
-12,000
-10,000
-8,000
-6,000
-4,000
-2,000
0
2012 2013 2014 2015 2016 2017 2018 2019 2020
KT
Net Trade

2014 2015 2016 2017 2018 2019 2020
74%
76%
78%
80%
82%
84%
86%
88%
90%
92%
0
1
2
3
4
5
6
7
Mill
ion
To
nn
es
Total Production Capacity Consumption Utilisation Rate
India Paraxylene Supply Demand

Indian Subcontinent Paraxylene Net Trade
(400)
(300)
(200)
(100)
-
100
200
300
400
2012 2013 2014 2015 2016 2017 2018 2019 2020
KT
Net Trade

Middle East Paraxylene Supply Demand
60%
62%
64%
66%
68%
70%
72%
74%
76%
78%
80%
-
1,000
2,000
3,000
4,000
5,000
6,000
7,000
8,000
9,000
2012 2013 2014 2015 2016 2017 2018 2019 2020
Nam
ep
late
Uti
lisat
ion
KT
Capacity Consumption Production Utilisation Rate

Middle East Paraxylene Net Trade
-
500
1,000
1,500
2,000
2,500
3,000
3,500
4,000
4,500
5,000
2012 2013 2014 2015 2016 2017 2018 2019 2020
KT
Net Trade

Outlook for PX & Aromatics Projects
Middle East and Asian projects in refining and consequently in
aromatics have been delayed/postponed/cancelled, e.g.
Saudi Aramco – Ras Tanura
Qatar Petroleum – Ras Laffan
GS Caltex 4 - Korea
Feedstock availability slowing down rate of project development
Investments increasingly complex and costly
Few, if any new condensate-based units being planned
Still several active projects that are yet to be
finalised/announced for 2020 or later. (Vietnam, Indonesia, SE
Asia, Middle East) – possibly Japan ??

Paraxylene Summary
China remains the focus of consumption growth in the medium term
and is struggling to meet domestic demand, with growing deficit of 10
million tons+
Invisibility of new China PX projects a major concern for market
planning
2015 production cuts kept spreads higher than forecast
Planned capacity under construction likely to keep PX market highly
competitive and well-supplied until 2018/2019
Current outages may keep physical market well balanced for most of
2016
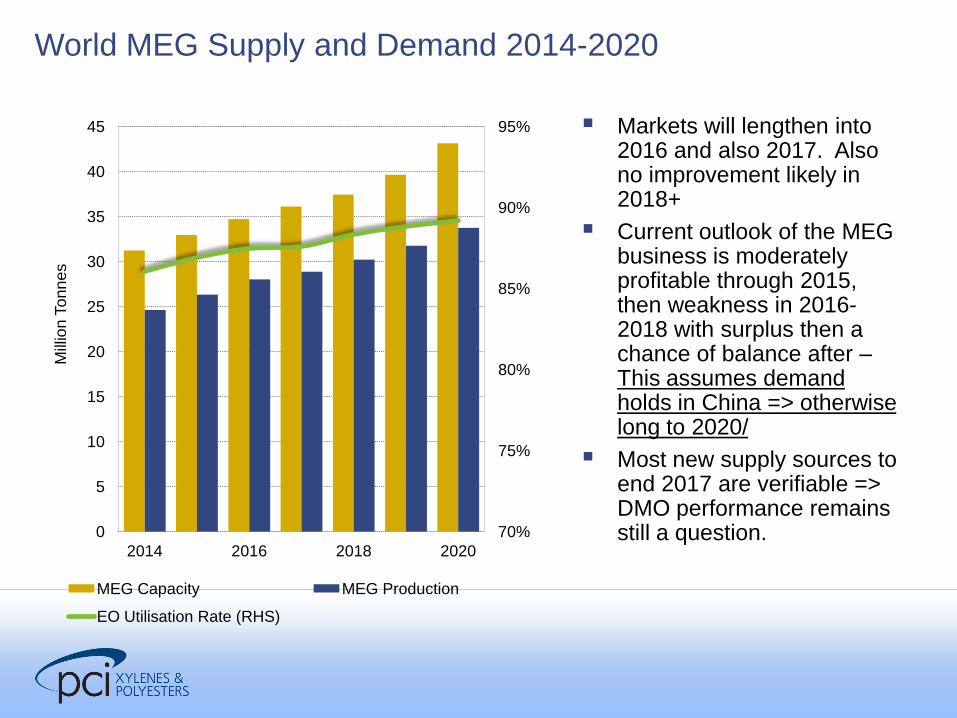
World MEG Supply and Demand 2014-2020
Markets will lengthen into 2016 and also 2017. Also no improvement likely in 2018+
Current outlook of the MEG business is moderately profitable through 2015, then weakness in 2016-2018 with surplus then a chance of balance after – This assumes demand holds in China => otherwise long to 2020/
Most new supply sources to end 2017 are verifiable => DMO performance remains still a question.
70%
75%
80%
85%
90%
95%
0
5
10
15
20
25
30
35
40
45
2014 2016 2018 2020
Mill
ion
To
nn
es
MEG Capacity MEG Production
EO Utilisation Rate (RHS)

DMO MEG Production
0%
5%
10%
15%
20%
25%
30%
35%
40%
45%
0
500
1,000
1,500
2,000
2,500
3,000
3,500
4,000
4,500
2011 2013 2015 2017 2019
Op
era
tin
g R
ate
Th
ou
sa
nd
To
nn
es
Capacity Production Rate (RHS)

Global MEG Balances 2012-2020
2015 tighter through summer, but with new capacity a Q4 inventory increase expected.
2016 supply increases adding to surplus with high cost producers coming under pressure sourcing to China.
2017 some consolidation of supply but still long.
2018 possible start of tighter market due to delayed expansions- but unlikely due to demand downside.
2018 Asia ethylene pressure from US PE exports.
2019+ more MEG plants due on line in USA etc.
-400
-200
0
200
400
600
800
2012 2014 2016 2018 2020
Th
ou
sa
nd
To
nn
es

MEG: Supply is more volatile than demand
DMO remains uncertain – both capacity and technical.
Low oil = low naphtha = lower ethylene cost and lower MEG
prices. For new projects => tough margin projections for the
low cost producers where these are far less than before. The
record capex costs remain.
Many China MEG projects expected DMO MEG and CMTO
MEG to have an advantage versus naphtha. This is not the
case now but maybe later? Is $100 oil coming back?
Will China be more focused on viable investments with tighter
credit controls.