visaka industries ltd. - hdfc securities
TRANSCRIPT

Visaka Industries Ltd.
1
Lorem ipsum dolor sit amet, consectetuer adipiscing elit, sed diam nonummy nibh euismod tincidunt ut laoreet dolore magna aliquam erat volutpat. Ut wisi enim ad minim veniam, quis nostrud exerci tation ullamcorper suscipit lobortis nisl ut aliquip ex ea commodo consequat. Duis autem vel eum iriure dolor in hendrerit in vulputate velit esse molestie consequat, vel illum dolore eu feugiat nulla
Lorem ipsum dolor sit amet, consectetuer adipiscing elit, sed diam nonummy nibh
euismod tincidunt ut laoreet dolore magna aliquam erat volutpat. Ut wisi enim ad minim veniam,
quis nostrud exerci tation ullamcorper suscipit lobortis nisl ut aliquip ex ea commodo consequat. Duis autem vel eum iriure dolor in hendrerit in vulputate velit esse molestie consequat,
vel illum dolore eu feugiat nulla facilisis at vero eros et accumsan et iusto odio dignissim qui blandit praesent luptatum zzril delenit augue duis dolore te feugait nulla facilisi. et iusto odio dignissim qui blandit praesent luptatum zzril delenit augue duis dolore te feugait nulla facilisLorem ipsum dolor sit amet,
Initiating Coverage
Visaka Industries Ltd.
15-March-2021
Visaka Industries Ltd.
2
Industry LTP Recommendation Base Case Fair Value Bull Case Fair Value Time Horizon
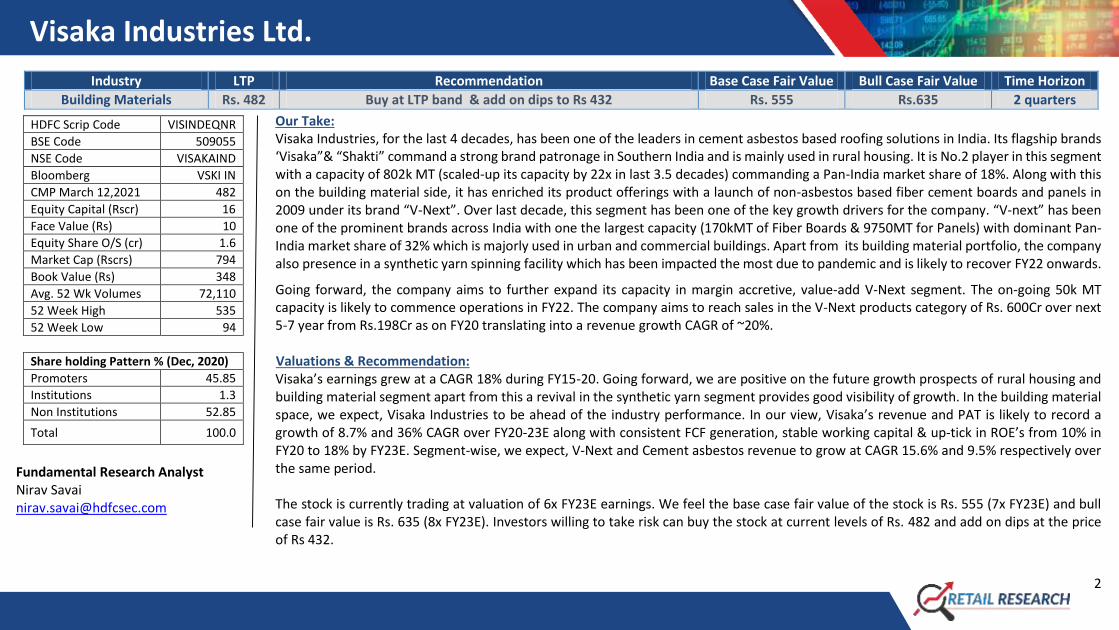
Building Materials Rs. 482 Buy at LTP band & add on dips to Rs 432 Rs. 555 Rs.635 2 quarters
Our Take: Visaka Industries, for the last 4 decades, has been one of the leaders in cement asbestos based roofing solutions in India. Its flagship brands ‘Visaka”& “Shakti” command a strong brand patronage in Southern India and is mainly used in rural housing. It is No.2 player in this segment with a capacity of 802k MT (scaled-up its capacity by 22x in last 3.5 decades) commanding a Pan-India market share of 18%. Along with this on the building material side, it has enriched its product offerings with a launch of non-asbestos based fiber cement boards and panels in 2009 under its brand “V-Next”. Over last decade, this segment has been one of the key growth drivers for the company. “V-next” has been one of the prominent brands across India with one the largest capacity (170kMT of Fiber Boards & 9750MT for Panels) with dominant Pan-India market share of 32% which is majorly used in urban and commercial buildings. Apart from its building material portfolio, the company also presence in a synthetic yarn spinning facility which has been impacted the most due to pandemic and is likely to recover FY22 onwards.
Going forward, the company aims to further expand its capacity in margin accretive, value-add V-Next segment. The on-going 50k MT capacity is likely to commence operations in FY22. The company aims to reach sales in the V-Next products category of Rs. 600Cr over next 5-7 year from Rs.198Cr as on FY20 translating into a revenue growth CAGR of ~20%. Valuations & Recommendation: Visaka’s earnings grew at a CAGR 18% during FY15-20. Going forward, we are positive on the future growth prospects of rural housing and building material segment apart from this a revival in the synthetic yarn segment provides good visibility of growth. In the building material space, we expect, Visaka Industries to be ahead of the industry performance. In our view, Visaka’s revenue and PAT is likely to record a growth of 8.7% and 36% CAGR over FY20-23E along with consistent FCF generation, stable working capital & up-tick in ROE’s from 10% in FY20 to 18% by FY23E. Segment-wise, we expect, V-Next and Cement asbestos revenue to grow at CAGR 15.6% and 9.5% respectively over the same period. The stock is currently trading at valuation of 6x FY23E earnings. We feel the base case fair value of the stock is Rs. 555 (7x FY23E) and bull case fair value is Rs. 635 (8x FY23E). Investors willing to take risk can buy the stock at current levels of Rs. 482 and add on dips at the price of Rs 432.
HDFC Scrip Code VISINDEQNR
BSE Code 509055
NSE Code VISAKAIND
Bloomberg VSKI IN
CMP March 12,2021 482
Equity Capital (Rscr) 16
Face Value (Rs) 10
Equity Share O/S (cr) 1.6
Market Cap (Rscrs) 794
Book Value (Rs) 348
Avg. 52 Wk Volumes 72,110
52 Week High 535
52 Week Low 94
Share holding Pattern % (Dec, 2020)
Promoters 45.85
Institutions 1.3
Non Institutions 52.85
Total 100.0
Fundamental Research Analyst Nirav Savai [email protected]
Visaka Industries Ltd.
3
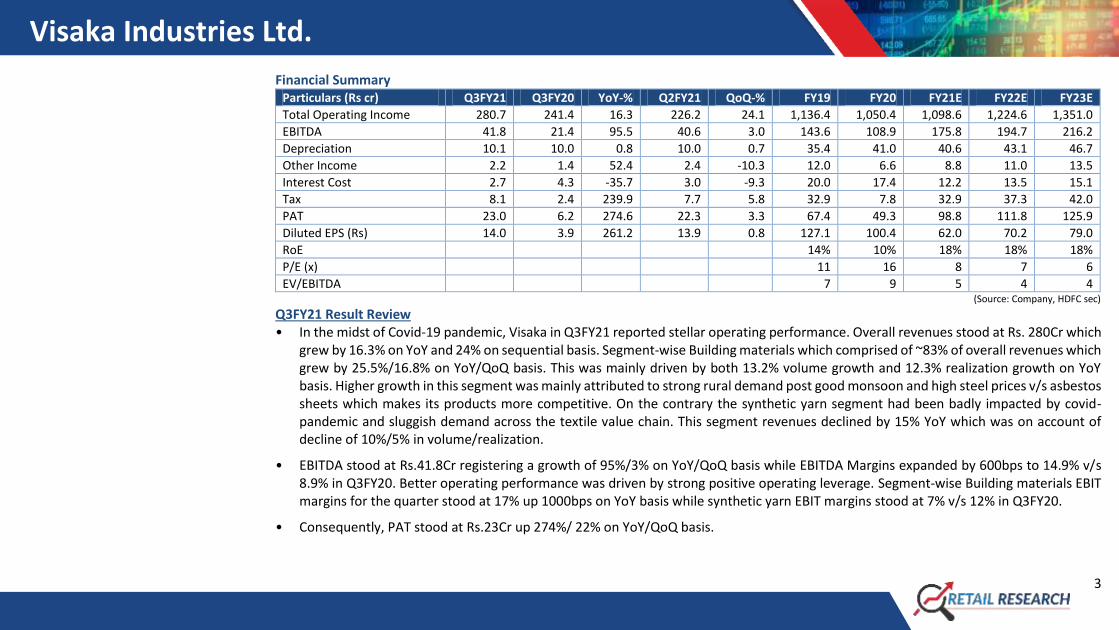
Financial Summary Particulars (Rs cr) Q3FY21 Q3FY20 YoY-% Q2FY21 QoQ-% FY19 FY20 FY21E FY22E FY23E
Total Operating Income 280.7 241.4 16.3 226.2 24.1 1,136.4 1,050.4 1,098.6 1,224.6 1,351.0
EBITDA 41.8 21.4 95.5 40.6 3.0 143.6 108.9 175.8 194.7 216.2
Depreciation 10.1 10.0 0.8 10.0 0.7 35.4 41.0 40.6 43.1 46.7
Other Income 2.2 1.4 52.4 2.4 -10.3 12.0 6.6 8.8 11.0 13.5
Interest Cost 2.7 4.3 -35.7 3.0 -9.3 20.0 17.4 12.2 13.5 15.1
Tax 8.1 2.4 239.9 7.7 5.8 32.9 7.8 32.9 37.3 42.0
PAT 23.0 6.2 274.6 22.3 3.3 67.4 49.3 98.8 111.8 125.9
Diluted EPS (Rs) 14.0 3.9 261.2 13.9 0.8 127.1 100.4 62.0 70.2 79.0
RoE 14% 10% 18% 18% 18%
P/E (x) 11 16 8 7 6
EV/EBITDA 7 9 5 4 4 (Source: Company, HDFC sec)
Q3FY21 Result Review • In the midst of Covid-19 pandemic, Visaka in Q3FY21 reported stellar operating performance. Overall revenues stood at Rs. 280Cr which
grew by 16.3% on YoY and 24% on sequential basis. Segment-wise Building materials which comprised of ~83% of overall revenues which grew by 25.5%/16.8% on YoY/QoQ basis. This was mainly driven by both 13.2% volume growth and 12.3% realization growth on YoY basis. Higher growth in this segment was mainly attributed to strong rural demand post good monsoon and high steel prices v/s asbestos sheets which makes its products more competitive. On the contrary the synthetic yarn segment had been badly impacted by covid-pandemic and sluggish demand across the textile value chain. This segment revenues declined by 15% YoY which was on account of decline of 10%/5% in volume/realization.
• EBITDA stood at Rs.41.8Cr registering a growth of 95%/3% on YoY/QoQ basis while EBITDA Margins expanded by 600bps to 14.9% v/s 8.9% in Q3FY20. Better operating performance was driven by strong positive operating leverage. Segment-wise Building materials EBIT margins for the quarter stood at 17% up 1000bps on YoY basis while synthetic yarn EBIT margins stood at 7% v/s 12% in Q3FY20.
• Consequently, PAT stood at Rs.23Cr up 274%/ 22% on YoY/QoQ basis.
Visaka Industries Ltd.
4
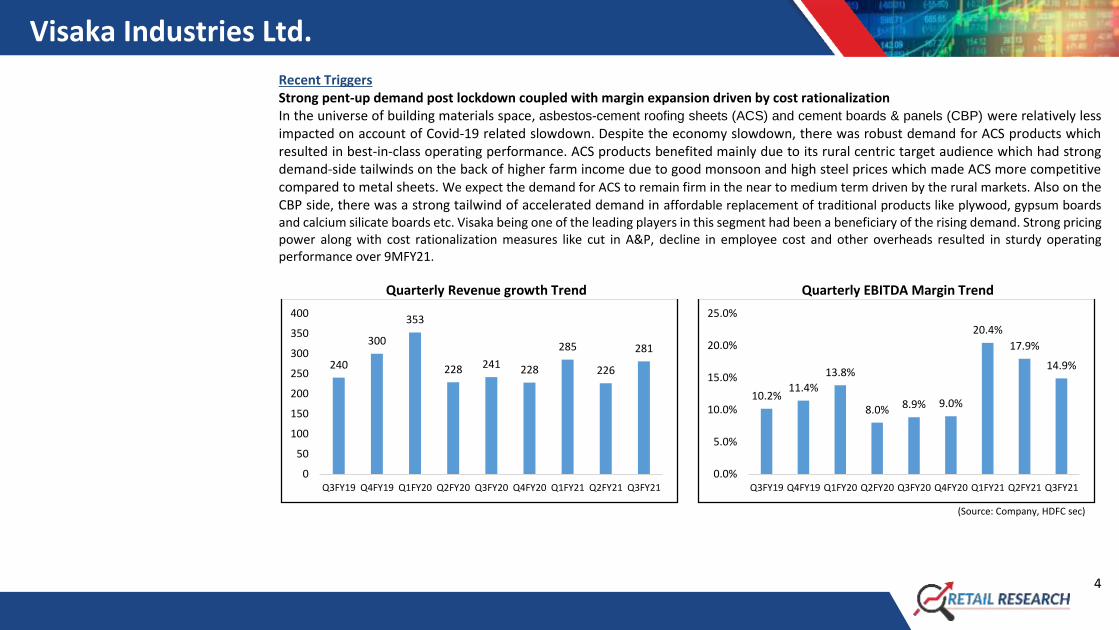
Recent Triggers Strong pent-up demand post lockdown coupled with margin expansion driven by cost rationalization In the universe of building materials space, asbestos-cement roofing sheets (ACS) and cement boards & panels (CBP) were relatively less impacted on account of Covid-19 related slowdown. Despite the economy slowdown, there was robust demand for ACS products which resulted in best-in-class operating performance. ACS products benefited mainly due to its rural centric target audience which had strong demand-side tailwinds on the back of higher farm income due to good monsoon and high steel prices which made ACS more competitive compared to metal sheets. We expect the demand for ACS to remain firm in the near to medium term driven by the rural markets. Also on the CBP side, there was a strong tailwind of accelerated demand in affordable replacement of traditional products like plywood, gypsum boards and calcium silicate boards etc. Visaka being one of the leading players in this segment had been a beneficiary of the rising demand. Strong pricing power along with cost rationalization measures like cut in A&P, decline in employee cost and other overheads resulted in sturdy operating performance over 9MFY21.
Quarterly Revenue growth Trend Quarterly EBITDA Margin Trend
(Source: Company, HDFC sec)
240
300
353
228 241 228
285
226
281
0
50
100
150
200
250
300
350
400
Q3FY19 Q4FY19 Q1FY20 Q2FY20 Q3FY20 Q4FY20 Q1FY21 Q2FY21 Q3FY21
10.2%11.4%
13.8%
8.0% 8.9% 9.0%
20.4%
17.9%
14.9%
0.0%
5.0%
10.0%
15.0%
20.0%
25.0%
Q3FY19 Q4FY19 Q1FY20 Q2FY20 Q3FY20 Q4FY20 Q1FY21 Q2FY21 Q3FY21
Visaka Industries Ltd.
5
Long Term Triggers Consistent market share gains across categories coupled with strong track record of execution The company has dominant market positioning and presence across categories in the building materials space. Despite being a younger player compared to its largest competitor HIL, it has gained significant ground over last 3 decades. In the asbestos sheet business the company is India’s 2nd largest player with 18% market share. Over last three and a half decades the company has almost multiplied its capacity by 22x from 36k MTPA to current 802k MTPA. Also in the “V-Next” segment the company has done a strong ramp-up over last decade, whereby its capacity has increased from 4k MTPA in FY08 to current 180k MTPA. Going forward, with the ongoing capex it further aims to expand this capacity to 240k MTPA by FY22. It currently has a dominant 32% market share in the Cement board and panel segment. Pan-India presence with clear focus on last mile connectivity VIL key strength comprises of its deep routed distribution network supported by Pan-India world-class manufacturing set-up. The company markets products directly to retailers as opposed to pursuing the conventional distributor-retailer approach, facilitating a superior understanding of marketplace realities. The company’s distribution network comprises >7,000 dealers in India’s urban, rural and suburban markets. On the manufacturing side, the company has progressively commissioned plants in regions with attractive off-take but relatively inadequate supply. Its strategy is to service consumers across a radius of 500 Km. Each of the company’s plants cover mutually exclusive marketing zones, maximizing national coverage. In the Fibre Cement Roofing Division which is more rural focused and has relatively higher freight cost, the company has 8 manufacturing facilities spread across India- 5 in Southern India (Telangana, Andhra Pradesh, Tamil Nadu, Karnataka & Odisha) 1 in East (West Bengal), 1 in West (Maharashtra) and 1 in North (UP). Also for V-Next business it has set-up 3 facilities in Telangana, Maharashtra and Haryana. Scale-up in non-seasonal “V-Next” segment to be margin accretive In order to insulate the seasonality factor of asbestos sheets and to catch-up the fast growing multi-decade growth opportunity in superior eco-friendly and price-value alternatives to wood, VIL ventured into innovative Cement board and panel segment (CBP) under its brand “V-Next” in 2008. These products are cement fibre sheets used wherever particle board and plywood are used in internal structures as well as external prefab applications. The off-take of cement bonded boards has been consistently growing following enhanced product awareness, shift from timber products (due to advantages of fire, water and termite resistance over plywood and particle boards), higher affordability, maintenance-free, low erection cost, functional use by carpenters, easy transportability (rather than be mixed onsite) and safety in seismic zones.
Visaka Industries Ltd.
6
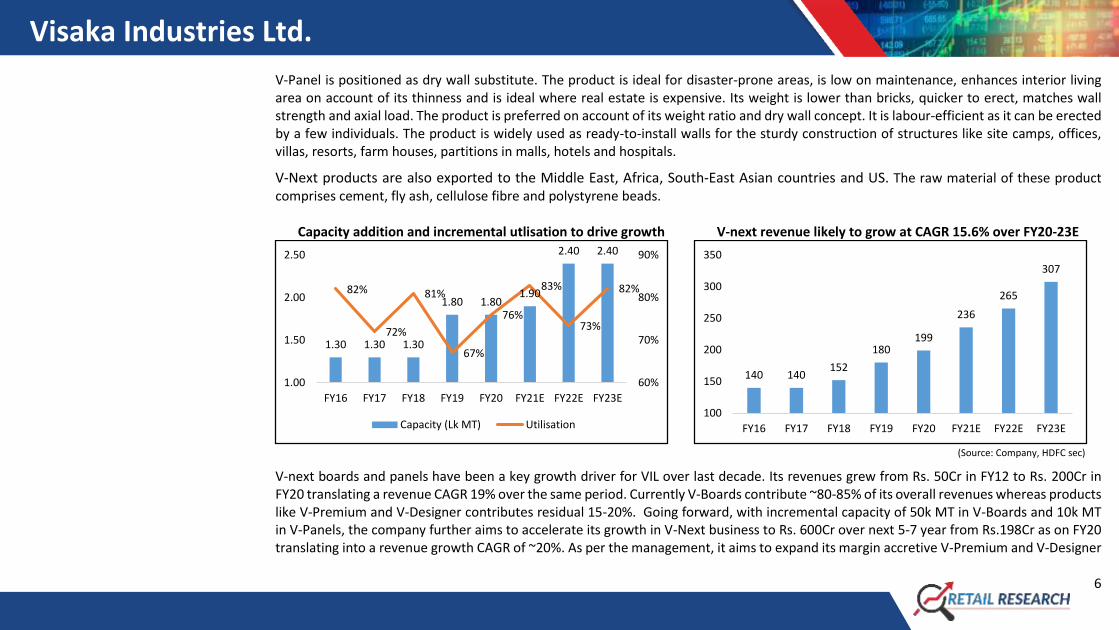
V-Panel is positioned as dry wall substitute. The product is ideal for disaster-prone areas, is low on maintenance, enhances interior living area on account of its thinness and is ideal where real estate is expensive. Its weight is lower than bricks, quicker to erect, matches wall strength and axial load. The product is preferred on account of its weight ratio and dry wall concept. It is labour-efficient as it can be erected by a few individuals. The product is widely used as ready-to-install walls for the sturdy construction of structures like site camps, offices, villas, resorts, farm houses, partitions in malls, hotels and hospitals.
V-Next products are also exported to the Middle East, Africa, South-East Asian countries and US. The raw material of these product comprises cement, fly ash, cellulose fibre and polystyrene beads.
Capacity addition and incremental utlisation to drive growth V-next revenue likely to grow at CAGR 15.6% over FY20-23E
(Source: Company, HDFC sec)
V-next boards and panels have been a key growth driver for VIL over last decade. Its revenues grew from Rs. 50Cr in FY12 to Rs. 200Cr in FY20 translating a revenue CAGR 19% over the same period. Currently V-Boards contribute ~80-85% of its overall revenues whereas products like V-Premium and V-Designer contributes residual 15-20%. Going forward, with incremental capacity of 50k MT in V-Boards and 10k MT in V-Panels, the company further aims to accelerate its growth in V-Next business to Rs. 600Cr over next 5-7 year from Rs.198Cr as on FY20 translating into a revenue growth CAGR of ~20%. As per the management, it aims to expand its margin accretive V-Premium and V-Designer
1.30 1.30 1.30
1.80 1.801.90
2.40 2.40
82%
72%
81%
67%
76%
83%
73%
82%
60%
70%
80%
90%
1.00
1.50
2.00
2.50
FY16 FY17 FY18 FY19 FY20 FY21E FY22E FY23E
Capacity (Lk MT) Utilisation
140 140152
180199
236
265
307
100
150
200
250
300
350
FY16 FY17 FY18 FY19 FY20 FY21E FY22E FY23E

Visaka Industries Ltd.
7
categories which will aid in earning higher sustainable margins of ~18% for this category. We expect V-Next to record a revenue of Rs. 307 cr by FY23E translating a CAGR of 15.6% thereby contributing 23% of overall revenues from 19% as on FY20. Asbestos Cement sheet (ACS)-Structurally well-placed to capture the rural housing demand VIL is the 2nd largest ACS producer in India, with a pan-India manufacturing footprint. The southern followed by eastern India comprises of major chunk of its revenues. VIL currently has 18% market share in ACS industry. The asbestos-cement products mainly comprise AC corrugated roofing sheets and AC pipes. It is a cheaper substitute to thatched and clay-tiled roofs and competes in pricing with low end metal sheets. The current demand tailwind in ACS is mainly driven by: 1) higher steel prices as these products competes with GI/metal sheets. Over last six months steel prices has shot-up significantly paving a way for higher demand for these products 2) Strong monsoon resulting in better farm income 3) Low impact of Covid related lockdown in rural areas as rural household comprises of major chunk of revenue stream for ACS products. We expect, these triggers are likely to sustain in the foreseeable future. Going forward, expect ACS volumes and revenue to grow at CAGR 6.5% and 9.5% respectively over FY20-23E. Higher utilisation on back of volumes led growth ACS revenue likely to grow at CAGR 9.5% over FY20-23E
(Source: Company, HDFC sec)
8.02 8.02 8.02 8.02 8.02 8.02 8.02 8.0286% 88% 88%
92%
80%
90% 92% 97%
0%
20%
40%
60%
80%
100%
0
2
4
6
8
10
FY16 FY17 FY18 FY19 FY20 FY21E FY22E FY23E
Capacity (Lk MT) Utilisation
683
637
678
728
628
745770
825
500
550
600
650
700
750
800
850
FY16 FY17 FY18 FY19 FY20 FY21E FY22E FY23E
Visaka Industries Ltd.
8
Synthetic yarn segment likely to revive FY22 onwards VIL diversified into yarn spinning business in 1992 by commissioning a factory in Nagpur. It initially had a capacity to produce 2k MTPA of man-made yarn which was later expanded it to manufacture a gamut of specialised products (mélange, high twist and specialty yarns) in different blends. The company has scaled-up its capacity to 12k MTPA and has been catering the needs of leading brands like Raymond, Arvind, Siyaram etc. In the current pandemic related lockdown, textile sector had been impacted the most which had resulted in a 50% decline in VIL textile business for 9MFY21. Going forward, the company has no plans to expand its synthetic yarn business. We expect, this business to stabilize once normalcy is back. Key Financial Summary
VIL has delivered a healthy revenue growth of CAGR 8% over FY08-20 aided by its consistent focus on product innovation, expansion of its distribution reach and scale-up of its high margin “V-Next” segment. The contribution of cement board and panel segment had increased from NIL in FY08 to ~20% of overall revenues in FY20. Going forward, we are expecting the company to report a revenue CAGR of 8.7% over FY20-23E, mainly driven by V-Next and Asbestos sheets which is likely to grow by 15.6% and 9.5% respectively. In the textile business, we expect mild decline in FY23 revenues over FY20.
Its EBITDA and PAT grew by CAGR 9%/17% respectively over FY08-20. Despite seasonality issues, volatile raw material prices, higher opex (in the initial phase of V-next business) VIL reported steady earnings growth over last decade. Its operating performance has been gradually improving with aggressive scale-up of V-Next business. Going forward, we expect its operational performance to stabilize with EBITDA and PAT likely to grow at CAGR 25.4% and 36% respectively over FY20-23E.
Despite, seasonality challenges in Asbestos sheet business and constant expansion in cement fiber board segment, VIL has been consistently able to reduce debt due to strong cash flow generation and stable working capital structure.

Visaka Industries Ltd.
9
Operating Performance trend Consistent Free Cash Flow generation
Constant reduction in Net D/E Improvement in RoE’s likely to sustain
(Source: Company, HDFC sec
37.2%43.4% 43.1%
48.4% 51.2% 51.4% 51.1%55.0% 54.8% 54.7%
6.4%9.4% 9.5% 12.2% 14.8% 12.6% 10.4%
16.0% 15.9% 16.0%
1.3% 2.0% 2.4%4.5%
6.6% 5.9% 4.7%9.0% 9.1% 9.3%
0.0%
10.0%
20.0%
30.0%
40.0%
50.0%
60.0%
FY14 FY15 FY16 FY17 FY18 FY19 FY20 FY21E FY22E FY23E
Gross Margin EBITDA Margin PAT Margin
30
-15
6177
7 11
45
155
8396
-50
0
50
100
150
200
FY14 FY15 FY16 FY17 FY18 FY19 FY20 FY21E FY22E FY23E
0.31
0.70 0.67
0.79
0.68
0.450.49 0.45 0.48
0.230.12
0.03
0.00
0.20
0.40
0.60
0.80
1.00
7%
12%
16%
14%
10%
18% 18% 18%
5%
10%
15%
20%
FY16 FY17 FY18 FY19 FY20 FY21E FY22E FY23E
Visaka Industries Ltd.
10
What could go wrong? • Sharp rise in competition intensity
VIL has 32% market share in the cement fiber boards and panel (V-Next) business, any big disruptive pricing in the market place due to any unanticipated competition intensity can erode margins of this segment leading to overall deterioration of margins.
• Inability to expand and grow the cement fiber boards and panel (V-Next) business Historically, VIL has been able to scale-up its V-Next with successful launches and has been able to constantly expand its product portfolio. Going forward, we expect the company to further expedite its focus on accelerated growth in this segment. In case if the execution of this strategy becomes more lengthy and tedious than earlier anticipated than there can an impact on its overall growth and earnings trajectory in short to medium term.
• Sharp rise in raw material Inflation Chrysotile fibre is a key ingredient in manufacturing of ACS. All ACS manufacturers in India import this raw material, which is billed in USD irrespective of movements in local currencies of the countries it is imported from. ACS EBITDA margin are highly sensitive to any prices of ACS and sharp depreciation in INR vs. USD.
• Higher freight cost due to increasing diesel prices can impact operational performance of the company Freight cost (largely road based, and hence, sensitive to diesel price movements) is a major cost component which accounts for ~9% of its net sales. In a rising crude oil scenario there can be an adverse impact on the operational performance of the company.
• Seasonality Historically Q1 and Q4 are the best quarters due to lumpiness in sales of ACS. However with rising contribution from other products, this is coming down.
Company Profile:
Visaka Industries was established in 1985. Visaka has two main divisions; building products division which manufactures cement asbestos sheets and fiber cement boards & panels (CBPs) and the textile division. As on FY20, the building products division accounted for a majority of the revenue – of ~ 80%. (Asbestos-60% & V-Next ~20%) followed by synthetic yarn segment which comprised of residual 20% of overall revenues. Visaka has 14 manufacturing facilities across India with a distribution network of 7000+ dealers network and an aggregate production capacity of 802 KTPA in cement asbestos sheets, 180 KTPA in V-boards and panels and 11,000 MT of yarn production per annum.
Visaka Industries Ltd.
11
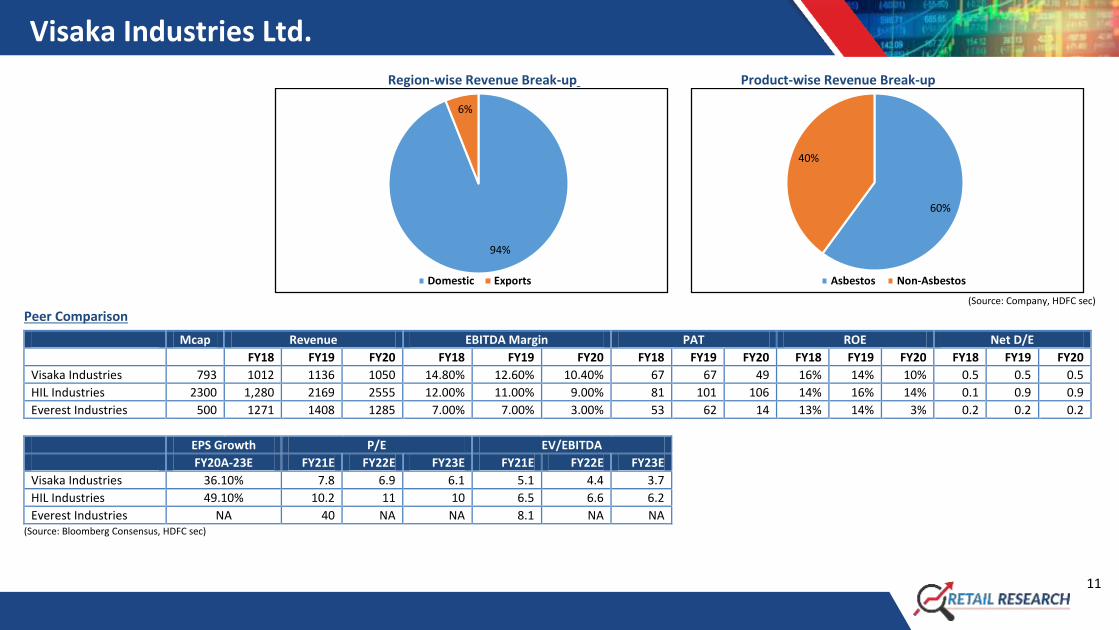
Region-wise Revenue Break-up Product-wise Revenue Break-up
(Source: Company, HDFC sec)
Peer Comparison
Mcap Revenue EBITDA Margin PAT ROE Net D/E
FY18 FY19 FY20 FY18 FY19 FY20 FY18 FY19 FY20 FY18 FY19 FY20 FY18 FY19 FY20
Visaka Industries 793 1012 1136 1050 14.80% 12.60% 10.40% 67 67 49 16% 14% 10% 0.5 0.5 0.5
HIL Industries 2300 1,280 2169 2555 12.00% 11.00% 9.00% 81 101 106 14% 16% 14% 0.1 0.9 0.9
Everest Industries 500 1271 1408 1285 7.00% 7.00% 3.00% 53 62 14 13% 14% 3% 0.2 0.2 0.2
EPS Growth P/E EV/EBITDA
FY20A-23E FY21E FY22E FY23E FY21E FY22E FY23E
Visaka Industries 36.10% 7.8 6.9 6.1 5.1 4.4 3.7
HIL Industries 49.10% 10.2 11 10 6.5 6.6 6.2
Everest Industries NA 40 NA NA 8.1 NA NA (Source: Bloomberg Consensus, HDFC sec)
94%
6%
Domestic Exports
60%
40%
Asbestos Non-Asbestos

Visaka Industries Ltd.
12
Financials
Income Statement Balance Sheet
(Rs Cr) FY19 FY20 FY21E FY22E FY23E As at March FY19 FY20 FY21E FY22E FY23E
Net Revenues 1136.4 1050.4 1098.6 1224.6 1351.0 SOURCE OF FUNDS
Growth (%) 12% -8% 5% 11% 10% Share Capital 15.9 15.9 15.9 15.9 15.9
Operating Expenses 992.8 941.5 922.8 1029.9 1134.8 Reserves 483.6 489.1 563.9 651.7 753.6
EBITDA 143.6 108.9 175.8 194.7 216.2 Shareholders' Funds 499.5 505.0 579.8 667.6 769.5
Growth (%) -4% -24% 61% 11% 11% Long Term Debt 246.4 262.9 162.9 112.9 62.9
EBITDA Margin (%) 12.6% 10.4% 16.0% 15.9% 16.0% Net Deferred Taxes 20.0 14.2 14.5 14.8 15.0
Depreciation 35.4 41.0 40.6 43.1 46.7 Other Liabilities 0.4 0.2 0.2 0.2 0.3
EBIT 108.3 67.9 135.2 151.6 169.5 Minority Interest 1.0 0.0 0.0 0.0 0.0
Other Income 12.0 6.6 8.8 11.0 13.5 Total Source of Funds 767 782 757 795 848
Interest expenses 20.0 17.4 12.2 13.5 15.1 APPLICATION OF FUNDS
PBT 100.4 57.1 131.7 149.1 167.9 Net Block & Goodwill 418.7 406.0 440.4 467.3 490.6
Tax 32.9 7.8 32.9 37.3 42.0 CWIP 1.2 8.8 8.8 8.8 8.8
RPAT 67.4 49.3 98.8 111.8 125.9 Other Non-Current Assets 14.1 15.1 22.0 18.4 20.3
APAT 67.4 49.3 98.8 111.8 125.9 Total Non-Current Assets 433.9 429.8 471.1 494.4 519.7
Growth (%) 0% -27% 100% 13% 13% Current Investments 0.0 0.0 0.0 0.0 0.0
EPS 127.1 100.4 62.0 70.2 79.0 Inventories 272.4 303.9 240.8 268.4 296.1
Trade Receivables 155.3 140.0 135.4 167.8 185.1
Cash & Equivalents 20.2 19.3 31.7 30.8 36.2
Other Current Assets 45.3 50.5 49.4 36.7 33.8
Total Current Assets 493.2 513.7 457.4 503.7 551.2
Short-Term Borrowings 0.0 0.0
Trade Payables 79.0 86.0 90.3 100.7 111.0
Other Current Liabilities 80.8 75.3 80.9 102.0 112.1
Total Current Liabilities 159.8 161.3 171.2 202.6 223.1
Net Current Assets 333.4 352.4 286.2 301.0 328.1
Total Application of Funds 767 782 757 795 848
Visaka Industries Ltd.
13
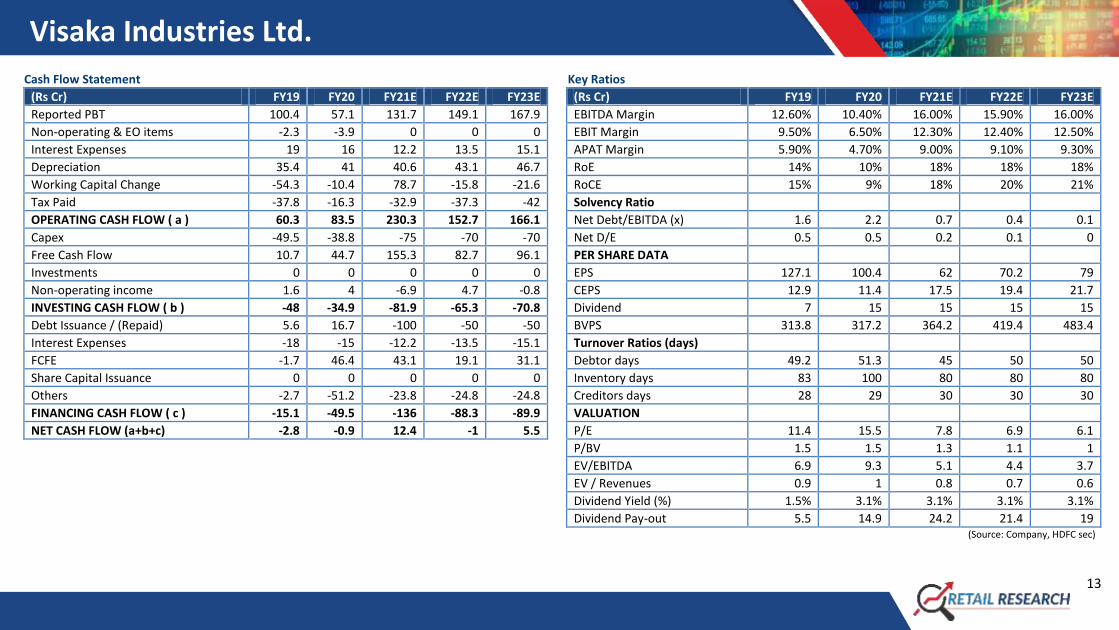
Cash Flow Statement Key Ratios
(Rs Cr) FY19 FY20 FY21E FY22E FY23E (Rs Cr) FY19 FY20 FY21E FY22E FY23E
Reported PBT 100.4 57.1 131.7 149.1 167.9 EBITDA Margin 12.60% 10.40% 16.00% 15.90% 16.00%
Non-operating & EO items -2.3 -3.9 0 0 0 EBIT Margin 9.50% 6.50% 12.30% 12.40% 12.50%
Interest Expenses 19 16 12.2 13.5 15.1 APAT Margin 5.90% 4.70% 9.00% 9.10% 9.30%
Depreciation 35.4 41 40.6 43.1 46.7 RoE 14% 10% 18% 18% 18%
Working Capital Change -54.3 -10.4 78.7 -15.8 -21.6 RoCE 15% 9% 18% 20% 21%
Tax Paid -37.8 -16.3 -32.9 -37.3 -42 Solvency Ratio
OPERATING CASH FLOW ( a ) 60.3 83.5 230.3 152.7 166.1 Net Debt/EBITDA (x) 1.6 2.2 0.7 0.4 0.1
Capex -49.5 -38.8 -75 -70 -70 Net D/E 0.5 0.5 0.2 0.1 0
Free Cash Flow 10.7 44.7 155.3 82.7 96.1 PER SHARE DATA
Investments 0 0 0 0 0 EPS 127.1 100.4 62 70.2 79
Non-operating income 1.6 4 -6.9 4.7 -0.8 CEPS 12.9 11.4 17.5 19.4 21.7
INVESTING CASH FLOW ( b ) -48 -34.9 -81.9 -65.3 -70.8 Dividend 7 15 15 15 15
Debt Issuance / (Repaid) 5.6 16.7 -100 -50 -50 BVPS 313.8 317.2 364.2 419.4 483.4
Interest Expenses -18 -15 -12.2 -13.5 -15.1 Turnover Ratios (days)
FCFE -1.7 46.4 43.1 19.1 31.1 Debtor days 49.2 51.3 45 50 50
Share Capital Issuance 0 0 0 0 0 Inventory days 83 100 80 80 80
Others -2.7 -51.2 -23.8 -24.8 -24.8 Creditors days 28 29 30 30 30
FINANCING CASH FLOW ( c ) -15.1 -49.5 -136 -88.3 -89.9 VALUATION
NET CASH FLOW (a+b+c) -2.8 -0.9 12.4 -1 5.5 P/E 11.4 15.5 7.8 6.9 6.1
P/BV 1.5 1.5 1.3 1.1 1
EV/EBITDA 6.9 9.3 5.1 4.4 3.7
EV / Revenues 0.9 1 0.8 0.7 0.6
Dividend Yield (%) 1.5% 3.1% 3.1% 3.1% 3.1%
Dividend Pay-out 5.5 14.9 24.2 21.4 19 (Source: Company, HDFC sec)
Visaka Industries Ltd.
14
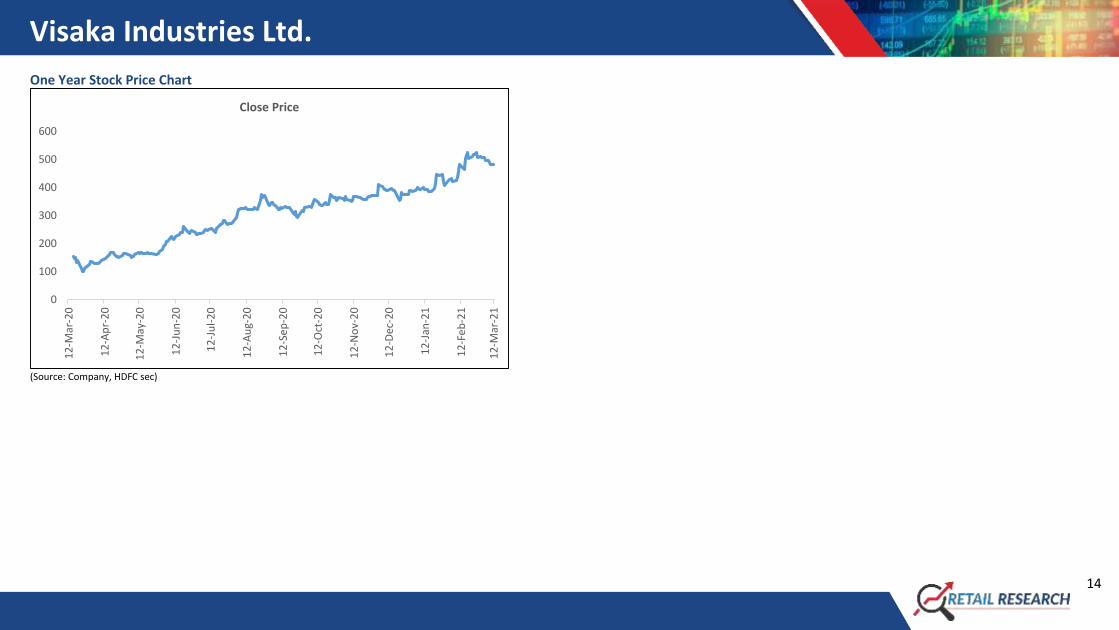
One Year Stock Price Chart
(Source: Company, HDFC sec)
0
100
200
300
400
500
600
12
-Mar
-20
12
-Ap
r-2
0
12
-May
-20
12
-Ju
n-2
0
12
-Ju
l-2
0
12
-Au
g-2
0
12
-Se
p-2
0
12
-Oct
-20
12
-No
v-2
0
12
-Dec
-20
12
-Jan
-21
12
-Fe
b-2
1
12
-Mar
-21
Close Price
Visaka Industries Ltd.
15
I, Nirav Savai, MBA, author and the names subscribed to this report, hereby certify that all of the views expressed in this research report accurately reflect our views about the subject issuer(s) or securities. HSL has no material adverse disciplinary history as on the date of publication of this report. We also
certify that no part of our compensation was, is, or will be directly or indirectly related to the specific recommendation(s) or view(s) in this report.
Research Analyst or his/her relative or HDFC Securities Ltd. does not have any financial interest in the subject company. Also Research Analyst or his relative or HDFC Securities Ltd. or its Associate may have beneficial ownership of 1% or more in the subject company at the end of the month immediately
preceding the date of publication of the Research Report. Further Research Analyst or his relative or HDFC Securities Ltd. or its associate does not have any material conflict of interest.
Any holding in stock –No
HDFC Securities Limited (HSL) is a SEBI Registered Research Analyst having registration no. INH000002475.
Disclaimer:
This report has been prepared by HDFC Securities Ltd and is solely for information of the recipient only. The report must not be used as a singular basis of any investment decision. The views herein are of a general nature and do not consider the risk appetite or the particular circumstances of an individual
investor; readers are requested to take professional advice before investing. Nothing in this document should be construed as investment advice. Each recipient of this document should make such investigations as they deem necessary to arrive at an independent evaluation of an investment in securities of
the companies referred to in this document (including merits and risks) and should consult their own advisors to determine merits and risks of such investment. The information and opinions contained herein have been compiled or arrived at, based upon information obtained in good faith from sources
believed to be reliable. Such information has not been independently verified and no guaranty, representation of warranty, express or implied, is made as to its accuracy, completeness or correctness. All such information and opinions are subject to change without notice. Descriptions of any company or
companies or their securities mentioned herein are not intended to be complete. HSL is not obliged to update this report for such changes. HSL has the right to make changes and modifications at any time.
This report is not directed to, or intended for display, downloading, printing, reproducing or for distribution to or use by, any person or entity who is a citizen or resident or located in any locality, state, country or other jurisdiction where such distribution, publication, reproduction, availability or use would be
contrary to law or regulation or what would subject HSL or its affiliates to any registration or licensing requirement within such jurisdiction. If this report is inadvertently sent or has reached any person in such country, especially, United States of America, the same should be ignored and brought to the attention
of the sender. This document may not be reproduced, distributed or published in whole or in part, directly or indirectly, for any purposes or in any manner.
Foreign currencies denominated securities, wherever mentioned, are subject to exchange rate fluctuations, which could have an adverse effect on their value or price, or the income derived from them. In addition, investors in securities such as ADRs, the values of which are influenced by foreign currencies
effectively assume currency risk. It should not be considered to be taken as an offer to sell or a solicitation to buy any security.
This document is not, and should not, be construed as an offer or solicitation of an offer, to buy or sell any securities or other financial instruments. This report should not be construed as an invitation or solicitation to do business with HSL. HSL may from time to time solicit from, or perform broking, or other
services for, any company mentioned in this mail and/or its attachments.
HSL and its affiliated company(ies), their directors and employees may; (a) from time to time, have a long or short position in, and buy or sell the securities of the company(ies) mentioned herein or (b) be engaged in any other transaction involving such securities and earn brokerage or other compensation or
act as a market maker in the financial instruments of the company(ies) discussed herein or act as an advisor or lender/borrower to such company(ies) or may have any other potential conflict of interests with respect to any recommendation and other related information and opinions.
HSL, its directors, analysts or employees do not take any responsibility, financial or otherwise, of the losses or the damages sustained due to the investments made or any action taken on basis of this report, including but not restricted to, fluctuation in the prices of shares and bonds, changes in the currency
rates, diminution in the NAVs, reduction in the dividend or income, etc.
HSL and other group companies, its directors, associates, employees may have various positions in any of the stocks, securities and financial instruments dealt in the report, or may make sell or purchase or other deals in these securities from time to time or may deal in other securities of the companies /
organizations described in this report.
HSL or its associates might have managed or co-managed public offering of securities for the subject company or might have been mandated by the subject company for any other assignment in the past twelve months.
HSL or its associates might have received any compensation from the companies mentioned in the report during the period preceding twelve months from t date of this report for services in respect of managing or co-managing public offerings, corporate finance, investment banking or merchant banking,
brokerage services or other advisory service in a merger or specific transaction in the normal course of business.
HSL or its analysts did not receive any compensation or other benefits from the companies mentioned in the report or third party in connection with preparation of the research report. Accordingly, neither HSL nor Research Analysts have any material conflict of interest at the time of publication of this report.
Compensation of our Research Analysts is not based on any specific merchant banking, investment banking or brokerage service transactions. HSL may have issued other reports that are inconsistent with and reach different conclusion from the information presented in this report.
Research entity has not been engaged in market making activity for the subject company. Research analyst has not served as an officer, director or employee of the subject company. We have not received any compensation/benefits from the subject company or third party in connection with the Research
Report.
HDFC securities Limited, I Think Techno Campus, Building - B, "Alpha", Office Floor 8, Near Kanjurmarg Station, Opp. Crompton Greaves, Kanjurmarg (East), Mumbai 400 042 Phone: (022) 3075 3400 Fax: (022) 2496 5066
Compliance Officer: Binkle R. Oza Email: [email protected] Phone: (022) 3045 3600
HDFC Securities Limited, SEBI Reg. No.: NSE, BSE, MSEI, MCX: INZ000186937; AMFI Reg. No. ARN: 13549; PFRDA Reg. No. POP: 11092018; IRDA Corporate Agent License No.: CA0062; SEBI Research Analyst Reg. No.: INH000002475; SEBI Investment
Adviser Reg. No.: INA000011538; CIN - U67120MH2000PLC152193
Mutual Funds Investments are subject to market risk. Please read the offer and scheme related documents carefully before investing.