hdfc securities retail research markets & macros
TRANSCRIPT

HDFC securities Retail Research
Markets &MacrosChart Book - June 2020

Markets & Macros
Markets in May
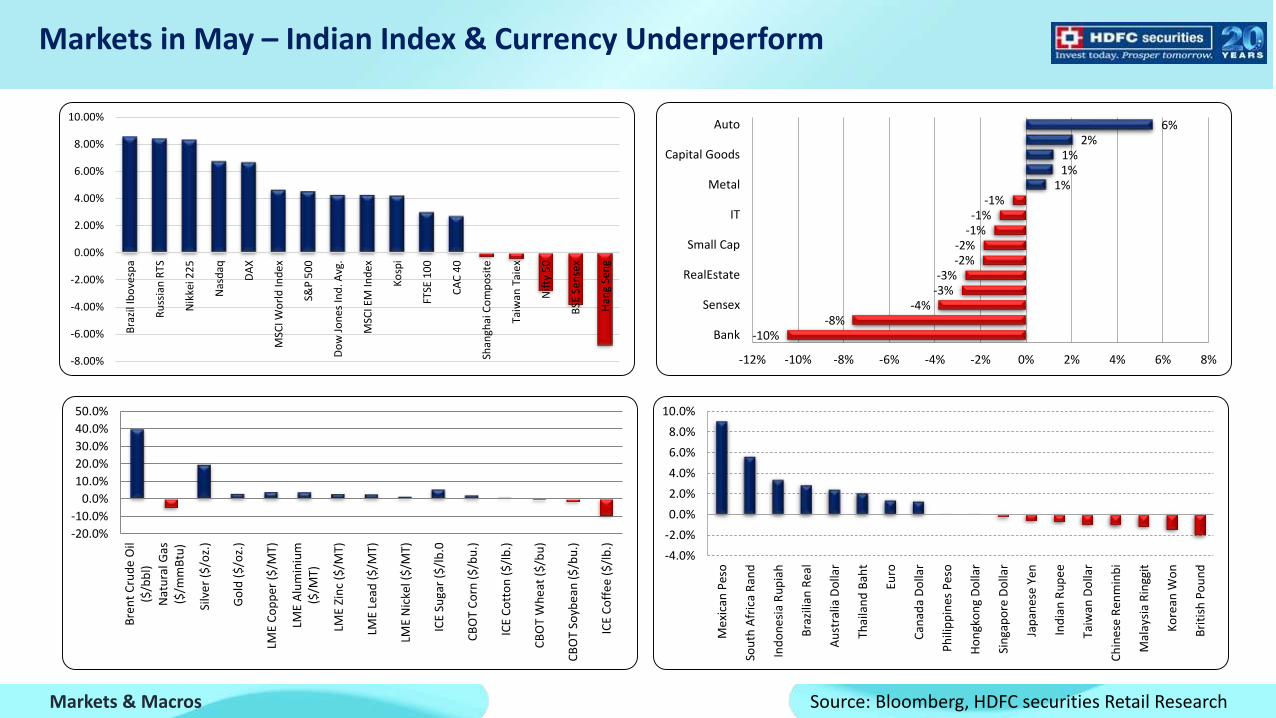
Markets in May – Indian Index & Currency Underperform
Markets & Macros Source: Bloomberg, HDFC securities Retail Research
-8.00%
-6.00%
-4.00%
-2.00%
0.00%
2.00%
4.00%
6.00%
8.00%
10.00%B
razi
l Ib
ove
spa
Ru
ssia
n R
TS
Nik
kei 2
25
Nas
daq
DA
X
MSC
I Wo
rld
Ind
ex
S&P
50
0
Do
w J
on
es In
d. A
vg.
MSC
I EM
Ind
ex
Ko
spi
FTSE
10
0
CA
C 4
0
Shan
ghai
Co
mp
osi
te
Taiw
an T
aie
x
Nif
ty 5
0
BSE
Se
nse
x
Han
g Se
ng
-10%-8%
-4%-3%-3%
-2%-2%
-1%-1%
-1%1%
1%1%
2%6%
-12% -10% -8% -6% -4% -2% 0% 2% 4% 6% 8%
Bank
Sensex
RealEstate
Small Cap
IT
Metal
Capital Goods
Auto
-20.0%
-10.0%
0.0%
10.0%
20.0%
30.0%
40.0%
50.0%
Bre
nt
Cru
de
Oil
($/b
bl)
Nat
ura
l Gas
($/m
mB
tu)
Silv
er
($/o
z.)
Go
ld (
$/o
z.)
LME
Co
pp
er (
$/M
T)
LME
Alu
min
ium
($/M
T)
LME
Zin
c ($
/MT)
LME
Lead
($
/MT)
LME
Nic
kel (
$/M
T)
ICE
Suga
r ($
/lb
.0
CB
OT
Co
rn (
$/b
u.)
ICE
Co
tto
n (
$/l
b.)
CB
OT
Wh
eat
($
/bu
)
CB
OT
Soyb
ean
($
/bu
.)
ICE
Co
ffe
e ($
/lb
.)
-4.0%
-2.0%
0.0%
2.0%
4.0%
6.0%
8.0%
10.0%
Me
xica
n P
eso
Sou
th A
fric
a R
and
Ind
on
esi
a R
up
iah
Bra
zilia
n R
eal
Au
stra
lia D
olla
r
Thai
lan
d B
aht
Euro
Can
ada
Do
llar
Ph
ilip
pin
es P
eso
Ho
ngk
on
g D
olla
r
Sin
gap
ore
Do
llar
Jap
anes
e Y
en
Ind
ian
Ru
pe
e
Taiw
an D
olla
r
Ch
ine
se R
enm
inb
i
Mal
aysi
a R
ingg
it
Ko
rean
Wo
n
Bri
tish
Po
un
d

Fear Subsides Across The Board
Markets & Macros Source: Bloomberg, HDFC securities Retail Research
0
20
40
60
80
100
120
140
160
180
Jan
/15
Ap
r/1
5
Jul/
15
Oct
/15
Jan
/16
Ap
r/1
6
Jul/
16
Oct
/16
Jan
/17
Ap
r/1
7
Jul/
17
Oct
/17
Jan
/18
Ap
r/1
8
Jul/
18
Oct
/18
Jan
/19
Ap
r/1
9
Jul/
19
Oct
/19
Jan
/20
Ap
r/2
0
0
10
20
30
40
50
60
70
80
90
Jan
/15
Ap
r/1
5
Jul/
15
Oct
/15
Jan
/16
Ap
r/1
6
Jul/
16
Oct
/16
Jan
/17
Ap
r/1
7
Jul/
17
Oct
/17
Jan
/18
Ap
r/1
8
Jul/
18
Oct
/18
Jan
/19
Ap
r/1
9
Jul/
19
Oct
/19
Jan
/20
Ap
r/2
0
0
10
20
30
40
50
60
70
80
90
100
Jan
/15
Ap
r/1
5
Jul/
15
Oct
/15
Jan
/16
Ap
r/1
6
Jul/
16
Oct
/16
Jan
/17
Ap
r/1
7
Jul/
17
Oct
/17
Jan
/18
Ap
r/1
8
Jul/
18
Oct
/18
Jan
/19
Ap
r/1
9
Jul/
19
Oct
/19
Jan
/20
Ap
r/2
0
Emerging Markets - CBOE EM ETF Vol Index
0
10
20
30
40
50
60
70
80
90
Jan
/15
Ap
r/1
5
Jul/
15
Oct
/15
Jan
/16
Ap
r/1
6
Jul/
16
Oct
/16
Jan
/17
Ap
r/1
7
Jul/
17
Oct
/17
Jan
/18
Ap
r/1
8
Jul/
18
Oct
/18
Jan
/19
Ap
r/1
9
Jul/
19
Oct
/19
Jan
/20
Ap
r/2
0
US Bond Markets -MOVE Index US Equity Markets - VIX Index
Indian Markets - India VIX Index

Asian Stocks Lag Global Peers
Markets & Macros Source: Bloomberg, HDFC securities Retail Research

Commodity Prices Stabilize But International Trade Volumes Plunge
Markets & Macros Source: Bloomberg, HDFC securities Retail Research
100
110
120
130
140
150
160
170
180
190
200
Jan
/19
Feb
/19
Mar
/19
Ap
r/1
9
May
/19
Jun
/19
Jul/
19
Au
g/1
9
Sep
/19
Oct
/19
No
v/1
9
Dec
/19
Jan
/20
Feb
/20
Mar
/20
Ap
r/2
0
May
/20
CRB Commodity Index
Monthly Average Line
110
112
114
116
118
120
122
124
126
128
Jan
/15
Ap
r/1
5
Jul/
15
Oct
/15
Jan
/16
Ap
r/1
6
Jul/
16
Oct
/16
Jan
/17
Ap
r/1
7
Jul/
17
Oct
/17
Jan
/18
Ap
r/1
8
Jul/
18
Oct
/18
Jan
/19
Ap
r/1
9
Jul/
19
Oct
/19
Jan
/20
CPB Wolrd Trade Volume Index(2010=100)
Monthly Average Line

Commodity To Equity Ratio Falls To New Record Lows
Markets & Macros Source: Bloomberg, HDFC securities Retail Research

Stronger Dollar , Emerging Market Currencies weakens
Markets & Macros Source: Bloomberg, HDFC securities Retail Research
1400
1450
1500
1550
1600
1650
1700
1750
Jan/15 Jan/16 Jan/17 Jan/18 Jan/19 Jan/20
MSCI EM Currency Index
85
87
89
91
93
95
97
99
101
103
105
Jan/15 Jan/16 Jan/17 Jan/18 Jan/19 Jan/20
DXY Index

Rupee Weakens against Major Currencies
Markets & Macros Source: Bloomberg, HDFC securities Retail Research
60
62
64
66
68
70
72
74
76
78
Jan
/15
Ap
r/1
5
Jul/
15
Oct
/15
Jan
/16
Ap
r/1
6
Jul/
16
Oct
/16
Jan
/17
Ap
r/1
7
Jul/
17
Oct
/17
Jan
/18
Ap
r/1
8
Jul/
18
Oct
/18
Jan
/19
Ap
r/1
9
Jul/
19
Oct
/19
Jan
/20
Ap
r/2
0
USDINR
60
65
70
75
80
85
90
Jan
/15
Ap
r/1
5
Jul/
15
Oct
/15
Jan
/16
Ap
r/1
6
Jul/
16
Oct
/16
Jan
/17
Ap
r/1
7
Jul/
17
Oct
/17
Jan
/18
Ap
r/1
8
Jul/
18
Oct
/18
Jan
/19
Ap
r/1
9
Jul/
19
Oct
/19
Jan
/20
Ap
r/2
0
EURINR
75
80
85
90
95
100
105
110
Jan
/15
Ap
r/1
5
Jul/
15
Oct
/15
Jan
/16
Ap
r/1
6
Jul/
16
Oct
/16
Jan
/17
Ap
r/1
7
Jul/
17
Oct
/17
Jan
/18
Ap
r/1
8
Jul/
18
Oct
/18
Jan
/19
Ap
r/1
9
Jul/
19
Oct
/19
Jan
/20
Ap
r/2
0
GBPINR
0.40
0.45
0.50
0.55
0.60
0.65
0.70
0.75
Jan
/15
Ap
r/1
5
Jul/
15
Oct
/15
Jan
/16
Ap
r/1
6
Jul/
16
Oct
/16
Jan
/17
Ap
r/1
7
Jul/
17
Oct
/17
Jan
/18
Ap
r/1
8
Jul/
18
Oct
/18
Jan
/19
Ap
r/1
9
Jul/
19
Oct
/19
Jan
/20
Ap
r/2
0
JPYINR
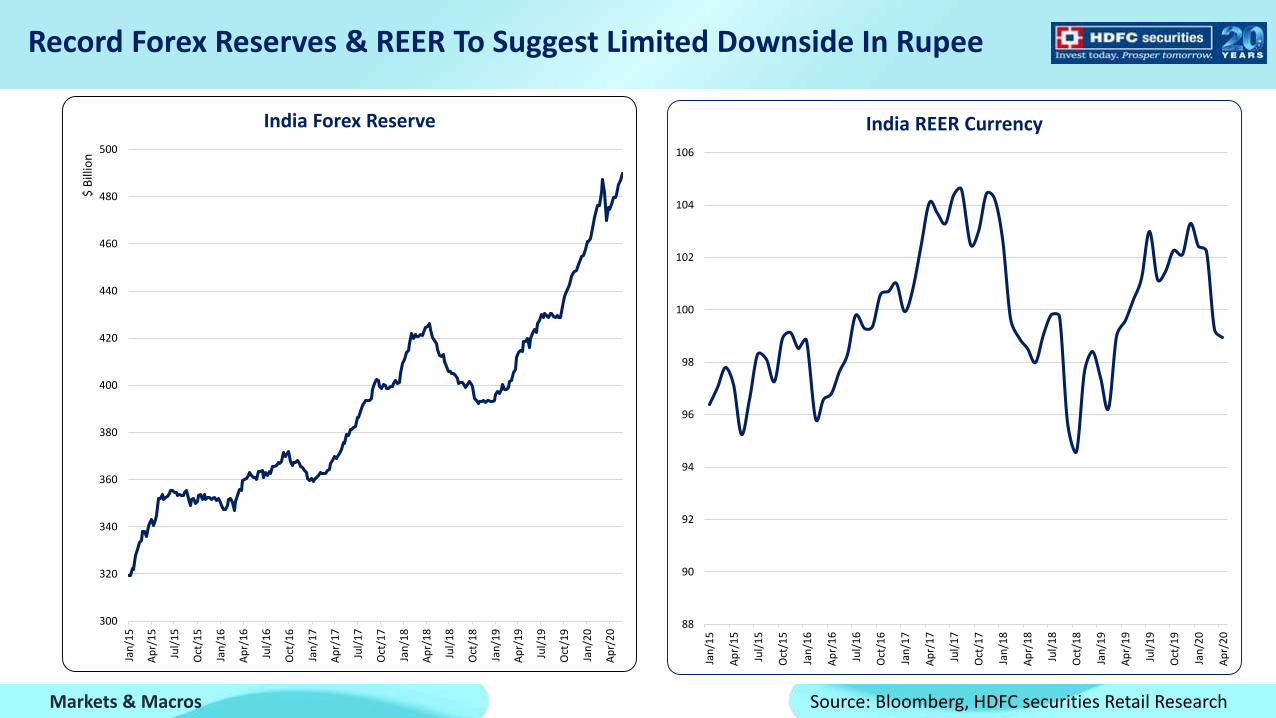
Record Forex Reserves & REER To Suggest Limited Downside In Rupee
Markets & Macros Source: Bloomberg, HDFC securities Retail Research
300
320
340
360
380
400
420
440
460
480
500
Jan
/15
Ap
r/1
5
Jul/
15
Oct
/15
Jan
/16
Ap
r/1
6
Jul/
16
Oct
/16
Jan
/17
Ap
r/1
7
Jul/
17
Oct
/17
Jan
/18
Ap
r/1
8
Jul/
18
Oct
/18
Jan
/19
Ap
r/1
9
Jul/
19
Oct
/19
Jan
/20
Ap
r/2
0
$ B
illio
n
India Forex Reserve
88
90
92
94
96
98
100
102
104
106
Jan
/15
Ap
r/1
5
Jul/
15
Oct
/15
Jan
/16
Ap
r/1
6
Jul/
16
Oct
/16
Jan
/17
Ap
r/1
7
Jul/
17
Oct
/17
Jan
/18
Ap
r/1
8
Jul/
18
Oct
/18
Jan
/19
Ap
r/1
9
Jul/
19
Oct
/19
Jan
/20
Ap
r/2
0
India REER Currency

G-Sec Trend lower, Widening Spread Between G-Sec and Corp Bonds
Markets & Macros Source: Bloomberg, HDFC securities Retail Research
5.00
5.50
6.00
6.50
7.00
7.50
8.00
8.50
Jan
/15
May
/15
Sep
/15
Jan
/16
May
/16
Sep
/16
Jan
/17
May
/17
Sep
/17
Jan
/18
May
/18
Sep
/18
Jan
/19
May
/19
Sep
/19
Jan
/20
May
/20
India 10 Year Bond Yield
5.00
5.50
6.00
6.50
7.00
7.50
8.00
8.50
9.00
9.50
Jan
/15
May
/15
Sep
/15
Jan
/16
May
/16
Sep
/16
Jan
/17
May
/17
Sep
/17
Jan
/18
May
/18
Sep
/18
Jan
/19
May
/19
Sep
/19
Jan
/20
May
/20
Corporate AAA Bond Yield
0
0.2
0.4
0.6
0.8
1
1.2
1.4
1.6
Jan
/15
May
/15
Sep
/15
Jan
/16
May
/16
Sep
/16
Jan
/17
May
/17
Sep
/17
Jan
/18
May
/18
Sep
/18
Jan
/19
May
/19
Sep
/19
Jan
/20
May
/20
Corporate AAA bond vs 10 YrGSec Spread

Central Bankers Add Gold & Trim US Treasuries
Markets & Macros Source: Bloomberg, HDFC securities Retail Research
IMF World Reserve Gold HoldingsGlobal Holdings of US Treasury

Foreigners Turn Tentative Buyers In Equity & Debt In May
Markets & Macros Source: Bloomberg, HDFC securities Retail Research
-1000
-500
0
500
1000
1500
Jan
/17
Feb
/17
Mar
/17
Ap
r/1
7
May
/17
Jun
/17
Jul/
17
Au
g/1
7
Sep
/17
Oct
/17
No
v/1
7
Dec
/17
Jan
/18
Feb
/18
Mar
/18
Ap
r/1
8
May
/18
Jun
/18
Jul/
18
Au
g/1
8
Sep
/18
Oct
/18
No
v/1
8
Dec
/18
Jan
/19
Feb
/19
Mar
/19
Ap
r/1
9
May
/19
Jun
/19
Jul/
19
Au
g/1
9
Sep
/19
Oct
/19
No
v/1
9
Dec
/19
Jan
/20
Feb
/20
Mar
/20
Ap
r/2
0
May
/20
India FIII Equity Flows ($mln)
-600
-400
-200
0
200
400
600
800
Jan
/17
Feb
/17
Mar
/17
Ap
r/1
7
May
/17
Jun
/17
Jul/
17
Au
g/1
7
Sep
/17
Oct
/17
No
v/1
7
Dec
/17
Jan
/18
Feb
/18
Mar
/18
Ap
r/1
8
May
/18
Jun
/18
Jul/
18
Au
g/1
8
Sep
/18
Oct
/18
No
v/1
8
Dec
/18
Jan
/19
Feb
/19
Mar
/19
Ap
r/1
9
May
/19
Jun
/19
Jul/
19
Au
g/1
9
Sep
/19
Oct
/19
No
v/1
9
Dec
/19
Jan
/20
Feb
/20
Mar
/20
Ap
r/2
0
May
/20
India FII Debt Flows ($mln)

Light leveraged Positions - Room for markets to Grow
HDFC securities Retail Research
0.5
1
1.5
2
2.5
3
3.5
4
4.5
Feb
-05
Sep
-05
Ap
r-0
6
No
v-0
6
Jun
-07
Jan
-08
Au
g-0
8
Mar
-09
Oct
-09
May
-10
Dec
-10
Jul-
11
Feb
-12
Sep
-12
Ap
r-1
3
No
v-1
3
Jun
-14
Jan
-15
Au
g-1
5
Mar
-16
Oct
-16
May
-17
Dec
-17
Jul-
18
Feb
-19
Sep
-19
Ap
r-2
0
Nifty Futures' Open Interest(No Cr)
2000
7000
12000
17000
22000
27000
Feb
-05
Sep
-05
Ap
r-0
6
No
v-0
6
Jun
-07
Jan
-08
Au
g-0
8
Mar
-09
Oct
-09
May
-10
Dec
-10
Jul-
11
Feb
-12
Sep
-12
Ap
r-1
3
No
v-1
3
Jun
-14
Jan
-15
Au
g-1
5
Mar
-16
Oct
-16
May
-17
Dec
-17
Jul-
18
Feb
-19
Sep
-19
Ap
r-2
0
Nifty Futures' Open Interest(Rs Cr)
Nifty Futures Open Interest At Multi Year Low
Source: NSE, HDFC securities Retail Research

Light Leveraged Positions - Weaker Hands Are Out Of The Markets
HDFC securities Retail Research Source: NSE, HSL Research
50
100
150
200
Jan
-07
Feb
-07
Mar
-07
Ap
r-0
7
May
-07
Jun
-07
Jul-
07
Au
g-0
7
Sep
-07
Oct
-07
No
v-0
7
Dec
-07
Jan
-08
Feb
-08
Mar
-08
Ap
r-0
8
May
-08
Jun
-08
Jul-
08
Au
g-0
8
Sep
-08
Oct
-08
No
v-0
8
Dec
-08
Jan
-09
Feb
-09
Mar
-09
Ap
r-0
9
May
-09
Jun
-09
Jul-
09
Stock Futures' Open Interest In 2007-08
60% Fall Before Markets bottoms out In Oct 2008
0100200300400500600
Oct
-15
Jan
-16
Ap
r-1
6
Jul-
16
Oct
-16
Jan
-17
Ap
r-1
7
Jul-
17
Oct
-17
Jan
-18
Ap
r-1
8
Jul-
18
Oct
-18
Jan
-19
Ap
r-1
9
Jul-
19
Oct
-19
Jan
-20
Ap
r-2
0
Stock Futures' Open Interest( No Of Shares Cr) 55% Fall Before Markets bottoms out In March 2020

Extreme Oversold Breadth Suggests Market Bottomed out In March
Markets & Macros Source: Bloomberg, HDFC securities Retail Research
2008 2011 2016 2018 20202013
2008
20112013
2016
2018
2020BSE500 Monthly Price Charts
BSE All Stocks
Bottom Date Of
Bear TrendStocks below 200 DMA
23-Mar-20 89%
26-Oct-18 86%
26-Feb-16 79%
20-Dec-11 91%
09-Mar-09 98%
17-May-04 75%
25-Apr-03 63%
21-Sep-01 94%

Number of 52 Weeks Highs V/S 52 Weeks Low Indicates Market Breadth has discounted its Worst in 2018 itself
Markets & Macros Source: Bloomberg, HDFC securities Retail Research
2008 2018 2020
Number of 52 Weeks Highs V/S 52 Weeks Low Indicates Market Breadth has discounted Worst in 2018 itself
Markets & Macros Source: Bloomberg, HDFC securities Retail Research
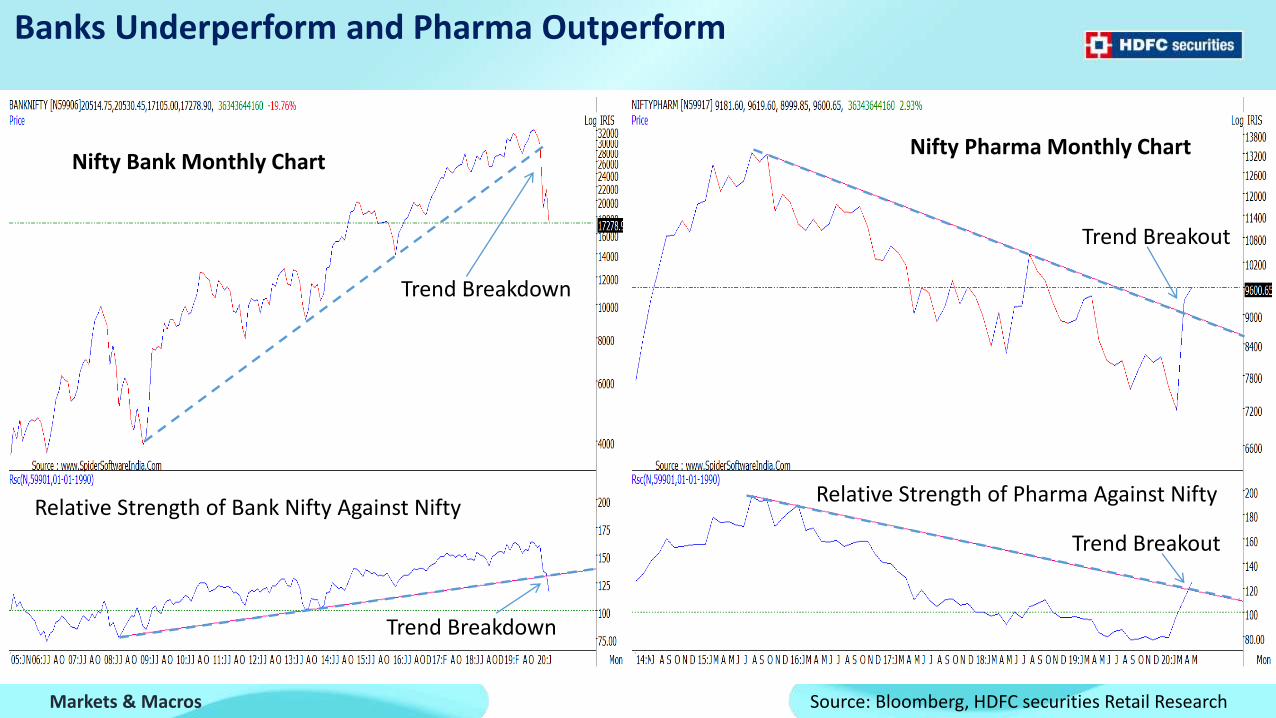
Banks Underperform and Pharma Outperform
Relative Strength of Bank Nifty Against Nifty
Nifty Pharma Monthly ChartNifty Bank Monthly Chart
Relative Strength of Pharma Against Nifty
Trend Breakout
Trend Breakdown
Trend Breakout
Trend Breakdown

Brisk Business on Bourses
Markets & Macros Source: Bloomberg, HDFC securities Retail Research
0
2000
4000
6000
8000
10000
12000
14000
May
/19
Jun
/19
Jun
/19
Jul/
19
Jul/
19
Au
g/1
9
Au
g/1
9
Sep
/19
Sep
/19
Oct
/19
Oct
/19
Oct
/19
No
v/1
9
No
v/1
9
Dec
/19
Dec
/19
Jan
/20
Jan
/20
Feb
/20
Feb
/20
Mar
/20
Mar
/20
Ap
r/2
0
Ap
r/2
0
Ap
r/2
0
May
/20
May
/20
India NSE BSE Combined Turnover
Indai NSE BSE Combined Turnover($mln) One Month Avg. Turnover ($mln)
0
500
1000
1500
2000
2500
0
10
20
30
40
50
60
70
Jan
/19
Feb
/19
Mar
/19
Ap
r/1
9
May
/19
Jun
/19
Jul/
19
Au
g/1
9
Sep
/19
Oct
/19
No
v/1
9
Dec
/19
Jan
/20
Feb
/20
Mar
/20
Ap
r/2
0
May
/20
India NSE BSE Combined Delivery Volume
Delivery Percentage NSE BSE Combined Delivery Volume mln

Retail SIP Flows Remain Robust Despite Market Rout
Markets & Macros Source: AMFI, HDFC securities Retail Research
New SIPs at 12 months low Monthly SIP flow
910 9
10
9 9
1011
10
1211
88
5 6 5 6 6 6 5 6 6 6 6 65
0
2
4
6
8
10
12
14
New SIPs SIPs Discontinued
#Lacs
67
75.5
80 80.682.4 83.2 82.5
85.3 83.8
30
40
50
60
70
80
90
Apr-18 Aug-18 Dec-18 Apr-19 Aug-19 Dec-19 Apr-20
Rs bn

Markets & Macros Source: Bloomberg, HDFC securities Retail Research
%
0
20
40
60
80
100
120
Mar-16 Mar-17 Mar-18 Mar-19 Mar-20
50.1 49.8 50.4 49 50.5
22 21.9 21.3 21.8 21
12.3 12.4 13 13.9 14.8
15.6 15.8 15.4 15.3 13.8
Promoters' FIIs DIIs Public
Foreign holding at 5 years lows

Markets & Macros
Macro in May

COVID-19 Relief Package - Too Little & Too Late ?
Markets & Macros Source: Bloomberg, HDFC securities Retail Research
Other 1%
Health 1%
Agriculture 19%
Housing3%
MSME18%
NBFC4%
Power4%
Monetary and liquidity
measures by RBI38%
Welfare measures
8% MNREGA2%
Delay in tax payment
obligation for few months
2%
Guarantees19%
Actual impact of FD
of FY219%
Liquidity measures by
RBI38%
Credit Facilities19%
Other15%
Break-up Of Economic Package

Annual GDP Growth Falls To The Lowest Since FY01
Markets & Macros Source: Gov. of India, HDFC securities Retail Research
5.1
7.3
8.7 8.9
7.1
6.2
5.6 5.8
5.2
4.44.1
3.1
Q1FY18
Q2FY18
Q3FY18
Q4FY18
Q1FY19
Q2FY19
Q3FY19
Q4FY19
Q1FY20
Q2FY20
Q3FY20
Q4FY20
0
2
4
6
8
10
12
FY0
1
FY0
2
FY0
3
FY0
4
FY0
5
FY0
6
FY0
7
FY0
8
FY0
9
FY1
0
FY1
1
FY1
2
FY1
3
FY1
4
FY1
5
FY1
6
FY1
7
FY1
8
FY1
9
FY2
0
Quarterly GDP Growth Falls To The Lowest Since Q4FY09Annual GDP Growth Falls To The Lowest Since FY01

India’s External Trade Plunge
Markets & Macros Source: Gov. Of India, HDFC securities Retail Research
Export & Import YoY % Trade Balance (in $ mn)
-70
-60
-50
-40
-30
-20
-10
0
10
20
30
40
Feb
/18
Ap
r/18
Jun
/18
Au
g/18
Oct
/18
De
c/18
Feb
/19
Ap
r/19
Jun
/19
Au
g/19
Oct
/19
De
c/19
Feb
/20
Ap
r/20
EXPORTS YOY IMPORT YOY
-20000
-18000
-16000
-14000
-12000
-10000
-8000
-6000
-4000
-2000
0
Feb
/18
Ap
r/18
Jun
/18
Au
g/18
Oct
/18
De
c/1
8
Feb
/19
Ap
r/19
Jun
/19
Au
g/19
Oct
/19
De
c/1
9
Feb
/20
Ap
r/20
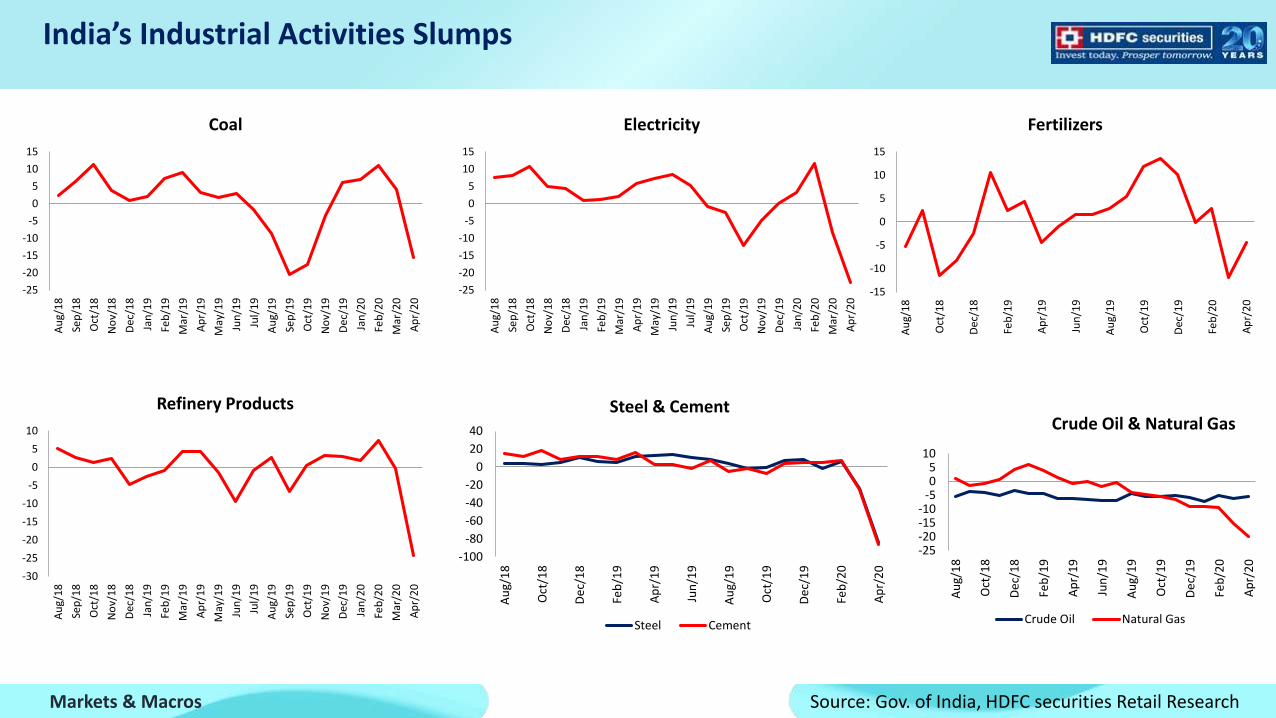
India’s Industrial Activities Slumps
Markets & Macros Source: Gov. of India, HDFC securities Retail Research
-25
-20
-15
-10
-5
0
5
10
15
Au
g/1
8
Sep
/18
Oct
/18
No
v/1
8
Dec
/18
Jan
/19
Feb
/19
Mar
/19
Ap
r/1
9
May
/19
Jun
/19
Jul/
19
Au
g/1
9
Sep
/19
Oct
/19
No
v/1
9
Dec
/19
Jan
/20
Feb
/20
Mar
/20
Ap
r/2
0
Coal
-25
-20
-15
-10
-5
0
5
10
15
Au
g/1
8
Sep
/18
Oct
/18
No
v/1
8
Dec
/18
Jan
/19
Feb
/19
Mar
/19
Ap
r/1
9
May
/19
Jun
/19
Jul/
19
Au
g/1
9
Sep
/19
Oct
/19
No
v/1
9
Dec
/19
Jan
/20
Feb
/20
Mar
/20
Ap
r/2
0
Electricity
-15
-10
-5
0
5
10
15
Au
g/1
8
Oct
/18
Dec
/18
Feb
/19
Ap
r/1
9
Jun
/19
Au
g/1
9
Oct
/19
Dec
/19
Feb
/20
Ap
r/2
0
Fertilizers
-30
-25
-20
-15
-10
-5
0
5
10
Au
g/1
8
Sep
/18
Oct
/18
No
v/1
8
Dec
/18
Jan
/19
Feb
/19
Mar
/19
Ap
r/1
9
May
/19
Jun
/19
Jul/
19
Au
g/1
9
Sep
/19
Oct
/19
No
v/1
9
Dec
/19
Jan
/20
Feb
/20
Mar
/20
Ap
r/2
0Refinery Products
-100
-80
-60
-40
-20
0
20
40
Au
g/1
8
Oct
/18
De
c/1
8
Feb
/19
Ap
r/1
9
Jun
/19
Au
g/1
9
Oct
/19
De
c/1
9
Feb
/20
Ap
r/2
0
Steel & Cement
Steel Cement
-25-20-15-10
-505
10
Au
g/1
8
Oct
/18
De
c/1
8
Feb
/19
Ap
r/1
9
Jun
/19
Au
g/1
9
Oct
/19
De
c/1
9
Feb
/20
Ap
r/2
0
Crude Oil & Natural Gas
Crude Oil Natural Gas

Purchasing Managers Index – Recovering after the lockdown plunge
Markets & Macros Source: Gov. of India, HDFC securities Retail Research
20
25
30
35
40
45
50
55
60
Mfg. PMI
0
10
20
30
40
50
60
70
Service PMI
0
10
20
30
40
50
60
70
May
/18
Jul/
18
Sep
/18
No
v/1
8
Jan
/19
Mar
/19
May
/19
Jul/
19
Sep
/19
No
v/1
9
Jan
/20
Mar
/20
May
/20
Composite PMI
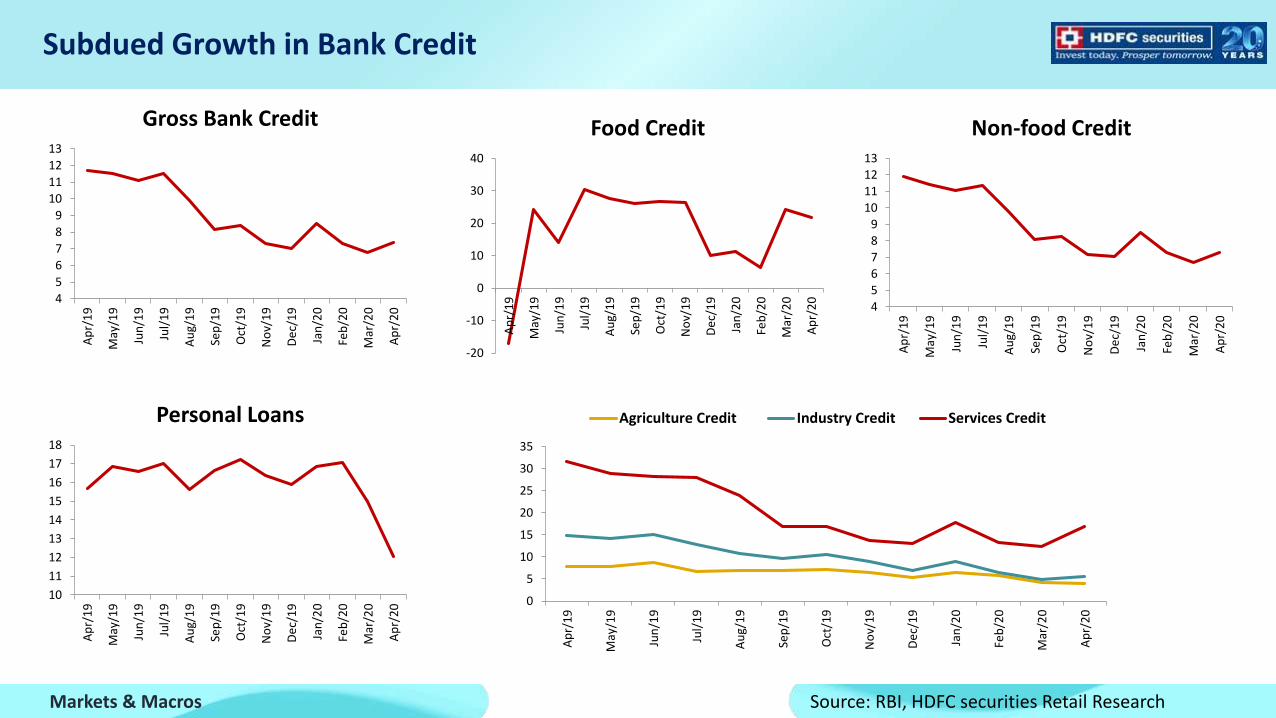
Subdued Growth in Bank Credit
Markets & Macros Source: RBI, HDFC securities Retail Research
4
5
6
7
8
9
10
11
12
13
Ap
r/1
9
May
/19
Jun
/19
Jul/
19
Au
g/1
9
Sep
/19
Oct
/19
No
v/1
9
De
c/1
9
Jan
/20
Feb
/20
Mar
/20
Ap
r/2
0
Gross Bank Credit
-20
-10
0
10
20
30
40
Ap
r/1
9
May
/19
Jun
/19
Jul/
19
Au
g/1
9
Sep
/19
Oct
/19
No
v/1
9
De
c/1
9
Jan
/20
Feb
/20
Mar
/20
Ap
r/2
0
Food Credit
456789
10111213
Ap
r/1
9
May
/19
Jun
/19
Jul/
19
Au
g/1
9
Sep
/19
Oct
/19
No
v/1
9
De
c/1
9
Jan
/20
Feb
/20
Mar
/20
Ap
r/2
0
Non-food Credit
10
11
12
13
14
15
16
17
18
Ap
r/1
9
May
/19
Jun
/19
Jul/
19
Au
g/1
9
Sep
/19
Oct
/19
No
v/1
9
De
c/1
9
Jan
/20
Feb
/20
Mar
/20
Ap
r/2
0
Personal Loans
0
5
10
15
20
25
30
35
Ap
r/1
9
May
/19
Jun
/19
Jul/
19
Au
g/1
9
Sep
/19
Oct
/19
No
v/1
9
De
c/1
9
Jan
/20
Feb
/20
Mar
/20
Ap
r/2
0
Agriculture Credit Industry Credit Services Credit

Markets & Macros Source: Bloomberg, HDFC securities Retail Research
-300000
-200000
-100000
0
100000
200000
300000
400000
Jan
/15
Ap
r/1
5
Jul/
15
Oct
/15
Jan
/16
Ap
r/1
6
Jul/
16
Oct
/16
Jan
/17
Ap
r/1
7
Jul/
17
Oct
/17
Jan
/18
Ap
r/1
8
Jul/
18
Oct
/18
Jan
/19
Ap
r/1
9
Jul/
19
Oct
/19
Jan
/20
Ap
r/2
0
India Current Account Deficit (Rs. 10 mln)
-300000
-200000
-100000
0
100000
200000
300000
400000
Jan
/15
Ap
r/1
5
Jul/
15
Oct
/15
Jan
/16
Ap
r/1
6
Jul/
16
Oct
/16
Jan
/17
Ap
r/1
7
Jul/
17
Oct
/17
Jan
/18
Ap
r/1
8
Jul/
18
Oct
/18
Jan
/19
Ap
r/1
9
Jul/
19
Oct
/19
Jan
/20
Ap
r/2
0
India Fiscal Deficit (Rs.10 mln)
Downgrade As Deficits Deteriorated, Moody’s Downgraded India’s Ratings

Markets & Macros Source: Bloomberg, HDFC securities Retail Research
Liquidity Vs Economic Activity ( Do not Fight the Fed !)
-15
-10
-5
0
5
10
0
1
2
3
4
5
6
7
8
Jun
-15
Au
g-1
5
Oct
-15
Dec
-15
Feb
-16
Ap
r-1
6
Jun
-16
Au
g-1
6
Oct
-16
Dec
-16
Feb
-17
Ap
r-1
7
Jun
-17
Au
g-1
7
Oct
-17
Dec
-17
Feb
-18
Ap
r-1
8
Jun
-18
Au
g-1
8
Oct
-18
Dec
-18
Feb
-19
Ap
r-1
9
Jun
-19
Au
g-1
9
Oct
-19
Dec
-19
Feb
-20
Ap
r-2
0
Mill
ion
s
Money Printing vs Economic Activity
US Condition of All Federal Reserve Banks Total Assets (L1) US Federal Reserve Bank of New York Weekly Economic Index (WEI) (R1)
Despite Lower Economic Activities - Liquidity Is Driving Asset Prices Higher


Disclaimer:This report has been prepared by HDFC Securities Ltd and is meant for sole use by the recipient and not for circulation. The information and opinions contained herein have been compiled or arrived at, based upon information obtained in good faith from sources believed to be reliable. Such information has not been independently verified and no guaranty, representation of warranty, express or implied, is made as to its accuracy, completeness or correctness. All such information and opinions are subject to change without notice. This document is for information purposes only. Descriptions of any company or companies or their securities mentioned herein are not intended to be complete and this document is not, and should not be construed as an offer or solicitation of an offer, to buy or sell any securities or other financial instruments. This report is not directed to, or intended for display, downloading, printing, reproducing or for distribution to or use by, any person or entity who is a citizen or resident or located in any locality, state, country or other jurisdiction where such distribution, publication, reproduction, availability or use would be contrary to law or regulation or what would subject HSL or its affiliates to any registration or licensing requirement within such jurisdiction. If this report is inadvertently sent or has reached any person in such country, especially, United States of America, the same should be ignored and brought to the attention of the sender. This document may not be reproduced, distributed or published in whole or in part, directly or indirectly, for any purposes or in any manner. Foreign currencies denominated securities, wherever mentioned, are subject to exchange rate fluctuations, which could have an adverse effect on their value or price, or the income derived from them. In addition, investors in securities such as ADRs, the values of which are influenced by foreign currencies effectively assume currency risk. It should not be considered to be taken as an offer to sell or a solicitation to buy any security. HSL may from time to time solicit from, or perform broking, or other services for, any company mentioned in this mail and/or its attachments.HSL and its affiliated company(ies), their directors and employees may; (a) from time to time, have a long or short position in, and buy or sell the securities of the company(ies) mentioned herein or (b) be engaged in any other transaction involving such securities and earn brokerage or other compensation or act as a market maker in the financial instruments of the company(ies) discussed herein or act as an advisor or lender/borrower to such company(ies) or may have any other potential conflict of interests with respect to any recommendation and other related information and opinions.HSL, its directors, analysts or employees do not take any responsibility, financial or otherwise, of the losses or the damages sustained due to the investments made or any action taken on basis of this report, including but not restricted to, fluctuation in the prices of shares and bonds, changes in the currency rates, diminution in the NAVs, reduction in the dividend or income, etc.HSL and other group companies, its directors, associates, employees may have various positions in any of the stocks, securities and financial instruments dealt in the report, or may make sell or purchase or other deals in these securities from time to time or may deal in other securities of the companies / organizations described in this report.
HSL or its associates might have managed or co-managed public offering of securities for the subject company or might have been mandated by the subject company for any other assignment in the past twelve months. HSL or its associates might have received any compensation from the companies mentioned in the report during the period preceding twelve months from t date of this report for services in respect of managing or co-managing public offerings, corporate finance, investment banking or merchant banking, brokerage services or other advisory service in a merger or specific transaction in the normal course of business.HSL or its analysts did not receive any compensation or other benefits from the companies mentioned in the report or third party in connection with preparation of the research report. Accordingly, neither HSL nor Research Analysts have any material conflict of interest at the time of publication of this report. Compensation of our Research Analysts is not based on any specific merchant banking, investment banking or brokerage service transactions. HSL may have issued other reports that are inconsistent with and reach different conclusion from the information presented in this report. Research entity has not been engaged in market making activity for the subject company. Research analyst has not served as an officer, director or employee of the subject company. We have not received any compensation/benefits from the subject company or third party in connection with the Research Report.
HDFC securities Limited, I Think Techno Campus, Building - B, "Alpha", Office Floor 8, Near Kanjurmarg Station, Opp. Crompton Greaves, Kanjurmarg (East), Mumbai 400 042 Phone: (022) 3075 3400 Fax: (022) 2496 5066Compliance Officer: Binkle R. Oza Email: [email protected] Phone: (022) 3045 3600
HDFC Securities Limited, SEBI Reg. No.: NSE, BSE, MSEI, MCX: INZ000186937; AMFI Reg. No. ARN: 13549; PFRDA Reg. No. POP: 11092018; IRDA Corporate Agent License No.: CA0062; SEBI Research Analyst Reg. No.: INH000002475; SEBI Investment Adviser Reg. No.: INA000011538; CIN - U67120MH2000PLC152193
Mutual Funds Investments are subject to market risk. Please read the offer and scheme related documents carefully before investing.
Markets & Macros