virtus investment partners - annualreports.com€¦ · virtus investment partners 2014 annual...
TRANSCRIPT

VIR
TU
S IN
VE
ST
ME
NT
PA
RT
NE
RS
20
14
AN
NU
AL
RE
PO
RT
COORDINATED CAPABILITIES SINGULAR FOCUS
2014 ANNUAL REPORT
VIRTUS_0007_Cover_2015_041715R.indd 1 4/17/15 1:08 PM

1 Certain supplemental performance measures are provided in addition to, but not as a substitute for, performance measures determined in accordance with GAAP. These supplemental measures may not be comparable to non-GAAP performance measures of other companies. “Operating Income, as Adjusted” and “Operating Margin, as Adjusted” are supplemental non-GAAP measures that net the distribution and administration expenses against the related revenue and remove certain non-cash and other identified amounts. For our definition of these terms, as well as a reconciliation to GAAP measures, see “Reconciliation of Revenues, Operating Expenses and Operating Income on a GAAP Basis to Revenues, Operating Expenses and Operating Income, as Adjusted” in the Supplemental Financial Information, included as an attachment to this annual report after the Form 10-K. 2 Represents assets under management excluding cash management strategies 3 Includes assets under management related to options strategies 4 Consists of long/short equity, real estate, master-limited partnerships, and other 5 Consists of option strategies
This report may contain forward-looking statements within the meaning of the Private Securities Litigation Reform Act of 1995, which, by their nature, are subject tosignificant risks and uncertainties. Virtus Investment Partners, Inc. intends for these forward-looking statements to be covered by the safe harbor provisions of the federal securities laws relating to forward-looking statements. For a further discussion, see “Forward-Looking Statements” on page 19 of the attached Form 10-K.
Summary of Operations(dollars in millions, except per share data) 2014 2013 ChangeRevenues $ 450.6 $ 389.2 16%
Operating Income $ 130.7 $ 113.5 15%
Operating Income, as Adjusted1 $ 162.8 $ 131.0 24%
Net Income Attributable to Common Stockholders $ 97.7 $ 75.2 30%
Operating Margin 29% 29%
Operating Margin, as Adjusted1 48% 45%
Per Share DataWeighted Average Shares Outstanding – Diluted (in thousands) 9,292 8,433 10%
Earnings per Share – Diluted $ 10.51 $ 8.92 18%
Assets Under Management (dollars in millions)Ending Long-Term Assets Under Management2 $ 56,702.4 $ 56,183.0 1%
By asset category (12/31/2014):
lEquity $ 34,180.7
lFixed Income 16,681.6
lAlternatives4 5,372.4
lOther5 467.7
Total $56,702.4
By product (12/31/2014):
lLong-Term Open-End Mutual Funds $ 36,292.3
lClosed-End Mutual Funds 7,581.4
lVariable Insurance Funds 1,221.9
lSeparately Managed Accounts3 6,884.8
l Institutional Products3 4,722.0
Total $ 56,702.4
Strategic Priorities
> Maintain a highly differentiated set of quality investment
strategies in a variety of product structures from disciplined
boutique managers
> Enhance our distribution capabilities to increase market
share in existing channels and develop opportunities in new
channels
> Enhance and align shared business support services to
maximize the leveragability of the business
> Attract and retain the right talent and individual capabilities
to support the growth and success of the business
> Optimize the business model and capital structure to best
position the firm for continued growth
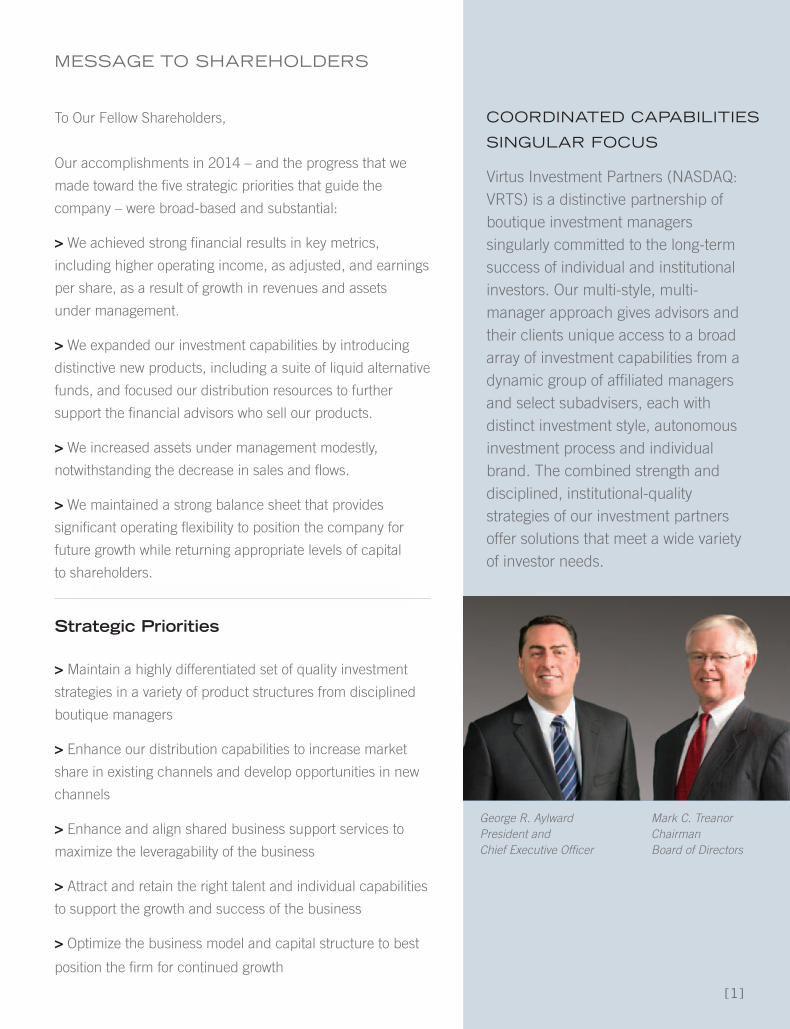
Mark C. Treanor ChairmanBoard of Directors
George R. AylwardPresident andChief Executive Officer
To Our Fellow Shareholders,
Our accomplishments in 2014 – and the progress that we
made toward the five strategic priorities that guide the
company – were broad-based and substantial:
> We achieved strong financial results in key metrics,
including higher operating income, as adjusted, and earnings
per share, as a result of growth in revenues and assets
under management.
> We expanded our investment capabilities by introducing
distinctive new products, including a suite of liquid alternative
funds, and focused our distribution resources to further
support the financial advisors who sell our products.
> We increased assets under management modestly,
notwithstanding the decrease in sales and flows.
> We maintained a strong balance sheet that provides
significant operating flexibility to position the company for
future growth while returning appropriate levels of capital
to shareholders.
MESSAGE TO SHAREHOLDERS
Virtus Investment Partners (NASDAQ: VRTS) is a distinctive partnership of boutique investment managers singularly committed to the long-term success of individual and institutional investors. Our multi-style, multi-manager approach gives advisors and their clients unique access to a broad array of investment capabilities from a dynamic group of affiliated managers and select subadvisers, each with distinct investment style, autonomous investment process and individual brand. The combined strength and disciplined, institutional-quality strategies of our investment partners offer solutions that meet a wide variety of investor needs.
COORDinATED CApAbiLiTiES
SinGuLAR fOCuS
[1]
[2]
Financial Results
In 2014 we achieved significant growth in operating
income, as adjusted, and earnings per share.
Operating income, as adjusted – the non-GAAP
performance measure that we believe best illustrates the
ongoing earnings of the company – was $162.8 million
for 2014, a 24 percent increase from $131.0 million in
2013. The related margin increased to 48 percent from
45 percent. The comparable GAAP metric, operating
income, increased 15 percent to $130.7 million from
$113.5 million in 2013, with a related margin that was
unchanged at 29 percent.1
Net income attributable to common shareholders was
$97.7 million or $10.51 per share, an increase of 30
percent from $75.2 million or $8.92 per share in 2013.
Revenue increased by 16 percent to $450.6 million from
$389.2 million in 2013 as a result of the 13 percent
increase in average long-term assets under management.
Investment Capabilities
A commitment to providing investors with a well-
diversified array of distinctive investment strategies to
address individual preferences and help navigate
changing market cycles is fundamental to our value
proposition, and during 2014 we introduced several
new capabilities:
> The Virtus Alternative Total Solution Fund,
Virtus Alternative Inflation Solution Fund and Virtus
Alternative Income Solution Fund are multi-manager,
multi-strategy open-end mutual funds managed by
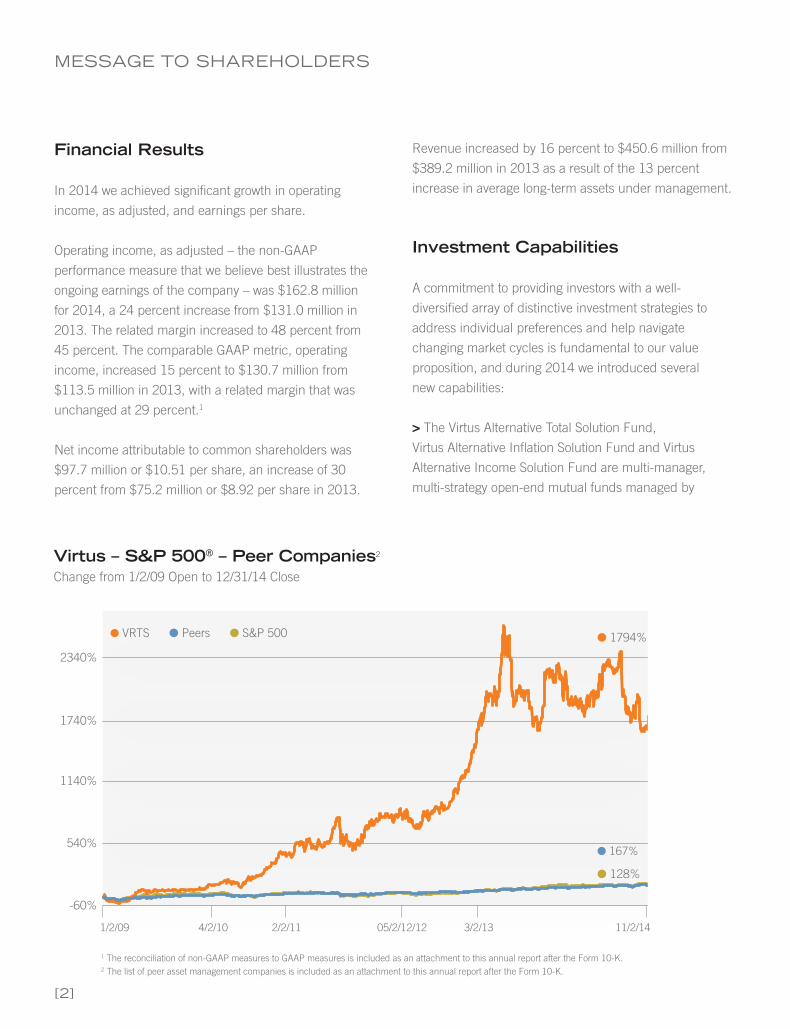
Virtus – S&P 500® – Peer Companies2 Change from 1/2/09 Open to 12/31/14 Close
1 The reconciliation of non-GAAP measures to GAAP measures is included as an attachment to this annual report after the Form 10-K.2 The list of peer asset management companies is included as an attachment to this annual report after the Form 10-K.
1/2/09 4/2/10 2/2/11 11/2/14
2340%
1740%
1140%
540%
-60%
l1794%
l167% l128%
lVRTS lPeers lS&P 500
05/2/12/12 3/2/13
MESSAGE TO SHAREHOLDERS

[3]
1 The reconciliation of non-GAAP measures to GAAP measures is included as an attachment to this annual report after the Form 10-K.2 The list of peer asset management companies is included as an attachment to this annual report after the Form 10-K.
Cliffwater Investments, a new majority-owned affiliate that
is our joint venture with a leading institutional alternatives
consultant. These “liquid alternative” funds offer
individual investors access to the hedge and alternative
strategies that institutional investors have used for years
to buffer their portfolios from the unpredictability of the
financial markets. An education platform for financial
advisors that takes advantage of the experience and
broad reach of our distribution team supported the
introduction of the funds.
> Virtus Strategic Income Fund, which leverages the
broad multi-sector fixed-income capabilities of our
Newfleet Asset Management affiliate, seeks opportunities
across undervalued sectors of the bond market.
> Virtus International Wealth Masters Fund invests in
companies managed by individuals who have a
substantial amount of their personal wealth invested in
the business and mirrors the successful Virtus Wealth
Masters Fund, also managed by Horizon Asset
Management.
> Duff & Phelps Select Energy MLP Fund (NYSE: DSE),
our ninth closed-end fund, raised $485 million in its
initial public offering. Managed by Duff & Phelps
Investment Management, DSE gives clients tax-efficient
exposure to the growing U.S. energy economy.
> We broadened distribution opportunities by adding
institutional share classes to 10 open-end mutual funds
for the defined contribution market and opening the
Virtus GF Multi-Sector Short-Duration Bond Fund, the
first fund on our collective investment platform for
non-U.S. clients.
Strong relative performance remains important to our
product offerings. Twenty-eight of our 34 rated mutual
funds – representing 79 percent of open-end mutual
fund assets – were in 5-, 4-, and 3-star Morningstar-rated
funds (on a load-waived basis) at year-end, with highly
rated funds across all asset classes. On the strength of
our Emerging Markets Opportunities and Foreign
Opportunities funds, Virtus was ranked by Lipper as a top
mutual fund family in the World Equity category of
Barron’s annual survey of fund companies for the second
time in the past four years.3
Distribution
Long-term assets under management, which exclude
money market assets, increased by 1 percent to
$56.7 billion at December 31, 2014 from $56.2 billion
at December 31, 2013, despite lower sales and weaker
flows. Mutual fund assets under management ended
2014 at $36.3 billion, compared with $36.4 billion at
December 31, 2013. Closed-end fund assets under
management grew by 17 percent to $7.6 billion at
December 31, 2014 from $6.5 billion at December 31, 2013.
After multiple years of consistent growth in mutual fund
and total sales and net flows, we were disappointed with
2014 flows. These results were below expectations and
primarily due to elevated mutual fund redemptions for
certain downside-protection and long/short equity
strategies. Total sales were $15.2 billion with net flows
of $(1.2) billion, compared with $21.3 billion and $8.1
billion, respectively, in 2013. Long-term open-end mutual
fund sales were $12.7 billion with net flows of $(0.5)
billion, compared with $19.1 billion in sales and $8.1
billion in net flows in 2013.
3 Additional information about fund performance is included as an attachment to this annual report after the Form 10-K.

Capital and Balance Sheet
Consistently strong financial performance – including five
consecutive years of growth in operating income, as
adjusted – has strengthened our balance sheet,
increased our financial flexibility, allowed us to invest in
the business, and supported our goal of providing a
meaningful return to our shareholders.
> We ended 2014 with cash and investments of $469.5
million or the equivalent of $52.31 per share, an increase
of 18 percent from $398.4 million or $43.75 per share at
the end of 2013. We have no outstanding debt and $75
million of unused capacity on our credit facility.
> Our seed capital portfolio grew to $238.1 million from
$123.6 million at the end of 2013. We invested $130.0
million in the three alternative funds, $30.0 million in
fixed income strategies, and $5.0 million in International
Wealth Masters, among new strategies funded in 2014,
and recycled $52.7 million from successful strategies.
> We initiated a $0.45 per share quarterly cash dividend,
and continued our share repurchase and net share
settlement programs, which combined to return $61.7
million to shareholders – an increase of 127 percent over
2013.
Positioning for the Future
Our diversified product offerings, advisor-focused
distribution approach, strong financial position, and
flexible business model give us the ability to build on
our recent accomplishments to sustain our success.
We began 2015 by further enhancing investment
capabilities. We introduced the Virtus Essential
Resources Fund, managed by Kleinwort Benson
Investors International, which invests in companies
that are focused on infrastructure and technology
projects aimed at meeting the world’s growing need for
water, food, and energy. We developed a new relationship
with Aviva Investors, which will manage a global tactical
asset allocation mutual fund. We made a majority
investment in ETF Issuer Solutions, an early-stage
company that operates a platform for listing, operating,
and distributing exchange-traded funds.
As we look toward 2015 and beyond, we believe Virtus
is well positioned with distinctive products from our
boutique asset management partners. We remain
intensely focused on delivering on our commitment to
provide suitable investment solutions that are the building
blocks of a well-diversified investment portfolio.
We appreciate the trust and confidence our clients have
placed in Virtus and we look forward to continuing to
serve the needs of financial advisors and their clients
while delivering long-term value to our shareholders.
On behalf of the entire board, management team and
staff at Virtus, we thank you for your investment in our
company.
Sincerely,
George R. Aylward Mark C. TreanorPresident and ChairmanChief Executive Officer
[4]

[5]
From left: Timothy A. Holt, Edward M. Swan, Jr., Melody L. Jones, Stephen T. Zarrilli, George R. Aylward, Mark C. Treanor, James R. Baio, Susan S. Fleming, Russel C. Robertson, Diane M. Coffey
bOARD Of DiRECTORS
George R. AylwardPresident and Chief Executive OfficerVirtus Investment Partners
James R. Baio 1,2
Chief Financial Officer, Treasurer and Executive Vice President (Retired)Franklin Templeton Investments
Diane M. Coffey 2,3
Managing Director and PartnerPeter J. Solomon Company, Ltd.
Susan S. Fleming, Ph.D. 3,4
Consultant and Executive Educator
Timothy A. Holt 1,4
Senior Vice President and Chief Investment Officer (Retired)Aetna, Inc.
Melody L. Jones 2
Chief Administrative OfficerCEB
Russel C. Robertson Executive Vice President and Head, Anti-Money LaunderingBMO Financial Group Edward M. Swan, Jr. 1,4
President (Retired)FIS Group
Mark C. Treanor 2,3
Non-Executive Chairman of the Board of DirectorsSenior Partner (Retired)Treanor Pope & Hughes
Stephen T. Zarrilli 1
President and Chief Executive OfficerSafeguard Scientifics, Inc.
Board Committees1 Audit2 Compensation3 Governance4 Risk and Finance

pRinCipAL CORpORATE OffiCERS
From left: Barry M. Mandinach, W. Patrick Bradley, Francis G. Waltman, George R. Aylward, Mardelle W. Peña, Mark S. Flynn, Michael A. Angerthal
George R. AylwardPresident, Chief Executive Officer and Director
Michael A. AngerthalExecutive Vice PresidentChief Financial Officer and Treasurer
W. Patrick BradleySenior Vice PresidentFund Services
Mark S. FlynnExecutive Vice PresidentGeneral Counsel and Corporate Secretary
Barry M. MandinachExecutive Vice PresidentHead of Distribution
Mardelle W. PeñaSenior Vice PresidentHuman Resources
Francis G. WaltmanExecutive Vice PresidentHead of Product Management
[6]

SHAREHOLDER infORMATiOn
Security ListingThe common stock of Virtus Investment Partners, Inc. is traded
on the NASDAQ Global Market under the symbol “VRTS.”
Transfer Agent and RegistrarFor information or assistance regarding your account,
please contact our transfer agent and registrar:
Virtus Investment Partners
c/o Computershare Investor Services
P.O. Box 43078
Providence, RI 02940
Toll-free (within U.S.): 866-205-7273
Foreign Shareowners: 413-775-6091
TDD for Foreign Shareowners: 781-575-2300
Web Site: www.computershare.com/investor
E-mail: [email protected]
Annual Meeting of ShareholdersAll shareholders are invited to attend the annual meeting of Virtus
Investment Partners on Thursday, May 28, 2015, at 10:30 a.m. EDT at
100 Pearl Street, 2nd Floor, Hartford, CT.
For More InformationTo receive additional information about Virtus Investment Partners
and access to other shareholder services, visit Investor Relations in the
“About Us” section of our Web site at www.virtus.com, or contact us at:
Virtus Investment Partners, Inc.
Investor Relations
100 Pearl Street
Hartford, CT 06103
Telephone: 800-248-7971 (Option 2)
Fax: 413-774-1714
e-mail: [email protected]
Affiliated Companies
Duff & Phelps Investment Management Co.200 S. Wacker DriveSuite 500Chicago, IL 60606312-263-2610
Cliffwater Investments LLC100 Pearl StreetHartford, CT 06103860-263-4707
Euclid Advisors LLC1540 BroadwaySuite 1600New York, NY 10036646-376-5913
Kayne Anderson Rudnick Investment Management, LLC1800 Avenue of the StarsSecond FloorLos Angeles, CA 90067800-231-7414
Newfleet Asset Management, LLC100 Pearl StreetHartford, CT 06103860-760-5828
Newfound Investments, LLC100 Pearl StreetHartford, CT 06103860-263-4707
Rampart Investment Management Co., Inc.One International PlaceBoston, MA 02110617-342-6900
Zweig Advisers LLC1540 BroadwayNew York, NY 10036800-272-2700
For more information on the Virtus Mutual Funds or other products, call your financial representative or visit our Web site at www.virtus.com.

VIR
TU
S IN
VE
ST
ME
NT
PA
RT
NE
RS
20
14
AN
NU
AL
RE
PO
RT
COORDINATED CAPABILITIES SINGULAR FOCUS
2014 ANNUAL REPORT
VIRTUS_0007_Cover_2015_041715R.indd 1 4/17/15 1:08 PM

2014 FORM 10-K

UNITED STATESSECURITIES AND EXCHANGE COMMISSION
Washington, D.C. 20549
FORM 10-KÈ ANNUAL REPORT PURSUANT TO SECTION 13 OR 15(d) OF THE SECURITIES EXCHANGE ACT OF 1934
For the fiscal year ended December 31, 2014
or‘ TRANSITION REPORT PURSUANT TO SECTION 13 OR 15(d) OF THE SECURITIES EXCHANGE ACT OF 1934
For the transition period from to
Commission file number 1-10994
VIRTUS INVESTMENT PARTNERS, INC.(Exact name of registrant as specified in its charter)
Delaware 95-4191764(State or other jurisdiction of
incorporation or organization)(I.R.S. Employer
Identification No.)
100 Pearl St., Hartford, CT 06103(Address of principal executive offices)
Registrant’s telephone number, including area code(800) 248-7971
Securities registered pursuant to Section 12(b) of the Act:Title of each class Name of each exchange on which registered
Common Stock, $.01 par value The NASDAQ Stock Market LLC(including attached Preferred Share Purchase Rights)
Securities registered pursuant to Section 12(g) of the Act:None
(Title of class)
Indicate by check mark if the registrant is a well-known seasoned issuer, as defined in Rule 405 of the Securities Act. È Yes ‘ NoIndicate by check mark if the registrant is not required to file reports pursuant to Section 13 or Section 15(d) of the Exchange Act. ‘ Yes È NoIndicate by check mark whether the registrant (1) has filed all reports required to be filed by Section 13 or 15(d) of the Securities Exchange Act of
1934 during the preceding 12 months (or for such shorter period that the registrant was required to file such reports), and (2) has been subject to suchfiling requirements for the past 90 days. È Yes ‘ No
Indicate by check mark whether the registrant has submitted electronically and posted on its corporate Web site, if any, every Interactive Data Filerequired to be submitted and posted pursuant to Rule 405 of Regulation S-T (§232.405 of this chapter) during the preceding 12 months (or for suchshorter period that the registrant was required to submit and post such files). È Yes ‘ No
Indicate by check mark if disclosure of delinquent filers pursuant to Item 405 of Regulation S-K (§229.405 of this chapter) is not containedherein, and will not be contained, to the best of registrant’s knowledge, in definitive proxy or information statements incorporated by reference inPart III of this Form 10-K or any amendment to this Form 10-K. ‘
Indicate by check mark whether the registrant is a large accelerated filer, an accelerated filer, a non-accelerated filer, or a smaller reportingcompany. See definitions of “large accelerated filer,” “accelerated filer” and “smaller reporting company” in Rule 12b-2 of the Exchange Act.
Large accelerated filer È Accelerated filer ‘
Non-accelerated filer ‘ (Do not check if a smaller reporting company) Smaller reporting company ‘
Indicate by check mark whether the registrant is a shell company (as defined in Rule 12b-2 of the Act). ‘ Yes È NoThe aggregate market value of the registrant’s voting and non-voting common equity held by non-affiliates computed by reference to the price at
which the common equity was last sold (based on the closing share price as quoted on the NASDAQ Global Market) as of the last business day of theregistrant’s most recently completed second fiscal quarter was $1,535,144,421. For purposes of this calculation, shares of common stock held orcontrolled by executive officers and directors of the registrant have been treated as shares held by affiliates.
There were 8,977,784 shares of the registrant’s common stock outstanding on February 12, 2015.
DOCUMENTS INCORPORATED BY REFERENCEPortions of the registrant’s Proxy Statement which will be filed with the SEC in connection with the 2015 Annual Meeting of Shareholders are
incorporated by reference into Part III of this Form 10-K.
Virtus Investment Partners, Inc.
Annual Report on Form 10-K for the Fiscal Year Ended December 31, 2014
Page
PART I
Item 1. Business . . . . . . . . . . . . . . . . . . . . . . . . . . . . . . . . . . . . . . . . . . . . . . . . . . . . . . . . . . . . . . . . . . . . . 1Item 1A. Risk Factors . . . . . . . . . . . . . . . . . . . . . . . . . . . . . . . . . . . . . . . . . . . . . . . . . . . . . . . . . . . . . . . . . . 11Item 1B. Unresolved Staff Comments . . . . . . . . . . . . . . . . . . . . . . . . . . . . . . . . . . . . . . . . . . . . . . . . . . . . . 19Item 2. Properties . . . . . . . . . . . . . . . . . . . . . . . . . . . . . . . . . . . . . . . . . . . . . . . . . . . . . . . . . . . . . . . . . . . . 19Item 3. Legal Proceedings . . . . . . . . . . . . . . . . . . . . . . . . . . . . . . . . . . . . . . . . . . . . . . . . . . . . . . . . . . . . . 19Item 4. Mine Safety Disclosures . . . . . . . . . . . . . . . . . . . . . . . . . . . . . . . . . . . . . . . . . . . . . . . . . . . . . . . . 20
PART II
Item 5. Market for the Registrant’s Common Equity, Related Stockholder Matters and IssuerPurchases of Equity Securities. . . . . . . . . . . . . . . . . . . . . . . . . . . . . . . . . . . . . . . . . . . . . . . . . . . . 21
Item 6. Selected Financial Data . . . . . . . . . . . . . . . . . . . . . . . . . . . . . . . . . . . . . . . . . . . . . . . . . . . . . . . . . 23Item 7. Management’s Discussion and Analysis of Financial Condition and Results of Operations . . . . 24Item 7A. Quantitative and Qualitative Disclosures About Market Risk . . . . . . . . . . . . . . . . . . . . . . . . . . . 43Item 8. Financial Statements and Supplementary Data . . . . . . . . . . . . . . . . . . . . . . . . . . . . . . . . . . . . . . . 43Item 9. Changes in and Disagreements with Accountants on Accounting and Financial Disclosure . . . . 43Item 9A. Controls and Procedures . . . . . . . . . . . . . . . . . . . . . . . . . . . . . . . . . . . . . . . . . . . . . . . . . . . . . . . . 43Item 9B. Other Information . . . . . . . . . . . . . . . . . . . . . . . . . . . . . . . . . . . . . . . . . . . . . . . . . . . . . . . . . . . . . 45
PART III
Item 10. Directors, Executive Officers and Corporate Governance . . . . . . . . . . . . . . . . . . . . . . . . . . . . . . 46Item 11. Executive Compensation . . . . . . . . . . . . . . . . . . . . . . . . . . . . . . . . . . . . . . . . . . . . . . . . . . . . . . . . 46Item 12. Security Ownership of Certain Beneficial Owners and Management and Related Stockholder
Matters . . . . . . . . . . . . . . . . . . . . . . . . . . . . . . . . . . . . . . . . . . . . . . . . . . . . . . . . . . . . . . . . . . . . . . 46Item 13. Certain Relationships and Related Transactions, and Director Independence . . . . . . . . . . . . . . . 47Item 14. Principal Accounting Fees and Services . . . . . . . . . . . . . . . . . . . . . . . . . . . . . . . . . . . . . . . . . . . . 47
PART IV
Item 15. Exhibits, Financial Statement Schedules . . . . . . . . . . . . . . . . . . . . . . . . . . . . . . . . . . . . . . . . . . . 48
“We,” “us,” “our,” the “Company” and “Virtus” as used in this Annual Report on Form 10-K (“AnnualReport”), refer to Virtus Investment Partners, Inc., a Delaware corporation, and its subsidiaries.

PART I
Item 1. Business.
Organization
Virtus Investment Partners, Inc. (the “Company”) commenced operations on November 1, 1995 through areverse merger with Duff & Phelps Corporation. The Company was a majority-owned subsidiary of The PhoenixCompanies, Inc. (“PNX”) from 1995 to 2001 and a wholly-owned subsidiary of PNX from 2001 until 2008. OnDecember 31, 2008, PNX distributed 100% of Virtus common stock to PNX stockholders in a spin-offtransaction.
Our Business
We are a provider of investment management and related services to individuals and institutions. We use amulti-manager, multi-style approach, offering investment strategies from affiliated managers and selectunaffiliated subadvisors, each having its own distinct investment style, autonomous investment process andindividual brand. By offering a broad array of products, we believe we can appeal to a greater number ofinvestors, which allows us to have opportunities across market cycles and through changes in investorpreferences.
We provide our products in a number of forms and through multiple distribution channels. Our retailproducts include open-end mutual funds, closed-end funds, variable insurance funds and separately managedaccounts. Our open-end mutual funds are distributed through intermediaries. Our closed-end funds trade on theNew York Stock Exchange. Our variable insurance funds are available as investment options in variableannuities and life insurance products distributed by life insurance companies. Separately managed accounts arecomprised of intermediary programs, sponsored and distributed by unaffiliated brokerage firms, and privateclient accounts, which are offered to the high net-worth clients of our affiliated managers. We also manageinstitutional accounts for corporations, multi-employer retirement funds, public employee retirement systems,foundations, endowments and as a subadviser to unaffiliated mutual funds. Our earnings are primarily driven byasset-based fees charged for services relating to these products including investment management, fundadministration, distribution and shareholder services. These fees are based on a percentage of assets undermanagement (“AUM”) and are calculated using daily or weekly average assets, quarter-end assets or averagemonth-end assets.
Our Investment Managers
Our investment management services are provided by investment managers who are registered investmentadvisers under the Investment Advisers Act of 1940, as amended (the “Investment Advisers Act”). Theinvestment managers are responsible for portfolio management activities for our retail and institutional productsoperating under advisory or subadvisory agreements. We provide our affiliated managers with distribution,operational and administrative support, thereby allowing each affiliated manager to focus primarily oninvestment management. We also engage select unaffiliated subadvisers for certain of our open-end mutualfunds, separately managed accounts and variable insurance funds. At December 31, 2014, $21.6 billion or 38.1%of our assets under management were managed by unaffiliated subadvisers. We monitor the quality of ourmanagers’ services by assessing their performance, style, consistency and the discipline with which they applytheir investment process.
1

Our affiliated investment managers and their respective assets under management, styles and strategies are as follows:
Affiliated Managers
Duff & PhelpsInvestment
Management
NewfleetAsset
Management
KayneAndersonRudnick
InvestmentManagement
Zweig/EuclidAdvisors
RampartInvestment
ManagementNewfound
InvestmentsCliffwater
Investments
AUM atDecember 31, 2014($ in billions) $10.8 $12.5 $9.3 $1.7 $0.6 $ — $0.2
Location Chicago, IL Hartford, CT Los Angeles, CA New York, NY Boston, MA Hartford, CT Hartford, CT
Investment Style Quality-oriented,equity income;
high quality fixedincome
Multi-sector,value-drivenfixed income
Quality at areasonable price
Growth at areasonable price,
high qualityfixed income
Systematic,disciplined
options solutions
Quantitative,tactical model
driven portfolios
Multi-manageralternativeportfolios
Investment TypesEquities • Utilities • Large, Mid &
Small CapCore/ Growth/Value
• Large CapCore
• Large CapCore
• Domestic andInternational
• Tactical AssetAllocation
• LowVolatility
• International &EmergingMarketsSmall-Cap
• International
Fixed Income • TaxAdvantaged
• High GradeCore
• Municipals
• Multi-sector• Core• Core Plus• Bank Loans• High Yield• Municipals• Emerging
Markets
• CaliforniaMunicipals
• U.S.GovernmentGrade Agencies
• Core Plus
• IntermediateTotal Return &Government
• InvestmentGradeCorporates
• Sovereign
Alternative/Other • REITs• Infrastructure• MLPs
• OptionsStrategies
• Multi-Strategy
Products
Open-EndMutual Funds ✓ ✓ ✓ ✓ ✓ ✓ ✓
Closed-EndFunds ✓ ✓ ✓ ✓
VariableInsurance Funds ✓ ✓ ✓ ✓
SeparatelyManagedAccounts ✓ ✓ ✓ ✓
Institutional ✓ ✓ ✓ ✓ ✓
2

Our Investment Products
Our assets under management are comprised of open-end mutual funds, closed-end funds, variableinsurance funds, separately managed accounts (intermediary sponsored and private client) and institutionalaccounts (traditional institutional mandates and structured products).
Assets Under Management by Product as of December 31, 2014($ in billions)
Retail ProductsMutual fund assets
Open-end mutual funds . . . . . . . . . . . . . . . . . . . . . . . . . . . . . . . . . . . . . . . . . . . . . . . . $36.3Closed-end funds . . . . . . . . . . . . . . . . . . . . . . . . . . . . . . . . . . . . . . . . . . . . . . . . . . . . . 7.6
Total mutual fund assets . . . . . . . . . . . . . . . . . . . . . . . . . . . . . . . . . . . . . . . . . . . . . . . . . . . 43.9Separately managed accounts . . . . . . . . . . . . . . . . . . . . . . . . . . . . . . . . . . . . . . . . . . . . . . . 6.9Variable insurance funds . . . . . . . . . . . . . . . . . . . . . . . . . . . . . . . . . . . . . . . . . . . . . . . . . . . 1.2
Total retail assets . . . . . . . . . . . . . . . . . . . . . . . . . . . . . . . . . . . . . . . . . . . . . . . . . . . . . . . . 52.0Total institutional assets . . . . . . . . . . . . . . . . . . . . . . . . . . . . . . . . . . . . . . . . . . . . . . . . . . 4.7
Total AUM . . . . . . . . . . . . . . . . . . . . . . . . . . . . . . . . . . . . . . . . . . . . . . . . . . . . . . . . . . . . . $56.7
3
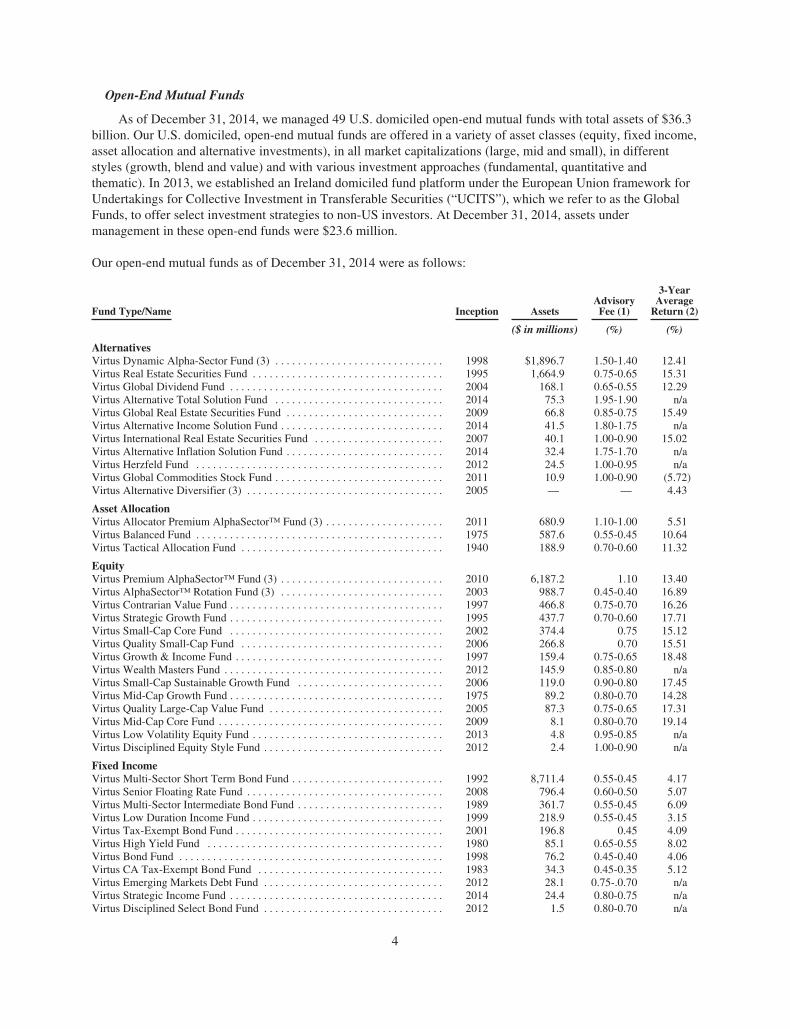
Open-End Mutual Funds
As of December 31, 2014, we managed 49 U.S. domiciled open-end mutual funds with total assets of $36.3billion. Our U.S. domiciled, open-end mutual funds are offered in a variety of asset classes (equity, fixed income,asset allocation and alternative investments), in all market capitalizations (large, mid and small), in differentstyles (growth, blend and value) and with various investment approaches (fundamental, quantitative andthematic). In 2013, we established an Ireland domiciled fund platform under the European Union framework forUndertakings for Collective Investment in Transferable Securities (“UCITS”), which we refer to as the GlobalFunds, to offer select investment strategies to non-US investors. At December 31, 2014, assets undermanagement in these open-end funds were $23.6 million.
Our open-end mutual funds as of December 31, 2014 were as follows:
Fund Type/Name Inception AssetsAdvisoryFee (1)
3-YearAverage
Return (2)
($ in millions) (%) (%)
AlternativesVirtus Dynamic Alpha-Sector Fund (3) . . . . . . . . . . . . . . . . . . . . . . . . . . . . . . 1998 $1,896.7 1.50-1.40 12.41Virtus Real Estate Securities Fund . . . . . . . . . . . . . . . . . . . . . . . . . . . . . . . . . . 1995 1,664.9 0.75-0.65 15.31Virtus Global Dividend Fund . . . . . . . . . . . . . . . . . . . . . . . . . . . . . . . . . . . . . . 2004 168.1 0.65-0.55 12.29Virtus Alternative Total Solution Fund . . . . . . . . . . . . . . . . . . . . . . . . . . . . . . 2014 75.3 1.95-1.90 n/aVirtus Global Real Estate Securities Fund . . . . . . . . . . . . . . . . . . . . . . . . . . . . 2009 66.8 0.85-0.75 15.49Virtus Alternative Income Solution Fund . . . . . . . . . . . . . . . . . . . . . . . . . . . . . 2014 41.5 1.80-1.75 n/aVirtus International Real Estate Securities Fund . . . . . . . . . . . . . . . . . . . . . . . 2007 40.1 1.00-0.90 15.02Virtus Alternative Inflation Solution Fund . . . . . . . . . . . . . . . . . . . . . . . . . . . . 2014 32.4 1.75-1.70 n/aVirtus Herzfeld Fund . . . . . . . . . . . . . . . . . . . . . . . . . . . . . . . . . . . . . . . . . . . . 2012 24.5 1.00-0.95 n/aVirtus Global Commodities Stock Fund . . . . . . . . . . . . . . . . . . . . . . . . . . . . . . 2011 10.9 1.00-0.90 (5.72)Virtus Alternative Diversifier (3) . . . . . . . . . . . . . . . . . . . . . . . . . . . . . . . . . . . 2005 — — 4.43
Asset AllocationVirtus Allocator Premium AlphaSector™ Fund (3) . . . . . . . . . . . . . . . . . . . . . 2011 680.9 1.10-1.00 5.51Virtus Balanced Fund . . . . . . . . . . . . . . . . . . . . . . . . . . . . . . . . . . . . . . . . . . . . 1975 587.6 0.55-0.45 10.64Virtus Tactical Allocation Fund . . . . . . . . . . . . . . . . . . . . . . . . . . . . . . . . . . . . 1940 188.9 0.70-0.60 11.32
EquityVirtus Premium AlphaSector™ Fund (3) . . . . . . . . . . . . . . . . . . . . . . . . . . . . . 2010 6,187.2 1.10 13.40Virtus AlphaSector™ Rotation Fund (3) . . . . . . . . . . . . . . . . . . . . . . . . . . . . . 2003 988.7 0.45-0.40 16.89Virtus Contrarian Value Fund . . . . . . . . . . . . . . . . . . . . . . . . . . . . . . . . . . . . . . 1997 466.8 0.75-0.70 16.26Virtus Strategic Growth Fund . . . . . . . . . . . . . . . . . . . . . . . . . . . . . . . . . . . . . . 1995 437.7 0.70-0.60 17.71Virtus Small-Cap Core Fund . . . . . . . . . . . . . . . . . . . . . . . . . . . . . . . . . . . . . . 2002 374.4 0.75 15.12Virtus Quality Small-Cap Fund . . . . . . . . . . . . . . . . . . . . . . . . . . . . . . . . . . . . 2006 266.8 0.70 15.51Virtus Growth & Income Fund . . . . . . . . . . . . . . . . . . . . . . . . . . . . . . . . . . . . . 1997 159.4 0.75-0.65 18.48Virtus Wealth Masters Fund . . . . . . . . . . . . . . . . . . . . . . . . . . . . . . . . . . . . . . . 2012 145.9 0.85-0.80 n/aVirtus Small-Cap Sustainable Growth Fund . . . . . . . . . . . . . . . . . . . . . . . . . . 2006 119.0 0.90-0.80 17.45Virtus Mid-Cap Growth Fund . . . . . . . . . . . . . . . . . . . . . . . . . . . . . . . . . . . . . . 1975 89.2 0.80-0.70 14.28Virtus Quality Large-Cap Value Fund . . . . . . . . . . . . . . . . . . . . . . . . . . . . . . . 2005 87.3 0.75-0.65 17.31Virtus Mid-Cap Core Fund . . . . . . . . . . . . . . . . . . . . . . . . . . . . . . . . . . . . . . . . 2009 8.1 0.80-0.70 19.14Virtus Low Volatility Equity Fund . . . . . . . . . . . . . . . . . . . . . . . . . . . . . . . . . . 2013 4.8 0.95-0.85 n/aVirtus Disciplined Equity Style Fund . . . . . . . . . . . . . . . . . . . . . . . . . . . . . . . . 2012 2.4 1.00-0.90 n/a
Fixed IncomeVirtus Multi-Sector Short Term Bond Fund . . . . . . . . . . . . . . . . . . . . . . . . . . . 1992 8,711.4 0.55-0.45 4.17Virtus Senior Floating Rate Fund . . . . . . . . . . . . . . . . . . . . . . . . . . . . . . . . . . . 2008 796.4 0.60-0.50 5.07Virtus Multi-Sector Intermediate Bond Fund . . . . . . . . . . . . . . . . . . . . . . . . . . 1989 361.7 0.55-0.45 6.09Virtus Low Duration Income Fund . . . . . . . . . . . . . . . . . . . . . . . . . . . . . . . . . . 1999 218.9 0.55-0.45 3.15Virtus Tax-Exempt Bond Fund . . . . . . . . . . . . . . . . . . . . . . . . . . . . . . . . . . . . . 2001 196.8 0.45 4.09Virtus High Yield Fund . . . . . . . . . . . . . . . . . . . . . . . . . . . . . . . . . . . . . . . . . . 1980 85.1 0.65-0.55 8.02Virtus Bond Fund . . . . . . . . . . . . . . . . . . . . . . . . . . . . . . . . . . . . . . . . . . . . . . . 1998 76.2 0.45-0.40 4.06Virtus CA Tax-Exempt Bond Fund . . . . . . . . . . . . . . . . . . . . . . . . . . . . . . . . . 1983 34.3 0.45-0.35 5.12Virtus Emerging Markets Debt Fund . . . . . . . . . . . . . . . . . . . . . . . . . . . . . . . . 2012 28.1 0.75-.0.70 n/aVirtus Strategic Income Fund . . . . . . . . . . . . . . . . . . . . . . . . . . . . . . . . . . . . . . 2014 24.4 0.80-0.75 n/aVirtus Disciplined Select Bond Fund . . . . . . . . . . . . . . . . . . . . . . . . . . . . . . . . 2012 1.5 0.80-0.70 n/a
4

Fund Type/Name Inception AssetsAdvisoryFee (1)
3-YearAverage
Return (2)
($ in millions) (%) (%)
International/GlobalVirtus Emerging Markets Opportunities Fund . . . . . . . . . . . . . . . . . . . . . . . . . 1999 8,557.9 1.00-0.95 5.83Virtus Foreign Opportunities Fund . . . . . . . . . . . . . . . . . . . . . . . . . . . . . . . . . . 1990 1,892.3 0.85-0.75 9.24Virtus Global Premium AlphaSector™ Fund (3) . . . . . . . . . . . . . . . . . . . . . . . 2011 182.2 1.10-1.00 7.53Virtus Global Opportunities Fund . . . . . . . . . . . . . . . . . . . . . . . . . . . . . . . . . . . 1960 133.6 0.85-0.75 13.76Virtus Emerging Markets Equity Income Fund . . . . . . . . . . . . . . . . . . . . . . . . . 2012 77.3 1.05-1.00 n/aVirtus International Small-Cap Fund . . . . . . . . . . . . . . . . . . . . . . . . . . . . . . . . . 2012 37.1 1.00-0.95 n/aVirtus Greater European Opportunities Fund . . . . . . . . . . . . . . . . . . . . . . . . . . 2009 15.6 0.85-0.80 10.45Virtus International Equity Fund . . . . . . . . . . . . . . . . . . . . . . . . . . . . . . . . . . . . 2010 10.3 0.85-0.75 8.66Virtus Emerging Markets Small Cap Fund . . . . . . . . . . . . . . . . . . . . . . . . . . . . 2013 5.0 1.20-1.15 n/aVirtus International Wealth Masters Fund . . . . . . . . . . . . . . . . . . . . . . . . . . . . . 2014 4.9 0.90-0.85 n/aVirtus Disciplined Select Country Fund . . . . . . . . . . . . . . . . . . . . . . . . . . . . . . 2012 1.4 1.10-1.00 n/a
Global FundsVirtus GF Multi-Sector Short Duration Bond Fund . . . . . . . . . . . . . . . . . . . . . 2013 20.0 1.75-0.55 n/aVirtus GF U.S. Small Cap Focus Fund . . . . . . . . . . . . . . . . . . . . . . . . . . . . . . . 2014 3.6 2.15-0.80 n/a
$36,292.3
(1) Percentage of average daily net assets of each fund. The percentages listed represent the range ofmanagement advisory fees paid by the funds, from the highest to the lowest. A range indicates that the fundhas breakpoints at which management advisory fees decrease as assets in the funds increase. We paysubadvisory fees on funds managed by unaffiliated subadvisers, which are not reflected in the percentageslisted.
(2) Represents average annual total return performance of the largest share class as measured by net assets forwhich performance data is available.
(3) This fund invests in other Virtus open-end mutual funds and/or unaffiliated exchange traded funds. Therelated assets invested in other Virtus open-end mutual funds are reflected only in the balances of therespective funds.
Past performance does not guarantee future results. Investment return and principal value will fluctuate sothat shares, when redeemed, may be worth more or less than their original cost.
5

Closed-End Funds
We managed nine closed-end funds as of December 31, 2014, each of which is traded on the New YorkStock Exchange, with aggregate assets of $7.6 billion. Closed-end funds do not continually offer to sell andredeem their shares; rather, daily liquidity is provided by the ability to trade the shares of these funds at pricesthat may be above or below the shares’ net asset value.
Our closed-end funds as of December 31, 2014 are as follows:
Fund Type/Name AssetsAdvisory
Fee
($ in billions) %
BalancedDNP Select Income Fund Inc. . . . . . . . . . . . . . . . . $3.8 0.60-0.50 (1)Zweig Total Return Fund Inc. . . . . . . . . . . . . . . . . 0.5 0.70(2)Virtus Total Return Fund . . . . . . . . . . . . . . . . . . . 0.2 0.85(2)
EquityDuff & Phelps Global Utility Income Fund
Inc. . . . . . . . . . . . . . . . . . . . . . . . . . . . . . . . . . . . 1.2 1.00(2)(3)Zweig Fund Inc. . . . . . . . . . . . . . . . . . . . . . . . . . . 0.4 0.85(2)
AlternativesDuff & Phelps Select Energy MLP Fund . . . . . . . 0.6 1.00(2)
Fixed IncomeDuff & Phelps Utility and Corporate Bond Trust
Inc. . . . . . . . . . . . . . . . . . . . . . . . . . . . . . . . . . . . 0.4 0.50(1)Virtus Global Multi-Sector Income Fund . . . . . . . 0.3 0.95(2)DTF Tax-Free Income Inc. . . . . . . . . . . . . . . . . . . 0.2 0.50(1)
Total Closed-End Funds . . . . . . . . . . . . . . . . . . . $7.6
(1) Percentage of average weekly net assets. The percentage listed represents the range of management advisoryfees paid by the funds, from the highest to the lowest. A range indicates that the fund has breakpoints atwhich management advisory fees decrease as assets in the fund increase.
(2) Percentage of average daily net assets of each fund.(3) The adviser has contractually agreed to waive a portion of its fee for a period of time, which is not reflected
in the percentage listed.
Separately Managed Accounts
Separately managed accounts are individually owned portfolios that include intermediary sponsoredprograms, whereby an intermediary assists individuals in hiring investment managers that have been approved bythe broker-dealer to fulfill those objectives and private client accounts that are accounts of high net-worthindividuals who are direct clients of our affiliated managers. Separately managed account assets totaled $6.9billion at December 31, 2014.
Variable Insurance Funds
Our variable insurance funds are available as investment options in variable annuities and life insuranceproducts distributed by life insurance companies.
6

Our variable insurance funds as of December 31, 2014 were as follows:
Fund Type/Name AssetsAdvisoryFee (1)
($ in billions) %
EquityVirtus International Series . . . . . . . . . . . . . . . . . . . $0.3 0.75-0.65Virtus Capital Growth Series . . . . . . . . . . . . . . . . . 0.2 0.70-0.60Virtus Growth and Income Series . . . . . . . . . . . . . 0.1 0.70-0.60Virtus Small-Cap Growth Series . . . . . . . . . . . . . . 0.1 0.85Virtus Real Estate Securities Series . . . . . . . . . . . . 0.1 0.75-0.65Virtus Small-Cap Value Series . . . . . . . . . . . . . . . 0.1 0.90
Fixed IncomeVirtus Multi-Sector Fixed Income Series . . . . . . . 0.2 0.50-0.40
Asset AllocationVirtus Strategic Allocation Series . . . . . . . . . . . . . 0.1 0.60-0.50
Total Variable Insurance Funds . . . . . . . . . . . . . $1.2
(1) Percentage of average daily net assets of each fund. The percentage listed represents the range ofmanagement advisory fees paid by the funds, from the highest to the lowest. A range indicates that the fundhas breakpoints at which management advisory fees decrease as assets in the fund increase. Subadvisoryfees paid on funds managed by unaffiliated subadvisers are not reflected in the percentages listed.
Institutional Accounts
We offer a variety of equity and fixed income strategies to institutional clients, including corporations,multi-employer retirement funds, public employee retirement systems, foundations, endowments and as asubadviser to unaffiliated mutual funds. Our institutional assets under management totaled $4.7 billion as ofDecember 31, 2014.
Our Investment Management, Administration and Transfer Agent Fees
Our investment management fees, administration fees and transfer agent fees earned in each of the last threeyears were as follows:
Years Ended December 31,
2014 2013 2012
($ in thousands)
Investment management fees:Open-end mutual funds . . . . . . . . . . . . . . . . . . . . . . . . . . . . $196,221 $166,596 $109,327Closed-end funds . . . . . . . . . . . . . . . . . . . . . . . . . . . . . . . . . 46,659 39,921 35,361Variable insurance funds . . . . . . . . . . . . . . . . . . . . . . . . . . . 6,475 7,347 6,388Separately managed accounts . . . . . . . . . . . . . . . . . . . . . . . . 35,152 31,510 23,245Institutional accounts . . . . . . . . . . . . . . . . . . . . . . . . . . . . . . 16,156 15,183 13,554
Total investment management fees . . . . . . . . . . . . . . . 300,663 260,557 187,875Administration fees . . . . . . . . . . . . . . . . . . . . . . . . . . . . . . . 39,374 33,736 23,646Transfer agent fees . . . . . . . . . . . . . . . . . . . . . . . . . . . . . . . . 16,642 14,449 10,133
Total . . . . . . . . . . . . . . . . . . . . . . . . . . . . . . . . . . . . . . . . . . . $356,679 $308,742 $221,654
Investment Management Fees
We provide investment management services pursuant to investment management agreements through ouraffiliated investment advisers (each, an “Adviser”). With respect to our open-end mutual funds, closed-end fundsand variable insurance funds, the Adviser provides overall management services to a fund, subject to supervision
7

by the fund’s board of directors, pursuant to agreements that must be approved annually by each fund’s board ofdirectors and which may be terminated by either party upon written notice, or automatically, in certain situations,such as a “change in control” of the Adviser. We earn fees based on each fund’s average daily or weekly netassets with most fee schedules providing for rate declines or “breakpoints” as asset levels increase to certainthresholds. For funds managed by a subadviser, the agreement provides that the subadviser manage the day-to-day investment management of the fund’s portfolio and receive a management fee from the Adviser based on thepercentage of average daily net assets in the funds they subadvise or a percentage of the Adviser’s managementfee. Each fund bears all expenses associated with its operations. In some cases, to the extent total fund expensesexceed a specified percentage of a fund’s average net assets, the Adviser has agreed to reimburse the funds forsuch excess expenses or voluntarily waive a portion of its fee for a period of time.
For separately managed accounts and institutional accounts, fees are negotiated and are based primarily onasset size, portfolio complexity and individual client requests.
Administration Fees
We provide fund administration services to our open-end mutual funds, variable insurance funds and certainof our closed-end funds. We earn fees based on each fund’s average daily or weekly net assets. Administrativeservices include recordkeeping, preparing and filing documents required to comply with federal and statesecurities laws, legal administration and compliance services, supervising the activities of the funds’ otherservice providers, providing assistance with fund shareholder meetings, tax services and treasury services as wellas providing office space, equipment and personnel that may be necessary for managing and administering thebusiness affairs of the funds.
Transfer Agent Fees
We provide shareholder services to our open-end mutual funds. We earn fees based on each fund’s averagedaily net assets. Shareholder services include maintaining shareholder accounts, processing shareholdertransactions, preparing filings and performing necessary reporting, among other things. We engage third-partyservice providers to perform certain aspects of the shareholder services.
Our Distribution Services
We distribute our open-end mutual funds through financial intermediaries. We have broad access in theretail market, with distribution partners that include national and regional broker-dealers and independentfinancial advisory firms. Our sales efforts are supported by regional sales professionals, a national accountrelationship group and separate teams for the retirement and insurance markets.
Our separately managed accounts are distributed through financial intermediaries and directly by teams atour affiliated managers. Our institutional distribution strategy is an affiliate-centric model. Through relationshipswith consultants, they target key market segments, including foundations and endowments, corporate, public andprivate pension plans and subadvisory accounts.
Our Broker-Dealer Services
VP Distributors, LLC (“VPD”), a wholly-owned subsidiary of the Company, is a broker-dealer registeredunder the Securities Exchange Act of 1934, as amended (the “Exchange Act”), and is a member of the FinancialIndustry Regulatory Authority (“FINRA”). VPD serves as principal underwriter and distributor of our open-endmutual funds and our separately managed accounts. Open-end mutual fund shares are distributed by VPD undersales agreements with unaffiliated financial intermediaries. VPD also markets advisory services to sponsors ofseparately managed account programs.
8
Our Competition
We face significant competition from a wide variety of financial institutions, including other investmentmanagement companies, as well as from proprietary products offered by our distribution partners such as banks,broker-dealers and financial planning firms. Competition in our businesses is based on several factors includinginvestment performance, access to distribution channels, service to financial advisers and their clients and feescharged. Our competitors, many of which are larger than we are, often offer similar products, use similardistribution sources, may offer less expensive products, may have greater access to key distribution channels andmay have greater resources than we do.
Our Regulatory Matters
We are subject to regulation by the Securities and Exchange Commission (“SEC”), FINRA and otherfederal and state agencies and self-regulatory organizations. Each affiliated manager and unaffiliated subadviseris registered with the SEC under the Investment Advisers Act. Each open-end mutual fund, closed-end fund andeach series of our variable insurance fund is registered with the SEC under the Investment Company Act of 1940.Our Global Funds are subject to regulation by the Central Bank of Ireland (“CBI”). The Global Funds and eachinvestment manager and sub-investment manager to the Global Funds are registered with the CBI.
The financial services industry is highly regulated and failure to comply with related laws and regulationscan result in the revocation of registrations, the imposition of censures or fines and the suspension or expulsionof a firm and/or its employees from the industry. All of our U.S.-domiciled open-end mutual funds are currentlyavailable for sale and are qualified in all 50 states, Washington, D.C., Puerto Rico, Guam and the U.S. VirginIslands. Our Global Funds are sold through financial intermediaries to investors who are not citizens of orresidents of the United States. Most aspects of our investment management business, including the business ofthe unaffiliated subadvisers, are subject to various U.S. federal and state laws and regulations.
Our officers, directors and employees may, from time to time, own securities that are also held by one ormore of our funds. Our internal policies with respect to personal investments are established pursuant to theprovisions of the Investment Company Act and/or the Investment Advisers Act. Employees, officers anddirectors who, in the function of their responsibilities to us, meet the requirements of the Investment CompanyAct, Investment Advisers Act and/or of FINRA regulations, must disclose personal securities holdings andtrading activity. Those employees, officers and directors with investment discretion or access to investmentdecisions are subject to additional restrictions with respect to the pre-clearance of the purchase or sale ofsecurities over which they have investment discretion or beneficial interest. Other restrictions are imposed uponsupervised persons with respect to personal transactions in securities held, recently sold or contemplated forpurchase by our mutual funds. All supervised persons are required to report holdings and transactions on anannual and quarterly basis pursuant to the provisions of the Investment Company Act and Investment AdvisersAct. In addition, certain transactions are restricted so as to seek to avoid the possibility of improper use ofinformation relating to the management of client accounts.
Our Employees
As of December 31, 2014, we had 410 full time equivalent employees. None of our employees arerepresented by a union.
Available Information
Our annual reports on Form 10-K, quarterly reports on Form 10-Q, current reports on Form 8-K, and allamendments to these reports filed or furnished pursuant to Section 13(a) or 15(d) of the Exchange Act, as well asproxy statements, will be available free of charge on our website located at www.virtus.com as soon asreasonably practicable after they are filed with or furnished to the SEC. You may also read and copy any
9

document we file at the SEC’s Public Reference Room at 100 F Street N.E., Washington, D.C. 20549. Please call1-800-SEC-0330 for further information on the operation of the Public Reference Room. Reports, proxystatements and other information regarding issuers that file electronically with the SEC, including our filings, arealso available to the public on the SEC’s website at http://www.sec.gov.
A copy of our Corporate Governance Principles, our Code of Conduct and the charters of our AuditCommittee, Compensation Committee, Governance Committee and Risk and Finance Committee are posted onour website, www.virtus.com, under “About Us,” “Investor Relations,” “Corporate Governance” and areavailable in print to any person who requests copies by contacting Investor Relations by email to:[email protected] or by mail to Virtus Investment Partners, Inc., c/o Investor Relations, 100 PearlStreet, Hartford, CT 06103. Information contained on the website is not incorporated by reference or otherwiseconsidered part of this document.
10

Item 1A. Risk Factors
This section describes some of the potential risks relating to our business, such as market, liquidity,operational, reputation and regulatory. The risks described below are some of the more important factors thatcould affect our business. You should carefully consider the risks described below, together with all of the otherinformation included in this Annual Report on Form 10-K, in evaluating the Company and our common stock. Ifany of the risks described below actually occur our business, revenues, profitability, results of operations,financial condition, cash flows, reputation and stock price could be materially adversely affected.
We earn substantially all of our revenues based on assets under management, and therefore a reduction inassets under management would reduce our revenues and profitability. Assets under management fluctuatebased on many factors including market conditions, investment performance and client withdrawals.
The majority of our revenues are generated from asset-based fees from investment management productsand services to individuals and institutions. Therefore, if the assets under management decline, our fee revenuesdecline reducing profitability as some of our expenses are fixed. There are several reasons that assets undermanagement could decline as discussed below:
• The value of assets under management can decline due to price declines in specific securities or inspecific market segments or geographic areas where those assets are invested. Funds andportfolios that we manage related to certain geographic markets and industry sectors are particularlyvulnerable to political, social and economic events in those markets and sectors. If these industries ormarkets decline or experience volatility, this could have a negative impact on our assets undermanagement and our revenues. For example, certain non-U.S. markets, particularly emerging markets,are not as developed or as efficient as the U.S. financial markets and, as a result, may be less liquid,less regulated and significantly more volatile than the U.S. financial markets. Liquidity in such marketsmay be adversely impacted by political or economic events, government policies, expropriation,volume trading limits by foreign investors and social or civil unrest. These factors may negativelyimpact our ability to dispose of an investment and its market value. In addition, an increase in the valueof the U.S. dollar relative to non-U.S. currencies could result in a decrease in the U.S. dollar value ofassets under management that are denominated in non-U.S. currencies.
• The performance of our investment strategies is critical to the maintenance and growth of assetsunder management. Net flows related to our investment strategies can be affected by investmentperformance relative to other competing investment strategies or to established benchmarks.Investment management strategies are rated, ranked or assessed by independent third-parties,distribution partners, and industry periodicals and services. These assessments often influence theinvestment decisions of our clients. If the performance or assessment of our investment strategies isseen as underperforming relative to peers, it could result in an increase in the withdrawal of assets byexisting clients and the inability to attract additional investments from existing and new clients. Inaddition, certain of our investment strategies have capacity constraints, as there is a limit to the numberof securities available for the strategy to operate effectively. In those instances, we may choose to limitaccess to new or existing investors.
• General domestic and global economic and political conditions throughout the world caninfluence assets under management. Changes in interest rates, the availability and cost of credit,inflation rates, economic uncertainty, changes in laws, trade barriers, commodity prices, currencyexchange rates and controls and national and international political circumstances (including wars,terrorist acts and security operations) and other conditions may impact the equity and credit marketswhich may influence our assets under management. In recent years, capital and credit markets haveexperienced substantial volatility. While there has been some recovery in the capital markets sincethen, high unemployment rates in the United States and elsewhere, a sluggish recovery in some realestate markets, continued economic weakness in the Eurozone, increased austerity measures by severalEuropean governments, uncertainty about the future of the euro, escalating regional turmoil in the
11
Middle East, concern over growth prospects in China and emerging markets, growing debt loads forcertain countries and uncertainty about the consequences of governments eventually withdrawingmonetary stimulus all indicate that economic and political conditions remain unpredictable. If thesecurity markets decline or experience volatility, our assets under management and our revenues couldbe negatively impacted.
In addition, the volatility in the markets in the recent past has highlighted the interconnection of theglobal markets and demonstrated how the deteriorating financial condition of one institution maymaterially adversely impact the performance of other institutions. Our assets under management haveexposure to many different industries and counterparties and may be exposed to credit, operational orother risk due to the default by a counterparty or client or in the event of a market failure or disruptionor otherwise. In the event of extreme circumstances, including economic, political or business crises,such as a widespread systemic failure in the global financial system or failures of firms that havesignificant obligations as counterparties, we may suffer significant declines in assets undermanagement and severe liquidity or valuation issues.
Moreover, a significant amount of our assets under management are in investments represented bystrategies that primarily invest in securities in non-U.S. companies. Many non-U.S. financial marketsare not as developed or as efficient as the U.S. financial markets and, as a result, have limited liquidityand greater price volatility and may lack established regulations. Liquidity in such markets also may beadversely impacted by political or economic events, government policies, expropriation, volumetrading limits by foreign investors and social and civil unrest. An investment’s market value or theability to dispose of an investment may be adversely impacted by any of these factors. Governments offoreign jurisdictions may assert their abilities to tax local gains and/or income of foreign investors,including our clients, which could adversely impact the economics associated with investing in foreignjurisdictions or non-U.S. based companies. These risks also could impact the performance of ourstrategies that invest in such markets and, in particular, strategies that concentrate investments inemerging market companies and countries.
• Changes in interest rates can have adverse effects on our assets under management. Increases ininterest rates from their historically low present levels may adversely affect the net asset values of ourassets under management. Furthermore, increases in interest rates may result in reduced prices inequity markets. Conversely, decreases in interest rates could lead to outflows in fixed income assetsthat we manage as investors seek higher yields. Any of these effects could lower our assets undermanagement and revenues and, if our revenues decline without a commensurate reduction in ourexpenses, would lead to a reduction in our net income.
Any of these factors could cause our assets under management to decline and have an adverse impact on ourresults of operations and financial condition.
Our investment advisory agreements are subject to withdrawal, renegotiation or termination on short notice.
Our clients include the boards of directors for our sponsored mutual funds, managed account programsponsors, private clients and institutional clients. Our investment management agreements with these clients maybe terminated upon short notice without penalty. As a result, there would be little impediment to these sponsorsor clients terminating our agreements. Our clients may terminate or renegotiate their investment contracts with usor reduce the aggregate amount of assets under management with us due to a number of reasons includinginvestment performance, reputational, regulatory or compliance issues, loss of key investment management orother personnel or a change in management or control of clients, third-party distributors, subadvisers or otherswith whom we have relationships. The directors of our sponsored funds may deem it to be in the best interests ofa fund’s shareholders to make decisions adverse to us, such as reducing the compensation paid to us, requestingthat we subsidize fund expenses over certain thresholds, or imposing restrictions on our management of the fund.Under the Investment Company Act, investment advisory agreements automatically terminate in the event of an
12
assignment, which may occur if, among other events, the Company undergoes a change in control, such as anyperson acquiring 25% voting rights of our common stock. If an assignment were to occur, we could continue toact as adviser to a fund only if that fund’s board of directors and its stockholders approved a new investmentadvisory agreement. In addition, investment advisory agreements for the separate accounts we manage may notbe assigned without the consent of the client. If an assignment occurs, we cannot be certain that the Companywill be able to obtain the necessary fund approvals or the necessary consents from our clients. The withdrawal,renegotiation or termination of any investment management contract relating to a material portion of assets undermanagement would have an adverse impact on our results of operations and financial condition.
Any damage to our reputation could harm our business and lead to a reduction in our revenues andprofitability.
Maintaining a strong reputation with the investment community is critical to our success. Our reputation isvulnerable to many threats that can be difficult or impossible to control, and costly or impossible to remediateeven if they are without merit or satisfactorily addressed. Our reputation may be impacted by many factors,including but not limited to: poor performance; litigation; conflicts of interests; regulatory inquiries,investigations or findings; intentional or unintentional misrepresentation of our products or services; or employeemisconduct or rumors. Any damage to our reputation could impede our ability to attract and retain clients andkey personnel, adversely impact relationships with third-party distributors and other business partners and lead toa reduction in the amount of our assets under management, any of which could adversely affect our results ofoperations and financial condition.
We manage client assets under agreements that have established investment guidelines or other contractualrequirements, and any failure to comply could result in claims, losses or regulatory sanctions, which couldnegatively impact our revenues and profitability.
The agreements under which we manage client assets often have established investment guidelines or othercontractual requirements that we are required to comply with in providing our investment management services.Although we maintain various compliance procedures and other controls to prevent, detect, and correct sucherrors, any failure or allegation of a failure to comply with these guidelines or other requirement could result inclient claims, reputational damage, withdrawal of assets and potential regulatory sanctions, any of which couldhave an adverse impact on our results of operations and financial condition.
Our business relies on the ability to attract and retain key employees, and the loss of such employees couldnegatively affect financial performance.
The success of our business is dependent to a large extent on our ability to attract and retain key employeessuch as senior executives, portfolio managers, securities analysts and sales personnel. Competition in the jobmarket for these professionals is generally intense and compensation levels in the industry are highlycompetitive. The market for investment managers is also characterized by the movement of investment managersamong different firms.
If we are unable to continue to attract and retain key employees, or if compensation costs required to attractand retain key employees increase, our performance, including our competitive position, could be materiallyadversely affected. Additionally, we utilize equity awards as part of our compensation philosophy and as a meansfor recruiting and retaining key employees. Declines in our stock price could result in deterioration in the valueof equity awards granted, thus lessening the effectiveness of retaining key employees through stock-basedawards.
In certain circumstances, the departure of key employees could cause higher redemption rates for certainassets under management, or the loss of certain client accounts. Any inability to retain our key employees, attractqualified employees, or replace key employee positions in a timely manner, could lead to a reduction in the
13

amount of our assets under management, which could have a material adverse effect on our revenues andprofitability. In addition, there could be additional costs to replace, retain or attract new talent which would resultin a decrease in our profitability and have an adverse impact on our results of operations and financial condition.
The highly competitive nature of the asset management industry may force us to reduce the fees we chargeto our clients, increase amounts paid to our financial intermediaries or provide more support to thoseintermediaries, all of which could result in a reduction of our revenues and profitability.
We face significant competition from a wide variety of financial institutions, including other investmentmanagement companies, as well as from proprietary products offered by our distribution partners such as banks,broker-dealers and financial planning firms. Competition in our businesses is based on several factors includinginvestment performance, access to distribution channels, service to financial advisers and their clients and feescharged. Our competitors, many of which are larger than we are, often offer similar products, use similardistribution sources, offer less expensive products, have greater access to key distribution channels and havegreater resources, geographic footprints and name recognition than we do.
In addition, our profits are highly dependent on the fee levels for our products and services. In recent years,there has been a trend in certain segments of our markets toward lower fees. Competition could cause us toreduce the fees that we charge for products and services. In order to maintain appropriate fee levels in acompetitive environment, we must be able to continue to provide clients with investment products and servicesthat are viewed as appropriate in relation to the fees charged. If our clients, including our fund boards, were toview our fees as being high relative to the market or the returns provided by our investment products, we maychoose to reduce our fee levels or we may experience significant redemptions in our assets under management,which could have an adverse impact on our results of operations and financial condition.
We are subject to an extensive and complex regulatory environment, and changes in regulations or failureto comply with regulation could adversely affect our revenues and profitability.
The investment management industry in which we operate is subject to extensive and frequently changingregulation. We are regulated by the SEC under the Exchange Act, the Investment Company Act and theInvestment Advisers Act, and we are subject to regulation by the Commodities Futures Trading Commissionunder the Commodities Exchange Act. Our Global Fund is subject to regulation by the Central Bank of Ireland.We are also regulated by FINRA, the Department of Labor under the Employee Retirement Income Security Actof 1974, as amended (“ERISA”), as well as other federal and state laws and regulations.
Although we spend extensive time and resources on compliance efforts designed to ensure compliance withall applicable laws and regulations, if we or our affiliates fail to timely and properly modify and update ourcompliance procedures in this changing and highly complex regulatory environment, we may be subject tovarious legal proceedings, including civil litigation, governmental investigations and enforcement actions andresult in fines, penalties or suspensions of individual employees or limitations on particular business activities,which could have an adverse impact on our results of operations and financial condition.
We have significant deferred tax assets in the U.S., and any limitations on our tax attributes could have anadverse impact on our financial condition, results of operations and cash flows.
We are subject to federal and state income taxes in the United States. Tax authorities may disagree withcertain positions we have taken and assess additional taxes. We regularly assess the appropriateness of our taxpositions and reporting. We cannot provide assurance, however, that we will accurately predict the outcomes ofaudits, and the actual outcomes of these audits could be unfavorable. In addition, our ability to use net operatingloss carryforwards and other tax attributes available to us will be dependent on our ability to generate taxableincome.
14

A large portion of our deferred tax assets is related to the application of a particular Internal Revenue Codesection. We received a private letter ruling that relies on certain facts, assumptions and representations frommanagement regarding the past conduct of our businesses and other matters. If any of these facts, assumptions orrepresentations are determined to be incorrect, we may not be able to rely on the ruling and could be subject tosignificant tax liabilities in the event we utilize the related deferred tax assets.
We utilize unaffiliated firms in providing investment management services and any matters that have anadverse impact to their business, or any change in our relationships with these unaffiliated firms could leadto a reduction in assets under management, which will adversely affect our revenues and profitability.
We utilize select unaffiliated subadvisers as investment managers on certain mutual funds and variableinsurance funds we offer. In addition, certain of our affiliated managers have licensing arrangements withunaffiliated data providers. Because we typically have no ownership interests in these unaffiliated firms, we donot control the business activities of such firms. Problems stemming from the business activities of theseunaffiliated firms may negatively impact or disrupt such firms’ operations or expose them to disciplinary actionor reputational harm. Furthermore, any such problems at these unaffiliated firms may have an adverse impact onour business or reputation or expose us to regulatory scrutiny, including with respect to our oversight of suchfirms. For example, in December 2014, the Securities and Exchange Commission announced a settlement with F-Squared Investments, one of our unaffiliated subadvisers, which settled charges that F-Squared had violated thefederal securities laws in connection with its false performance advertising as well as aided and abetted andcaused certain mutual funds sub-advised by F-Squared to violate Section 34(b) of the Investment Company Actof 1940. See “Item 7. Management’s Discussion and Analysis of Financial Condition and Results of Operations”for additional information related to the impact of developments at F-Squared on the Company’s results ofoperations and financial condition.
In addition, we periodically negotiate provisions and renewals of these relationships, and we cannot provideassurance that such terms will remain acceptable to us or the unaffiliated firms. These relationships can also beterminated upon short notice without penalty. An interruption or termination of our unaffiliated firm relationshipscould affect our ability to market our products and result in a reduction in assets under management, which couldhave an adverse impact on our results of operations and financial condition.
We distribute through intermediaries, and changes in key distribution relationships could reduce ourrevenues, increase our costs and adversely affect our profitability.
Our primary source of distribution for our retail products is through intermediaries that include third partyfinancial intermediaries, such as: major wire houses; national, regional and independent broker-dealers andfinancial advisors; banks and financial planners and registered investment advisors. Our success is highlydependent on access to these various distribution systems. These distributors are generally not contractuallyrequired to distribute our products and typically offer their clients various investment products and services,including proprietary products and services, in addition to and in competition with our products and services.While we compensate these distributors for selling our products and services pursuant to agreed amounts, wemay not be able to retain access to these channels at all or at similar pricing. Increasing competition for thesedistribution channels could cause our distribution costs to rise, which could have a material adverse effect on ourbusiness, revenues and profitability. To the extent that existing or future intermediaries prefer to do business withour competitors, the sales of our products as well as our market share, revenues and profitability could decline.
We and our third-party service providers, which includes securities pricing and transaction processingservices, rely on numerous technology systems, and a temporary business interruption or security breachcould negatively impact our business and profitability. Our business will suffer if our technology systemsfail or are interrupted or if security breaches or other disruptions compromise our information.
15
Our technology systems and those of our third-party service providers are critical to our operations. Theability to consistently and reliably obtain accurate securities pricing information, process client portfolio andfund shareholder transactions and provide reports and other customer service to fund shareholders and clients inother accounts managed by us is essential to our continuing success. Any delays or inaccuracies in obtainingpricing information, processing such transactions or such reports, other breaches and errors, and anyinadequacies in other customer service, could result in reimbursement obligations or other liabilities, or alienatecustomers and potentially give rise to claims against us. Our customer service capability, as well as our ability toobtain prompt and accurate securities pricing information and to process transactions and reports, is highlydependent on our third-party service providers’ information systems. Any failure or interruption of thosesystems, whether resulting from technology or infrastructure breakdowns, defects or external causes such as fire,natural disaster, viruses, acts of terrorism or power disruptions, could result in financial loss, negatively impactour reputation, and negatively affect our ability to do business. Although we have in place disaster recoveryplans, we may experience temporary interruptions if a natural disaster or prolonged power outages were to occurwhich could have an adverse impact on our results of operations and financial condition.
In addition, like other companies in the financial services industry, our computer systems are regularlysubject to and are expected to continue to be the target of computer viruses or other malicious codes,unauthorized access, cyber-attacks or other computer-related penetrations. While we have experienced threats toour data and systems, to date, we are not aware that we have experienced a material breach of cyber security.Over time, however, the sophistication of cyber threats continues to increase, and any controls we put in placeand preventative actions we take to reduce the risk of cyber incidents and protect our information may beinsufficient to detect or prevent unauthorized access, cyber-attacks or other security breaches to our computersystems or those of third parties with whom we do business. Breach of our technology systems or those of thirdparties with whom we do business through cyber-attacks, or failure to manage and secure our technologyenvironment, could result in interruptions or malfunctions in the operations of our business, loss of valuableinformation, liability for stolen assets or information, remediation costs to repair damage caused by a breach,additional costs to mitigate against future incidents and litigation costs resulting from an incident.
We and certain of our third-party vendors receive and store personal information as well as non-publicbusiness information. Although we and our third-party vendors take precautions, we may still be vulnerable tohacking or other unauthorized use. A breach of the systems or hardware could result in an unauthorized access toour proprietary business or client data or release of this type of data, which could subject us to legal liability orregulatory action under data protection and privacy laws which may result in fines or penalties, the termination ofexisting client contracts, costly mitigation activities and harm to our reputation, which could have an adverseimpact on our results of operations and financial condition.
Ownership of a relatively large percentage of our common stock is concentrated with a small number ofshareholders, which could increase the volatility in our stock trading and dramatically affect our shareprice.
A large percentage of our common stock is held by a limited number of shareholders. If our largershareholders decide to liquidate their positions, it could cause significant fluctuation in the share price of ourcommon stock. Public companies with a relatively concentrated level of institutional shareholders, such as wehave, often have difficulty generating trading volume in their stock.
Civil litigation and government investigations or proceedings could adversely affect our business.
Many aspects of our business involve substantial risks of liability, and there have been substantialincidences of litigation and regulatory investigations in the financial services industry in recent years, includingcustomer claims as well as class action suits seeking substantial damages. From time to time, we and/or our fundsmay be named as defendants or co-defendants in lawsuits or be involved in disputes that involve the threat oflawsuits seeking substantial damages. We and/or our funds are also involved from time to time in governmental
16

and self-regulatory organization investigations and proceedings. Any of these lawsuits, investigations orproceedings could result in reputational damage, loss of clients and assets, settlements, awards, injunctions, fines,penalties, increased costs and expenses in resolving a claim, diversion of employee resources and resultingfinancial losses. Predicting the outcome of such matters is inherently difficult, particularly where claims arebrought on behalf of various classes of claimants or by a large number of claimants, when claimants seeksubstantial or unspecified damages or when investigations or legal proceedings are at an early stage. Asubstantial judgment, settlement, fine or penalty could be material to our operating results or cash flows for aparticular period, depending on our results for that period, or could cause us significant reputational harm, whichcould harm our business prospects.
We depend to a large extent on our business relationships and our reputation to attract and retain clients. Asa result, allegations of improper conduct by private litigants, including investors in our funds, or regulators,whether the ultimate outcome is favorable or unfavorable to us, as well as negative publicity and pressspeculation about us, our investment activities or the asset management industry in general, whether or not valid,may harm our reputation, which may be more damaging to our business than to other types of businesses. Wemay incur substantial legal expenses in defending against proceedings commenced by a client, regulatoryauthority or other private litigant. Substantial legal liability levied on us could cause significant reputational harmand have an adverse impact on our results of operations and financial condition.
We have a significant portion of our assets invested in marketable securities that are primarily comprised ofour seed capital program.
At December 31, 2014, the Company had $238.1 million of seed capital investments. A decline in the valueof equity, fixed income and alternative securities could lower the value of these investments and result indeclines in our non-operating income and net income. In addition, increases or decreases in the value of theseinvestments will increase the volatility of our earnings.
We cannot assure you that our intended quarterly distributions will be paid each quarter or at all.
The declaration, payment and determination of the amount of our quarterly dividend, if any, will be at thediscretion of our Board of Directors, who may change our dividend policy at any time. In making decisionsregarding our quarterly dividend, our Board of Directors considers general economic and business conditions,our strategic plans and prospects, our businesses and investment opportunities, our financial condition and
17

operating results, working capital requirements and anticipated cash needs, contractual restrictions andobligations, legal, tax, regulatory and other restrictions that may have implications on the payment ofdistributions by us to our common shareholders or by our subsidiaries to us, and such other factors as our Boardof Directors may deem relevant. We cannot assure you that any distributions, whether quarterly or otherwise,will be paid.
We may need to raise additional capital in the future, and resources may not be available to us in sufficientamounts or on acceptable terms, which could have an adverse impact on our business.
Our ability to meet the future cash needs of the Company is dependent upon our ability to generate cash.Although the Company has been successful in generating sufficient cash in the past, it may not be successful ingenerating additional cash in the future. As of December 31, 2014, we maintained a strong cash and workingcapital position and had no debt outstanding, however, we may need to raise capital to fund new businessinitiatives and financing may not be available to us in sufficient amounts, on acceptable terms, or at all. Ourability to access capital markets efficiently depends on a number of factors, including the state of credit andequity markets, interest rates and credit spreads. If we are unable to access sufficient capital on acceptable termsour business could be adversely impacted.
We have corporate governance provisions that may make an acquisition of us more difficult.
Certain provisions of our certificate of incorporation and bylaws could discourage, delay, or prevent amerger, acquisition, or other change in control that stockholders may consider favorable, including transactionsin which stockholders might otherwise receive a premium for their shares. These provisions also could limit theprice that investors might be willing to pay in the future for shares of our common stock, thereby depressing themarket price of our common stock. Stockholders who wish to participate in these transactions may not have theopportunity to do so. In addition, the provisions of Section 203 of the Delaware General Corporation Law alsorestrict certain business combinations with interested stockholders.
Our insurance policies may not cover all liabilities and losses to which we may be exposed.
We carry insurance in amounts and under terms that we believe are appropriate. Our insurance may notcover all liabilities and losses to which we may be exposed. Certain insurance coverage may not be available ormay be prohibitively expensive in future periods. As our insurance policies come up for renewal, we may need toassume higher deductibles or pay higher premiums, which could have an adverse impact on our results ofoperations and financial condition.
18
SPECIAL NOTE ABOUT FORWARD-LOOKING STATEMENTS
This Annual Report on Form 10-K contains statements that are, or may be considered to be, forward-looking statements within the meaning of The Private Securities Litigation Reform Act of 1995, as amended,Section 27A of the Securities Act of 1933, as amended, and Section 21E of the Securities Exchange Act of 1934,as amended. All statements that are not historical facts, including statements about our beliefs or expectations,are forward-looking statements. These statements may be identified by such forward-looking terminology as“expect,” “estimate,” “intend,” “believe,” “anticipate,” “may,” “will,” “should,” “could,” “continue,” “project,”“opportunity,” “predict,” “would,” “potential,” “future,” “forecast,” “guarantee,” “assume,” “likely,” “target” orsimilar statements or variations of such terms.
Our forward-looking statements are based on a series of expectations, assumptions and projections about ourCompany and the markets in which we operate, are not guarantees of future results or performance and involvesubstantial risks and uncertainty, including assumptions and projections concerning our assets undermanagement, net cash inflows and outflows, operating cash flows and future credit facilities, for all futureperiods. All of our forward-looking statements contained in this Annual Report on Form 10-K are as of the dateof this Annual Report on Form 10-K only.
We can give no assurance that such expectations or forward-looking statements will prove to be correct.Actual results may differ materially. We do not undertake or plan to update or revise any such forward-lookingstatements to reflect actual results, changes in plans, assumptions, estimates or projections, or othercircumstances occurring after the date of this Annual Report on Form 10-K, even if such results, changes orcircumstances make it clear that any forward-looking information will not be realized. If there are any futurepublic statements or disclosures by us which modify or impact any of the forward-looking statements containedin or accompanying this Annual Report on Form 10-K, such statements or disclosures will be deemed to modifyor supersede such statements in this Annual Report on Form 10-K.
Our business and our forward-looking statements involve substantial known and unknown risks anduncertainties, including those discussed under “Risk Factors,” and “Management’s Discussion and Analysis ofFinancial Condition and Results of Operations” in this Annual Report on Form 10-K. Any occurrence of, or anymaterial adverse change in, one or more risk factors or risks and uncertainties referred to in this Annual Reporton Form 10-K or our other periodic reports filed with the SEC could materially and adversely affect ouroperations, financial results, cash flows, prospects and liquidity. You are urged to carefully consider all suchfactors.
Item 1B. Unresolved Staff Comments.
None.
Item 2. Properties.
We lease our principal offices, which are located at 100 Pearl St., Hartford, CT 06103. In addition, we leaseoffice space in Illinois, California, Massachusetts and New York. We believe our office facilities are suitable andadequate for our business as it is presently conducted.
Item 3. Legal Proceedings.
The Company is regularly involved in litigation and arbitration as well as examinations, inquiries andinvestigations by various regulatory bodies, including the SEC, involving its compliance with, among otherthings, securities laws, client investment guidelines, laws governing the activities of broker-dealers and otherlaws and regulations affecting its products and other activities. Legal and regulatory matters of this natureinvolve or may involve the Company’s activities as an employer, issuer of securities, investor, investment
19

adviser, broker-dealer or taxpayer. In addition, in the normal course of business, the Company discusses matterswith its regulators raised during regulatory examinations or is otherwise subject to their inquiry. These matterscould result in censures, fines, penalties or other sanctions.
The Company accrues for a liability when it is both probable that a liability has been incurred and theamount of the liability can be reasonably estimated. Significant judgment is required in both the determination ofprobability and the determination as to whether a loss is reasonably estimable. In addition, in the event theCompany determines that a loss is not probable, but is reasonably possible, and it becomes possible to developwhat the Company believes to be a reasonable range of possible loss, then the Company will include disclosuresrelated to such matter as appropriate and in compliance with ASC 450, Loss Contingencies. The disclosures,accruals or estimates, if any, resulting from the foregoing analysis are reviewed at least quarterly and adjusted toreflect the impact of negotiations, settlements, rulings, advice of legal counsel and other information and eventspertaining to a particular matter. The Company believes, based on its current knowledge, that the outcomes of itslegal and regulatory proceedings are not likely, either individually or in the aggregate, to have a material adverseeffect on its consolidated financial condition. However, in the event of unexpected subsequent developments andgiven the inherent unpredictability of these legal and regulatory matters, the Company can provide no assurancethat its assessment of any claim, dispute, regulatory examination or investigation or other legal matter will reflectthe ultimate outcome and an adverse outcome in certain matters could, from time to time, have a material adverseeffect on the Company’s results of operations or cash flows in particular quarterly or annual periods.
Tom Cummins v. Virtus Investment Partners Inc. et al
On February 20, 2015, a putative class action complaint alleging violation of the federal securities laws wasfiled by an individual shareholder against the Company and certain of the Company’s current officers in theUnited States District Court for the Southern District of New York. The complaint was purportedly filed onbehalf of all purchasers of the Company’s common stock between May 28, 2013 and December 22, 2014,inclusive (the “Class Period”). The complaint alleges that, during the Class Period, the defendants disseminatedmaterially false and misleading statements and concealed material adverse facts relating to certain fundssubadvised by F-Squared Investments. The complaint alleges claims under Sections 10(b) and 20(a) of theSecurities Exchange Act of 1934, as amended, and Rule 10b-5. The plaintiff seeks to recover unspecifieddamages on behalf of the class members. The Company believes that the suit is without merit and intends todefend it vigorously.
Item 4. Mine Safety Disclosures.
Not applicable.
20
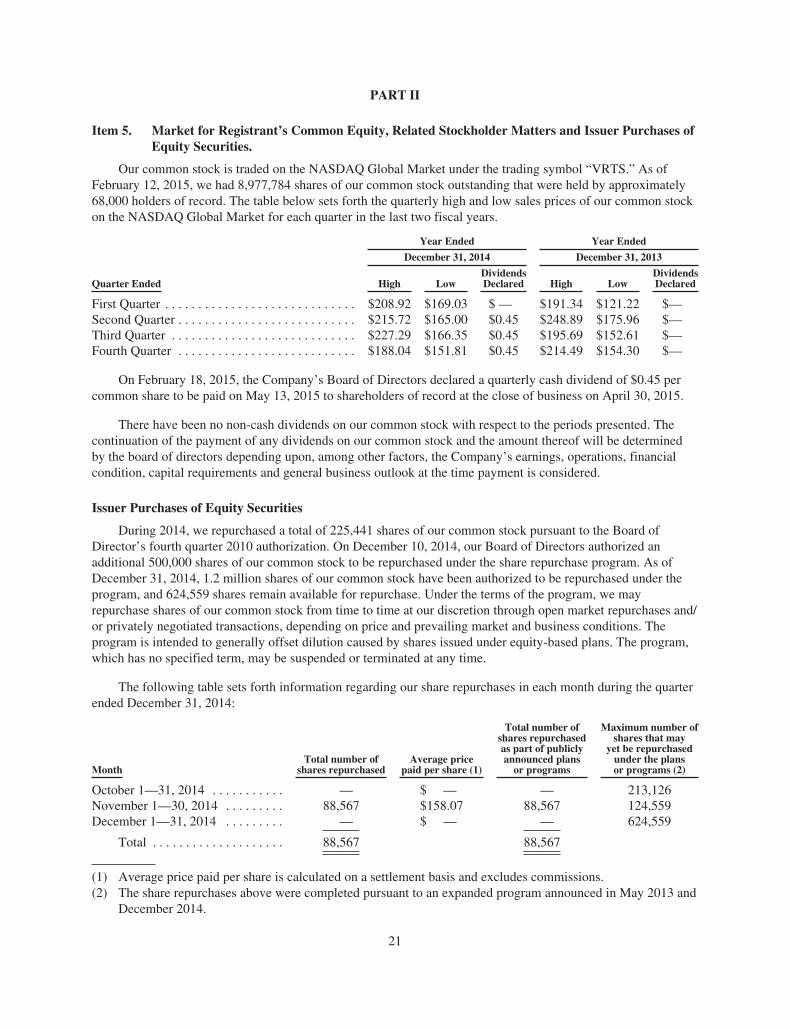
PART II
Item 5. Market for Registrant’s Common Equity, Related Stockholder Matters and Issuer Purchases ofEquity Securities.
Our common stock is traded on the NASDAQ Global Market under the trading symbol “VRTS.” As ofFebruary 12, 2015, we had 8,977,784 shares of our common stock outstanding that were held by approximately68,000 holders of record. The table below sets forth the quarterly high and low sales prices of our common stockon the NASDAQ Global Market for each quarter in the last two fiscal years.
Year Ended Year Ended
December 31, 2014 December 31, 2013
Quarter Ended High LowDividendsDeclared High Low
DividendsDeclared
First Quarter . . . . . . . . . . . . . . . . . . . . . . . . . . . . . $208.92 $169.03 $ — $191.34 $121.22 $—Second Quarter . . . . . . . . . . . . . . . . . . . . . . . . . . . $215.72 $165.00 $0.45 $248.89 $175.96 $—Third Quarter . . . . . . . . . . . . . . . . . . . . . . . . . . . . $227.29 $166.35 $0.45 $195.69 $152.61 $—Fourth Quarter . . . . . . . . . . . . . . . . . . . . . . . . . . . $188.04 $151.81 $0.45 $214.49 $154.30 $—
On February 18, 2015, the Company’s Board of Directors declared a quarterly cash dividend of $0.45 percommon share to be paid on May 13, 2015 to shareholders of record at the close of business on April 30, 2015.
There have been no non-cash dividends on our common stock with respect to the periods presented. Thecontinuation of the payment of any dividends on our common stock and the amount thereof will be determinedby the board of directors depending upon, among other factors, the Company’s earnings, operations, financialcondition, capital requirements and general business outlook at the time payment is considered.
Issuer Purchases of Equity Securities
During 2014, we repurchased a total of 225,441 shares of our common stock pursuant to the Board ofDirector’s fourth quarter 2010 authorization. On December 10, 2014, our Board of Directors authorized anadditional 500,000 shares of our common stock to be repurchased under the share repurchase program. As ofDecember 31, 2014, 1.2 million shares of our common stock have been authorized to be repurchased under theprogram, and 624,559 shares remain available for repurchase. Under the terms of the program, we mayrepurchase shares of our common stock from time to time at our discretion through open market repurchases and/or privately negotiated transactions, depending on price and prevailing market and business conditions. Theprogram is intended to generally offset dilution caused by shares issued under equity-based plans. The program,which has no specified term, may be suspended or terminated at any time.
The following table sets forth information regarding our share repurchases in each month during the quarterended December 31, 2014:
MonthTotal number of
shares repurchasedAverage price
paid per share (1)
Total number ofshares repurchasedas part of publiclyannounced plans
or programs
Maximum number ofshares that may
yet be repurchasedunder the plansor programs (2)
October 1—31, 2014 . . . . . . . . . . . — $ — — 213,126November 1—30, 2014 . . . . . . . . . 88,567 $158.07 88,567 124,559December 1—31, 2014 . . . . . . . . . — $ — — 624,559
Total . . . . . . . . . . . . . . . . . . . . 88,567 88,567
(1) Average price paid per share is calculated on a settlement basis and excludes commissions.(2) The share repurchases above were completed pursuant to an expanded program announced in May 2013 and
December 2014.
21

There were no unregistered sales of equity securities during the period covered by this Annual Report.Shares of our common stock purchased by participants in our Employee Stock Purchase Plan were delivered toparticipant accounts via open market purchases at fair value by the third-party administrator under the plan. Wedo not reserve shares for this plan or discount the purchase price of the shares.
For the year ended December 31, 2014, we paid $9.5 million in minimum employee tax withholdingobligations related to employee share transactions.
22

Item 6. Selected Financial Data.
The following table sets forth our selected consolidated financial and other data at the dates and for theperiods indicated. The selected financial data should be read in conjunction with “Management’s Discussion andAnalysis of Financial Condition and Results of Operations” and our consolidated financial statements and thenotes thereto appearing elsewhere in this Annual Report on Form 10-K.
($ in thousands, except per share data) Years Ended December 31,
2014 (1) 2013 (1) 2012 (1) 2011 (2) 2010 (2)
Results of OperationsRevenues . . . . . . . . . . . . . . . . . . . . . . . . . . . . . . . . . . . $450,598 $389,215 $280,086 $ 204,652 $144,556Operating Expenses . . . . . . . . . . . . . . . . . . . . . . . . . . 319,878 275,711 219,641 190,749 135,285Operating income . . . . . . . . . . . . . . . . . . . . . . . . . . . . 130,720 113,504 60,445 13,903 9,271Income tax expense (benefit) (3) . . . . . . . . . . . . . . . . 39,349 44,778 27,030 (132,428) 513Net income (3) . . . . . . . . . . . . . . . . . . . . . . . . . . . . . . 96,965 77,130 37,773 145,420 9,642Net income attributable to common stockholders (3) . . . 97,700 75,190 37,608 111,678 5,209Earnings per share—basic (3) . . . . . . . . . . . . . . . . . . . 10.75 9.18 4.87 17.98 0.87Earnings per share—diluted (3) . . . . . . . . . . . . . . . . . 10.51 8.92 4.66 16.34 0.81Cash dividends declared per share . . . . . . . . . . . . . . . 1.35 — — — —
As of December 31,
2014 (1) 2013 (1) 2012 (2) 2011 (2) 2010 (2)
Balance Sheet DataCash and cash equivalents . . . . . . . . . . . . . . . . . . . . . $202,847 $271,014 $ 63,432 $ 45,267 $ 43,948Investments . . . . . . . . . . . . . . . . . . . . . . . . . . . . . . . . 63,448 37,258 18,433 18,357 12,913Goodwill and other intangible assets, net . . . . . . . . . . 47,043 49,893 53,971 56,891 57,772Total assets . . . . . . . . . . . . . . . . . . . . . . . . . . . . . . . . . 698,773 644,954 332,749 286,379 148,911Accrued compensation and benefits . . . . . . . . . . . . . . 54,815 53,140 41,252 31,171 19,245Debt . . . . . . . . . . . . . . . . . . . . . . . . . . . . . . . . . . . . . . . — — 15,000 15,000 15,000Total liabilities . . . . . . . . . . . . . . . . . . . . . . . . . . . . . . 112,350 109,900 85,115 68,007 64,720Convertible preferred stock (4) . . . . . . . . . . . . . . . . . . — — — 35,217 35,921Total equity . . . . . . . . . . . . . . . . . . . . . . . . . . . . . . . . . 563,352 492,868 244,471 183,155 48,270Net assets of consolidated sponsored investment
products (5) . . . . . . . . . . . . . . . . . . . . . . . . . . . . . . . 216,672 98,433 40,397 — —
As of December 31,
2014 2013 2012 2011 2010($ in millions)
Assets Under ManagementTotal assets under management . . . . . . . . . . . . . . . . . $ 56,702 $ 57,740 $ 45,537 $ 34,588 $ 29,473
(1) Derived from audited consolidated financial statements included elsewhere in this Annual Report onForm 10-K.
(2) Derived from audited consolidated financial statements not included in this Annual Report on Form 10-K.(3) The amount shown for the 2014 fiscal year includes a net tax benefit of approximately $15.5 million due to
the resolution of uncertain tax positions. The amount shown for the 2011 fiscal year includes a tax benefit of$132.4 million, primarily related to the release of a valuation allowance on certain deferred tax assets.
(4) On October 27, 2011, the Company entered into an agreement with the Series B Convertible Preferred Stock(“Series B”) stockholder to convert 35,217 shares of Series B into 1,349,300 shares of common stock. TheSeries B was converted to shares of common stock on January 6, 2012. As a result of the conversion, all ofthe preferred shares were retired.
(5) The Company consolidates sponsored investment products in which it has a majority voting interest. Netassets of consolidated sponsored investment products are comprised of $252.3, $149.2 and $43.9 million oftotal assets, $12.6, $8.6 and $0.3 million of total liabilities and $23.1, $42.2 and $3.2 million of redeemablenoncontrolling interests at December 31, 2014, 2013 and 2012, respectively.
23

Item 7. Management’s Discussion and Analysis of Financial Condition and Results of Operations.
Overview
Our Business
We are a provider of investment management and related services to individuals and institutions. We use amulti-manager, multi-style approach, offering investment strategies from affiliated managers and unaffiliatedsubadvisers, each having its own distinct investment style, autonomous investment process and individual brand.By offering a broad array of products, we believe we can appeal to a greater number of investors, which allowsus to have offerings across market cycles through changes in investor preferences. Our earnings are primarilydriven by asset-based fees charged for services relating to these various products including investmentmanagement, fund administration, distribution and shareholder services.
We offer investment strategies for individual and institutional investors in different product structures andthrough multiple distribution channels. Our investment strategies are available in a diverse range of styles anddisciplines, managed by a collection of boutique investment managers, both affiliated and unaffiliated. We haveofferings in various asset classes (domestic and international equity, fixed income and alternative), in all marketcapitalizations (large, mid and small), in different styles (growth, blend and value) and with various investmentapproaches (fundamental, quantitative and thematic). Our retail products include open-end mutual funds, closed-end funds, variable insurance funds and separately managed accounts. We also offer certain of our investmentstrategies to institutional clients.
We distribute our open-end mutual funds through financial intermediaries. We have broad access in theretail market, with distribution partners that include national and regional broker-dealers, independent broker-dealers and independent financial advisory firms. In many of these firms, we have a number of products that areon firms’ preferred “recommended” lists and on fee-based advisory programs. Our sales efforts are supported byregional sales professionals, a national account relationship group and separate teams for the retirement andinsurance markets.
Our separately managed accounts are distributed through financial intermediaries and directly by teams atour affiliated managers. Our institutional distribution strategy is an affiliate-centric and coordinated model.Through relationships with consultants, our affiliates target key market segments, including foundations andendowments, corporate, public and private pension plans and unaffiliated mutual funds.
Market Developments
In 2014, the global equity markets were up as evidenced by the MSCI World Index ending the year at 1,710as compared to 1,661 at the start of the year, an increase of 3.0%. The major U.S. equity indexes were also up for2014, with the Dow Jones Industrial Average ending the year at 17,823, from 16,577 at the beginning of the year,an increase of 7.5%, and the Standard & Poor’s 500 Index increased by 11.4% ending the year at 2,059, from1,848 at the beginning of the year. The major U.S. bond index, the Barclays U.S. Aggregate Bond Index,increased 6.0% in 2014 ending the year at 1,915, compared to 1,807 at the beginning of the year.
The financial markets have had and are likely to continue to have a significant impact on asset flows and thevalue of our assets under management. The capital and financial markets could experience fluctuation andvolatility, as they have in the past, which could impact relative investment returns and asset flows amonginvestment products as well as investor choices and preferences among investment products, including equity,fixed income and alternative products.
Financial Highlights
• Total revenues were $450.6 million in 2014, an increase of $61.4 million, or 15.8%, from $389.2million in 2013. Total revenues increased in 2014 compared to the same period in the prior year as aresult of higher average assets under management and an increase in average fees earned.
24

• Long-term open-end mutual fund sales in 2014 of $12.7 billion represent a 34.8% sales rate (defined asinflows divided by beginning assets under management). Open-end fund sales during 2014 remaineddiversified by asset class, with 29.3% of sales in international equity funds, 29.7% in fixed incomestrategies, 28.7% of sales in domestic equity funds and 12.3% in alternative strategies.
• Net income attributable to common stockholders in 2014 increased 29.9% to $97.7 million, from $75.2million, in 2013. The 2014 earnings include a net tax benefit of $15.5 million related to the resolutionof uncertain tax positions. Earnings per diluted common share increased 17.8% to $10.51 in 2014 from$8.92 in 2013.
• In the second quarter of 2014, we launched the Duff & Phelps Select Energy MLP Fund Inc. (NYSE:DSE), a new closed-end fund managed by Duff & Phelps Investment Management Co., an affiliatedmanager. The fund added $493.8 million in assets under management during the year. At December 31,2014 the fund had assets under management of $583.7 million inclusive of leverage.
Assets Under Management
At December 31, 2014, we managed $56.7 billion in total assets, representing a decrease of $1.0 billion, or1.8%, from the $57.7 billion managed at December 31, 2013. The decrease in assets under management was dueto the liquidation of our money market open-end funds of $1.6 billion, net outflows of $1.2 billion, $1.0 billionfrom dividends distributed, net of reinvestments, and the impact on assets from the use of leverage, offset bymarket appreciation of $2.8 billion. The 2014 full year net outflows of $0.5 billion in our long-term open-endfunds was the result of fourth quarter 2014 net outflows of $2.2 billion, offset by net inflows of $1.7 billion fromthe first three quarters of 2014. The $2.2 billion in net outflows during the fourth quarter of 2014 was primarilyattributable to $1.8 billion in net outflows in our domestic equity, Premium AlphaSector and alternative DynamicAlphaSector funds. We believe several factors individually and collectively contributed to the outflows,including reactions to a large capital gain distribution communicated in the fourth quarter of 2014, the absoluteperformance of these products in a rising market environment and developments at the funds’ subadviser,F-Squared Investments, including a regulatory settlement and the resignation of its CEO in the fourth quarter of2014 and the related announcements and media coverage. At December 31, 2014, F-Squared Investments servedas subadviser to the Virtus mutual funds that represented $9.9 billion of assets under management. In 2015, wecontinued to experience net outflows in our long-term open-end funds primarily attributable to net outflows inthe Premium AlphaSector and Dynamic AlphaSector funds. The changes in our assets under management mayalso be affected by the factors discussed in Item 1A of this Annual Report on Form 10-K “Risk Factors”.
Long-term assets under management, which exclude cash management products, were $56.7 billion atDecember 31, 2014, an increase of $0.5 billion, or 0.9%, from $56.2 billion at December 31, 2013. Averageassets under management, which generally correspond to our fee-earning asset levels, were $59.1 billion for theyear ended December 31, 2014, an increase of $6.1 billion, or 11.6%, from $53.0 billion for the year endedDecember 31, 2013.
Operating Results
In 2014, total revenues increased 15.8% to $450.6 million from $389.2 million in 2013. Revenues increasedin 2014 compared to 2013, primarily as a result of an increase in average assets under management and anincrease in fee rates. Operating income increased by 15.2% from $113.5 million in 2013 to $130.7 million in2014, due to increased revenues driven by higher levels of average assets under management partially offset byhigher employment expenses associated with personnel additions to support the growth of the business anddistribution and administrative expenses attributable to the launch of the new DSE closed-end fund.
25

Assets Under Management by Product
The following table summarizes our assets under management by product:
As of December 31, Change
2014 2013 20122014 vs.
2013 %2013 vs.
2012 %
($ in millions)
Retail AssetsMutual fund assets
Long-term open-end mutualfunds . . . . . . . . . . . . . . . . . $36,292.3 $36,367.7 $25,827.1 $ (75.4) (0.2)% $10,540.6 40.8%
Closed-end funds . . . . . . . . . . 7,581.4 6,499.6 6,231.6 1,081.8 16.6% 268.0 4.3%Money market open-end
funds (1) . . . . . . . . . . . . . . — 1,556.6 1,994.1 (1,556.6) (100.0)% (437.5) (21.9)%
Total mutual fund assets . . . . . . . . 43,873.7 44,423.9 34,052.8 (550.2) (1.2)% 10,371.1 30.5%Variable insurance funds . . . . . . . . 1,221.9 1,311.8 1,295.7 (89.9) (6.9)% 16.1 1.2%Separately managed accounts (2) . . 6,884.8 7,433.1 5,829.0 (548.3) (7.4)% 1,604.1 27.5%
Total retail assets . . . . . . . . . . . . . . 51,980.4 53,168.8 41,177.5 (1,188.4) (2.2)% 11,991.3 29.1%Total institutional accounts (2) . . . . 4,722.0 4,570.8 4,359.5 151.2 3.3% 211.3 4.8%
Total Assets UnderManagement . . . . . . . . . . . . . . $56,702.4 $57,739.6 $45,537.0 $(1,037.2) (1.8)% $12,202.6 26.8%
Average Assets UnderManagement . . . . . . . . . . . . . . $59,122.1 $52,975.8 $39,631.5 $ 6,146.3 11.6% $13,344.3 33.7%
(1) On October 20, 2014, our money market funds were liquidated. This liquidation had no impact on ouroperating results.
(2) Includes assets under management related to option strategies.
26

Asset Flows by Product
The following table summarizes our asset flows by product for the periods indicated:
($ in millions) Years Ended December 31,
2014 2013 2012
Retail ProductsMutual Funds—Long-Term Open-EndBeginning balance . . . . . . . . . . . . . . . . . . . . . . . . . . . . . . . . . . . . . . . . . . . . . . . . . . . . . . . . . . . . . . $ 36,367.7 $ 25,827.1 $16,896.6Inflows . . . . . . . . . . . . . . . . . . . . . . . . . . . . . . . . . . . . . . . . . . . . . . . . . . . . . . . . . . . . . . . . . . . . . . . 12,665.6 19,097.6 12,340.9Outflows . . . . . . . . . . . . . . . . . . . . . . . . . . . . . . . . . . . . . . . . . . . . . . . . . . . . . . . . . . . . . . . . . . . . . (13,198.3) (10,991.7) (5,921.7)
Net flows . . . . . . . . . . . . . . . . . . . . . . . . . . . . . . . . . . . . . . . . . . . . . . . . . . . . . . . . . . . . . . . . . . . . . (532.7) 8,105.9 6,419.2Market performance . . . . . . . . . . . . . . . . . . . . . . . . . . . . . . . . . . . . . . . . . . . . . . . . . . . . . . . . . . . . 1,225.4 2,124.6 2,542.0Other (1) . . . . . . . . . . . . . . . . . . . . . . . . . . . . . . . . . . . . . . . . . . . . . . . . . . . . . . . . . . . . . . . . . . . . . (768.1) 310.1 (30.7)
Ending balance . . . . . . . . . . . . . . . . . . . . . . . . . . . . . . . . . . . . . . . . . . . . . . . . . . . . . . . . . . . . . . . $ 36,292.3 $ 36,367.7 $25,827.1
Mutual Funds—Closed-EndBeginning balance . . . . . . . . . . . . . . . . . . . . . . . . . . . . . . . . . . . . . . . . . . . . . . . . . . . . . . . . . . . . . . $ 6,499.6 $ 6,231.6 $ 5,675.6Inflows . . . . . . . . . . . . . . . . . . . . . . . . . . . . . . . . . . . . . . . . . . . . . . . . . . . . . . . . . . . . . . . . . . . . . . . 493.8 — 444.2Outflows . . . . . . . . . . . . . . . . . . . . . . . . . . . . . . . . . . . . . . . . . . . . . . . . . . . . . . . . . . . . . . . . . . . . . — — —
Net flows . . . . . . . . . . . . . . . . . . . . . . . . . . . . . . . . . . . . . . . . . . . . . . . . . . . . . . . . . . . . . . . . . . . . . 493.8 — 444.2Market performance . . . . . . . . . . . . . . . . . . . . . . . . . . . . . . . . . . . . . . . . . . . . . . . . . . . . . . . . . . . . 799.3 728.2 362.7Other (1) . . . . . . . . . . . . . . . . . . . . . . . . . . . . . . . . . . . . . . . . . . . . . . . . . . . . . . . . . . . . . . . . . . . . . (211.3) (460.2) (250.9)
Ending balance . . . . . . . . . . . . . . . . . . . . . . . . . . . . . . . . . . . . . . . . . . . . . . . . . . . . . . . . . . . . . . . $ 7,581.4 $ 6,499.6 $ 6,231.6
Mutual Funds—Money MarketBeginning balance . . . . . . . . . . . . . . . . . . . . . . . . . . . . . . . . . . . . . . . . . . . . . . . . . . . . . . . . . . . . . . $ 1,556.6 $ 1,994.1 $ 2,294.8Other (1) . . . . . . . . . . . . . . . . . . . . . . . . . . . . . . . . . . . . . . . . . . . . . . . . . . . . . . . . . . . . . . . . . . . . . (1,556.6) (437.5) (300.7)
Ending balance . . . . . . . . . . . . . . . . . . . . . . . . . . . . . . . . . . . . . . . . . . . . . . . . . . . . . . . . . . . . . . . $ — $ 1,556.6 $ 1,994.1
Variable Insurance FundsBeginning balance . . . . . . . . . . . . . . . . . . . . . . . . . . . . . . . . . . . . . . . . . . . . . . . . . . . . . . . . . . . . . . $ 1,311.8 $ 1,295.7 $ 1,308.6Inflows . . . . . . . . . . . . . . . . . . . . . . . . . . . . . . . . . . . . . . . . . . . . . . . . . . . . . . . . . . . . . . . . . . . . . . . 68.1 48.7 48.0Outflows . . . . . . . . . . . . . . . . . . . . . . . . . . . . . . . . . . . . . . . . . . . . . . . . . . . . . . . . . . . . . . . . . . . . . (229.8) (245.4) (238.2)
Net flows . . . . . . . . . . . . . . . . . . . . . . . . . . . . . . . . . . . . . . . . . . . . . . . . . . . . . . . . . . . . . . . . . . . . . (161.7) (196.7) (190.2)Market performance . . . . . . . . . . . . . . . . . . . . . . . . . . . . . . . . . . . . . . . . . . . . . . . . . . . . . . . . . . . . 71.8 213.3 177.3Other (1) . . . . . . . . . . . . . . . . . . . . . . . . . . . . . . . . . . . . . . . . . . . . . . . . . . . . . . . . . . . . . . . . . . . . . — (0.5) —
Ending balance . . . . . . . . . . . . . . . . . . . . . . . . . . . . . . . . . . . . . . . . . . . . . . . . . . . . . . . . . . . . . . . $ 1,221.9 $ 1,311.8 $ 1,295.7
Separately Managed Accounts (2)Beginning balance . . . . . . . . . . . . . . . . . . . . . . . . . . . . . . . . . . . . . . . . . . . . . . . . . . . . . . . . . . . . . . $ 7,433.1 $ 5,829.0 $ 3,933.8Inflows . . . . . . . . . . . . . . . . . . . . . . . . . . . . . . . . . . . . . . . . . . . . . . . . . . . . . . . . . . . . . . . . . . . . . . . 1,333.6 1,384.0 1,178.4Outflows . . . . . . . . . . . . . . . . . . . . . . . . . . . . . . . . . . . . . . . . . . . . . . . . . . . . . . . . . . . . . . . . . . . . . (2,244.8) (1,225.9) (980.7)
Net flows . . . . . . . . . . . . . . . . . . . . . . . . . . . . . . . . . . . . . . . . . . . . . . . . . . . . . . . . . . . . . . . . . . . . . (911.2) 158.1 197.7Market performance . . . . . . . . . . . . . . . . . . . . . . . . . . . . . . . . . . . . . . . . . . . . . . . . . . . . . . . . . . . . 355.5 1,481.4 526.8Other (1) . . . . . . . . . . . . . . . . . . . . . . . . . . . . . . . . . . . . . . . . . . . . . . . . . . . . . . . . . . . . . . . . . . . . . 7.4 (35.4) 1,170.7
Ending balance . . . . . . . . . . . . . . . . . . . . . . . . . . . . . . . . . . . . . . . . . . . . . . . . . . . . . . . . . . . . . . . $ 6,884.8 $ 7,433.1 $ 5,829.0
Institutional Accounts (2)Beginning balance . . . . . . . . . . . . . . . . . . . . . . . . . . . . . . . . . . . . . . . . . . . . . . . . . . . . . . . . . . . . . . $ 4,570.8 $ 4,359.5 $ 4,478.2Inflows . . . . . . . . . . . . . . . . . . . . . . . . . . . . . . . . . . . . . . . . . . . . . . . . . . . . . . . . . . . . . . . . . . . . . . . 650.5 796.3 435.9Outflows . . . . . . . . . . . . . . . . . . . . . . . . . . . . . . . . . . . . . . . . . . . . . . . . . . . . . . . . . . . . . . . . . . . . . (743.0) (782.1) (576.1)
Net flows . . . . . . . . . . . . . . . . . . . . . . . . . . . . . . . . . . . . . . . . . . . . . . . . . . . . . . . . . . . . . . . . . . . . . (92.5) 14.2 (140.2)Market performance . . . . . . . . . . . . . . . . . . . . . . . . . . . . . . . . . . . . . . . . . . . . . . . . . . . . . . . . . . . . 389.2 314.7 233.4Other (1) . . . . . . . . . . . . . . . . . . . . . . . . . . . . . . . . . . . . . . . . . . . . . . . . . . . . . . . . . . . . . . . . . . . . . (145.5) (117.6) (211.9)
Ending balance . . . . . . . . . . . . . . . . . . . . . . . . . . . . . . . . . . . . . . . . . . . . . . . . . . . . . . . . . . . . . . . $ 4,722.0 $ 4,570.8 $ 4,359.5
TotalBeginning balance . . . . . . . . . . . . . . . . . . . . . . . . . . . . . . . . . . . . . . . . . . . . . . . . . . . . . . . . . . . . . . $ 57,739.6 $ 45,537.0 $34,587.6Inflows . . . . . . . . . . . . . . . . . . . . . . . . . . . . . . . . . . . . . . . . . . . . . . . . . . . . . . . . . . . . . . . . . . . . . . . 15,211.6 21,326.6 14,447.4Outflows . . . . . . . . . . . . . . . . . . . . . . . . . . . . . . . . . . . . . . . . . . . . . . . . . . . . . . . . . . . . . . . . . . . . . (16,415.9) (13,245.1) (7,716.7)
Net flows . . . . . . . . . . . . . . . . . . . . . . . . . . . . . . . . . . . . . . . . . . . . . . . . . . . . . . . . . . . . . . . . . . . . . (1,204.3) 8,081.5 6,730.7Market performance . . . . . . . . . . . . . . . . . . . . . . . . . . . . . . . . . . . . . . . . . . . . . . . . . . . . . . . . . . . . 2,841.2 4,862.2 3,842.2Other (1) . . . . . . . . . . . . . . . . . . . . . . . . . . . . . . . . . . . . . . . . . . . . . . . . . . . . . . . . . . . . . . . . . . . . . (2,674.1) (741.1) 376.5
Ending balance . . . . . . . . . . . . . . . . . . . . . . . . . . . . . . . . . . . . . . . . . . . . . . . . . . . . . . . . . . . . . . . $ 56,702.4 $ 57,739.6 $45,537.0
27

(1) Represents open-end and closed-end mutual fund distributions, net of reinvestments, net flows of cashmanagement strategies, net flows and market performance on structured products and net flows from non-sales related activities such as asset acquisitions/(dispositions), marketable securities investments/(withdrawals) and the impact on assets from the use of leverage.
(2) Includes assets under management related to option strategies.
The following table summarizes our assets under management by asset class:
As of December 31, Change
2014 2013 20122014 vs.
2013 %2013 vs.
2012 %
($ in millions)
Asset ClassEquity . . . . . . . . . . . . . . . . . . . $34,180.7 $33,610.7 $24,668.1 $ 570.0 1.7% $ 8,942.6 36.3%Fixed income . . . . . . . . . . . . . 16,681.6 15,829.4 14,861.2 852.2 5.4% 968.2 6.5%Alternatives (1) . . . . . . . . . . . . 5,372.4 5,308.3 2,694.7 64.1 1.2% 2,613.6 97.0%Other (2) . . . . . . . . . . . . . . . . . 467.7 2,991.2 3,313.0 (2,523.5) (84.4)% (321.8) (9.7)%
Total . . . . . . . . . . . . . . . . . . . . $56,702.4 $57,739.6 $45,537.0 $(1,037.2) (1.8)% $12,202.6 26.8%
(1) Consists of long/short equity, real estate, master-limited partnerships and other.(2) Consists of cash management and options strategies. Options strategies were $467.7 million, $1,403.6
million and $1,283.2 million at December 31, 2014, 2013 and 2012, respectively.
Average Assets Under Management and Average Basis Points
The following table summarizes average assets under management and the average management fee earned:
As of December 31,
Average Fee Earned(expressed in basis points)
Average Assets Under Management($ in millions)
2014 2013 2012 2014 2013 2012
ProductsMutual Funds—Long-term Open-End (1)(2) . . . . . . 51.3 51.1 50.5 $38,349.2 $32,520.4 $21,446.5Mutual Funds—Closed-End . . . . . . . . . . . . . . . . . . . 65.6 61.6 58.8 7,112.9 6,476.0 6,014.9Mutual Funds—Money Market Open-End (1) . . . . . — 1.6 4.2 1,060.1 1,700.7 1,845.7Variable Insurance Funds (1) . . . . . . . . . . . . . . . . . . . 50.9 56.5 48.4 1,271.1 1,300.6 1,319.8Separately Managed Accounts (3) . . . . . . . . . . . . . . . 51.9 48.7 50.7 6,774.2 6,471.4 4,586.0Institutional Accounts (3) . . . . . . . . . . . . . . . . . . . . . 35.5 33.7 30.7 4,554.6 4,506.7 4,418.6
All Products . . . . . . . . . . . . . . . . . . . . . . . . . . . 50.9 49.2 47.4 $59,122.1 $52,975.8 $39,631.5
(1) Average fees earned are net of fees paid to unaffiliated subadvisers.(2) Excludes the impact of consolidated sponsored investment products.(3) Includes assets under management related to options strategies.
Long-term and money market open-end mutual fund and variable insurance fund fees are calculated basedon average daily net assets. Closed-end fund fees are calculated based on either average weekly or daily netassets. Average fees earned will vary based on several factors, including the asset mix and reimbursements tofunds. Separately managed account fees are calculated based on the end of the preceding or current quarter’sasset values or on an average of month-end balances. Institutional account fees are calculated based on anaverage of month-end balances or current quarter’s asset values.
28
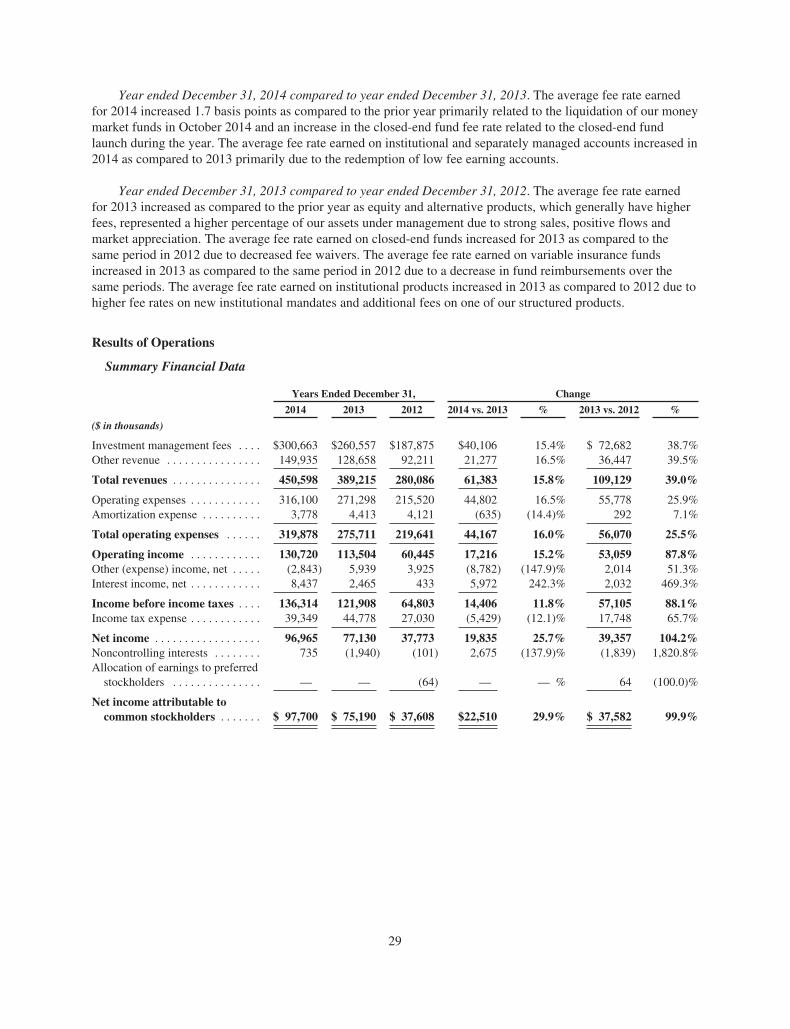
Year ended December 31, 2014 compared to year ended December 31, 2013. The average fee rate earnedfor 2014 increased 1.7 basis points as compared to the prior year primarily related to the liquidation of our moneymarket funds in October 2014 and an increase in the closed-end fund fee rate related to the closed-end fundlaunch during the year. The average fee rate earned on institutional and separately managed accounts increased in2014 as compared to 2013 primarily due to the redemption of low fee earning accounts.
Year ended December 31, 2013 compared to year ended December 31, 2012. The average fee rate earnedfor 2013 increased as compared to the prior year as equity and alternative products, which generally have higherfees, represented a higher percentage of our assets under management due to strong sales, positive flows andmarket appreciation. The average fee rate earned on closed-end funds increased for 2013 as compared to thesame period in 2012 due to decreased fee waivers. The average fee rate earned on variable insurance fundsincreased in 2013 as compared to the same period in 2012 due to a decrease in fund reimbursements over thesame periods. The average fee rate earned on institutional products increased in 2013 as compared to 2012 due tohigher fee rates on new institutional mandates and additional fees on one of our structured products.
Results of Operations
Summary Financial Data
Years Ended December 31, Change
2014 2013 2012 2014 vs. 2013 % 2013 vs. 2012 %
($ in thousands)
Investment management fees . . . . $300,663 $260,557 $187,875 $40,106 15.4% $ 72,682 38.7%Other revenue . . . . . . . . . . . . . . . . 149,935 128,658 92,211 21,277 16.5% 36,447 39.5%
Total revenues . . . . . . . . . . . . . . . 450,598 389,215 280,086 61,383 15.8% 109,129 39.0%
Operating expenses . . . . . . . . . . . . 316,100 271,298 215,520 44,802 16.5% 55,778 25.9%Amortization expense . . . . . . . . . . 3,778 4,413 4,121 (635) (14.4)% 292 7.1%
Total operating expenses . . . . . . 319,878 275,711 219,641 44,167 16.0% 56,070 25.5%
Operating income . . . . . . . . . . . . 130,720 113,504 60,445 17,216 15.2% 53,059 87.8%Other (expense) income, net . . . . . (2,843) 5,939 3,925 (8,782) (147.9)% 2,014 51.3%Interest income, net . . . . . . . . . . . . 8,437 2,465 433 5,972 242.3% 2,032 469.3%
Income before income taxes . . . . 136,314 121,908 64,803 14,406 11.8% 57,105 88.1%Income tax expense . . . . . . . . . . . . 39,349 44,778 27,030 (5,429) (12.1)% 17,748 65.7%
Net income . . . . . . . . . . . . . . . . . . 96,965 77,130 37,773 19,835 25.7% 39,357 104.2%Noncontrolling interests . . . . . . . . 735 (1,940) (101) 2,675 (137.9)% (1,839) 1,820.8%Allocation of earnings to preferred
stockholders . . . . . . . . . . . . . . . — — (64) — — % 64 (100.0)%
Net income attributable tocommon stockholders . . . . . . . $ 97,700 $ 75,190 $ 37,608 $22,510 29.9% $ 37,582 99.9%
29

Revenues
Revenues by source were as follows:
Years Ended December 31, Change
($ in thousands) 2014 2013 2012 2014 vs. 2013 % 2013 vs. 2012 %
Investment management feesMutual funds . . . . . . . . . . . . . . . . . . . . . . . . . $242,880 $206,516 $144,688 $36,364 17.6% $ 61,828 42.7%Separately managed accounts . . . . . . . . . . . . 35,152 31,510 23,245 3,642 11.6% 8,265 35.6%Institutional accounts . . . . . . . . . . . . . . . . . . . 16,156 15,184 13,554 972 6.4% 1,630 12.0%Variable products . . . . . . . . . . . . . . . . . . . . . 6,475 7,347 6,388 (872) (11.9)% 959 15.0%
Total investment management fees . . . . . . 300,663 260,557 187,875 40,106 15.4% 72,682 38.7%Distribution and service fees . . . . . . . . . . . 91,950 78,965 56,866 12,985 16.4% 22,099 38.9%Administration and transfer agent fees . . . 56,016 48,185 33,779 7,831 16.3% 14,406 42.6%Other income and fees . . . . . . . . . . . . . . . . . 1,969 1,508 1,566 461 30.6% (58) (3.7)%
Total revenues . . . . . . . . . . . . . . . . . . . . . . . $450,598 $389,215 $280,086 $61,383 15.8% $109,129 39.0%
Investment Management Fees
Year ended December 31, 2014 compared to year ended December 31, 2013. Investment management feesare earned based on a percentage of assets under management and are paid pursuant to the terms of the respectiveinvestment management contracts, which generally require monthly or quarterly payments. Investmentmanagement fees increased by $40.1 million or 15.4% for the year ended December 31, 2014 due to an 11.6%increase in average assets under management and an increase of approximately two basis points in average feerate earned. The increase in average assets under management for the year ended December 31, 2014 was dueprimarily to the 2013 growth in assets under management. Revenues increased at a higher rate than assets undermanagement due to the increase in the average fee rate earned and the timing of flows during the year.
Year ended December 31, 2013 compared to year ended December 31, 2012. Investment management feesincreased by $72.7 million or 38.7% for the year ended December 31, 2013 due to a 33.7% increase in averageassets under management and an increase of approximately two basis points in average fee rate earned. Theincrease in average assets under management for the year ended December 31, 2013 was due primarily to overallpositive net flows of $8.1 billion resulting from higher sales of long-term open-end mutual funds in 2013 andmarket appreciation of $4.9 billion. Revenues increased at a higher rate than assets under management due to theincrease in the average fee rate earned and the mix of assets. Cash management assets represented 2.7% of totalassets under management at December 31, 2013 compared to 4.5% at December 31, 2012.
Distribution and Service Fees
Year ended December 31, 2014 compared to year ended December 31, 2013. Distribution and service fees,which are asset-based fees earned from open-end mutual funds and variable insurance funds for distributionservices, increased by $13.0 million or 16.4% for the year ended December 31, 2014 as compared to the prioryear due to higher average long-term open-end assets under management. The increase in fees also resulted in acorresponding increase in distribution and administrative expenses, primarily driven by increased payments tothird-party distribution partners for providing services to investors in our sponsored funds, including marketingsupport services.
Year ended December 31, 2013 compared to year ended December 31, 2012. Distribution and service feesincreased by $22.1 million or 38.9% for the year ended December 31, 2013 as compared to the prior year due tohigher assets under management. The increase in fees also resulted in a corresponding increase in distributionand administrative expenses, primarily driven by increased payments to our third-party distribution partners forproviding services to investors in our sponsored funds.
30
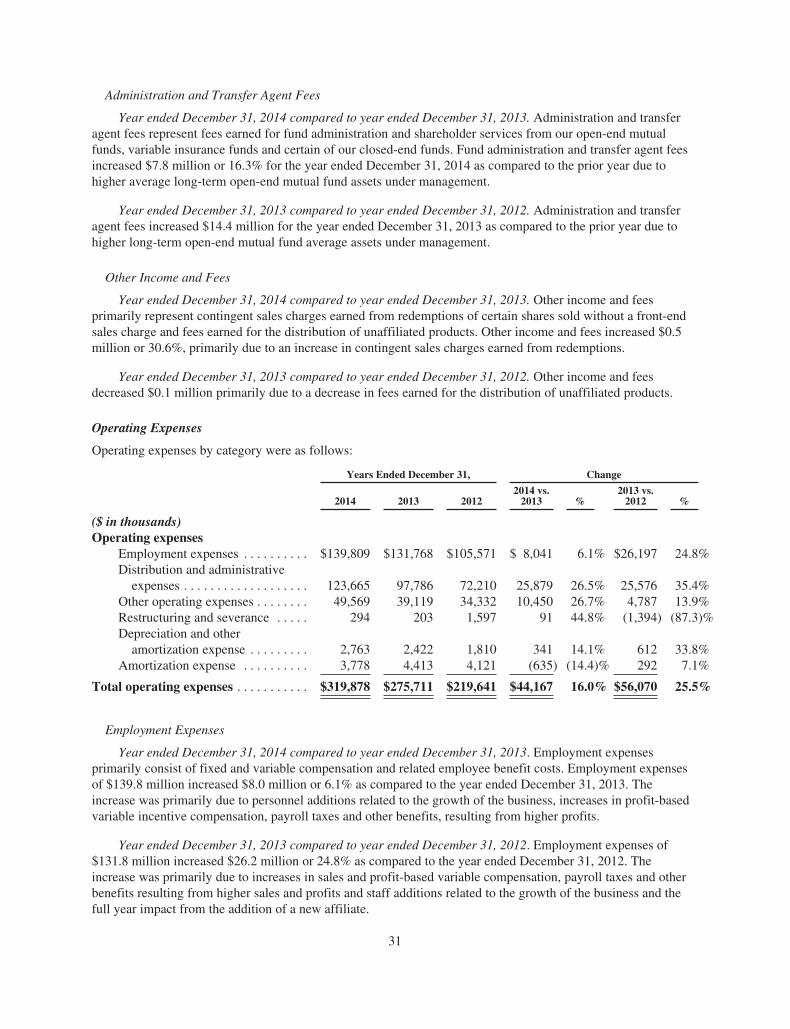
Administration and Transfer Agent Fees
Year ended December 31, 2014 compared to year ended December 31, 2013. Administration and transferagent fees represent fees earned for fund administration and shareholder services from our open-end mutualfunds, variable insurance funds and certain of our closed-end funds. Fund administration and transfer agent feesincreased $7.8 million or 16.3% for the year ended December 31, 2014 as compared to the prior year due tohigher average long-term open-end mutual fund assets under management.
Year ended December 31, 2013 compared to year ended December 31, 2012. Administration and transferagent fees increased $14.4 million for the year ended December 31, 2013 as compared to the prior year due tohigher long-term open-end mutual fund average assets under management.
Other Income and Fees
Year ended December 31, 2014 compared to year ended December 31, 2013. Other income and feesprimarily represent contingent sales charges earned from redemptions of certain shares sold without a front-endsales charge and fees earned for the distribution of unaffiliated products. Other income and fees increased $0.5million or 30.6%, primarily due to an increase in contingent sales charges earned from redemptions.
Year ended December 31, 2013 compared to year ended December 31, 2012. Other income and feesdecreased $0.1 million primarily due to a decrease in fees earned for the distribution of unaffiliated products.
Operating Expenses
Operating expenses by category were as follows:
Years Ended December 31, Change
2014 2013 20122014 vs.
2013 %2013 vs.
2012 %
($ in thousands)Operating expenses
Employment expenses . . . . . . . . . . $139,809 $131,768 $105,571 $ 8,041 6.1% $26,197 24.8%Distribution and administrative
expenses . . . . . . . . . . . . . . . . . . . 123,665 97,786 72,210 25,879 26.5% 25,576 35.4%Other operating expenses . . . . . . . . 49,569 39,119 34,332 10,450 26.7% 4,787 13.9%Restructuring and severance . . . . . 294 203 1,597 91 44.8% (1,394) (87.3)%Depreciation and other
amortization expense . . . . . . . . . 2,763 2,422 1,810 341 14.1% 612 33.8%Amortization expense . . . . . . . . . . 3,778 4,413 4,121 (635) (14.4)% 292 7.1%
Total operating expenses . . . . . . . . . . . $319,878 $275,711 $219,641 $44,167 16.0% $56,070 25.5%
Employment Expenses
Year ended December 31, 2014 compared to year ended December 31, 2013. Employment expensesprimarily consist of fixed and variable compensation and related employee benefit costs. Employment expensesof $139.8 million increased $8.0 million or 6.1% as compared to the year ended December 31, 2013. Theincrease was primarily due to personnel additions related to the growth of the business, increases in profit-basedvariable incentive compensation, payroll taxes and other benefits, resulting from higher profits.
Year ended December 31, 2013 compared to year ended December 31, 2012. Employment expenses of$131.8 million increased $26.2 million or 24.8% as compared to the year ended December 31, 2012. Theincrease was primarily due to increases in sales and profit-based variable compensation, payroll taxes and otherbenefits resulting from higher sales and profits and staff additions related to the growth of the business and thefull year impact from the addition of a new affiliate.
31
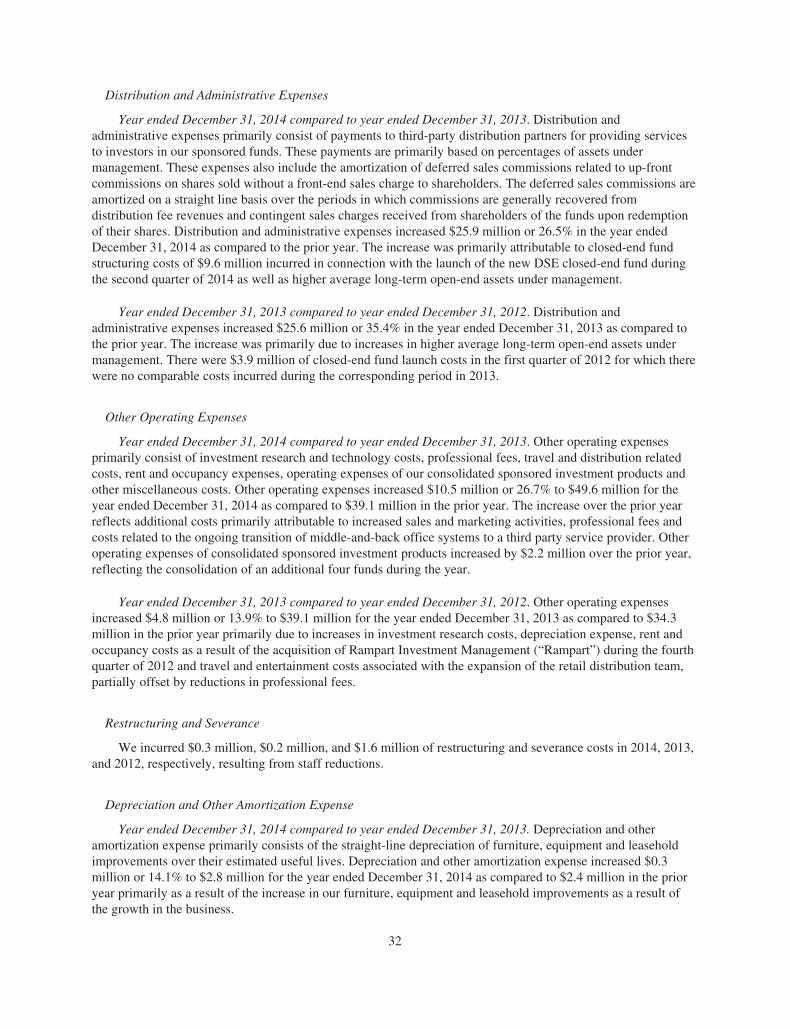
Distribution and Administrative Expenses
Year ended December 31, 2014 compared to year ended December 31, 2013. Distribution andadministrative expenses primarily consist of payments to third-party distribution partners for providing servicesto investors in our sponsored funds. These payments are primarily based on percentages of assets undermanagement. These expenses also include the amortization of deferred sales commissions related to up-frontcommissions on shares sold without a front-end sales charge to shareholders. The deferred sales commissions areamortized on a straight line basis over the periods in which commissions are generally recovered fromdistribution fee revenues and contingent sales charges received from shareholders of the funds upon redemptionof their shares. Distribution and administrative expenses increased $25.9 million or 26.5% in the year endedDecember 31, 2014 as compared to the prior year. The increase was primarily attributable to closed-end fundstructuring costs of $9.6 million incurred in connection with the launch of the new DSE closed-end fund duringthe second quarter of 2014 as well as higher average long-term open-end assets under management.
Year ended December 31, 2013 compared to year ended December 31, 2012. Distribution andadministrative expenses increased $25.6 million or 35.4% in the year ended December 31, 2013 as compared tothe prior year. The increase was primarily due to increases in higher average long-term open-end assets undermanagement. There were $3.9 million of closed-end fund launch costs in the first quarter of 2012 for which therewere no comparable costs incurred during the corresponding period in 2013.
Other Operating Expenses
Year ended December 31, 2014 compared to year ended December 31, 2013. Other operating expensesprimarily consist of investment research and technology costs, professional fees, travel and distribution relatedcosts, rent and occupancy expenses, operating expenses of our consolidated sponsored investment products andother miscellaneous costs. Other operating expenses increased $10.5 million or 26.7% to $49.6 million for theyear ended December 31, 2014 as compared to $39.1 million in the prior year. The increase over the prior yearreflects additional costs primarily attributable to increased sales and marketing activities, professional fees andcosts related to the ongoing transition of middle-and-back office systems to a third party service provider. Otheroperating expenses of consolidated sponsored investment products increased by $2.2 million over the prior year,reflecting the consolidation of an additional four funds during the year.
Year ended December 31, 2013 compared to year ended December 31, 2012. Other operating expensesincreased $4.8 million or 13.9% to $39.1 million for the year ended December 31, 2013 as compared to $34.3million in the prior year primarily due to increases in investment research costs, depreciation expense, rent andoccupancy costs as a result of the acquisition of Rampart Investment Management (“Rampart”) during the fourthquarter of 2012 and travel and entertainment costs associated with the expansion of the retail distribution team,partially offset by reductions in professional fees.
Restructuring and Severance
We incurred $0.3 million, $0.2 million, and $1.6 million of restructuring and severance costs in 2014, 2013,and 2012, respectively, resulting from staff reductions.
Depreciation and Other Amortization Expense
Year ended December 31, 2014 compared to year ended December 31, 2013. Depreciation and otheramortization expense primarily consists of the straight-line depreciation of furniture, equipment and leaseholdimprovements over their estimated useful lives. Depreciation and other amortization expense increased $0.3million or 14.1% to $2.8 million for the year ended December 31, 2014 as compared to $2.4 million in the prioryear primarily as a result of the increase in our furniture, equipment and leasehold improvements as a result ofthe growth in the business.
32
Year ended December 31, 2013 compared to year ended December 31, 2012. Depreciation and otheramortization expense increased $0.6 million or 33.8% to $2.4 million for the year ended December 31, 2013 ascompared to $1.8 million in the prior year primarily as a result of the increase in our furniture, equipment andleasehold improvements as a result of the growth in the business.
Amortization Expense
Year ended December 31, 2014 compared to year ended December 31, 2013. Amortization expenseprimarily consists of the straight-line amortization of acquired investment advisory contracts, recorded asdefinite-lived intangible assets, over their estimated useful lives. Amortization expense was $3.8 million during2014, representing a decrease of $0.6 million or 14.4%, compared to 2013. The decrease was primarily due tocertain definite-lived intangible assets becoming fully amortized during 2014.
Year ended December 31, 2013 compared to year ended December 31, 2012. Amortization expense of $4.4million for the year ended December 31, 2013 increased from the prior year by $0.3 million or 7.1% due to theaddition of intangible assets as a result of the acquisition of Rampart in 2012.
Other Income (Expense), net
Year ended December 31, 2014 compared to year ended December 31, 2013. Other income (expense), netprimarily consists of realized and unrealized gains and losses recorded on investments, investments ofconsolidated sponsored investment products as well as earnings from equity method investments. Other income(expense), net, decreased from the prior year by $8.8 million or 147.9%. Excluding investments of consolidatedsponsored investment products, Other income (expense), net decreased $0.6 million primarily due to a decreasein realized and unrealized gains on investments partially offset by an increase in earnings on equity methodinvestments. Investments of consolidated sponsored investment products recognized $4.6 million of unrealizedlosses during 2014 versus $3.5 million of unrealized gains during the prior year.
Year ended December 31, 2013 compared to year ended December 31, 2012. Other income (expense), netincreased from the prior year by $2.0 million or 51.3% due to increases in the market value of trading securitiesand realized and unrealized gains related to investments of consolidated sponsored investment products.
Interest Income (Expense), net
Year ended December 31, 2014 compared to year ended December 31, 2013. Interest income, net consistsof interest and dividend income earned on cash equivalents, investments and the investments of our consolidatedsponsored investment products. Interest income, net increased $6.0 million or 242.3% in 2014 compared to theprior year. The increase in interest income, net was primarily due to higher interest and dividend income earnedon our investments and the investments of our consolidated sponsored investment products. Investments ofconsolidated sponsored investment products have grown $97.6 million, or 70.2% during 2014 from $139.1million at December 31, 2013 to $236.7 million at December 31, 2014.
Year ended December 31, 2013 compared to year ended December 31, 2012. Interest income (expense), netincreased $2.0 million for the year ended December 31, 2013 compared to the prior year. The increase in interestincome (expense), net was due to higher interest and dividend income earned on investments of our consolidatedsponsored investment products and $0.1 million in lower interest expense for the year since we repaid our debtoutstanding during the third quarter of 2013. During September 2013, we repaid the entire outstanding balanceunder our amended senior secured revolving credit facility (“Credit Facility”). The effective interest rate on ouroutstanding long-term debt, inclusive of the amortization of deferred financing costs, was 4.77% through theperiod we had outstanding debt in 2013 as compared to 5.05% as of December 31, 2012. The decrease in oureffective interest rate was due to the decrease in our interest rate based on the terms of our Credit Facility.
33

Income Tax Expense
Year ended December 31, 2014 compared to year ended December 31, 2013. The provision for incometaxes reflected U.S. federal, state and local taxes at an estimated effective tax rate of 28.9% and 36.7% for 2014and 2013, respectively. Our effective tax rate for 2014 was impacted by a net tax benefit of approximately $15.5million due to the resolution of uncertain tax positions partially offset by a $2.2 million valuation allowanceprimarily related to unrealized mark-to-market loss positions on our seed capital portfolio.
Year ended December 31, 2013 compared to year ended December 31, 2012. The provision for incometaxes reflected federal, state and local taxes at an estimated annual effective tax rate of 36.7% and 41.7%, for theyears ended December 31, 2013 and 2012, respectively. The primary difference in the annual effective tax ratefor 2013 compared to 2012 was attributable to a reduction of the recorded value of our state net deferred tax assetof $3.4 million in 2012 due to an expected decrease in our state tax rate.
Effects of Inflation
Inflation can impact our organization primarily in two ways. First, inflationary pressures can result inincreases to our cost structure, especially to the extent that large expense components such as compensation areimpacted. To the degree that these expense increases are not recoverable or cannot be counterbalanced throughpricing increases due to the competitive environment, our profitability could be negatively impacted. Secondly,the value of the assets that we manage may be negatively impacted when inflationary expectations result in arising interest rate environment. Declines in the values of these assets under management could lead to reducedrevenues as management fees are generally earned as a percent of assets under management.
Liquidity and Capital Resources
Certain Financial Data
The following tables summarize certain key financial data relating to our liquidity and capital resources:
As of December 31, Change
($ in thousands) 2014 2013 20122014 vs.
2013 %2013 vs.
2012 %
Balance Sheet Data (1)Cash and cash equivalents . . . . . . . . . $202,847 $271,014 $ 63,432 $ (68,167) (25.2)% $207,582 327.3%Investments . . . . . . . . . . . . . . . . . . . . 63,448 37,258 18,433 26,190 70.3% 18,825 102.1%Deferred taxes, net . . . . . . . . . . . . . . . 60,162 64,500 96,923 (4,338) (6.7)% (32,423) (33.5)%Dividends payable . . . . . . . . . . . . . . . 4,270 — — 4,270 100.0% — — %Debt . . . . . . . . . . . . . . . . . . . . . . . . . . — — 15,000 — — % (15,000) (100.0)%Total equity . . . . . . . . . . . . . . . . . . . . 563,352 492,868 244,471 70,484 14.3% 248,397 101.6%Net assets of consolidated sponsored
investment products (1) . . . . . . . . . 216,672 98,433 40,397 118,239 120.1% 58,036 143.7%
Years Ended December 31,
2014 2013 2012
Cash Flow Data (1)Provided by (used in)Operating activities . . . . . . . . . . . . . . . . . . . . . . . . . . . . . . . . . . . . . . . . . . . . . . . $(58,871) $ 28,837 $ 39,818Investing activities . . . . . . . . . . . . . . . . . . . . . . . . . . . . . . . . . . . . . . . . . . . . . . . . (8,181) (6,231) (5,167)Financing activities . . . . . . . . . . . . . . . . . . . . . . . . . . . . . . . . . . . . . . . . . . . . . . . (1,189) 185,493 (16,472)
(1) Net assets of consolidated sponsored investment products were comprised of $252.3, $149.2 and $43.9million of total assets, $12.6, $8.6 and $0.3 million of total liabilities and $23.1, $42.2 and $3.2 million ofredeemable noncontrolling interests at December 31, 2014, 2013 and 2012, respectively.
34
Overview
We maintained significant liquidity and capital resources during the year ended December 31, 2014. AtDecember 31, 2014, we had $202.8 million of cash and cash equivalents and $50.3 million of investments inmarketable securities compared to $271.0 million of cash and cash equivalents and $29.0 million of investmentsin marketable securities at December 31, 2013. We have additional liquidity available through a Credit Facilitythat allows us to borrow up to $75.0 million that expires in September 2017. Under the terms of the underlyingcredit agreement, we can increase this facility to $125.0 million upon satisfaction of certain approvalrequirements. At December 31, 2014, we had no outstanding borrowings under the Credit Facility.
Short-Term Capital Requirements
Our short-term capital requirements, which we consider to be those capital requirements due within oneyear, include payment of annual incentive compensation, income tax payments and other operating expenses,primarily consisting of investment research and technology costs, professional fees, distribution and occupancycosts. Incentive compensation, which is one of the largest annual operating cash expenditures, is paid in the firstquarter of the year. In the first quarter of 2014 and 2013, we paid approximately $45.0 million and $33.0 million,respectively, in incentive compensation earned during the years ended December 31, 2013 and 2012,respectively. Short-term capital requirements may also be affected by employee tax withholding paymentsrelated to the net share settlement of equity awards. The Company paid $9.5 million and $7.5 million inminimum employee tax withholding obligations related to net share settlements in 2014 and 2013, respectively.These net share settlements had the effect of share repurchases by the Company as they reduced the number ofshares that otherwise would have been issued as a result of the vesting or exercise. The amount of employee taxwithholdings we pay in future periods will vary based on our stock price, the number of equity awards net settledduring the period and whether we and our employees elect to satisfy withholding taxes through net sharesettlement. Approximately 65,700 restricted stock units (“RSUs”) are expected to vest in March 2015 that mayrequire a cash outlay related to minimum employee tax withholdings.
Other Uses of Capital
We expect that our main uses of cash will be to (i) invest in our organic growth, including our distributionefforts and closed-end fund launches; (ii) seed new investment strategies and mutual funds to introduce newproducts or to enhance distribution access; (iii) return of capital to stockholders through acquisition of shares ofour common stock, payment of cash dividends on our common stock or other means; (iv) fund ongoing andpotential investments in our infrastructure to achieve greater economies of scale and a more efficient overall coststructure; and (v) invest in inorganic growth opportunities as they arise.
In August and November 2014, we paid cash dividends on our common stock in the amount of $0.45 pershare, respectively, totaling $8.2 million. On December 10, 2014, our Board of Directors approved a third cashdividend on our common stock in the amount of $0.45 per share to holders of record at the close of business onJanuary 30, 2015 which was paid on February 13, 2015. The amount paid for this dividend was $4.0 million. OnFebruary 18, 2015, our Board of Directors declared a quarterly cash dividend of $0.45 per common share to bepaid on May 13, 2015 to shareholders of record at the close of business on April 30, 2015. In addition, during2014 we paid approximately $40.3 million to repurchase a total of 225,441 common shares under the boardauthorized share repurchase program. During 2013, we paid approximately $19.7 million to repurchase 105,000common shares under the same program.
Capital and Reserve Requirements
VPD, a wholly-owned subsidiary of the Company, is a broker-dealer registered with the SEC and istherefore subject to certain rules regarding minimum net capital, as defined by those rules. VPD is required tomaintain a ratio of “aggregate indebtedness” to “net capital,” as defined, which may not exceed 15 to 1 and mustalso maintain a minimum amount of net capital. Failure to meet these requirements could result in adverseconsequences to us including additional reporting requirements, a lower required ratio of aggregate indebtedness
35

to net capital or interruption of our business. At December 31, 2014 and 2013, the ratio of aggregate indebtednessto net capital of our broker-dealer was below the maximum allowed, and its net capital was significantly greaterthan the required minimum.
Balance Sheet
Cash and cash equivalents consist of cash in banks and money market fund investments. Cash and cashequivalents typically increase in the second, third and fourth quarters of the year as we record, but do not pay,variable incentive compensation. Investments consist primarily of investments in our affiliated mutual funds.Consolidated sponsored investment products primarily represent investment products we sponsor and where weown a majority of the voting interest in the entity. As of December 31, 2014, we consolidated a total of 12sponsored investment products. At both December 31, 2014 and 2013, we had no debt outstanding.
Operating Cash Flow
Net cash used in operating activities of $58.9 million for 2014 decreased by $87.7 million from net cashprovided by operating activities of $28.8 million in the prior year due primarily to increases in net purchases ofinvestments by consolidated sponsored investment products of $95.2 million. Excluding the net purchases ofinvestments by consolidated sponsored investment products, net cash provided by operating activities increased$7.5 million. This increase is primarily attributable to increases in cash pledged or on deposit of consolidatedsponsored investment products, increases in the recognition of excess tax benefits from stock-basedcompensation and decreased deferred income taxes and accrued compensation, accounts payable and accruedliabilities, partially offset by cash generated from increased operating profitability and increases in sales oftrading securities, net.
Net cash provided by operating activities of $28.8 million for the year ended December 31, 2013 declinedby $11.0 million from net cash provided by operating activities of $39.8 million in the prior year due primarily toincreases in purchases of investments by consolidated sponsored investment products, payments of deferredcommissions, accounts receivable and realized and unrealized gains on investments of consolidated sponsoredinvestment products offset by an increase in our net income, amortization of deferred commissions and accruedcompensation, accounts payable and accrued liabilities. Cash flows from operating activities for the year endedDecember 31, 2013 included the expected utilization of deferred tax assets to reduce current taxes payable in theamount of $32.6 million.
Investing Cash Flow
Net cash used in investing activities consists primarily of capital expenditures and other investing activitiesrelated to our business operations. Net cash used in investing activities of $8.2 million for 2014 increased by $2.0million from net cash used in investing activities of $6.2 million in the prior year due to an increase in theamount paid for asset acquisitions of equity method and other investments in the current year as compared to theprior year.
Net cash used in investing activities of $6.2 million for the year ended December 31, 2013 increased by $1.1million from net cash used in investing activities of $5.2 million in the prior year due primarily to the acquisitionof our equity method investment in Kleinwort Benson Investors International, Ltd. as well as the change in cashand cash equivalents as a result of the deconsolidation of certain consolidated sponsored investment productsoffset by a decrease in capital expenditures of approximately $1.8 million.
Financing Cash Flow
Cash flows used in financing activities consist primarily of repurchases of our common stock, payments tosettle minimum tax withholding obligations for the net share settlement of employee share transactions,payments of cash dividends on our common stock and contributions to noncontrolling interests related to ourconsolidated sponsored investment products. Net cash used in financing activities decreased $186.7 million to
36

$1.2 million in 2014 compared to net cash provided by financing activities of $185.5 million in the prior year.The primary reason for the decrease was due to proceeds of $191.8 million from the issuance of 1.3 millionshares of our common stock in the prior year with no such issuance in the current year. Also contributing to thechange in 2014 was increased repurchases of our common stock of $20.6 million and dividends paid of $8.2million, partially offset by the repayment of the entire $15.0 million of debt outstanding in the prior year that didnot recur in 2014. During the 2014, we received $24.8 million in excess tax benefits from stock-basedcompensation compared to $0.5 million received in the prior year.
For the year ended December 31, 2013, net cash provided by financing activities of $185.5 million consistedprimarily of net proceeds of $191.8 million from the issuance of 1.3 million shares of common stock in a publicoffering, $35.5 million in third-party contributions to the noncontrolling interests in our consolidated sponsoredinvestment products and $0.6 million in proceeds from stock option exercises offset by the repayment of the totalamount outstanding of $15.0 million on our Credit Facility, repurchases of our common stock of $19.7 million,payments to settle minimum tax withholding obligations for the net share settlement of RSUs of $7.5 million andcontingent payments made related to acquired investment management contracts of $0.6 million.
Debt
Our Credit Facility, as amended and restated, has a five-year term expiring in September 2017 and providesborrowing capacity of up to $75.0 million with a $7.5 million sub-limit for the issuance of standby letters ofcredit. In addition, the Credit Facility provides for a $50.0 million increase in borrowing capacity conditioned onapproval by the lending group. The Credit Facility is secured by substantially all of our assets. At December 31,2014 and 2013, no amount was outstanding under the Credit Facility. As of December 31, 2014 and 2013, wehad the capacity to draw on the entire $75.0 million available under the Credit Facility.
Amounts outstanding under the Credit Facility bear interest at an annual rate equal to, at our option, eitherLIBOR for interest periods of 1, 2, 3 or 6 months or an alternate base rate (as defined in the Credit Facilityagreement), plus, in each case, an applicable margin, that ranges from 0.75% to 2.50%. Under the terms of theCredit Facility, we are also required to pay certain fees, including an annual commitment fee that ranges from0.35% to 0.50% on undrawn amounts and a letter of credit participation fee at an annual rate equal to theapplicable margin as well as any applicable fronting fees, each of which is payable quarterly in arrears.
The Credit Facility contains customary covenants, including covenants that restrict (subject in certaininstances to minimum thresholds or exceptions) our and certain of our subsidiaries’ ability to incur additionalindebtedness, create liens, merge or make acquisitions, dispose of assets, enter into leases, sale/leasebacks oracquisitions of capital stock, and make loans, guarantees and investments, among other things. In addition, theCredit Facility contains certain financial covenants, the most restrictive of which include: (i) a minimum interestcoverage ratio (generally, adjusted EBITDA to interest expense as defined in and for the period specified in theCredit Facility agreement) of at least 4.00:1, and (ii) a leverage ratio (generally, total debt as of any date toadjusted EBITDA as defined in and for the period specified in the Credit Facility agreement) of no greater than2.75:1. For purposes of the Credit Facility, adjusted EBITDA generally means, for any period, our net incomebefore interest expense, income taxes, depreciation and amortization expense, and excluding non-cash stock-based compensation, unrealized mark-to-market gains and losses, certain severance, and certain non-cash non-recurring gains and losses as described in and specified under the Credit Facility. At December 31, 2014, wewere in compliance with all financial covenants under the Credit Facility.
The Credit Facility agreement also contains customary provisions regarding events of default which couldresult in an acceleration of amounts due under the facility. Such events of default include our failure to payprincipal or interest when due, our failure to satisfy or comply with covenants, a change of control, theimposition of certain judgments, the invalidation of liens we have granted and a cross-default to other debtobligations.
37

Contractual Obligations
The following table summarizes our contractual obligations as of December 31, 2014:
Payments Due
($ in millions) TotalLess Than
1 Year 1-3 Years 3-5 YearsMore Than
5 Years
Lease obligations . . . . . . . . . . . . . . . . . . . . . . . . . . . . . . . . . . $20.5 $3.7 $10.7 $ 3.8 $ 2.3Credit Facility, including commitment fee (1) . . . . . . . . . . . . 0.7 0.3 0.4 — —Minimum payments on service contracts (2) . . . . . . . . . . . . . 13.0 4.9 7.5 0.6 —
Total . . . . . . . . . . . . . . . . . . . . . . . . . . . . . . . . . . . . . . . . . . . . $34.2 $8.9 $18.6 $ 4.4 $ 2.3
(1) At December 31, 2014, we had no amount outstanding under our Credit Facility, which has a variableinterest rate. Amounts outstanding under the Credit Facility bear interest at an annual rate equal to, at ouroption, either LIBOR for interest periods of one, two, three or six months or an alternate base rate, plus, ineach case, an applicable margin, that ranges from 0.75% to 2.50%. We are also required to pay an annualcommitment fee that ranges from 0.35% to 0.50% on undrawn amounts. Payments due are estimated basedon the commitment fee rate of 0.35% in effect on December 31, 2014.
(2) Service contracts include contractual amounts that will be due to purchase goods and services to be used inour operations and may be canceled at earlier times than those indicated under certain conditions that mayinclude termination fees.
Impact of New Accounting Standards
For a discussion of accounting standards, see Note 2 to our consolidated financial statements.
Off-Balance Sheet Arrangements
We do not invest in any off-balance sheet vehicles that provide liquidity, capital resources, market or creditrisk support, or engage in any leasing activities that expose us to any liability that is not reflected in ourconsolidated financial statements.
Critical Accounting Policies and Estimates
The Company’s consolidated financial statements and the accompanying notes are prepared in accordancewith Generally Accepted Accounting Principles, which requires the use of estimates. Actual results will varyfrom these estimates. Management believes the following critical accounting policies are important tounderstanding our results of operations and financial position.
Consolidation
The consolidated financial statements include the accounts of the Company, its subsidiaries and sponsoredinvestment products in which it has a controlling financial interest. The Company is generally considered to havea controlling financial interest when it owns a majority of the voting interest in an entity or otherwise has thepower to govern the financial and operating policies of the subsidiary. See Note 19 to our consolidated financialstatements for additional information related to the consolidation of sponsored investment products.
The Company also evaluates any variable interest entities (“VIEs”) in which the Company has a variableinterest for consolidation. A VIE is an entity in which either (a) the equity investment at risk is not sufficient topermit the entity to finance its own activities without additional financial support or (b) where as a group, theholders of the equity investment at risk do not possess: (i) the power to direct the activities that most significantlyimpact the entity’s performance; (ii) the obligation to absorb expected losses or the right to receive expected
38
residual returns of the entity; or (iii) proportionate voting and economic interests and where substantially all ofthe entity’s activities either involve or are conducted on behalf of the equity holders. If any entity has any ofthese characteristics, it is considered a VIE and required to be consolidated by its primary beneficiary. Theprimary beneficiary is the entity that has both the power to direct the activities that most significantly impact theVIE’s economic performance and has the obligation to absorb losses of, or the right to receive benefits from, theVIE that could potentially be significant to the VIE.
Fair Value Measurements and Fair Value of Financial Instruments
The Financial Accounting Standards Board (“FASB”) defines fair value as the price that would be receivedto sell an asset, or paid to transfer a liability, in an orderly transaction between market participants at themeasurement date. Accounting Standards Codification (“ASC”) 820, Fair Value Measurements and Disclosures,establishes a framework for measuring fair value and a valuation hierarchy based upon the transparency of inputsused in the valuation of an asset or liability. Classification within the hierarchy is based upon the lowest level ofinput that is significant to the fair value measurement. The valuation hierarchy contains three levels as follows:
Level 1 – Quoted prices for identical instruments in active markets. Level 1 assets and liabilities mayinclude debt securities and equity securities that are traded in an active exchange market.
Level 2 – Quoted prices for similar instruments in active markets; quoted prices for identical or similarinstruments in markets that are not active; and model-derived valuations in which all significant inputs andsignificant value drivers are observable in active markets. Level 2 inputs may include observable marketdata such as closing market prices provided by independent pricing services after considering factors suchas the yields or prices of comparable investments of comparable quality, coupon, maturity, call rights andother potential prepayments, terms and type, reported transactions, indications as to values from dealers andgeneral market conditions. In addition, pricing services may determine the fair value of equity securitiestraded principally in foreign markets when it has been determined that there has been a significant trend inthe U.S. equity markets or in index futures trading. Level 2 assets and liabilities may include debt and equitysecurities, purchased loans and over-the-counter derivative contracts whose fair value is determined using apricing model without significant unobservable market data inputs.
Level 3 – Valuations derived from valuation techniques in which one or more significant inputs orsignificant value drivers are unobservable in active exchange markets.
The following is a discussion of the valuation methodologies used for the Company’s assets measured at fairvalue.
Sponsored funds represent investments in open-end mutual funds, variable insurance funds and closed-endfunds for which we act as the investment manager. The fair value of open-end mutual funds and variableinsurance funds is determined based on their published net asset values and are categorized as Level 1. The fairvalue of closed-end funds is determined based on the official closing price of the exchange they are traded on andare categorized as Level 1.
Equity securities include securities traded on active markets and are valued at the official closing price(typically last sale or bid) on the exchange on which the securities are primarily traded and are categorized asLevel 1.
Nonqualified retirement plan assets represent mutual funds within a nonqualified retirement plan whose fairvalue is determined based on their published net asset value and are categorized as Level 1.
Investments of consolidated sponsored investment products represent the underlying debt and equitysecurities held in sponsored products which we consolidate. Equity securities are valued at the official closingprice on the exchange on which the securities are traded and are categorized within Level 1. Level 2 investmentsinclude certain equity securities for which closing prices are not readily available or are deemed to not reflect
39

readily available market prices and are valued using an independent pricing service as well as most debtsecurities, which are valued based on quotations received from independent pricing services or from dealers whomake markets in such securities. Pricing services do not provide pricing for all securities, and therefore indicativebids from dealers are utilized, which are based on pricing models used by market makers in the security and arealso included within Level 2. Level 3 investments include debt securities that are not widely traded, are illiquidand are priced by dealers based on pricing models used by market makers in the security.
Cash and cash equivalents, accounts receivable, accounts payable and accrued liabilities equal orapproximate fair value based on the short-term nature of these instruments. Marketable securities are reflected inthe condensed consolidated financial statements at fair value based upon publicly quoted market prices.
Goodwill and Other Intangible Assets
As of December 31, 2014, the carrying values of goodwill, indefinite-lived and definite-lived intangibleassets was $5.3 million, $32.4 million and $9.4 million, respectively. Goodwill represents the excess of thepurchase price of acquisitions over the fair value of identified net assets and liabilities acquired. Indefinite-livedintangible assets are comprised of acquired, closed-end fund investment advisory contracts.
For goodwill and indefinite-lived intangible assets, impairment tests are performed annually, or morefrequently, should circumstances change, which could reduce the fair value below its carrying value. We havedetermined that the Company has only one reporting unit for purposes of assessing the carrying value ofgoodwill. For definite-lived intangible assets, impairment testing is performed whenever events or changes incircumstances indicate that the carrying amount may not be recoverable. If the Company determines the carryingvalue of the definite-lived intangible assets is less than the sum of the undiscounted cash flows expected to resultfrom the asset we will quantify the impairment using a discounted cash flow model. The key assumptions in thediscounted cash flow model include: the estimated remaining useful life of the intangible asset; the discount rate;investment management fee rates on assets under management; and the market expense ratio factor.
Definite-lived intangible assets are comprised of acquired investment advisory contracts. The Companymonitors the useful lives of definite-lived intangible assets and revises the useful lives, if necessary, based on thecircumstances. Significant judgment is required in estimating the period that these assets will contribute to ourcash flows and the pattern over which these assets will be consumed. A change in the remaining useful life of anyof these assets could have a significant impact on our amortization expense. All amortization expense iscalculated on a straight-line basis.
We apply the rules issued in Accounting Standards Update (“ASU”) No. 2011-08, Testing Goodwill forImpairment (the revised standard), which amends the rules for testing goodwill for impairment by allowing anentity the option to first assess qualitative factors to determine whether the existence of events or circumstancesleads to a determination that it is more likely than not that the fair value of a reporting unit is less than itscarrying amount. If, after assessing the totality of events or circumstances, an entity determines it is more likelythan not that the fair value of a reporting unit is greater than its carrying amount, then performing the two-stepimpairment test is unnecessary.
We apply the rules issued in ASU No. 2012-02, Testing Indefinite-Lived Intangible Assets for Impairment,which provides entities with an option to perform a qualitative assessment of indefinite-lived intangible assetsother than goodwill for impairment to determine if additional impairment testing is necessary.
In assessing the qualitative factors to determine whether it is more likely than not that the fair value of areporting unit for goodwill and each unit of accounting for indefinite-lived intangible assets is less than itscarrying amount, we assess relevant events and circumstances that may impact the fair value and the carryingamount for each. The identification of relevant events and circumstances and how these may impact the fairvalue or carrying amount involve significant judgments and assumptions. The judgment and assumptions includethe identification of macroeconomic conditions, industry and market considerations, cost factors, historical trends
40

in operating margins, trending of each unit’s assets under management levels, overall financial performance,specific events such as secondary offerings and share price trends and making the assessment on whether eachrelevant factor will impact the impairment test positively or negatively and the magnitude of any such impact.
Based upon our fiscal 2014 qualitative impairment analysis for goodwill and indefinite-lived intangibleassets, prepared in accordance with ASU No. 2011-08 and ASU No. 2012-02, we concluded that there was norequirement to do a quantitative annual goodwill and indefinite-lived intangible asset impairment test. The keyqualitative factors that led to our conclusion were: (i) that our last quantitative goodwill impairment analysisindicated that the fair value of our reporting unit significantly exceeded the carrying amount; (ii) that our lastquantitative indefinite-lived intangible asset impairment analysis indicated that the fair value of our units ofaccounting significantly exceeded the carrying amount; (iii) the significant increase in our share price and marketcapitalization since our last quantitative annual goodwill impairment analysis; (iv) the significant increase in ourassets under management since our last quantitative indefinite-lived intangible asset impairment analysis; (v) thatwe continue to show positive financial performance overall; and (vi) positive operating margins and positiveperformance of the underlying funds that represent the indefinite-lived intangible assets recorded. During theyear ended December 31, 2014, no events or circumstances occurred that indicated the carrying value of definite-lived intangible assets might be impaired and therefore no quantitative impairment tests were performed duringthis period.
No impairments have been identified or recorded by the Company for the year ended December 31, 2014.
Significant deterioration in markets or declines in revenues or in the value of the Company could result infuture impairment charges.
Revenue Recognition
Investment management fees, distribution and service fees and administration and transfer agent fees arerecorded as revenues during the period in which services are performed. Investment management fees are earnedbased upon a percentage of assets under management and are paid pursuant to the terms of the respectiveinvestment management contracts, which generally require monthly or quarterly payment. The Companyaccounts for investment management fees in accordance with ASC 605, Revenue Recognition, and has recordedits management fees net of fees paid to unaffiliated advisers. We consider the nature of our contractualarrangements in determining whether to recognize revenue based on the gross amount billed or net amountretained. We have evaluated the factors in ASC 605-45 in determining whether to record revenue on a gross ornet basis with significant weight placed on: (i) if we are the primary obligor in the arrangement; and (ii) if wehave latitude in establishing price. Amounts paid to unaffiliated subadvisers for the years ended December 31,2014, 2013 and 2012 were $124.4 million, $96.1 million and $53.7 million, respectively.
Investment management fees are calculated based on our assets under management. We rely on dataprovided to us by mutual funds and custodians in the pricing of assets under management, which are not reflectedwithin our consolidated financial statements. The boards of the mutual funds and the custodians of the assets wemanage have formal pricing policies and procedures over pricing of investments. As of December 31, 2014, ourtotal assets under management by fair value hierarchy level as defined by ASC 820, Fair Value Measurementsand Disclosures, was approximately 58.1% Level 1, 41.8% Level 2 and 0.1% Level 3.
Distribution and service fees are earned based on a percentage of assets under management and are paidmonthly pursuant to the terms of the respective distribution and service fee contracts.
Administration and transfer agent fees consist of fund administration fees, transfer agent fees and fiduciaryfees. Fund administration fees are earned based on the average daily assets in the funds. Transfer agent fees areearned based on the average daily assets in the funds. Fiduciary fees are recorded monthly based on the numberof 401(k) accounts. The Company utilizes outside service providers to perform some of the functions related tofund administration and shareholder services.
41

Other income and fees consist primarily of redemption income on the early redemption of certain shareclasses of mutual funds and brokerage commissions and fees earned for the distribution of nonaffiliated products.Commissions earned (and related expenses) are recorded on a trade date basis and are computed based uponcontractual agreements.
Accounting for Income Taxes
We account for income taxes in accordance with ASC 740, Income Taxes, which requires recognition of theamount of taxes payable or refundable for the current year, as well as deferred tax liabilities and assets for thefuture tax consequences of events that have been included in our financial statements or tax returns. Deferred taxliabilities and assets result from differences between the book value and tax basis of our assets, liabilities andcarry-forwards, such as net operating losses or tax credits. We recognize the tax benefit from an uncertain taxposition only if it is more likely than not that the tax position will be sustained, based on the technical merits ofthe position. The tax benefits recognized in the financial statements from such a position are measured based onthe largest benefit that has a greater than 50% likelihood of being realized upon ultimate settlement. Our policy isto record interest and penalties related to income taxes as a component of income tax expense.
Significant judgment is required in determining the provision for income taxes and, in particular, anyvaluation allowance that is recorded against our deferred tax assets. Our methodology for determining therealizability of deferred tax assets includes consideration of taxable income in prior carryback year(s) ifcarryback is permitted under the tax law, as well as consideration of the reversal of deferred tax liabilities that arein the same period and jurisdiction and are of the same character as the temporary differences that gave rise to thedeferred tax assets. Our methodology also includes estimates of future taxable income from our operations, aswell as the expiration dates and amounts of carryforwards related to net operating losses and capital losses. Theseestimates are projected through the life of the related deferred tax assets based on assumptions that we believe tobe reasonable and consistent with demonstrated operating results. Changes in future operating results notcurrently forecasted may have a significant impact on the realization of deferred tax assets. Valuation allowancesare provided when it is determined that it is more likely than not that the benefit of deferred tax assets will not berealized.
Loss Contingencies
The likelihood that a loss contingency exists is evaluated using the criteria of ASC 450, Loss Contingencies,and an accrued liability is recorded if the likelihood of a loss is considered both probable and reasonablyestimable at the date of the consolidated financial statements.
We believe that we have considered relevant circumstances that we may be currently subject to, and theconsolidated financial statements accurately reflect our reasonable estimate of the results of our operations,financial condition and cash flows for the years presented.
42

Item 7A. Quantitative and Qualitative Disclosures About Market Risk.
Market Risk
Substantially all of our revenues are derived from investment management, distribution and service, andadministration and transfer agent fees, which are based on the market value of assets under management.Accordingly, a decline in the prices of securities would cause our revenues and income to decline due to adecrease in the value of the assets under management. In addition, a decline in security prices could cause ourclients to withdraw their investments in favor of other investments offering higher returns or lower risk, whichwould cause our revenues and income to decline.
We are also subject to market risk due to a decline in the market value of our investments, consistingprimarily of marketable securities. At December 31, 2014, the fair value of marketable securities was $266.7million. Assuming a 10.0% increase or decrease in the fair value of marketable securities at December 31, 2014,our net income attributable to common stockholders would change by $15.8 million, and our total comprehensiveincome would change by $15.9 million, in each case for the year ended December 31, 2014.
Interest Rate Risk
Interest rate risk is the risk that the fair value of future cash flows of a financial instrument will fluctuatebecause of changes in market interest rates. At December 31, 2014, we were exposed to interest rate risk as aresult of holding investments in fixed-income sponsored funds of $101.7 million. Assuming a 1.0% increase ordecrease in interest rates, the fair value of our fixed income investments would change by $3.7 million for theyear ended December 31, 2014.
At December 31, 2014, we had no amounts outstanding under our Credit Facility. Amounts outstandingunder the Credit Facility bear interest at an annual rate equal to, at our option, either LIBOR for interest periodsof one, two, three or six months or an alternate base rate (as defined in the Credit Facility agreement), plus, ineach case, an applicable margin, that ranges from 0.75% to 2.50%.
Item 8. Financial Statements and Supplementary Data.
The audited Consolidated Financial Statements, including the Report of Independent Registered PublicAccounting Firm and the required supplementary quarterly information, required by this item are presented underItem 15 beginning on page F-1.
Item 9. Changes in and Disagreements With Accountants on Accounting and Financial Disclosure.
None.
Item 9A. Controls and Procedures.
Disclosure Controls and Procedures
We maintain disclosure controls and procedures designed to ensure that information required to be disclosedin reports filed or submitted under the Securities Exchange Act of 1934, as amended (the “Exchange Act”), isrecorded, processed, summarized and reported within the time periods specified in the Commission’s rules andforms and that such information is accumulated and communicated to management, including our ChiefExecutive Officer and Chief Financial Officer, as appropriate, to allow timely decisions regarding requireddisclosure. Any controls and procedures, no matter how well designed and operated, can provide only reasonableassurance of achieving the desired control objectives.
Our management, with the participation of our Chief Executive Officer and our Chief Financial Officer,evaluated the effectiveness of our disclosure controls and procedures (as defined in Rules 13a-15(e) and15d-15(e) of the Exchange Act) as of the end of the period covered by this Annual Report on Form 10-K. Based
43
on their evaluation, our Chief Executive Officer and Chief Financial Officer concluded that the Company’sdisclosure controls and procedures were effective at the reasonable assurance level as of December 31, 2014, theend of the period covered by this Annual Report on Form 10-K.
Changes in Internal Control over Financial Reporting
As previously disclosed in our Quarterly Report on Form 10-Q for the quarterly period ended September 30,2014, the Company’s management, including our Chief Executive Officer and Chief Financial Officer, hadpreviously identified a material weakness in the Company’s internal control over financial reporting. A materialweakness is a deficiency, or a combination of deficiencies, in internal control over financial reporting, such thatthere is a reasonable possibility that a material misstatement of the Company’s annual or interim financialstatements will not be prevented or detected on a timely basis. The Company failed to design controls upon theadoption of ASC 810-10, as amended by ASU 2009-17, to assess whether it has the potential to receive collateralmanagement fees that could be significant and failed to design appropriate controls over the requirement tocontinuously reassess its variable interest entities at appropriate levels of precision. As a result, the Company’sanalysis of whether it has the potential to receive collateral management fees that could be significant was not atthe appropriate levels of precision to determine whether to consolidate certain variable interest entities. Thismaterial weakness, if not remediated, could have resulted in a failure to consolidate certain variable interestentities that could result in a material misstatement to the annual or interim consolidated financial statements thatwould not be prevented or detected.
As remediation measures to address the material weakness described above, the Company designed andimplemented new and enhanced controls to ensure that the primary beneficiary assessment for variable interestentities is assessed at the appropriate level of precision and that in-house accounting personnel have training toensure they have the relevant expertise related to the consolidation of variable interest entities. With theimplementation of these new and enhanced controls, we have concluded that, as of December 31, 2014, thepreviously identified material weakness in our internal control over financial reporting has been remediated.
The remediation measures discussed above were changes in our internal control over financial reporting (asdefined in Rules 13a-15(f) and 15d-15(f) under the Exchange Act) that occurred during the most recent quarterand materially affected, or are reasonably likely to materially affect, our internal control over financial reporting.Other than these remediation measures, there have been no changes in the Company’s internal control overfinancial reporting that occurred during our most recent quarter which materially affected, or are reasonablylikely to materially affect, our internal control over financial reporting.
Management’s Report on Internal Control over Financial Reporting
Our management, with the participation of our Chief Executive Officer and Chief Financial Officer, isresponsible for establishing and maintaining adequate internal control over financial reporting, as defined in Rule13a-15(f) or Rule 15d-15(f) of the Exchange Act. Because of its inherent limitations, internal control overfinancial reporting may not prevent or detect misstatements. Projections of any evaluation of effectiveness tofuture periods are subject to the risk that controls may become inadequate because of changes in conditions, orthat the degree of compliance with the policy or procedures may deteriorate. Under the supervision and with theparticipation of our management, including our Chief Executive Officer and Chief Financial Officer, we haveconducted an evaluation of the effectiveness of our internal control over financial reporting as of December 31,2014 based on the framework set forth by the Committee of Sponsoring Organizations of the TreadwayCommission in Internal Control—Integrated Framework (2013). Based on this evaluation, management,including our Chief Executive Officer and Chief Financial Officer, has concluded that our internal control overfinancial reporting was effective as of December 31, 2014.
The effectiveness of our internal control over financial reporting as of December 31, 2014 has been auditedby PricewaterhouseCoopers LLP, our independent registered public accounting firm, as stated in their reportwhich is included in Item 15 of this Annual Report on Form 10-K.
44

Item 9B. Other Information.
None.
45

PART III
Item 10. Directors, Executive Officers and Corporate Governance.
The information concerning the Company’s directors and nominees under the caption “Item 1—Election ofDirectors,” information concerning the Audit Committee and the “audit committee financial expert” under thecaption “Corporate Governance—Audit Committee,” information concerning the Company’s executive officersunder the caption “Executive Officers,” and the information under the caption “Section 16(a) BeneficialOwnership Reporting Compliance” in the Company’s Proxy Statement for the Company’s 2015 Annual Meetingof Shareholders, are incorporated herein by reference.
The Company has adopted a Code of Conduct that applies to the Company’s Chief Executive Officer, seniorfinancial officers and all other Company employees, officers and Board members. The Code of Conduct isavailable on the Company’s website, www.virtus.com, under “Investor Relations,” and is available in print to anyperson who requests it. Any substantive amendment to the Code of Conduct and any waiver in favor of a Boardmember or an executive officer may only be granted by the Board of Directors and will be publicly disclosed onthe Company’s website, www.virtus.com, under “About Us,” “Investor Relations.”
The information concerning procedures by which shareholders may recommend director nominees set forthunder the caption “Corporate Governance—Governance Committee—Director Nomination Process” in theCompany’s Proxy Statement for the Company’s 2015 Annual Meeting of Shareholders is incorporated hereinby reference.
Item 11. Executive Compensation.
The information relating to executive compensation and the Company’s policies and practices as they relateto the Company’s risk management is set forth under the captions “Executive Compensation,” “DirectorCompensation,” “Corporate Governance—Compensation Committee—Risks Related to Compensation Policiesand Practices” and “Corporate Governance—Compensation Committee Interlocks and Insider Participation” inthe Company’s Proxy Statement for the Company’s 2015 Annual Meeting of Shareholders and is incorporatedherein by reference. The information included under the caption “Executive Compensation—Report of theCompensation Committee” in the Company’s Proxy Statement for the Company’s 2015 Annual Meeting ofShareholders is incorporated herein by reference but shall be deemed “furnished” (and not “filed”) with thisreport.
Item 12. Security Ownership of Certain Beneficial Owners and Management and Related StockholderMatters.
The information set forth under the caption “Security Ownership by Certain Beneficial Owners andManagement” in the Company’s Proxy Statement for the Company’s 2015 Annual Meeting of Shareholders isincorporated herein by reference.
46

The following table sets forth information as of December 31, 2014 with respect to compensation plansunder which shares of our common stock may be issued:
EQUITY COMPENSATION PLAN INFORMATION
Plan Category
Number ofsecurities to be
issuedupon exercise of
outstandingoptions, warrants
and rights (a)
Weighted-averageexercise price of
outstandingoptions, warrantsand rights (b) (1)
Number ofsecurities remainingavailable for future
issuanceunder equity
compensation plans(excluding
securities reflectedin column (a)(c)
Equity compensation plans approved by securityholders (2) . . . . . . . . . . . . . . . . . . . . . . . . . . . . . . . . . . . 342,760 $18.79 427,781
Equity compensation plans not approved by securityholders . . . . . . . . . . . . . . . . . . . . . . . . . . . . . . . . . . . . . . — — —
Total . . . . . . . . . . . . . . . . . . . . . . . . . . . . . . . . . . . . . . . . . 342,760 $18.79 427,781
(1) The weighted-average exercise price set forth in this column is calculated excluding outstanding restrictedstock unit awards (“RSUs”) since recipients of such awards are not required to pay an exercise price toreceive the shares subject to these awards. The weighted-average exercise price of outstanding options,warrants and rights, including RSUs, was $8.93.
(2) Represents 162,824 shares of common stock issuable upon the exercise of stock options and 179,936 sharesof our common stock issuable upon the vesting of RSUs outstanding under the Company’s OmnibusIncentive and Equity Plan (the “Omnibus Plan”). Of the 1,800,000 maximum number of shares of ourcommon stock authorized for issuance under the Omnibus Plan, 74,935 shares of common stock have beenissued on a cumulative basis in the form of direct grants to directors.
Item 13. Certain Relationships and Related Transactions, and Director Independence.
The information set forth under the captions “Corporate Governance—Transactions with Related Persons”and “Corporate Governance—Director Independence” in the Company’s Proxy Statement for the Company’s2015 Annual Meeting of Shareholders is incorporated herein by reference.
Item 14. Principal Accounting Fees and Services.
The information regarding auditors fees and services and the Company’s pre-approval policies andprocedures for audit and non-audit services to be provided by the Company’s independent registered publicaccounting firm set forth under the caption “Item 2—Ratification of the Appointment of the IndependentRegistered Public Accounting Firm” in the Company’s Proxy Statement for the 2015 Annual Meeting ofShareholders is incorporated herein by reference.
47
PART IV
Item 15. Exhibits, Financial Statement Schedules.
(a)(1) Financial Statements: The following Report of Independent Registered Public Accounting Firm andConsolidated Financial Statements of Virtus are included in this Annual Report:
Report of Independent Registered Public Accounting Firm
Consolidated Balance Sheets as of December 31, 2014 and 2013
Consolidated Statements of Operations for the Years Ended December 31, 2014, 2013 and 2012
Consolidated Statements of Comprehensive Income for the Years Ended December 31, 2014, 2013and 2012
Consolidated Statements of Changes in Stockholders’ Equity for the Years Ended December 31,2014, 2013 and 2012
Consolidated Statements of Cash Flows for the Years Ended December 31, 2014, 2013 and 2012
Notes to Consolidated Financial Statements
(a)(2) Financial Statement Schedules:
All financial statement schedules have been omitted because the required information is eitherpresented in the consolidated financial statements or the notes thereto or is not applicable or required.
48

(a)(3) Exhibits:
The following exhibits are filed herewith or incorporated herein by reference:
ExhibitNumber Exhibit Description
(2) Plan of Acquisition, Reorganization, Arrangement, Liquidation or Succession
2.1 Separation Agreement, Plan of Reorganization and Distribution by and between The PhoenixCompanies, Inc. and the Registrant, dated as of December 18, 2008 (incorporated by reference toExhibit 2.1 of the Registrant’s Amendment No. 4 to Form 10, filed December 19, 2008).
(3) Articles of Incorporation and Bylaws
3.1 Amended and Restated Certificate of Incorporation of the Registrant, dated December 18, 2008(incorporated by reference to Exhibit 3.1 of the Registrant’s Amendment No. 4 to Form 10, filedDecember 19, 2008).
3.2 Amended and Restated Bylaws of the Registrant, as adopted on January 28, 2010 (incorporated byreference to Exhibit 3.1 of the Registrant’s Current Report on Form 8-K, filed February 2, 2010).
3.3 Certificate of Designations of Series A Non-Voting Convertible Preferred Stock and Series B VotingConvertible Preferred Stock of the Registrant, dated October 31, 2008 (incorporated by reference toExhibit 4.2 of the Registrant’s Amendment No. 2 to Form 10, filed November 14, 2008).
3.4 Certificate of Amendment of the Certificate of Designations of Series A Non-Voting ConvertiblePreferred Stock and Series B Voting Convertible Preferred Stock of the Registrant (incorporated byreference to Exhibit 3.1 of the Registrant’s Quarterly Report on Form 10-Q, filed August 13, 2009).
3.5 Certificate of Designations of Series C Junior Participating Preferred Stock of the Registrant, datedDecember 29, 2008 (incorporated by reference to Exhibit 3.1 of the Registrant’s Current Report onForm 8-K, filed January 2, 2009).
(4) Instruments Defining the Rights of Security Holders, Including Indentures
4.1 Note in favor of The Bank of New York Mellon as Lender, dated September 1, 2009 (incorporatedby reference to Exhibit 4.1 of the Registrant’s Current Report on Form 8-K, filed September 4,2009).
4.2 Note in favor of PNC Bank, National Association as Lender, dated September 1, 2009 (incorporatedby reference to Exhibit 4.2 of the Registrant’s Current Report on Form 8-K, filed September 4,2009).
(10) Material Contracts
10.1 Transition Services Agreement by and between The Phoenix Companies, Inc. and the Registrant,dated as of December 18, 2008 (incorporated by reference to Exhibit 10.1 of the Registrant’sAmendment No. 4 to Form 10, filed December 19, 2008).
10.2 Tax Separation Agreement by and between The Phoenix Companies, Inc. and the Registrant, datedDecember 18, 2008 (incorporated by reference to Exhibit 10.2 of the Registrant’s Amendment No. 4to Form 10, filed December 19, 2008).
10.3 Amendment to Tax Separation Agreement, dated April 8, 2009, by and between The PhoenixCompanies, Inc. and the Registrant, dated as of December 18, 2008 (incorporated by reference toExhibit 10.15 of the Registrant’s Annual Report on Form 10-K, filed April 10, 2009).
10.4 Employee Matters Agreement by and between The Phoenix Companies, Inc. and the Registrant,dated December 18, 2008 (incorporated by reference to Exhibit 10.3 of the Registrant’s AmendmentNo. 4 to Form 10, filed December 19, 2008).
49

ExhibitNumber Exhibit Description
*10.5 Change in Control Agreement between George R. Aylward and the Registrant, effective as ofDecember 31, 2008 (incorporated by reference to Exhibit 10.4 of the Registrant’s Amendment No. 4to Form 10, filed December 19, 2008).
*10.6 Amended and Restated Virtus Investment Partners, Inc. Omnibus Incentive and Equity Plan,effective as of January 1, 2014 (incorporated by reference to Exhibit 10.1 of the Registrant’sForm 8-K, filed <ay 16, 2014).
*10.7 Virtus Investment Partners, Inc. Non-Qualified Excess Investment Plan, effective as of November 1,2008 (incorporated by reference to Exhibit 10.6 of the Registrant’s Amendment No. 2 to Form 10,filed November 14, 2008).
*10.8 First Amendment to the Virtus Investment Partners, Inc. Non-Qualified Excess Investment Plan,effective as of February 1, 2010 (incorporated by reference to Exhibit 10.1 of the Registrant’sQuarterly Report on Form 10-Q, filed May 4, 2010).
*10.9 Virtus Investment Partners, Inc. Amended and Restated Executive Severance Allowance Plan,effective as of February 2, 2009 (incorporated by reference to Exhibit 10.1 of the Registrant’sCurrent Report on Form 8-K, filed February 4, 2009).
10.10 Investment and Contribution Agreement by and among Phoenix Investment Management Company,the Registrant, Harris Bankcorp, Inc. and The Phoenix Companies, Inc., dated as of October 30, 2008(incorporated by reference to Exhibit 10.8 of the Registrant’s Amendment No. 2 to Form 10, filedNovember 14, 2008).
10.11 Annex A to the Investment and Contribution Agreement by and among Phoenix InvestmentManagement Company, the Registrant, Harris Bankcorp, Inc. and The Phoenix Companies, Inc.,dated October 30, 2008 (incorporated by reference to Exhibit 10.10 of the Registrant’s AnnualReport on Form 10-K, filed March 1, 2011).
10.12 Transaction Agreement by and among Harris Investment Management, Inc., Phoenix InvestmentCounsel, Inc., Harris Financial Corp. and Phoenix Investment Partners, LTD., dated as of March 28,2006 (incorporated by reference Exhibit 6.01 of the Schedule 13D, filed January 12, 2009 by Bank ofMontreal, Harris Financial Corp. and Harris Bankcorp, Inc.).
10.13 Strategic Partnership Agreement by and between Harris Investment Management, Inc. and PhoenixInvestment Counsel, Inc., dated as of March 28, 2006 (incorporated by reference to Exhibit 6.02 ofthe Schedule 13D, filed January 12, 2009 by Bank of Montreal, Harris Financial Corp. and HarrisBankcorp, Inc.).
*10.14 Form of Non-Qualified Stock Option Agreement under the Virtus Investment Partners, Inc. OmnibusIncentive and Equity Plan (incorporated by reference to Exhibit 10.4 of the Registrant’s QuarterlyReport on Form 10-Q, filed May 13, 2009).
*10.15 Form of Restricted Stock Units Agreement under the Virtus Investment Partners, Inc. OmnibusIncentive and Equity Plan (incorporated by reference to Exhibit 10.5 of the Registrant’s QuarterlyReport on Form 10-Q, filed May 13, 2009).
*10.16 Form of Performance Share Units Agreement under the Virtus Investment Partners, Inc. OmnibusIncentive and Equity Plan (incorporated by reference to Exhibit 10.30 of the Registrant’s QuarterlyReport on Form 10-Q, filed August 5, 2011).
10.17 Amended and Restated Credit Agreement, dated as of September 10, 2012 among the Registrant, asBorrower, the lenders party thereto, PNC Bank, National Association, as Syndication Agent, and TheBank of New York Mellon, as Administrative Agent, as Swingline Lender and as Issuing Bank (the“Credit Agreement”) (incorporated by reference to Exhibit 10.1 of the Registrant’s Quarterly Reporton Form 10-Q, filed November 7, 2012).
50

ExhibitNumber Exhibit Description
10.18 Amendment No. 1, dated as of July 2, 2013, to the Credit Agreement, dated as of September 10,2012, among the Registrant, as Borrower, the lenders party thereto, PNC Bank, National Association,as Syndication Agent, and The Bank of New York Mellon, as Administrative Agent, as SwinglineLender and as Issuing Bank (incorporated by reference to Exhibit 10.1 of the Registrant’s QuarterlyReport on Form 10-Q, filed August 2, 2013).
10.19 Amendment No. 2, dated as of September 18, 2013, to the Credit Agreement, dated as ofSeptember 10, 2012, among the Registrant, as Borrower, the lenders party thereto, PNC Bank,National Association, as Syndication Agent, and The Bank of New York Mellon, as AdministrativeAgent, as Swingline Lender and as Issuing Bank (incorporated by reference to Exhibit 10.1 of theRegistrant’s Quarterly Report on Form 10-Q, filed November 4, 2013).
10.20 Guarantee Agreement among the Registrant, each of the subsidiary guarantors party thereto and TheBank of New York Mellon, as Administrative Agent, dated as of September 1, 2009 (incorporated byreference to Exhibit 10.24 of the Registrant’s Annual Report on Form 10-K, filed March 1, 2011).
10.21 Reaffirmation of Guarantee among the Registrant as Borrower, each of the subsidiary guarantorsparty thereto and the Bank of New York Mellon, as Administrative Agent, as Swingline Lender andas Issuing Bank under the Credit Agreement (incorporated by reference to Exhibit 10.2 of theRegistrant’s Quarterly Report on Form 10-Q, filed November 7, 2012).
10.22 Security Agreement among the Registrant, each of the other grantors party thereto and The Bank ofNew York Mellon, as Administrative Agent, dated as of September 1, 2009 (incorporated byreference to Exhibit 10.25 of the Registrant’s Annual Report on Form 10-K, filed March 1, 2011).
10.23 Amendment No. 1, dated as of September 10, 2012, to the Security Agreement, dated as of September 1,2009, among the Registrant, as Borrower, each of the subsidiary guarantors party thereto, and the Bank ofNew York Mellon, as Administrative Agent under the Credit Agreement (incorporated by reference toExhibit 10.3 of the Registrant’s Quarterly Report on Form 10-Q, filed November 7, 2012).
*10.24 Form of Indemnity Agreement (incorporated by reference to Exhibit 10.4 to the Registrant’sQuarterly Report on Form 10-Q, filed November 4, 2009).
*10.25 Offer Letter from the Registrant to Jeffrey T. Cerutti dated May 18, 2010 (incorporated by referenceto Exhibit 10.27 of the Registrant’s Annual Report on Form 10-K, filed March 1, 2011).
10.26 Conversion and Voting Agreement, dated as of October 27, 2011, between BMO, Inc. (f/k/a HarrisBankcorp, Inc.) and the Registrant (incorporated by reference to Exhibit 10.1 of the Registrant’sCurrent Report on Form 8-K, filed November 2, 2011).
*10.27 Offer Letter from the Registrant to Mark S. Flynn dated December 9, 2010 (incorporated byreference to Exhibit 10.31 of the Registrant’s Annual Report on Form 10-K, filed March 1, 2012).
10.28 Amendment No. 3 to Amended and Restated Credit Agreement dated December 4, 2013 among theRegistrant, as Borrower, the lenders party thereto, PNC Bank, National Association, as SyndicationAgent, and The Bank of New York Mellon, as Administrative Agent, as Swingline Lender and asIssuing Bank (incorporated by reference to Exhibit 10.29, of the Registrant’s Annual Report onForm 10-K, filed February 24, 2014).
10.39 Amendment No. 2, dated as of December 4, 2013, to the Security Agreement, dated as of September 1,2009, among the Registrant, as Borrower, each of the subsidiary guarantors party thereto, and the Bank ofNew York Mellon, as Administrative Agent under the Credit Agreement (incorporated by reference toExhibit 10.30 of the Registrant’s Annual Report on Form 10-K, filed February 24, 2014).
(21) Subsidiaries of the Registrant
21.1 Virtus Investment Partners, Inc., Subsidiaries List.
51

ExhibitNumber Exhibit Description
(23) Consents of Experts and Counsel
23.1 Consent of Independent Registered Public Accounting Firm.
31.1 Certifications of Registrant’s Chief Executive Officer pursuant to Section 302 of the Sarbanes-OxleyAct of 2002.
31.2 Certifications of Registrant’s Chief Financial Officer pursuant to Section 302 of the Sarbanes-OxleyAct of 2002.
32.1 Certifications of Registrant’s Chief Executive Officer and Chief Financial Officer pursuant toSection 906 of the Sarbanes-Oxley Act of 2002.
101 The following information formatted in XBRL (Extensible Business Reporting Language):(i) Consolidated Balance Sheets as of December 31, 2014 and December 31, 2013, (ii) ConsolidatedStatements of Operations for the years ended December 31, 2014, 2013 and 2012, (iii) ConsolidatedStatements of Comprehensive Income for the years ended December 31, 2014, 2013 and 2012,(iv) Consolidated Statements of Cash Flows for the years ended December 31, 2014, 2013 and 2012,(v) Consolidated Statements of Changes in Stockholders’ Equity for the years ended December 31,2014, 2013 and 2012 and (iv) Notes to Consolidated Financial Statements.
* Management contract, compensatory plan or arrangement.
The agreements and other documents filed as exhibits to this report are not intended to provide factualinformation or other disclosure other than the terms of the agreements or other documents themselves, and youshould not rely on them for that purpose. In particular, any representations and warranties made by the Companyin these agreements or other documents were made solely within the specific context of the relevant agreement ordocument and may not describe the actual state of affairs at the date they were made or at any other time.
52

SIGNATURES
Pursuant to the requirements of Section 13 or 15(d) of the Securities Exchange Act of 1934, the registranthas duly caused this report to be signed on its behalf by the undersigned, thereunto duly authorized.
Dated: March 2, 2015
Virtus Investment Partners, Inc.
By: /S/ MICHAEL A. ANGERTHAL
Michael A. AngerthalExecutive Vice PresidentChief Financial Officer
(Principal Financial Officer and Principal Accounting Officer)
Pursuant to the requirements of the Securities Exchange Act of 1934, this report has been signed below bythe following persons on behalf of the registrant and in the capacities indicated as of March 2, 2015.
/S/ MARK C. TREANOR
Mark C. TreanorDirector and Non-Executive Chairman
/S/ GEORGE R. AYLWARD
George R. AylwardPresident, Chief Executive Officer and Director
(Principal Executive Officer)
/S/ JAMES R. BAIO
James R. BaioDirector
/S/ SUSAN S. FLEMING
Susan S. FlemingDirector
/S/ DIANE M. COFFEY
Diane M. CoffeyDirector
/S/ RUSSEL C. ROBERTSON
Russel C. RobertsonDirector
/S/ TIMOTHY A. HOLT
Timothy A. HoltDirector
/S/ MELODY L. JONES
Melody L. JonesDirector
/S/ EDWARD M. SWAN, JR.Edward M. Swan, Jr.
Director
/S/ STEPHEN T. ZARRILLI
Stephen T. ZarrilliDirector
/S/ MICHAEL A. ANGERTHAL
Michael A. AngerthalChief Financial Officer
(Principal Financial Officer and Principal Accounting Officer)
53

[THIS PAGE INTENTIONALLY LEFT BLANK]
INDEX TO CONSOLIDATED FINANCIAL STATEMENTS
Page
Report of Independent Registered Public Accounting Firm . . . . . . . . . . . . . . . . . . . . . . . . . . . . . . . . . . . . . . F-2
Audited Consolidated Financial StatementsConsolidated Balance Sheets as of December 31, 2014 and 2013 . . . . . . . . . . . . . . . . . . . . . . . . . . . . . . . . . . F-3Consolidated Statements of Operations for the Years Ended December 31, 2014, 2013 and 2012 . . . . . . . . F-4Consolidated Statements of Comprehensive Income for the Years Ended December 31, 2014, 2013 and
2012 . . . . . . . . . . . . . . . . . . . . . . . . . . . . . . . . . . . . . . . . . . . . . . . . . . . . . . . . . . . . . . . . . . . . . . . . . . . . . . . F-5Consolidated Statements of Changes in Stockholders’ Equity for the Years Ended December 31, 2014,
2013 and 2012 . . . . . . . . . . . . . . . . . . . . . . . . . . . . . . . . . . . . . . . . . . . . . . . . . . . . . . . . . . . . . . . . . . . . . . . . F-6
Consolidated Statements of Cash Flows for the Years Ended December 31, 2014, 2013 and 2012 . . . . . . . . F-7Notes to Consolidated Financial Statements . . . . . . . . . . . . . . . . . . . . . . . . . . . . . . . . . . . . . . . . . . . . . . . . . . F-8
F-1

Report of Independent Registered Public Accounting Firm
To the Board of Directors and Stockholders of Virtus Investment Partners, Inc.
In our opinion, the accompanying consolidated balance sheets and the related consolidated statements ofoperations, comprehensive income, changes in stockholders’ equity and cash flows present fairly, in all materialrespects, the financial position of Virtus Investment Partners, Inc. and its subsidiaries at December 31, 2014 and2013, and the results of their operations and their cash flows for each of the three years in the period endedDecember 31, 2014 in conformity with accounting principles generally accepted in the United States of America.Also in our opinion, the Company maintained, in all material respects, effective internal control over financialreporting as of December 31, 2014, based on criteria established in the Internal Control—Integrated Framework(2013) issued by the Committee of Sponsoring Organizations of the Treadway Commission (COSO). TheCompany’s management is responsible for these financial statements, for maintaining effective internal controlover financial reporting and for its assessment of the effectiveness of internal control over financial reporting,included in Management’s Report on Internal Control over Financial Reporting appearing under Item 9A. Ourresponsibility is to express opinions on these financial statements and on the Company’s internal control overfinancial reporting based on our integrated audits. We conducted our audits in accordance with the standards ofthe Public Company Accounting Oversight Board (United States). Those standards require that we plan andperform the audits to obtain reasonable assurance about whether the financial statements are free of materialmisstatement and whether effective internal control over financial reporting was maintained in all materialrespects. Our audits of the financial statements included examining, on a test basis, evidence supporting theamounts and disclosures in the financial statements, assessing the accounting principles used and significantestimates made by management, and evaluating the overall financial statement presentation. Our audit of internalcontrol over financial reporting included obtaining an understanding of internal control over financial reporting,assessing the risk that a material weakness exists, and testing and evaluating the design and operatingeffectiveness of internal control based on the assessed risk. Our audits also included performing such otherprocedures as we considered necessary in the circumstances. We believe that our audits provide a reasonablebasis for our opinions.
A company’s internal control over financial reporting is a process designed to provide reasonable assuranceregarding the reliability of financial reporting and the preparation of financial statements for external purposes inaccordance with generally accepted accounting principles. A company’s internal control over financial reportingincludes those policies and procedures that (i) pertain to the maintenance of records that, in reasonable detail,accurately and fairly reflect the transactions and dispositions of the assets of the company; (ii) provide reasonableassurance that transactions are recorded as necessary to permit preparation of financial statements in accordancewith generally accepted accounting principles, and that receipts and expenditures of the company are being madeonly in accordance with authorizations of management and directors of the company; and (iii) provide reasonableassurance regarding prevention or timely detection of unauthorized acquisition, use, or disposition of thecompany’s assets that could have a material effect on the financial statements.
Because of its inherent limitations, internal control over financial reporting may not prevent or detectmisstatements. Also, projections of any evaluation of effectiveness to future periods are subject to the risk thatcontrols may become inadequate because of changes in conditions, or that the degree of compliance with thepolicies or procedures may deteriorate.
/s/ PricewaterhouseCoopers LLP
Hartford, ConnecticutMarch 2, 2015
F-2

Virtus Investment Partners, Inc.
Consolidated Balance Sheets
December 31,2014
December 31,2013
($ in thousands, except share data)
Assets:Cash and cash equivalents . . . . . . . . . . . . . . . . . . . . . . . . . . . . . . . . . . . . . . . . . . . . . . . $ 202,847 $ 271,014Cash of consolidated sponsored investment products . . . . . . . . . . . . . . . . . . . . . . . . . . 457 531Cash pledged or on deposit of consolidated sponsored investment products . . . . . . . . 8,230 —Investments . . . . . . . . . . . . . . . . . . . . . . . . . . . . . . . . . . . . . . . . . . . . . . . . . . . . . . . . . . 63,448 37,258Investments of consolidated sponsored investment products . . . . . . . . . . . . . . . . . . . . 236,652 139,054Accounts receivable, net . . . . . . . . . . . . . . . . . . . . . . . . . . . . . . . . . . . . . . . . . . . . . . . . 49,721 50,166Furniture, equipment, and leasehold improvements, net . . . . . . . . . . . . . . . . . . . . . . . . 7,193 7,219Intangible assets, net . . . . . . . . . . . . . . . . . . . . . . . . . . . . . . . . . . . . . . . . . . . . . . . . . . . 41,783 44,633Goodwill . . . . . . . . . . . . . . . . . . . . . . . . . . . . . . . . . . . . . . . . . . . . . . . . . . . . . . . . . . . . 5,260 5,260Deferred taxes, net . . . . . . . . . . . . . . . . . . . . . . . . . . . . . . . . . . . . . . . . . . . . . . . . . . . . . 60,162 64,500Other assets . . . . . . . . . . . . . . . . . . . . . . . . . . . . . . . . . . . . . . . . . . . . . . . . . . . . . . . . . . 16,060 15,724Other assets of consolidated sponsored investment products . . . . . . . . . . . . . . . . . . . . 6,960 9,595
Total assets . . . . . . . . . . . . . . . . . . . . . . . . . . . . . . . . . . . . . . . . . . . . . . . . . . . . . . . $ 698,773 $ 644,954
Liabilities and EquityLiabilities:Accrued compensation and benefits . . . . . . . . . . . . . . . . . . . . . . . . . . . . . . . . . . . . . . . $ 54,815 $ 53,140Accounts payable and accrued liabilities . . . . . . . . . . . . . . . . . . . . . . . . . . . . . . . . . . . . 31,627 29,912Dividends payable . . . . . . . . . . . . . . . . . . . . . . . . . . . . . . . . . . . . . . . . . . . . . . . . . . . . . 4,270 —Other liabilities . . . . . . . . . . . . . . . . . . . . . . . . . . . . . . . . . . . . . . . . . . . . . . . . . . . . . . . . 9,082 18,413Liabilities of consolidated sponsored investment products . . . . . . . . . . . . . . . . . . . . . . 12,556 8,435
Total liabilities . . . . . . . . . . . . . . . . . . . . . . . . . . . . . . . . . . . . . . . . . . . . . . . . . . . . 112,350 109,900
Commitments and Contingencies (Note 9)Redeemable noncontrolling interests . . . . . . . . . . . . . . . . . . . . . . . . . . . . . . . . . . . . . . . 23,071 42,186Equity:Equity attributable to stockholders:Common stock, $0.01 par value, 1,000,000,000 shares authorized; 9,551,274 shares
issued and 8,975,833 shares outstanding at December 31, 2014 and 9,455,521shares issued and 9,105,521 shares outstanding at December 31, 2013 . . . . . . . . . . 96 95
Additional paid-in capital . . . . . . . . . . . . . . . . . . . . . . . . . . . . . . . . . . . . . . . . . . . . . . . 1,148,908 1,135,644Accumulated deficit . . . . . . . . . . . . . . . . . . . . . . . . . . . . . . . . . . . . . . . . . . . . . . . . . . . . (507,521) (605,221)Accumulated other comprehensive loss . . . . . . . . . . . . . . . . . . . . . . . . . . . . . . . . . . . . (242) (150)Treasury stock, at cost, 575,441 and 350,000 shares at December 31, 2014 and
December 31, 2013, respectively . . . . . . . . . . . . . . . . . . . . . . . . . . . . . . . . . . . . . . . . (77,699) (37,438)
Total equity attributable to stockholders . . . . . . . . . . . . . . . . . . . . . . . . . . . . . . . . 563,542 492,930Noncontrolling interests . . . . . . . . . . . . . . . . . . . . . . . . . . . . . . . . . . . . . . . . . . . . . . . . . (190) (62)
Total equity . . . . . . . . . . . . . . . . . . . . . . . . . . . . . . . . . . . . . . . . . . . . . . . . . . . . . . 563,352 492,868
Total liabilities and equity . . . . . . . . . . . . . . . . . . . . . . . . . . . . . . . . . . . . . . . $ 698,773 $ 644,954
The accompanying notes are an integral part of these consolidated financial statements.
F-3

Virtus Investment Partners, Inc.
Consolidated Statements of Operations
Years Ended December 31,
2014 2013 2012
($ in thousands, except per share data)
RevenuesInvestment management fees . . . . . . . . . . . . . . . . . . . . . . . . . . . . . . . . . . . . . . . $300,663 $260,557 $187,875Distribution and service fees . . . . . . . . . . . . . . . . . . . . . . . . . . . . . . . . . . . . . . . 91,950 78,965 56,866Administration and transfer agent fees . . . . . . . . . . . . . . . . . . . . . . . . . . . . . . . 56,016 48,185 33,779Other income and fees . . . . . . . . . . . . . . . . . . . . . . . . . . . . . . . . . . . . . . . . . . . . 1,969 1,508 1,566
Total revenues . . . . . . . . . . . . . . . . . . . . . . . . . . . . . . . . . . . . . . . . . . . . . . 450,598 389,215 280,086
Operating ExpensesEmployment expenses . . . . . . . . . . . . . . . . . . . . . . . . . . . . . . . . . . . . . . . . . . . . 139,809 131,768 105,571Distribution and administration expenses . . . . . . . . . . . . . . . . . . . . . . . . . . . . . 123,665 97,786 72,210Other operating expenses . . . . . . . . . . . . . . . . . . . . . . . . . . . . . . . . . . . . . . . . . . 46,531 38,321 34,017Other operating expenses of consolidated sponsored investment products . . . . 3,038 798 315Restructuring and severance . . . . . . . . . . . . . . . . . . . . . . . . . . . . . . . . . . . . . . . . 294 203 1,597Depreciation and other amortization . . . . . . . . . . . . . . . . . . . . . . . . . . . . . . . . . 2,763 2,422 1,810Amortization expense . . . . . . . . . . . . . . . . . . . . . . . . . . . . . . . . . . . . . . . . . . . . . 3,778 4,413 4,121
Total operating expenses . . . . . . . . . . . . . . . . . . . . . . . . . . . . . . . . . . . . . . 319,878 275,711 219,641
Operating Income . . . . . . . . . . . . . . . . . . . . . . . . . . . . . . . . . . . . . . . . . . . . . . . 130,720 113,504 60,445
Other Income (Expense)Realized and unrealized gain on investments, net . . . . . . . . . . . . . . . . . . . . . . . 914 2,350 1,891Realized and unrealized (loss) gain on investments of consolidated sponsored
investment products, net . . . . . . . . . . . . . . . . . . . . . . . . . . . . . . . . . . . . . . . . . (4,648) 3,515 2,072Other income (expense), net . . . . . . . . . . . . . . . . . . . . . . . . . . . . . . . . . . . . . . . . 891 74 (38)
Total other (expense) income, net . . . . . . . . . . . . . . . . . . . . . . . . . . . (2,843) 5,939 3,925
Interest Income (Expense)Interest expense . . . . . . . . . . . . . . . . . . . . . . . . . . . . . . . . . . . . . . . . . . . . . . . . . (537) (782) (854)Interest and dividend income . . . . . . . . . . . . . . . . . . . . . . . . . . . . . . . . . . . . . . . 1,706 664 710Interest and dividend income of investments of consolidated sponsored
investment products . . . . . . . . . . . . . . . . . . . . . . . . . . . . . . . . . . . . . . . . . . . . 7,268 2,583 577
Total interest income, net . . . . . . . . . . . . . . . . . . . . . . . . . . . . . . . . . . 8,437 2,465 433
Income Before Income Taxes . . . . . . . . . . . . . . . . . . . . . . . . . . . . . . . . . . . . . 136,314 121,908 64,803Income tax expense . . . . . . . . . . . . . . . . . . . . . . . . . . . . . . . . . . . . . . . . . . . . . . 39,349 44,778 27,030
Net Income . . . . . . . . . . . . . . . . . . . . . . . . . . . . . . . . . . . . . . . . . . . . . . . . . . . . 96,965 77,130 37,773Noncontrolling interests . . . . . . . . . . . . . . . . . . . . . . . . . . . . . . . . . . . . . . . . . . . 735 (1,940) (101)Allocation of earnings to preferred stockholders . . . . . . . . . . . . . . . . . . . . . . . . — — (64)
Net Income Attributable to Common Stockholders . . . . . . . . . . . . . . . . . . . $ 97,700 $ 75,190 $ 37,608
Earnings per share—Basic . . . . . . . . . . . . . . . . . . . . . . . . . . . . . . . . . . . . . . . $ 10.75 $ 9.18 $ 4.87
Earnings per share—Diluted . . . . . . . . . . . . . . . . . . . . . . . . . . . . . . . . . . . . . . $ 10.51 $ 8.92 $ 4.66
Cash dividends declared per share . . . . . . . . . . . . . . . . . . . . . . . . . . . . . . . . . $ 1.35 $ — $ —
Weighted Average Shares Outstanding—Basic (in thousands) . . . . . . . . . . 9,091 8,188 7,727
Weighted Average Shares Outstanding—Diluted (in thousands) . . . . . . . . 9,292 8,433 8,073
The accompanying notes are an integral part of these consolidated financial statements.
F-4

Virtus Investment Partners, Inc.
Consolidated Statements of Comprehensive Income
Years Ended December 31,
2014 2013 2012
($ in thousands)
Net Income . . . . . . . . . . . . . . . . . . . . . . . . . . . . . . . . . . . . . . . . . . . . . . . . . . . . . . . . $96,965 $77,130 $37,773Other comprehensive income (loss), net of tax:
Foreign currency translation adjustment, net of tax of $132 and ($50) for theyears ended December 31, 2014 and 2013 . . . . . . . . . . . . . . . . . . . . . . . . . . (216) 81 —
Unrealized gain (loss) on available-for-sale securities, net of tax of ($76),$223, and $81 for the years ended December 31, 2014, 2013 and 2012,respectively . . . . . . . . . . . . . . . . . . . . . . . . . . . . . . . . . . . . . . . . . . . . . . . . . . 124 56 (273)
Other comprehensive (loss) income . . . . . . . . . . . . . . . . . . . . . . . . . . . . . (92) 137 (273)Comprehensive income . . . . . . . . . . . . . . . . . . . . . . . . . . . . . . . . . . . . . . . . . . . . . . 96,873 77,267 37,500Comprehensive income attributable to noncontrolling interests . . . . . . . . . . . . . . . 735 (1,940) (101)Allocation of comprehensive income to preferred stockholders . . . . . . . . . . . . . . . — — (64)
Comprehensive income attributable to common stockholders . . . . . . . . . . . . . . . . $97,608 $75,327 $37,335
The accompanying notes are an integral part of these consolidated financial statements.
F-5
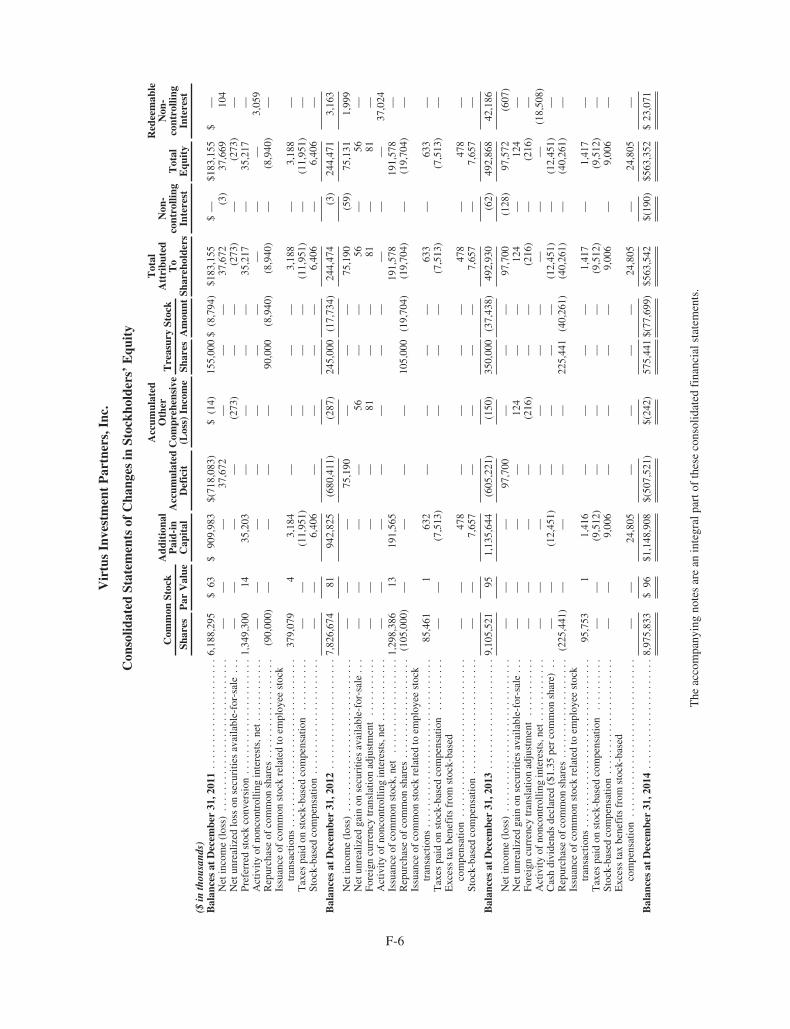
Vir
tus
Inve
stm
ent
Par
tner
s,In
c.
Con
solid
ated
Stat
emen
tsof
Cha
nges
inSt
ockh
olde
rs’
Equ
ity
Com
mon
Stoc
kA
ddit
iona
lP
aid-
inC
apit
alA
ccum
ulat
edD
efic
it
Acc
umul
ated
Oth
erC
ompr
ehen
sive
(Los
s)In
com
e
Tre
asur
ySt
ock
Tot
alA
ttri
bute
dT
oSh
areh
olde
rs
Non
-co
ntro
lling
Inte
rest
Tot
alE
quit
y
Red
eem
able
Non
-co
ntro
lling
Inte
rest
Shar
esP
arV
alue
Shar
esA
mou
nt
($in
thou
sand
s)B
alan
ces
atD
ecem
ber
31,2
011
....
....
....
....
....
.6,
188,
295
$63
$90
9,98
3$(
718,
083)
$(1
4)15
5,00
0$
(8,7
94)
$183
,155
$—
$183
,155
$—
Net
inco
me
(los
s)..
....
....
....
....
....
....
...
——
—37
,672
——
—37
,672
(3)
37,6
6910
4N
etun
real
ized
loss
onse
curi
ties
avai
labl
e-fo
r-sa
le..
.—
——
—(2
73)
——
(273
)—
(273
)—
Pref
erre
dst
ock
conv
ersi
on..
....
....
....
....
....
1,34
9,30
014
35,2
03—
——
—35
,217
—35
,217
—A
ctiv
ityof
nonc
ontr
ollin
gin
tere
sts,
net
....
....
....
——
——
——
——
——
3,05
9R
epur
chas
eof
com
mon
shar
es..
....
....
....
....
.(9
0,00
0)—
——
—90
,000
(8,9
40)
(8,9
40)
—(8
,940
)—
Issu
ance
ofco
mm
onst
ock
rela
ted
toem
ploy
eest
ock
tran
sact
ions
....
....
....
....
....
....
....
....
379,
079
43,
184
——
——
3,18
8—
3,18
8—
Tax
espa
idon
stoc
k-ba
sed
com
pens
atio
n..
....
....
——
(11,
951)
——
—(1
1,95
1)—
(11,
951)
—St
ock-
base
dco
mpe
nsat
ion
....
....
....
....
....
..—
—6,
406
——
——
6,40
6—
6,40
6—
Bal
ance
sat
Dec
embe
r31
,201
2..
....
....
....
....
...
7,82
6,67
481
942,
825
(680
,411
)(2
87)
245,
000
(17,
734)
244,
474
(3)
244,
471
3,16
3
Net
inco
me
(los
s)..
....
....
....
....
....
....
...
——
—75
,190
——
—75
,190
(59)
75,1
311,
999
Net
unre
aliz
edga
inon
secu
ritie
sav
aila
ble-
for-
sale
...
——
——
56—
—56
—56
—Fo
reig
ncu
rren
cytr
ansl
atio
nad
just
men
t..
....
....
.—
——
—81
——
81—
81—
Act
ivity
ofno
ncon
trol
ling
inte
rest
s,ne
t..
....
....
..—
——
——
——
——
—37
,024
Issu
ance
ofco
mm
onst
ock,
net
....
....
....
....
..1,
298,
386
1319
1,56
519
1,57
819
1,57
8—
Rep
urch
ase
ofco
mm
onsh
ares
....
....
....
....
...
(105
,000
)—
——
—10
5,00
0(1
9,70
4)(1
9,70
4)—
(19,
704)
—Is
suan
ceof
com
mon
stoc
kre
late
dto
empl
oyee
stoc
ktr
ansa
ctio
ns..
....
....
....
....
....
....
....
..85
,461
163
2—
——
—63
3—
633
—T
axes
paid
onst
ock-
base
dco
mpe
nsat
ion
....
....
..—
—(7
,513
)—
——
(7,5
13)
(7,5
13)
—E
xces
sta
xbe
nefi
tsfr
omst
ock-
base
dco
mpe
nsat
ion
....
....
....
....
....
....
....
..—
—47
8—
——
—47
8—
478
—St
ock-
base
dco
mpe
nsat
ion
....
....
....
....
....
..—
—7,
657
——
——
7,65
7—
7,65
7—
Bal
ance
sat
Dec
embe
r31
,201
3..
....
....
....
....
...
9,10
5,52
195
1,13
5,64
4(6
05,2
21)
(150
)35
0,00
0(3
7,43
8)49
2,93
0(6
2)49
2,86
842
,186
Net
inco
me
(los
s)..
....
....
....
....
....
....
...
——
—97
,700
——
—97
,700
(128
)97
,572
(607
)N
etun
real
ized
gain
onse
curi
ties
avai
labl
e-fo
r-sa
le..
.—
——
—12
4—
—12
4—
124
—Fo
reig
ncu
rren
cytr
ansl
atio
nad
just
men
t..
....
....
.—
——
—(2
16)
——
(216
)—
(216
)—
Act
ivity
ofno
ncon
trol
ling
inte
rest
s,ne
t..
....
....
..—
——
——
——
——
—(1
8,50
8)C
ash
divi
dend
sde
clar
ed($
1.35
per
com
mon
shar
e)..
——
(12,
451)
——
——
(12,
451)
—(1
2,45
1)—
Rep
urch
ase
ofco
mm
onsh
ares
....
....
....
....
...
(225
,441
)—
——
—22
5,44
1(4
0,26
1)(4
0,26
1)—
(40,
261)
—Is
suan
ceof
com
mon
stoc
kre
late
dto
empl
oyee
stoc
ktr
ansa
ctio
ns..
....
....
....
....
....
....
....
..95
,753
11,
416
——
——
1,41
7—
1,41
7—
Tax
espa
idon
stoc
k-ba
sed
com
pens
atio
n..
....
....
——
(9,5
12)
——
——
(9,5
12)
(9,5
12)
—St
ock-
base
dco
mpe
nsat
ion
....
....
....
....
....
..—
—9,
006
——
——
9,00
6—
9,00
6—
Exc
ess
tax
bene
fits
from
stoc
k-ba
sed
com
pens
atio
n..
....
....
....
....
....
....
....
——
24,8
05—
——
—24
,805
—24
,805
—
Bal
ance
sat
Dec
embe
r31
,201
4..
....
....
....
....
...
8,97
5,83
3$
96$1
,148
,908
$(50
7,52
1)$(
242)
575,
441
$(77
,699
)$5
63,5
42$(
190)
$563
,352
$23
,071
The
acco
mpa
nyin
gno
tes
are
anin
tegr
alpa
rtof
thes
eco
nsol
idat
edfi
nanc
ials
tate
men
ts.
F-6

Virtus Investment Partners, Inc.
Consolidated Statements of Cash Flows
Years Ended December 31,
2014 2013 2012
($ in thousands)Cash Flows from Operating Activities:
Net income . . . . . . . . . . . . . . . . . . . . . . . . . . . . . . . . . . . . . . . . . . . . . . . . . . . . . . . . . . . . . . . . . . . . . . . . $ 96,965 $ 77,130 $ 37,773Adjustments to reconcile net income to net cash (used in) provided by operating activities:
Depreciation expense, intangible asset and other amortization . . . . . . . . . . . . . . . . . . . . . . . . . . . . 6,759 7,046 6,198Stock-based compensation . . . . . . . . . . . . . . . . . . . . . . . . . . . . . . . . . . . . . . . . . . . . . . . . . . . . . . . 9,778 7,960 6,927Excess tax benefit from stock-based compensation . . . . . . . . . . . . . . . . . . . . . . . . . . . . . . . . . . . . (24,805) (478) (89)Amortization of deferred commissions . . . . . . . . . . . . . . . . . . . . . . . . . . . . . . . . . . . . . . . . . . . . . . 17,907 14,453 10,715Payments of deferred commissions . . . . . . . . . . . . . . . . . . . . . . . . . . . . . . . . . . . . . . . . . . . . . . . . . (13,796) (18,912) (10,868)Equity in earnings of equity method investments . . . . . . . . . . . . . . . . . . . . . . . . . . . . . . . . . . . . . . (488) (161) —Realized and unrealized gains on trading securities . . . . . . . . . . . . . . . . . . . . . . . . . . . . . . . . . . . . (914) (2,350) (1,891)Realized and unrealized losses (gains) on investments of consolidated sponsored investment
products . . . . . . . . . . . . . . . . . . . . . . . . . . . . . . . . . . . . . . . . . . . . . . . . . . . . . . . . . . . . . . . . . . . . 4,671 (3,515) (2,072)Sales (purchases) of trading securities, net . . . . . . . . . . . . . . . . . . . . . . . . . . . . . . . . . . . . . . . . . . . 26,742 (2,701) 2,025Purchases of investments by consolidated sponsored investment products, net . . . . . . . . . . . . . . . (195,683) (100,499) (41,155)Sales of securities sold short by consolidated sponsored investment products, net . . . . . . . . . . . . 8,071 — —Deferred taxes, net . . . . . . . . . . . . . . . . . . . . . . . . . . . . . . . . . . . . . . . . . . . . . . . . . . . . . . . . . . . . . . 4,394 32,596 26,689
Changes in operating assets and liabilities:Cash pledged or on deposit of consolidated sponsored investment products . . . . . . . . . . . . . (10,785) — —Accounts receivable, net and other assets . . . . . . . . . . . . . . . . . . . . . . . . . . . . . . . . . . . . . . . . (4,157) (13,416) (10,047)Other assets of consolidated sponsored investment products . . . . . . . . . . . . . . . . . . . . . . . . . 1,082 (6,043) (683)Accrued compensation and benefits, accounts payable, accrued liabilities and other
liabilities . . . . . . . . . . . . . . . . . . . . . . . . . . . . . . . . . . . . . . . . . . . . . . . . . . . . . . . . . . . . . . . 17,754 37,575 15,919Liabilities of consolidated sponsored investment products . . . . . . . . . . . . . . . . . . . . . . . . . . . (2,366) 152 377
Net cash (used in) provided by operating activities . . . . . . . . . . . . . . . . . . . . . . . . . . . . (58,871) 28,837 39,818
Cash Flows from Investing Activities:Capital expenditures . . . . . . . . . . . . . . . . . . . . . . . . . . . . . . . . . . . . . . . . . . . . . . . . . . . . . . . . . . . . (2,432) (2,009) (3,782)Change in cash and cash equivalents of consolidated sponsored investment products due to
deconsolidation . . . . . . . . . . . . . . . . . . . . . . . . . . . . . . . . . . . . . . . . . . . . . . . . . . . . . . . . . . . . . . (436) (662) —Asset acquisitions and purchases of other investments . . . . . . . . . . . . . . . . . . . . . . . . . . . . . . . . . . (5,000) (3,364) (1,006)Purchase of available-for-sale securities . . . . . . . . . . . . . . . . . . . . . . . . . . . . . . . . . . . . . . . . . . . . . (313) (196) (379)
Net cash used in investing activities . . . . . . . . . . . . . . . . . . . . . . . . . . . . . . . . . . . . . . . . (8,181) (6,231) (5,167)
Cash Flows from Financing Activities:Contingent consideration paid for acquired investment management contracts . . . . . . . . . . . . . . . — (630) (665)Borrowings of proceeds from short sales by consolidated sponsored investment products . . . . . . 2,555 — —Repurchase of common shares . . . . . . . . . . . . . . . . . . . . . . . . . . . . . . . . . . . . . . . . . . . . . . . . . . . . (40,261) (19,704) (8,940)Dividends paid . . . . . . . . . . . . . . . . . . . . . . . . . . . . . . . . . . . . . . . . . . . . . . . . . . . . . . . . . . . . . . . . . (8,182) — —Proceeds from exercise of stock options . . . . . . . . . . . . . . . . . . . . . . . . . . . . . . . . . . . . . . . . . . . . . 753 570 2,636Taxes paid related to net share settlement of restricted stock units . . . . . . . . . . . . . . . . . . . . . . . . . (9,512) (7,513) (11,951)Proceeds from issuance of common stock, net of issuance costs . . . . . . . . . . . . . . . . . . . . . . . . . . — 191,771 —Excess tax benefits from stock-based compensation . . . . . . . . . . . . . . . . . . . . . . . . . . . . . . . . . . . . 24,805 478 89Payment of debt and deferred financing costs . . . . . . . . . . . . . . . . . . . . . . . . . . . . . . . . . . . . . . . . . — (15,026) (700)Contributions of noncontrolling interests, net . . . . . . . . . . . . . . . . . . . . . . . . . . . . . . . . . . . . . . . . . 28,653 35,547 3,059
Net cash (used in) provided by financing activities . . . . . . . . . . . . . . . . . . . . . . . . . . . . (1,189) 185,493 (16,472)
Net (decrease) increase in cash and cash equivalents . . . . . . . . . . . . . . . . . . . . . . . . . . . . . . . . . . . . . . . . . . . (68,241) 208,099 18,179Cash and cash equivalents, beginning of year . . . . . . . . . . . . . . . . . . . . . . . . . . . . . . . . . . . . . . . . . . . . . . . . . 271,545 63,446 45,267
Cash and Cash Equivalents, end of year . . . . . . . . . . . . . . . . . . . . . . . . . . . . . . . . . . . . . . . . . . . . . . . . . . . $ 203,304 $ 271,545 $ 63,446
Supplemental Cash Flow Information:Interest paid . . . . . . . . . . . . . . . . . . . . . . . . . . . . . . . . . . . . . . . . . . . . . . . . . . . . . . . . . . . . . . . . . . . $ 266 $ 393 $ 415Income taxes paid, net . . . . . . . . . . . . . . . . . . . . . . . . . . . . . . . . . . . . . . . . . . . . . . . . . . . . . . . . . . . $ 23,274 $ 1,697 $ 74
Non-Cash Investing Activities:Purchase of investment management contracts . . . . . . . . . . . . . . . . . . . . . . . . . . . . . . . . . . . . . . . . $ — $ — $ 435Non-cash activity related to rabbi trust . . . . . . . . . . . . . . . . . . . . . . . . . . . . . . . . . . . . . . . . . . . . . . $ (843) $ (1,250) $ (144)
Non-Cash Financing Activities:Dividends payable . . . . . . . . . . . . . . . . . . . . . . . . . . . . . . . . . . . . . . . . . . . . . . . . . . . . . . . . . . . . . . $ 4,270 $ — $ —(Decrease) increase to noncontrolling interest due to (deconsolidation) consolidation of
sponsored investment products, net . . . . . . . . . . . . . . . . . . . . . . . . . . . . . . . . . . . . . . . . . . . . . . . $ (47,165) $ 1,477 $ —Preferred stock conversion . . . . . . . . . . . . . . . . . . . . . . . . . . . . . . . . . . . . . . . . . . . . . . . . . . . . . . . $ — $ — $ 35,217
The accompanying notes are an integral part of these condensed consolidated financial statements.
F-7
Virtus Investment Partners, Inc.
Notes to Consolidated Financial Statements
1. Organization and Business
Virtus Investment Partners, Inc. (the “Company,” “we,” “us,” “our” or “Virtus”), a Delaware corporation,operates in the investment management industry through its subsidiaries.
The Company provides investment management and related services to individuals and institutionsthroughout the United States of America. The Company’s retail investment management services are provided toindividuals through products consisting of open-end mutual funds, closed-end funds, variable insurance fundsand separately managed accounts. Separately managed accounts are offered through intermediary programs thatare sponsored and distributed by unaffiliated broker-dealers and individual direct managed account investmentservices that are provided by the Company. Institutional investment management services are provided primarilyto corporations, multi-employer retirement funds, employee retirement systems, foundations, endowments andsubadvisory accounts.
2. Summary of Significant Accounting Policies
The Company’s significant accounting policies, which have been consistently applied, are as follows:
Principles of Consolidation and Basis of Presentation
The Company’s consolidated financial statements have been prepared in conformity with accountingprinciples generally accepted in the United States of America (“GAAP”). The consolidated financial statementsinclude the accounts of the Company, its subsidiaries and sponsored investment products in which it has acontrolling financial interest. The Company is generally considered to have a controlling financial interest whenit owns a majority of the voting interest in an entity or otherwise has the power to govern the financial andoperating policies of the subsidiary. See Note 19 for additional information related to the consolidation ofsponsored investment products. Material intercompany accounts and transactions have been eliminated.
The Company also evaluates any variable interest entities (“VIEs”) in which the Company has a variableinterest for consolidation. A VIE is an entity in which either (a) the equity investment at risk is not sufficient topermit the entity to finance its own activities without additional financial support or (b) where as a group, theholders of the equity investment at risk do not possess: (i) the power to direct the activities that most significantlyimpact the entity’s performance; (ii) the obligation to absorb expected losses or the right to receive expectedresidual returns of the entity; or (iii) proportionate voting and economic interests and where substantially all ofthe entity’s activities either involve or are conducted on behalf of the equity holders. If any entity has any ofthese characteristics, it is considered a VIE and required to be consolidated by its primary beneficiary. Theprimary beneficiary is the entity that has both the power to direct the activities that most significantly impact theVIE’s economic performance and has the obligation to absorb losses of, or the right to receive benefits from, theVIE that could potentially be significant to the VIE.
Collateralized Debt Obligations
As of December 31, 2014 and 2013, certain of the Company’s affiliates served as the collateral manager forcollateralized loan and collateralized bond obligations (collectively, “CDOs”). The CDOs’ assets and liabilitiesreside in bankruptcy remote, special purpose entities in which the Company has no ownership in, nor holds anynotes issued by, the CDOs and provides neither recourse nor guarantees. Accordingly, the Company’s financialexposure to these CDOs is limited only to the collateral investment management fees it earns, which totaled $1.6million, $1.7 million and $2.5 million for the years ended December 31, 2014, 2013 and 2012, respectively.
F-8
Virtus Investment Partners, Inc.
Notes to Consolidated Financial Statements—(Continued)
The CDOs are considered VIEs, and as a result, the Company is required to consider the nature of itsinvolvement in these VIEs in determining if it should consolidate the entity. In assessing consolidation of theCDOs, the Company assessed whether the collateral management fees represented a variable interest and theCompany was the primary beneficiary of the VIE. The primary beneficiary assessment includes an analysis of therights of the Company in its capacity as collateral manager and an analysis of whether the Company couldreceive significant benefits or absorb significant losses from the CDO.
The Company determined that its investment management fees received as collateral manager for certainCDOs did not represent a variable interest due to the anticipated fees being fixed in nature, senior to interest andprincipal payments, and any subordinated fee elements were insignificant relative to the total fee and totalanticipated economic performance of the CDOs.
Noncontrolling Interest
Noncontrolling interests represent the profit or loss attributed to third party investors in consolidatedsponsored investment products and other affiliates. Movements in amounts attributable to noncontrollinginterests in consolidated entities on the Company’s Consolidated Statements of Operations offset the operatingresults, gains and losses and interest expense of the third party investors. Noncontrolling interests related tocertain consolidated sponsored investment products are classified as redeemable noncontrolling interests becauseinvestors in these funds may request withdrawals at any time.
Use of Estimates
The preparation of the consolidated financial statements requires management to make certain estimates andassumptions that affect the reported amounts of assets and liabilities and the disclosures of contingent assets andliabilities at the dates of the consolidated financial statements and the reported amounts of revenues and expensesduring the reporting periods. Management believes the estimates used in preparing the consolidated financialstatements are reasonable and prudent. Actual results could differ from those estimates.
Segment Information
Accounting Standards Codification (“ASC”) 280, Segment Reporting, establishes disclosure requirementsrelating to operating segments in annual and interim financial statements. Business or operating segments aredefined as components of an enterprise about which separate financial information is available that is regularlyevaluated by the chief operating decision maker in deciding how to allocate resources and assess performance.The Company operates in one business segment, namely as an asset manager providing investment managementand distribution services for individual and institutional clients. The Company’s Chief Executive Officer is theCompany’s chief operating decision maker. Although the Company does make some disclosures regarding assetsunder management and other asset flows by product, the Company’s determination that it operates in onebusiness segment is based on the fact that the same investment and operational resources support multipleproducts, they have the same or similar regulatory framework and that the Company’s chief operating decisionmaker reviews the Company’s financial performance at a consolidated level. Investment organizations within theCompany are generally not aligned with specific product lines. Investment professionals manage both retail andinstitutional products.
Cash and Cash Equivalents
Cash and cash equivalents consist of cash in banks and money market fund investments.
F-9
Virtus Investment Partners, Inc.
Notes to Consolidated Financial Statements—(Continued)
Investments
Marketable Securities
Marketable securities consist of investments in the Company’s sponsored mutual funds and other publiclytraded securities which are carried at fair value in accordance with ASC 320, Investments—Debt and EquitySecurities (“ASC 320”). Marketable securities are marked to market based on the respective publicly quoted netasset values of the funds or market prices of the equity securities or bonds. Marketable securities transactions arerecorded on a trade date basis. Marketable securities include sponsored mutual funds, sponsored variableinsurance funds and other equity securities classified as trading securities and sponsored closed-end fundsclassified as available-for-sale securities. Any unrealized appreciation or depreciation on available for salesecurities, net of income taxes, is reported as a component of accumulated other comprehensive income in equityattributable to stockholders.
On a quarterly basis, the Company conducts a review to assess whether other-than-temporary impairmentexists on its available-for-sale marketable securities. Other-than-temporary declines in value may exist if the fairvalue of a marketable security has been below the carrying value for an extended period of time. If an other-than-temporary decline in value is determined to exist, the unrealized investment loss, net of tax, is recognized in theConsolidated Statements of Operations in the period in which the other-than-temporary decline in value occurs,as well as an accompanying permanent adjustment to accumulated other comprehensive income.
Equity Method Investments
The Company’s investment in noncontrolled investees is accounted for under the equity method ofaccounting in accordance with ASC 323, Investments-Equity Method and Joint Ventures. Under the equitymethod of accounting, the Company’s share of the noncontrolled affiliate’s net income or loss is recorded inother income (expense), net in the accompanying Consolidated Statements of Operations. Distributions receivedreduce the Company’s investment balance. The investment is evaluated for impairment as events or changesindicate that the carrying amount exceeds its fair value. If the carrying amount of an investment does exceed itsfair value and the decline in fair value is deemed to be other than temporary, an impairment charge will berecorded.
Non-qualified Retirement Plan Assets and Liabilities
The Company has a non-qualified retirement plan (the “Excess Incentive Plan”) that allows certainemployees to voluntarily defer compensation. Under the Excess Incentive Plan, participants elect to defer aportion of their compensation which the Company then contributes into a trust. Each participant is responsiblefor designating investment options for assets they contribute and the ultimate distribution paid to each participantreflects any gains or losses on the assets realized while in the trust. The Company holds the Excess IncentivePlan assets in a rabbi trust, which is subject to the claims of the Company’s creditors in the event of theCompany’s bankruptcy or insolvency. Assets held in trust are included in investments and are carried at fairvalue in accordance with ASC 320; the associated obligations to participants are included in other liabilities inthe Company’s Consolidated Balance Sheets. Assets held in trust consist of mutual funds and are recorded at fairvalue, utilizing Level 1 valuation techniques.
Deferred Commissions
Deferred commissions, which are included in other assets, are commissions paid to broker-dealers on salesof mutual fund shares. Deferred commissions are recovered by the receipt of monthly asset-based distributor fees
F-10

Virtus Investment Partners, Inc.
Notes to Consolidated Financial Statements—(Continued)
from the mutual funds or contingent deferred sales charges received upon redemption of shares within one to fiveyears, depending on the fund share class. The deferred costs resulting from the sale of shares are amortized on astraight-line basis over a one to five-year period, depending on the fund share class, or until the underlying sharesare redeemed. Deferred commissions are periodically assessed for impairment and additional amortizationexpense is recorded, as appropriate.
Furniture, Equipment and Leasehold Improvements, Net
Furniture, equipment and leasehold improvements are recorded at cost. Depreciation is computed using thestraight-line method over the estimated useful lives of three to seven years for furniture and office equipment,and three to five years for computer equipment and software. Leasehold improvements are depreciated over theshorter of the remaining estimated lives of the related leases or useful lives of the improvements. Major renewalsor betterments are capitalized, and recurring repairs and maintenance are expensed as incurred. Leaseholdimprovements that are funded upfront by a landlord and are constructed for the benefit of the Company arerecorded at cost and depreciated on a straight-line basis over the original minimum term of the lease and acorresponding lease incentive liability in the same amount is also recorded and initially amortized over the sameperiod.
Leases
The Company currently leases office space and equipment under various leasing arrangements. Leases areclassified as either capital leases or operating leases, as appropriate. Most lease agreements are classified asoperating leases and contain renewal options, rent escalation clauses or other inducements provided by the lessor.Rent expense under non-cancelable operating leases with scheduled rent increases or rent holidays is accountedfor on a straight-line basis over the lease term, beginning on the date of initial possession or the effective date ofthe lease agreement. The amount of the excess of straight-line rent expense over scheduled payments is recordedas a deferred liability. Build-out allowances and other such lease incentives are recorded as deferred credits, andare amortized on a straight-line basis as a reduction of rent expense beginning in the period they are deemed to beearned, which generally coincides with the effective date of the lease.
Intangible Assets and Goodwill
Definite-lived intangible assets are comprised of acquired investment advisory contracts. These assets areamortized on a straight-line basis over the estimated useful lives of such assets, which range from one to sixteenyears. Definite-lived intangible assets are evaluated for impairment on an ongoing basis under GAAP wheneverevents or circumstances indicate that the carrying value of the definite-lived intangible asset may not be fullyrecoverable. The Company determines if impairment has occurred by comparing estimates of futureundiscounted cash flows to the carrying value of assets. Assets are considered impaired, and impairment isrecorded, if the carrying value exceeds the expected future undiscounted cash flows.
Goodwill represents the excess of the purchase price of acquisitions and mergers over the identified netassets and liabilities acquired. In accordance with ASC 350, Goodwill and Other Intangible Assets, goodwill isnot being amortized. A single reporting unit has been identified for the purpose of assessing potential futureimpairments of goodwill. An impairment analysis of goodwill is performed annually or more frequently, ifwarranted by events or changes in circumstances affecting the Company’s business. The Company follows theFinancial Accounting Standards Board (“FASB”) Accounting Standards Update (“ASU”) 2011-08, TestingGoodwill for Impairment, which states that an entity has the option to first assess qualitative factors to determinewhether the existence of events or circumstances leads to a determination that it is more likely than not that the
F-11

Virtus Investment Partners, Inc.
Notes to Consolidated Financial Statements—(Continued)
fair value of a reporting unit is less than its carrying amount. If, after assessing the totality of events orcircumstances, an entity determines it is not more likely than not that the fair value of a reporting unit is less thanits carrying amount, then performing the two-step impairment test is unnecessary. The Company’s 2014 and2013 annual goodwill impairment analysis did not result in any impairment charges.
Indefinite-lived intangible assets are comprised of closed-end fund investment advisory contracts. Theseassets are tested for impairment annually and when events or changes in circumstances indicate the assets mightbe impaired. The Company follows ASU No. 2012-02, Testing Indefinite-Lived Intangible Assets for Impairment,which provides entities with an option to perform a qualitative assessment of indefinite-lived intangible assetsother than goodwill for impairment to determine if additional impairment testing is necessary. The Company’s2014 and 2013 annual indefinite-lived intangible assets impairment analyses did not result in any impairmentcharges.
Treasury Stock
Treasury stock is accounted for under the cost method and is included as a deduction from equity in theStockholders’ Equity section of the Consolidated Balance Sheets. Upon any subsequent resale, the treasury stockaccount is reduced by the cost of such stock.
Revenue Recognition
Investment management fees, distribution and service fees and administration and transfer agent fees arerecorded as revenues during the period in which services are performed. Investment management fees are earnedbased upon a percentage of assets under management and are paid pursuant to the terms of the respectiveinvestment management contracts, which generally require monthly or quarterly payment.
The Company accounts for investment management fees in accordance with ASC 605, RevenueRecognition, and has recorded its management fees net of fees paid to unaffiliated advisers. The Companyconsiders the nature of its contractual arrangements in determining whether to recognize revenue based on thegross amount billed or net amount retained. The Company has evaluated the factors in ASC 605-45 indetermining whether to record revenue on a gross or net basis with significant weight placed on: (i) if theCompany is the primary obligor in the arrangement; and (ii) if the Company has latitude in establishing price.Amounts paid to unaffiliated advisers for the years ended December 31, 2014, 2013 and 2012 were $124.4million, $96.1 million and $53.7 million, respectively.
Distribution and service fees are earned based on a percentage of assets under management and are paidmonthly pursuant to the terms of the respective distribution and service fee contracts. Underwriter fees are sales-based charges on sales of certain class A-share mutual funds.
Administration and transfer agent fees consist of fund administration fees, transfer agent fees and fiduciaryfees. Fund administration and transfer agent fees are earned based on the average daily assets in the funds.
Other income and fees consist primarily of redemption income on the early redemption of certain shareclasses of mutual funds and distribution of nonaffiliated products.
Advertising and Promotion
Advertising and promotional costs include print advertising and promotional items and are expensed asincurred. These costs are classified in other operating expense in the Consolidated Statements of Operations.
F-12

Virtus Investment Partners, Inc.
Notes to Consolidated Financial Statements—(Continued)
Stock-based Compensation
The Company accounts for stock-based compensation expense in accordance with ASC 718,Compensation—Stock Compensation (“ASC 718”), which requires the measurement and recognition ofcompensation expense for share-based awards based on the estimated fair value on the date of grant.
Restricted stock units (“RSUs”) are stock awards that entitle the holder to receive shares of the Company’scommon stock as the award vests over time or when certain performance targets are achieved. The fair value ofeach RSU award is estimated using the intrinsic value method, which is based on the fair market value price onthe date of grant unless it contains a performance metric that is considered a market condition. RSUs that containa market condition are valued using a simulation valuation model. Compensation expense for RSU awards isrecognized ratably over the vesting period on a straight-line basis.
The fair value of each stock option award is estimated on the date of grant using the Black-Scholes stockoption valuation model. The Black-Scholes stock option valuation model incorporates assumptions as to dividendyield, volatility, an appropriate risk-free interest rate and the expected life of the stock option.
Income Taxes
The Company accounts for income taxes in accordance with ASC 740, Income Taxes, which requiresrecognition of the amount of taxes payable or refundable for the current year, as well as deferred tax liabilitiesand assets for the future tax consequences of events that have been included in the Company’s financialstatements or tax returns. Deferred tax liabilities and assets result from differences between the book value andtax basis of the Company’s assets, liabilities and carry-forwards, such as net operating losses or tax credits.
The Company’s methodology for determining the realizability of deferred tax assets includes considerationof taxable income in prior carryback year(s) if carryback is permitted under the tax law, as well as considerationof the reversal of deferred tax liabilities that are in the same period and jurisdiction and are of the same characteras the temporary differences that gave rise to the deferred tax assets. The Company’s methodology also includesestimates of future taxable income from its operations, as well as the expiration dates and amounts of carry-forwards related to net operating losses and capital losses. These estimates are projected through the life of therelated deferred tax assets based on assumptions that the Company believes to be reasonable and consistent withdemonstrated operating results. Changes in future operating results not currently forecasted may have asignificant impact on the realization of deferred tax assets. Valuation allowances are provided when it isdetermined that it is more likely than not that the benefit of deferred tax assets will not be realized.
Comprehensive Income
The Company reports all changes in comprehensive income in the Consolidated Statements of Changes inStockholders’ Equity and the Consolidated Statements of Comprehensive Income. Comprehensive incomeincludes net income (loss), foreign currency translation adjustments (net of tax) and unrealized gains and losseson investments classified as available-for-sale (net of tax).
Earnings per Share
Earnings per share (“EPS”) is calculated in accordance with ASC 260, Earnings per Share. Basic EPSexcludes dilution for potential common stock issuances and is computed by dividing basic net income availableto common stockholders by the weighted-average number of common shares outstanding for the period. DilutedEPS reflects the potential dilution that could occur if securities or other contracts to issue common stock were
F-13
Virtus Investment Partners, Inc.
Notes to Consolidated Financial Statements—(Continued)
exercised or converted into common stock. For the calculation of diluted EPS, the basic weighted averagenumber of shares is increased by the dilutive effect of RSUs and stock options using the treasury stock method.
Fair Value Measurements and Fair Value of Financial Instruments
The FASB defines fair value as the price that would be received to sell an asset, or paid to transfer aliability, in an orderly transaction between market participants at the measurement date. ASC 820, Fair ValueMeasurements and Disclosures, establishes a framework for measuring fair value and a valuation hierarchy basedupon the transparency of inputs used in the valuation of an asset or liability. Classification within the hierarchy isbased upon the lowest level of input that is significant to the fair value measurement. The valuation hierarchycontains three levels as follows:
Level 1—Quoted prices for identical instruments in active markets. Level 1 assets and liabilities mayinclude debt securities and equity securities that are traded in an active exchange market.
Level 2—Quoted prices for similar instruments in active markets; quoted prices for identical or similarinstruments in markets that are not active; and model-derived valuations in which all significant inputs andsignificant value drivers are observable in active markets. Level 2 inputs may include observable marketdata such as closing market prices provided by independent pricing services after considering factors suchas the yields or prices of comparable investments of comparable quality, coupon, maturity, call rights andother potential prepayments, terms and type, reported transactions, indications as to values from dealers andgeneral market conditions. In addition, pricing services may determine the fair value of equity securitiestraded principally in foreign markets when it has been determined that there has been a significant trend inthe U.S. equity markets or in index futures trading. Level 2 assets and liabilities may include debt and equitysecurities, purchased loans and over-the-counter derivative contracts whose fair value is determined using apricing model without significant unobservable market data inputs.
Level 3—Valuations derived from valuation techniques in which one or more significant inputs orsignificant value drivers are unobservable in active exchange markets.
Recent Accounting Pronouncements
In February 2015, the Financial Accounting Standards Board (“FASB”) issued ASU No. 2015-02,Consolidation (Topic 810): Amendments to the Consolidation Analysis (“ASU 2015-02”). This standard modifiesexisting consolidation guidance for reporting organizations that are required to evaluate whether they shouldconsolidate certain legal entities. ASU 2015-02 is effective for fiscal years and interim periods within those yearsbeginning after December 15, 2015, and requires either a retrospective or a modified retrospective approach toadoption. Early adoption is permitted. The company is currently evaluating the potential impact of this standardon its financial statements, as well as the available transition methods.
In August 2014, the FASB issued ASU No. 2014-13, Measuring the Financial Assets and FinancialLiabilities of a Consolidated Collateralized Financing Entity (“CFE”) (“ASU 2014-13”). This new guidancerequires reporting entities to use the more observable of the fair value of the financial assets or the financialliabilities to measure the financial assets and the financial liabilities of a CFE when a CFE is initiallyconsolidated. It permits entities to make an accounting policy election to apply this same measurement approachafter initial consolidation or to apply other GAAP to account for the consolidated CFE’s financial assets andfinancial liabilities. It also prohibits all entities from electing to use the fair value option in ASC 825, FinancialInstruments, to measure either the financial assets or financial liabilities of a consolidated CFE that is within thescope of this issue. This guidance is effective for fiscal years beginning after December 15, 2015, and interim
F-14
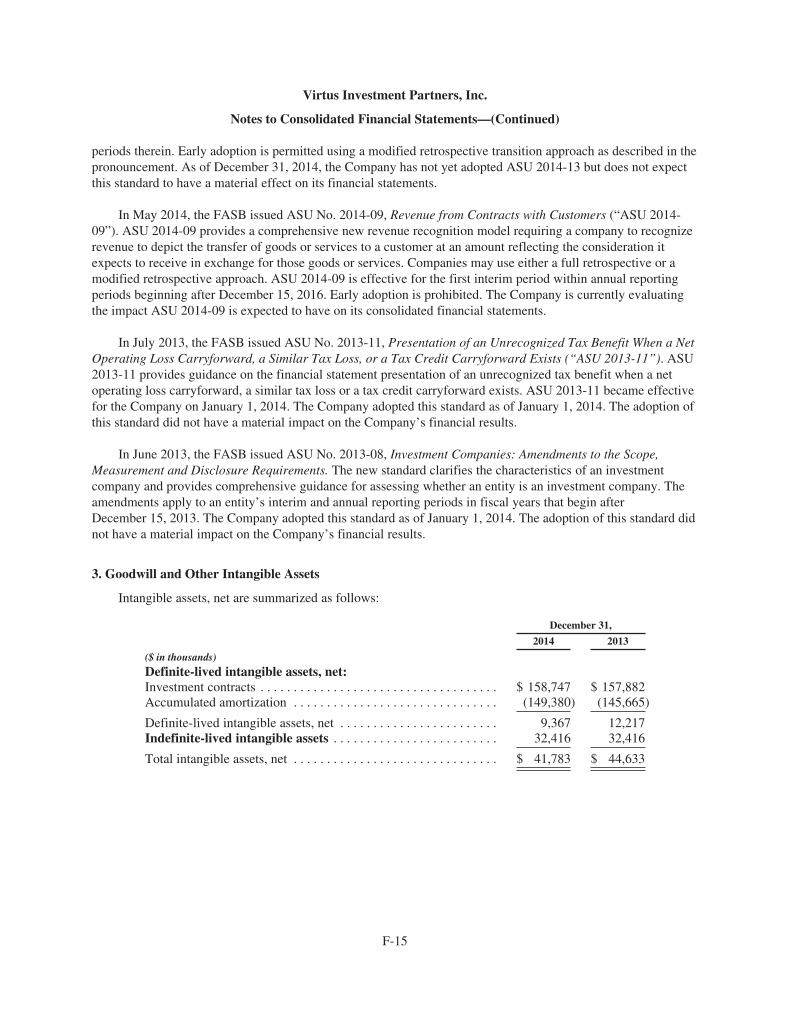
Virtus Investment Partners, Inc.
Notes to Consolidated Financial Statements—(Continued)
periods therein. Early adoption is permitted using a modified retrospective transition approach as described in thepronouncement. As of December 31, 2014, the Company has not yet adopted ASU 2014-13 but does not expectthis standard to have a material effect on its financial statements.
In May 2014, the FASB issued ASU No. 2014-09, Revenue from Contracts with Customers (“ASU 2014-09”). ASU 2014-09 provides a comprehensive new revenue recognition model requiring a company to recognizerevenue to depict the transfer of goods or services to a customer at an amount reflecting the consideration itexpects to receive in exchange for those goods or services. Companies may use either a full retrospective or amodified retrospective approach. ASU 2014-09 is effective for the first interim period within annual reportingperiods beginning after December 15, 2016. Early adoption is prohibited. The Company is currently evaluatingthe impact ASU 2014-09 is expected to have on its consolidated financial statements.
In July 2013, the FASB issued ASU No. 2013-11, Presentation of an Unrecognized Tax Benefit When a NetOperating Loss Carryforward, a Similar Tax Loss, or a Tax Credit Carryforward Exists (“ASU 2013-11”). ASU2013-11 provides guidance on the financial statement presentation of an unrecognized tax benefit when a netoperating loss carryforward, a similar tax loss or a tax credit carryforward exists. ASU 2013-11 became effectivefor the Company on January 1, 2014. The Company adopted this standard as of January 1, 2014. The adoption ofthis standard did not have a material impact on the Company’s financial results.
In June 2013, the FASB issued ASU No. 2013-08, Investment Companies: Amendments to the Scope,Measurement and Disclosure Requirements. The new standard clarifies the characteristics of an investmentcompany and provides comprehensive guidance for assessing whether an entity is an investment company. Theamendments apply to an entity’s interim and annual reporting periods in fiscal years that begin afterDecember 15, 2013. The Company adopted this standard as of January 1, 2014. The adoption of this standard didnot have a material impact on the Company’s financial results.
3. Goodwill and Other Intangible Assets
Intangible assets, net are summarized as follows:
December 31,
2014 2013
($ in thousands)
Definite-lived intangible assets, net:Investment contracts . . . . . . . . . . . . . . . . . . . . . . . . . . . . . . . . . . . . $ 158,747 $ 157,882Accumulated amortization . . . . . . . . . . . . . . . . . . . . . . . . . . . . . . . (149,380) (145,665)
Definite-lived intangible assets, net . . . . . . . . . . . . . . . . . . . . . . . . 9,367 12,217Indefinite-lived intangible assets . . . . . . . . . . . . . . . . . . . . . . . . . 32,416 32,416
Total intangible assets, net . . . . . . . . . . . . . . . . . . . . . . . . . . . . . . . $ 41,783 $ 44,633
F-15

Virtus Investment Partners, Inc.
Notes to Consolidated Financial Statements—(Continued)
Activity in goodwill and intangible assets, net is as follows:
Years Ended December 31,
2014 2013 2012
($ in thousands)
Intangible assets, netBalance, beginning of period . . . . . . . . . . . . . . . . . . . . . . . $44,633 $48,711 $52,096Acquisition . . . . . . . . . . . . . . . . . . . . . . . . . . . . . . . . . . . . . 1,075 356 560Amortization expense . . . . . . . . . . . . . . . . . . . . . . . . . . . . . (3,925) (4,434) (3,945)
Balance, end of period . . . . . . . . . . . . . . . . . . . . . . . . . . . $41,783 $44,633 $48,711
GoodwillBalance, beginning of period . . . . . . . . . . . . . . . . . . . . . . . $ 5,260 $ 5,260 $ 4,795Acquisition . . . . . . . . . . . . . . . . . . . . . . . . . . . . . . . . . . . . . — — 465
Balance, end of period . . . . . . . . . . . . . . . . . . . . . . . . . . . $ 5,260 $ 5,260 $ 5,260
Definite-lived intangible asset amortization for the next five years is estimated as follows: 2015—$3.3 million, 2016—$2.5 million, 2017—$0.8 million, 2018—$0.6 million, 2019—$0.5 million, and thereafter—$1.7 million. At December 31, 2014, the weighted average estimated remaining amortization period for definite-lived intangible assets is 4.8 years.
4. Investments
The Company’s investments, excluding the assets of consolidated sponsored investment products, discussedin Note 19, are as follows:
December 31,
2014 2013
($ in thousands)
Marketable securities . . . . . . . . . . . . . . . . . . . . . . . . . . . . . . . . . . . . . . $50,251 $28,968Equity method investments . . . . . . . . . . . . . . . . . . . . . . . . . . . . . . . . . . 7,209 4,070Nonqualified retirement plan assets . . . . . . . . . . . . . . . . . . . . . . . . . . . 5,063 4,220Other investments . . . . . . . . . . . . . . . . . . . . . . . . . . . . . . . . . . . . . . . . . 925 —
Total investments . . . . . . . . . . . . . . . . . . . . . . . . . . . . . . . . . . . . . . . . . $63,448 $37,258
F-16

Virtus Investment Partners, Inc.
Notes to Consolidated Financial Statements—(Continued)
Marketable Securities
The Company’s marketable securities consist of both trading (including securities held by a broker-dealeraffiliate) and available-for-sale securities. The composition of the Company’s marketable securities issummarized as follows:
December 31, 2014
CostUnrealized
LossUnrealized
GainFair
Value
($ in thousands)
Trading:Sponsored funds . . . . . . . . . . . . . . . . . . . . . . . . . . . . . . . . . . . . . $39,079 $(1,190) $423 $38,312Equity securities . . . . . . . . . . . . . . . . . . . . . . . . . . . . . . . . . . . . . 8,421 — 319 8,740
Available-for-sale:Sponsored closed-end funds . . . . . . . . . . . . . . . . . . . . . . . . . . . . 3,129 (163) 233 3,199
Total marketable securities . . . . . . . . . . . . . . . . . . . . . . . . . . . . . . . $50,629 $(1,353) $975 $50,251
December 31, 2013
CostUnrealized
LossUnrealized
GainFair
Value
($ in thousands)
Trading:Sponsored funds . . . . . . . . . . . . . . . . . . . . . . . . . . . . . . . . . . . . . $16,079 $(704) $2,529 $17,904Equity securities . . . . . . . . . . . . . . . . . . . . . . . . . . . . . . . . . . . . . 7,043 — 1,336 8,379
Available-for-sale:Sponsored closed-end funds . . . . . . . . . . . . . . . . . . . . . . . . . . . . 2,815 (145) 15 2,685
Total marketable securities . . . . . . . . . . . . . . . . . . . . . . . . . . . . . . . $25,937 $(849) $3,880 $28,968
For the years ended December 31, 2014, 2013 and 2012, the Company recognized a realized gain of $8.2million, $1.0 million and $0.4 million, respectively, on trading securities.
Equity Method Investments
In 2014, the Company acquired an interest in a limited partnership for approximately $5.0 million whichincludes a future capital commitment for up to $6.7 million in the event that it is called by the partnership.
On April 9, 2013, the Company acquired a 24% noncontrolling Euro-denominated equity interest inKleinwort Benson Investors International, Ltd. (“KBII”), a subsidiary of Kleinwort Benson Investors (Dublin)(“KBID”) for €2.6 million or $3.4 million. KBII is a U.S. registered investment adviser that provides specializedequity strategies. As of the date of acquisition, the Company allocated $2.5 million of this investment togoodwill, $0.6 million to definite-lived intangible assets that are being amortized over seven years and $0.3million allocated to the remaining assets and liabilities of KBII. In conjunction with this investment, theCompany entered into a put and call option with KBID. This investment is translated into U.S. dollars at currentexchange rates as of the end of each accounting period. Net income or loss of the noncontrolled affiliate istranslated at average exchange rates in effect during the accounting period. Net translation exchange gains andlosses are excluded from income and recorded in accumulated other comprehensive income.
F-17

Virtus Investment Partners, Inc.
Notes to Consolidated Financial Statements—(Continued)
Nonqualified Retirement Plan Assets
The Excess Incentive Plan allows certain employees to voluntarily defer compensation. The Company holdsthe Excess Incentive Plan assets in a rabbi trust, which is subject to the claims of the Company’s creditors in theevent of the Company’s bankruptcy or insolvency. Assets held in trust are included in investments and arecarried at fair value in accordance with ASC 320; the associated obligations to participants are included in otherliabilities in the Company’s Consolidated Balance Sheets.
Other Investments
Other investments represents interests in affiliate entities not accounted for under the equity method such asthe cost method or fair value.
5. Fair Value Measurements
The Company’s assets and liabilities measured at fair value, excluding the assets and liabilities ofconsolidated sponsored investment products discussed in Note 19, on a recurring basis as of December 31, 2014and December 31, 2013 by fair value hierarchy level were as follows:
December 31, 2014Level 1 Level 2 Level 3 Total
($ in thousands)
AssetsCash equivalents . . . . . . . . . . . . . . . . . . . . . . . . . . . . . . . . . . . . . . . . . . . . $202,054 $— $— $202,054Marketable securities trading:
Sponsored funds . . . . . . . . . . . . . . . . . . . . . . . . . . . . . . . . . . . . . . . . 38,312 — — 38,312Equity securities . . . . . . . . . . . . . . . . . . . . . . . . . . . . . . . . . . . . . . . . 8,740 — — 8,740
Marketable securities available for sale:Sponsored closed-end funds . . . . . . . . . . . . . . . . . . . . . . . . . . . . . . . 3,199 — — 3,199
Other investmentsNonqualified retirement plan assets . . . . . . . . . . . . . . . . . . . . . . . . . 5,063 — — 5,063
Total assets measured at fair value . . . . . . . . . . . . . . . . . . . . . . . . . . . . $257,368 $— $— $257,368
December 31, 2013Level 1 Level 2 Level 3 Total
($ in thousands)
AssetsCash equivalents . . . . . . . . . . . . . . . . . . . . . . . . . . . . . . . . . . . . . . . . . . . . $270,262 $— $— $270,262Marketable securities trading:
Sponsored funds . . . . . . . . . . . . . . . . . . . . . . . . . . . . . . . . . . . . . . . . 17,904 — — 17,904Equity securities . . . . . . . . . . . . . . . . . . . . . . . . . . . . . . . . . . . . . . . . 8,379 — — 8,379
Marketable securities available for sale:Sponsored closed-end funds . . . . . . . . . . . . . . . . . . . . . . . . . . . . . . . 2,685 — — 2,685
Other investmentsNonqualified retirement plan assets . . . . . . . . . . . . . . . . . . . . . . . . . 4,220 — — 4,220
Total assets measured at fair value . . . . . . . . . . . . . . . . . . . . . . . . . . . . $303,450 $— $— $303,450
The following is a discussion of the valuation methodologies used for the Company’s assets measured at fairvalue.
F-18

Virtus Investment Partners, Inc.
Notes to Consolidated Financial Statements—(Continued)
Cash equivalents represent investments in money market funds. Cash investments in actively traded moneymarket funds are valued using published net asset values and are classified as Level 1.
Sponsored funds represent investments in open-end mutual funds, variable insurance funds and closed-endfunds for which the Company acts as the investment manager. The fair value of open-end mutual funds andvariable insurance funds is determined based on their published net asset values and are categorized as Level 1.The fair value of closed-end funds is determined based on the official closing price of the exchange they aretraded on and are categorized as Level 1.
Equity securities include securities traded on active markets and are valued at the official closing price(typically last sale or bid) on the exchange on which the securities are primarily traded and are categorized asLevel 1.
Nonqualified retirement plan assets represent mutual funds within a nonqualified retirement plan whose fairvalue is determined based on their published net asset value and are categorized as Level 1.
Cash, accounts receivable, accounts payable and accrued liabilities equal or approximate fair value based onthe short-term nature of these instruments. Marketable securities are reflected in the consolidated financialstatements at fair value based upon publicly quoted market prices.
Transfers into and out of levels are reflected when significant inputs, including market inputs orperformance attributes, used for the fair value measurement become observable or unobservable or when theCompany determines it has the ability, or no longer has the ability, to redeem, in the near term, certaininvestments that the Company values using a net asset value, or if the book value of certain equity methodinvestments no longer represents fair value. There were no transfers between Level 1 and Level 2 during theyears ended December 31, 2014 and 2013.
6. Furniture, Equipment and Leasehold Improvements, Net
Furniture, equipment and leasehold improvements, net are summarized as follows:
December 31,
2014 2013
($ in thousands)
Furniture and office equipment . . . . . . . . . . . . . . . . . . . . . . . . . . . . . . $ 4,762 $ 4,033Computer equipment and software . . . . . . . . . . . . . . . . . . . . . . . . . . . 6,148 5,663Leasehold improvements . . . . . . . . . . . . . . . . . . . . . . . . . . . . . . . . . . . 8,454 7,240
19,364 16,936Accumulated depreciation and amortization . . . . . . . . . . . . . . . . . . . . (12,171) (9,717)
Furniture, equipment and leasehold improvements, net . . . . . . . . . . . $ 7,193 $ 7,219
F-19

Virtus Investment Partners, Inc.
Notes to Consolidated Financial Statements—(Continued)
7. Income Taxes
The components of the provision for income taxes are as follows:
Years Ended December 31,
2014 2013 2012
($ in thousands)
CurrentFederal . . . . . . . . . . . . . . . . . . . . . . . . . . . . . . . . . . . . $31,787 $10,395 $ —State . . . . . . . . . . . . . . . . . . . . . . . . . . . . . . . . . . . . . . 3,168 1,787 341
Total current tax expense . . . . . . . . . . . . . . . . . . . . . . . . . . 34,955 12,182 341
DeferredFederal . . . . . . . . . . . . . . . . . . . . . . . . . . . . . . . . . . . . 3,200 29,933 19,707State . . . . . . . . . . . . . . . . . . . . . . . . . . . . . . . . . . . . . . 1,194 2,663 6,982
Total deferred tax expense (benefit) . . . . . . . . . . . . . . . . . 4,394 32,596 26,689
Total expense for income taxes . . . . . . . . . . . . . . . . . . . . . $39,349 $44,778 $27,030
The following presents a reconciliation of the provision (benefit) for income taxes computed at the federalstatutory rate to the provision (benefit) for income taxes recognized in the Consolidated Statements of Operationsfor the years indicated:
Years Ended December 31,
2014 2013 2012
($ in thousands)
Tax at statutory rate . . . . . . . . . . . . . . . . . . . . . . . . . . . . . . . . $ 47,922 35% $41,968 35% $22,645 35%State taxes, net of federal benefit . . . . . . . . . . . . . . . . . . . . . . 4,357 3 2,893 2 4,793 7Uncertain tax positions . . . . . . . . . . . . . . . . . . . . . . . . . . . . . (30,961) (22) — — — —IRS audit resolution . . . . . . . . . . . . . . . . . . . . . . . . . . . . . . . . 15,505 11 — — — —Change in valuation allowance . . . . . . . . . . . . . . . . . . . . . . . 2,165 2 (264) — (242) —Other, net . . . . . . . . . . . . . . . . . . . . . . . . . . . . . . . . . . . . . . . . 361 — 181 — (166) —
Income tax expense . . . . . . . . . . . . . . . . . . . . . . . . . . . . . . . . $ 39,349 29% $44,778 37% $27,030 42%
The provision for income taxes reflects U.S. federal, state and local taxes at an estimated effective tax rateof 28.9%, 36.7% and 41.7% for the years ended December 31, 2014, 2013 and 2012, respectively. TheCompany’s effective tax rate for the year ended December 31, 2014 was impacted by a net tax benefit ofapproximately $15.5 million due to the settlement of the Internal Revenue Service (“IRS”) examination of its2011 federal consolidated corporate income tax return. The net benefit is comprised of the recognition of taxbenefits from uncertain tax positions of approximately $31.0 million and a reduction in the deferred tax assets ofapproximately $15.5 million which are related to a loss resulting from the past dissolution of a subsidiary.
F-20

Virtus Investment Partners, Inc.
Notes to Consolidated Financial Statements—(Continued)
Deferred taxes resulted from temporary differences between the amounts reported in the consolidatedfinancial statements and the tax basis of assets and liabilities. The tax effects of temporary differences are asfollows:
December 31,
2014 2013
($ in thousands)
Deferred tax assets:Intangible assets . . . . . . . . . . . . . . . . . . . . . . . . . . . . . . . . . . . . . . . . . $ 36,340 $ 43,827Net operating losses . . . . . . . . . . . . . . . . . . . . . . . . . . . . . . . . . . . . . . 21,547 23,705Compensation accruals . . . . . . . . . . . . . . . . . . . . . . . . . . . . . . . . . . . . 6,757 6,280Investments . . . . . . . . . . . . . . . . . . . . . . . . . . . . . . . . . . . . . . . . . . . . . 8,717 5,111Unrealized loss/(gain) . . . . . . . . . . . . . . . . . . . . . . . . . . . . . . . . . . . . . 2,362 (2,357)Other . . . . . . . . . . . . . . . . . . . . . . . . . . . . . . . . . . . . . . . . . . . . . . . . . . 46 1,581
Gross deferred tax assets . . . . . . . . . . . . . . . . . . . . . . . . . . . . . . . . . . 75,769 78,147Valuation allowance . . . . . . . . . . . . . . . . . . . . . . . . . . . . . . . . . . . . . . (2,397) (35)
Gross deferred tax assets after valuation allowance . . . . . . . . . . . . . . 73,372 78,112
Deferred tax liabilities:Intangible assets . . . . . . . . . . . . . . . . . . . . . . . . . . . . . . . . . . . . . . . . . (12,718) (13,078)Other investments . . . . . . . . . . . . . . . . . . . . . . . . . . . . . . . . . . . . . . . . (492) (534)
Gross deferred tax liabilities . . . . . . . . . . . . . . . . . . . . . . . . . . . . . . . . (13,210) (13,612)
Deferred tax assets, net . . . . . . . . . . . . . . . . . . . . . . . . . . . . . . . . . . . . $ 60,162 $ 64,500
At each reporting date, the Company evaluates the positive and negative evidence used to determine thelikelihood of realization of all its deferred tax assets. The Company maintained a valuation allowance in theamount of $2.4 million, $0.0 million and $1.6 million at December 31, 2014, 2013 and 2012, respectively,relating to deferred tax assets on items of a capital nature as well as certain state deferred tax assets.
As of December 31, 2014, the Company had $41.0 million of net operating loss carry-forwards for federalincome tax purposes. The related federal net operating loss carry-forwards are scheduled to begin to expire in theyear 2029. As of December 31, 2014, the Company had state net operating loss carry-forwards, varying bysubsidiary and jurisdiction, represented by a $7.2 million deferred tax asset. The state net operating loss carry-forwards are scheduled to begin to expire in 2016.
Internal Revenue Code Section 382 limits tax deductions for net operating losses, capital losses and netunrealized built-in losses after there is a substantial change in ownership in a corporation’s stock involving a 50percentage point increase in ownership by 5% or larger stockholders. During the year ended December 31, 2009,due to changes in the Company’s stockholder base, the Company incurred an ownership change as defined inSection 382. At December 31, 2014, the Company has approximately $66.5 million in pre-change net operatingloss carryovers and built-in losses that are reflected within the Company’s deferred tax assets noted above andare subject to an annual limitation of $4.2 million plus any cumulative unused Section 382 limitation from post-change tax years.
F-21
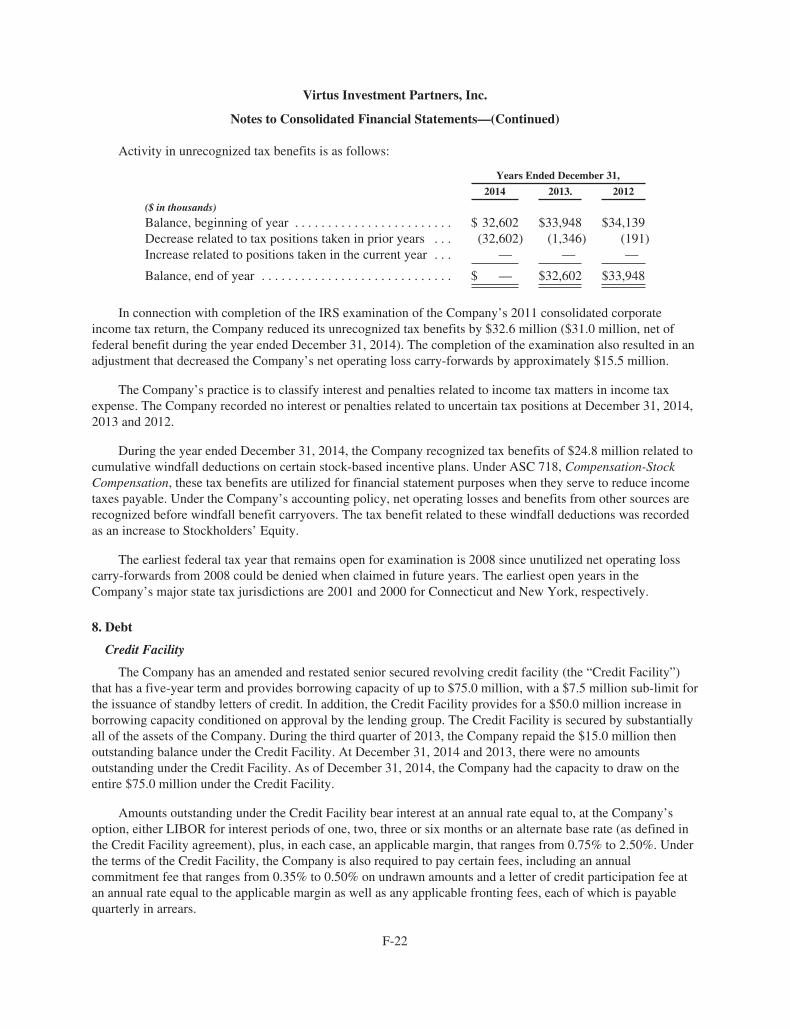
Virtus Investment Partners, Inc.
Notes to Consolidated Financial Statements—(Continued)
Activity in unrecognized tax benefits is as follows:
Years Ended December 31,
2014 2013. 2012
($ in thousands)
Balance, beginning of year . . . . . . . . . . . . . . . . . . . . . . . . $ 32,602 $33,948 $34,139Decrease related to tax positions taken in prior years . . . (32,602) (1,346) (191)Increase related to positions taken in the current year . . . — — —
Balance, end of year . . . . . . . . . . . . . . . . . . . . . . . . . . . . . $ — $32,602 $33,948
In connection with completion of the IRS examination of the Company’s 2011 consolidated corporateincome tax return, the Company reduced its unrecognized tax benefits by $32.6 million ($31.0 million, net offederal benefit during the year ended December 31, 2014). The completion of the examination also resulted in anadjustment that decreased the Company’s net operating loss carry-forwards by approximately $15.5 million.
The Company’s practice is to classify interest and penalties related to income tax matters in income taxexpense. The Company recorded no interest or penalties related to uncertain tax positions at December 31, 2014,2013 and 2012.
During the year ended December 31, 2014, the Company recognized tax benefits of $24.8 million related tocumulative windfall deductions on certain stock-based incentive plans. Under ASC 718, Compensation-StockCompensation, these tax benefits are utilized for financial statement purposes when they serve to reduce incometaxes payable. Under the Company’s accounting policy, net operating losses and benefits from other sources arerecognized before windfall benefit carryovers. The tax benefit related to these windfall deductions was recordedas an increase to Stockholders’ Equity.
The earliest federal tax year that remains open for examination is 2008 since unutilized net operating losscarry-forwards from 2008 could be denied when claimed in future years. The earliest open years in theCompany’s major state tax jurisdictions are 2001 and 2000 for Connecticut and New York, respectively.
8. Debt
Credit Facility
The Company has an amended and restated senior secured revolving credit facility (the “Credit Facility”)that has a five-year term and provides borrowing capacity of up to $75.0 million, with a $7.5 million sub-limit forthe issuance of standby letters of credit. In addition, the Credit Facility provides for a $50.0 million increase inborrowing capacity conditioned on approval by the lending group. The Credit Facility is secured by substantiallyall of the assets of the Company. During the third quarter of 2013, the Company repaid the $15.0 million thenoutstanding balance under the Credit Facility. At December 31, 2014 and 2013, there were no amountsoutstanding under the Credit Facility. As of December 31, 2014, the Company had the capacity to draw on theentire $75.0 million under the Credit Facility.
Amounts outstanding under the Credit Facility bear interest at an annual rate equal to, at the Company’soption, either LIBOR for interest periods of one, two, three or six months or an alternate base rate (as defined inthe Credit Facility agreement), plus, in each case, an applicable margin, that ranges from 0.75% to 2.50%. Underthe terms of the Credit Facility, the Company is also required to pay certain fees, including an annualcommitment fee that ranges from 0.35% to 0.50% on undrawn amounts and a letter of credit participation fee atan annual rate equal to the applicable margin as well as any applicable fronting fees, each of which is payablequarterly in arrears.
F-22

Virtus Investment Partners, Inc.
Notes to Consolidated Financial Statements—(Continued)
The Credit Facility contains customary covenants, including covenants that restrict (subject in certain instancesto minimum thresholds or exceptions) the ability of the Company and certain of its subsidiaries to incur additionalindebtedness, create liens, merge or make acquisitions, dispose of assets, enter into leases, sale/leasebacks oracquisitions of capital stock, and make loans, guarantees and investments, among other things. In addition, theCredit Facility contains certain financial covenants, the most restrictive of which include: (i) a minimum interestcoverage ratio (generally, adjusted EBITDA to interest expense as defined in and for the period specified in theCredit Facility agreement) of at least 4.00:1, and (ii) a leverage ratio (generally, total debt as of any date to adjustedEBITDA as defined in and for the period specified in the Credit Facility agreement) of no greater than 2.75:1. Forpurposes of the Credit Facility, adjusted EBITDA generally means, for any period, net income of the Companybefore interest expense, income taxes, depreciation and amortization expense, and excluding non-cash stock-basedcompensation, unrealized mark-to-market gains and losses, certain severance, and certain non-cash non-recurringgains and losses as described in and specified under the Credit Facility. At December 31, 2014 and 2013, theCompany was in compliance with all financial covenants under the Credit Facility.
The Credit Facility agreement also contains customary provisions regarding events of default which couldresult in an acceleration of amounts due under the facility. Such events of default include our failure to payprincipal or interest when due, our failure to satisfy or comply with covenants, a change of control, theimposition of certain judgments, the invalidation of liens we have granted, and a cross-default to other debtobligations.
9. Commitments and Contingencies
Legal Matters
The Company is regularly involved in litigation and arbitration as well as examinations, inquiries andinvestigations by various regulatory bodies, including the SEC, involving its compliance with, among otherthings, securities laws, client investment guidelines, laws governing the activities of broker-dealers and otherlaws and regulations affecting its products and other activities. Legal and regulatory matters of this natureinvolve or may involve the Company’s activities as an employer, issuer of securities, investor, investmentadviser, broker-dealer or taxpayer. In addition, in the normal course of business, the Company discusses matterswith its regulators raised during regulatory examinations or is otherwise subject to their inquiry. These matterscould result in censures, fines, penalties or other sanctions.
The Company accrues for a liability when it is both probable that a liability has been incurred and theamount of the liability can be reasonably estimated. Significant judgment is required in both the determination ofprobability and the determination as to whether a loss is reasonably estimable. In addition, in the event theCompany determines that a loss is not probable, but is reasonably possible, and it becomes possible to developwhat the Company believes to be a reasonable range of possible loss, then the Company will include disclosuresrelated to such matter as appropriate and in compliance with ASC 450, Loss Contingencies. The disclosures,accruals or estimates, if any, resulting from the foregoing analysis are reviewed at least quarterly and adjusted toreflect the impact of negotiations, settlements, rulings, advice of legal counsel and other information and eventspertaining to a particular matter. The Company believes, based on its current knowledge that the outcomes of itslegal and regulatory proceedings are not likely, either individually or in the aggregate, to have a material adverseeffect on its consolidated financial condition. However, in the event of unexpected subsequent developments andgiven the inherent unpredictability of these legal and regulatory matters, the Company can provide no assurancethat its assessment of any claim, dispute, regulatory examination or investigation or other legal matter will reflectthe ultimate outcome and an adverse outcome in certain matters could, from time to time, have a material adverseeffect on the Company’s results of operations or cash flows in particular quarterly or annual periods.
F-23

Virtus Investment Partners, Inc.
Notes to Consolidated Financial Statements—(Continued)
Tom Cummins v. Virtus Investment Partners Inc. et al
On February 20, 2015, a putative class action complaint alleging violation of the federal securities laws wasfiled by an individual shareholder against the Company and certain of the Company’s current officers in theUnited States District Court for the Southern District of New York. The complaint was purportedly filed onbehalf of all purchasers of the Company’s common stock between May 28, 2013 and December 22, 2014,inclusive (the “Class Period”). The complaint alleges that, during the Class Period, the defendants disseminatedmaterially false and misleading statements and concealed material adverse facts relating to certain fundssubadvised by F-Squared Investments. The complaint alleges claims under Sections 10(b) and 20(a) of theSecurities Exchange Act of 1934, as amended, and Rule 10b-5. The plaintiff seeks to recover unspecifieddamages on behalf of the class members. The Company believes that the suit is without merit and intends todefend it vigorously. The Company believes that there is not a material loss that is probable and reasonablyestimable related to this claim.
Lease Commitments
The Company incurred rental expenses, primarily related to office space, under operating leases of $3.7million, $3.4 million and $3.3 million in 2014, 2013 and 2012, respectively. Minimum aggregate rental paymentsrequired under operating leases that have initial or remaining non-cancelable lease terms in excess of one year asof December 31, 2014 are as follows: $3.7 million in 2015; $3.7 million in 2016; $3.6 million in 2017; $3.4million in 2018; $2.1 million in 2019; and $4.0 million thereafter.
10. Equity Transactions
During the years ended December 31, 2014 and 2013, pursuant to the Company’s share repurchase programimplemented in the fourth quarter of 2010, the Company repurchased 225,441 and 105,000 common shares,respectively, at a weighted average price of $178.54 per share and $187.61 per share, respectively, plustransaction costs for a total cost of approximately $40.3 million and $19.7 million, respectively. As ofDecember 31, 2014, the Company has repurchased a total of 575,441 shares of common stock at a weightedaverage price of $134.98 per share plus transaction costs for a total cost of $77.7 million.
On December 10, 2014, the Company’s board of directors authorized an additional 500,000 shares ofcommon stock under the current share repurchase program. Total shares remaining available for repurchase as ofDecember 31, 2014 were 624,559. Under the terms of the program, the Company may repurchase shares of itscommon stock from time to time at its discretion through open market repurchases and/or privately negotiatedtransactions, depending on price and prevailing market and business conditions. The program, which has nospecified term, may be suspended or terminated at any time.
During the second, third and fourth quarters of the year ended December 31, 2014, the Board of Directorsdeclared quarterly cash dividends of $0.45 each. Total dividends declared were $12.5 million for the year endedDecember 31, 2014. At December 31, 2014, $4.3 million is shown as dividends payable in liabilities in theConsolidated Balance Sheet, primarily representing the fourth quarter dividend to be paid on February 13, 2015to all shareholders of record on January 30, 2015. There were no cash dividends during the year endedDecember 31, 2013.
In September 2013, the Company issued 1.3 million shares of common stock in a public offering for netproceeds of $191.8 million after underwriting discounts, commissions and other offering expenses, pursuant toan already effective shelf registration statement.
F-24

Virtus Investment Partners, Inc.
Notes to Consolidated Financial Statements—(Continued)
11. Accumulated Other Comprehensive Income
The changes in accumulated other comprehensive income by, component, are as follows:
Unrealized Gainsand (Losses)on Securities
Available-for-Sale
ForeignCurrency
TranslationAdjustments
($ in thousands)
Balance December 31, 2013 . . . . . . . . . . . . . . . . . . . . . . . . . $(231) $ 81
Unrealized net gains on investments, net of tax of ($76) . . . 124 —Foreign currency translation adjustments, net of tax of
$132 . . . . . . . . . . . . . . . . . . . . . . . . . . . . . . . . . . . . . . . . . . — (216)Amounts reclassified from accumulated other
comprehensive income . . . . . . . . . . . . . . . . . . . . . . . . . . . . — —
Net current-period other comprehensive income . . . . . . . . . . 124 (216)
Balance December 31, 2014 . . . . . . . . . . . . . . . . . . . . . . . . . $(107) $(135)
Unrealized Gainsand (Losses)on Securities
Available-for-Sale
ForeignCurrency
TranslationAdjustments
($ in thousands)
Balance December 31, 2012 . . . . . . . . . . . . . . . . . . . . . . . . . $(287) $ —
Unrealized net gains on investments, net of tax of $223 . . . . 56 —Foreign currency translation adjustments, net of tax of
($50) . . . . . . . . . . . . . . . . . . . . . . . . . . . . . . . . . . . . . . . . . . — 81Amounts reclassified from accumulated other
comprehensive income . . . . . . . . . . . . . . . . . . . . . . . . . . . . — —
Net current-period other comprehensive income . . . . . . . . . . 56 81
Balance December 31, 2013 . . . . . . . . . . . . . . . . . . . . . . . . . $(231) $ 81
12. Capital and Reserve Requirement Information
As a broker-dealer registered with the Securities and Exchange Commission and a member of the FinancialIndustry Regulatory Authority, our subsidiary, VP Distributors, LLC (“VPD”), is subject to certain rules regardingminimum net capital. VPD operates pursuant to Rule 15c3-1(a), promulgated under the Securities Exchange Act of1934, as amended (the “Exchange Act”), and, accordingly, is required to maintain a ratio of “aggregateindebtedness” to “net capital” (as those items are defined in the rule) which may not exceed 15.0 to 1.0.
Aggregate indebtedness, net capital, and the resultant ratio for VPD were as follows:
December 31,
2014 2013 2012
($ in thousands)
Aggregate indebtedness . . . . . . . . . . . . . . . . . . . . . . . . . $ 23,511 $ 28,020 $ 23,443Net capital . . . . . . . . . . . . . . . . . . . . . . . . . . . . . . . . . . . . 21,919 22,086 16,617Ratio of aggregate indebtedness to net capital . . . . . . . . 1.1 to 1 1.3 to 1 1.4 to 1
F-25

Virtus Investment Partners, Inc.
Notes to Consolidated Financial Statements—(Continued)
VPD’s minimum required net capital at December 31, 2014 and 2013 based on its aggregate indebtednesson those dates was $1.6 million and $1.9 million, respectively.
The operations of VPD do not include the physical handling of securities or the maintenance of opencustomer accounts. Accordingly, VPD claims exemption from the reserve provisions of Rule 15c3-3 promulgatedunder the Exchange Act pursuant to the exemption allowed by paragraph (k)(2)(i) of such rule.
13. Restructuring and Severance
During 2014, 2013 and 2012, the Company recorded restructuring charges of $0.3 million, $0.2 million and$1.6 million, respectively, related to headcount reductions and consolidation activities. These restructuring andseverance charges have been included within restructuring and severance expenses in the accompanyingConsolidated Statements of Operations. There was less than $0.1 million of unpaid severance and related chargesas of December 31, 2014.
14. BMO Related Party Transactions
In May 2006, the Company acquired the rights to advise, distribute and administer the Insight Funds fromBMO Asset Management Corp. (“BMO”), a subsidiary of BMO Financial Corp. BMO and BMO FinancialCorp., a significant stockholder of the Company, are related parties of the Company.
Subadvisory investment management fees and distribution and administration fee expenses paid or payableto BMO were $0.1 million, $0.5 million and $2.1 million for the years ended December 31, 2014, 2013 and 2012respectively. No amount was payable to BMO and its affiliates at December 31, 2014. At December 31, 2013,less than $0.1 million was payable to BMO and its affiliates related to subadvisory investment management feesand distribution fees.
15. Retirement Savings Plan
The Company sponsors a defined contribution 401(k) retirement plan (the “401(k) Plan”) covering allemployees who meet certain age and service requirements. Employees may contribute a percentage of theireligible compensation into the 401(k) Plan, subject to certain limitations imposed by the Internal Revenue Code.The Company matches employees’ contributions at a rate of 100% of employees’ contributions up to the first3.0% and 50.0% of the next 2.0% of the employees’ compensation contributed to the 401(k) Plan. TheCompany’s matching contributions were $2.8 million, $2.5 million and $2.0 million in 2014, 2013 and 2012,respectively.
16. Stock-Based Compensation
The Company has an Omnibus Incentive and Equity Plan (the “Plan”) under which officers, employees anddirectors may be granted equity-based awards, including restricted stock units (“RSUs”), stock options andunrestricted shares of common stock. At December 31, 2014, 427,781 shares of common stock remain availablefor issuance of the 1,800,000 shares that were reserved for issuance under the Plan. Each RSU entitles the holderto one share of common stock when the restriction expires. RSUs generally have a term of one to three years andmay be time-vested or performance-contingent. Stock options generally cliff vest after three years and have acontractual life of ten years. Stock options are granted with an exercise price equal to the fair market value of theshares at the date of grant. The fair value of each RSU is estimated using the intrinsic value method, which isbased on the fair market value price on the date of grant unless it contains a performance metric that is
F-26

Virtus Investment Partners, Inc.
Notes to Consolidated Financial Statements—(Continued)
considered a market condition. RSUs that contain a market condition are valued using a simulation valuationmodel. Shares that are issued upon exercise of stock options and vesting of RSUs are newly issued shares fromthe Plan and are not issued from treasury stock.
Stock-based compensation expense is summarized as follows:
Years Ended December 31,
2014 2013 2012
($ in thousands)
Stock-based compensation expense . . . . . . . . . . . . . . . . . . . . . $9,778 $7,960 $6,927
RSU activity for the year ended December 31, 2014 is summarized as follows:
Numberof shares
WeightedAverage
Grant DateFair Value
Outstanding at December 31, 2013 . . . . . . . . . . . . . . . . . 233,763 $ 87.97Granted . . . . . . . . . . . . . . . . . . . . . . . . . . . . . . . . . . . . . . . 77,947 $183.83Forfeited . . . . . . . . . . . . . . . . . . . . . . . . . . . . . . . . . . . . . . (13,860) $139.61Settled . . . . . . . . . . . . . . . . . . . . . . . . . . . . . . . . . . . . . . . . (117,914) $ 60.91
Outstanding at December 31, 2014 . . . . . . . . . . . . . . . . . 179,936 $143.25
The grant-date intrinsic value of RSUs granted during the year ended December 31, 2014 was $14.3 million.At December 31, 2014, outstanding RSUs have a weighted average remaining contractual life of 1.1 years. Theweighted-average grant-date fair value of RSUs granted during the years ended December 31, 2014, 2013 and2012 was $183.83, $188.36 and $81.47 per share, respectively. The total fair value of RSUs vested during theyears ended December 31, 2014, 2013 and 2012 was $21.1 million, $17.9 million and $30.7 million,respectively. For the years ended December 31, 2014, 2013 and 2012, a total of 50,952, 38,222 and 143,102RSUs, respectively, were withheld through net share settlement by the Company to settle minimum employee taxwithholding obligations. The Company paid $9.1 million, $7.5 million and $11.5 million for the years endedDecember 31, 2014, 2013 and 2012, respectively, in minimum employee tax withholding obligations related toRSUs withheld. These net share settlements had the effect of share repurchases by the Company as they reducedthe number of shares that would have been otherwise issued as a result of the vesting.
As of December 31, 2014, unamortized stock-based compensation expense for outstanding RSUs was $12.6million, with a weighted average remaining amortization period of 1.1 years. As of December 31, 2013,unamortized stock-based compensation expense for outstanding RSUs and stock options was $8.9 million and$0.1 million, respectively, with weighted average remaining amortization periods of 1.0 years and 0.2 years,respectively. The Company did not capitalize any stock-based compensation expenses during the years endedDecember 31, 2014, 2013 and 2012. There were no unvested stock options at December 31, 2014.
During the year ended December 31, 2014, the Company granted 27,782 RSUs which contain twoperformance based metrics in addition to a service condition. The two performance metrics are based on theCompany’s growth in operating income, as adjusted, relative to peers over a one year period and totalshareholder return (“TSR”) relative to peers over a three year period. For the year ended December 31,2014, total stock-based compensation expense included $1.4 million for these performance contingent RSUs. Asof December 31, 2014, unamortized stock-based compensation expense related to these performance contingentRSUs was $3.5 million.
F-27

Virtus Investment Partners, Inc.
Notes to Consolidated Financial Statements—(Continued)
Compensation expense for these performance contingent awards is recognized over the three year serviceperiod based upon the value determined under the intrinsic value method for the growth in operating income, asadjusted portion of the awards and the Monte Carlo simulation valuation model for the TSR portion of theawards since it represents a market condition. Compensation expense for the TSR portion of the awards is fixedat the date of grant and will not be adjusted in future periods based upon the achievement of the TSRperformance metric. Compensation expense for the growth in operating income, as adjusted, portion of theawards is recorded each period based upon a probability assessment of the expected outcome of the performancemetric with a final adjustment upon the final outcome.
Stock option activity for the year ended December 31, 2014 is summarized as follows:
Numberof shares
WeightedAverage
Exercise Price
Outstanding at December 31, 2013 . . . . . . . . . . . . . . . . . 190,160 $20.11Granted . . . . . . . . . . . . . . . . . . . . . . . . . . . . . . . . . . . . . . — $ —Exercised . . . . . . . . . . . . . . . . . . . . . . . . . . . . . . . . . . . . . (27,336) $27.97Forfeited . . . . . . . . . . . . . . . . . . . . . . . . . . . . . . . . . . . . . — $ —
Outstanding at December 31, 2014 . . . . . . . . . . . . . . . . . 162,824 $18.79
Vested and exercisable at December 31, 2014 . . . . . . . . 162,824 $18.79
The weighted-average remaining contractual term for stock options outstanding at December 31, 2014 andDecember 31, 2013 was 3.9 and 4.8 years, respectively. The weighted-average remaining contractual term forstock options vested and exercisable at December 31, 2014 was 3.9 years. At December 31, 2014, the aggregateintrinsic value of stock options outstanding and vested and exercisable was $24.7 million. The total grant-datefair value of stock options vested during the years ended December 31, 2014, 2013 and 2012 was $0.4 million,$0.2 million and $1.2 million, respectively. The total intrinsic value of stock options exercised for the yearsended December 31, 2014, 2013 and 2012 was $4.2 million, $5.1 million, $9.2 million, respectively. Cashreceived from stock option exercises was $0.8 million, $0.6 million and $2.6 million for 2014, 2013 and 2012,respectively.
Employee Stock Purchase Plan
The Company offers an employee stock purchase plan that allows employees to purchase shares of commonstock on the open market at market price through after-tax payroll deductions. The initial transaction fees arepaid for by the Company and shares of common stock are purchased on a quarterly basis. The Company does notreserve shares for this plan or discount the purchase price of the shares.
F-28

Virtus Investment Partners, Inc.
Notes to Consolidated Financial Statements—(Continued)
17. Earnings Per Share
The computation of basic and diluted earnings per share is as follows:
Years Ended December 31,
2014 2013 2012
($ in thousands, except per share amounts)
Net Income . . . . . . . . . . . . . . . . . . . . . . . . . . . . . . . . . . . . $96,965 $77,130 $37,773Noncontrolling interests . . . . . . . . . . . . . . . . . . . . . . . . . . . 735 (1,940) (101)Allocation of earnings to preferred stockholders . . . . . . . . — — (64)
Net Income Attributable to Common Stockholders . . . $97,700 $75,190 $37,608
Shares:Basic: Weighted-average number of shares
outstanding . . . . . . . . . . . . . . . . . . . . . . . . . . . . . . . . . . . 9,091 8,188 7,727Plus: Incremental shares from assumed conversion of
dilutive instruments . . . . . . . . . . . . . . . . . . . . . . . . . . . . 201 245 346
Diluted: Weighted-average number of sharesoutstanding . . . . . . . . . . . . . . . . . . . . . . . . . . . . . . . . . . . 9,292 8,433 8,073
Earnings per share—basic . . . . . . . . . . . . . . . . . . . . . . . . . $ 10.75 $ 9.18 $ 4.87Earnings per share—diluted . . . . . . . . . . . . . . . . . . . . . . . . $ 10.51 $ 8.92 $ 4.66
For the year ended December 31, 2014, there were 6,085 instruments excluded from the above computationsof weighted-average shares for diluted EPS because the effect would be anti-dilutive. For the years endedDecember 31, 2013 and 2012, there were no instruments excluded from the above computations of weighted-average shares for diluted EPS because the effect would be anti-dilutive.
18. Concentration of Credit Risk
The concentration of credit risk with respect to advisory fees receivable is generally limited due to the shortpayment terms extended to clients by the Company. The following funds provided 10 percent or more of the totalrevenues of the Company:
Years Ended December 31,
2014 2013 2012
($ in thousands)
Virtus Premium AlphaSector™ FundInvestment management, administration and transfer
agent fees . . . . . . . . . . . . . . . . . . . . . . . . . . . . . . . . $61,566 $41,921 $27,987Percent of total revenues . . . . . . . . . . . . . . . . . . . . . . 14% 11% 12%
Virtus Multi-Sector Short Term Bond FundInvestment management, administration and transfer
agent fees . . . . . . . . . . . . . . . . . . . . . . . . . . . . . . . . $55,401 $52,568 $39,475Percent of total revenues . . . . . . . . . . . . . . . . . . . . . . 12% 14% 17%
Virtus Emerging Markets Opportunities FundInvestment management, administration and transfer
agent fees . . . . . . . . . . . . . . . . . . . . . . . . . . . . . . . . $50,435 $53,202 $29,818Percent of total revenues . . . . . . . . . . . . . . . . . . . . . . 11% 14% 12%
F-29
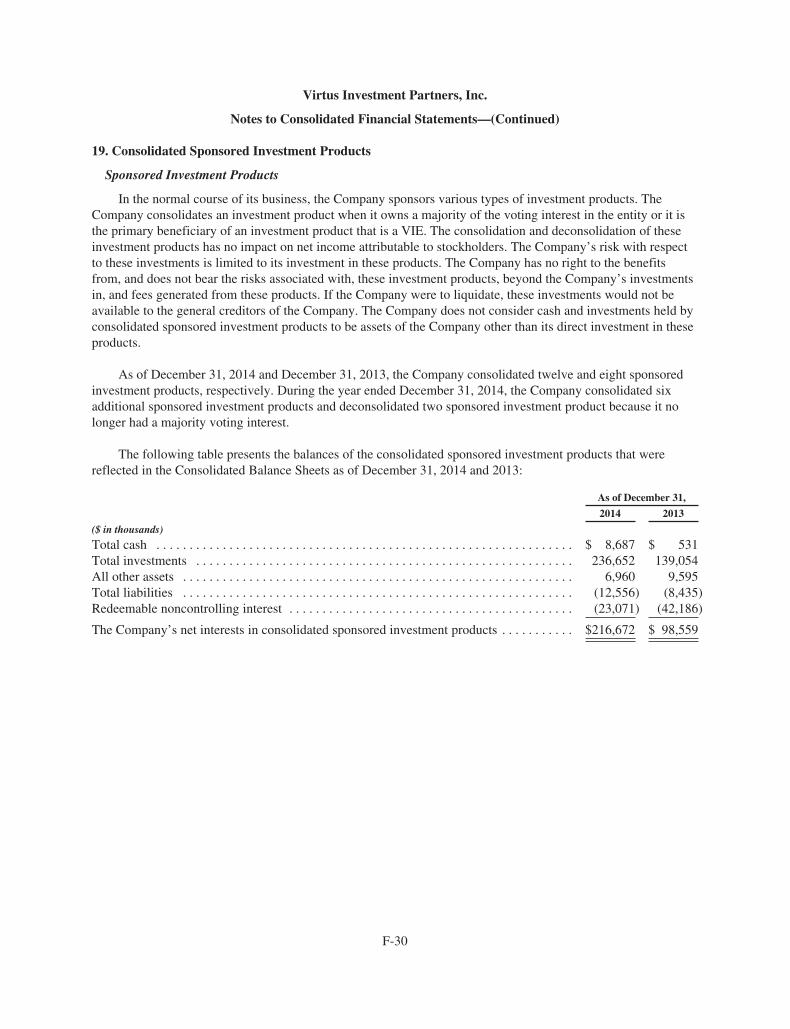
Virtus Investment Partners, Inc.
Notes to Consolidated Financial Statements—(Continued)
19. Consolidated Sponsored Investment Products
Sponsored Investment Products
In the normal course of its business, the Company sponsors various types of investment products. TheCompany consolidates an investment product when it owns a majority of the voting interest in the entity or it isthe primary beneficiary of an investment product that is a VIE. The consolidation and deconsolidation of theseinvestment products has no impact on net income attributable to stockholders. The Company’s risk with respectto these investments is limited to its investment in these products. The Company has no right to the benefitsfrom, and does not bear the risks associated with, these investment products, beyond the Company’s investmentsin, and fees generated from these products. If the Company were to liquidate, these investments would not beavailable to the general creditors of the Company. The Company does not consider cash and investments held byconsolidated sponsored investment products to be assets of the Company other than its direct investment in theseproducts.
As of December 31, 2014 and December 31, 2013, the Company consolidated twelve and eight sponsoredinvestment products, respectively. During the year ended December 31, 2014, the Company consolidated sixadditional sponsored investment products and deconsolidated two sponsored investment product because it nolonger had a majority voting interest.
The following table presents the balances of the consolidated sponsored investment products that werereflected in the Consolidated Balance Sheets as of December 31, 2014 and 2013:
As of December 31,
2014 2013
($ in thousands)
Total cash . . . . . . . . . . . . . . . . . . . . . . . . . . . . . . . . . . . . . . . . . . . . . . . . . . . . . . . . . . . . . . . $ 8,687 $ 531Total investments . . . . . . . . . . . . . . . . . . . . . . . . . . . . . . . . . . . . . . . . . . . . . . . . . . . . . . . . . 236,652 139,054All other assets . . . . . . . . . . . . . . . . . . . . . . . . . . . . . . . . . . . . . . . . . . . . . . . . . . . . . . . . . . . 6,960 9,595Total liabilities . . . . . . . . . . . . . . . . . . . . . . . . . . . . . . . . . . . . . . . . . . . . . . . . . . . . . . . . . . . (12,556) (8,435)Redeemable noncontrolling interest . . . . . . . . . . . . . . . . . . . . . . . . . . . . . . . . . . . . . . . . . . . (23,071) (42,186)
The Company’s net interests in consolidated sponsored investment products . . . . . . . . . . . $216,672 $ 98,559
F-30

Virtus Investment Partners, Inc.
Notes to Consolidated Financial Statements—(Continued)
Consolidation
The following tables reflect the impact of the consolidated sponsored investment products in theConsolidated Balance Sheets as of December 31, 2014 and 2013, respectively:
As of December 31, 2014
Balance BeforeConsolidation of
Investment Products
ConsolidatedSponsoredInvestmentProducts
Eliminationsand
Adjustments (a)
Balances asReported in
ConsolidatedBalance Sheet
($ in thousands)Total cash . . . . . . . . . . . . . . . . . . . . . . . . . . . . . . . $202,847 $ 8,687 $ — $211,534Total investments . . . . . . . . . . . . . . . . . . . . . . . . . 279,863 236,652 (216,415) 300,100All other assets . . . . . . . . . . . . . . . . . . . . . . . . . . . 180,436 6,960 (257) 187,139
Total assets . . . . . . . . . . . . . . . . . . . . . . . . . . . . . . $663,146 $252,299 $(216,672) $698,773
Total liabilities . . . . . . . . . . . . . . . . . . . . . . . . . . . $ 99,794 $ 12,813 $ (257) $112,350Redeemable noncontrolling interest . . . . . . . . . . — — 23,071 23,071Equity attributable to stockholders of the
Company . . . . . . . . . . . . . . . . . . . . . . . . . . . . . 563,542 239,486 (239,486) 563,542Non-redeemable noncontrolling interest . . . . . . . (190) — — (190)
Total liabilities and equity . . . . . . . . . . . . . . . . . . $663,146 $252,299 $(216,672) $698,773
As of December 31, 2013
Balance BeforeConsolidation of
Investment Products
ConsolidatedSponsoredInvestmentProducts
Eliminationsand
Adjustments (a)
Balances asReported in
ConsolidatedBalance Sheet
($ in thousands)Total cash . . . . . . . . . . . . . . . . . . . . . . . . . . . . . . . $271,014 $ 531 $ — $271,545Total investments . . . . . . . . . . . . . . . . . . . . . . . . . 135,692 139,054 (98,434) 176,312All other assets . . . . . . . . . . . . . . . . . . . . . . . . . . . 187,627 9,595 (125) 197,097
Total assets . . . . . . . . . . . . . . . . . . . . . . . . . . . . . . $594,333 $149,180 $ (98,559) $644,954
Total liabilities . . . . . . . . . . . . . . . . . . . . . . . . . . . $101,465 $ 8,560 $ (125) $109,900Redeemable noncontrolling interest . . . . . . . . . . — — 42,186 42,186Equity attributable to stockholders of the
Company . . . . . . . . . . . . . . . . . . . . . . . . . . . . . 492,930 140,620 (140,620) 492,930Non-redeemable noncontrolling interest . . . . . . . (62) — — (62)
Total liabilities and equity . . . . . . . . . . . . . . . . . . $594,333 $149,180 $ (98,559) $644,954
(a) Adjustments include the elimination of intercompany transactions between the Company and itsconsolidated sponsored investment products, primarily the elimination of the investments and equity andrecording of any noncontrolling interest.
F-31

Virtus Investment Partners, Inc.
Notes to Consolidated Financial Statements—(Continued)
The following table reflects the impact of the consolidated sponsored investment products in theConsolidated Statement of Operations for the years ended December 31 2014, 2013 and 2012, respectively:
For the Year Ended December 31, 2014
Balance BeforeConsolidation of
Investment Products
ConsolidatedSponsoredInvestmentProducts
Eliminationsand
Adjustments (a)
Balances asReported in
ConsolidatedStatement ofOperations
($ in thousands)
Total operating revenues . . . . . . . . . . . . . . . . . . . . $451,259 $ — $ (661) $450,598Total operating expenses . . . . . . . . . . . . . . . . . . . . 316,840 3,699 (661) 319,878
Operating income (loss) . . . . . . . . . . . . . . . . . . . . 134,419 (3,699) — 130,720Total other non-operating income (expense) . . . . 2,502 2,619 473 5,594
Income (loss) before income tax expense . . . . . . . 136,921 (1,080) 473 136,314Income tax expense . . . . . . . . . . . . . . . . . . . . . . . . 39,349 — — 39,349
Net income (loss) . . . . . . . . . . . . . . . . . . . . . . . . . 97,572 (1,080) 473 96,965Noncontrolling interests . . . . . . . . . . . . . . . . . . . . 128 — 607 735
Net income (loss) attributable to the Company . . $ 97,700 $(1,080) $1,080 $ 97,700
F-32

Virtus Investment Partners, Inc.
Notes to Consolidated Financial Statements—(Continued)
For the Year Ended December 31, 2013
Balance BeforeConsolidation of
Investment Products
ConsolidatedSponsoredInvestmentProducts
Eliminationsand
Adjustments (a)
Balances asReported in
ConsolidatedStatement ofOperations
($ in thousands)
Total operating revenues . . . . . . . . . . . . . . . . . . . . $389,202 $ — $ 13 $389,215Total operating expenses . . . . . . . . . . . . . . . . . . . . 274,913 785 13 275,711
Operating income (loss) . . . . . . . . . . . . . . . . . . . . 114,289 (785) — 113,504Total other non-operating income (expense) . . . . 5,620 6,098 (3,314) 8,404
Income (loss) before income tax expense . . . . . . . 119,909 5,313 (3,314) 121,908Income tax expense . . . . . . . . . . . . . . . . . . . . . . . . 44,778 — — 44,778
Net income (loss) . . . . . . . . . . . . . . . . . . . . . . . . . 75,131 5,313 (3,314) 77,130Noncontrolling interests . . . . . . . . . . . . . . . . . . . . 59 — (1,999) (1,940)
Net income (loss) attributable to the Company . . $ 75,190 $5,313 $(5,313) $ 75,190
For the Year Ended December 31, 2012
Balance BeforeConsolidation of
Investment Products
ConsolidatedSponsoredInvestmentProducts
Eliminationsand
Adjustments (a)
Balances asReported in
ConsolidatedStatement ofOperations
($ in thousands)
Total operating revenues . . . . . . . . . . . . . . . . . . . . $279,919 $ — $ 167 $280,086Total operating expenses . . . . . . . . . . . . . . . . . . . . 219,326 148 167 219,641
Operating income (loss) . . . . . . . . . . . . . . . . . . . . 60,593 (148) — 60,445Total other non-operating income (expense) . . . . 4,106 2,649 (2,397) 4,358
Income (loss) before income tax expense . . . . . . . 64,699 2,501 (2,397) 64,803Income tax expense . . . . . . . . . . . . . . . . . . . . . . . . 27,030 — — 27,030
Net income (loss) . . . . . . . . . . . . . . . . . . . . . . . . . 37,669 2,501 (2,397) 37,773Noncontrolling interests . . . . . . . . . . . . . . . . . . . . 3 — (104) (101)Allocation of earnings to preferred
stockholders . . . . . . . . . . . . . . . . . . . . . . . . . . . . (64) — — (64)
Net income (loss) attributable to the Company . . $ 37,608 $2,501 $(2,501) $ 37,608
(a) Adjustments include the elimination of intercompany transactions between the Company and itsconsolidated sponsored investment products, primarily the elimination of the investments and equity andrecording of any noncontrolling interest.
F-33

Virtus Investment Partners, Inc.
Notes to Consolidated Financial Statements—(Continued)
Fair Value Measurements of Consolidated Sponsored Investment Products
The assets and liabilities of the consolidated sponsored investment products measured at fair value on arecurring by fair value hierarchy level were as follows:
As of December 31, 2014Level 1 Level 2 Level 3 Total
($ in thousands)
AssetsDebt securities . . . . . . . . . . . . . . . . . . . . . . . . . . . . . . . . . . . . . . . . $ — $135,050 $1,065 $136,115Equity securities . . . . . . . . . . . . . . . . . . . . . . . . . . . . . . . . . . . . . . 82,417 18,120 — 100,537Derivatives . . . . . . . . . . . . . . . . . . . . . . . . . . . . . . . . . . . . . . . . . . 154 227 — 381
Total Assets Measured at Fair Value . . . . . . . . . . . . . . . . $82,571 $153,397 $1,065 $237,033
LiabilitiesDerivatives . . . . . . . . . . . . . . . . . . . . . . . . . . . . . . . . . . . . . . . . . . $ 191 $ — $ — $ 191Short sales . . . . . . . . . . . . . . . . . . . . . . . . . . . . . . . . . . . . . . . . . . . 7,491 674 — 8,165
Total Liabilities Measured at Fair Value . . . . . . . . . . . . . $ 7,682 $ 674 $ — $ 8,356
As of December 31, 2013Level 1 Level 2 Level 3 Total
($ in thousands)
AssetsDebt securities . . . . . . . . . . . . . . . . . . . . . . . . . . . . . . . . . . . . . . . . . $ — $47,114 $— $ 47,114Equity securities . . . . . . . . . . . . . . . . . . . . . . . . . . . . . . . . . . . . . . . . 91,940 — — 91,940
Total Assets Measured at Fair Value . . . . . . . . . . . . . . . . . . $91,940 $47,114 $— $139,054
The following is a discussion of the valuation methodologies used for the assets and liabilities of theCompany’s consolidated sponsored investment products measured at fair value.
Investments of consolidated sponsored investment products represent the underlying debt and equitysecurities held in sponsored products which are consolidated by the Company. Equity securities are valued at theofficial closing price on the exchange on which the securities are traded and are categorized within Level 1.Level 2 investments include certain equity securities, including non-US securities, for which closing prices arenot readily available or are deemed to not reflect readily available market prices and are valued using anindependent pricing service as well as most debt securities, which are valued based on quotations received fromindependent pricing services or from dealers who make markets in such securities. Pricing services do notprovide pricing for all securities, and therefore indicative bids from dealers are utilized, which are based onpricing models used by market makers in the security and are also included within Level 2. Level 3 investmentsinclude debt securities that are not widely traded, are illiquid and are priced by dealers based on pricing modelsused by market makers in the security.
F-34

Virtus Investment Partners, Inc.
Notes to Consolidated Financial Statements—(Continued)
The following table is a reconciliation of assets of consolidated sponsored investment products for Level 3investments for which significant unobservable inputs were used to determine fair value.
Level 3Debt
securities (a)
Balance at December 31, 2013 . . . . . . . . . . . . . . . . . . . . . . $ —Purchases . . . . . . . . . . . . . . . . . . . . . . . . . . . . . . . . . . . . . . . 1,119Sales . . . . . . . . . . . . . . . . . . . . . . . . . . . . . . . . . . . . . . . . . . . —Paydowns . . . . . . . . . . . . . . . . . . . . . . . . . . . . . . . . . . . . . . . (3)Change in unrealized gain/loss . . . . . . . . . . . . . . . . . . . . . . (51)
Balance at December 31, 2014 . . . . . . . . . . . . . . . . . . . . . $1,065
(a) None of the securities were internally fair valued at December 31, 2014.
Securities with an end of period market value of $1.5 million were transferred from Level 1 to Level 2during the year ended December 31, 2014 because certain non-US securities no longer had readily availableclosing prices or were deemed not reflective of readily available closing prices. There were no transfers betweenLevel 1, Level 2 and Level 3 during the years ended December 31, 2013 and 2012, respectively.
Derivatives
Beginning in the second quarter of 2014, the Company consolidated investment products which includederivative instruments as part of their investment strategies. These derivatives may include futures contracts,options contracts and forward contracts. The fair value of such derivatives at December 31, 2014 was immaterial.The change in fair value of such derivatives, which is recorded in realized and unrealized gain (loss) oninvestments of consolidated sponsored investment products, net, was immaterial for the year endedDecember 31, 2014. In connection with entering into these derivative contracts these funds may be required topledge to the broker an amount of cash equal to the “initial margin” requirements that varies based on the type ofderivative. The cash pledged or on deposit is recorded in the Consolidated Balance Sheet of the Company asCash pledged or on deposit of consolidated sponsored investment products.
Short Sales
Some of the Company’s consolidated sponsored investment products may engage in short sales, which aretransactions in which a fund sells a security that it does not own (or that it owns but does not intend to deliver) inanticipation that the price of the security will decline. Short sales are recorded in the Consolidated Balance Sheetwithin Other liabilities of consolidated sponsored investment products.
Borrowings
One of our consolidated sponsored investment products employs leverage in the form of using proceedsfrom shorts, which allows it to use its long positions as collateral in order to purchase additional securities. Theuse of these proceeds from shorts is secured by the assets of the consolidated sponsored investment productwhich are held with the custodian in a separate account. This consolidated sponsored investment product ispermitted to borrow up to 33.33% of its total assets.
F-35

Virtus Investment Partners, Inc.
Notes to Consolidated Financial Statements—(Continued)
20. Subsequent Event
On January 26, 2015, the Company announced an agreement to acquire a majority interest in ETF IssuerSolutions (“ETFis”), a New York City-based company that operates a platform for listing, operating, anddistributing exchange-traded funds. The transaction is expected to close in March 2015.
On February 18, 2015, the Company declared a quarterly cash dividend of $0.45 per common share to bepaid on May 13, 2015 to shareholders of record at the close of business on April 30, 2015.
21. Selected Quarterly Data (Unaudited)
2014
($ in thousands, except share data)FourthQuarter
ThirdQuarter (1)
SecondQuarter
FirstQuarter
Revenues . . . . . . . . . . . . . . . . . . . . . . . . . . . . . . . . . $112,137 $117,841 $112,749 $107,871Operating Income . . . . . . . . . . . . . . . . . . . . . . . . . . 36,665 38,927 22,502 32,626Net Income Attributable to Common
Stockholders . . . . . . . . . . . . . . . . . . . . . . . . . . . . 18,879 37,340 19,543 21,938Earnings per share—Basic . . . . . . . . . . . . . . . . . . . $ 2.09 $ 4.10 $ 2.14 $ 2.41Earnings per share—Diluted . . . . . . . . . . . . . . . . . $ 2.05 $ 4.02 $ 2.10 $ 2.34
2013
FourthQuarter
ThirdQuarter
SecondQuarter
FirstQuarter
Revenues . . . . . . . . . . . . . . . . . . . . . . . . . . . . . . . . . . . $106,498 $100,409 $96,140 $86,168Operating Income . . . . . . . . . . . . . . . . . . . . . . . . . . . . 33,892 31,630 26,882 21,100Net Income Attributable to Common Stockholders . . 24,756 21,089 15,385 13,960Earnings per share—Basic . . . . . . . . . . . . . . . . . . . . . $ 2.72 $ 2.64 $ 1.97 $ 1.79Earnings per share—Diluted . . . . . . . . . . . . . . . . . . . . $ 2.65 $ 2.56 $ 1.91 $ 1.73
(1) The third quarter of 2014 includes a net tax benefit of approximately $15.5 million due to completion of theaudit of the Company’s 2011 federal corporate income tax return.
F-36
Exhibit 31.1
CERTIFICATION UNDER SECTION 302
I, George R. Aylward, certify that:
1. I have reviewed this annual report on Form 10-K of Virtus Investment Partners, Inc.;
2. Based on my knowledge, this report does not contain any untrue statement of a material fact or omitto state a material fact necessary to make the statements made, in light of the circumstances under whichsuch statements were made, not misleading with respect to the period covered by this report;
3. Based on my knowledge, the financial statements, and other financial information included in thisreport, fairly present in all material respects the financial condition, results of operations and cash flows ofthe registrant as of, and for, the periods presented in this report;
4. The registrant’s other certifying officer(s) and I are responsible for establishing and maintainingdisclosure controls and procedures (as defined in Exchange Act Rules 13a-15(e) and 15d-15(e)) and internalcontrol over financial reporting (as defined in Exchange Act Rules 13a-15(f) and 15d-15(f)) for theregistrant and have:
(a) Designed such disclosure controls and procedures, or caused such disclosure controls andprocedures to be designed under our supervision, to ensure that material information relating to theregistrant, including its consolidated subsidiaries, is made known to us by others within those entities,particularly during the period in which this report is being prepared;
(b) Designed such internal control over financial reporting, or caused such internal control overfinancial reporting to be designed under our supervision, to provide reasonable assurance regarding thereliability of financial reporting and the preparation of financial statements for external purposes inaccordance with generally accepted accounting principles;
(c) Evaluated the effectiveness of the registrant’s disclosure controls and procedures and presented inthis report our conclusions about the effectiveness of the disclosure controls and procedures, as of the end ofthe period covered by this report based on such evaluation; and
(d) Disclosed in this report any change in the registrant’s internal control over financial reporting thatoccurred during the registrant’s most recent fiscal quarter (the registrant’s fourth fiscal quarter in the case ofan annual report) that has materially affected, or is reasonably likely to materially affect, the registrant’sinternal control over financial reporting; and
5. The registrant’s other certifying officer(s) and I have disclosed, based on our most recent evaluationof internal control over financial reporting, to the registrant’s auditors and the audit committee of theregistrant’s board of directors (or persons performing the equivalent functions):
(a) All significant deficiencies and material weaknesses in the design or operation of internal controlover financial reporting which are reasonably likely to adversely affect the registrant’s ability to record,process, summarize and report financial information; and
(b) Any fraud, whether or not material, that involves management or other employees who have asignificant role in the registrant’s internal control over financial reporting.
Date: March 2, 2015
/S/ GEORGE R. AYLWARD
George R. AylwardPresident, Chief Executive Officer and Director
(Principal Executive Officer)

Exhibit 31.2
CERTIFICATION UNDER SECTION 302
I, Michael A. Angerthal, certify that:
1. I have reviewed this annual report on Form 10-K of Virtus Investment Partners, Inc.;
2. Based on my knowledge, this report does not contain any untrue statement of a material fact or omitto state a material fact necessary to make the statements made, in light of the circumstances under whichsuch statements were made, not misleading with respect to the period covered by this report;
3. Based on my knowledge, the financial statements, and other financial information included in thisreport, fairly present in all material respects the financial condition, results of operations and cash flows ofthe registrant as of, and for, the periods presented in this report;
4. The registrant’s other certifying officer(s) and I are responsible for establishing and maintainingdisclosure controls and procedures (as defined in Exchange Act Rules 13a-15(e) and 15d-15(e)) and internalcontrol over financial reporting (as defined in Exchange Act Rules 13a-15(f) and 15d-15(f)) for theregistrant and have:
(a) Designed such disclosure controls and procedures, or caused such disclosure controls andprocedures to be designed under our supervision, to ensure that material information relating to theregistrant, including its consolidated subsidiaries, is made known to us by others within those entities,particularly during the period in which this report is being prepared;
(b) Designed such internal control over financial reporting, or caused such internal control overfinancial reporting to be designed under our supervision, to provide reasonable assurance regarding thereliability of financial reporting and the preparation of financial statements for external purposes inaccordance with generally accepted accounting principles;
(c) Evaluated the effectiveness of the registrant’s disclosure controls and procedures and presented inthis report our conclusions about the effectiveness of the disclosure controls and procedures, as of the end ofthe period covered by this report based on such evaluation; and
(d) Disclosed in this report any change in the registrant’s internal control over financial reporting thatoccurred during the registrant’s most recent fiscal quarter (the registrant’s fourth fiscal quarter in the case ofan annual report) that has materially affected, or is reasonably likely to materially affect, the registrant’sinternal control over financial reporting; and
5. The registrant’s other certifying officer(s) and I have disclosed, based on our most recent evaluationof internal control over financial reporting, to the registrant’s auditors and the audit committee of theregistrant’s board of directors (or persons performing the equivalent functions):
(a) All significant deficiencies and material weaknesses in the design or operation of internal controlover financial reporting which are reasonably likely to adversely affect the registrant’s ability to record,process, summarize and report financial information; and
(b) Any fraud, whether or not material, that involves management or other employees who have asignificant role in the registrant’s internal control over financial reporting.
Date: March 2, 2015
/S/ MICHAEL A. ANGERTHAL
Michael A. AngerthalExecutive Vice President, Chief Financial Officer
(Principal Financial Officer and Principal Accounting Officer)
Exhibit 32.1
CERTIFICATIONS OF CEO AND CFO PURSUANT TO 18 U.S.C. SECTION 1350,AS ADOPTED PURSUANT TO
SECTION 906 OF THE SARBANES-OXLEY ACT OF 2002
In connection with this Annual Report on Form 10-K of Virtus Investment Partners, Inc. (the “Company”)for the fiscal year ended December 31, 2014, as filed with the Securities and Exchange Commission on the datehereof (the “Report”), each of the undersigned officers of the Company hereby certifies, pursuant to 18 U.S.C.Section 1350, as adopted pursuant to Section 906 of the Sarbanes-Oxley Act of 2002, that to the best of hisknowledge:
(1) the Report fully complies with the requirements of Section 13(a) or 15(d) of the Securities ExchangeAct of 1934; and
(2) the information contained in the Report fairly presents, in all material respects, the financial conditionand results of operations of the Company.
Dated: March 2, 2015
/S/ GEORGE R. AYLWARD
George R. AylwardPresident, Chief Executive Officer and Director
(Principal Executive Officer)
/S/ MICHAEL A. ANGERTHAL
Michael A. AngerthalExecutive Vice President, Chief Financial Officer
(Principal Financial Officer andPrincipal Accounting Officer)

[THIS PAGE INTENTIONALLY LEFT BLANK]

SUPPLEMENTAL FINANCIAL INFORMATION
Schedule of Non-GAAP Information(Dollars in thousands)
The company reports its financial results on a Generally Accepted Accounting Principles (GAAP) basis; howevermanagement believes that evaluating the company’s ongoing operating results may be enhanced if investors haveadditional non-GAAP financial measures. Management reviews non-GAAP financial measures to assess ongoingoperations and considers them only to be additional metrics for both management and investors to consider thecompany’s financial performance over time, as noted in the footnotes below. Management does not advocate thatinvestors consider such non-GAAP financial measures in isolation from, or as a substitute for, financial resultsprepared in accordance with GAAP.
Reconciliation of Revenues, Operating Expenses and Operating Income on a GAAP Basis to Revenues,Operating Expenses and Operating Income, as Adjusted
Twelve Months EndedDec 31, 2014 Dec 31, 2013
Revenues, GAAP basis . . . . . . . . . . . . . . . . . . . . . . . . . . . . . . . . . . . . . . . . . . . . . . . . . . $450,598 $389,215Less:
Distribution and administration expenses . . . . . . . . . . . . . . . . . . . . . . . . . . . . . 114,089 97,786Consolidated sponsored investment products revenues (1) . . . . . . . . . . . . . . . (661) 13
Revenues, as adjusted (2) . . . . . . . . . . . . . . . . . . . . . . . . . . . . . . . . . . . . . . . . . . . . . . . . $337,170 $291,416
Operating Expenses, GAAP basis . . . . . . . . . . . . . . . . . . . . . . . . . . . . . . . . . . . . . . . . . $319,878 $275,711Less:
Distribution and administration expenses . . . . . . . . . . . . . . . . . . . . . . . . . . . . . 114,089 97,786Depreciation and amortization . . . . . . . . . . . . . . . . . . . . . . . . . . . . . . . . . . . . . 6,541 6,835Stock-based compensation (3) . . . . . . . . . . . . . . . . . . . . . . . . . . . . . . . . . . . . . 9,592 7,490Closed-end fund launch costs (4) . . . . . . . . . . . . . . . . . . . . . . . . . . . . . . . . . . . 10,085 —Restructuring and severance charges . . . . . . . . . . . . . . . . . . . . . . . . . . . . . . . . 294 203System transition costs (5) . . . . . . . . . . . . . . . . . . . . . . . . . . . . . . . . . . . . . . . . 1,050 —Newfleet transition expenses (6) . . . . . . . . . . . . . . . . . . . . . . . . . . . . . . . . . . . . 859 2,172Consolidated sponsored investment product expenses (1) . . . . . . . . . . . . . . . . 3,038 798
Operating Expenses, as adjusted (7) . . . . . . . . . . . . . . . . . . . . . . . . . . . . . . . . . . . . . . . $174,330 $160,427
Operating Income, as adjusted (8) . . . . . . . . . . . . . . . . . . . . . . . . . . . . . . . . . . . . . . . . $162,840 $130,989
Operating margin, GAAP basis . . . . . . . . . . . . . . . . . . . . . . . . . . . . . . . . . . . . . . . . . . . . 29% 29%Operating margin, as adjusted (8) . . . . . . . . . . . . . . . . . . . . . . . . . . . . . . . . . . . . . . . . . . . 48% 45%
(1) Revenues and expenses related to consolidated sponsored investment products have been excluded toreflect revenues and expenses of the company prior to the consolidation of these products. Revenuesrepresent investment management fees net of fees paid to unaffiliated subadvisors and fund expensereimbursements, distribution and service fees, and administration and transfer agent fees.
(2) Revenues, as adjusted, is a non-GAAP financial measure calculated by netting distribution andadministration expenses from GAAP revenues. Management believes Revenues, as adjusted, providesuseful information to investors because distribution and administration expenses are costs that aregenerally passed directly through to external parties.
(3) Stock-based compensation expense includes equity issued under incentive plans and equity granted toBoard of Directors.
(4) For the twelve months ended December 31, 2014, closed-end fund launch costs comprise structuringfees of $9.6 million payable to underwriters and sales-based compensation of $0.5 million.
S-1
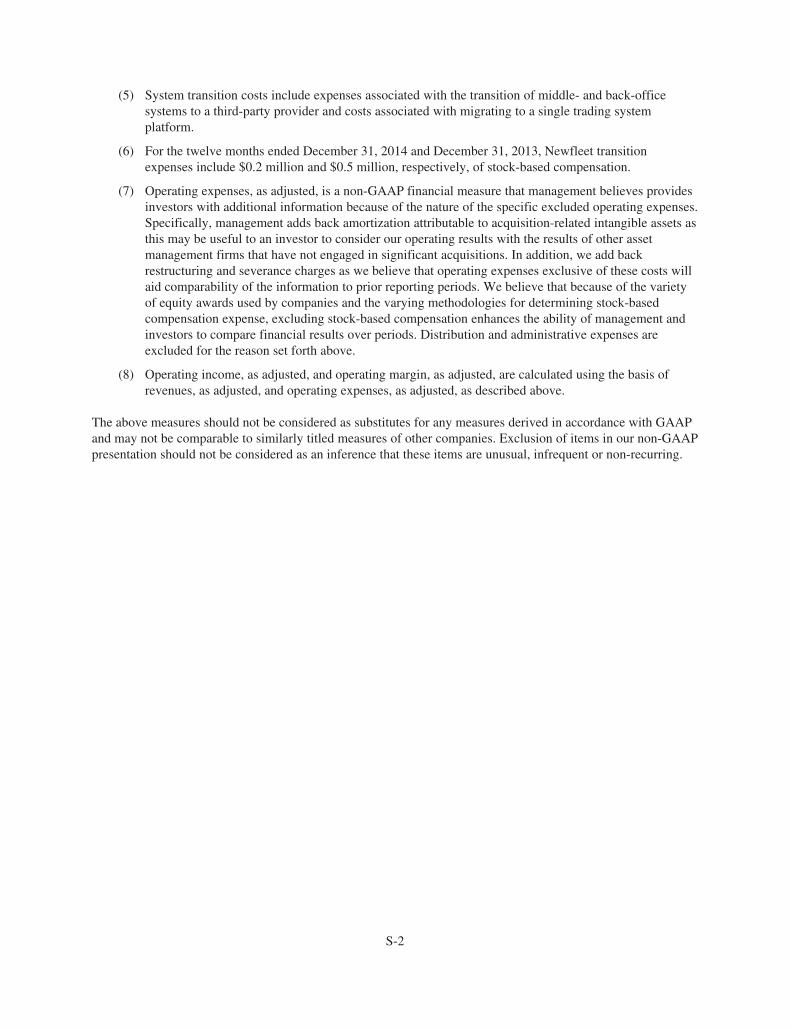
(5) System transition costs include expenses associated with the transition of middle- and back-officesystems to a third-party provider and costs associated with migrating to a single trading systemplatform.
(6) For the twelve months ended December 31, 2014 and December 31, 2013, Newfleet transitionexpenses include $0.2 million and $0.5 million, respectively, of stock-based compensation.
(7) Operating expenses, as adjusted, is a non-GAAP financial measure that management believes providesinvestors with additional information because of the nature of the specific excluded operating expenses.Specifically, management adds back amortization attributable to acquisition-related intangible assets asthis may be useful to an investor to consider our operating results with the results of other assetmanagement firms that have not engaged in significant acquisitions. In addition, we add backrestructuring and severance charges as we believe that operating expenses exclusive of these costs willaid comparability of the information to prior reporting periods. We believe that because of the varietyof equity awards used by companies and the varying methodologies for determining stock-basedcompensation expense, excluding stock-based compensation enhances the ability of management andinvestors to compare financial results over periods. Distribution and administrative expenses areexcluded for the reason set forth above.
(8) Operating income, as adjusted, and operating margin, as adjusted, are calculated using the basis ofrevenues, as adjusted, and operating expenses, as adjusted, as described above.
The above measures should not be considered as substitutes for any measures derived in accordance with GAAPand may not be comparable to similarly titled measures of other companies. Exclusion of items in our non-GAAPpresentation should not be considered as an inference that these items are unusual, infrequent or non-recurring.
S-2
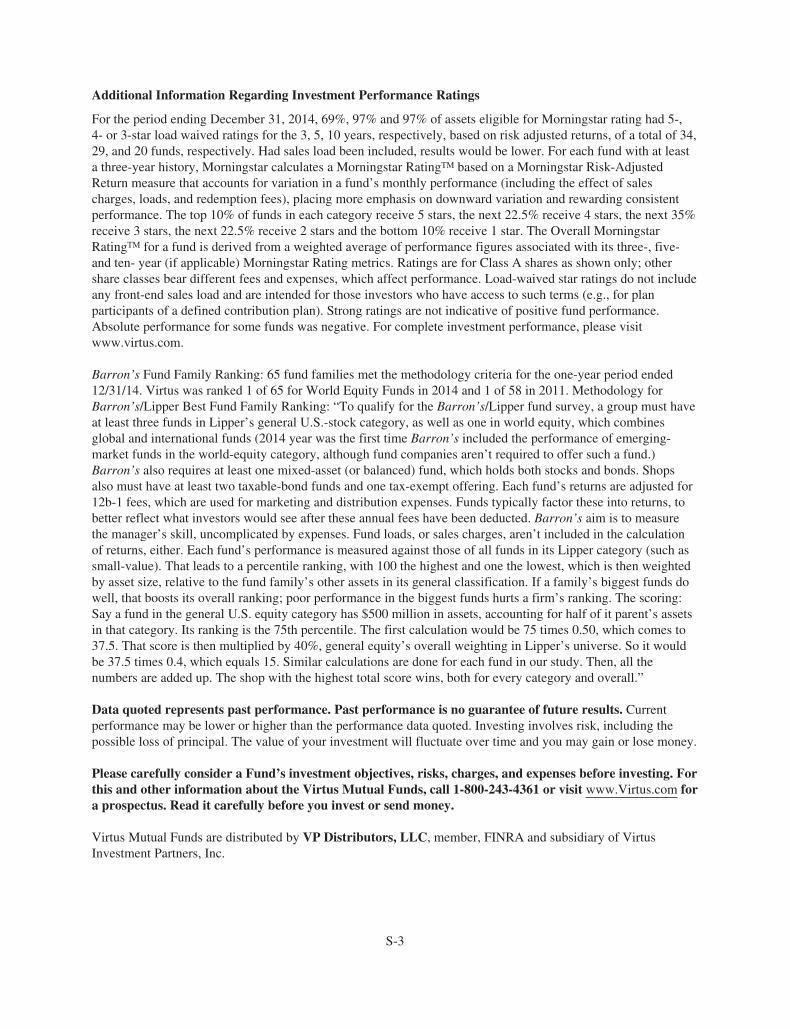
Additional Information Regarding Investment Performance Ratings
For the period ending December 31, 2014, 69%, 97% and 97% of assets eligible for Morningstar rating had 5-,4- or 3-star load waived ratings for the 3, 5, 10 years, respectively, based on risk adjusted returns, of a total of 34,29, and 20 funds, respectively. Had sales load been included, results would be lower. For each fund with at leasta three-year history, Morningstar calculates a Morningstar RatingTM based on a Morningstar Risk-AdjustedReturn measure that accounts for variation in a fund’s monthly performance (including the effect of salescharges, loads, and redemption fees), placing more emphasis on downward variation and rewarding consistentperformance. The top 10% of funds in each category receive 5 stars, the next 22.5% receive 4 stars, the next 35%receive 3 stars, the next 22.5% receive 2 stars and the bottom 10% receive 1 star. The Overall MorningstarRatingTM for a fund is derived from a weighted average of performance figures associated with its three-, five-and ten- year (if applicable) Morningstar Rating metrics. Ratings are for Class A shares as shown only; othershare classes bear different fees and expenses, which affect performance. Load-waived star ratings do not includeany front-end sales load and are intended for those investors who have access to such terms (e.g., for planparticipants of a defined contribution plan). Strong ratings are not indicative of positive fund performance.Absolute performance for some funds was negative. For complete investment performance, please visitwww.virtus.com.
Barron’s Fund Family Ranking: 65 fund families met the methodology criteria for the one-year period ended12/31/14. Virtus was ranked 1 of 65 for World Equity Funds in 2014 and 1 of 58 in 2011. Methodology forBarron’s/Lipper Best Fund Family Ranking: “To qualify for the Barron’s/Lipper fund survey, a group must haveat least three funds in Lipper’s general U.S.-stock category, as well as one in world equity, which combinesglobal and international funds (2014 year was the first time Barron’s included the performance of emerging-market funds in the world-equity category, although fund companies aren’t required to offer such a fund.)Barron’s also requires at least one mixed-asset (or balanced) fund, which holds both stocks and bonds. Shopsalso must have at least two taxable-bond funds and one tax-exempt offering. Each fund’s returns are adjusted for12b-1 fees, which are used for marketing and distribution expenses. Funds typically factor these into returns, tobetter reflect what investors would see after these annual fees have been deducted. Barron’s aim is to measurethe manager’s skill, uncomplicated by expenses. Fund loads, or sales charges, aren’t included in the calculationof returns, either. Each fund’s performance is measured against those of all funds in its Lipper category (such assmall-value). That leads to a percentile ranking, with 100 the highest and one the lowest, which is then weightedby asset size, relative to the fund family’s other assets in its general classification. If a family’s biggest funds dowell, that boosts its overall ranking; poor performance in the biggest funds hurts a firm’s ranking. The scoring:Say a fund in the general U.S. equity category has $500 million in assets, accounting for half of it parent’s assetsin that category. Its ranking is the 75th percentile. The first calculation would be 75 times 0.50, which comes to37.5. That score is then multiplied by 40%, general equity’s overall weighting in Lipper’s universe. So it wouldbe 37.5 times 0.4, which equals 15. Similar calculations are done for each fund in our study. Then, all thenumbers are added up. The shop with the highest total score wins, both for every category and overall.”
Data quoted represents past performance. Past performance is no guarantee of future results. Currentperformance may be lower or higher than the performance data quoted. Investing involves risk, including thepossible loss of principal. The value of your investment will fluctuate over time and you may gain or lose money.
Please carefully consider a Fund’s investment objectives, risks, charges, and expenses before investing. Forthis and other information about the Virtus Mutual Funds, call 1-800-243-4361 or visit www.Virtus.com fora prospectus. Read it carefully before you invest or send money.
Virtus Mutual Funds are distributed by VP Distributors, LLC, member, FINRA and subsidiary of VirtusInvestment Partners, Inc.
S-3

Companies in the Composite of Other Publicly Traded Traditional Asset Management Companies
Affiliated Managers Group, Inc.; AllianceBernstein Holding L.P.; Artisan Partners Asset Management Inc.;Calamos Asset Management, Inc.; Cohen & Steers, Inc.; Eaton Vance Corp.; Federated Investors, Inc.; FranklinResources, Inc.; GAMCO Investors, Inc.; Invesco Ltd.; Janus Capital Group Inc.; Legg Mason, Inc.; Manning &Napier, Inc.; T. Rowe Price Group, Inc.; and Waddell & Reed Financial, Inc.
S-4

[THIS PAGE INTENTIONALLY LEFT BLANK]

[THIS PAGE INTENTIONALLY LEFT BLANK]