vintage filings, llc (a pr newswire...
TRANSCRIPT

ANNUAL REPORT
Oberweis International Opportunities Institutional Fund (OBIIX)
December 31, 2015
oberweisfunds.com


President and Portfolio Manager’s Letter . . . . . . . . . . . . . . . . . . . . . . . . . . . . . . . . . . 2
Fund Overview . . . . . . . . . . . . . . . . . . . . . . . . . . . . . . . . . . . . . . . . . . . . . . . . . . . . . . . . . . . 5
Schedule of Investments . . . . . . . . . . . . . . . . . . . . . . . . . . . . . . . . . . . . . . . . . . . . . . . . . 8
Statement of Assets and Liabilities . . . . . . . . . . . . . . . . . . . . . . . . . . . . . . . . . . . . . . . . 12
Statement of Operations . . . . . . . . . . . . . . . . . . . . . . . . . . . . . . . . . . . . . . . . . . . . . . . . . 13
Statement of Changes in Net Assets . . . . . . . . . . . . . . . . . . . . . . . . . . . . . . . . . . . . . . 14
Notes to Financial Statements . . . . . . . . . . . . . . . . . . . . . . . . . . . . . . . . . . . . . . . . . . . . 15
Financial Highlights . . . . . . . . . . . . . . . . . . . . . . . . . . . . . . . . . . . . . . . . . . . . . . . . . . . . . . 21
Report of Independent Registered Public Accounting Firm . . . . . . . . . . . . . . . . . . 22
Trustees and Officers . . . . . . . . . . . . . . . . . . . . . . . . . . . . . . . . . . . . . . . . . . . . . . . . . . . . . 24
Supplemental Information . . . . . . . . . . . . . . . . . . . . . . . . . . . . . . . . . . . . . . . . . . . . . . . . 26
TABLE OF CONTENTS
1

Dear Shareholder:
Thank you for your investment in the Oberweis International Opportunities Institutional Fund
(OBIIX). This fund is managed by Ralf Scherschmidt and team. In 2015, the fund returned
15.68% versus 9.92% for the MSCI World Ex-US Small-Cap Growth Index.
THE QUARTER AND YEAR IN REVIEW
In Europe, multiple headwinds for corporate profits finally turned into tailwinds. Lower credit
costs, thanks in part to the enactment of the ECB’s version of quantitative easing (QE), led to
credit growth after multi-year declines. A weaker Euro resulted in better price competitiveness
for European companies selling products globally. And finally, costs as a percentage of
revenues broadly declined thanks to lower commodity prices. We benefitted from a better
economic and earnings environment in Continental Europe with a positive contribution to our
outperformance from the region in 2015. In Japan the labor market hit multi-year highs in terms
of the ratio of jobs-to-applicants, reflecting the aging demographic situation. As a result,
wages have slowly begun to rise, allowing for growth in consumer spending. Similarly, in the
U.K., a strong labor market allowed consumer confidence to hit multi-year highs.
Continued weakness in the energy complex, combined with less demand for commodities
from the emerging markets, specifically China, reduced earnings expectations for companies
exposed to these trends. Additionally, the second half was a difficult time for global industrial
companies. Continued weakness in industrial demand from China was coupled with a slowing
industrial environment in the U.S. The only reprieve seemed to be companies catering to the
automobile market, where passenger vehicle demand in the U.S. hit multi-year highs,
European orders rebounded, and Chinese purchases bounced back late in the fourth quarter
thanks to lower car buying taxes. On the other hand, consumer discretionary and technology
companies were more likely to post better-than-expected results and our holdings within
those two sectors were our best two contributing sectors to our outperformance in 2015.
As we enter 2016, the outlook for international equities remains mixed. In the Eurozone,
inflation continues to be below the ECB’s expectations, which implies that the ECB is likely to
remain committed to stimulating their markets with positive growth policies. However, the
ECB’s intentions seem well understood by the market and may imply a less positive response
by European equities relative to what was experienced by U.S. equities during its multi-year
QE era. That said, earnings expectations within the Eurozone have come down from earlier in
2015, reflecting slower global growth, especially within cyclical end markets. As a result, we
continue to find niche opportunities in Continental Europe where companies can exhibit
better than expected results and head into the New Year with a slight overweight in the region.
In Japan, consumer-oriented firms appear to be in good shape. The tight labor market is
driving up wages and disposable incomes. As a result, we have an overweight in Japan and a
large part of our overweight in consumer sectors is from Japanese corporations. The big
question regarding Japan in 2016 is the direction of the Japanese Yen. Recent stronger
economic data in Japan suggests a stronger currency, at the same time continued U.S.
Federal Reserve tightening could suggest that the Yen remains weak.
PRESIDENT AND PORTFOLIO MANAGER’S LETTER
2

We remain concerned about end market demand coming from the emerging markets as
China continues to find a new normal level of growth. While we respect the ‘political will’ of the
Chinese government to drive growth if needed, we remain in the camp that after
multiple years of excesses building up across every industrial segment, it will take
multiple years to unwind those excesses. In the U.S., the industrial economy feels like it is in
recession with the most recent Purchasing Managers Index (PMI), which measures the health
of the industrial economy, ending November 2015 at 48.6, which is down considerably from
the end of 2014 reading of 55.1. Additionally, we are concerned that weakness in the debt of
cyclical companies could spread to global markets during 2016. Recently high yield debt
spreads (the difference between the most and least safe rated debt) have expanded, even
when excluding energy, thanks in large part to less faith in the future cash flows of industrial
corporations. We are in agreement and enter the year with industrials being our largest
underweight.
Lastly, the bifurcated market development in 2015 between growth and value stocks, with
growth outperforming value, is likely to persist into 2016. The cyclical areas continue to face a
new era of lower growth and many related companies are realizing that their supply base
exceeds existing and forecasted levels of demand. How those companies respond internally
remains paramount in 2016 and may be the only way these groups of companies could
present an opportunity. We find it interesting that many market pundits have recently
suggested that there is ‘value’ within the cyclicals because share prices have cratered. We
remain unconvinced, as fundamentals have yet to become at least less bad. Future earnings
expectations for the cyclicals look too high to us relative to fundamentals that appear to
continue on a downward trajectory. On the flip side, we are finding many ideas within
technology, consumer discretionary and consumer staples where fundamentals are
developing better than the market expects. As a result, while we see an array of macro risks
heading into 2016, we also see opportunities for active stock managers, especially relative to
expectations for strategies similar to ours.
We see average valuations for ex-U.S. developed market small-cap stocks. Our portfolio’s
weighted-average forward 12-month P/E is higher than one year ago, in large part because we
are holding far less industrial exposure in the portfolio and industrial names historically have
lower P/E’s relative to other sectors within our universe. Additionally, we continue to believe
that while forward twelve-month P/E multiples look average, outer year earnings expectations
feel too low especially for our European holdings where we believe there is the potential for
a multi-year catch up in earnings. Lastly, excessively low bond yields within the Eurozone have
made valuation comparisons less directly comparable than in the past.
PORTFOLIO HIGHLIGHTS
At quarter-end, the portfolio was invested in 96 stocks in 14 countries. Our top five country
weightings (portfolio weighting versus the MSCI World ex-US Small Cap Growth Index) at the
end of the quarter were Japan (33.5% vs. 27.7%), the United Kingdom (18.5% vs. 20.1%),
Denmark (6.9% vs. 2.3%), Canada (6.7% vs. 7.4%), and Germany (6.7% vs. 6.1%). On a sector
basis, the portfolio is overweight information technology (16.4% vs. 12.9%) and underweight
industrials (14.4% vs. 22.5%).
PRESIDENT AND PORTFOLIO MANAGER’S LETTER (continued)
3

Some of the top performers for the quarter included: Genmab A/S (GEN DC), which returned
+46.0% and contributed 71 basis points to the portfolio’s return; Megmilk Snow Brand Co. Ltd.
(2270 JP), which returned +35.9% and contributed 52 bps; and Dominos Pizza Enterprises
(DMP AU), which returned +48.7% and contributed 50 bps. Some of the leading detractors for
the quarter included: Astaldi Spa. (AST IM), which returned -41.3% and detracted 41 bps; Kaken
Pharmaceutical Co. Ltd. (4521 JP), which returned -29.9% and detracted 40 bps; and
Dollarama Inc. (DOL CN), which returned -14.4% and detracted 31 bps.
We appreciate your investment in The Oberweis Funds and are grateful for the trust you have
shown us with your valuable investments. If you have any questions about your account,
please contact shareholder services at (800) 245-7311. Thank you for investing with us in The
Oberweis Funds.
Sincerely,
James W. Oberweis, CFAPresident
Ralf ScherschmidtPortfolio Manager
PRESIDENT AND PORTFOLIO MANAGER’S LETTER (continued)
4

Market Environment
Global equities were essentially flat in 2015, as measured by a return of -0.32% for the MSCI World
Index. U.S. equities, as measured by the 1.38% return on the S&P 500 Index, outperformed large
foreign equities in 2015. Within the international landscape, small growth stocks outperformed
large growth stocks by a 222 basis point differential in 2015, as measured by the respective
returns of the MSCI World ex US small cap Growth (+9.92%) and MSCI World ex US large cap
Growth (7.70%) indices. Within international small-cap, growth stocks significantly outperformed
value stocks, with the MSCI World ex US small cap Growth Index outperforming the MSCI World
ex US small cap Value Index by 886 basis points for the year.
Discussion of The International Opportunities Institutional Fund
The International Opportunities Institutional Fund tends to have a style bias that leads to
stronger performance in periods during which small-cap stocks beat large-cap stocks and
when growth stocks beat value stocks. The Funds benefitted from growth stocks
outperforming value stocks and small cap stocks outperforming large cap stocks in 2015.
The International Opportunities Institutional Fund returned 15.68% versus 9.92% for the MSCI
World ex-US Small Cap Growth Index. The portfolio benefitted from stock selection in
Germany and Canada, slightly offset by adverse stock selection in Italy and Finland. On a
sector level, the portfolio benefitted from stock selection in Consumer Discretionary and
Information Technology, partially offset by adverse stock selection in Healthcare. At the stock
level, Genmab (GEN DC), Pandora (PNDORA DC), and Gamesa Corp (GAM SM) were among
the top contributors to performance; Combo Telecom Systems (2342 HK), Dominion Diamond
Corp (DDC CN), and Canadian Energy Services (CEU CN) were among the top detractors.
MANAGEMENT DISCUSSION ON FUND PERFORMANCE
5
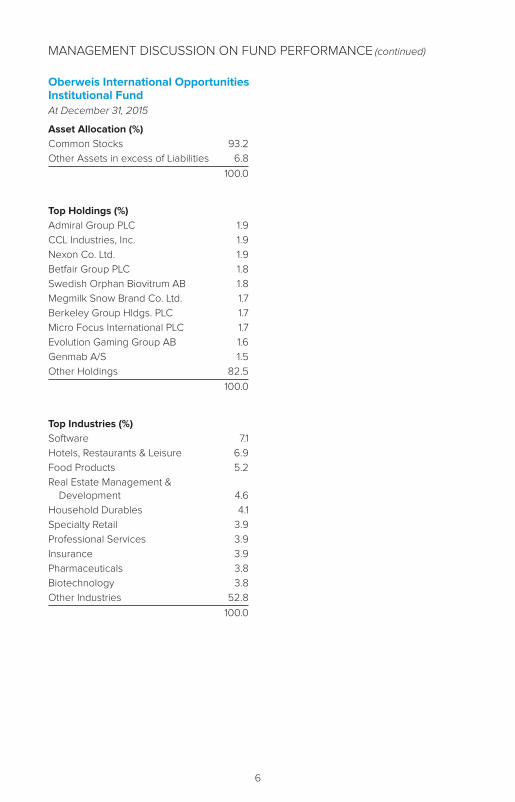
Oberweis International OpportunitiesInstitutional Fund
At December 31, 2015
Asset Allocation (%)
Common Stocks 93.2
Other Assets in excess of Liabilities 6.8
100.0
Top Holdings (%)
Admiral Group PLC 1.9
CCL Industries, Inc. 1.9
Nexon Co. Ltd. 1.9
Betfair Group PLC 1.8
Swedish Orphan Biovitrum AB 1.8
Megmilk Snow Brand Co. Ltd. 1.7
Berkeley Group Hldgs. PLC 1.7
Micro Focus International PLC 1.7
Evolution Gaming Group AB 1.6
Genmab A/S 1.5
Other Holdings 82.5
100.0
Top Industries (%)
Software 7.1
Hotels, Restaurants & Leisure 6.9
Food Products 5.2
Real Estate Management &Development 4.6
Household Durables 4.1
Specialty Retail 3.9
Professional Services 3.9
Insurance 3.9
Pharmaceuticals 3.8
Biotechnology 3.8
Other Industries 52.8
100.0
MANAGEMENT DISCUSSION ON FUND PERFORMANCE (continued)
6

Average Annual Total Returns1 (for the Periods Ended December 31, 2015)
1 YR(%)
SINCEINCEPTION2
(%)
EXPENSERATIO3
(%)
OBIIX 15.68 2.19 1.10
MSCI World ex-U.S. Small Cap Growth 9.92 0.51
Growth of a $10,000 Investment (from March 10, 2014 to December 31, 2015)
$10,399
Oberweis International Opportunities Institutional Fund (OBIIX)
MSCI World Ex US Small Cap Growth
$0
$5,000
$10,000
$15,000
12/1512/143/14
$10,093
1 Performance data represents past performance, which is no guarantee of future results. Returns are
historical and include changes in share price and reinvestment of dividends and capital gains. Current
performance may be higher or lower than the performance shown. You can obtain performance data
current to the most recent month by visiting oberweisfunds.com. The principal value and investment return
of an investment will fluctuate so that your shares, when redeemed, may be worth more or less than their
original cost. The Oberweis Funds invest in rapidly growing smaller and medium sized companies, which
may offer greater return potential. However, these investments often involve greater risks and volatility.
Foreign and emerging market investing involves special risks such as currency fluctuation and less public
disclosure, as well as economic and political risk. There is no guarantee that the portfolios can achieve
their objectives.
The MSCI World ex-US Small Cap Growth Index is a free float-adjusted market capitalization weighted
index that is designed to measure the equity market performance of small cap growth developed and
emerging markets excluding the U.S., with minimum dividends reinvested net of withholding tax.
2 Since Inception returns are from commencement of operations on 03/10/14 for the Fund.
3 Expense ratio is the total annual net fund operating expense ratio as of 12/31/15. The expense ratio gross
of any fee waivers or expense reimbursement was 1.28%.
MANAGEMENT DISCUSSION ON FUND PERFORMANCE (continued)
7

SHARES VALUE
Equities − 93.2%
AUSTRALIA − 2.9%
Domino’s Pizza Enterprises Ltd. . . . . . . . . . . . . . . . . . . . . . . . . . 113,400 $ 4,772,171
Orora Ltd. . . . . . . . . . . . . . . . . . . . . . . . . . . . . . . . . . . . . . . . . . . . 446,200 731,582
Qantas Airways Ltd. . . . . . . . . . . . . . . . . . . . . . . . . . . . . . . . . . . . 1,718,293 5,121,197
10,624,950
CANADA − 6.7%
CCL Industries, Inc. . . . . . . . . . . . . . . . . . . . . . . . . . . . . . . . . . . . 42,172 6,838,283
Colliers International Group, Inc. . . . . . . . . . . . . . . . . . . . . . . . . 51,900 2,315,377Cott Corp. . . . . . . . . . . . . . . . . . . . . . . . . . . . . . . . . . . . . . . . . . . . 203,800 2,239,762Dollarama, Inc. . . . . . . . . . . . . . . . . . . . . . . . . . . . . . . . . . . . . . . . 61,700 3,564,572FirstService Corp. . . . . . . . . . . . . . . . . . . . . . . . . . . . . . . . . . . . . 58,500 2,363,337Keyera Corp. . . . . . . . . . . . . . . . . . . . . . . . . . . . . . . . . . . . . . . . . 106,400 3,095,804Parex Resources, Inc.* . . . . . . . . . . . . . . . . . . . . . . . . . . . . . . . . . 526,400 3,865,162
24,282,297
DENMARK − 6.9%Chr Hansen Hldg. A/Sa . . . . . . . . . . . . . . . . . . . . . . . . . . . . . . . . 81,000 5,066,582Genmab A/Sa* . . . . . . . . . . . . . . . . . . . . . . . . . . . . . . . . . . . . . . . 41,604 5,531,836H Lundbeck A/Sa* . . . . . . . . . . . . . . . . . . . . . . . . . . . . . . . . . . . . 72,800 2,485,778Pandora A/Sa . . . . . . . . . . . . . . . . . . . . . . . . . . . . . . . . . . . . . . . . 42,600 5,371,173Royal Unibrew A/Sa . . . . . . . . . . . . . . . . . . . . . . . . . . . . . . . . . . . 67,760 2,753,875SimCorp A/Sa* . . . . . . . . . . . . . . . . . . . . . . . . . . . . . . . . . . . . . . . 41,200 2,323,079Sydbank A/Sa . . . . . . . . . . . . . . . . . . . . . . . . . . . . . . . . . . . . . . . . 42,130 1,352,792
24,885,115
FINLAND − 1.2%Huhtamaki OYJa . . . . . . . . . . . . . . . . . . . . . . . . . . . . . . . . . . . . . . 119,600 4,339,861
FRANCE − 4.6%Cellectis SA* . . . . . . . . . . . . . . . . . . . . . . . . . . . . . . . . . . . . . . . . . 54,600 1,656,631Ipsen SA* . . . . . . . . . . . . . . . . . . . . . . . . . . . . . . . . . . . . . . . . . . . . 38,800 2,572,050Nexity SA* . . . . . . . . . . . . . . . . . . . . . . . . . . . . . . . . . . . . . . . . . . . 67,600 2,997,629SEB SA . . . . . . . . . . . . . . . . . . . . . . . . . . . . . . . . . . . . . . . . . . . . . 45,900 4,718,692Teleperformance SA . . . . . . . . . . . . . . . . . . . . . . . . . . . . . . . . . . 55,600 4,682,678
16,627,680
GERMANY − 6.7%Aurelius AGa . . . . . . . . . . . . . . . . . . . . . . . . . . . . . . . . . . . . . . . . . 26,400 1,370,327Deutsche Wohnen AGa* . . . . . . . . . . . . . . . . . . . . . . . . . . . . . . . 165,300 4,570,719Grand City Properties SAa* . . . . . . . . . . . . . . . . . . . . . . . . . . . . . 83,600 1,932,321KION Group AGa . . . . . . . . . . . . . . . . . . . . . . . . . . . . . . . . . . . . . 100,700 4,993,350Rheinmetall AGa* . . . . . . . . . . . . . . . . . . . . . . . . . . . . . . . . . . . . . 58,100 3,861,914Sixt SEa . . . . . . . . . . . . . . . . . . . . . . . . . . . . . . . . . . . . . . . . . . . . . 18,300 930,981
SMA Solar Technology AGa* . . . . . . . . . . . . . . . . . . . . . . . . . . . . 62,800 3,472,850Stroeer Media SEa . . . . . . . . . . . . . . . . . . . . . . . . . . . . . . . . . . . . 48,900 3,070,146
24,202,608
OBERWEIS INTERNATIONAL OPPORTUNITIES INSTITUTIONAL FUND
Schedule of Investments December 31, 2015
See accompanying notes to the financial statements.
8

SHARES VALUE
IRELAND − 1.0%
ICON PLC* . . . . . . . . . . . . . . . . . . . . . . . . . . . . . . . . . . . . . . . . . . 47,400 $ 3,682,980
ITALY − 1.3%
Brembo SpAa . . . . . . . . . . . . . . . . . . . . . . . . . . . . . . . . . . . . . . . . 95,800 4,628,237
JAPAN − 33.2%
Adastria Co. Ltd.a . . . . . . . . . . . . . . . . . . . . . . . . . . . . . . . . . . . . . 47,300 2,646,813
Alps Electric Co. Ltd.a . . . . . . . . . . . . . . . . . . . . . . . . . . . . . . . . . 33,800 916,589
Asahi Intecc Co. Ltd.a . . . . . . . . . . . . . . . . . . . . . . . . . . . . . . . . . 66,000 3,032,964
Daifuku Co. Ltd.a . . . . . . . . . . . . . . . . . . . . . . . . . . . . . . . . . . . . . 272,000 4,631,901Ezaki Glico Co. Ltd.a* . . . . . . . . . . . . . . . . . . . . . . . . . . . . . . . . . . 72,000 3,889,715GMO Internet, Inc.a . . . . . . . . . . . . . . . . . . . . . . . . . . . . . . . . . . . 299,800 3,946,033Iida Group Hldgs. Co. Ltd.a . . . . . . . . . . . . . . . . . . . . . . . . . . . . . 135,100 2,503,944Istyle, Inc.a* . . . . . . . . . . . . . . . . . . . . . . . . . . . . . . . . . . . . . . . . . . 89,700 1,584,780Kajima Corp.a . . . . . . . . . . . . . . . . . . . . . . . . . . . . . . . . . . . . . . . . 358,000 2,130,618Kusuri No Aoki Co. Ltd.a . . . . . . . . . . . . . . . . . . . . . . . . . . . . . . . 54,800 2,674,833Kyowa Hakko Kirin Co. Ltd.a . . . . . . . . . . . . . . . . . . . . . . . . . . . . 154,000 2,423,137Megmilk Snow Brand Co. Ltd.a* . . . . . . . . . . . . . . . . . . . . . . . . . 240,000 6,171,490MISUMI Group, Inc.a . . . . . . . . . . . . . . . . . . . . . . . . . . . . . . . . . . 191,900 2,650,840Mitsui Chemicals, Inc.a . . . . . . . . . . . . . . . . . . . . . . . . . . . . . . . . . 985,000 4,368,483Morinaga & Co. Ltd.a* . . . . . . . . . . . . . . . . . . . . . . . . . . . . . . . . . 942,000 4,955,498Nexon Co. Ltd.a . . . . . . . . . . . . . . . . . . . . . . . . . . . . . . . . . . . . . . 411,200 6,689,293Nihon Chouzai Co. Ltd.a . . . . . . . . . . . . . . . . . . . . . . . . . . . . . . . 79,600 3,147,041NS Solutions Corp.a* . . . . . . . . . . . . . . . . . . . . . . . . . . . . . . . . . . 157,800 3,595,589Obayashi Corp.a* . . . . . . . . . . . . . . . . . . . . . . . . . . . . . . . . . . . . . 210,000 1,937,713Open House Co. Ltd.a . . . . . . . . . . . . . . . . . . . . . . . . . . . . . . . . . 123,600 2,373,514Santen Pharmaceutical Co. Ltd.a . . . . . . . . . . . . . . . . . . . . . . . . 216,400 3,562,684SCSK Corp.a . . . . . . . . . . . . . . . . . . . . . . . . . . . . . . . . . . . . . . . . . 125,300 5,034,418Shimadzu Corp.a . . . . . . . . . . . . . . . . . . . . . . . . . . . . . . . . . . . . . 297,000 4,971,756Shimamura Co. Ltd.a* . . . . . . . . . . . . . . . . . . . . . . . . . . . . . . . . . . 33,500 3,923,156Taiyo Yuden Co. Ltd.a* . . . . . . . . . . . . . . . . . . . . . . . . . . . . . . . . . 64,300 889,252Takeuchi Manufacturing Co. Ltd.a . . . . . . . . . . . . . . . . . . . . . . . 171,800 3,495,503TechnoPro Hldgs., Inc.a . . . . . . . . . . . . . . . . . . . . . . . . . . . . . . . . 159,400 4,652,105Temp Hldgs. Co. Ltd.a . . . . . . . . . . . . . . . . . . . . . . . . . . . . . . . . . 313,000 4,851,702Toda Corp.a* . . . . . . . . . . . . . . . . . . . . . . . . . . . . . . . . . . . . . . . . . 467,000 2,489,898Toho Hldgs. Co. Ltd.a* . . . . . . . . . . . . . . . . . . . . . . . . . . . . . . . . . 76,300 1,854,675Toyota Boshoku Corp.a* . . . . . . . . . . . . . . . . . . . . . . . . . . . . . . . 202,900 4,083,852Trend Micro, Inc.a . . . . . . . . . . . . . . . . . . . . . . . . . . . . . . . . . . . . . 113,000 4,585,216Tsuruha Hldgs., Inc.a . . . . . . . . . . . . . . . . . . . . . . . . . . . . . . . . . . 35,300 3,058,603Ulvac, Inc.a* . . . . . . . . . . . . . . . . . . . . . . . . . . . . . . . . . . . . . . . . . . 150,800 4,268,044W-Scope Corp.a . . . . . . . . . . . . . . . . . . . . . . . . . . . . . . . . . . . . . . 57,000 2,112,291
120,103,943
NETHERLANDS − 0.7%Corbion NV . . . . . . . . . . . . . . . . . . . . . . . . . . . . . . . . . . . . . . . . . . 101,500 2,461,392
NEW ZEALAND − 0.3%a2 Milk Co. Ltd.* . . . . . . . . . . . . . . . . . . . . . . . . . . . . . . . . . . . . . . 937,800 1,193,016
OBERWEIS INTERNATIONAL OPPORTUNITIES INSTITUTIONAL FUND
Schedule of Investments December 31, 2015 (continued)
See accompanying notes to the financial statements.
9

SHARES VALUE
SWEDEN − 5.0%
Evolution Gaming Group ABa* . . . . . . . . . . . . . . . . . . . . . . . . . . 154,910 $ 5,601,809
Hexpol ABa . . . . . . . . . . . . . . . . . . . . . . . . . . . . . . . . . . . . . . . . . . 174,000 1,865,658
Mycronic ABa . . . . . . . . . . . . . . . . . . . . . . . . . . . . . . . . . . . . . . . . 141,300 1,367,414
Swedish Orphan Biovitrum ABa* . . . . . . . . . . . . . . . . . . . . . . . . 401,600 6,370,123
Unibet Group PLCa* . . . . . . . . . . . . . . . . . . . . . . . . . . . . . . . . . . . 29,200 2,977,368
18,182,372
SWITZERLAND − 4.1%
Galenica AGa* . . . . . . . . . . . . . . . . . . . . . . . . . . . . . . . . . . . . . . . . 1,673 2,617,492Swiss Life Hldg. AGa* . . . . . . . . . . . . . . . . . . . . . . . . . . . . . . . . . . 15,300 4,121,053Temenos Group AGa* . . . . . . . . . . . . . . . . . . . . . . . . . . . . . . . . . 88,400 4,565,733U-Blox AGa . . . . . . . . . . . . . . . . . . . . . . . . . . . . . . . . . . . . . . . . . . 16,060 3,418,197
14,722,475
UNITED KINGDOM − 18.6%Admiral Group PLC . . . . . . . . . . . . . . . . . . . . . . . . . . . . . . . . . . . 282,300 6,904,551Auto Trader Group PLC* . . . . . . . . . . . . . . . . . . . . . . . . . . . . . . . 757,400 4,957,771Beazley PLC . . . . . . . . . . . . . . . . . . . . . . . . . . . . . . . . . . . . . . . . . 530,800 3,057,402Berkeley Group Hldgs. PLC . . . . . . . . . . . . . . . . . . . . . . . . . . . . 112,700 6,127,637Betfair Group PLC . . . . . . . . . . . . . . . . . . . . . . . . . . . . . . . . . . . . 111,300 6,399,381DCC PLC . . . . . . . . . . . . . . . . . . . . . . . . . . . . . . . . . . . . . . . . . . . . 56,900 4,747,958Dominos Pizza Group PLC . . . . . . . . . . . . . . . . . . . . . . . . . . . . . 178,000 2,760,666Greene King PLC . . . . . . . . . . . . . . . . . . . . . . . . . . . . . . . . . . . . . 169,100 2,318,487Greggs PLC . . . . . . . . . . . . . . . . . . . . . . . . . . . . . . . . . . . . . . . . . 131,800 2,553,224Howden Joinery Group PLC . . . . . . . . . . . . . . . . . . . . . . . . . . . . 549,800 4,267,576Inmarsat PLC* . . . . . . . . . . . . . . . . . . . . . . . . . . . . . . . . . . . . . . . . 290,800 4,874,533JD Sports Fashion PLC . . . . . . . . . . . . . . . . . . . . . . . . . . . . . . . . 219,000 3,361,035Micro Focus International PLC . . . . . . . . . . . . . . . . . . . . . . . . . . 257,100 6,045,621Redrow PLC . . . . . . . . . . . . . . . . . . . . . . . . . . . . . . . . . . . . . . . . . 233,700 1,619,672Regus PLC . . . . . . . . . . . . . . . . . . . . . . . . . . . . . . . . . . . . . . . . . . 132,900 652,842Rightmove PLC . . . . . . . . . . . . . . . . . . . . . . . . . . . . . . . . . . . . . . . 83,700 5,090,115Sophos Group PLC . . . . . . . . . . . . . . . . . . . . . . . . . . . . . . . . . . . 332,800 1,285,473
67,023,944
Total Equities(Cost: $301,348,596) . . . . . . . . . . . . . . . . . . . . . . . . . . . . . . . . . . $ 336,960,870
Total Investments − 93.2%(Cost: $301,348,596) . . . . . . . . . . . . . . . . . . . . . . . . . . . . . . . . . . $ 336,960,870
Other Assets Less Liabilities − 6.8% . . . . . . . . . . . . . . . . . . . . . . 24,441,169
Net Assets − 100% . . . . . . . . . . . . . . . . . . . . . . . . . . . . . . . . . . . $ 361,402,039
OBERWEIS INTERNATIONAL OPPORTUNITIES INSTITUTIONAL FUND
Schedule of Investments December 31, 2015 (continued)
See accompanying notes to the financial statements.
10

Cost of investments is $304,764,702 for federal income tax purposes and net unrealized
appreciation consists of:
Gross unrealized appreciation . . . . . . . . . . . . . . . . . . . . . . . . . . . . . . . . . . . . $ 39,364,069
Gross unrealized depreciation . . . . . . . . . . . . . . . . . . . . . . . . . . . . . . . . . . . . (7,167,901)
Net unrealized appreciation . . . . . . . . . . . . . . . . . . . . . . . . . . . . . . . . . . . . . . $ 32,196,168
a Certain securities were fair valued under the discretion of the Board of Trustees
* Non-income producing security during the year ended December 31, 2015
SECTOR ALLOCATIONS (As a percentage of Net Assets)
Consumer Discretionary . . . . . . . . . . . . . . . . . . . . . . . . . . . . . . . . . . . . . . . . . . . . . . . . . 23.5%Consumer Staples . . . . . . . . . . . . . . . . . . . . . . . . . . . . . . . . . . . . . . . . . . . . . . . . . . . . . . 9.7%Energy . . . . . . . . . . . . . . . . . . . . . . . . . . . . . . . . . . . . . . . . . . . . . . . . . . . . . . . . . . . . . . . . 1.9%Financials . . . . . . . . . . . . . . . . . . . . . . . . . . . . . . . . . . . . . . . . . . . . . . . . . . . . . . . . . . . . . 9.2%Health Care . . . . . . . . . . . . . . . . . . . . . . . . . . . . . . . . . . . . . . . . . . . . . . . . . . . . . . . . . . . 9.9%Industrials . . . . . . . . . . . . . . . . . . . . . . . . . . . . . . . . . . . . . . . . . . . . . . . . . . . . . . . . . . . . . 14.4%Information Technology . . . . . . . . . . . . . . . . . . . . . . . . . . . . . . . . . . . . . . . . . . . . . . . . . . 16.3%Materials . . . . . . . . . . . . . . . . . . . . . . . . . . . . . . . . . . . . . . . . . . . . . . . . . . . . . . . . . . . . . . 7.0%Telecommunication Services . . . . . . . . . . . . . . . . . . . . . . . . . . . . . . . . . . . . . . . . . . . . . 1.3%
OBERWEIS INTERNATIONAL OPPORTUNITIES INSTITUTIONAL FUND
Schedule of Investments December 31, 2015 (continued)
See accompanying notes to the financial statements.
11

ASSETS
Investment securities at value(a) . . . . . . . . . . . . . . . . . . . . . . . . . . . . . . . . . . . . . . $336,960,870
Cash . . . . . . . . . . . . . . . . . . . . . . . . . . . . . . . . . . . . . . . . . . . . . . . . . . . . . . . . . . . . 34,568,279
Receivable from securities sold . . . . . . . . . . . . . . . . . . . . . . . . . . . . . . . . . . . . . . 655,135
Receivable from fund shares sold . . . . . . . . . . . . . . . . . . . . . . . . . . . . . . . . . . . . 340,487
Dividends and interest receivable . . . . . . . . . . . . . . . . . . . . . . . . . . . . . . . . . . . . 607,692
Prepaid expenses . . . . . . . . . . . . . . . . . . . . . . . . . . . . . . . . . . . . . . . . . . . . . . . . . 27,763
Total Assets . . . . . . . . . . . . . . . . . . . . . . . . . . . . . . . . . . . . . . . . . . . . . . . . . . . . . . 373,160,226
LIABILITIES
Payable for fund shares redeemed . . . . . . . . . . . . . . . . . . . . . . . . . . . . . . . . . . . 7,141Payable for securities purchased . . . . . . . . . . . . . . . . . . . . . . . . . . . . . . . . . . . . 11,387,392Payable to advisor (see note 2) . . . . . . . . . . . . . . . . . . . . . . . . . . . . . . . . . . . . . . 244,386Accrued expenses . . . . . . . . . . . . . . . . . . . . . . . . . . . . . . . . . . . . . . . . . . . . . . . . 119,268
Total Liabilities . . . . . . . . . . . . . . . . . . . . . . . . . . . . . . . . . . . . . . . . . . . . . . . . . . . . 11,758,187
NET ASSETS . . . . . . . . . . . . . . . . . . . . . . . . . . . . . . . . . . . . . . . . . . . . . . . . . . . . . $ 361,402,039
SHARES OUTSTANDING
(shares of beneficial interest issued and outstanding, respectively, unlimitednumber of shares authorized with no par value) . . . . . . . . . . . . . . . . . . . . . . 35,036,333
Net asset value, offering price and redemption price . . . . . . . . . . . . . . . . . . . . $ 10.32
ANALYSIS OF NET ASSETS
Capital . . . . . . . . . . . . . . . . . . . . . . . . . . . . . . . . . . . . . . . . . . . . . . . . . . . . . . . . . . . $ 342,211,026Accumulated net investment loss . . . . . . . . . . . . . . . . . . . . . . . . . . . . . . . . . . . . (955,737)Accumulated net realized losses on investments and foreign currency
transactions . . . . . . . . . . . . . . . . . . . . . . . . . . . . . . . . . . . . . . . . . . . . . . . . . . . . (15,462,175)Net unrealized appreciation/depreciation on investments and translation of
assets and liabilities denominated in foreign currencies . . . . . . . . . . . . . . . 35,608,925
Net Assets . . . . . . . . . . . . . . . . . . . . . . . . . . . . . . . . . . . . . . . . . . . . . . . . . . . . . . . $ 361,402,039
(a) Investment securities at cost . . . . . . . . . . . . . . . . . . . . . . . . . . . . . . . . . . . . . . $ 301,348,596
OBERWEIS INTERNATIONAL OPPORTUNITIES INSTITUTIONAL FUND
Statement of Assets and Liabilities December 31, 2015
See accompanying notes to the financial statements.
12

INVESTMENT INCOME
Interest . . . . . . . . . . . . . . . . . . . . . . . . . . . . . . . . . . . . . . . . . . . . . . . . . . . . . . . . . . . $ 33,312
Dividendsa . . . . . . . . . . . . . . . . . . . . . . . . . . . . . . . . . . . . . . . . . . . . . . . . . . . . . . . . 4,144,462
Total Income . . . . . . . . . . . . . . . . . . . . . . . . . . . . . . . . . . . . . . . . . . . . . . . . . . . . . . 4,177,774
EXPENSES
Investment advisory fees (see note 2) . . . . . . . . . . . . . . . . . . . . . . . . . . . . . . . . . 2,476,272
Transfer agent fees and expenses . . . . . . . . . . . . . . . . . . . . . . . . . . . . . . . . . . . . 95,299
Custodian fees and expenses . . . . . . . . . . . . . . . . . . . . . . . . . . . . . . . . . . . . . . . . 432,213
Other . . . . . . . . . . . . . . . . . . . . . . . . . . . . . . . . . . . . . . . . . . . . . . . . . . . . . . . . . . . . 167,227
Total expenses before reimbursed expenses . . . . . . . . . . . . . . . . . . . . . . . . . . . 3,171,011Earnings credit (see note 5) . . . . . . . . . . . . . . . . . . . . . . . . . . . . . . . . . . . . . . . . . . (4,794)Expense reimbursement (see note 2) . . . . . . . . . . . . . . . . . . . . . . . . . . . . . . . . . . (442,318)
Total Expenses . . . . . . . . . . . . . . . . . . . . . . . . . . . . . . . . . . . . . . . . . . . . . . . . . . . . 2,723,899
NET INVESTMENT INCOME . . . . . . . . . . . . . . . . . . . . . . . . . . . . . . . . . . . . . . . . . 1,453,875
NET REALIZED AND UNREALIZED GAINS (LOSSES) FROM INVESTMENTS
Net realized gains on investment transactions . . . . . . . . . . . . . . . . . . . . . . . . . . 2,712,085Net realized losses on foreign currency transactions . . . . . . . . . . . . . . . . . . . . . (83,339)
Net realized gains on investment and foreign currency transactions . . . . . . . . 2,628,746Change in net unrealized appreciation/depreciation on investments and
translation of assets and liabilities denominated in foreign currencies . . . . 29,740,935
Net realized/unrealized gains on investments and foreign currencies . . . . . . . 32,369,681
NET INCREASE IN NET ASSETS RESULTING FROM OPERATIONS . . . . . . . . . $33,823,556
a Dividends are net of foreign withholding tax of $520,479
OBERWEIS INTERNATIONAL OPPORTUNITIES INSTITUTIONAL FUND
Statements of Operations Year Ended December 31, 2015
See accompanying notes to the financial statements.
13

Year EndedDecember 31,
2015
Period EndedDecember 31,
2014*
FROM OPERATIONS
Net investment income . . . . . . . . . . . . . . . . . . . . . . . . . . . $ 1,453,875 $ 93,104
Net realized gains (losses) on investments and foreign
currency transactions . . . . . . . . . . . . . . . . . . . . . . . . . . . 2,628,746 (18,232,742)
Change in net unrealized appreciation\depreciation on
investments and foreign currencies . . . . . . . . . . . . . . . 29,740,935 5,867,990
Net increase (decrease) in net assets resulting from
operations . . . . . . . . . . . . . . . . . . . . . . . . . . . . . . . . . . . . 33,823,556 (12,271,648)
FROM DISTRIBUTIONS
Distributions from net investment income . . . . . . . . . . . . (1,967,928) (396,444)
Net decrease in net assets from distributions . . . . . . . . . (1,967,928) (396,444)
FROM CAPITAL SHARE TRANSACTIONS
Proceeds from sale of shares . . . . . . . . . . . . . . . . . . . . . . 158,781,402 194,307,457Proceeds from reinvestment of distributions . . . . . . . . . . 1,591,306 370,568Redemption of shares . . . . . . . . . . . . . . . . . . . . . . . . . . . . (9,817,613) (3,018,617)
Net increase from capital share transactions . . . . . . . . . . 150,555,095 191,659,408
Total increase in net assets . . . . . . . . . . . . . . . . . . . . . . . . 182,410,723 178,991,316
NET ASSETS
Beginning of period . . . . . . . . . . . . . . . . . . . . . . . . . . . . . . 178,991,316 —
End of period . . . . . . . . . . . . . . . . . . . . . . . . . . . . . . . . . . . . $361,402,039 $ 178,991,316
ACCUMULATED NET INVESTMENT LOSS . . . . . . . . . . . . $ (955,737) $ (377,205)
TRANSACTIONS IN SHARES
Shares sold . . . . . . . . . . . . . . . . . . . . . . . . . . . . . . . . . . . . . 15,917,373 20,243,585Shares issued in reinvestment of distributions . . . . . . . . 153,453 40,947Less shares redeemed . . . . . . . . . . . . . . . . . . . . . . . . . . . . (988,167) (330,858)
Net increase from capital share transactions . . . . . . . . . . 15,082,659 19,953,674
* For the period from March 10, 2014 (commencement of operations) through December 31, 2014
OBERWEIS INTERNATIONAL OPPORTUNITIES INSTITUTIONAL FUND
Statement of Changes in Net Assets
See accompanying notes to the financial statements.
14

1. Significant Accounting Policies
Description of business. The Oberweis Funds (the ‘‘Trust’’) is registered under the Investment
Company Act of 1940 as a diversified open-end management investment company. The Trust is
authorized to operate numerous Funds under various trading strategies. The Oberweis
International Opportunities Institutional Fund is one fund in a series issued by the Trust.
Investment valuation. Investments in securities are stated at value as of the close of the
regular trading session on the New York Stock Exchange (‘‘NYSE’’) (generally 3 p.m., Central
Standard Time). Each listed and unlisted security for which last sale information is regularly
reported is valued at the last reported sales price on that day. If there has been no sale on
such day, then such security is valued at the current day’s bid price. Any unlisted security for
which last sale information is not regularly reported and any listed debt security which has an
inactive listed market for which over-the-counter market quotations are readily available are
valued at the closing bid price determined on the basis of reasonable inquiry. Options are
valued at the last reported bid price on the primary exchange as of the close of the regular
trading session of the Chicago Board Options Exchange (‘‘CBOE’’). Restricted securities and
any other securities or other assets for which market quotations are not readily available are
valued by appraisal at their fair value as determined in good faith under procedures
established by and under the general supervision and responsibility of the Board of Trustees.
Short-term debt obligations, commercial paper and repurchase agreements are valued on the
basis of quoted yields for securities of comparable maturity, quality and type or on the basis of
amortized cost.
The Oberweis International Opportunities Institutional Fund holds foreign equity securities.
Foreign securities are fair valued as described in the following circumstances. Generally, trading
in foreign securities markets is completed each day at various times prior to the close of the
regular trading session of the NYSE. Due to the time differences between the closings of the
relevant foreign securities exchanges and the close of the regular trading session of the NYSE for
the Fund, the Fund will fair value their foreign investments when it is determined that the market
quotations for the foreign investments either are not readily available or are unreliable and,
therefore, do not represent fair value. When the fair value prices are utilized, these prices will
attempt to reflect the impact of the U.S. financial markets’ perceptions and trading activities on the
Funds’ foreign investments since the last closing prices of the foreign investments were
calculated on their primary foreign securities markets or exchanges. For these purposes, the
Board of Trustees of the Trust has determined that movements in relevant indices, after the close
of the foreign securities exchanges, may demonstrate that market quotations are unreliable, and
may trigger fair value pricing for certain securities. Consequently, fair valuation of portfolio
securities may occur on a daily basis. In determining fair value prices, the Trust utilizes data
furnished by an independent pricing service (and that data draws upon, among other information,
the market values of foreign investments). When a Fund uses fair value pricing, the values
assigned to the Fund’s foreign investments may not be the quoted or published prices of the
investments on their primary markets or exchanges.
Fair Value Measurements. In accordance with Financial Accounting Standards Board
(‘‘FASB’’) guidance, the Fund utilizes the ‘‘Fair Value Measurements and Disclosures’’ to define
fair value, set out a framework for measuring fair value, and expand disclosures regarding fair
value measurements.
OBERWEIS INTERNATIONAL OPPORTUNITIES INSTITUTIONAL FUND
Notes to Financial Statements December 31, 2015
15

Various inputs are used in determining the value of the Fund’s investments. These inputs are
summarized in the three levels listed below:
• Level 1 − Quoted prices in active markets for identical securities.
• Level 2 − Other significant observable inputs (including quoted prices for similar
securities, interest rates, prepayment speeds, credit risk, etc).
• Level 3 − Significant unobservable inputs (including the Fund’s own assumptions in
determining the fair value of investments).
The inputs or methodology used for valuing securities are not necessarily an indication of the
risk associated with investing in those securities. The following is a summary of the inputsused to value the Fund’s net assets as of December 31, 2015:
Level 1 Level 2 Level 3
Investment SecuritiesCommon Stocks
Total Asia . . . . . . . . . . . . . . . . . . . . . . . . . $ — $120,103,943 $ —Total Australia . . . . . . . . . . . . . . . . . . . . . 11,817,966 — —Total Europe. . . . . . . . . . . . . . . . . . . . . . . 89,795,996 90,960,668 —Total North America . . . . . . . . . . . . . . . . 24,282,297 — —
Total Investments . . . . . . . . . . . . . . . . . . . . . . $125,896,259 $ 211,064,611 $ —
The Fund’s assets include certain foreign securities for which a third party statistical pricing
service may be employed for purposes of fair market valuation. The pricing service provides fair
market valuation on days when the movement in relevant indices exceeds a predetermined
threshold. When fair market valuations are employed these techniques may result in transfers
between Level 1 and Level 2. For movements between the levels within the fair value hierarchy,
the Funds have adopted a policy of recognizing the transfers as of year end.
Significant transfers between Levels 1 and 2 included securities valued at $64,165,575 at
December 31, 2015. These movements were primarily the result of certain foreign securities
using a systematic fair value model at December 31, 2015 but not at December 31, 2014.
Foreign Currency Transactions. The accounting records of the Fund are maintained in U.S.
dollars. Foreign currency amounts are translated into U.S. dollars at the current rate of
exchange to determine the value of investments, assets and liabilities. Purchases and sales of
securities, and income and expenses are translated at the prevailing rate of exchange on the
respective date of these transactions. The Fund does not isolate that portion of the results of
operations resulting from changes in foreign exchange rates on investments from fluctuations
arising from changes in market prices of securities held. These fluctuations are included with
the net realized and unrealized gains or losses from investments and foreign currencies.
Risks Associated with Foreign Securities and Currencies. Investments in securities of
foreign issuers carry certain risks not ordinarily associated with investments in securities of
U.S. issuers. These risks include future political and economic developments, and the
possible imposition of exchange controls or other foreign governmental laws and restrictions.
In addition, with respect to certain countries, there is the possibility of expropriation of assets,
confiscatory taxation, political or social instability or diplomatic developments, which could
adversely affect investments in those countries.
OBERWEIS INTERNATIONAL OPPORTUNITIES INSTITUTIONAL FUND
Notes to Financial Statements December 31, 2015 (continued)
16

Certain countries also may impose substantial restrictions on investments in their capitalmarkets by foreign entities, including restrictions on investments in issuers of industriesdeemed sensitive to relevant national interests. These factors may limit the investmentopportunities available and result in a lack of liquidity and a high price volatility with respect tosecurities of issuers from developing countries.
Fund share valuation. Fund shares are sold and redeemed on a continuous basis at netasset value. On each day the NYSE is open for trading, the net asset value per share isdetermined as of the later of the close of the NYSE or the CBOE by dividing the total value ofeach Fund’s investments and other assets, less liabilities, by the number of each Fund’sshares outstanding.
Investment transactions and investment income. Investment transactions are accountedfor on the trade date (date the order to buy or sell is executed). Dividend income is recordedon the ex-dividend date, except that certain dividends from foreign securities are recorded assoon as the information is available to the Fund, and interest income is recorded on theaccrual basis and includes amortization of premium and discount. Realized gains and lossesfrom investment transactions are reported on an identified cost basis. Gains and losses onpremiums from expired options are recognized on the date of expiration.
Federal income taxes and dividends to shareholders. It is the policy of the Fund to complywith all requirements of the Internal Revenue Code of 1986, as amended (‘‘the Code’’), applicableto regulated investment companies and to distribute substantially all of the taxable income to theshareholders. The Fund has met the requirements of the Code applicable to regulatedinvestment companies for the year ended December 31, 2015. Therefore, no federal income taxprovision is required. Income and capital gains of the Fund are determined in accordance withboth tax regulations and accounting principles generally accepted in the U.S. (‘‘GAAP’’). Suchtreatment may result in temporary and permanent differences between tax basis earnings andearnings reported for financial statement purposes. These reclassifications, which have noimpact on the net asset value of the Fund, are primarily attributable to certain differences incomputation of distributable income and capital gains under federal tax rules versus GAAP.
For the year ended December 31, 2015, permanent book and tax differences resulting primarilyfrom differing treatments for foreign currency transactions, and passive foreign investmentcompany (‘‘PFIC’’) adjustments were identified and reclassified among the components of theFund’s net assets.
The tax character of distributions paid during the fiscal year ended December 31, 2015 was asfollows:
DistributionsPaid fromOrdinary
Income
DistributionsPaid from Net
Long-TermCapital Gains
TotalDistributions
Paid
International Opportunities InstitutionalFund . . . . . . . . . . . . . . . . . . . . . . . . . . . . . . $ 1,967,928 $ — $ 1,967,928
The tax character of distributions paid during the fiscal year ended December 31, 2014 was asfollows:
DistributionsPaid fromOrdinary
Income
DistributionsPaid from Net
Long-TermCapital Gains
TotalDistributions
Paid
International Opportunities Institutional
Fund . . . . . . . . . . . . . . . . . . . . . . . . . . . . . . $396,444 $ — $396,444
OBERWEIS INTERNATIONAL OPPORTUNITIES INSTITUTIONAL FUND
Notes to Financial Statements December 31, 2015 (continued)
17

As of December 31, 2015, the Fund had the following net capital loss carryforwards to offset
future net capital gains, if any, to the extent provided by treasury regulations:
Expires 2017 (Pre-Enactment)Not subject to Expiration
(Post-Enactment)
Short-Term Long-Term Short-Term Long-Term
International Opportunities
Institutional Fund . . . . . . . $ — $ — $11,423,197 $ —
Capital loss carryforwards are subject to certain limitations to offset future gains, if any, due to
the ownership change limitations set forth in Internal Revenue Code Section 382. All losses
may not be available in any particular year.
Under the Regulated Investment Company Modernization Act of 2010 (the ‘‘Act’’), the Fundswill be permitted to carryforward capital losses incurred in taxable years beginning afterDecember 22, 2010, the date of enactment of the Act, for an unlimited period. However, anylosses incurred during those future taxable years will be required to be utilized prior to thelosses incurred in pre-enactment taxable years. As a result of this ordering rule,pre-enactment capital loss carryforwards may be more likely to expire unused. Additionally,post-enactment capital losses that are carried forward will retain their character as eithershort-term or long-term capital losses rather than being considered all short-term as underprevious law.
Post-October capital losses and late-year ordinary losses incurred after October 31 and withinthe taxable year are deemed to arise on the first business day of the Funds' next taxable year.For the year ended December 31, 2015, the following Funds deferred to January 1, 2016post-October capital losses and Qualified late-year losses:
Post-OctoberCapitalLosses
Late-yearOrdinary
Losses
International Opportunities Institutional Fund . . . . . . . . . . . $1,562,027 $27,950
As of December 31, 2015 the components of accumulated earnings (deficit) on a tax basiswere as follows:
UndistributedOrdinary
Income(Deficit)
UndistributedLong-Term
CapitalGains
AccumulatedCapital
and OtherLosses
UnrealizedAppreciation
onInvestments
UnrealizedAppreciation
ForeignCurrency
Translations
InternationalOpportunitiesInstitutional Fund. . . $ — $ — $(13,013,174) $32,196,168 $8,019
Accumulated capital and other losses consists of capital loss carryovers and qualified late-year
losses. The difference between book-basis and tax basis unrealized appreciation/(depreciation)
is primarily attributable to timing differences in recognizing certain gains and losses on
investment transactions.
The Funds have reviewed all open tax years and major jurisdictions and concluded that there
are no significant uncertain tax positions that would require recognition in the financial
statements. Open tax years are those that are open for exam by taxing authorities and as of
December 31, 2015, open federal tax years included the tax years ended 2014 through 2015.The Funds have no examinations in progress and is also not aware of any tax positions for
OBERWEIS INTERNATIONAL OPPORTUNITIES INSTITUTIONAL FUND
Notes to Financial Statements December 31, 2015 (continued)
18

which it is reasonably possible that the total amounts of unrecognized tax benefits will
significantly change in the next twelve months.
Use of estimates. The preparation of financial statements in conformity with generally
accepted accounting principles requires management to make estimates and assumptions
that affect the amounts reported in the financial statements and accompanying notes. Actual
results may differ from those estimates.
Indemnifications. Under the Trust’s organizational documents, its present and former
Officers and Trustees are indemnified against certain liabilities arising out of the performance
of their duties to the Trust. In addition, in the normal course of business, the Trust enters into
contracts that provide general indemnifications to other parties. The Trust’s maximumexposure under these arrangements is unknown as this would involve future claims that maybe made against the Trust that have not yet occurred. However, the Trust has not had priorclaims or losses pursuant to these contracts and expects the risk of loss to be remote.
2. Transactions with affiliates
The Fund has written agreements with Oberweis Asset Management, Inc. (‘‘OAM’’) as theFunds’ investment adviser and manager. Oberweis Securities, Inc. (‘‘OSI’’), the Funds’ principaldistributor, is an affiliate of OAM.
Investment advisory agreement. Under the Advisory Agreement, OAM provides investmentadvisory and management services to the International Opportunities Institutional Fund.The International Opportunities Institutional Fund paid monthly investment advisory andmanagement fees at an annual rate equal to 1.00% of average daily net assets. For the yearended December 31, 2015, the International Opportunities Institutional Fund incurred investmentadvisory and management fees totaling $2,476,272.
Expense reimbursement. OAM is contractually obligated to reduce its investment andmanagement fees or reimburse the International Opportunities Institutional Fund to the extentthat total ordinary operating expenses, as defined, exceed in any one year 1.10% expressed asa percentage of the Fund’s average daily net assets. For the year ended December 31, 2015OAM reimbursed the International Opportunities Institutional Fund in the amount of $442,318.
Officers and trustees. Certain officers and trustees of the Trust are also officers and/ordirectors of OAM and OSI. During the year ended December 31, 2015, the Trust made no directpayments to its officers and paid $89,000 to its unaffiliated trustees.
Affiliated Commissions. For the year ended December 31, 2015, the InternationalOpportunities Institutional Fund did not execute any security transactions through OSI andtherefore did not pay commissions to OSI.
3. Investment transactions
The cost of securities purchased and proceeds from securities sold during the period endedDecember 31, 2015, other than options written and money market investments, aggregated$621,450,795 and $489,293,529, respectively. The Fund did not hold government securities
during the year ended December 31, 2015.
The Fund may write covered call options. The premiums received provide a partial hedge(protection) against declining prices and enables the Fund to generate a higher return during
periods when OAM does not expect the underlying security to make any major price moves inthe near future but still deems the underlying security to be, over the long term, an attractive
OBERWEIS INTERNATIONAL OPPORTUNITIES INSTITUTIONAL FUND
Notes to Financial Statements December 31, 2015 (continued)
19
investment for each Fund. The Fund may write covered call options for which premiums
received are recorded as liabilities and are subsequently adjusted to the current value of the
options written. Premiums received from writing options that expire are treated as realized
gains. Premiums received from writing options, which are either exercised or closed, are offset
against the proceeds received or amount paid on the transaction to determine realized gains
or losses. Amounts recovered for securities litigation are included in the realized gains of the
Fund and are recorded when received. The Fund did not write covered call options for the
year ended December 31, 2015.
4. Redemption fee
The Oberweis Funds are designed for long-term investors. To discourage market timersredemptions of shares within 90 days of purchase are subject to a 2.00% redemption fee ofthe total redemption amount. The redemption fee is deducted from the redemption proceedsand is retained by the Fund.
The redemption fee is retained by the Fund for the expense they incur in connection withshareholder redemptions. Redemption fees received by the Fund were $13,288, for the yearended December 31, 2015, and were recorded as a reduction of the proceeds of sharesredeemed in the statements of changes in net assets.
5. Earnings credits and interest charges
The Trust, as part of the agreement with the Custodian, receives credits against its custodianfees on its uninvested cash balances and is allowed to borrow for temporary purposes.Borrowings are not to exceed 5% of the value of the Fund’s total assets at the time of any suchborrowing. Interest on amounts borrowed is calculated at the prime rate and is payablemonthly. During the year ended December 31, 2015, the Fund received credits of $4,794. TheFund incurred interest charges of $903, which is included in custodian fees and expenses inthe statement of operations.
6. Subsequent events
The Fund has evaluated subsequent events that have occurred through the date the financialstatements were issued and determined that no events have occurred that require disclosure.
At its February 18, 2016 meeting, the Trust’s Board of Trustees (the ‘‘Board’’) and the Trust’s AuditCommittee approved BBD LLC as the Funds’ independent registered public accounting firm.PricewaterhouseCoopers LLP (‘‘PwC’’) was previously engaged as the independent registeredpublic accounting firm to audit the Funds’ financial statements. PwC issued reports on the Funds’financial statements from March 10, 2014 through December 31, 2015. During that period endedDecember 31, 2015 the reports from PwC did not contain any adverse opinion or disclaimer ofopinion, and were not qualified or modified as to uncertainty, audit scope or accountingprinciples. The Funds had no disagreements with PwC on any matter of accounting principles orpractices, financial statement disclosure or auditing scope or procedure.
OBERWEIS INTERNATIONAL OPPORTUNITIES INSTITUTIONAL FUND
Notes to Financial Statements December 31, 2015 (continued)
20

Per share income and capital for a share outstanding throughout each period is as follows:
Year EndedDecember 31,
2015
Period EndedDecember 31,
2014a
Net asset value at beginning of period . . . . . . . . . . . . . . . . $ 8.97 $ 10.00
INCOME (LOSS) FROM INVESTMENT OPERATIONS
Net investment incomeb . . . . . . . . . . . . . . . . . . . . . . . . . . . . .06 .01
Net realized and unrealized gains (losses) on
investments . . . . . . . . . . . . . . . . . . . . . . . . . . . . . . . . . . . . 1.35 (1.02)
Total from investment operations . . . . . . . . . . . . . . . . . . . . . 1.41 (1.01)
Redemption Feesb . . . . . . . . . . . . . . . . . . . . . . . . . . . . . . . . . —g —g
Less dividends:
Dividends from net investment income . . . . . . . . . . . . . . . . (.06) (.02)
Net asset value at end of period . . . . . . . . . . . . . . . . . . . . . $ 10.32 $ 8.97
Total Return (%) . . . . . . . . . . . . . . . . . . . . . . . . . . . . . . . . . . . . 15.68 (10.10)e
RATIO/SUPPLEMENTAL DATA
Net Assets at end of period (in thousands) . . . . . . . . . . . . . $361,402 $178,991
Ratio of gross expenses to average net assets (%) . . . . . . 1.28 1.39d
Ratio of net expenses to average net assets (%)c . . . . . . . 1.10 1.10d
Ratio of net investment income to averagenet assets (%) . . . . . . . . . . . . . . . . . . . . . . . . . . . . . . . . . . . .59 .11d
Portfolio turnover rate (%) . . . . . . . . . . . . . . . . . . . . . . . . . . . 211 152ef
Notes:
a For the period from March 10, 2014 (commencement of operations) through December 31, 2014.
b The net investment loss per share data and the redemption fee data were determined using average
shares outstanding during the period.
c The ratios in this row reflect the impact, if any, of expense offset arrangements and expense reimbursement
from the advisor.
d Annualized.
e Not annualized.
f Excludes the value of portfolio securities received as a result of in-kind purchases of the fund’s capital
shares.
g Less than $0.005 per share.
OBERWEIS INTERNATIONAL OPPORTUNITIES INSTITUTIONAL FUND
Financial Highlights
21

To the Board of Trustees and Shareholders of the
Oberweis International Opportunities Institutional Fund
In our opinion, the accompanying statement of assets and liabilities, including the schedule of
investments, and the related statements of operations and of changes in net assets and the
financial highlights present fairly, in all material respects, the financial position of the Oberweis
International Opportunities Institutional Fund (the ‘‘Fund’’) at December 31, 2015, the results of
its operations for the year then ended, the changes in its net assets for each of the two years
in the period then ended and the financial highlights for each of the periods presented, in
conformity with accounting principles generally accepted in the United States of America.
These financial statements and financial highlights (hereafter referred to as ‘‘financial
statements’’) are the responsibility of the Fund's management. Our responsibility is to express
an opinion on these financial statements based on our audits. We conducted our audits of
these financial statements in accordance with the standards of the Public Company
Accounting Oversight Board (United States). Those standards require that we plan and
perform the audit to obtain reasonable assurance about whether the financial statements are
free of material misstatement. An audit includes examining, on a test basis, evidence
supporting the amounts and disclosures in the financial statements, assessing the accounting
principles used and significant estimates made by management, and evaluating the overall
financial statement presentation. We believe that our audits, which included confirmation of
securities at December 31, 2015 by correspondence with the custodian and brokers, provide
a reasonable basis for our opinion.
February 25, 2016
REPORT OF INDEPENDENT REGISTERED PUBLIC ACCOUNTING FIRM
22

(This page intentionally left blank.)

Name, Address and AgePosition Held
with FundTerm of Office and
Length of Time Served
NONINTERESTED TRUSTEES
Katherine Smith Dedrick (58)
3333 Warrenville Road,
Suite 500 Lisle, IL 60532
Trustee Trustee since
November, 20041
Gary D. McDaniel (67)3333 Warrenville Road,Suite 500 Lisle, IL 60532
Trustee Trustee sinceApril, 20041
James G. Schmidt (68)3333 Warrenville Road,Suite 500 Lisle, IL 60532
Trustee Trustee sinceDecember, 20031
INTERESTED TRUSTEES
James D. Oberweis (69)3333 Warrenville Road,Suite 500 Lisle, IL 60532
Trustee2 Trustee sinceJuly, 19861
James W. Oberweis (41)3333 Warrenville Road,Suite 500 Lisle, IL 60532
President Officer sinceAugust, 19963
Patrick B. Joyce (56)3333 Warrenville Road,Suite 500 Lisle, IL 60532
Executive Vice Presidentand Treasurer
Officer sinceOctober, 19943
David I. Covas (40)3333 Warrenville Road,Suite 500 Lisle, IL 60532
Vice President Officer sinceAugust, 20043
Kenneth S. Farsalas (45)3333 Warrenville Road,Suite 500 Lisle, IL 60532
Vice President Officer sinceAugust, 20093
Eric V. Hannemann (42)3333 Warrenville Road,Suite 500 Lisle, IL 60532
Secretary Officer sinceAugust, 20053
1 Unless otherwise noted, each trustee shall serve as a trustee of the Fund until the next meeting ofshareholders, if any, called for the purpose of considering the election or re-election of such trustee or of asuccessor to such trustee, and until the election and qualification of his successor, if any, elected at suchmeeting, or until such trustee sooner dies, resigns, retires or is removed.2 James D. Oberweis is an interested trustee of the Fund since he is a shareholder of Oberweis AssetManagement, Inc., the Fund’s investment advisor.3 Elected annually by board of trustees.
The Statement of Additional Information includes additional information about Fund officers and trusteesand is available upon request without charge, by calling the Fund at 1-800-323-6166.
TRUSTEES AND OFFICERS OF THE OBERWEIS FUNDS
24

Principal Occupation Last Five Years
Number ofPortfolios
Overseen byTrustee
OtherDirectorships
President − KDS Law P.C., 2015 to present;
President − KSD Global Consulting, Inc., 2015 to
present; President − Aggressive Publishing, Inc., 2010
to present; Member − Risk Worldwide LLC, 2011 to
present; Partner − Childress Duffy, Ltd., 2007 to 2015.
7 None
Chairman − Star Packaging Corp., 2012 to 2013;Senior Vice President/General Manager of ExopackHolding Corp. 2008 to 2010.
7 None
Senior Vice President and Chief Financial Officer −Federal Heath Sign Co., May 2003 to present.
7 None
Illinois State Senator, January 2013 to present;Chairman − Oberweis Dairy, Inc. December, 1986 topresent. Chairman − Diamond Marketing SolutionsNovember, 2009 to 2013.
7 None
President − Oberweis Asset Management, Inc.,September, 2001 to present; Portfolio Manager fromDecember, 1995 to present; President and Director −Oberweis Securities, Inc., September, 1996 to present.
Not Applicable None
Executive Vice President, Secretary and Director −Oberweis Asset Management, Inc., September, 1994 topresent; Executive Vice President and Director −Oberweis Securities, Inc. September, 1996 to present.
Not Applicable None
Vice President − Oberweis Asset Management, Inc.,September, 2003 to present.
Not Applicable None
Vice President − Oberweis Asset Management, Inc.,November 2004 to present.
Not Applicable None
Vice President of Accounting − Oberweis AssetManagement, Inc. and Oberweis Securities, Inc.,June, 2004 to present.
Not Applicable None
TRUSTEES AND OFFICERS OF THE OBERWEIS FUNDS (continued)
25

Qualified Dividend Income:
For the year ended December 31, 2015, 100.00% of the dividends paid from net investment
income for the Fund are designated as qualified dividend income. For the year ended
December 31, 2014, 100.00% of the dividends paid from net investment income for the Fund
are designated as qualified dividend income.
Proxy Voting:
The Oberweis Funds has delegated authority to vote proxies related to the International
Opportunities Institutional Fund’s portfolio securities to the Funds’ investment adviser,
Oberweis Asset Management, Inc. (‘‘OAM’’). A description of the policies and procedures thatOAM uses in fulfilling this responsibility is available, without charge upon request, by calling800-323-6166. It also appears on oberweisfunds.com and in the Funds’ Statement ofAdditional Information, which can be found on the Securities and Exchange Commission’s(‘‘SEC’’) website at http://www.sec.gov. Information on how the Funds voted proxies relating toportfolio securities during the most recent 12 month period ended June 30 is available(1) without charge, upon request, by calling 800-323-6166, and (2) on the SEC’s website athttp://www.sec.gov.
Availability of Schedules of Portfolio Investments:
The Funds file their complete schedule of portfolio investments with the SEC for the first andthird quarter of each fiscal year (March 31 and September 30) on Form NQ. The Funds’Forms NQ are available, without charge, on the SEC’s website at http://www.sec.gov and maybe reviewed and copied at the SEC’s Public Reference Room in Washington, D.C. Informationon the operation of the Public Reference Room may be obtained by calling 800-SEC-0330.
Approval of Investment Advisory Contract:
The Investment Advisory and Management Agreement between The Oberweis Funds(the ‘‘Trust’’) and Oberweis Asset Management (‘‘OAM’’) with respect to the InternationalOpportunities Institutional Fund (the ‘‘Fund’’) was last approved by the Board of Trustees(the ‘‘Board’’), including all of the trustees who are not parties to such agreements orinterested persons of any such party (the ‘‘independent trustees’’), on August 20, 2015. TheBoard of Trustees, including a majority of the independent trustees, determined that approvalof the agreement was in the best interests of the Fund. The independent trustees wereassisted by legal counsel in making their determination.
The Board noted that OAM has been associated with the Fund since its inception. The Boardrecognized that a long-term relationship with a capable, conscientious investment adviser is inthe best interests of shareholders, and that shareholders have invested in the Fund knowingthat OAM manages the Fund and knowing the investment advisory fee schedule.
Nature, Quality and Extent of Services. With respect to the nature, quality and extent of theservices provided by OAM pursuant to the Investment Advisory and Management Agreement,the Board considered the functions performed by OAM and the personnel providing such
services, information contained in OAM’s Form ADV, OAM’s financial condition and thecompliance reports provided to the Board, and the culture of compliance created by OAM,
including the competency of the chief compliance officer of the Trust and the fact that the Trustand OAM have not had any material compliance issues. The Board also considered the
experience, academic background, long tenure and structure of the portfolio management
OBERWEIS INTERNATIONAL OPPORTUNITIES INSTITUTIONAL FUND
Supplemental Information (Unaudited)
26

team and its role, as well as the honesty and integrity of OAM and the portfolio management
team, and that OAM personnel are open and forthright with the Board. In addition, the Board
considered that OAM is a research-oriented firm that conducts extensive research. Based on
the information provided, the Board concluded that the nature and extent of services provided
to the Fund by OAM was appropriate, and that the quality of such services was good.
The Board also reviewed the reports prepared by OAM containing information on total returns
and average annual total returns of the Fund over various periods of time, as compared to
relevant market indices and other mutual funds pursuing broadly similar strategies. The Board
noted that the peer group mutual funds had been provided by OAM at a previous meeting,
and include funds currently in existence that were similar in investment objective to the Fund.
Based on the information provided, the Board concluded that the Fund in some instancesoutperformed in varying degrees and in some instances performed in line with the othermutual funds in the report and outperformed the relevant market index for the year-to-dateperiod, and that the Fund in some instances outperformed in varying degrees and in otherinstances underperformed in varying degrees the other mutual funds in the report andoutperformed the relevant market index for the one-year and inception-to-date (March 10,2014) periods.
Fees and Expenses. The Board compared the amounts paid to OAM for advisory andmanagement services for the Fund and the Fund’s expense ratio with other mutual fundspursuing broadly similar strategies, as included in the reports prepared by OAM.
This information showed that the advisory and management fees of the Fund was the lowestrelative to the other mutual funds. The information also showed that the expense ratio of theFund was the lowest relative to the other mutual funds. In addition, the Board consideredamounts paid to OAM by other clients. With respect to OAM’s other clients, the Boardrecognized that the mix of services provided and the level of responsibility required under theagreement with the Fund was greater than OAM’s obligations for similar client accounts, andthat the advisory fees of such accounts are less relevant to the Board’s consideration becausethey reflect different competitive forces than those in the mutual fund marketplace. Based onthe information considered, the Board concluded that the Fund’s advisory and managementfees were reasonable and/or appropriate in amount, given the quality of services providedand taking into consideration relevant circumstances.
Profitability. With respect to the costs of services provided and profits realized by OAM, theBoard considered the advisory and management fees received by OAM from the Fund. TheBoard also considered representations from OAM that the profits realized by OAM specificallyfrom the relationship with the Fund could not be identified due to the impracticality of expenseallocation, noting the difficulty of breaking down profitability related to the Fund versus otheradvisory accounts because management and personnel time and services are not allocatedbetween the various types of accounts, and OAM believed that the overall profitability of OAMwas within an acceptable range for investment advisory firms, that the advisory fees chargedthe Fund were consistent with other advisory clients, and that OAM reimburses the Fund if theexpense ratio exceeds certain limits. Based on this information, the Board concluded thatOAM’s profitability was not unreasonable.
Economies of Scale. The Board also considered the extent to which economies of scalewould be realized as the Fund grows, and whether fee levels reflect economies of scale for
the benefit of Fund shareholders. The Board also noted asset capacity constraints for theFund that limits economies of scale. The Board concluded that the Fund’s advisory and
management fees reflect an appropriate recognition of any economies of scale.
OBERWEIS INTERNATIONAL OPPORTUNITIES INSTITUTIONAL FUND
Supplemental Information (Unaudited) (continued)
27

Other Benefits to OAM and Its Affiliates. The Board considered the character and amount of
other incidental benefits received by OAM and its affiliates from their relationship with the
Funds including benefits to OAM related to soft dollars. The Board also noted that during the
past year none of the Fund’s brokerage transactions had been placed through the affiliated
broker-dealer of OAM.
After due consideration of all of the information and factors deemed relevant by the Board and
the conclusions reached, the Board determined to approve the agreement. The Board of
Trustees, including the independent trustees, did not identify any single factor or group of
factors as all-important or controlling, and considered all factors together.
Expense Examples:
As a shareholder of The Oberweis Funds, you may incur two types of costs: (1) transaction
costs, including redemption fees and (2) ongoing costs, including management fees;
distribution (and/or service) 12b-1 fees; and other Fund expenses. This example is intended to
help you understand your ongoing costs (in dollars) of investing in The Oberweis Funds and to
compare these costs with the ongoing costs of investing in other mutual funds.
The Example is based on an investment of $1,000 investment at the beginning of the period
and held for the entire period.
Actual Expenses:
The first line for each Fund in the table below provides information about actual account
values and actual expenses. You may use the information below; together with the amount
you invested, to estimate the expenses that you paid over the period. Simply divide your
account value by $1,000 (for example, an $8,600 account value divided by $1,000=8.6), then
multiply the result by the number in the table under the heading entitled ‘‘Expenses Paid
During Period’’ to estimate the expenses you paid on your account during this period.
OBERWEIS INTERNATIONAL OPPORTUNITIES INSTITUTIONAL FUND
Supplemental Information (Unaudited) (continued)
28

Hypothetical Example for Comparison Purposes:
The second line for each Fund in the table below provides information about hypothetical
account values and hypothetical expenses based on each Fund’s actual expense ratio and an
assumed rate of return of 5% per year before expenses, which is not the Fund’s actual return.
The hypothetical account values and expenses may not be used to estimate the actual ending
account balance or expenses you paid for the period. You may use this information to
compare this 5% hypothetical example with the 5% hypothetical examples that appear in the
shareholder reports of other funds.
Please note that the expenses shown in the table are meant to highlight your ongoing costs
only and do not reflect any transactional costs, such as redemption fees. Therefore, thesecond line for each Fund in the table is useful in comparing ongoing costs only, and will nothelp you determine the relative total costs of owning different funds. In addition, if thesetransactional costs were included, your costs would have been higher.
BeginningAccount
Value7/1/15
EndingAccount
Value12/31/15
ExpensePaid
DuringPeriod*7/1/15–
12/31/15
ExpenseRatio
DuringPeriod
7/1/15–12/31/15
Actual . . . . . . . . . . . . . . . . . . . . . . . . . . . . $1,000.00 $1,026.40 $5.62 1.10%Hypothetical
(5% return before expenses) . . . . . . . . $1,000.00 $ 1,019.66 $5.60 1.10%
* Expenses are equal to the average account value times the Fund’s annualized expense ratio multiplied by the
number of days in the most recent fiscal half-year divided by the number of days in the fiscal year.
OBERWEIS INTERNATIONAL OPPORTUNITIES INSTITUTIONAL FUND
Supplemental Information (Unaudited) (continued)
29

Trustees and Officers
James D. OberweisTrustee
Gary D. McDanielTrustee
James W. OberweisPresident
David I. CovasVice President
Kenneth S. FarsalasVice President
Katherine Smith DedrickTrustee
James G. SchmidtTrustee
Patrick B. JoyceExecutive Vice PresidentTreasurer
Eric V. HannemannSecretary
Manager and Investment AdvisorOberweis Asset Management, Inc.3333 Warrenville Road, Suite 500, Lisle, IL 60532800-323-6166oberweisfunds.com
DistributorOberweis Securities, Inc.3333 Warrenville Road, Suite 500, Lisle, IL 60532630-577-2300oberweisfunds.com
CustodianUMB Bank, n.a.928 Grand Blvd., Kansas City, MO 64106
Transfer AgentUMB Fund Services, Inc.P.O. Box 711 Milwaukee, WI 53201-0711800-245-7311
CounselVedder Price P.C.222 North LaSalle Street, Chicago, IL 60601
Independent Registered Public Accounting FirmPricewaterhouseCoopers LLPOne North Wacker Drive, Chicago, IL 60606
International Opportunities Institutional Fund
800-245-7311oberweisfunds.com

oberweisfunds.com
800-323-6166
630-577-2300
Shareholder Services
800-245-7311
3333 Warrenville Road
Suite 500
Lisle, IL 60532