vicksburg formation - geodigital info · vicksburg formation - lower rio grande valley . south...
TRANSCRIPT
South Texasof
Vicksburg Formation
Vicksburg Formation - Lower Rio Grande Valley South Texas
Overview
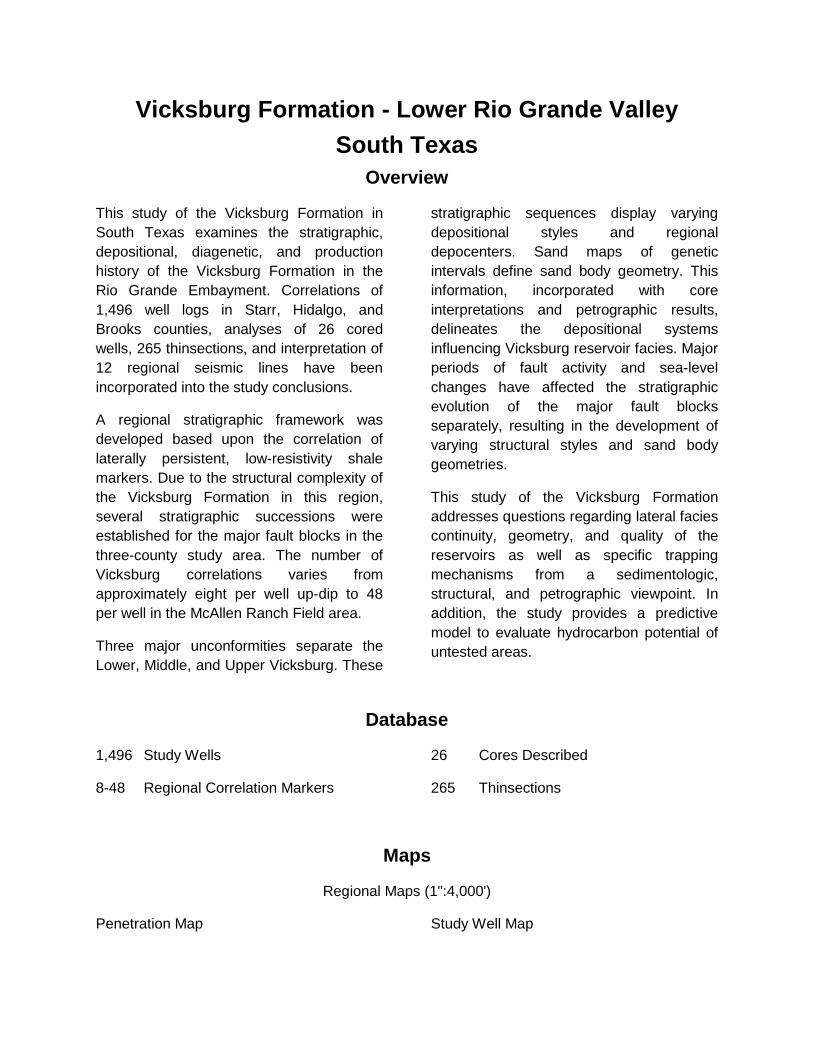
This study of the Vicksburg Formation in South Texas examines the stratigraphic, depositional, diagenetic, and production history of the Vicksburg Formation in the Rio Grande Embayment. Correlations of 1,496 well logs in Starr, Hidalgo, and Brooks counties, analyses of 26 cored wells, 265 thinsections, and interpretation of 12 regional seismic lines have been incorporated into the study conclusions.
A regional stratigraphic framework was developed based upon the correlation of laterally persistent, low-resistivity shale markers. Due to the structural complexity of the Vicksburg Formation in this region, several stratigraphic successions were established for the major fault blocks in the three-county study area. The number of Vicksburg correlations varies from approximately eight per well up-dip to 48 per well in the McAllen Ranch Field area.
Three major unconformities separate the Lower, Middle, and Upper Vicksburg. These
stratigraphic sequences display varying depositional styles and regional depocenters. Sand maps of genetic intervals define sand body geometry. This information, incorporated with core interpretations and petrographic results, delineates the depositional systems influencing Vicksburg reservoir facies. Major periods of fault activity and sea-level changes have affected the stratigraphic evolution of the major fault blocks separately, resulting in the development of varying structural styles and sand body geometries.
This study of the Vicksburg Formation addresses questions regarding lateral facies continuity, geometry, and quality of the reservoirs as well as specific trapping mechanisms from a sedimentologic, structural, and petrographic viewpoint. In addition, the study provides a predictive model to evaluate hydrocarbon potential of untested areas.
Database
1,496 Study Wells
8-48 Regional Correlation Markers
26 Cores Described
265 Thinsections
Maps
Regional Maps (1":4,000')
Penetration Map Study Well Map

Subregional Maps (1":4,000')
Starr/Brooks counties area
6 Net Sand Maps
4 Isopach Maps
2 Structure Maps
Javelina-McAllen area
4 Net Sand Maps
4 Isopach Maps
2 Study Well Reference Map Overlays
1 Structure Map
Frio Expansion area
16 Net Sand Maps
16 Isopach Maps
8 Percent Sand Maps
2 Structure Maps
Cross Sections
Regional Depositional-dip Sections
16 Subregional Cross Sections
Siesmic Data
12 Regional Seismic Lines Incorporated
Type Logs
Starr/Brooks counties area, Javelina-McAllen area, Frio Expansion area
Report Contents
TEXT AND FIGURES - This fully-illustrated report includes discussions, figures, and color plates on such topics as: Regional Synthesis, Structural History, Depositional Systems, Stratigraphy, Exploration Models, Production Trends, Exploration Fairways, and Bibliography. It also includes structural interpretations, stratigraphic interpretations,
and synthesis for each of the three subdivisions of the study area: Starr/Brooks counties area, Javelina-McAllen area, and Frio Expansion area.
CORE DESCRIPTIONS - This section contains graphic descriptions of 26 cores and petrographic data.

STRATIGRAPHIC DATA - This digital database lists all the markers correlated for each log as well as the isopach thickness, net sand, and percent sand for every interval between correlated markers for the 1,496 wells used in the study. These data are intended to permit explorationists the opportunity to transfer study results onto their own maps or logs. This information is
referenced by well name, operator, and API number.
MAPS AND CROSS SECTIONS - These sections contain: maps of the entire study area, subregional maps, regional cross sections, subregional cross sections, "stick" sections, and other miscellaneous information. Cross sections include regional and subregional seismic lines.

Vicksburg Formationof South Texas
MEXICO
STARR
HIDALGO
BROOKS
JIM HOGG
McAllen
La Grulla
Rincon
SanManuel
Encino
RioGrandeCity
WILLACY
KENEDYAgua Nueva
Study Boundary
MILES
100 N
R 11 ET24S
R 16 ET24S
R 16 E
T32S
T32S
R 11 E

StudyTable of Contents
Vicksburg Formationof South Texas

TABLE OF CONTENTS
PREFACE
Table of Contents ………………………………………………………………..……… ii
List of Figures ………………………………………………………………….………… viii
List of Tables …………………………………………………………………….………. xv
List of Maps and Cross Sections ………………………………………………..…….. xvi
Acknowledgements ……………………………………….…………………………….. xix
EXECUTIVE SUMMARY EXECUTIVE SUMMARY ………………………………………………………………………. E-1
CHAPTER 1 INTRODUCTION ………………………………………………………….……………..……… 1-1
Statement of the Problem ………………………………………………………..…….. 1-2
Objectives …………………………………………………………………………..……. 1-3
Study Area ………………………………………………………………………..……… 1-3
General Structural Setting ………………………………………………………..…….. 1-4
Structural Setting of the Vicksburg ……………………………………………. 1-4
Growth Fault Mechanics ……………………………………….……… 1-5
Growth Faults and Deltaic Depocenters ……………………….……. 1-7
Database/Methodology ………………………………………………………...……….. 1-8
Description of GDI Stratigraphic Markers ……………………………………. 1-9
Definition of "Sand" on Electric Logs ………………………………………… 1-9
Data Entry ……………………………………………………………….………. 1-11
Regional Maps …………………………………………………………….……. 1-11
Core Descriptions ………………………………………………………..…….. 1-12
Other Analytic Methods ……………………………………………….……….. 1-12
Age and Biostratigraphic Zonation ……………………………………………………. 1-12
Organization of the Report …………………………………………………………….. 1-13
Data Acknowledgments ……………….………………………………..…..………….. 1-14
ii

CHAPTER 2 REGIONAL SYNTHESIS ……………………………………………………………..………… 2-1
Structural History …………………………………………………………….………….. 2-2
Regional Cross Sections ………………………………………………………. 2-2
Major Periods of Growth ……………………………………………………….. 2-4
Modern Analogs …………………………………………………….………….. 2-5
Depositional Systems ………………………………………………………..…………. 2-6
Previous Interpretations ……………………………………………………….. 2-6
Deep Water Facies ……………………………………….…………… 2-7
Deltaic Facies ……………………………………………..…………… 2-7
Significant Observations ……………………………………………………………….. 2-9
Regional Setting …………………………………………………….………….. 2-9
Gross Sediment Distribution ………………………………………………….. 2-10
General Log Patterns ………………………………………………….………. 2-11
Features Observed in Cores ………………………………………..………… 2-12
Vicksburg Core Facies ………………………………………………..……….. 2-14
Delta Plain ……………………………………………………………… 2-14
Channel …………………………………………………………………. 2-15
Upper Delta Front …………………………………………….……….. 2-15
Lower Delta Front ……………………………………………………… 2-15
Upper Distal Delta Front ……………………………………………… 2-16
Lower Distal Delta Front ………………………………………………. 2-17
Marine Mudstones ………………………………………….…………. 2-17
Depositional Model …………………………………………………………..…………. 2-17
Deltaic Spectrum …………………………………………………….…………. 2-17
Models That Do Not Work ………………………………………….…………. 2-18
Deep Water …………………………………………………..………… 2-18
Wave-Influenced Deltas ………………………………………………..2-18
Vicksburg Delta Models ……………………………………………………....………… 2-19
Fan Deltas ………………………………………………………….……………. 2-19
Characteristics ………………………………………………………….. 2-19
Modifications ……………………………………………………………. 2-21
Fluvial Deltas …………………………………………………………… 2-22
Stratigraphic Development ………………………………………………….…………. 2-23
iii
CHAPTER 3 STARR/BROOKS COUNTIES AREA ………………………………………….……..………. 3-1
Introduction …………………………………………………………………..………….. 3-2
Extent of Subregion ……………………………………………………………. 3-2
Major Structural Elements ……………………………………….……………. 3-2
Paleontology ……………………………………………………….…………… 3-3
Stratigraphic Units …………………………………………………..………….. 3-3
Mappable Units ……………………………………………………..………….. 3-4
Structural Interpretations ……………………………………………………………….. 3-4
Interval Interpretations …………………………………………………..……………… 3-6
Upper Vicksburg Depositional Systems ……………………….…………….. 3-6
V257-V317 Interval ……………………………………………………. 3-7
V237-V257 Interval ……………………………………………………. 3-8
V167-V237 Interval ……………………………………………………. 3-8
V127-V167 Interval ……………………………………….…………… 3-9
V077-V127 Interval ……………………………………………………. 3-10
V077-V177 Interval: Brooks and Northern Starr Counties ………… 3-10
Petrography …………………………………………………………………..…………. 3-11
Synthesis …………………………………………………………………………………. 3-12
Major Observed Features ……………………………………………………… 3-12
Structural History …………………………………………………..…………… 3-12
Depositional History ……………………………………………….…………… 3-13
Trapping Mechanisms ………………………………………………………….. 3-13
Structural Traps …………………………………………….………….. 3-13
Stratigraphic Traps ……………………………………………………. 3-14
CHAPTER 4 "MCALLEN-JAVELINA" AREA ………………………………………………………….……… 4-1
Introduction …………………………………………………………………….………… 4-2
Major Stratigraphic Subdivisions …………………………………….……….. 4-3
Structural Interpretations ……………………………………………………..………… 4-6
Stratigraphic Interpretations ……………………………………………………………. 4-6
McAllen Stratigraphy ……….………………………………………..………… 4-7
Lower Vicksburg - South McAllen Field ………………………………4-8
iv
V761-V771 Interval …………………………………….……… 4-8
Middle Vicksburg - South McAllen Field ……………….……………. 4-9
V511-V531 Interval ………………………………..………….. 4-9
V481-V511 Interval ……………………….………..………… 4-10
Middle Vicksburg - North McAllen Field …………………………….. 4-10
V451-V461 Interval ………………………………..………….. 4-10
Middle Vicksburg - North and South McAllen Fields ………………. 4-11
V301-V361 Interval ……………………………………………. 4-11
Upper Vicksburg - North and South McAllen and Lips Fields ….…. 4-12
V211-V241 Interval ………………………………….………… 4-12
Javelina Stratigraphy …………………………………………….…………….. 4-12
Lower Vicksburg - Javelina Area …………………………………….. 4-13
V742-V762 Interval ……………………………..……………. 4-13
V872-V892 Interval ……………………………..…………….. 4-13
Middle Vicksburg - Javelina Area ………………………..…………… 4-14
V492-V512 Interval ……………………………..…………….. 4-14
V392-V422 Interval ………………………………….………… 4-15
Petrography ………………………………………………….…………. 4-15
Synthesis …………………………………………………………………….…..………. 4-17
CHAPTER 5 "FRIO EXPANSION" AREA …………………………………………………………………….. 5-1
Introduction ………………………………………………………………………………. 5-2
Structural Interpretation ………………………………………………………………… 5-3
Stratigraphic Interpretation ………………………………………………...…………… 5-5
Monte Christo Field …………………………………………………..………… 5-5
Interval Descriptions …………………………………………………… 5-6
V334-V354, V324-V334, and V304-V324 intervals ……….. 5-6
V204-V224 Interval ………………………………………..….. 5-9
V104-V204 Interval …………………………………….……… 5-9
Petrography ……………………………………………………….……. 5-10
Tabasco Field …………………………………………………………..………. 5-12
Interval Descriptions …………………………………………………… 5-12
V554-V604, V534-V554, and V504-V534 Intervals ……..… 5-12
v

V464-V504, V424-V464 Intervals ……………………..……. 5-13
V424-V444, V404-V424 Intervals ………………………....… 5-14
V354-V404, V304-V354, and V204-V304 Intervals …..…… 5-15
V104-V204 Interval ……………………………………….…… 5-15
Synthesis …………………………………………………………………………………. 5-16
CHAPTER 6 EXPLORATION MODELS ………………………………………………………………………. 6-1
Production Trends ………………………………………………………………..…….. 6-2
Petrographic Analysis and Regional Trends ………………………..……….. 6-2
Sampling and Methods ……………………………………...………… 6-2
Detrital Minerals and their Alteration ……………………….………… 6-3
Quartz ……………………………………………….…………. 6-3
Feldspar …………………………………………….………….. 6-4
Rock Fragments ……………………………………………….. 6-5
Matrix ………….………………………………………………………… 6-5
Compaction …………………………………………….………………. 6-5
Pore Filling Authigenic Phases ……………………….……………… 6-6
Carbonates …………………………………….………………. 6-6
Chlorite …………………………………………..…………….. 6-7
Quartz …………………………………………..………………. 6-7
Albite ……………………………………………………………. 6-7
Laumontite ……………………………………….…………….. 6-8
Minor Pore Filling Phases ……………………..…………….. 6-8
Sequence of Diagenetic Events ………………………..…………….. 6-8
Porosity …………………………………………………….……………. 6-9
Reservoir Quality ……………………………………….……………… 6-10
Area Trends …………………………………………….……………… 6-10
Potential Formation Damage ………………………………….………………. 6-11
Porosity/Diagenetic Trends ……………………………………..…………….. 6-12
Area ……………………………………………………………………… 6-12
Environment …………………………………………………………….. 6-13
Diagenesis and Porosity ……………………………..……………….. 6-13
Exploration Fairways ……………………………………………………………………. 6-14
vi

Trapping Mechanisms …………………………………………..……………… 6-15
Structural ……………………………………………….……………….. 6-15
Stratigraphic …………………………………………….………………. 6-15
Porosity Distribution …………………..………………………..………………. 6-18
BIBLIOGRAPHY BIBLIOGRAPHY ………………………………………………………………………………… B-1
APPENDICES (Separate Files)
Cores Descriptions
Starr/Brooks Counties
McAllen-Javelina Area
Frio Expansion Area
Petrographic Descriptions
Maps and Cross Sections
Database
vii

LIST OF FIGURES
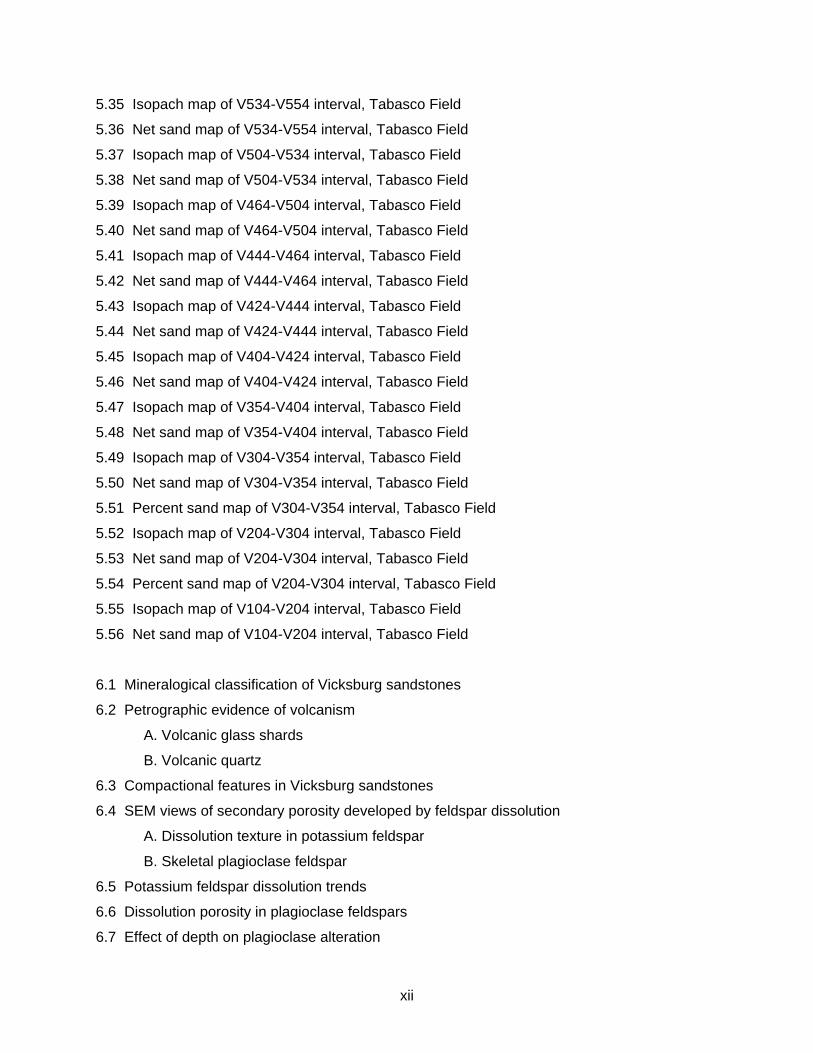
E.1 Three stratigraphic subdivisions of the study area
E.2 Regional cross sections
E.3 Subregional cross sections
1.1 Structural setting of Vicksburg depocenter
1.2 Vicksburg/Eocene contact relationships
1.3 General setting of study area
1.4 Location of subdivisions of study area
1.5 Cretaceous/Tertiary shelf margins, western Gulf Coast
1.6 Regional cross section based on seismic interpretation
1.7 Seismic line through Slick Ranch Field
1.8 Effect of varying boundary conditions on rollover geometry
1.9 Effect of varying slide velocity profiles on rollover geometry
1.10 Calculated syndepositional rollover structures
1.11 Relationships of depositional and subsidence rates on deltaic depocenter development
1.12 Location of regional cross sections
1.13 Location of subregional cross sections
1.14 Plot of KB elevations
1.15 Major Cenozoic stratigraphic units of the Texas Gulf Coast
1.16 Comparison of interpretations of foraminiferal zones
2.1 Location of Vicksburg regional structural cross sections
2.2 Development of a residual shale mass
2.3 Synsedimentary fault types
2.4 Simple and complex diapiric growth faults
2.5 Seismic dip section across a Niger Delta
2.6 South Texas Vicksburg structural styles
2.7 Lower Vicksburg depositional environments
2.8 Vicksburg net sand maps
2.9 Depositional models for Lower, Middle and Upper Vicksburg in South Texas
2.10 Strike-elongate sand trends
2.11 Reciprocal sedimentation
viii

2.12 Graphic core description of the Shell, Woods Christian #6
2.13. Graphic core description of Superior, F.I. Johnson #20
2.14A. Core photograph of Superior, F.I. Johnson #20; core depth 9,579.4
B. Core photograph of ARCO, Woods, C.T. #2; core depth 11,030
2.15 Graphic core description of Shell, Davis #9
2.16A. Core photograph of Forest, McAllen #12; core depth 13,455.3
B. Core photograph of ARCO, Bell, E.R. #1; core depth 10,571
2.17 Graphic core description of Forest, McAllen #12
2.18 Graphic core description of Shell, Woods Christian #6
2.19A. Core photograph of Superior, F.I. Johnson #51; core depth 8,006
B. Core photograph of Shell, McAllen #18; core depth 11,791
2.20A. Core photograph of ARCO, Lysinger #1; core depth 10,424
B. Core photograph of ARCO, Bell, E.R. #1; core depth 10,256
2.21A. Core photograph of ARCO, Bell, E.R. #1; core depth 10,284
B. Core photograph of ARCO, Bell, E.R. #1; core depth 10,216
2.22A. Core photograph of Superior, F.I. Johnson #51; core depth 7,988
B. Core photograph of Shell, Woods Christian #4; core depth 10,811
2.23A. Core photograph of ARCO, Page, R. #3; core depth 7,281
B. Core photograph of ARCO, Woods, C.T. #2; core depth 11,022
2.24 Factors influencing deltaic sedimentation
2.25 High-constructive and high-destructive delta types
2.26 Process classification of modern deltas
2.27 Comparison of delta classifications
2.28 South Texas Vicksburg depositional systems
2.29 Vicksburg fan delta facies
2.30 Effect of growth fault subsidence rates on deltation
A. Rapid movement along growth faults
B. Reduced rates of movement on a fault
2.31 Net sand distribution and facies relationships of "bar-finger" sands
2.32 Log facies cross sections
2.33 Spectrum of deltaic characteristics
2.34 Factors favoring the development of elongate deltaic lobes
2.35 Explanation of symbols for schematic stratigraphic development of the Vicksburg
2.36 Schematic view of the Vicksburg study area
ix

2.37 Phase 1 - Lower Vicksburg
2.38 Phase 2 - Lower Vicksburg
2.39 Phase 3 - Lower Middle Vicksburg
2.40 Phase 4 - Middle Vicksburg
2.41 Phase 5 - middle Upper Vicksburg
2.42 Phase 6 - Upper Vicksburg
2.43 Phase 7 - Vicksburg-Frio unconformity
3.1 Location of the Starr/Brooks subarea
3.2 Location of Humble, Skipper #12 in Brooks County
3.3 Occurrence of Vicksburg-Frio unconformity in Starr/Brooks Counties
3.4 Middle Vicksburg unconformity in Starr/Brooks Counties
3.5 Starr and Brooks Counties type logs
3.6 Extent of Lower and Middle Vicksburg correlations in Starr/Brooks Counties
3.7 Major gas producing fields in Starr and Brooks Counties
3.8 Upper Vicksburg fluvial-deltaic axes
4.1 Areal extent of McAllen-Javelina Area
4.2 Location of McAllen-Javelina major gas fields
4.3 Areal extent of stratigraphic sequences for the McAllen-Javelina Area
4.4 Distribution of McAllen-Javelina Area type logs
4.5 Distribution of McAllen-Javelina Area cores
4.6 North McAllen Dip Stick Section
4.7 A-F Location of major axes for mapped intervals in the McAllen Area
4.8 A-G Location of major axes for mapped intervals in Javelina Area
4.9 Location of McAllen and Javelina map areas
4.10 Core description of Forest, McAllen #14; core depth 13,621-13.679
4.11 Core description of Forest, McAllen #12; core depth 13,455-13,514
4.12 Core description of Shell, Woods Christian #7; core depth 10,827-10,875.5
4.13 Core description of Shell, Woods Christian #6; core depth 10,826-10,876
4.14 Core description of Shell, Woods Christian #6; core depth 10,722-10,770
4.15 Core description of Shell, Woods Christian #6; core depth 9,670-9,719.5
4.16 Unconformity trapping mechanisms for the McAllen-Javelina Area
x

5.1 Areal extent and major structural elements of Frio Expansion Area
5.2 Oil and gas fields, Frio Expansion Area
5.3 Location and extent of stratigraphic sequences and type logs for Frio Expansion Area
5.4 Structure map on top of V104 in Monte Christo Field
5.5 Structure map on top of V104 in Tabasco Field
5.6 Location of Monte Christo Field Area
5.7 Distribution of cores, Monte Christo and Tabasco Fields
5.8 Key to interval map symbols
5.9 Isopach map of V334-V354 interval, Monte Christo Field
5.10 Net sand map of V334-V354 interval, Monte Christo Field
5.11 Percent sand map of V334-V354 interval, Monte Christo Field
5.12 Isopach map of V324-V334 interval, Monte Christo Field
5.13 Net sand map of V324-V334 interval, Monte Christo Field
5.14 Percent sand map of V324-V334 interval, Monte Christo Field
5.15 Isopach map of V304-V324 interval, Monte Christo field
5.16 Net sand map of V304-V324 interval, Monte Christo field
5.17 Percent sand map of V304-V324 interval, Monte Christo Field
5.18 Location of Monte Christo Field cross sections
5.19 Dip section 1-1' Monte Christo Field
5.20 Dip section 2-2' Monte Christo Field
5.21 Strike section 11-11' Monte Christo Field
5.22 Strike section 12-12' Monte Christo Field
5.23 Isopach map of V204-V224 interval, Monte Christo Field
5.24 Net sand map of V204-V224 interval, Monte Christo Field
5.25 Percent sand map of V204-V224 interval, Monte Christo Field
5.26 Isopach map of V104-V204 interval, Monte Christo Field
5.27 Net sand map of V104-V204 interval, Monte Christo Field
5.28 Percent sand map of V104-V204 interval, Monte Christo Field
5.29 Location of Tabasco Field map area
5.30 Isopach map of V554-V604 interval, Tabasco Field
5.31 Net sand map of V554-V604 interval, Tabasco Field
5.32 Percent sand map of V554-V604 interval, Tabasco Field
5.33 Location of dip section I-I'
5.34 Dip section 1-1', Tabasco Field
xi
5.35 Isopach map of V534-V554 interval, Tabasco Field
5.36 Net sand map of V534-V554 interval, Tabasco Field
5.37 Isopach map of V504-V534 interval, Tabasco Field
5.38 Net sand map of V504-V534 interval, Tabasco Field
5.39 Isopach map of V464-V504 interval, Tabasco Field
5.40 Net sand map of V464-V504 interval, Tabasco Field
5.41 Isopach map of V444-V464 interval, Tabasco Field
5.42 Net sand map of V444-V464 interval, Tabasco Field
5.43 Isopach map of V424-V444 interval, Tabasco Field
5.44 Net sand map of V424-V444 interval, Tabasco Field
5.45 Isopach map of V404-V424 interval, Tabasco Field
5.46 Net sand map of V404-V424 interval, Tabasco Field
5.47 Isopach map of V354-V404 interval, Tabasco Field
5.48 Net sand map of V354-V404 interval, Tabasco Field
5.49 Isopach map of V304-V354 interval, Tabasco Field
5.50 Net sand map of V304-V354 interval, Tabasco Field
5.51 Percent sand map of V304-V354 interval, Tabasco Field
5.52 Isopach map of V204-V304 interval, Tabasco Field
5.53 Net sand map of V204-V304 interval, Tabasco Field
5.54 Percent sand map of V204-V304 interval, Tabasco Field
5.55 Isopach map of V104-V204 interval, Tabasco Field
5.56 Net sand map of V104-V204 interval, Tabasco Field
6.1 Mineralogical classification of Vicksburg sandstones
6.2 Petrographic evidence of volcanism
A. Volcanic glass shards
B. Volcanic quartz
6.3 Compactional features in Vicksburg sandstones
6.4 SEM views of secondary porosity developed by feldspar dissolution
A. Dissolution texture in potassium feldspar
B. Skeletal plagioclase feldspar
6.5 Potassium feldspar dissolution trends
6.6 Dissolution porosity in plagioclase feldspars
6.7 Effect of depth on plagioclase alteration
xii
6.8 Volcanic-carbonate-other rock fragment ratios in Vicksburg sandstones
6.9 Compactional porosity loss
6.10 Total cement-depth trend in Vicksburg sandstones
6.11 Calcite cement
6.12 Pore lining, Platy chlorite, Close-up of chlorite-lined pore
6.13 SEM views of reservoir sandstones showing inhibition of quartz overgrowths by chlorite
coatings and porosity preserved by dissolution of carbonates
6.14 SEM views of pore throat blocking by platy chlorite
6.15 Chlorite-depth trend in Vicksburg sandstones
6.16 Thin sections of chlorite content variability
6.17 Thin sections of quartz and albite overgrowths
6.18 Quartz and albite overgrowths in reservoir sandstones; Monte Christo Field
6.19 Quartz cement/depth trend in Vicksburg sandstones
6.20 SEM views of albite overgrowths
6.21 Depth/stratigraphic relationships of petrographic samples
6.22 Laumontite/depth relationships in Vicksburg sandstones
6.23 Thin sections of laumontite cement
6.24 SEM views of:
A) Quartz overgrowths and chlorite rims and
B) Typical pipe organ laumontite fabric
6.25 SEM views of:
A) Authigenic sphene and
B) Elite coatings in secondary pores
6.26 Thin sections showing relative timing of quartz overgrowths
6.27 SEM views of calcite pore filling
6.28 Thin sections showing:
A) Chlorite rim and dissolution of potassium feldspar and
B) Large secondary pore formed by dissolution of a framework grain
6.29 Contrasting views of dissolution timing relative to compaction
6.30 Views of relative timing of dissolution
6.31 Laumontite and ferroan calcite cements in poor quality reservoir set of sandstone
6.32 Diagenetic events
6.33 Secondary porosity in typical Vicksburg reservoirs
6.34 Porosity versus depth
xiii
6.35 Two thin sections showing similar porosity but different reservoir quality
A. Typical reservoir from Monte Christo Field with clean interconnected porosity
B. Typical reservoirs from McAllen Ranch Field with patchy clean porosity and
microporosity
6.36 Reservoir quality trends
6.37 Quartz-feldspar-rock fragment ratios in the various areas of the Vicksburg samples
6.38 Framework-matrix-cement-porosity ratios in Vicksburg sandstones
6.39 Matrix-porosity area trends
6.40 Oil and gas occurrences Cenozoic Niger Delta Complex
6.41 Unconformity trap, Starr/Brooks Counties
6.42 Unconformity traps, McAllen-Javelina Area
6.43 Structural and stratigraphic traps, Frio Expansion Area
6.44 Matrix-porosity-cement ratios
6.45 Matrix and cement-porosity-framework ratios
6.46 Matrix and porosity variations
xiv

LIST OF TABLES
1.1 Correlation diagram showing GDI stratigraphic codes and subregional ties
1.2 Synopsis of previous studies of the Vicksburg in South Texas
2.1 Fan delta references
2.2 Sequence of depositional events
3.1 Star Brooks Counties stratigraphy
3.2 History of fault movement in Upper Vicksburg
4.1 McAllen-Javelina Area fields' cumulative gas production
4.2 McAllen-Javelina Area stratigraphy
4.3 Vicksburg cored intervals in the McAllen-Javelina Area
4.4 Stratigraphic evolution summary of McAllen-Javelina Area
5.1 Number codes for "Frio Expansion" Area stratigraphy
5.2 Characteristics of Monte Christo Field stratigraphic intervals
5.3 Characteristics of Tabasco Field stratigraphic intervals
5.4 Comparison of depositional features - Tabasco & Monte Christo Fields
6.1 Cumulative production from Vicksburg oil and gas fields
6.2 Vicksburg field mean petrographic values
6.3 McAllen Ranch Fault mean petrographic values by environment
xv

LIST OF MAPS AND CROSS SECTIONS
Study Area Maps Penetration East Half West Half Study Well Reference East Half West Half
"Starr/Brooks Counties" Maps, V077 - V127 Net Sand V077 - V127 Isopach V077 - V177 Net Sand V077 - V177 Isopach V127 - V167 Net Sand V167 - V237 Net Sand V237 - V257 Net Sand V237 - V257 Isopach V257-V317 Net Sand V257-V317 Isopach V077 Structure V317 Structure
"McAllen-Javelina" Area Maps, Lower Vicksburg Lower Vicksburg V761-V771, V872-V892, V761-V771, V872-V892, V742-V762 Net Sand V742-V762 Isopach Middle Vicksburg Middle Vicksburg V301-V361, V392-V422 Net Sand V301-V361, V392-V422 Isopach Middle Vicksburg Middle Vicksburg V511-V531, V451-V461, V511-V531, V451-V461, V492-V512 Net Sand V492-V512 Isopach Upper Vicksburg Upper Vicksburg V211-V241 Net Sand V211-V241 Isopach Overlay Map Study Well Reference Map V301 Structure Map
xvi

"Frio Expansion" Area
Regional Cross Sections North Sun/Sal Del Rey Dip Part 1
Part 2 Part 3
Rincon/Monte Christo Dip Part 1
Part 2 Part 3
Stick Sections Garcia/Alta Mesa Strike Part 1
Part 2 Part 3 Part 4 Part 5
Javelina/McCook Structural Dip North McAllen Structural Dip North Rincon Structural Dip South McAllen Structural Dip Rincon/Jeffress Structural Dip
"Starr/Brooks Counties" Cross Sections Rincon Dip Part 1
Part 2 North Rincon Dip Part 1
Part 2 Part 3
North Sun Dip Part 1
Part 2 Part 3
Alta Mesa/Lips Dip Part 1
Part 2 Rincon/Jeffress Dip Part 1
Part 2
xvii

"McAllen-Javelina" Area Cross Sections South McAllen Strike Upper Half
Lower Half North McAllen Dip Upper Half
Lower Half South McAllen Dip Part 1 - Upper Half
Lower Half Part 2 - Upper Half
Lower Half Javelina/McCook Dip Part 1 - Upper Half
Lower Half Part 2 - Upper Half
Lower Half Flores/Javelina Strike Part 1 - Upper Half
Lower Half Part 2 - Upper Half
Lower Half Javelina/McAllen Strike Part 1
Part 2 McAllen/Lips Strike Part 1
Part 2
"Frio Expansion" Area Cross Sections Frio Expansion Strike Part 1
Part 2 Part 3
Monte Christo Dip Upper Half Lower Half
Sal Del Rey Dip Part 1
Part 2 Tabasco Dip Part 1
Part 2
Type Logs
Frio Expansion Area Type Logs
McAllen Javelina Area Type Logs
Starr Brooks Counties Type Logs
xviii

Selected Figuresfrom the Study
Vicksburg Formationof South Texas
Return to Text
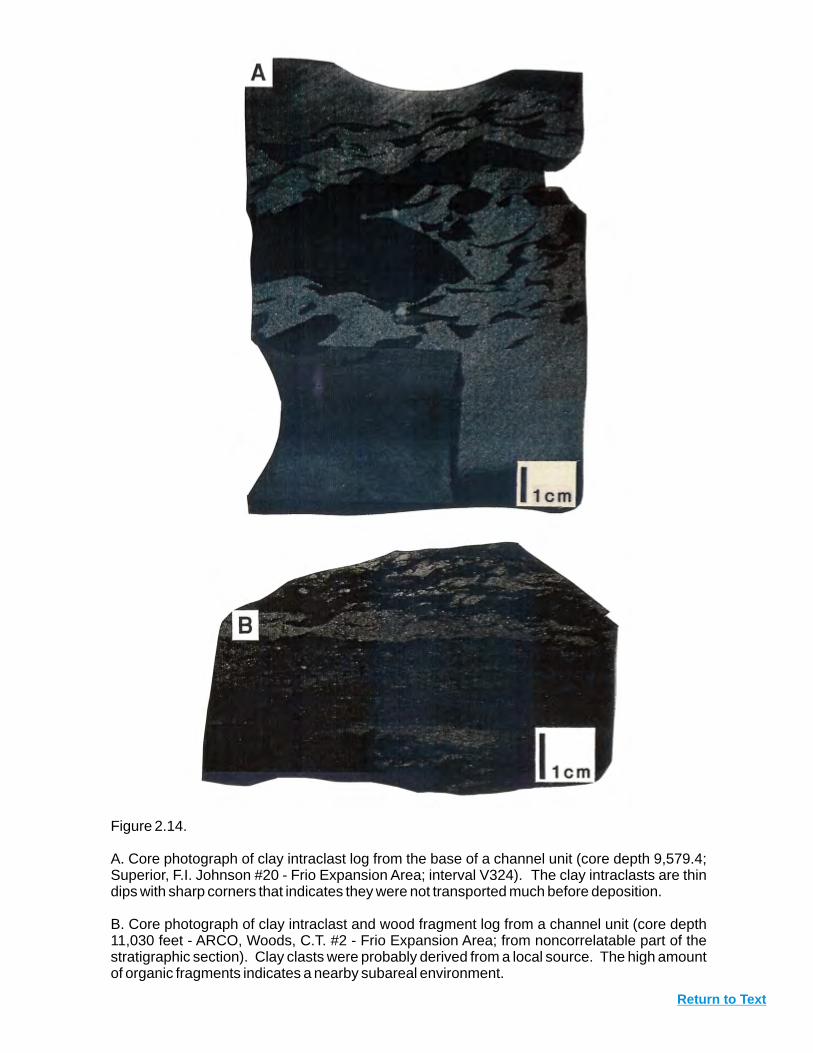
Figure 2.14.
A. Core photograph of clay intraclast log from the base of a channel unit (core depth 9,579.4; Superior, F.I. Johnson #20 - Frio Expansion Area; interval V324). The clay intraclasts are thin dips with sharp corners that indicates they were not transported much before deposition.
B. Core photograph of clay intraclast and wood fragment log from a channel unit (core depth 11,030 feet - ARCO, Woods, C.T. #2 - Frio Expansion Area; from noncorrelatable part of the stratigraphic section). Clay clasts were probably derived from a local source. The high amount of organic fragments indicates a nearby subareal environment.

Figure 2.28. South Texas Vicksburg depositional systems. Major fluvial feeder system is structurally
confined to axis of an aulacogen. This system is then spread basinward at an apex forming a broad low-
relief alluvial fan. Braided channels on the proximal fan shift loci forming a series of overlapping broad
fan lobes. Position of active lobes affects sites of deposition along the fan margin. Active portions of the
fan margin are potential areas for fan delta systems. Fan delta deposits stack and aggrade on the
downthrown sides of syndepositional growth faults.
Return to Text
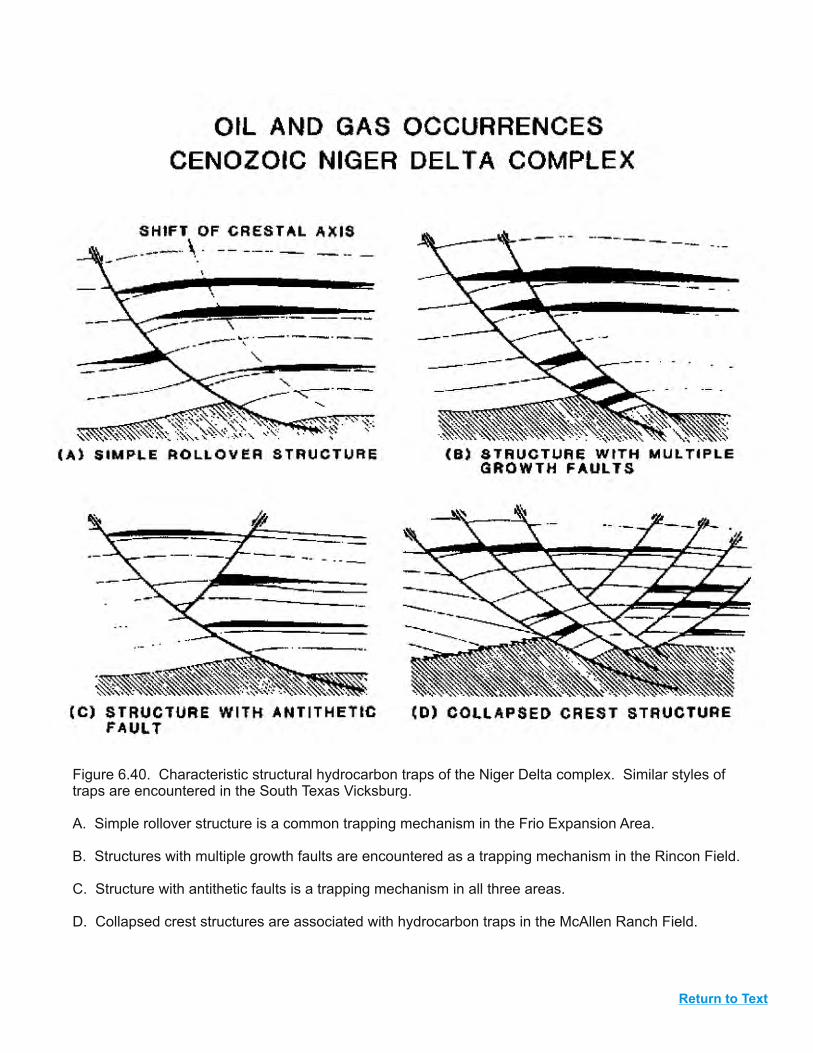
Figure 6.40. Characteristic structural hydrocarbon traps of the Niger Delta complex. Similar styles of traps are encountered in the South Texas Vicksburg.
A. Simple rollover structure is a common trapping mechanism in the Frio Expansion Area.
B. Structures with multiple growth faults are encountered as a trapping mechanism in the Rincon Field.
C. Structure with antithetic faults is a trapping mechanism in all three areas.
D. Collapsed crest structures are associated with hydrocarbon traps in the McAllen Ranch Field.
Return to Text

Figure 6.27A. SEM views of calcite (C) pore fill clearly post-dating albite (A) and quartz overgrowths (Q). Shell Horoan 10, depth = 11,107 feet.
Figure 6.27B. SEM view of calcite (C) pore fill clearly post-dating albite (A) and quartz overgrowths (Q). Shell Woods Christian 6, depth = 10,283 feet.
Return to Text

Example of a Core Description