verso fourth quarter and ye 2017 results
TRANSCRIPT

Earnings Conference Call and Webcast – March 8, 2018
Verso Fourth Quarter and YE 2017 Results

In this presentation, all statements that are not purely historical facts are forward-looking statements within the meaning of Section 27A of the Securities Act of 1933 and Section 21E of the Securities Exchange Act of 1934. Forward-looking statements in this presentation include, but are not limited to, our guidance for the fourth quarter of 2017 and the full year of 2017 and our expectations for pricing and input costs. Forward-looking statements may be identified by the words "believe," "expect," "anticipate," "project," "plan," "estimate," "intend," “potential” and other similar expressions. Forward-looking statements are based on currently available business, economic, financial, and other information and reflect management's current beliefs, expectations, and views with respect to future developments and their potential effects on Verso. Actual results could vary materially depending on risks and uncertainties that may affect Verso and its business. Verso’s actual actions and results may differ materially from what is expressed or implied by these statements due to a variety of factors, including those risks and uncertainties listed under the caption “Risk Factors” in Verso’s Form 10-K for the fiscal year ended December 31, 2017 and from time to time in Verso’s other filings with the Securities and Exchange Commission. Verso assumes no obligation to update any forward-looking statement made in this presentation to reflect subsequent events or circumstances or actual outcomes.
Non-GAAP Financial Information
This presentation contains certain non-GAAP financial information relating to Verso, including EBITDA, Adjusted EBITDA and related margins and free cash flow. Definitions and reconciliations of these non-GAAP measures are included in this presentation. Because EBITDA, Adjusted EBITDA and free cash flow are not measurements determined in accordance with GAAP and are susceptible to varying calculations, EBITDA, Adjusted EBITDA and free cash flow, as presented, may not be comparable to similarly titled measures of other companies. You should consider our EBITDA, Adjusted EBITDA and free cash flow in addition to, and not as a substitute for, or superior to, our operating or net income or cash flows from operating activities, which are determined in accordance with GAAP.
Presentation of Predecessor and Successor Financial Results
Verso adopted fresh-start reporting as of July 15, 2016 (the “Effective Date”), the effective date of its First Modified Third Amended Joint Plan of Reorganization under Chapter 11 of the U.S. Bankruptcy Code dated June 20, 2016, and the date that Verso emerged from its Chapter 11 cases. As a result of the application of fresh-start reporting, Verso’s financial statements for periods prior to the Effective Date are not comparable to those for periods subsequent to the Effective Date. References to “Successor” refer to Verso on or after the Effective Date. References to “Predecessor” refer to Verso prior to the Effective Date. Operating results for the Successor and Predecessor periods are not necessarily indicative of the results to be expected for a full fiscal year. References such as the “Company,” “we,” “our” and “us” refer to Verso Corporation and its consolidated subsidiaries, whether Predecessor and/or Successor, as appropriate.
Forward Looking Statements, Successor Financial Results & Non-GAAP Financial Information
1

Business Overview B. Christopher DiSantis Chief Executive Officer

• Difficult start to 2017 with market challenges, downtime, volume and price.
• Strong turnaround in results in the second half, particularly with respect to earnings and cash flow.
Overview
3
• Consolidation of corporate offices, austerity measures and organizational restructuring resulted in significantly lower SG&A.
• Graphic industry operating rates expected in the mid-to-high 90’s as result of corrections in supply demand balance. Imports impacted by exchange rates with Euro at $1.23, favorable to Verso.
• Specialty business (23% of revenue) continues to run full – looking to find ways to create additional capacity. Excellent progress with landing new programs and winning additional market share.
• Verso team delivered in a variety of areas: R-Gap savings, strengthened customer partnerships, effective negotiations on input costs and multi-sourcing, improved efficiency and effectiveness of our Information Technology platform and creation of enhanced optionality.
• Entered 2018 with strong order books and pricing momentum. Higher maintenance costs due to seasonal outage at Quinnesec and Luke together with widespread inflation will need to be managed.
(Dollars in millions) Q4-17 YE 2017 Sales $639 $2,461 Adj. EBITDA $65 $134 EBITDA Margin % 10.2% 5.4%
1 See Appendix for reconciliation of net income to EBITDA and Adjusted EBITDA. 2 Rate is as of 3/2/2018.
1
2

• Finished 2017 with a very strong Q4 at $65M of Adj. EBITDA (10.2% EBITDA margin, one of the best in our industry). Fared well vs. our competition.
• Generated $112M in cash flow through reduction in net debt and reduced working capital by $103M. Through our supply chain synchronization initiatives, reduced inventory by $60M. Made progress normalizing supplier terms.
• Increased liquidity from $163M as of December 31, 2016, to $216M at the end of 2017, enhancing our cushion and safety net, partially due to elimination of LC’s. Net pension underfunding was reduced by $34M to $457M.
• Achieved SG&A and other overhead cost reductions of more than $31M. Reduced total headcount by approximately 350 positions. Restructured variable compensation, harmonized other benefit programs, decreased $3.7M in OPEB. SG&A cost structure now at less than 4%.
• Expanded Specialty footprint. Filled Androscoggin Mill’s No. 5 paper machine to 100% capacity during fourth quarter and No. 4 machine is on track to be 100% Specialty by end of 2018.
• Business momentum recovered with enhanced pricing in the back half of 2017 with successive increases across every grade. Pricing initiatives are expected to have traction in 2018.
• Avery Dennison awarded its Best Supplier Innovation Award to Verso, recognizing us as "a key partner in the successful implementation of new products and ideas."
Fiscal 2017 Highlights
Built a better business in 2017 and now have a clearer sense of direction for Verso going forward.
4
1 See Appendix for reconciliation of net income to EBITDA and Adjusted EBITDA. 2 See calculation of liquidity on Liquidity & Net Debt slide 13.
1
2

• Remain the leader in Graphic papers, but anticipate a “mix migration” over time.
• Grow our Specialty business through new products, enhanced market share and finding low investment solutions to increasing machine throughput.
• Diversify in low-risk ways into packaging grades.
– Androscoggin Mill’s No. 3 paper machine transitioning to linerboard to satisfy global demand for virgin fiber. 200k tons focused on lighter basis weights. $17M investment ($13M net), creates 120 jobs. Anticipated start up in Q3.
– Expect to spend $8M of start up costs and be run rate profitable in Q4.
• Maintain low SG&A structure and aggressively go after other cost categories.
• Capitalize on low risk, relatively light investment conversion opportunities – currently looking at SBS, bag, liner and other products.
• Headwinds in 2018. Must develop countermeasures for this year’s challenges, which are expected to partially offset price gains:
– Production obstacles and weather could contribute to difficulties.
– Significant input cost and energy inflation anticipated.
– Freight / logistics availability issues & cost increases mounting.
– Will incur higher maintenance expenses and longer outages this year.
• Continue to move forward with previously announced strategic alternatives review, but nothing to report at this time and no guarantee that our process will result in any transaction.
Strategy
5

Financial Overview Allen Campbell SVP and Chief Financial Officer

Key Metrics
• CGW web is the primary driver to the lower overall volume - impacted due to the No. 3 machine closure at the Androscoggin Mill.
• Pulp shipments up 13% vs. prior year.
• Paper price started to experience recovery from low in Q2 2017. Prices up across all product groups.
• Pulp continues to see gradual improvement from low in second half of 2016.
Q4 2017 Revenue
72%
23%
5%
Q4-16 Q4-17 Δ Δ %
- Paper 717 687 (30) -4%
- Pulp 55 62 7 13%
Total 772 749 (23) -3%
NSP ($/ton)
- Paper $ 858 $ 879 $ 21 2%
- Pulp $ 479 $ 567 $ 88 18%
Inventory ($M) $ 445 $ 385 $ (60) -13%
Shipments (000 tons)
7
71%
23%
6% Graphic Papers
Specialty Papers
Pulp

Q4 2016 to Q4 2017 Profit and Loss
• Net sales down, driven by capacity reduction at Androscoggin Mill and general softening of demand for coated papers.
• Gross margin (excluding depreciation, amortization and depletion) was down from 16.6% to 13.3%, driven by a swing in OPEB gain recognition, lower sales volume, increased freight costs and mill performance issues, partially offset by reductions in manufacturing overhead costs, lower maintenance costs, and increased sales price. Gross margin was favorably impacted in Q4 2016 by $22M and Q4 2017 by $4M as a result of gains in cost of products sold, associated with the elimination of certain postretirement benefit costs. Neutralizing for OPEB gain in both periods, gross margin (excluding depreciation, amortization and depletion) was up from 13.2% to 13.9%.
• Depreciation, amortization and depletion was lower as a result of $43M in accelerated depreciation in Q4 2016 relating to the capacity reduction at our Androscoggin Mill.
• SG&A expenses were flat as a percentage of net sales at 4%.
• Other non-operating income includes $7M gain from extinguishment of an obligation in connection with the unwind of a New Market Tax Credit (NMTC) transaction entered in 2010.
8
(Dollars in millions)Q4-16 Q4-17 QoQ Δ
Net sales 646$ 639$ (7)$
Costs and expenses:
Cost of products sold 539 554 15
Depreciation, amortization, and depletion 69 28 (41)
Selling, general, and administrative expenses 26 25 (1)
Restructuring charges 9 1 (8)
Other operating (income) expense 6 1 (5)
Operating income (loss) (3) 30 33
Interest expense 9 9 -
Other (income) expense - (7) (7)
Income (loss) before reorganization items, net (12) 28 40
Reorganization items, net - - -
Income (loss) before income taxes (12) 28 40
Income tax expense (benefit) (20) (8) 12
Net income (loss) 8$ 36$ 28$
Income (loss) per common share (basic and diluted): 0.23$ 1.04$ 0.81$
Successor

Q4 2016 to Q4 2017 Adjusted EBITDA1
• Restructuring costs relate primarily to the Androscoggin/Wickliffe mills capacity reductions and HQ consolidation.
• Q4 2016 includes $6M of costs incurred in connection with advisory and legal services related to emergence from the Chapter 11 cases.
• Q4 2017 includes an adjustment for the $7M gain that resulted from the extinguishment of an obligation in connection with the unwind of a New Market Tax Credit (NMTC) transaction entered in 2010.
9
1 See Appendix for reconciliation of net income to EBITDA and Adjusted EBITDA.
(Dollars in millions)Q4-16 Q4-17 QoQ Δ
Net income (loss) 8$ 36$ 28$
Income tax expense (benefit) (20) (8) 12
Interest expense 9 9 -
Depreciation, amortization, and depletion 69 28 (41)
EBITDA 66$ 65$ (1)$
Restructuring charges 9 1 (8)
Fresh-start accounting adjustments 2 - (2)
(Gain) loss on disposal of assets 2 2 -
Pre- and post-reorganization costs 6 - (6)
Other severance costs 2 1 (1)
Strategic initiatives costs - 3 3
Extinguishment of NMTC obligation - (7) (7)
Other items, net 5 - (5)
Adjusted EBITDA 92$ 65$ (27)$
Adjusted EBITDA Margin % 14.2% 10.2% -4.1%
Gross margin 107$ 85$ (22)$
Gross margin % 16.6% 13.3% -3.3%
Successor

Q4 2016 to Q4 2017 Adjusted EBITDA Bridge ($M)1
1 See Appendix for reconciliation of net income to EBITDA and Adjusted EBITDA.
10
• A gain of $25M was realized in 2016 with the elimination of certain post employment benefit costs for the majority of eligible employees, while an additional gain of $4M was recorded in 2017 for elimination of the remaining employees.
• For Q4 2017, price/mix was up $12M across most product lines. • Volume in Q4 2017 was 23K tons lower than Q4 2016, driven primarily by lower CGW volume as a result of the
closure of the Androscoggin Mill No. 3 machine in Q1 2017. • Logistics costs were unfavorable in Q4 2017 due to continued increases in rates and surcharges while other
input costs were unfavorable due to higher chemical and natural gas prices. • Operational costs were unfavorable in Q4 2017, driven primarily by production issues and unfavorable material
usage at one mill, partially offset by favorable maintenance costs and production across other mills. • SG&A/Corporate costs were favorable due to realization of cost savings initiatives.

FY 2016 vs. FY 2017
• Decreased volume of $26M and price of $23M drove lower revenue and margin due to competitive market pressures and the idling of No. 3 paper machine at the Androscoggin Mill in Q1 2017.
• Adjusted EBITDA would have been $203M in 2016 and $131M in 2017 net of the $25M gain for settlement of OPEB liability in 2016 and $4M in 2017.
• Controllable costs reduced year over year with SG&A at 4.3% of revenue for 2017 (adjusted SG&A at 3.9%).
• EBITDA margin declined from 8.6% to 5.4%.
11
Dollars in millions
$2,641M
$228M
$2,461M
$134M
$0
$500
$1,000
$1,500
$2,000
$2,500
$3,000
Revenue Adjusted EBITDA
2016 2017
1 See Appendix for reconciliation of net income to EBITDA and Adjusted EBITDA.
1

Successor
Q4 2017 FY 2017
Adjusted EBITDA 65$ 134$
Less CapEx (11) (40)
Free Cash Flow 54$ 94$
Less:
Change in working capital 44 99
Net pension contributions (6) (26)
Cash interest (7) (30)
Other (6) (23)
79$ 114$
(Dollars in millions)
Net Cash From Operations and
Investing Activities
Strong Cash Flow Generation in 2017
• Q4 2017 working capital cash flows were driven by changes in AR of $8M, inventory of $14M, other current assets of $1M, accounts payable of $13M, and accrued liabilities of $8M.
12
1 See Appendix for reconciliation of net income to EBITDA and Adjusted EBITDA. 2 Other includes restructuring, severance, strategic initiatives along with miscellaneous items.
1
2
Generated $193M

Liquidity and Net Debt
1 $375M ABL facility limited by borrowing base. 2 Only applicable when ABL availability is below $30M. At 12/31/17 Verso had $186M of excess availability above this trigger.
13
Changes in Liquidity Q4 Full Year
Beginning Liquidity $180 $163
Change in balance drawn 52 47
Change in borrowing base (32) (33)
Change in cash balance 1 1
Reduction in LOCs 15 38
December 31, 2017 $216 $216
$ in Millions
Liquidity 12/31/16 9/30/17 12/31/17
Revolving credit facilities1
$347 $346 $314
- Balance drawn 112 117 65
- Letters of credit 78 55 40
Remaining ABL availability 157 174 209
Cash 6 6 7
Total Liquidity $163 $180 $216
Net Debt 12/31/16 9/30/17 12/31/17
Revolving credit facilities $112 $117 $65
Other debt (Term Loan) 211 171 146
Less: cash (6) (6) (7)
Total Net Debt $317 $282 $204
Debt covenant status and significant changes in the fourth quarter.
• Strong cash flow drove a $52M reduction in ABL usage and a $25M reduction in the Term Loan balance.
• Liquidity improved by $36M.
• Improving credit position allowed for further reductions in LOCs of $15M.
• Total leverage ratio below the covenant maximum of 2.25x.
• Fixed charge coverage ratio2 above the covenant minimum of 1.00x.
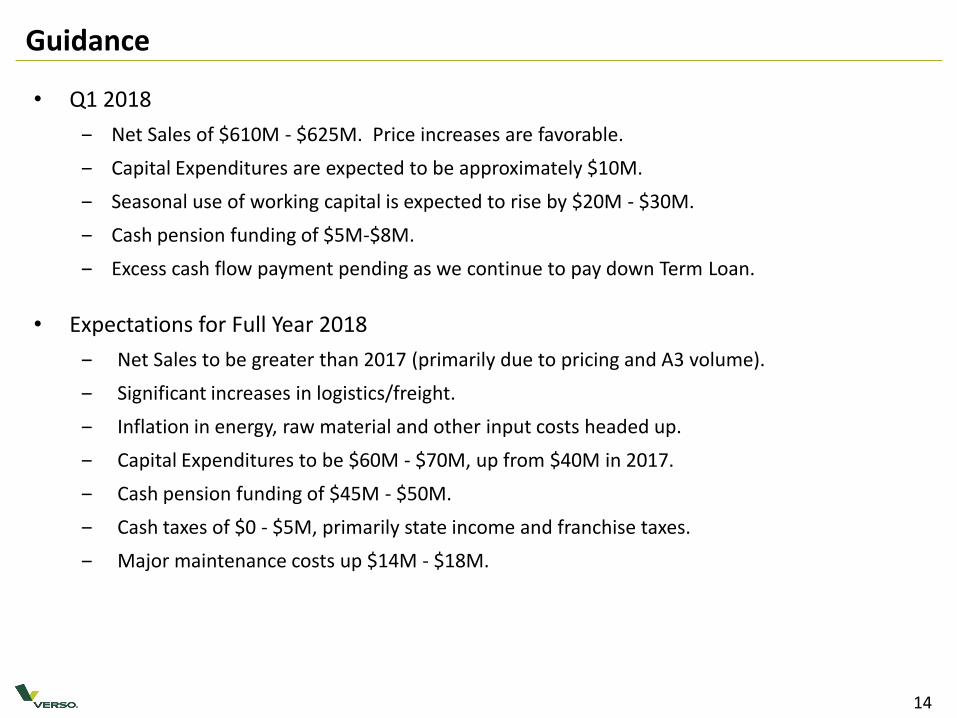
Guidance • Q1 2018
‒ Net Sales of $610M - $625M. Price increases are favorable.
‒ Capital Expenditures are expected to be approximately $10M.
‒ Seasonal use of working capital is expected to rise by $20M - $30M.
‒ Cash pension funding of $5M-$8M.
‒ Excess cash flow payment pending as we continue to pay down Term Loan.
• Expectations for Full Year 2018
‒ Net Sales to be greater than 2017 (primarily due to pricing and A3 volume).
‒ Significant increases in logistics/freight.
‒ Inflation in energy, raw material and other input costs headed up.
‒ Capital Expenditures to be $60M - $70M, up from $40M in 2017.
‒ Cash pension funding of $45M - $50M.
‒ Cash taxes of $0 - $5M, primarily state income and franchise taxes.
‒ Major maintenance costs up $14M - $18M.
14

Finance Appendix

EBITDA consists of earnings before interest, taxes, depreciation, and amortization. Adjusted EBITDA reflects adjustments to EBITDA to eliminate the impact of certain items that we do not consider to be indicative of our ongoing performance. We use EBITDA and Adjusted EBITDA as a way of evaluating our performance relative to that of our peers and to assess compliance with our credit facilities. We believe that Adjusted EBITDA is an operating performance measure commonly used in our industry that provides investors and analysts with a measure of ongoing operating results unaffected by differences in capital structures, capital investment cycles, and ages of related assets among otherwise comparable companies.
We believe that the supplemental adjustments applied in calculating Adjusted EBITDA are reasonable and appropriate to provide additional information to investors.
EBITDA and Adjusted EBITDA Definitions
16
FY 2017 Profit and Loss
17
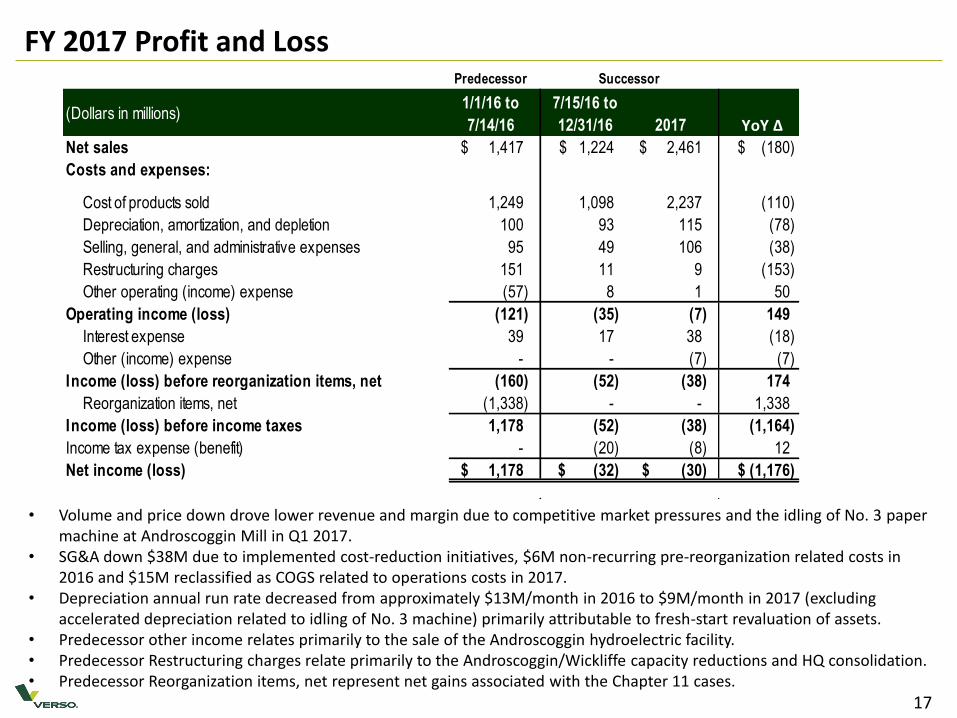
• Volume and price down drove lower revenue and margin due to competitive market pressures and the idling of No. 3 paper machine at Androscoggin Mill in Q1 2017.
• SG&A down $38M due to implemented cost-reduction initiatives, $6M non-recurring pre-reorganization related costs in 2016 and $15M reclassified as COGS related to operations costs in 2017.
• Depreciation annual run rate decreased from approximately $13M/month in 2016 to $9M/month in 2017 (excluding accelerated depreciation related to idling of No. 3 machine) primarily attributable to fresh-start revaluation of assets.
• Predecessor other income relates primarily to the sale of the Androscoggin hydroelectric facility. • Predecessor Restructuring charges relate primarily to the Androscoggin/Wickliffe capacity reductions and HQ consolidation. • Predecessor Reorganization items, net represent net gains associated with the Chapter 11 cases.
Predecessor
(Dollars in millions)1/1/16 to
7/14/16
7/15/16 to
12/31/16 2017 YoY Δ
Net sales 1,417$ 1,224$ 2,461$ (180)$
Costs and expenses:
Cost of products sold 1,249 1,098 2,237 (110)
Depreciation, amortization, and depletion 100 93 115 (78)
Selling, general, and administrative expenses 95 49 106 (38)
Restructuring charges 151 11 9 (153)
Other operating (income) expense (57) 8 1 50
Operating income (loss) (121) (35) (7) 149
Interest expense 39 17 38 (18)
Other (income) expense - - (7) (7)
Income (loss) before reorganization items, net (160) (52) (38) 174
Reorganization items, net (1,338) - - 1,338
Income (loss) before income taxes 1,178 (52) (38) (1,164)
Income tax expense (benefit) - (20) (8) 12
Net income (loss) 1,178$ (32)$ (30)$ (1,176)$
Successor
FY 2016 to FY 2017 Adjusted EBITDA1
18
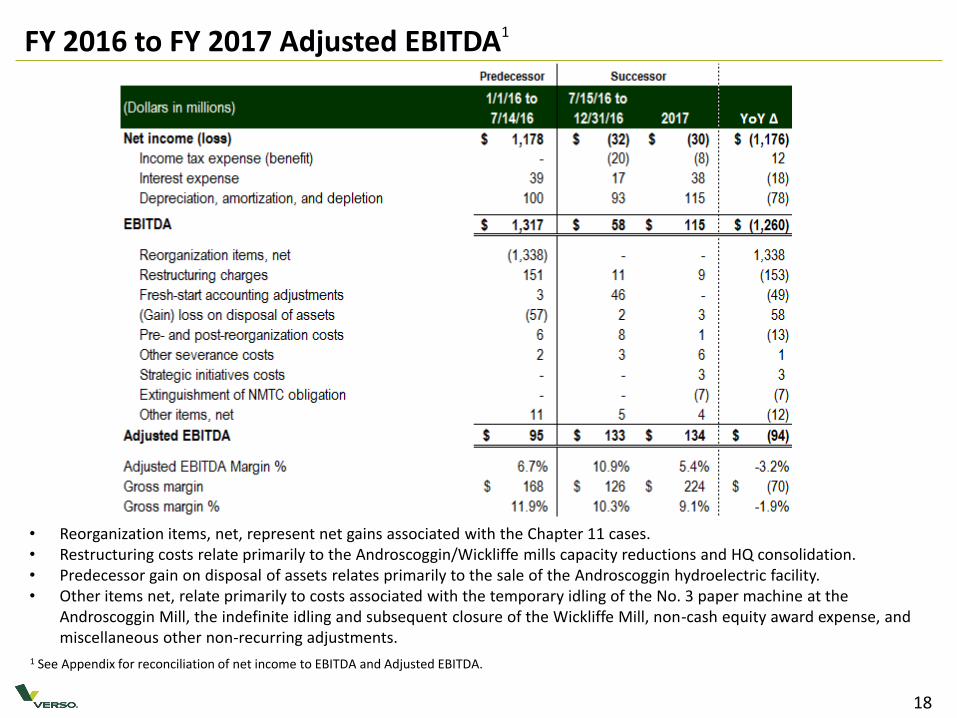
• Reorganization items, net, represent net gains associated with the Chapter 11 cases. • Restructuring costs relate primarily to the Androscoggin/Wickliffe mills capacity reductions and HQ consolidation. • Predecessor gain on disposal of assets relates primarily to the sale of the Androscoggin hydroelectric facility. • Other items net, relate primarily to costs associated with the temporary idling of the No. 3 paper machine at the
Androscoggin Mill, the indefinite idling and subsequent closure of the Wickliffe Mill, non-cash equity award expense, and miscellaneous other non-recurring adjustments.
1 See Appendix for reconciliation of net income to EBITDA and Adjusted EBITDA.

FY 2016 to FY 2017 Adjusted EBITDA Bridge ($M)1
• FY 2017, price/mix was off $21M from FY2016, with pricing lower in all grade lines except Digital, C1S Specialty and MG Specialty through Q3 and rebounding in Q4 2017.
• Volume was off 190K tons for FY2017 compared to FY2016, driven primarily by the closure of No. 3 machine at the Androscoggin Mill, with CFS, SC, UFS, and C1S Specialty also lower.
• Significant market and maintenance downtime taken in 2017. • Input costs were unfavorable $24M, with higher chemical and energy pricing partially offset by lower wood
prices. • SG&A/Corporate Costs were favorable by $27M year over year, driven by cost reduction initiatives implemented
across the Company.
1 See Appendix for reconciliation of net income to EBITDA and Adjusted EBITDA.
19

Consolidated Net Income/(Loss) to EBITDA and Adjusted EBITDA Reconciliation
20
(1) Net gains associated with the Chapter 11 Cases. (2) For 2015, charges represent severance and employee related costs and other restructuring charges associated with the NewPage acquisition, and the closure of the Bucksport Mill. For 2016, charges are primarily associated with the closure of the Wickliffe Mill, of which $137 million is non-cash. For 2017, charges are primarily associated with the announced closure and relocation of the Memphis office headquarters and closure of the Wickliffe Mill. (3) Non-cash charges related to the one-time impacts of adopting fresh-start accounting. (4) Realized (gains) and losses on the disposal of assets, which are primarily attributable to the sale of hydroelectric facilities in January 2016. (5) Costs incurred in connection with advisory and legal services related to planning for and emerging from the Chapter 11 Cases. (6) Severance and related benefit costs not associated with restructuring activities. (7) Professional fees and other charges and integration costs incurred in connection with the NewPage acquisition, including one-time impacts of purchase accounting. (8) Professional fees and other charges associated with strategic alternatives initiatives. (9) Extinguishment of obligation in December 2017 in connection with the unwind of a New Market Tax Credit (NMTC) transaction entered in 2010. (10) For 2015, non-cash equity award expense, unrealized losses (gains) on energy-related derivative contracts, and miscellaneous other non-recurring adjustments. For 2016, costs associated with the indefinite idling of the Wickliffe Mill, non-cash equity award expense, unrealized losses (gains) on energy-related derivative contracts, and miscellaneous other non-recurring adjustments. For 2017, costs incurred in connection with the re-engineering of information systems, non-cash equity award expense, costs associated with the temporary idling of the No. 3 paper machine at the Androscoggin Mill, and miscellaneous other non-recurring adjustments.

Q4 2017 and FY 2017 P&L Adjusted EBITDA add back items
21
The table below shows the Company’s consolidated income statement as presented under U.S. GAAP in the first column, then adjusted to reflect the adjustments the Company uses to get from EBITDA to Adjusted EBITDA.
(1)
(2)
(3)
(4)
(5)
Costs associated with the temporary idling of the No. 3 paper machine at the Androscoggin Mill, costs associated with strategic alternatives
initiatives, severance and related benefit costs not associated with restructuring activities, and (Gain) loss on disposal of assets.
Costs incurred in connection with advisory and legal services related to emerging from the Chapter 11 Cases.
Extinguishment of obligation in December 2017 in connection with the unwind of a New Market Tax Credit (NMTC) transaction entered in 2010.
Professional fees and other charges associated with strategic alternatives initiatives, Severance and related benefit costs not associated with
restructuring activities, non-cash equity award expense, costs incurred in connection with the re-engineering of information systems and
miscellaneous other non-recurring adjustments. Charges are primarily associated with the announced closure and relocation of the Memphis office headquarters and closure of the Wickliffe
Mill.
(Dollars in mill ions) Q4 2017
Less
Adjustments
to EBITDA
Before
Adjustments
to EBITDA FY 2017
Less
Adjustments
to EBITDA
Before
Adjustments
to EBITDA
Net sales 639$ -$ 639$ 2,461$ -$ 2,461$
Costs and expenses:
Cost of products sold 554 2 (1) 552 2,237 4 (1) 2,233
Depreciation, amortization, and depletion 28 - 28 115 - 115
Selling, general, and administrative expenses 25 3 (2) 22 106 12 (2) 94
Restructuring charges 1 1 (3) - 9 9 (3) -
Other operating (income) expense 1 1 (4) - 1 1 (4) -
Operating income (loss) 30 (7) 37 (7) (26) 19
Interest expense 9 - 9 38 - 38
Other (income) expense (7) (7) (5) - (7) (7) (5) -
Income (loss) before income taxes 28 - 28 (38) (19) (19)
Income tax benefit (8) - (8) (8) - (8)
Net income (loss) 36$ -$ 36$ (30)$ (19)$ (11)$