versilia flood: a prefrontal supercell system embedded in weak flow impinging on near-coastal...
DESCRIPTION
A deep and stationary convective event occured over Versilia (a part of the Tuscany region, Italy) on 19 June 1996 producing heavy precipitation during twelve hours (maximum accumulated value 478 mm). It initially formed at the coastline and its growth was supported by lifting of the weak flow towards the Apuane Alps. Cases of this type highlight the need for accurate and spatially highly resolved observations for analysis and prediction. We collected non-standard data and performed special numerical simulations with different LAMs to improve investigation of a case which produced many injuries to the local people.TRANSCRIPT

22/6/2016 Introduction
file:///E:/Luca%20archivio/Ufficio/Siti%20web/htdocs/papers/00463.html 1/10
VERSILIA FLOOD: A PREFRONTAL SUPERCELL SYSTEM EMBEDDED IN WEAKFLOW IMPINGING ON NEARCOASTAL MOUNTAIN RANGE
(1)P.Frontero, (2)P.Binder, (1)S.Pugnaghi, (1)L.Lombroso, (1)R.Santangelo,
(3)A.Buzzi, (4)T.Paccagnella, (4)A.Selvini
(1) Dip.Sci.Ing. Sez. Osservatorio Geofisico Univ. Modena, I
(2) Swiss Meteorological Institute, Zurich, CH
(3) FISBATCNRBologna, I
(4) Serv.Met.Reg. Bologna, I
Abstract
A deep and stationary convective event occured over Versilia (a part of the Tuscany region, Italy) on 19 June 1996 producingheavy precipitation during twelve hours (maximum accumulated value 478 mm). It initially formed at the coastline and its growthwas supported by lifting of the weak flow towards the Apuane Alps. Cases of this type highlight the need for accurate andspatially highly resolved observations for analysis and prediction. We collected nonstandard data and performed specialnumerical simulations with different LAMs to improve investigation of a case which produced many injuries to the local people.
Introduction
The Versilia event (Italy) on 19 June 1996 was a severe convective case leading to heavy precipitation. The major synopticfeature was a cold front approaching from the north, but which was still on the northern side of the Alps during the critical timeperiod. The farinfluence of this cold front in combination with the prevailing WSW warm advection over the Mediterranean inthe lower part of the troposphere created the prerequisite conditions for the supercell thunderstorm to develop. The synopticforcing in this case was very weak, more important was the mesoscale flow and the convection enhanced by local orography.
Only few observations from the GTS network are available in the area of the mesoscale phenomenon.
The Versilia event represents a convergencedivergence field case that needs a better comprehension by means of models and thisis one of the main scientific objective of MAP. The heavy precipitation system exhibited characteristics similar to other events[Frontero et al., 1995], [Frontero et al., 1996] seen in the same area. These cases highlight the need for more highresolutionobservations in this area, also to have better initial conditions for LAMs.
Synoptic situation
The synoptic situation at 500 hPa on 19 of June shows a ridge with axis from Algeria up to Brittany. A geopotential minimum isfound over southern Sweden. This setting produced a northwestern flow regime over Italy with a wind speed of about 10 m/s. Thecurvature of the geopotential field was mainly anticyclonic. Temperature over Northern Italy at this altitude was about 15 °C dueto cold advection. At 850 hPa warm advection from WSW over the sea led to instability [Berliner Wetterkarte, 1996]. The surfacepressure field was well levelled around 1015 hPa with a light cyclonic curvature. The lower part of a cold front over centralEurope reached the northern Italian regions. As a whole, the synoptic situation, does not exhibit spectacular features.
Precipitation
From the measurements of the meteorological stations in the Versilia area it can be seen that precipitation began at 3:00 UTC onJune 19 and lasted until 18:00 UTC producing a maximum of accumulated precipitation of 478 mm at the Pomezzana rain gaugestation. Around Pomezzana St, in an area of about 10x20 km2 (see the rectangular area in Fig. 1a) the accumulated precipitationexceeded 100 mm. Outside this area the accumulated precipitation decreased rapidly and at the nearby synoptic stations of Pisa,Firenze and Perugia precipitation amounts of: 0.0, 0.6 and 0.0 mm were observed respectively. The event had two intensitymaxima, the first between 5 and 6 UTC and the second around 13:00 UTC of minor intensity.

22/6/2016 Introduction
file:///E:/Luca%20archivio/Ufficio/Siti%20web/htdocs/papers/00463.html 2/10
It is interesting to know that in this region the annual precipitation has a local maximum of about 4000 mm, due to its particularlysensitive position linked to the local orography. This is the value measured at Mt. Pania (1800 m), inside the rectangular area ofFig. 1a. The gradient of precipitation towards the coast is very sharp. On the coast, only 14 km away from Mt. Pania, the annualaccumulated precipitation is 600700 mm.
Case study
The cell was triggered over the sea, close to the coast of La Spezia, at about 1:00 UTC. It was observed by the NOAA andMETEOSAT satellites. The satellite images show an initial eastward displacement toward the Apuane Alps; the cell had a circularshape in this phase. Then it was oriented SE along the Apennines' ridge and a clockwise rotation became apparent. The hodographhad the same rotation while the supercell grew instigating new cells at its right flank [Bluestein, 1993]; this can be seen on bothsatellite images and by the precipitation distribution. In spite of the elipsoidal of the cloud system in the second phase, theprecipitation continued above the same area. NOAAAVHRR images taken at about 13:30 UTC in channel 1 (visible) and channel4 (thermal infrared) show that a great part of the cloud system was a sort of plume [Levizzani et al., 1996], since the highlevelcloud were blownoff in the upper wind direction. Under this plume there was no precipitation. By means of the TeraScan softwarepackage, using TIR channels, we determined the SST. A difference of about two degrees resulted between the Ligurian sea (21.5°C) and the Thyrrhenian sea (23.5 °C). With the same package TOVS data were analyzed to obtain geopotential, wind, temperatureand dew point temperature fields at standard pressure levels. The minimum of geopotential at 850 hPa southeast of the ApuaneAlps (Fig. 1b) corresponds to a well defined downstream lee depression [Carlson, 1991] and the dew point temperature shows adry air nucleous in the same area. The background of both Fig. 1a and 1b is the brightness temperature obtained by AVHRRchannel 4; bright and dark colours indicate warm and cold surface respectively.
We collected all the radiosoundings performed around the region of interest: Ajaccio, Cagliari, Nimes, San Pietro Capofiume(Bologna) and Milano, all of them show no significant instability while the considered LAMs: BOLAM (FISBATCNR, Italy),LAMBO (SMR, Italy) and SM (SMI, Switzerland) show different instability characteristics for this area. The SM profiles over theLigurian sea show in the first two or three model layers a very stable (i.e. temperature inversion) saturated boundary layer. Thisinversion is maintained by the warm WSW advection, previously quoted, of potentially very unstable but dry air and by therelatively cold sea surface. This gives the characteristic shape of the profile over the sea (see Fig. 2a). The profiles over the landhave the same main structure (see Fig. 2b), but here no capping inversion exists and some lifting at the coast and the mountainbehind is exerted on the flow.
Quite an impressive picture is given by the 10 m wind (see Fig. 3a). The lowlevel flow exhibits significant convergence towardsthe Versilia coast. This feature is connected to a distinct vorticity pattern. Flow splitting in the stable marine boundary layer isseen around Corsica. The northern branch of the split flow converges with the flow coming down the Rhone vally and turning tothe east. However, this relevant flow characteristic can not be observed by the SYNOP stations on the coast. BOLAM identifiedthe same low level flow pattern as the SM.
At 850 hPa westerly flow can be seen in Fig. 3b. The model wind speed at this altitude is in fair agreement with the mountainstation observations.
An other relevant aspect is derived by the analysis of the cross sections of the horizontal wind speed (see Fig. 4a) and of omega,connected to the vertical motion [Kurz, 1990] (see Fig. 4b). In the WE cross section of Fig. 4a a core of wind speed of 20 m/s atabout 950 hPa is clearly visible over the Ligurian sea. It is a kind of lowlevel boundary layer jet. Fig. 4b shows a reduction ofstability between 900 and 800 hPa close to the Versilia coast and to the right of the lowlevel jet; this reduction is of courseassociated with an ascending vertical motion. Behind Apennines, positive values of omega indicate descending air motion(foehneffect). This in part explains the geopotential pattern of Fig. 1b.
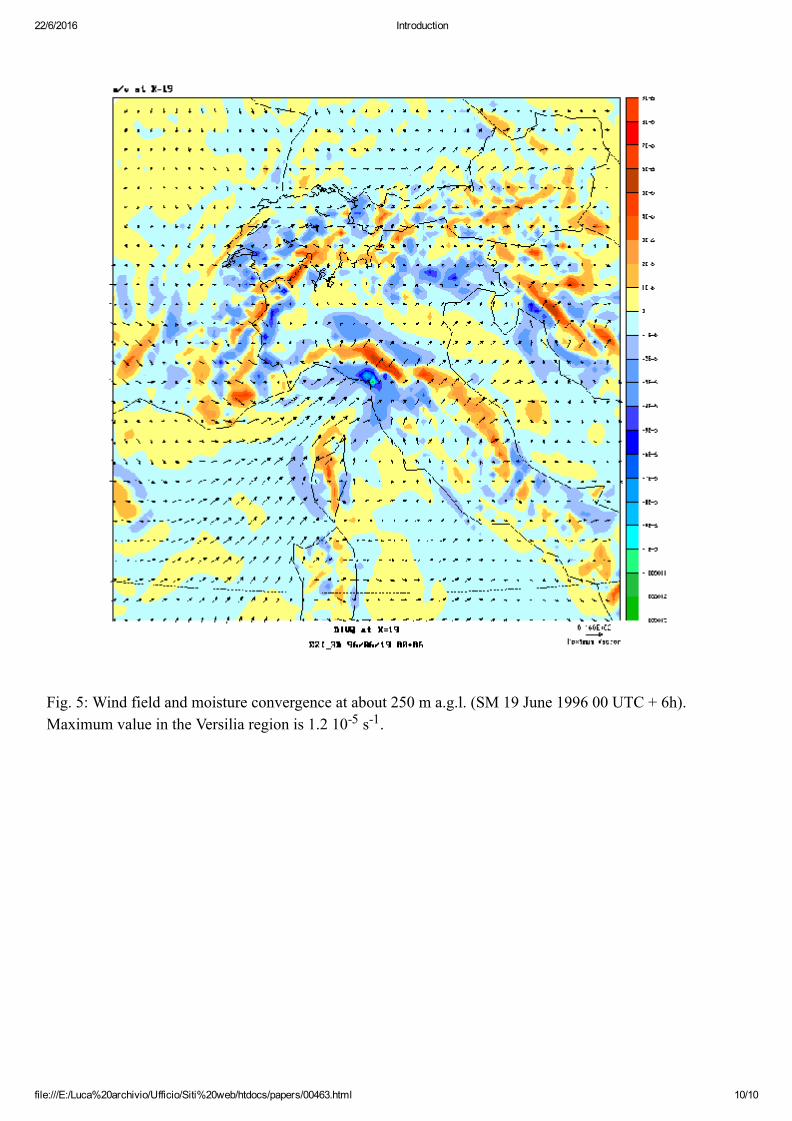
Finally a synthetic description of the event is given by the windvector and moisture convergence analysis shown in Fig. 5 (mapobtained at about 250 m a.g.l.). A significant moisture convergence reaches its maximum value in the area where there was themaximum of precipitation. In the Tiedke parameterization scheme for convection, as used in the SM, this quantity is crucial forthe onset and maintenance of convection; the 24h maximum precipitation amount forecasted by the SM for the period in questionwas 155 mm (most precipitation forecasted of the three considered LAMs).
Conclusion
The supercell was triggered over the sea, near the coast and grew above the Versilia area, producing a maximum of 478 mm duringtwelve hours.
The key factors leading to the event were:
1) the vertical structure of the atmosphere with its blocked boundary layer over the sea and significant instability potential aloft(large CAPE values);

22/6/2016 Introduction
file:///E:/Luca%20archivio/Ufficio/Siti%20web/htdocs/papers/00463.html 3/10
2) the lowlevel jet formed by the convergence of the flow deflected around Corsica and the Alps leading to moisture convergenceand lifting onshore. The geometry of the flow is mainly driven by the local topography. Synoptic forcing in this case was veryweak and therefore the local and mesoscale conditions were responsible for the outbreak of the severe convection.
Finally we remark a lack of vertical observations in this sensitive area (Gulf of Genoa); this was a factor reducing the reliability ofthe LAM forecasts.
Aknowledgement
Observed precipitation data, from the station network of the italian Servizio Idrografico e Mareografico Nazionale, have beenmade available for research purposes by the Italian Department for Civil protection.
We thank Matthias Jaeneke (Deutscher Wetterdienst) for the information and F. Parmiggiani (IMGACNR, Italy) for the NOAAimages.
Reference
Berliner Wetterkarte, Institute fur Meteorologie der Freie Universitat Berlin, Germany, 1996
Bluestein H.B., 1993
Synopticdynamic meteorology in midlatitudes, Volume III
Oxford University Press, 1993.
Carlson T.N., 1991
MidLatitude Weather Systems
HarperCollins Academic 1991
Frontero P., L. Lombroso, S. Pugnaghi, R. Santangelo, 1995
November 1994 Piedmont flood nowcasting contribution
MAP Newsletter n°3, 1995
Frontero P., L. Lombroso, S. Pugnaghi, R. Santangelo,A. Buzzi, T. Paccagnella, P. Binder, 1996
Heavy precipitation over the Ligurian area: The case of 46 October 1995
MAP Newsletteter n°5, 1996
Kurz M.M., 1990
Methods of synoptic diagnosis, DWDZentralamt, 1990
Levizzani V., M.Setvak, R.A.Rabin, C.A.Doswell III, P.K.Wang, 1996
Storm top structure as seen from NOAAAVHRR imagery: A need for interpretation
MAP newsletter n°5, 1996

22/6/2016 Introduction
file:///E:/Luca%20archivio/Ufficio/Siti%20web/htdocs/papers/00463.html 4/10
Figures
Fig. 1a: The dark shade over the sea is the cloud system during its early stage at about 2 UTC on 19 June1996. The rectangle shows the area with accumulated precipitation greater then 100 mm. The spot inside therectangle indicates the station where there was the maximum precipitation of 478 mm.

22/6/2016 Introduction
file:///E:/Luca%20archivio/Ufficio/Siti%20web/htdocs/papers/00463.html 5/10
Fig. 1b: TOVSgeopotential contour lines at 850 hPa. The minimum to the southeast of the Apuane Alpscorresponds to a downstream lee depression.
Fig. 2a: Characteristic thermodynamic profile as seen by the Swiss Model (SM) over the sea westsouthwestof Versilia: 19 June 1996 00 UTC (right) and 06 UTC (left).

22/6/2016 Introduction
file:///E:/Luca%20archivio/Ufficio/Siti%20web/htdocs/papers/00463.html 6/10
Fig. 2b: Same as Fig. 2a but for a Versilia land point.
Fig. 3a: SM predicted (+6h) wind field at 10 m for 19 June 1996 06 UTC. Note the convergence offshoreVersilia.

22/6/2016 Introduction
file:///E:/Luca%20archivio/Ufficio/Siti%20web/htdocs/papers/00463.html 7/10
Fig. 3b: Same as Fig. 3a but for the 850 hPa wind field. Flow splitting around Corsica is almost absent.

22/6/2016 Introduction
file:///E:/Luca%20archivio/Ufficio/Siti%20web/htdocs/papers/00463.html 8/10
Fig. 4a: Vertical crosssection at about 44 N. Equivalent potential temperature (solid lines, every 2 degrees)and wind speed (shading and bold dashed isolines for 10, 13 and 16 m/s) as predicted by the SM (19 June1996 00 UTC + 6h). The mountain range to the left (west) are the Maritime Alps, the ridge to the right (east)are the Apuane Alps (Apennines).

22/6/2016 Introduction
file:///E:/Luca%20archivio/Ufficio/Siti%20web/htdocs/papers/00463.html 9/10
Fig. 4b: Vertical crosssection at about 44 N cutting the Apuane Alps. Equivalent potential temperature andvertical velocity (omega). Upward motion is indicated by dashed lines.
22/6/2016 Introduction
file:///E:/Luca%20archivio/Ufficio/Siti%20web/htdocs/papers/00463.html 10/10
Fig. 5: Wind field and moisture convergence at about 250 m a.g.l. (SM 19 June 1996 00 UTC + 6h).Maximum value in the Versilia region is 1.2 105 s1.