venezuela outlook for petrocaribe and impact on the … · cuba haiti surinam ... rising oil prices...
TRANSCRIPT
Frank Fuentes Brito
Dominican Republic’s Representative at the IMF & Senior Advisor to the Executive Director of the Brazilian Constituency
January 2017
Venezuela—Outlook for Petrocaribe and Impact on the Caribbean
Disclaimers
This presentations is intended for informational purposes only and do not replace independent professional judgment.
Statements of fact and opinions expressed are my own and, unless stated otherwise, are not the opinion or position of the International Monetary Fund or the Government of the Dominican Republic.
Assessing the economic outlook for Venezuela is increasingly difficult due to delays in publication of key economic data. Analysis is currently made with independent estimations and projections.
Content
1. Impact of low oil prices and ongoing macroeconomic policies in Venezuela
2. Evolution of Petrocaribe and its influence in the region
3. Potential effects of Venezuela’s financial situation on Petrocaribe
Impact of low oil prices and ongoing macroeconomic policies in Venezuela
1
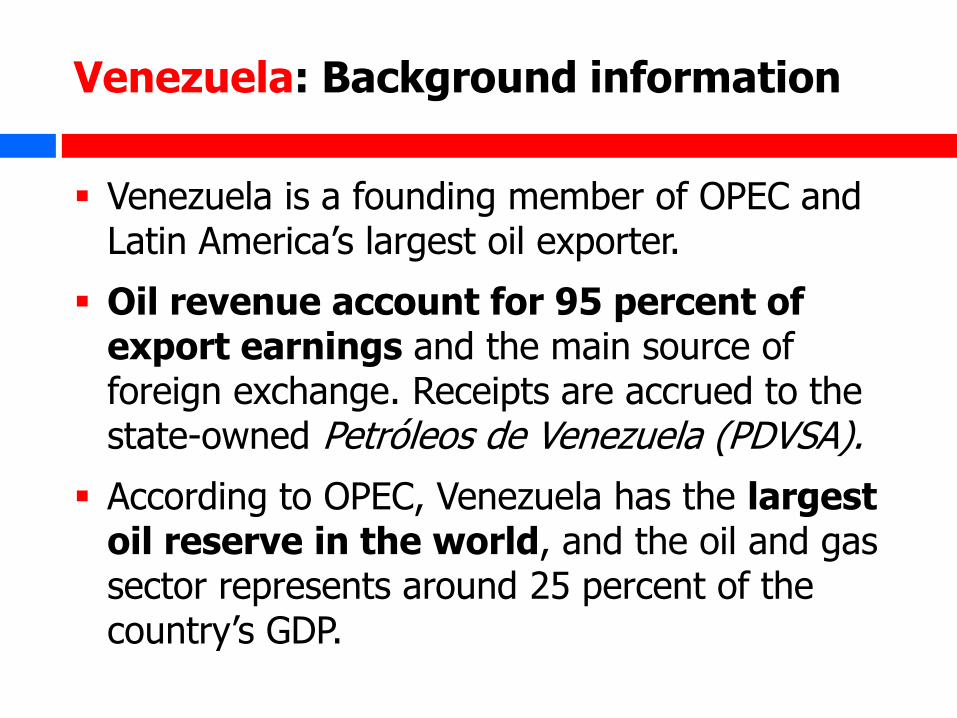
Venezuela: Background information
Venezuela is a founding member of OPEC and Latin America’s largest oil exporter.
Oil revenue account for 95 percent of export earnings and the main source of foreign exchange. Receipts are accrued to the state-owned Petróleos de Venezuela (PDVSA).
According to OPEC, Venezuela has the largest oil reserve in the world, and the oil and gas sector represents around 25 percent of the country’s GDP.
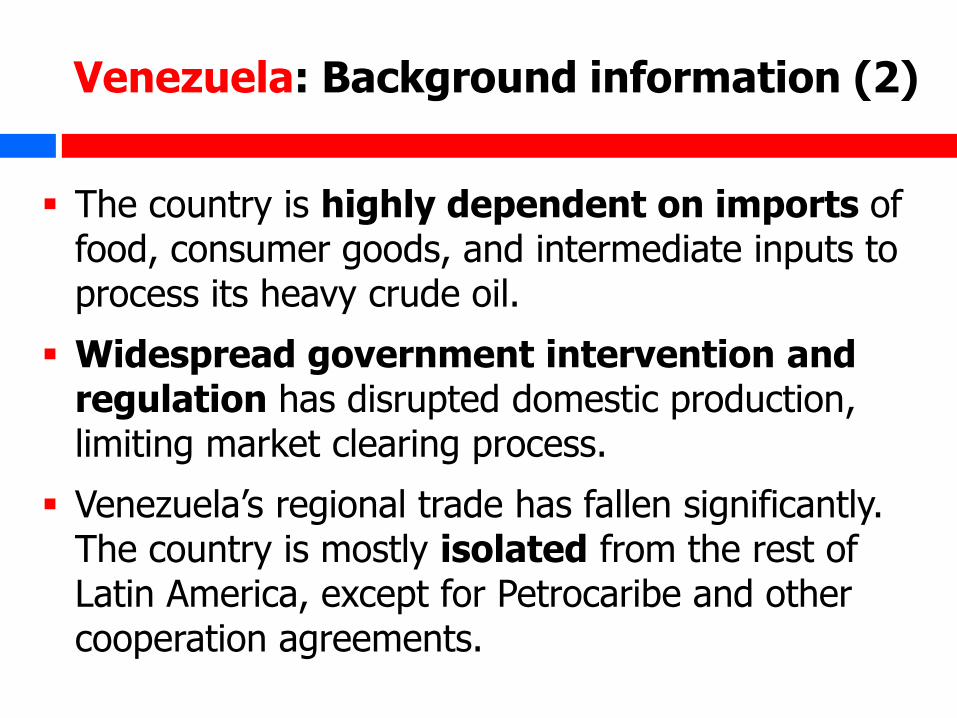
Venezuela: Background information (2)
The country is highly dependent on imports of food, consumer goods, and intermediate inputs to process its heavy crude oil.
Widespread government intervention and regulation has disrupted domestic production, limiting market clearing process.
Venezuela’s regional trade has fallen significantly. The country is mostly isolated from the rest of Latin America, except for Petrocaribe and other cooperation agreements.
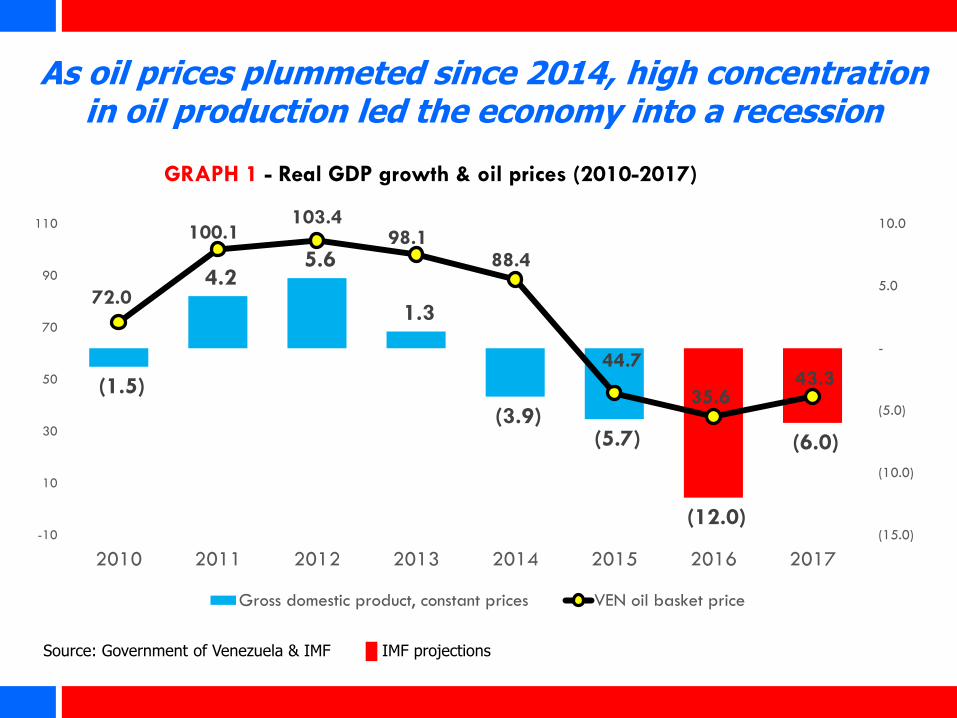
Source: Government of Venezuela & IMF █ IMF projections
As oil prices plummeted since 2014, high concentration in oil production led the economy into a recession
(1.5)
4.2 5.6
1.3
(3.9) (5.7)
(12.0)
(6.0)
72.0
100.1 103.4
98.1 88.4
44.7
35.6 43.3
(15.0)
(10.0)
(5.0)
-
5.0
10.0
-10
10
30
50
70
90
110
2010 2011 2012 2013 2014 2015 2016 2017
GRAPH 1 - Real GDP growth & oil prices (2010-2017)
Gross domestic product, constant prices VEN oil basket price
21.2
27.9
25.1 26.1
30.3
25.3
15.8 14.1
-
5.0
10.0
15.0
20.0
25.0
30.0
35.0
2010 2011 2012 2013 2014 2015 2016 2017
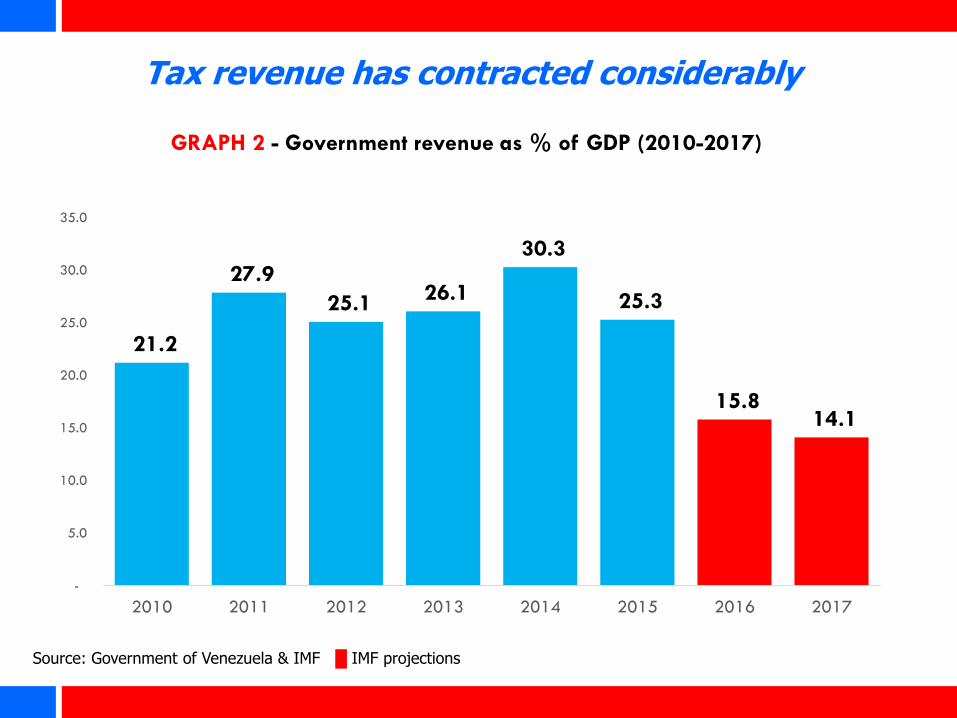
GRAPH 2 - Government revenue as % of GDP (2010-2017)
Source: Government of Venezuela & IMF █ IMF projections
Tax revenue has contracted considerably
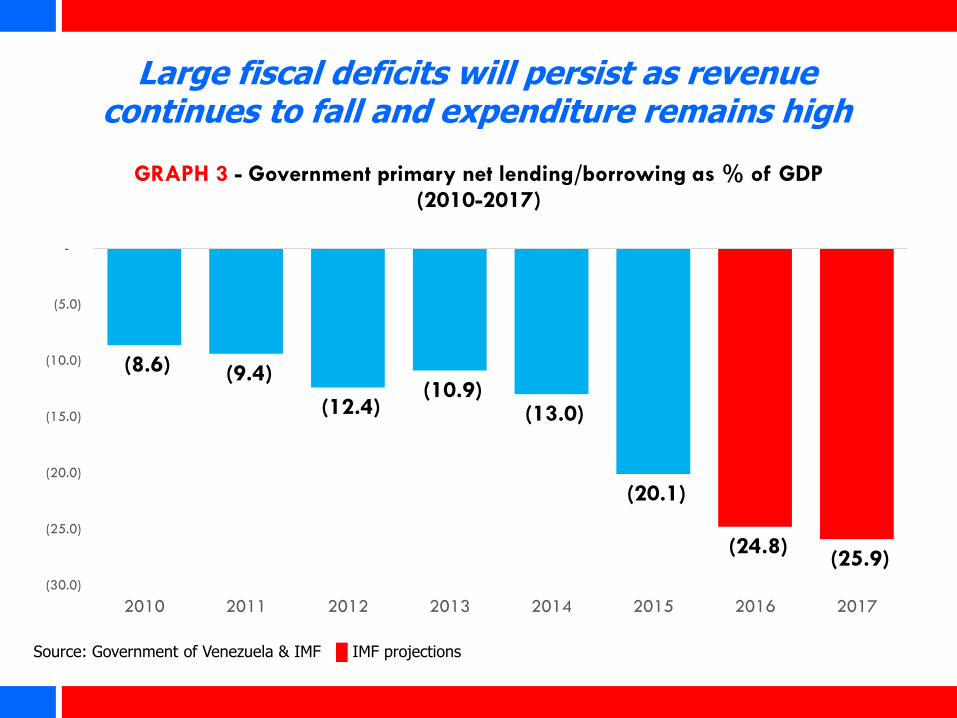
(8.6) (9.4)
(12.4) (10.9)
(13.0)
(20.1)
(24.8) (25.9)
(30.0)
(25.0)
(20.0)
(15.0)
(10.0)
(5.0)
-
2010 2011 2012 2013 2014 2015 2016 2017
GRAPH 3 - Government primary net lending/borrowing as % of GDP (2010-2017)
Large fiscal deficits will persist as revenue continues to fall and expenditure remains high
Source: Government of Venezuela & IMF █ IMF projections
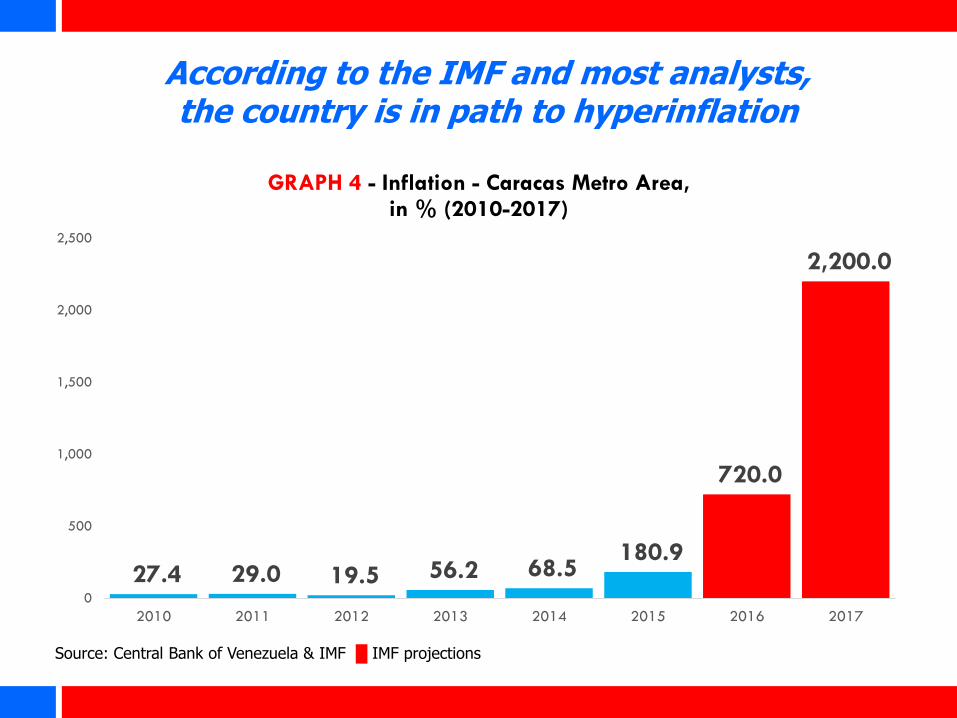
27.4 29.0 19.5 56.2 68.5 180.9
720.0
2,200.0
0
500
1,000
1,500
2,000
2,500
2010 2011 2012 2013 2014 2015 2016 2017
GRAPH 4 - Inflation - Caracas Metro Area, in % (2010-2017)
According to the IMF and most analysts, the country is in path to hyperinflation
Source: Central Bank of Venezuela & IMF █ IMF projections
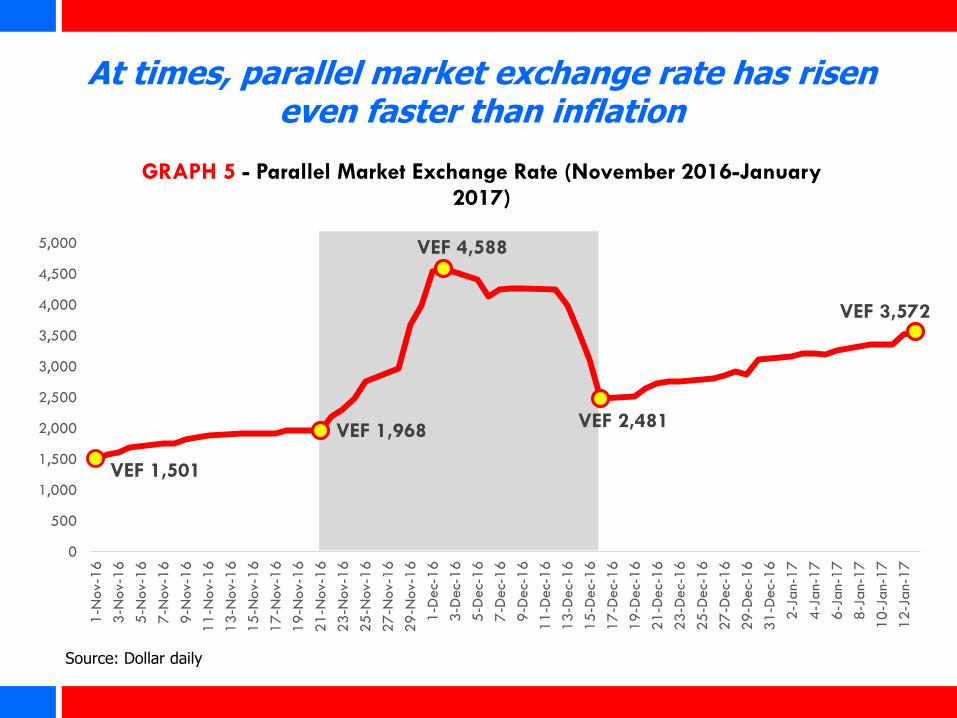
VEF 1,501
VEF 1,968
VEF 4,588
VEF 2,481
VEF 3,572
0
500
1,000
1,500
2,000
2,500
3,000
3,500
4,000
4,500
5,000
1-N
ov-
16
3-N
ov-
16
5-N
ov-
16
7-N
ov-
16
9-N
ov-
16
11
-Nov-
16
13
-Nov-
16
15
-Nov-
16
17
-Nov-
16
19
-Nov-
16
21
-Nov-
16
23
-Nov-
16
25
-Nov-
16
27
-Nov-
16
29
-Nov-
16
1-D
ec-
16
3-D
ec-
16
5-D
ec-
16
7-D
ec-
16
9-D
ec-
16
11-D
ec-
16
13-D
ec-
16
15-D
ec-
16
17-D
ec-
16
19-D
ec-
16
21-D
ec-
16
23-D
ec-
16
25-D
ec-
16
27-D
ec-
16
29-D
ec-
16
31-D
ec-
16
2-J
an-
17
4-J
an-
17
6-J
an-
17
8-J
an-
17
10-J
an-
17
12-J
an-
17
GRAPH 5 - Parallel Market Exchange Rate (November 2016-January 2017)
At times, parallel market exchange rate has risen even faster than inflation
Source: Dollar daily
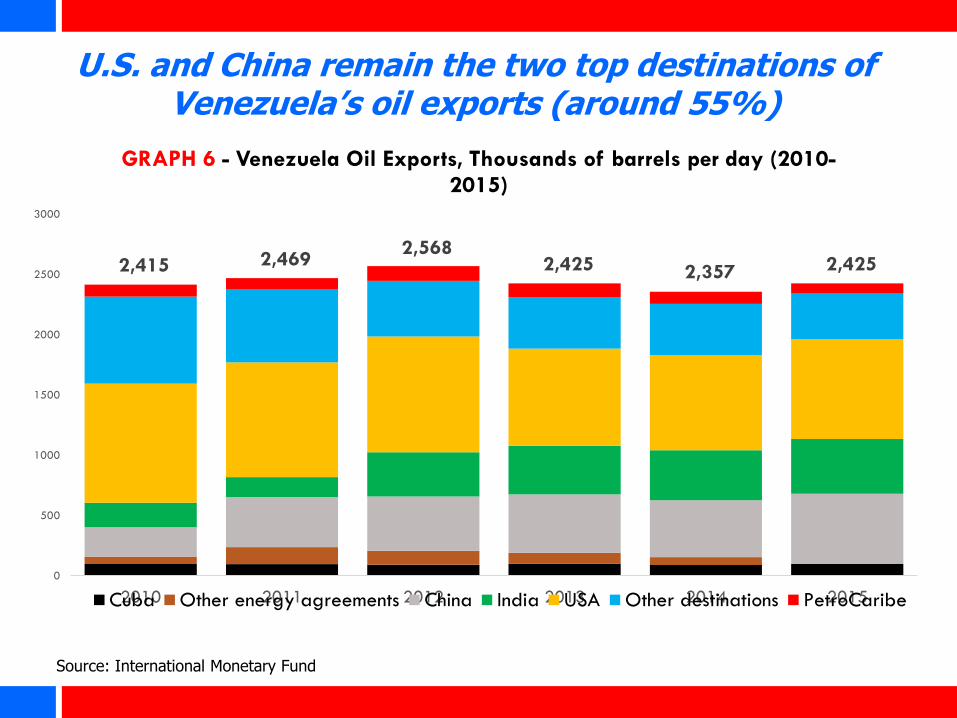
2,415 2,469 2,568
2,425 2,357 2,425
U.S. and China remain the two top destinations of Venezuela’s oil exports (around 55%)
0
500
1000
1500
2000
2500
3000
2010 2011 2012 2013 2014 2015
GRAPH 6 - Venezuela Oil Exports, Thousands of barrels per day (2010-2015)
Cuba Other energy agreements China India USA Other destinations PetroCaribe
Source: International Monetary Fund
Evolution of Petrocaribe and its influence in the region
2
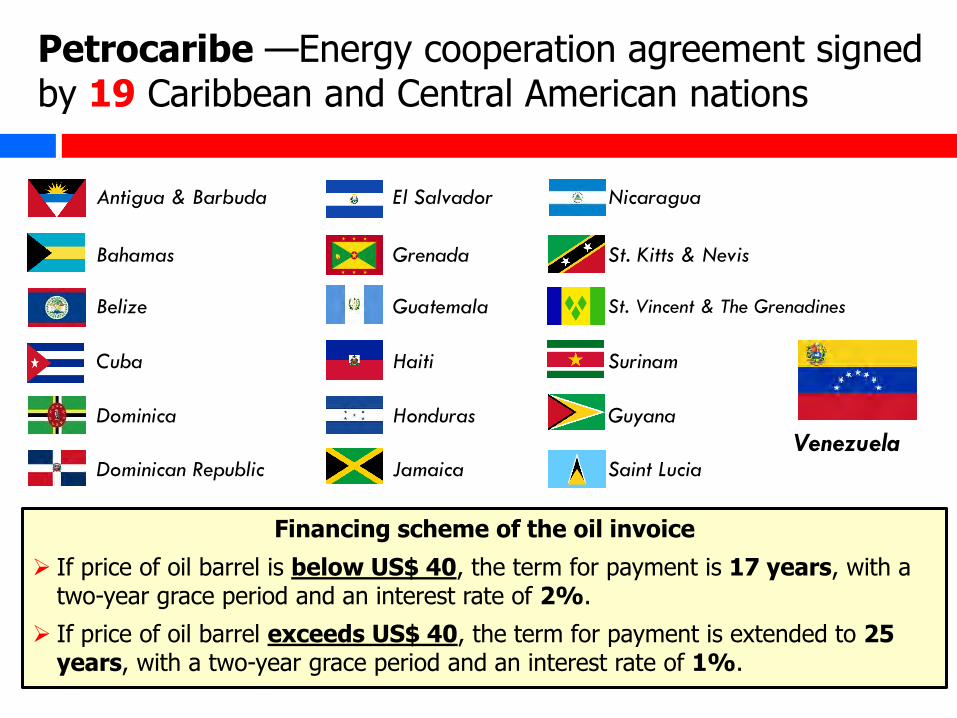
Petrocaribe —Energy cooperation agreement signed by 19 Caribbean and Central American nations
Antigua & Barbuda El Salvador Nicaragua
Bahamas Grenada St. Kitts & Nevis
Belize Guatemala St. Vincent & The Grenadines
Cuba Haiti Surinam
Dominica Honduras Guyana
Dominican Republic Jamaica Saint Lucia
Financing scheme of the oil invoice
If price of oil barrel is below US$ 40, the term for payment is 17 years, with a two-year grace period and an interest rate of 2%.
If price of oil barrel exceeds US$ 40, the term for payment is extended to 25 years, with a two-year grace period and an interest rate of 1%.
Venezuela
Overall macroeconomic impact
During 2005-2015, Petrocaribe has met an average of 32% of members demand, financing approximately 50% of oil invoice (US$ 28 billion).
By 2014, the IMF estimated an average impact of Petrocaribe at 2.5% of GDP. Guyana (4.7%), Nicaragua (4.3%), Haiti (4.1%) and Belize (3.5%) showed the largest impact on their GDP.
Guyana, Nicaragua, Jamaica and the Dominican Republic has paid off portions of oil shipments and its oil debt with food, medication, fertilizers and cement. In 2014, a total of US$ 3.2 millions has been received by Venezuela as clearing of the oil invoice.
30
27
23.5
14
10
7 5.2 4.4 4
1.2 1 1 1 0
5
10
15
20
25
30
35
0
5
10
15
20
25
30
35
DR NIC JAM HAI SUR SAL GUY A&B BEL SK&N GRE DOM SV&G
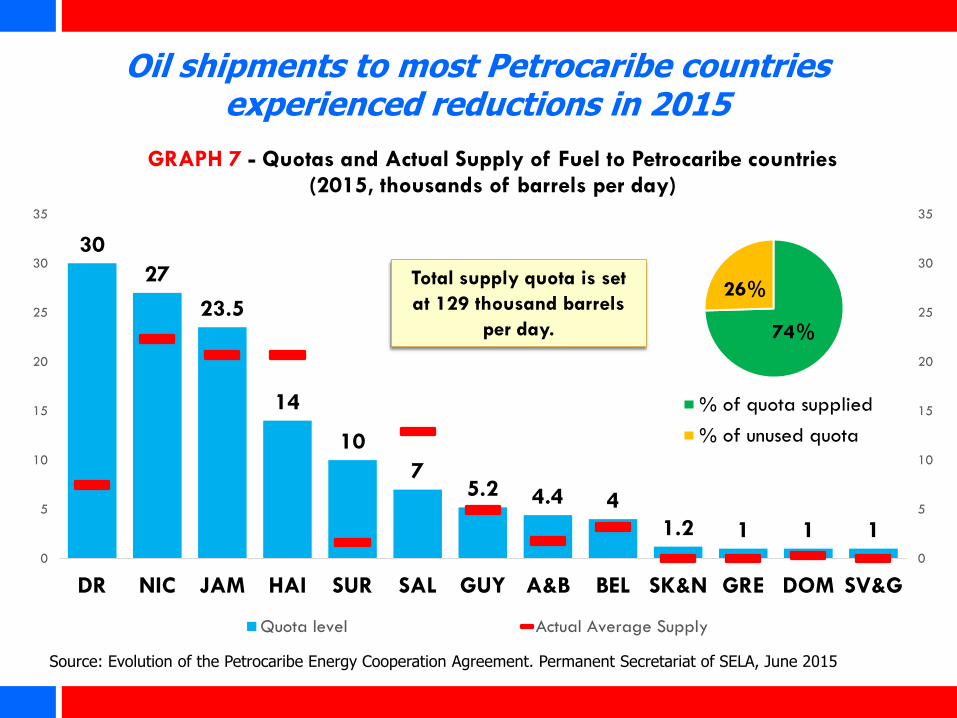
GRAPH 7 - Quotas and Actual Supply of Fuel to Petrocaribe countries (2015, thousands of barrels per day)
Quota level Actual Average Supply
74%
26%
% of quota supplied
% of unused quota
Source: Evolution of the Petrocaribe Energy Cooperation Agreement. Permanent Secretariat of SELA, June 2015
Oil shipments to most Petrocaribe countries experienced reductions in 2015
Total supply quota is set
at 129 thousand barrels
per day.
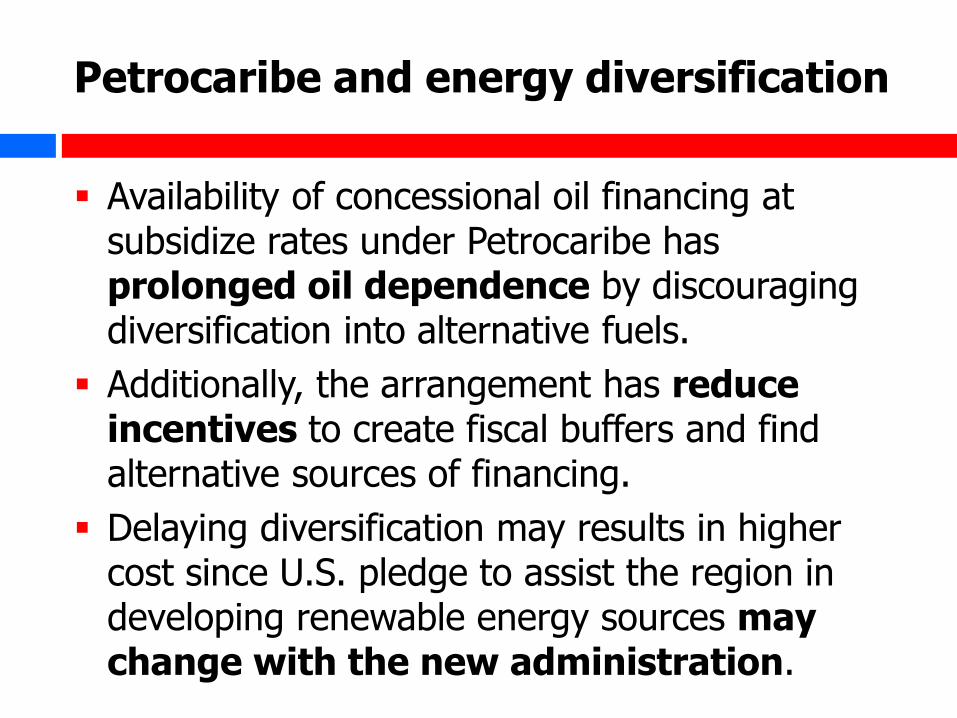
Petrocaribe and energy diversification
Availability of concessional oil financing at subsidize rates under Petrocaribe has prolonged oil dependence by discouraging diversification into alternative fuels.
Additionally, the arrangement has reduce incentives to create fiscal buffers and find alternative sources of financing.
Delaying diversification may results in higher cost since U.S. pledge to assist the region in developing renewable energy sources may change with the new administration.
Potential effects of Venezuela’s financial situation on Petrocaribe
3
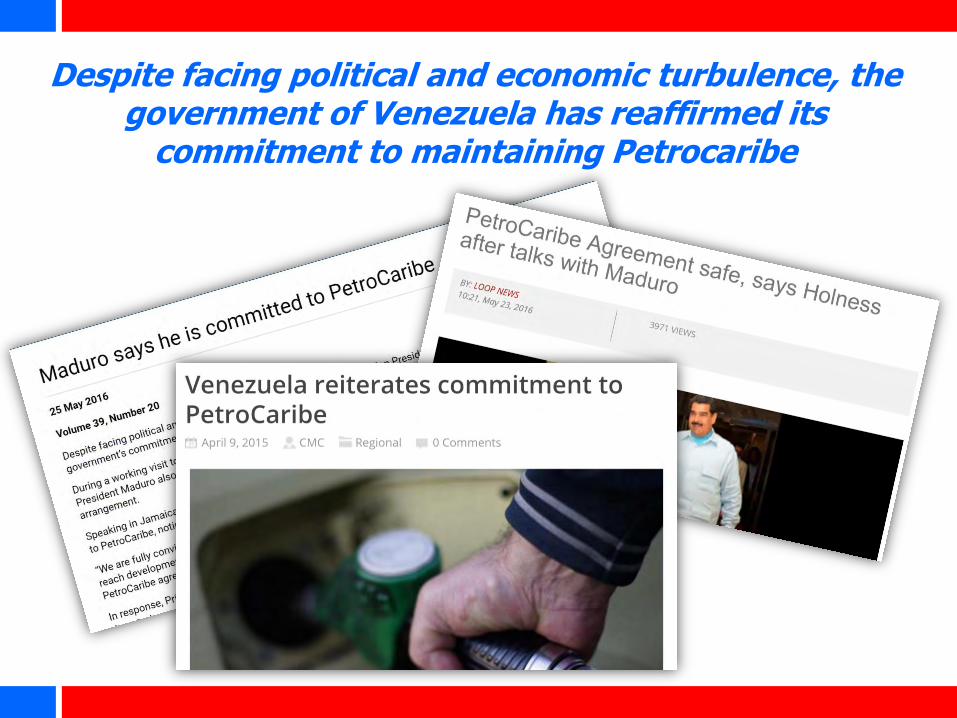
Despite facing political and economic turbulence, the government of Venezuela has reaffirmed its
commitment to maintaining Petrocaribe
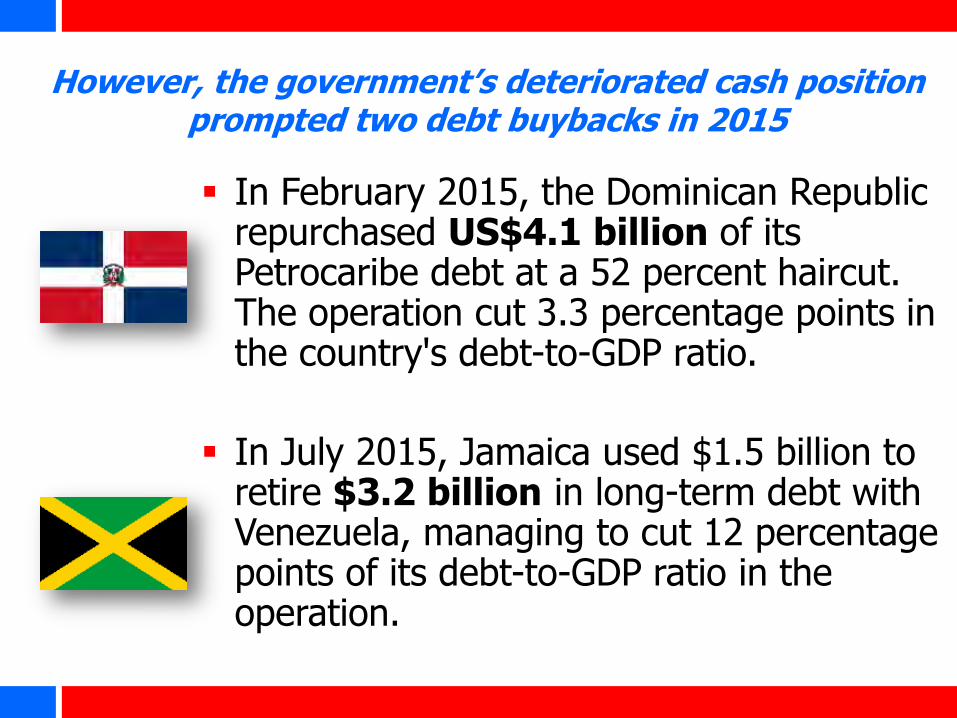
However, the government’s deteriorated cash position prompted two debt buybacks in 2015
In February 2015, the Dominican Republic repurchased US$4.1 billion of its Petrocaribe debt at a 52 percent haircut. The operation cut 3.3 percentage points in the country's debt-to-GDP ratio.
In July 2015, Jamaica used $1.5 billion to retire $3.2 billion in long-term debt with Venezuela, managing to cut 12 percentage points of its debt-to-GDP ratio in the operation.
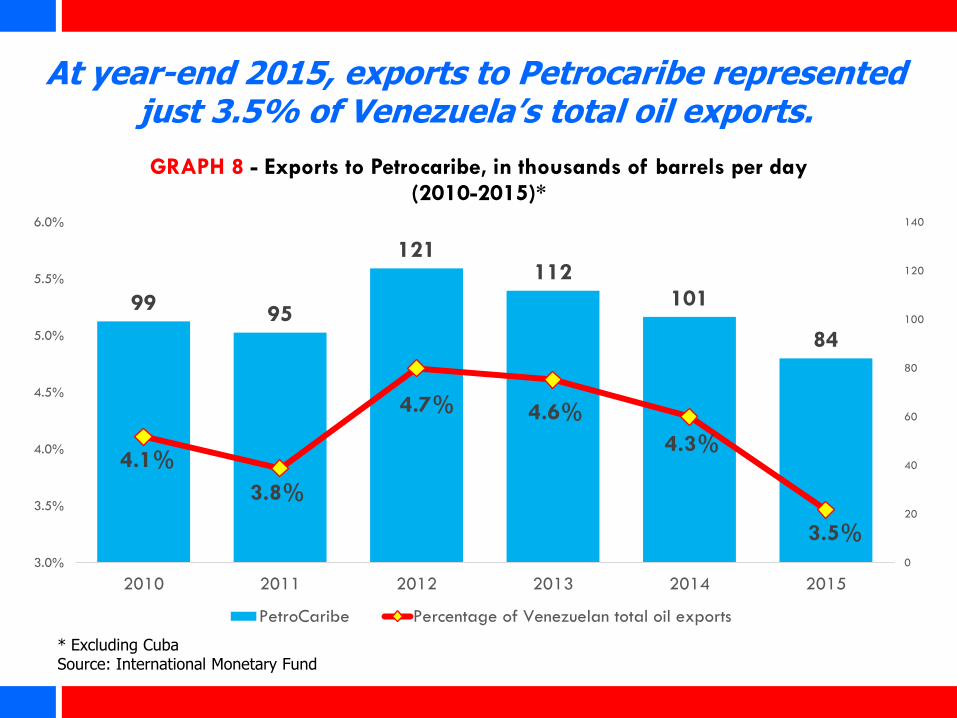
99 95
121 112
101
84
4.1%
3.8%
4.7% 4.6%
4.3%
3.5% 0
20
40
60
80
100
120
140
3.0%
3.5%
4.0%
4.5%
5.0%
5.5%
6.0%
2010 2011 2012 2013 2014 2015
GRAPH 8 - Exports to Petrocaribe, in thousands of barrels per day (2010-2015)*
PetroCaribe Percentage of Venezuelan total oil exports
At year-end 2015, exports to Petrocaribe represented just 3.5% of Venezuela’s total oil exports.
* Excluding Cuba Source: International Monetary Fund
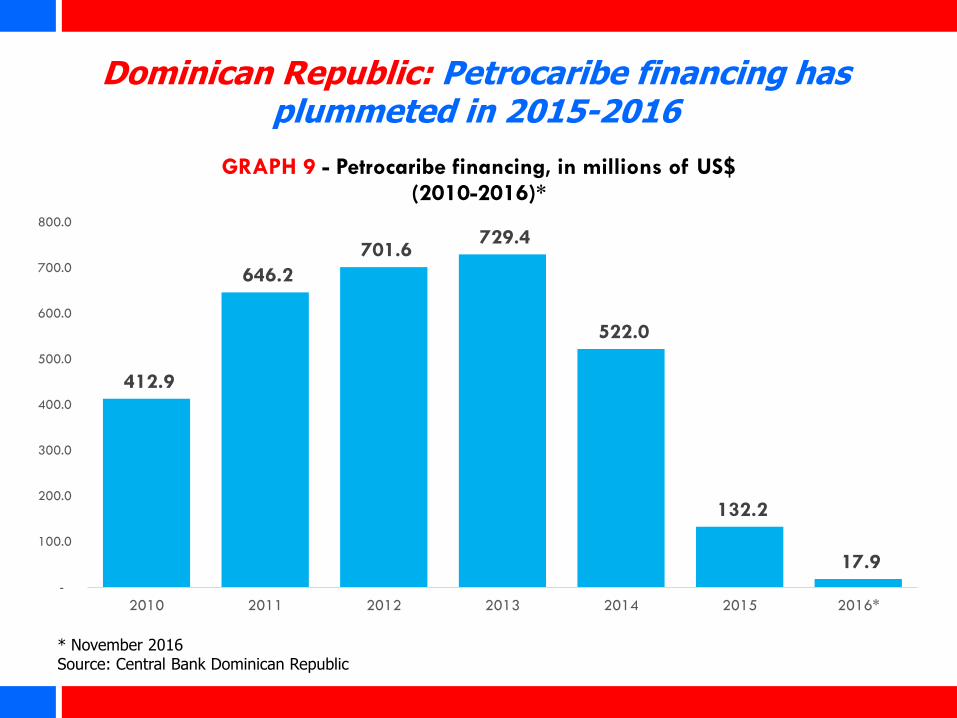
Dominican Republic: Petrocaribe financing has plummeted in 2015-2016
* November 2016 Source: Central Bank Dominican Republic
412.9
646.2
701.6 729.4
522.0
132.2
17.9 -
100.0
200.0
300.0
400.0
500.0
600.0
700.0
800.0
2010 2011 2012 2013 2014 2015 2016*
GRAPH 9 - Petrocaribe financing, in millions of US$ (2010-2016)*
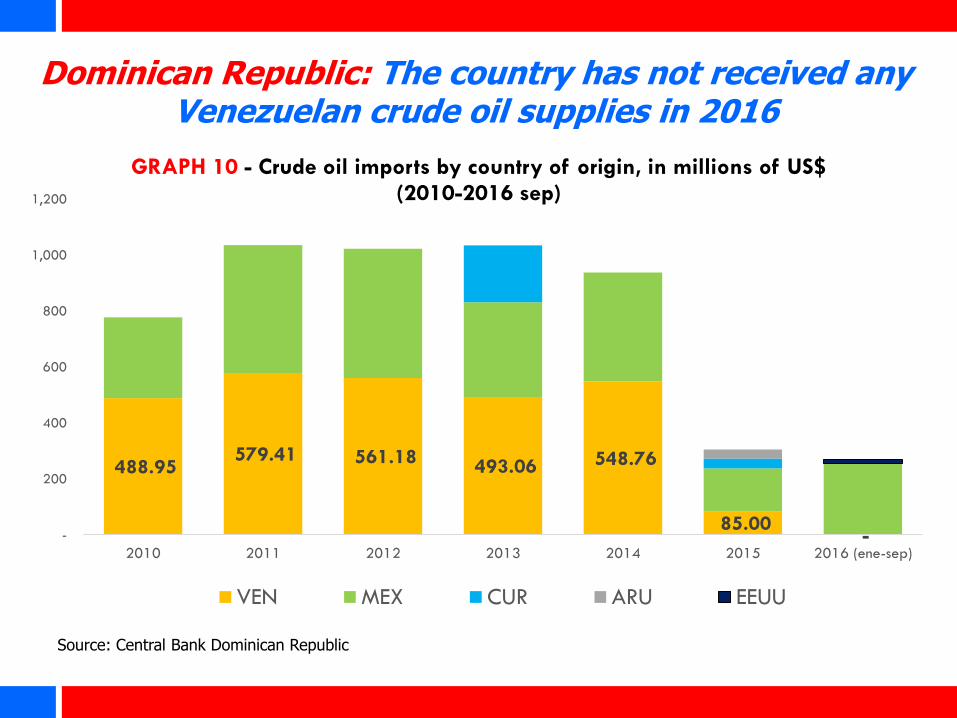
488.95 579.41 561.18
493.06 548.76
85.00 - -
200
400
600
800
1,000
1,200
2010 2011 2012 2013 2014 2015 2016 (ene-sep)
GRAPH 10 - Crude oil imports by country of origin, in millions of US$ (2010-2016 sep)
VEN MEX CUR ARU EEUU
Dominican Republic: The country has not received any Venezuelan crude oil supplies in 2016
Source: Central Bank Dominican Republic
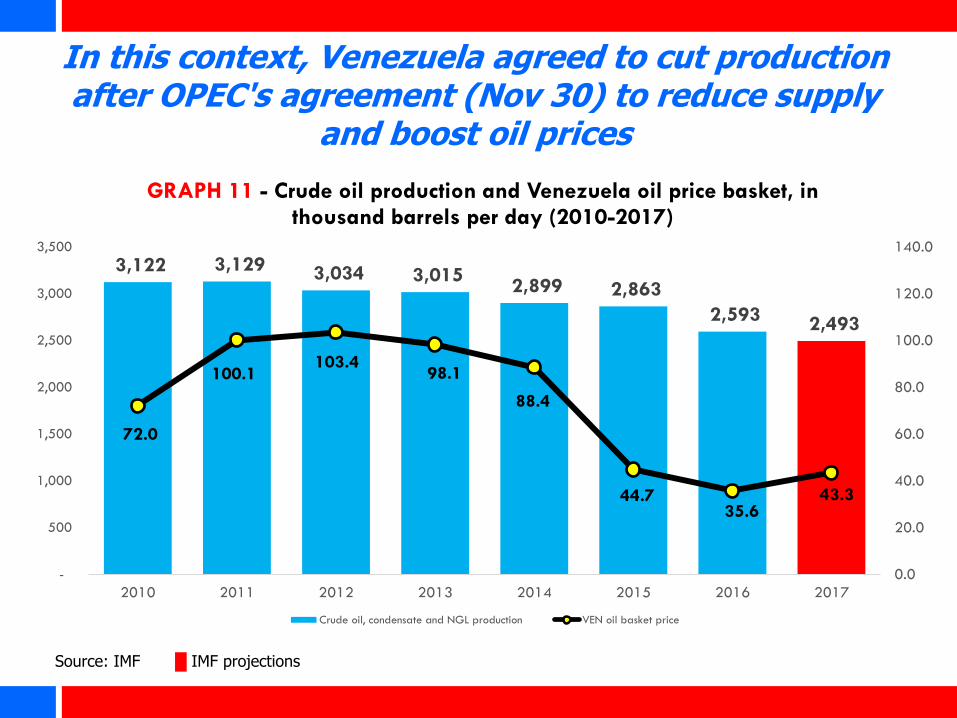
Source: IMF █ IMF projections
In this context, Venezuela agreed to cut production after OPEC's agreement (Nov 30) to reduce supply
and boost oil prices
3,122 3,129 3,034 3,015 2,899 2,863
2,593 2,493
72.0
100.1 103.4
98.1
88.4
44.7 35.6
43.3
0.0
20.0
40.0
60.0
80.0
100.0
120.0
140.0
-
500
1,000
1,500
2,000
2,500
3,000
3,500
2010 2011 2012 2013 2014 2015 2016 2017
GRAPH 11 - Crude oil production and Venezuela oil price basket, in thousand barrels per day (2010-2017)
Crude oil, condensate and NGL production VEN oil basket price
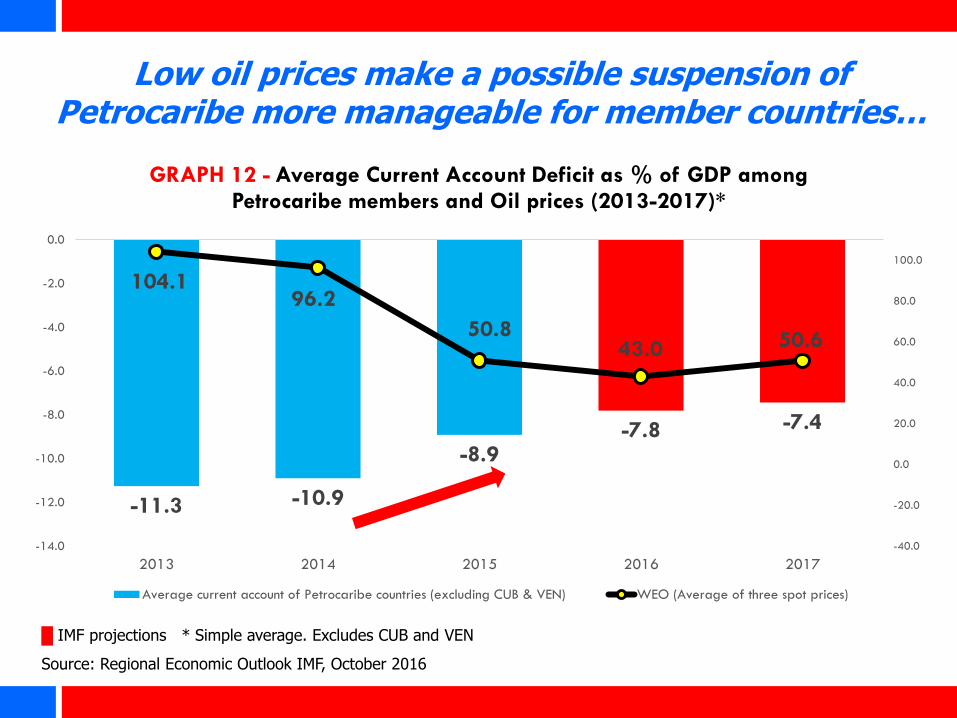
Low oil prices make a possible suspension of Petrocaribe more manageable for member countries…
█ IMF projections * Simple average. Excludes CUB and VEN
Source: Regional Economic Outlook IMF, October 2016
-11.3 -10.9
-8.9 -7.8 -7.4
104.1 96.2
50.8 43.0 50.6
-40.0
-20.0
0.0
20.0
40.0
60.0
80.0
100.0
-14.0
-12.0
-10.0
-8.0
-6.0
-4.0
-2.0
0.0
2013 2014 2015 2016 2017
GRAPH 12 - Average Current Account Deficit as % of GDP among Petrocaribe members and Oil prices (2013-2017)*
Average current account of Petrocaribe countries (excluding CUB & VEN) WEO (Average of three spot prices)
If Petrocaribe ends, the impact would differ across the membership…
In general, governments receiving large flows and without alternative financing sources would be most affected, while those that have built buffers, or have alternative financing sources, should be affected less.
Impact on Cuba would be negligible, unless Venezuela decides to end the CIC as well.
However, a large part of the impact of a potential end to Petrocaribe has already materialized (with much lower oil prices/Petrocaribe financing).
Therefore, what could have been an abrupt external shock has turned into a gradual transition.
Summary and final thoughts
Petrocaribe has served its membership well. But concessional oil financing has prolonged oil dependence and discourage energy diversification.
Rising oil prices could relieve some pressure on Venezuela's fiscal accounts, but diminished production capacity, deterioration of living standards, excessive regulation and rising debt obligations make a rapid recovery unlikely.
Indications point to an unofficial scale back of Petrocaribe as Venezuela increases focus on U.S. and China. Low oil prices make a possible suspension of Petrocaribe more manageable for member countries, depending on market access.

Frank Fuentes Brito
Dominican Republic’s Representative at the IMF & Senior Advisor to the Executive Director of the Brazilian Constituency
January 2017
Venezuela—Outlook for Petrocaribe and Impact on the Caribbean