taxation system, macroeconomic and energy · pdf fileembassy of the bolivarian republic of...
TRANSCRIPT
Embassy of the Bolivarian Republic of Venezuela
Venezuela Energy OutlookVenezuela Energy Outlook
TAXATION SYSTEM, MACROECONOMIC AND TAXATION SYSTEM, MACROECONOMIC AND ENERGY OUTLOOK, INDUSTRIAL AND EXCHANGE ENERGY OUTLOOK, INDUSTRIAL AND EXCHANGE POLICY IN VENEZUELA POLICY IN VENEZUELA
Bolivarian HallBolivarian HallWashington, DCWashington, DCOctober 31October 31stst, 2006, 2006
Embassy of the BolivarianEmbassy of the BolivarianRepublic of VenezuelaRepublic of Venezuela

Embassy of the Bolivarian Republic of Venezuela
0
20,000
40,000
60,000
80,000
100,000
120,000
1985
1987
1989
1991
1993
1995
1997
1999
2001
2003
2005
2007
2009
2011
2013
2015
2017
2019
Dai
ly P
rodu
ctio
n (m
bopd
)
0
20,000
40,000
60,000
80,000
100,000
120,000
Non OPEC Crude Oil Non-OPEC NGL
Non-OPEC Oil Sands 1.1% Growth
1.8% Growth 2.4% Growth
The Growing Differential Between Non-OPEC Supply Capacity and
Global Demand
Growing Gap Between Global Demand and Non-OPEC Supply
Source: PFC Energy, 2006

Embassy of the Bolivarian Republic of Venezuela
•• Increase and monetize VenezuelaIncrease and monetize Venezuela’’s reserve bases reserve base
•• Enhance VenezuelaEnhance Venezuela’’s capabilities in Production and Refinings capabilities in Production and Refining
•• Convert the Orinoco Belt into a light crude oil reservoirConvert the Orinoco Belt into a light crude oil reservoir
•• Be the #1 oil products exporter in the Western HemisphereBe the #1 oil products exporter in the Western Hemisphere
•• Use Natural Gas first to satisfy the domestic market and Use Natural Gas first to satisfy the domestic market and second to be an effective tool for energy regional integrationsecond to be an effective tool for energy regional integration
•• Enhance infrastructure capabilities and connectivityEnhance infrastructure capabilities and connectivity
•• Enhance human talent in key core businessesEnhance human talent in key core businesses
•• Speed up market diversification to emerging countriesSpeed up market diversification to emerging countries
•• Diversify supply base of technology, goods & servicesDiversify supply base of technology, goods & services
•• Increase local content and endogenous development in Increase local content and endogenous development in operating areasoperating areas
Venezuela Oil & Gas Business ObjectivesVenezuela Oil & Gas Business Objectives

Embassy of the Bolivarian Republic of Venezuela
Oil World Reserves
Source: Oil & Gas Journal, December 2005
Venezuela, including the Orinoco Belt, is the country with the world’s largest liquid hydrocarbon reserves (316 billion bbl)
Latin America (excluding Venezuela) 2%
Middle East & Iran49%
Venezuela21%
Canada 13%
Africa 7%Europa 7%
Asia Pacific 2%
Total World Reserves 1,527 Billion Barrels
80
236
316
Proved
Orinoco Belt (in process of certification)
Venezuelammmbbl
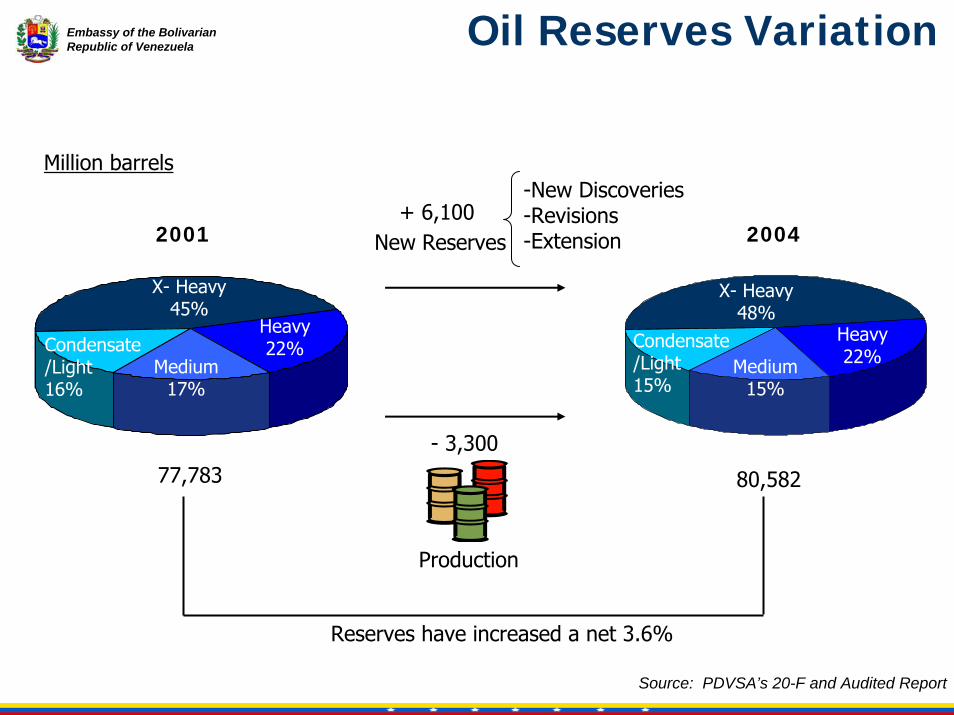
Embassy of the Bolivarian Republic of Venezuela Oil Reserves Variation
Source: PDVSA’s 20-F and Audited Report
Production
New Reserves2001 2004
- 3,300
+ 6,100
77,783 80,582
Million barrels
Reserves have increased a net 3.6%
Heavy22%
X- Heavy48%
Heavy22%
X- Heavy45%
Medium17%
Medium15%
Condensate/Light16%
Condensate/Light15%
-New Discoveries-Revisions-Extension
Embassy of the Bolivarian Republic of Venezuela
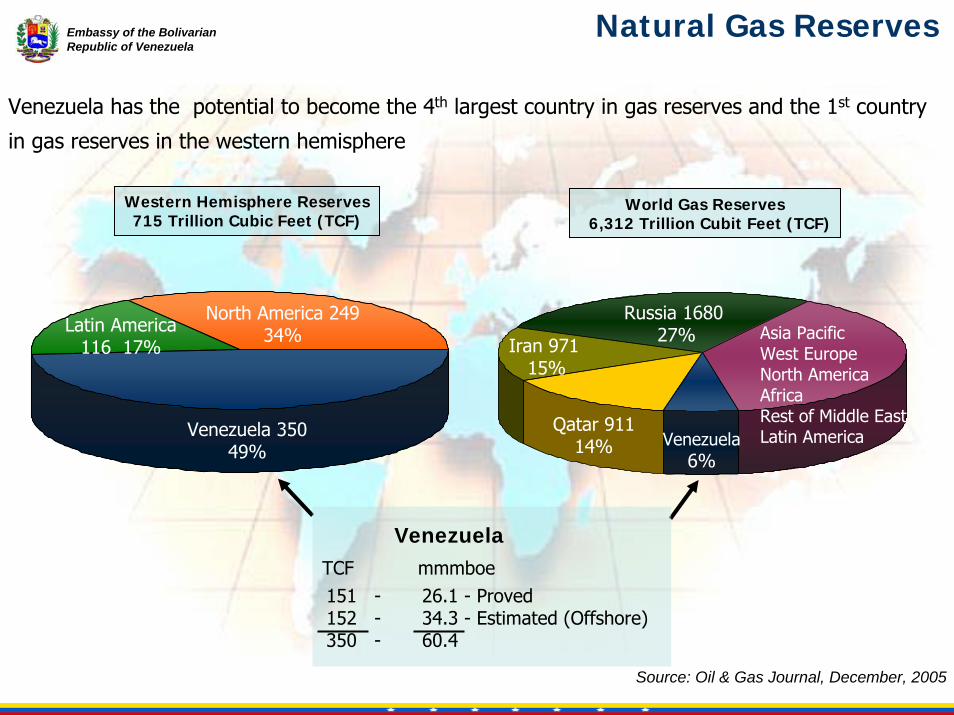
Natural Gas Reserves
Source: Oil & Gas Journal, December, 2005
Venezuela 35049%
North America 24934%Latin America
116 17%
Western Hemisphere Reserves715 Trillion Cubic Feet (TCF)
Venezuela has the potential to become the 4th largest country in gas reserves and the 1st country
in gas reserves in the western hemisphere
39%
Qatar 91114%
Iran 971 15%
Russia 1680 27% Asia Pacific
West EuropeNorth AmericaAfricaRest of Middle EastLatin America
World Gas Reserves6,312 Trillion Cubit Feet (TCF)
Venezuela6%
151 - 26.1 - Proved 152 - 34.3 - Estimated (Offshore)350 - 60.4
TCF mmmboe
Venezuela
Embassy of the Bolivarian Republic of Venezuela
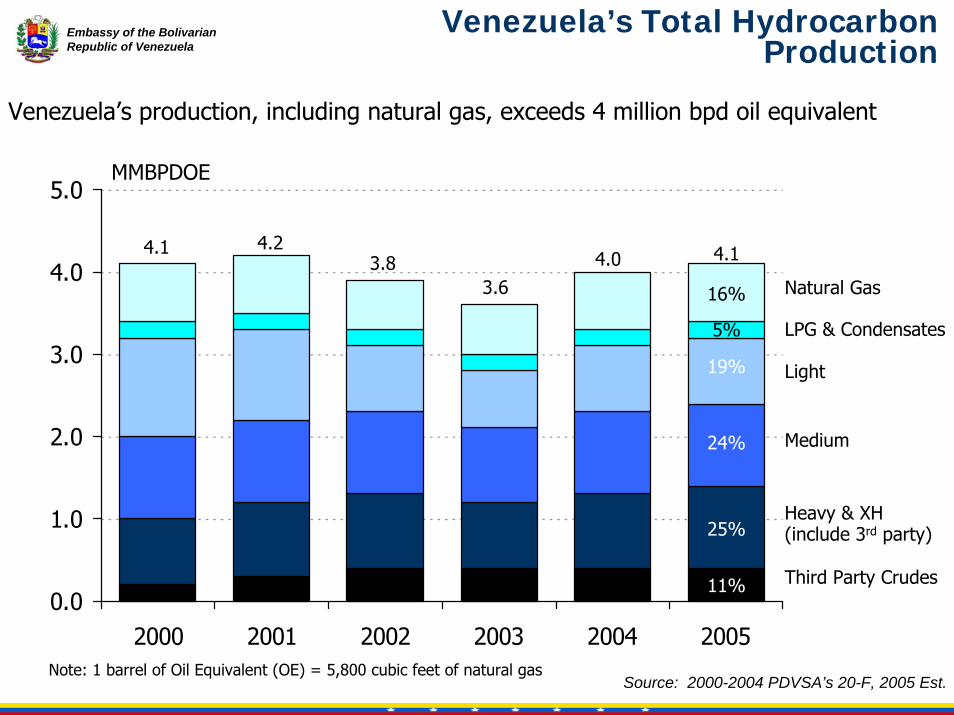
Venezuela’s Total Hydrocarbon Production
Source: 2000-2004 PDVSA’s 20-F, 2005 Est.
0.0
1.0
2.0
3.0
4.0
5.0
2000 2001 2002 2003 2004 2005
Natural Gas
LPG & Condensates
Light
Medium
Heavy & XH(include 3rd party)
Third Party Crudes
MMBPDOE
4.1 4.23.8
3.64.0 4.1
16%
5%
19%
24%
25%
11%
Note: 1 barrel of Oil Equivalent (OE) = 5,800 cubic feet of natural gas
Venezuela’s production, including natural gas, exceeds 4 million bpd oil equivalent

Embassy of the Bolivarian Republic of Venezuela
Supply & Disposition of Liquid Hydrocarbons (mbd)
2004 2005PDVSA 3rd Parties Vnzla PDVSA 3rd Parties Vnzla
Supply (Production of Liquid Hidrocarbons)PDVSA's Own Production 2,066 - 2,066 2,109 - 2,109 Operating Service Agreements 519 - 519 502 - 502 Extra-heavy Crude (less 8 API) 38 - 38 61 - 61 Sub-total PDVSA's crude 2,623 - 2,623 2,672 - 2,672 Orinoco Belt Associations (% PDVSA's Equity crude):
Petrozuata (49.9%) 62 62 124 60 60 120 PDVSA Cerro Negro (41.67%) 50 70 120 51 71 122 PDVSA Sincor (38%) 66 109 175 73 120 193 Ameriven / Corpoguanipa (30%) 32 74 106 50 117 167
Sub-total Orinoco Belt Association 210 315 525 234 368 602 LPG 166 - 166 165 - 165 Total Production of Liquid Hidrocarbons 2,999 315 3,314 3,071 368 3,439
Disposition (Exports and Local Market)Crude Own Production 1,617 - 1,617 1,641 - 1,641 Bitor (Orimulsion / Fuel Oil) 53 - 53 86 - 86 Refined Products 610 - 610 594 - 594 LPG 49 - 49 56 - 56 Sub-total PDVSA's crude 2,329 - 2,329 2,377 - 2,377 Orinoco Belt Associations:
Petrozuata 40 40 80 45 45 90 PDVSA Cerro Negro 51 71 122 53 76 129 PDVSA Sincor 76 123 199 81 131 212 Ameriven / Corpoguanipa 31 73 104 56 129 185
Sub-total Orinoco Belt Association 198 307 505 235 381 616 Total Exports 2,527 307 2,834 2,612 381 2,993 Local Market Consumption 485 - 485 506 - 506 Total Exports and Local Market 3,012 307 3,319 3,118 381 3,499
Inventory change & volume net gains / (losses) 13 (8) 5 47 13 60

Embassy of the Bolivarian Republic of Venezuela
PDVSA’s 2005 Crude's and Products Flow (mbd)
Refined Product
Sales
Crude Sales
Crude & LPG
Production
Refined Product
Purchases (Wholesale)
Crude Spot Purchases
Refineries Abroad
Crude Exports
Local Refineries
Local Market
PDVSA’s Supply Disposition
Product Exports
Consolidated Sales
506
650
1,831
1,204
2,628
1,156
1,472
627
International Activity

Embassy of the Bolivarian Republic of Venezuela
Venezuela’s Crude Oil Production
Source: 2000-2005 PODE, 2006-2012 PDVSA
0.0
1.0
2.0
3.0
4.0
5.0
6.0
7.0
'00 '01 '02 '03 '04 '05 '06 '07 '08 '09 '10 '11 '12
Risk Sharing Exploration
New JV & Projects
Own Operations
Existing Joint Ventures
Operating Joint Partnerships
3.2 3.33.0
2.83.1
3.3 3.43.8
4.1
4.64.9
5.55.8
MMBPD
Embassy of the Bolivarian Republic of Venezuela
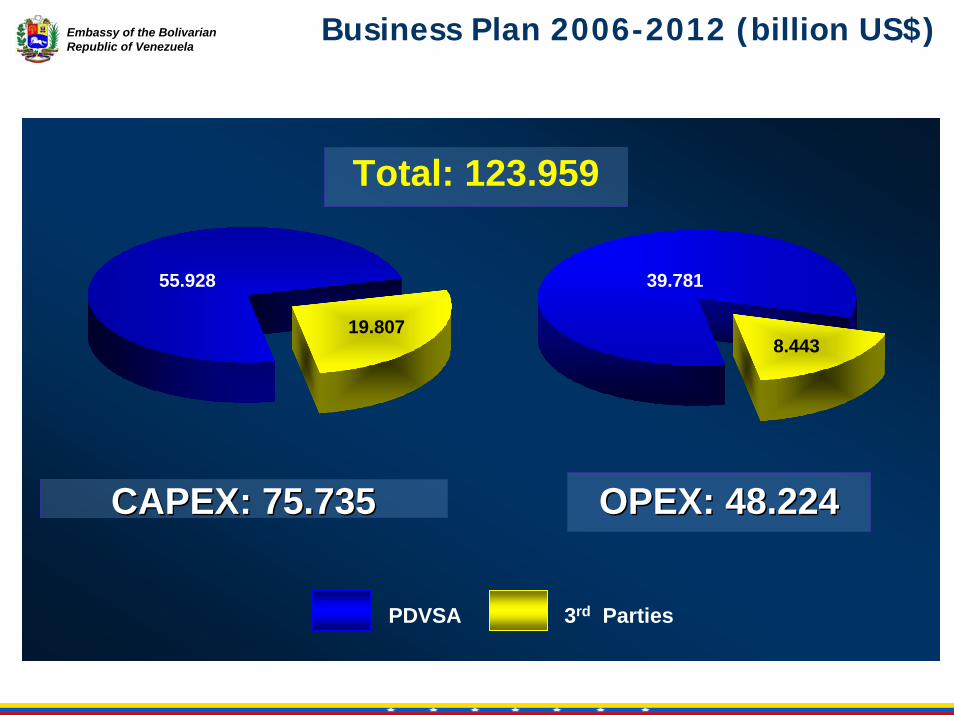
CAPEX: 75.735CAPEX: 75.735 OPEX: 48.224OPEX: 48.224
55.928
19.807
39.781
8.443
PDVSA 3rd Parties
Total: 123.959
Business Plan 2006-2012 (billion US$)
Embassy of the Bolivarian Republic of Venezuela
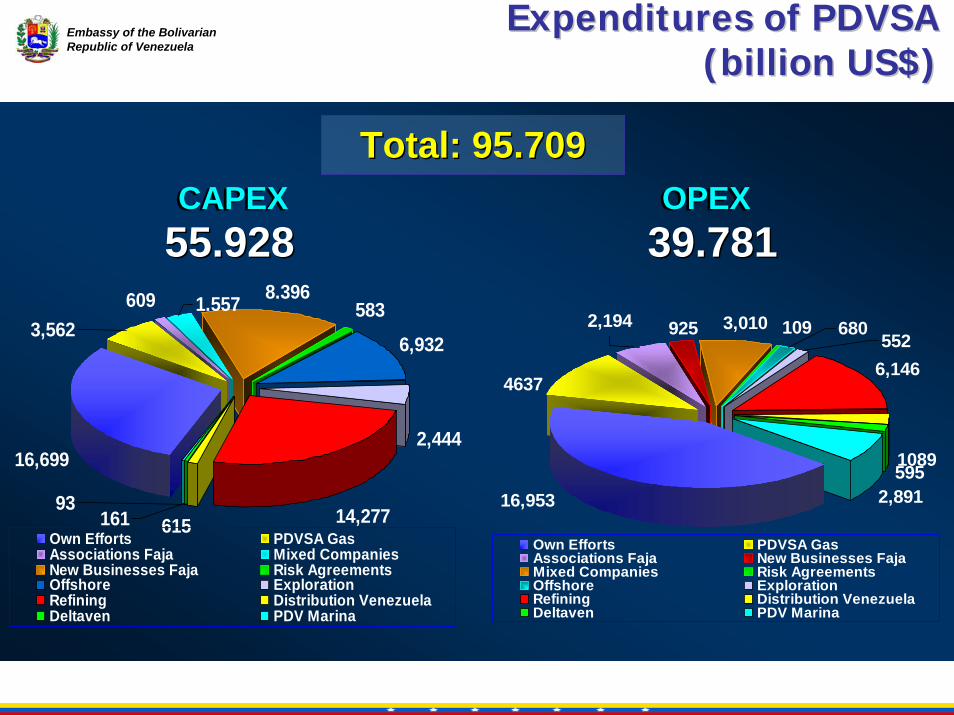
CAPEXCAPEX
16,699
609 583
6,932
2,444
14,277615
3,562
93161
8.3961.557
Own Efforts PDVSA GasAssociations Faja Mixed CompaniesNew Businesses Faja Risk AgreementsOffshore ExplorationRefining Distribution VenezuelaDeltaven PDV Marina
OPEXOPEX
3,010 109
6,146
1089595
2,89116,953
680552
9252,194
4637
Own Efforts PDVSA GasAssociations Faja New Businesses FajaMixed Companies Risk AgreementsOffshore ExplorationRefining Distribution VenezuelaDeltaven PDV Marina
Total: 95.709Total: 95.709
55.92855.928 39.78139.781
Expenditures of PDVSA Expenditures of PDVSA (billion US$)(billion US$)

Embassy of the Bolivarian Republic of Venezuela
CAPEXCAPEX
1,882
5.703
1.575
8.067
1,496 1.083
Associations Faja New Businesses FajaMixed Companies Risk AgreementsOffshore Refining
19.80719.807OPEXOPEX8.4438.443
Total: 28.250Total: 28.250
3,459
685
8892,892
519
Associations Faja New Businesses FajaMixed Companies Risk AgreementsOffshore
Expenditures Third Parties Expenditures Third Parties (billion US$)(billion US$)

Embassy of the Bolivarian Republic of Venezuela
Summary: Capital Investment Plan 2006 - 2012
$MMM Est.
2005 2006 2007 2008 2009 2010 2011 2012 Total
E&P Exploration 0.2 0.4 0.4 0.5 0.4 0.3 0.2 0.2 2.4
Production 1.9 2.5 2.6 2.4 2.4 2.5 2.2 2.1 16.7
Operating Joint Partnership's 0.6 0.7 0.7 0.5 0.5 0.4 0.2 0.1 3.1
Orinoco Belt 0.0 0.5 0.3 1.9 4.9 3.9 4.0 3.5 19.0
Profit Sharing Agreements 0.1 0.4 0.3 0.2 0.4 0.4 0.0 0.0 1.7
Gas 0.7 2.3 2.5 2.2 2.5 2.2 2.5 2.0 16.2
E&P Total 3.5 6.7 6.8 7.7 11.1 9.6 9.2 8.0 59.0
Refining 0.2 0.6 3.4 3.7 3.8 3.3 1.2 0.3 16.3
Others 0.4 0.2 0.2 0.2 0.3 0.6 0.5 0.0 2.1
TOTAL 4.1 7.5 10.4 11.6 15.3 13.5 10.8 8.3 77.4
Medium Term Plan 2006-2012

Embassy of the Bolivarian Republic of Venezuela
Production Schemes
PDVSA
Pro
duct
ion
Sch
emes
Unconventional oil & gas drilling (fracture stimulationand horizontal drilling).
Secondary recoveryWater & gas injection
Slant drilling/horizontalDrilling, commingle wells
Private participant involvedOn offshore drilling and production by special rigs (jackups, drill ships, semi submersible)
Traditional Areas
Onshore
PDVSA60 – 80%
Private Participation (operates)20 – 40%
Offshore
Third PartiesOperate100%
Own Operations Operating Joint Partnership Private
PDVSA51%
Private Participation (operates)
49%
Traditional Areas Orinoco Belt
Key Drivers:
Embassy of the Bolivarian Republic of Venezuela
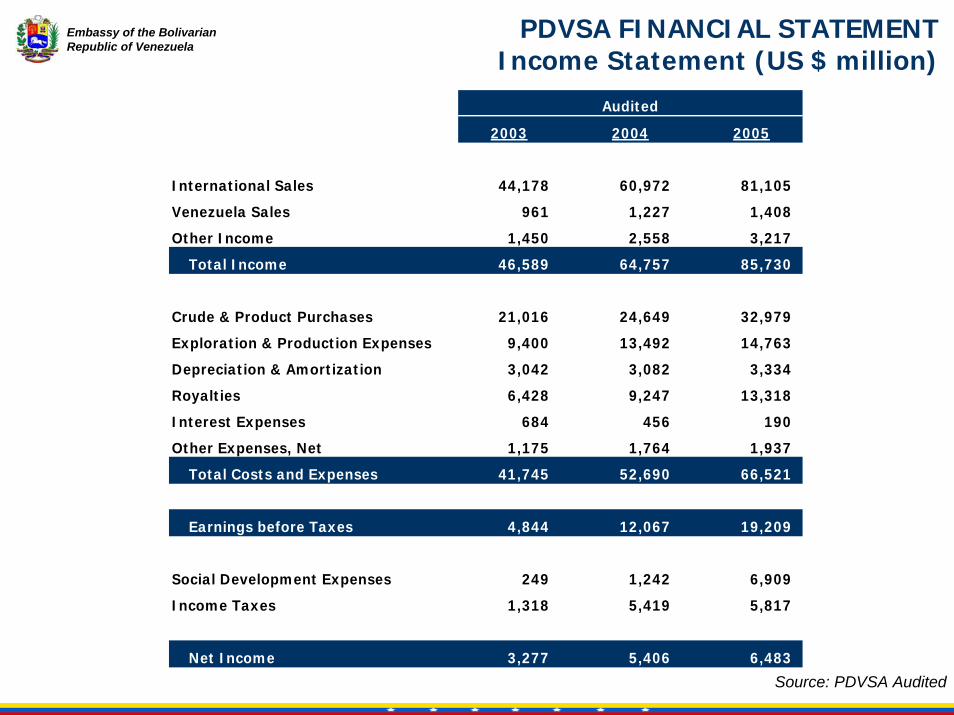
PDVSA FINANCIAL STATEMENTIncome Statement (US $ million)
Source: PDVSA Audited
Audited
2003 2004 2005
International Sales 44,178 60,972 81,105
Venezuela Sales 961 1,227 1,408
Other Income 1,450 2,558 3,217
Total Income 46,589 64,757 85,730
Crude & Product Purchases 21,016 24,649 32,979
Exploration & Production Expenses 9,400 13,492 14,763
Depreciation & Amortization 3,042 3,082 3,334
Royalties 6,428 9,247 13,318
Interest Expenses 684 456 190
Other Expenses, Net 1,175 1,764 1,937
Total Costs and Expenses 41,745 52,690 66,521
Earnings before Taxes 4,844 12,067 19,209
Social Development Expenses 249 1,242 6,909
Income Taxes 1,318 5,419 5,817
Net Income 3,277 5,406 6,483

Embassy of the Bolivarian Republic of Venezuela Cash Contribution’s to the Nation
11.89.7 10.0
16.5
24.627.5
23.0
32.6
38.9
19.5
0
5
10
15
20
25
30
35
40
45
2001 2002 2003 2004 2005
Foreign Currency Revenues (cash)
FONDENFONDESPASocial ProgramsDividends
Royalties
Income Tax
$ billion
Increase of contributions to the nation has been in proportion to windfall revenues

Embassy of the Bolivarian Republic of Venezuela
Source : Lehman Brothers/ PDVSA
% Exploration Succeed (2003 – 2004)
Venezuela 70 %
% Exploration Succeed(1997 – 2003)
World
12 %
Venezuela
46 %
Exploration Indicators
Costs of Exploration per barrel / Discovered Reserves
1.04
1993 1995 1997 1999 2001 20030.0
0.5
1.0
1.5
2.0
2.5
3.0
$/b
l
Incl. revisions

Embassy of the Bolivarian Republic of Venezuela Exploration Objective 2005 - 2012
Production
New Reserves2005 2012
- 12,920
+ 15,847
81,307 84,230
Million barrels
Reserves will increase a net 3.6%
-Exploration (8,600)-Revisions-Extension
X- Heavy48%
Heavy22%Medium
15.5%
Condensate/Light14.5%
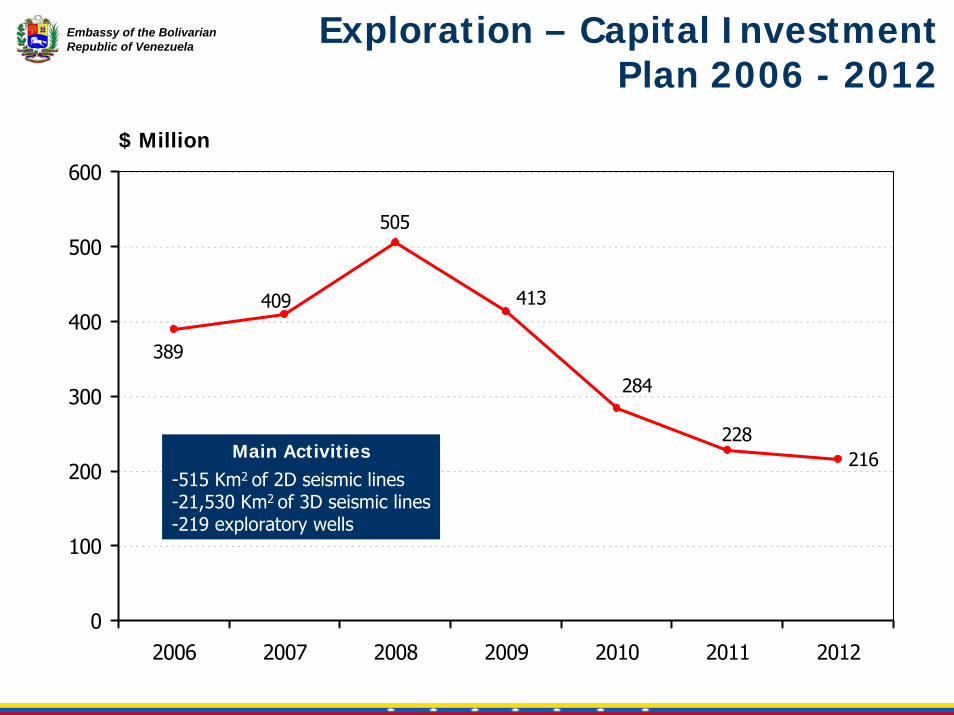
Embassy of the Bolivarian Republic of Venezuela Exploration – Capital Investment
Plan 2006 - 2012
216
389
409
505
413
284
228
0
100
200
300
400
500
600
2006 2007 2008 2009 2010 2011 2012
$ Million
-515 Km2 of 2D seismic lines-21,530 Km2 of 3D seismic lines-219 exploratory wells
Main Activities
Embassy of the Bolivarian Republic of Venezuela
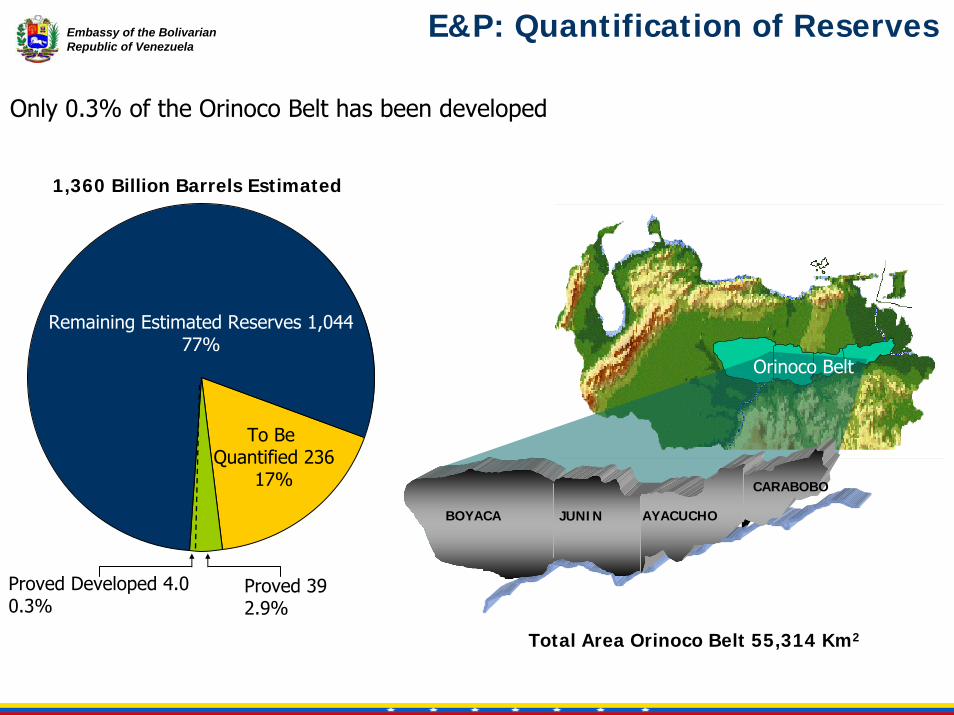
Remaining Estimated Reserves 1,04477%
To Be Quantified 236
17%
Proved 392.9%
Proved Developed 4.00.3%
1,360 Billion Barrels Estimated
MACHETE
R í o O r i n o c oBOYACA JUNIN
CARABOBO
AYACUCHO
Total Area Orinoco Belt 55,314 Km2
Orinoco Belt
Only 0.3% of the Orinoco Belt has been developed
E&P: Quantification of Reserves

Embassy of the Bolivarian Republic of Venezuela
Certification of Crude Oil Reserves by Independent Parties
SPAINIRAN
Rio Orinoco
N
5522
33 44
1155 PETROZUATA
San Cristobal
SINCOR
11
8899
1122
AMERIVEN 44
33
55 6677
11OCN
BITOR 44
22
PAR
QU
E N
ACIO
NAL
AGU
AR
O G
UAR
IQU
ITO
33
77
33
66
55
22 4444
11
66 33
77
77
33
44
11
Petrozuata
BRAZIL
INDIA
RUSSIA
RUSSIA
CHINA

Embassy of the Bolivarian Republic of Venezuela
0
200
400
600
800
1000
1200
1400
2005 2006 2007 2008 2009 2010 2011 2012
Initial Production
New Development I
New Development II
Optimization637687
807
1,207
MBPD
1,138
Orinoco Belt Production Profile
Norway
France
SINCOR PETROZUATA
USA
HAMACA
USAUK
CERRO NEGRO
Current Production – Strategic Associations

Embassy of the Bolivarian Republic of Venezuela
STAGESSTAGES 1T 2T 3T 4T 1T 2T 3T 4T 1T 2T 3T 4T 1T 2T 3T 4T
Data Package Preparation
20052005 20062006 20072007 20082008
- PDVSA stand-aloneCarabobo(3 Blocks)
Ayacucho(5 Blocks)
Junin(6 Blocks)
Quantification and Certification of Reserves
- PDVSA & Companies with Mou´sexecuted between governments
- Service Companies
Boy
acá
(6 B
lock
s)
Carabobo 1Junin sur
Ayacucho 7Junin 33
Junin 77
Ayacucho 3Junin 44
Quantification and Certification ProjectQuantification and Certification Projectof Orinoco Oil Belt Reservesof Orinoco Oil Belt Reserves

Embassy of the Bolivarian Republic of Venezuela
Canadian Tar Sands vs. Venezuelan FAJA
Production Process: Surface Mining
Estimated Production Cost
US$ 25 / Barrel*+
Upgrading cost
Estimated Recoverable Reserves
170 Bbls
*Source: Wall Street Journal: As Prices Surge, Oil Giants Turn Sludge Into Gold 03.27.2006
Production Process: Oil Drilling
Estimated Production CostProduction:
< US$ 1 / Barrel
Estimated Recoverable Reserves
236 Bbls
Upgrading:US$ 4 / Barrel
Description: Through a complex state of the art mining and production process, this bituminous sand is
transformed into Heavy Petroleum
Description: 9°API Crude oil produced under available technology, that is
upgraded into 32°API Crude
ROI=10% @ $40/barrelROI=10% @ $40/barrel ROI>200% @ $40/barrelROI>200% @ $40/barrel
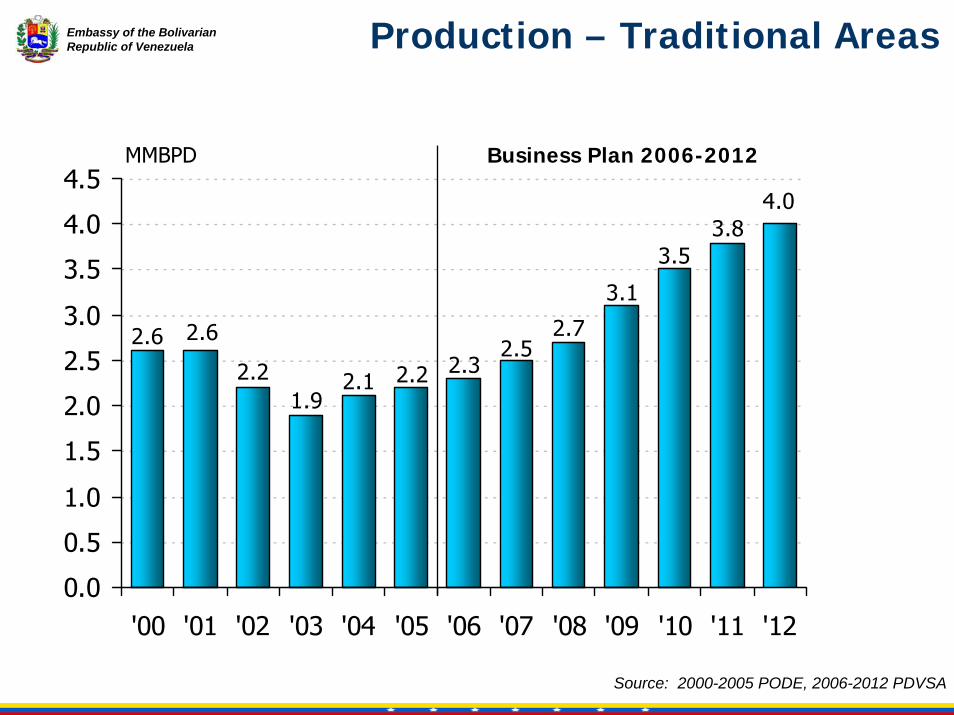
Embassy of the Bolivarian Republic of Venezuela Production – Traditional Areas
Source: 2000-2005 PODE, 2006-2012 PDVSA
4.03.8
3.5
3.1
2.72.5
2.32.22.11.9
2.2
2.62.6
0.0
0.5
1.0
1.5
2.0
2.5
3.0
3.5
4.0
4.5
'00 '01 '02 '03 '04 '05 '06 '07 '08 '09 '10 '11 '12
MMBPD Business Plan 2006-2012
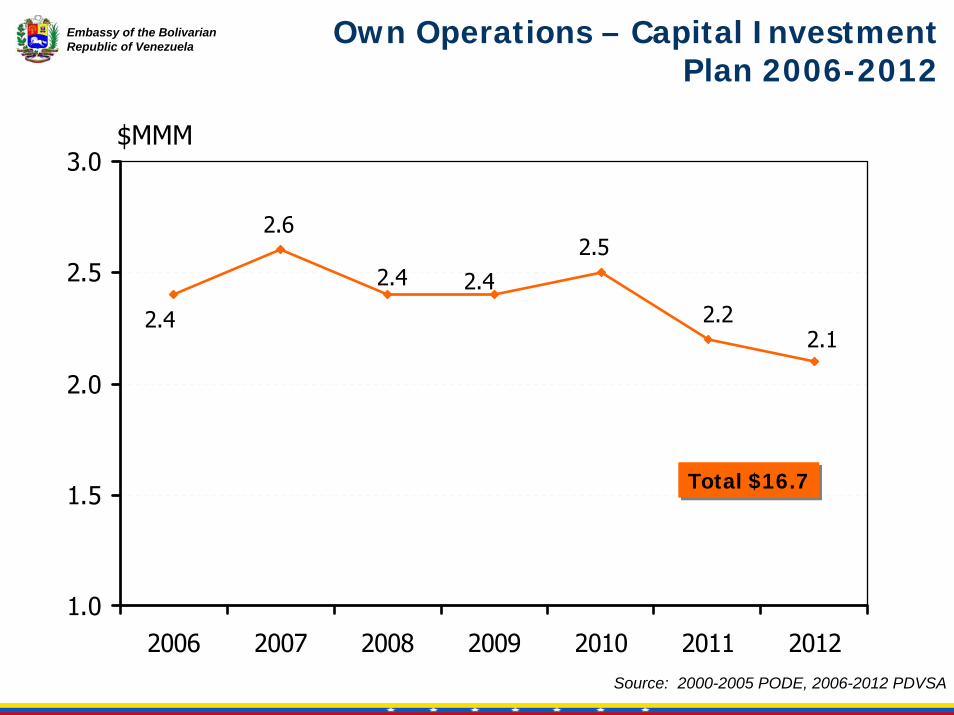
Embassy of the Bolivarian Republic of Venezuela Own Operations – Capital Investment
Plan 2006-2012
Source: 2000-2005 PODE, 2006-2012 PDVSA
2.12.2
2.52.42.4
2.6
2.4
1.0
1.5
2.0
2.5
3.0
2006 2007 2008 2009 2010 2011 2012
$MMM
Total $16.7Total $16.7
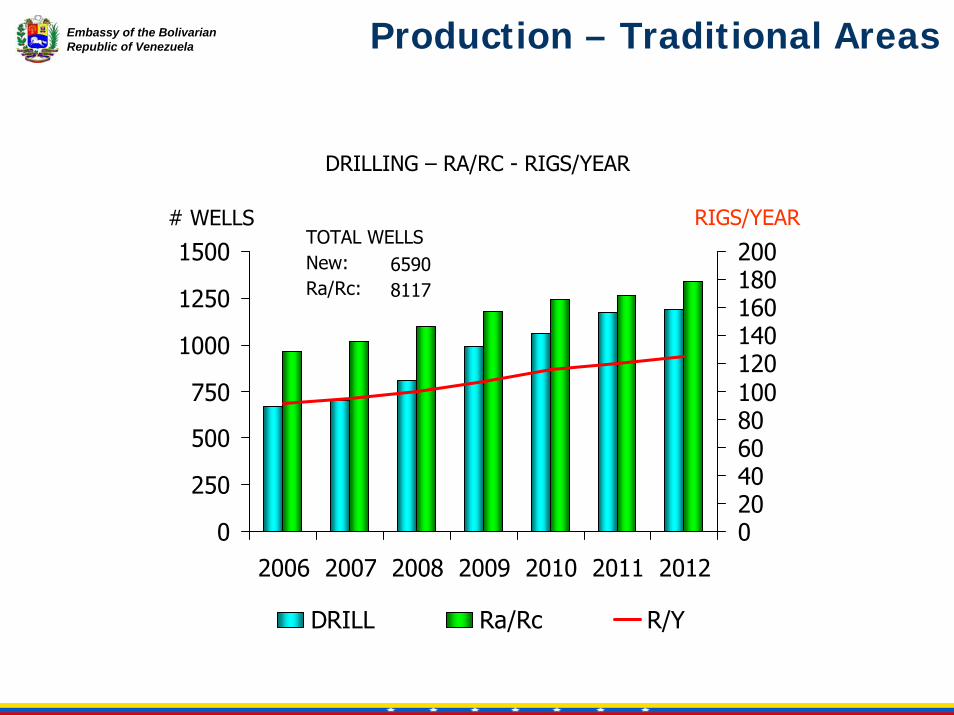
Embassy of the Bolivarian Republic of Venezuela Production – Traditional Areas
0
250
500
750
1000
1250
1500
2006 2007 2008 2009 2010 2011 2012020406080100120140160180200
DRILL Ra/Rc R/Y
# WELLSTOTAL WELLSNew:Ra/Rc:
RIGS/YEAR
65908117
DRILLING – RA/RC - RIGS/YEAR

Embassy of the Bolivarian Republic of Venezuela Infrastructure – Own Operations
Capacity of Installed Infrastructure
● Transportation network: 3,113 Km of crude oil pipeline (28).Throughput Capacity 6,340 mbd
3,781 Km of gas pipelines Throughput Capacity 2,748
● Storage capacity: 30 mmbbl (tank farms and shipping terminals). 50 mmbbl in storage tanks located in the Caribbean (Bonaire, the Bahamas & Curacao)
● Terminal Facilities: 9 maritime ports and 2 river ports
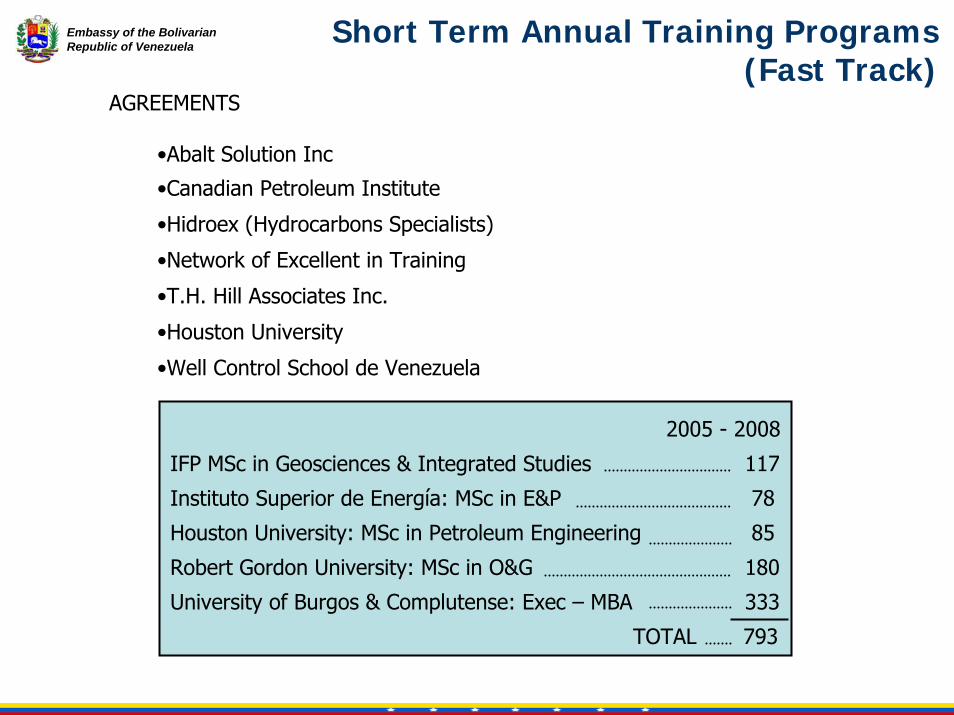
Embassy of the Bolivarian Republic of Venezuela Short Term Annual Training Programs
(Fast Track)AGREEMENTS
•Abalt Solution Inc
•Canadian Petroleum Institute
•Hidroex (Hydrocarbons Specialists)
•Network of Excellent in Training
•T.H. Hill Associates Inc.
•Houston University
•Well Control School de Venezuela
2005 - 2008
IFP MSc in Geosciences & Integrated Studies 117
Instituto Superior de Energía: MSc in E&P 78
Houston University: MSc in Petroleum Engineering 85
Robert Gordon University: MSc in O&G 180
University of Burgos & Complutense: Exec – MBA 333
TOTAL 793
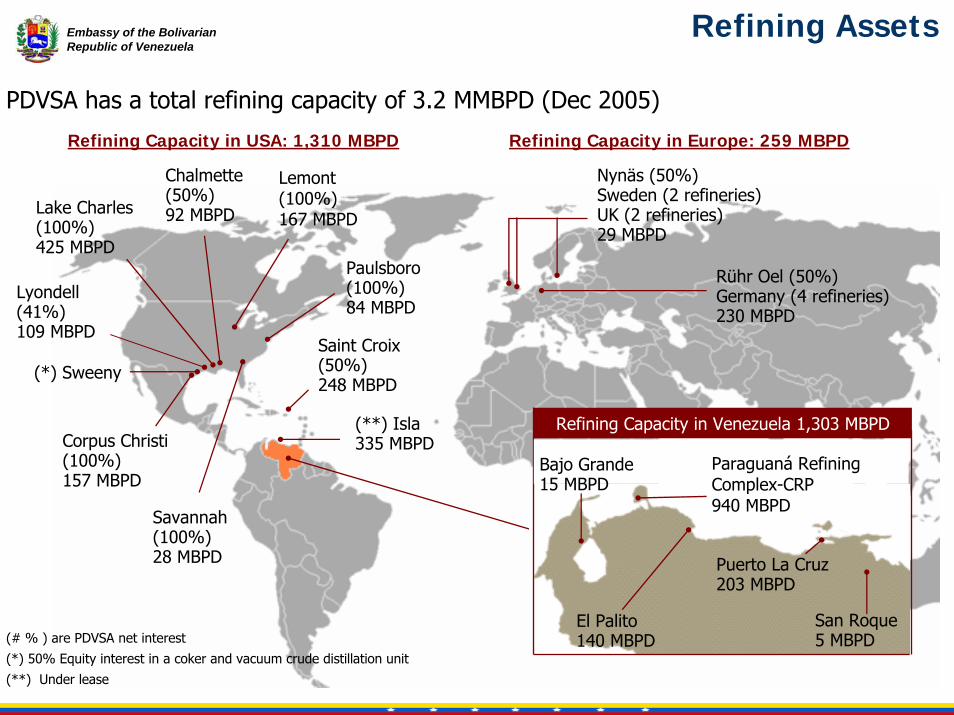
Embassy of the Bolivarian Republic of Venezuela
Refining Assets
PDVSA has a total refining capacity of 3.2 MMBPD (Dec 2005)
Chalmette (50%)92 MBPD
Paulsboro (100%)84 MBPD
Saint Croix (50%)248 MBPD
(**) Isla335 MBPD
(*) Sweeny
Lake Charles (100%)425 MBPD
Corpus Christi (100%)157 MBPD
Lyondell (41%)109 MBPD
Savannah (100%)28 MBPD
Nynäs (50%)Sweden (2 refineries)UK (2 refineries)29 MBPD
Rühr Oel (50%)Germany (4 refineries)230 MBPD
Puerto La Cruz203 MBPD
El Palito140 MBPD
San Roque5 MBPD
Refining Capacity in Venezuela 1,303 MBPD
Lemont (100%)167 MBPD
Paraguaná Refining Complex-CRP 940 MBPD
Bajo Grande15 MBPD
Refining Capacity in USA: 1,310 MBPD Refining Capacity in Europe: 259 MBPD
(# % ) are PDVSA net interest(*) 50% Equity interest in a coker and vacuum crude distillation unit(**) Under lease

Embassy of the Bolivarian Republic of Venezuela
6
5
4
32
1
Domestic Refining
NEW REFINERIES
4- Caripito Refinery – 50 MBPDAsphalt production
5- Cabruta Refinery- 400 MBPDConversion of extra-heavy crudesinto distillates
6- Santa Inés Refinery - 50 MBPDFuel supply for the domestic market
EXISTING REFINERIES
3- RPLC 200 MBPD- Conversion of residuals into distillates- Merey new desalting unit- Ethanol Fuel Project:
Lead elimination from gasolines and gradual substitution of MTBE/ TAME with Ethanol
2- RELP 140 MBPDProject for converting residuals into distillates- Conversion capacity increase- HDT Diesel – HDS VGO- New CCR
1- CRP 940 MBPD- Adapt the refinery to meet future quality
demands- Residuals to distillates conversion project- Downstream industrialization

Embassy of the Bolivarian Republic of Venezuela
Refining - International
Jamaica (50) 25
Brazil (200) 100
Uruguay (50)
Cabruta 400Santa Inés 50Caripito 50
Capacity in Venezuela MMBD
2005 1.3
2012 1.8
International Capacity MMBD
2005 2.0
2012 2.3
Cienfuegos 70
Total Investment: 16.3 US$ bnInvestment in Venezuela 14,2 (87%)Investment in Petroamerica 2,1 (13%)
Total : 3.3 4.1
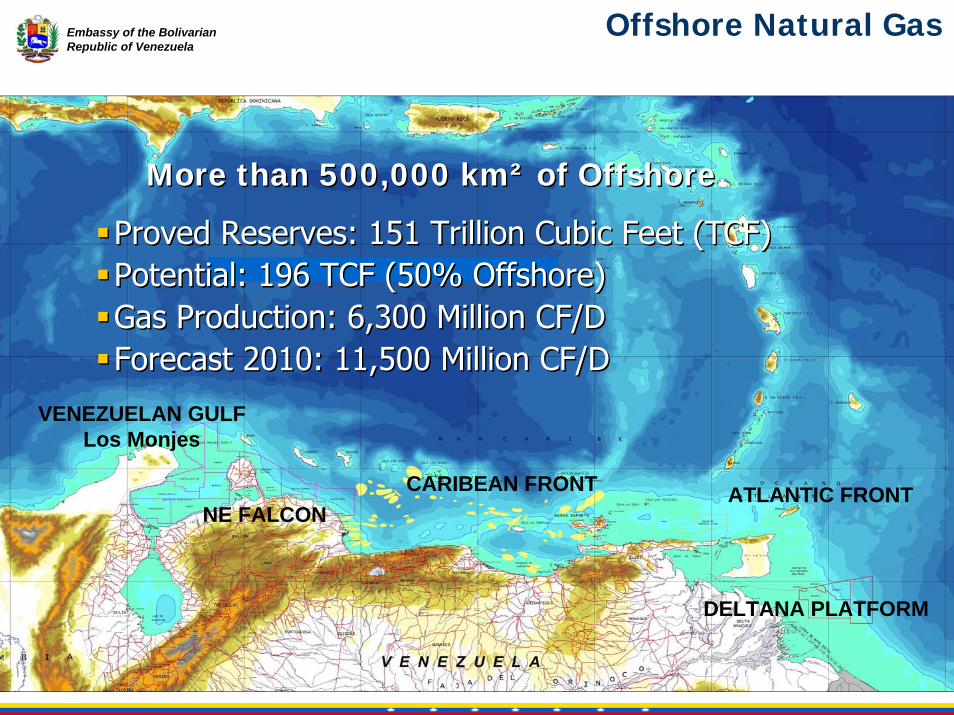
Embassy of the Bolivarian Republic of Venezuela
More than 500,000 km² of OffshoreMore than 500,000 km² of Offshore
VENEZUELAN GULFLos Monjes
NE FALCON CARIBEAN FRONT ATLANTIC FRONT
DELTANA PLATFORM
Offshore Natural Gas
Proved Reserves: 151 Trillion Cubic Feet (TCF)Potential: 196 TCF (50% Offshore)Gas Production: 6,300 Million CF/DForecast 2010: 11,500 Million CF/D
Proved Reserves: 151 Trillion Cubic Feet (TCF)Potential: 196 TCF (50% Offshore)Gas Production: 6,300 Million CF/DForecast 2010: 11,500 Million CF/D

Embassy of the Bolivarian Republic of Venezuela
Delta Caribe Project - Eastern Venezuela
CARUPANOCARUPANO RRíío Caribeo Caribe
Mariscal Sucre Project 14 TCF
CIGMA
LNG
Gas / Condensate
TUCUPITA
CUM
ANA
CUM
ANA
Export: 1000 MMCF
Plataforma DeltanaProject 15 TCF
Corocoro 450 MMB3TCF
Punta Pescador
Guarapiche
Punta Pescador
Delta Centro
ORINOCO BELT
ORINOCO BELT
Great South Gas Pipeline
•B-1
•B-2
•B-3
•B-4
•B-5 En estudio

Embassy of the Bolivarian Republic of Venezuela
Delta Caribe West – Rafael UrdanetaProject
Assigned Blocks under Exploration Licensing
Future Exploration Licenses
3 TCF0,5 mmmbls
27 TCF7 mmmbls
Assigned Blocks

Embassy of the Bolivarian Republic of Venezuela
PHASE I
PHASE II
PHASE III
PHASE IV
PROTECTEDAREASAFETYAREA
22 3200 8 57I - IV
PHASES
2004 - 2035
PERIOD LAND LOTSIN USE NET AREA (ha) SERVICE
LAND LOTSSERVICE
CORRIDORS (KM)
GASTREATMENT
CRUDEREFINING
CRUDE ANDPRODUCTSSTORAGE
LNG PLANTS
PETROCHEMICALPRODUCTS
PETROCHEMICAL PRODUCTS
GAS
G.T.L.
CRUDEPROCESSING
CRUDEUPGRADING
SOLIDSHANDLING
FERTILIZERS
ADMINISTRATIVE ANDSERVICE BUILDINGS
CONTAINERS
RESERVES
POWERGENERATION
PORTSERVICES
SERVICEDOCK
INDUSTRIALPARK
ACCOMMODATIONSCONSTRUCTION
RESIDENTIALAREA
LNGTERMINALS
CONTAINERDOCK
PRODUCTTERMINAL
PETROCHEMICALDOCK
CIGMA Project Master PlanCIGMA Project Master Plan
GÜIRIAGÜIRIA

Embassy of the Bolivarian Republic of Venezuela
13901443
931
2006 2009 2012
177137121
2006 2009 2012
965710
469
2006 2009 2012
North America
Latin America
Europe
Asia
CRUDE OIL EXPORTS BY DESTINATION (MBD)
765290
150
2006 2009 2012
Total ExportsInternationalization
Spot SalesOrinoco Belt/New Agreements
16711041630
-
258012541206120
329713441168785
2006 2009 2012
MBD: Thousands Barrels per Day
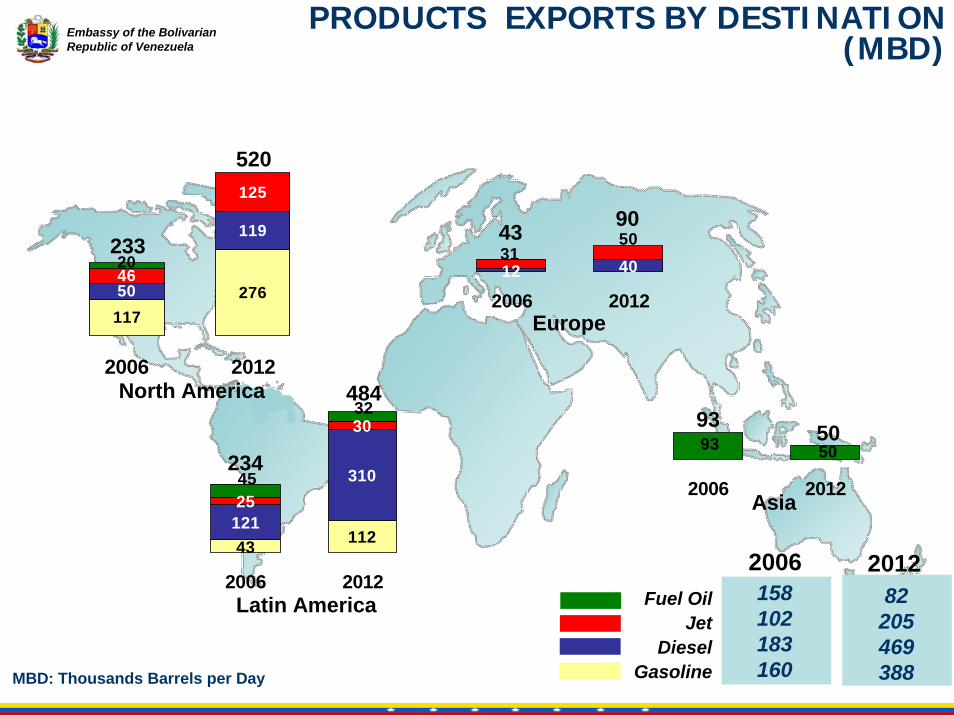
Embassy of the Bolivarian Republic of Venezuela
11727650
119
46
125
20
2006 2012
12 4050
31
2006 2012
43 112121
31025
30
45
32
2006 2012
North America
Latin America
Europe
Asia
PRODUCTS EXPORTS BY DESTINATION (MBD)
Fuel OilJet
DieselGasoline
158102183160
2006 2012
233
520
234
484
43 90
5093
2006 2012
93 50
82205469388MBD: Thousands Barrels per Day

Embassy of the Bolivarian Republic of Venezuela
Regional Energy Integration
Name: Cien Fuegos RefineryCapacity: 70 MbpdPartners: PDVSA (100%)
Name: Abreu de Lima RefineryCapacity: 200 MbpdPartners: PETROBRAS (50%) –PDVSA (50%)
Name: La Teja RefineryCapacity: 100 MbpdPartners: ANCAP (50%) – PDVSA (50%)
Name: Great South American Gas PipelinePAÍSES: ARGENTINA, BOLIVIA, BRASIL, PARAGUAY, URUGUAY Y VENEZUELA
NOMBRE: Antonio Ricaurter Gas PipelinePAÍSES: COLOMBIA, PANAMÁ, VENEZUELA
Name: Jamaica RefineryCapacity: 50 MbpdPartners: PETROJAM (50%) –PDVSA (50%)
Energy Agreements
1. SAN JOSÉ (80,0 Mbpd)2. CARACAS (146,5 Mbpd)3. PETROCARIBE (23,7 Mbpd)

Embassy of the Bolivarian Republic of Venezuela
Venezuelan – Colombian Gas Pipeline
Execution up to 2006:• Jobs: 902 (Direct: 243 / Indirect: 659)• Executed: 28 %• Engineering & Environmental licenses:
Completed • Construction: Initiated July 06 installed 10 kms of
pipelines and 150 kms already manufactured
VenezuelaVenezuela
Golfo de VenezuelaGolfo de Venezuela
Fuerte Mara
CUATRO VÍASMARAUASAHU
CARRAIPIA
EL CERRO
RIO LIMÓN
SILOÉTULÉ
LOS CORTIJOS
BALLENA
MAJAYURA
EMR RL
BAJO GRANDEEMR
RU
La Concepción
El Tigre
• Completion date: May 2007• Total Investment: $ 335 Million• Total Job creation: 31,060 (4,490 direct /
26,570 indirect)
TRANSCARIBEAN GAS PIPELINE ANTONIO
RICAURTE
End Procurement Start Construction Start of the ProjectEnd Engineering
Embassy of the Bolivarian Republic of Venezuela
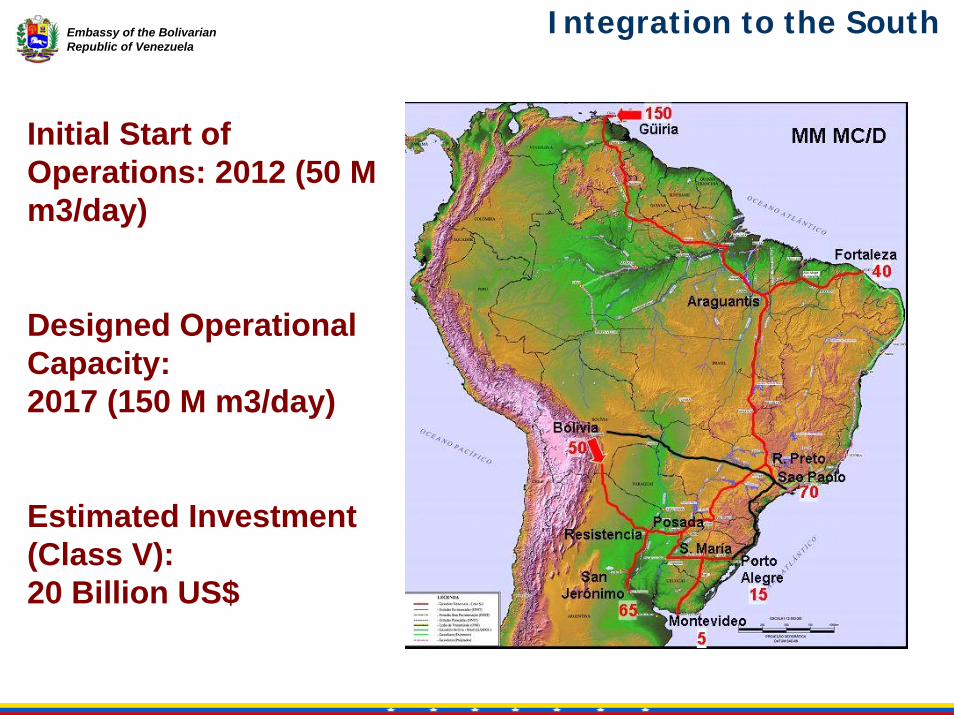
Initial Start of Operations: 2012 (50 M m3/day)
Designed Operational Capacity: 2017 (150 M m3/day)
Estimated Investment (Class V):20 Billion US$
Integration to the South

Embassy of the Bolivarian Republic of Venezuela
SUPPLY STRATEGY FOR THE CARIBBEAN The PETROCARIBE Initiative
Estimated Investment 2006-2012: $24 Million
• Minimize Supply Disruption Risk
• Provide Affordable Access to Energy
• Minimize Transaction Costs
• Ensure Minimum Level of Infrastructure
• Foster Economic and Social Development
• Minimize Supply Disruption Risk
• Provide Affordable Access to Energy
• Minimize Transaction Costs
• Ensure Minimum Level of Infrastructure
• Foster Economic and Social Development
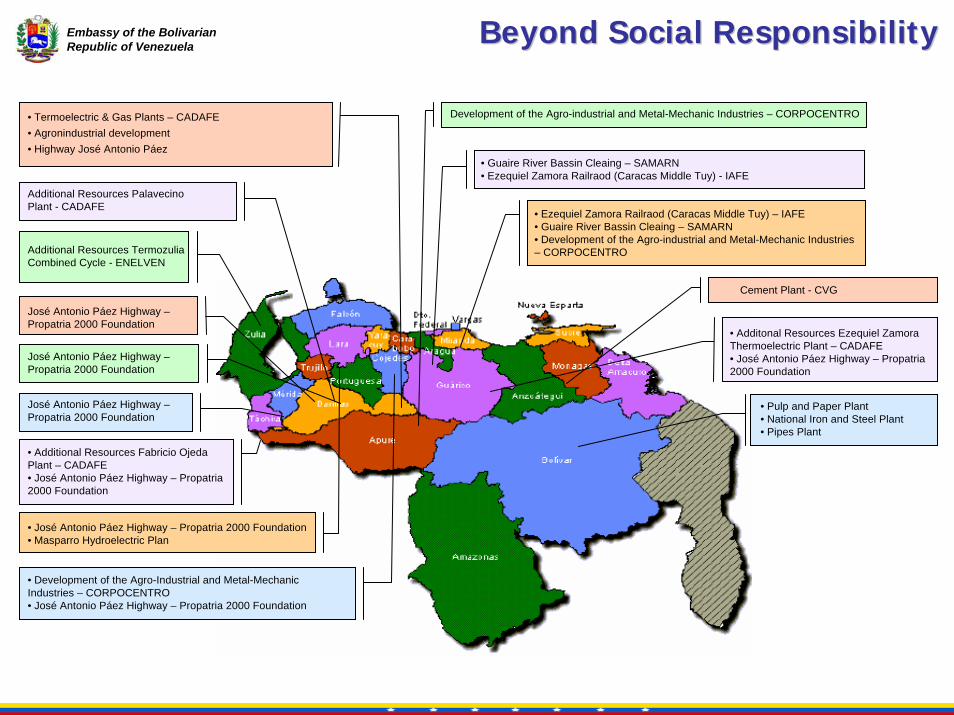
Embassy of the Bolivarian Republic of Venezuela Beyond Social ResponsibilityBeyond Social Responsibility
• Additional Resources Fabricio Ojeda Plant – CADAFE• José Antonio Páez Highway – Propatria2000 Foundation
Additional Resources PalavecinoPlant - CADAFE
• Termoelectric & Gas Plants – CADAFE• Agronindustrial development• Highway José Antonio Páez
Additional Resources TermozuliaCombined Cycle - ENELVEN
• Ezequiel Zamora Railraod (Caracas Middle Tuy) – IAFE • Guaire River Bassin Cleaing – SAMARN• Development of the Agro-industrial and Metal-Mechanic Industries – CORPOCENTRO
Cement Plant - CVG
• Guaire River Bassin Cleaing – SAMARN• Ezequiel Zamora Railraod (Caracas Middle Tuy) - IAFE
Development of the Agro-industrial and Metal-Mechanic Industries – CORPOCENTRO
• Development of the Agro-Industrial and Metal-Mechanic Industries – CORPOCENTRO• José Antonio Páez Highway – Propatria 2000 Foundation
José Antonio Páez Highway –Propatria 2000 Foundation
José Antonio Páez Highway –Propatria 2000 Foundation
José Antonio Páez Highway –Propatria 2000 Foundation
• José Antonio Páez Highway – Propatria 2000 Foundation• Masparro Hydroelectric Plan
• Pulp and Paper Plant• National Iron and Steel Plant• Pipes Plant
• Additonal Resources Ezequiel Zamora Thermoelectric Plant – CADAFE• José Antonio Páez Highway – Propatria2000 Foundation
Embassy of the Bolivarian Republic of Venezuela
Venezuela View on Venezuela View on Natural Resource Natural Resource
ManagementManagement
Embassy of the Bolivarian Republic of Venezuela
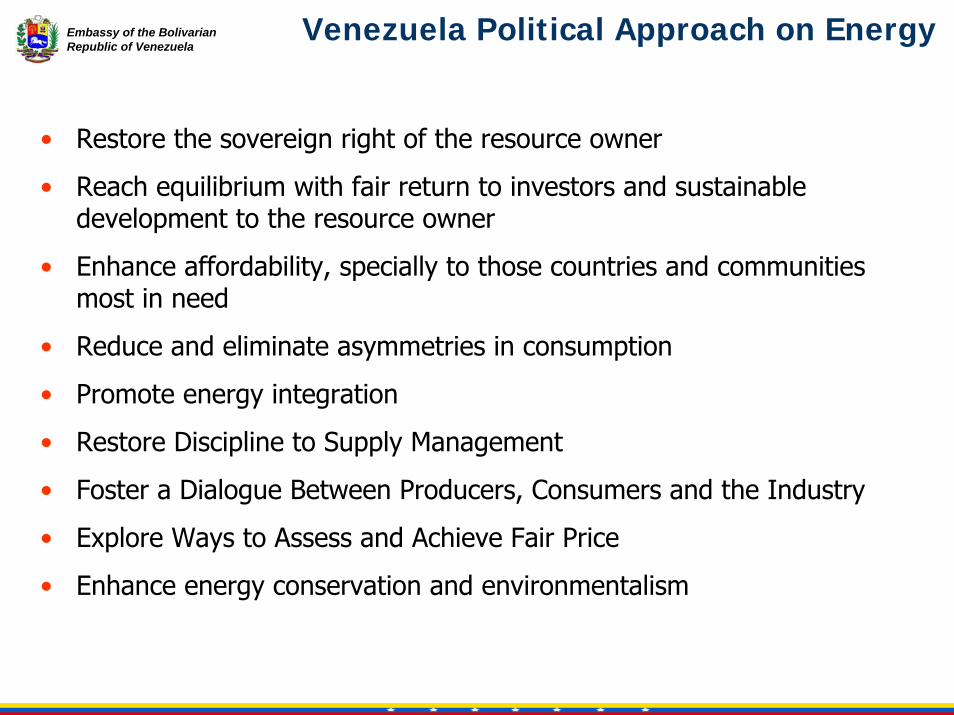
Venezuela Political Approach on Energy
• Restore the sovereign right of the resource owner
• Reach equilibrium with fair return to investors and sustainable development to the resource owner
• Enhance affordability, specially to those countries and communities most in need
• Reduce and eliminate asymmetries in consumption
• Promote energy integration
• Restore Discipline to Supply Management
• Foster a Dialogue Between Producers, Consumers and the Industry
• Explore Ways to Assess and Achieve Fair Price
• Enhance energy conservation and environmentalism

Embassy of the Bolivarian Republic of Venezuela
0%
10%
20%
30%
40%
50%
60%
70%
76 78 80 82 84 86 88 90 92 94 96 98 00
ROYALTIES
INCOME TAX
FISCAL EXPORT VALUE
DIV.
66%
45%
Public Revenues Public Revenues -- Gross Domestic Product RatioGross Domestic Product Ratio
The governance of the Venezuelan oil was unsustainable, domestically and internationally
Collapse of the Fiscal Regime

Embassy of the Bolivarian Republic of Venezuela
Extent of US Companies’ Ability to Enter Market
ChinaChina
KuwaitKuwait
MexicoMexico NO NO NO YES
Saudi ArabiaSaudi Arabia
VenezuelaVenezuela YES YES YES YES
Can US purchase Can US purchase local oil local oil
companies?companies?
Can a US Can a US company obtain company obtain
equity oil?equity oil?
Can US Can US company invest company invest
in Refining/ in Refining/ PetrochemicalsPetrochemicals
Can a US company Can a US company market petroleum market petroleum
products?products?
Only if Joint Venture Uncertain YES YES
NO NO YES YES
NO NO YES YES
Source: US Department of Energy; National Security Review of International Energy Requirements - February 2006
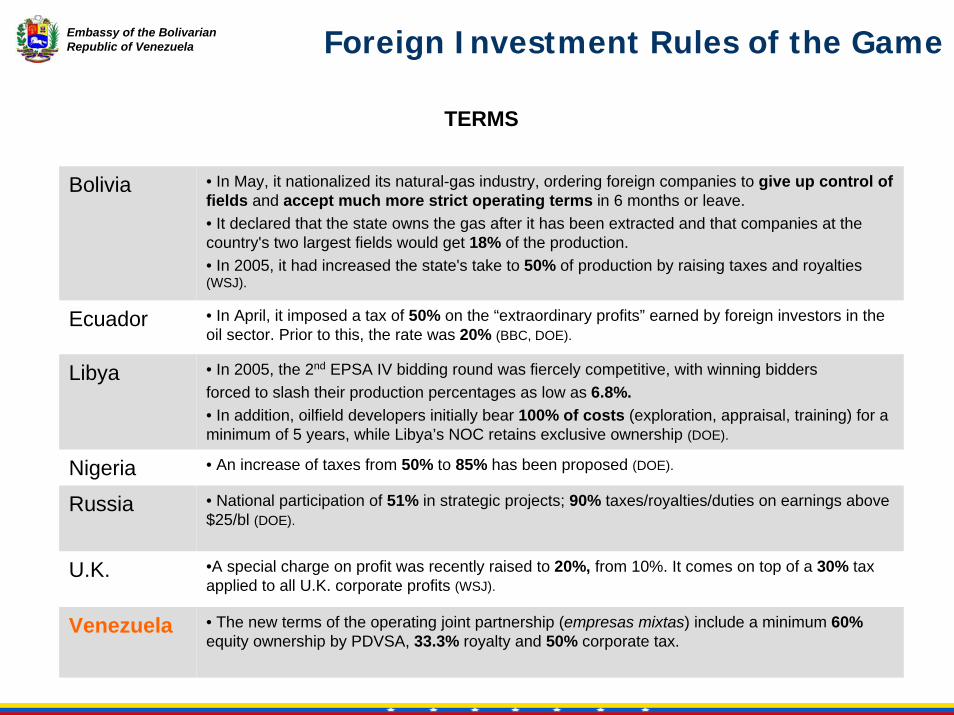
Embassy of the Bolivarian Republic of Venezuela Foreign Investment Rules of the Game
TERMS
Bolivia • In May, it nationalized its natural-gas industry, ordering foreign companies to give up control of fields and accept much more strict operating terms in 6 months or leave. • It declared that the state owns the gas after it has been extracted and that companies at the country's two largest fields would get 18% of the production. • In 2005, it had increased the state's take to 50% of production by raising taxes and royalties (WSJ).
Libya • In 2005, the 2nd EPSA IV bidding round was fiercely competitive, with winning biddersforced to slash their production percentages as low as 6.8%.• In addition, oilfield developers initially bear 100% of costs (exploration, appraisal, training) for a minimum of 5 years, while Libya’s NOC retains exclusive ownership (DOE).
U.K. •A special charge on profit was recently raised to 20%, from 10%. It comes on top of a 30% tax applied to all U.K. corporate profits (WSJ).
Nigeria • An increase of taxes from 50% to 85% has been proposed (DOE).
Russia • National participation of 51% in strategic projects; 90% taxes/royalties/duties on earnings above $25/bl (DOE).
Venezuela • The new terms of the operating joint partnership (empresas mixtas) include a minimum 60%equity ownership by PDVSA, 33.3% royalty and 50% corporate tax.
Ecuador • In April, it imposed a tax of 50% on the “extraordinary profits” earned by foreign investors in the oil sector. Prior to this, the rate was 20% (BBC, DOE).
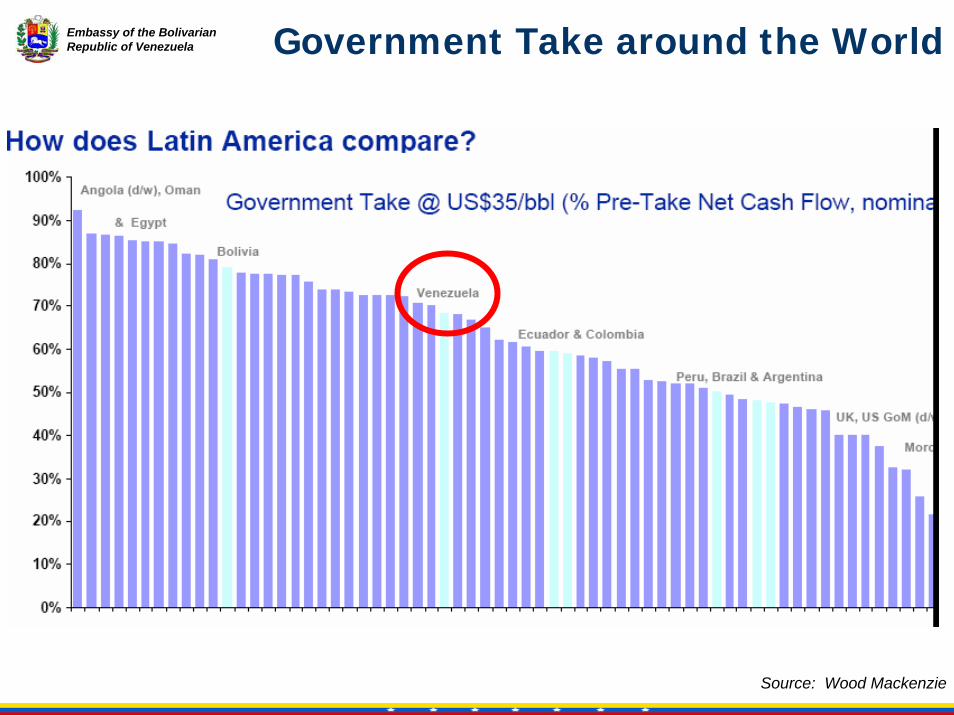
Embassy of the Bolivarian Republic of Venezuela Government Take around the World
Source: Wood Mackenzie

Embassy of the Bolivarian Republic of Venezuela
Bilateral Energy Bilateral Energy RelationRelation
Venezuela Venezuela –– U.S.U.S.

Embassy of the Bolivarian Republic of Venezuela
●● Venezuela accounts of Venezuela accounts of 12% to 15%12% to 15% of of total US importstotal US imports
●● Venezuela is the Venezuela is the 44thth largestlargest supplier of supplier of crude oil to the UScrude oil to the US
●● Including exports to Virgin Islands, Including exports to Virgin Islands, Venezuela was the Venezuela was the 11stst largest largest foreign foreign supplier to the USsupplier to the US
●● Venezuela is the Venezuela is the 22ndnd largest exporter of largest exporter of oil productsoil products to the USto the US
●● Venezuela is Venezuela is 4 to 5 days4 to 5 days shipping time to shipping time to the USthe US
●● Venezuela purchases more than Venezuela purchases more than $2 $2 billions per yearbillions per year of good & services from of good & services from 800 U.S. companies800 U.S. companies
●● Venezuela is one of the largest foreign Venezuela is one of the largest foreign investor in the US through its CITGO investor in the US through its CITGO refining circuitrefining circuit
Source: EIA 2006
The U.S. - Venezuela Energy Relationship
0
10,000
20,000
30,000
40,000
50,000
60,000
70,000
80,000
90,000
2000 2001 2002 2003 2004 2005
Venezuela Canada Mexico Saudi Arabia
Main Oil Suppliers to the USA (Crude + Products)

Embassy of the Bolivarian Republic of Venezuela
Place: Volume (gallons): Households:
Washington, DC (2) 328.303 1.721Alaska (2) 769.346 4.033Maryland (2) 2.901.501 15.210Virginia (2) 3.808.959 19.967New Jersey (2) 5.600.527 29.359Indiana (2) 639.739 3.354Michigan (2) 2.235.471 11.719Wisconsin (2) 1.909.034 10.007Contingencia 10.000.000 20.000
Total: 100.000.000 459.370
Massachusetts 11.445.763 60.000New York City 23.845.340 125.000Maine 7.630.509 40.000Rhode Island 1.907.627 10.000Pennsylvania 9.538.136 50.000Vermont 1.907.627 10.000Delaware 953.814 5.000Connecticut 4.578.305 24.000Tribus Indigenas (1) 10.000.000 20.000
(1) More than 220 tribes from Alaska, Minnesota, New York, Connecticut y Maine.(2) New States and Cities.
Venezuela – CITGO Heating Oil Program2006-2007

Embassy of the Bolivarian Republic of Venezuela
•• The U.S. is under tremendous pressure to access secure and reliaThe U.S. is under tremendous pressure to access secure and reliable supply of ble supply of oiloil
•• The U.S. energy independence is a myth and cannot be achieved unThe U.S. energy independence is a myth and cannot be achieved under current der current consumption patterns, as the U.S. addiction to oil is highly relconsumption patterns, as the U.S. addiction to oil is highly related to qualityated to quality--ofof--life perception, and it is less likely to change that patternlife perception, and it is less likely to change that pattern
•• The U.S. SPR proved not to be sufficiently efficient in times ofThe U.S. SPR proved not to be sufficiently efficient in times of crisiscrisis
•• Alternative energy (Alternative energy (biofuelbiofuel and ethanol) is a good sign, but will not be enough and ethanol) is a good sign, but will not be enough to offset the increase in consumptionto offset the increase in consumption
•• Sources of oil in the Middle East will at the end and naturally Sources of oil in the Middle East will at the end and naturally be directed to be directed to satisfy the demand growth in Asia satisfy the demand growth in Asia –– Current geopolitics in this region proved Current geopolitics in this region proved not to be efficient to pop up more secure oilnot to be efficient to pop up more secure oil
•• The U.S. will have to rely on sustainable supply from within theThe U.S. will have to rely on sustainable supply from within the hemispherehemisphere
•• Mexico is declining, Canada is not sufficient and Venezuela has Mexico is declining, Canada is not sufficient and Venezuela has the biggest the biggest reserves of oil in the worldreserves of oil in the world
A cooperative approach between the U.S. and Latin America and specially Venezuela is indeed a sole guarantee for a sustainable
energy security in the Hemisphere
The U.S. Oil Crisis and its approach to Venezuela

Embassy of the Bolivarian Republic of VenezuelaEmbassy of the Bolivarian
Republic of VenezuelaEmbassy of the Bolivarian Republic of Venezuela