vava'u island - pacific community
TRANSCRIPT

Results of Land Cover Type Mapping and CoconutResource Field Inventory Using World View-2
Image Data, Tonga
Vava'u IslandDraft Version 1st February, 2016
Field work in Vava'u Group measuring palms in selected sample plots
This draft report shows the results of field work and image analysis. A separate reportexplains the database and all calculations. A further paper explains how to establish theplots and n record all data. For questions contact Wolf Forstreuter at [email protected] +679-3249-237and Kataebati Bataua [email protected] +679-3249-230.
1

Table of Contents
1 Introduction...................................................................................................................................31.1 Purpose of the Coconut Resource Inventory.........................................................................31.2 The Steps of the Coconut Resource Inventory.......................................................................4
2 Summary Results..........................................................................................................................52.1 Coconut Palm Area................................................................................................................52.2 Number of Coconut Palms.....................................................................................................52.3 Coconut Production...............................................................................................................52.4 Available Timber Volume........................................................................................................5
3 Area Delineation and Calculation...................................................................................................53.1 The Satellite Image Data........................................................................................................63.2 The Land Use and Coconut Palm Cover................................................................................6
4 Counting Number of Palms...........................................................................................................85 Age of Coconut Palms...................................................................................................................8
5.1 Old Method of Age Estimation................................................................................................85.2 Adjusted Method of Age Estimation.......................................................................................95.3 Age Distribution....................................................................................................................10
6 Timber Volume of Palm Trunks....................................................................................................106.1 Purpose of Coconut Timber Volume Estimation...................................................................106.2 Need of Form Factor............................................................................................................116.3 Form Factor in Vava'u..........................................................................................................116.4 Volume Measurement..........................................................................................................116.5 Timber Volume of Palms in Vava'u.......................................................................................12
7 Coconut Production.....................................................................................................................138 Dead Palm Trunks in Vava'u........................................................................................................149 Health Condition of Coconut Palms.............................................................................................1410 Amount of Hybrids in Vava'u......................................................................................................1511 Regeneration.............................................................................................................................1512 Recommendations....................................................................................................................16
2

1 IntroductionThe Forestry Division of the Ministry of Agriculture & Food, Forestry and Fisheries (MAFFF), isresponsible for the conservation and sustainable management of forests, coconut, and fruit treesresource. Coconut and fruit trees are specifically mentioned to emphasize their ever increasingimportance, among others, in view of food security, permanent source of livelihoods, social values,and better resilience to climate change impacts especially in rural terrestrial and isolated maritimecommunities. The Division asked for assistance to conduct a coconut resource inventory sincelong time. In June 2015, the USAID funded food security project provided funds and SPCconducted an inventory for the Vava'u Group in the north of Tonga.
The current report is still a draft as for example the area has to be adjusted. Currently coconutstocked area the land cover class “settlement area” is not counted but will be further delineatedand corresponding parts will added to the productive coconut area.
This report concentrates on the calculated figures derived from the inventory work. A separatepaper “Inventory Measurement Instructions Image Interpretation and Field Work” explains how thedata is recorded. The “Database Manual” explains (i) how all figures are calculated and (ii) how tooperate the database. These three reports are one inventory output. The database as such is anessential additional output of the inventory. The same applies to the digital land cover layers.
1.1 Purpose of the Coconut Resource Inventory
The Forestry Department in Tonga is within the Agriculture Department responsible for coconutproduction. Currently there are some indications that the coconut production area is declining andthat in addition the production per area is declining as well. The reason seems to be that thecoconut stands are over-aged due to insufficient regeneration.
There is a need to keep coconut resource in full production or even increase the production to: (i)create income in rural areas to avoid further decrease of rural population, (ii) keep the coconutresource as it is a very sustainable resource less sensitive to weather anomalies than other crops,(iii) keep the minimum of coconut palms to protect other crops growing underneath from sun andwind and (iv) keep coconut resource as food security.
To increase production farmers have to see direct financial benefits which only can be managedthrough an increased demand for coconuts. There are several possibilities such as: (i) virgincoconut oil production where a market has to be created, (ii) traditional copra production forcoconut oil, (iii) bio fuel production, (iv) direct energy production. However, all these marketpossibilities need investment and all investors want to have a clear idea about the resource. Theywant to know: (i) the current area stratified into coconut palm densities, (ii) the production figuresand age structure per hectare where the production figures include the amount of hybrids, theinfection of natural reduction factors such as rhinoceros beetle, stick insect, etc., (iii) the amount oftimber volume as dead trunks must be removed from the stands to avoid infection of rhinocerosbeetle
It seems to be that the resource is over-aged as there were no regeneration programs since thecopra price broke down. Most probably senile palms have to be removed and replaced by youngmore fertile ones.
3

Semi dense stands with 50 to 150 palms per hectare are the productive areas. In scattered standsit is uneconomic to collect nuts as the walking distance is to far between the nuts on the groundand in dense stands the movement is very restricted. Therefore the analysis is focussed on semidense stands.
1.2 The Steps of the Coconut Resource Inventory
A new coconut inventory field design incorporating VHR satellite image data was developed andtested in Suva in late 2012. This was presented on the ACIAR SPC Pacific Coconut R&D CoconutStrategy Meeting. This inventory design is based on satellite image interpretation, GIS application,field measurements with high resolution GPS and forest measurement equipment and databaseapplication.
The first step of such an inventory is the mapping of the land use with focus on coconut palmstands. The coconut cover of Vavau islands in Tonga was stratified into dense, semi dense andscattered coconut cover. All mapping is based on visual interpretation at 1:5,000 working scale ofgeo-coded very high resolution image data. The mapping was carried out as on screen delineation,which creates a GIS layer. The result of this step was the area stocked with coconut stratified intothree densities.
The next step of the design is the counting of palms which was conducted through a statisticalsound number of randomly selected image plots. The interpreter marks all visible palms and a GISprogram does the counting. The results are stored in a database. Plots were selected for all threestrata and the average number of palms per stratum was calculated.
The third step of the design is the field work where randomly image plots were selected andvisited in the field to conduct measurements and counting on the ground. The field work wascarried out from 6 July 2015 to 2 of August, there were two teams with different assignment. Thefirst team concentrated on measuring dead palms to establish a form factor and basic data for agecalculation of palms while the second team carried out inventory field measurements for 100selected sample plots. At the same time the team was trained on how to use the equipment tomeasure palms.
4

2 Summary ResultsThe results are explained in moredetail below. This chapter provides anoverview only.
2.1 Coconut Palm Area
Area estimation is based on satellite image interpretation.
2.2 Number of Coconut Palms
The number of coconut palms perhectare were estimated with satelliteimage data and later adjusted in thefield through comparison of sampleplots in the image data and on theground. Table 02.02 represents thenumber of palms counted within the
field plots only.
2.3 Coconut Production
The coconut production was estimated (i)as production per hectare per stratum andmultiplied with the area (table 02.03) and(ii) as average production per palm perstratum and multiplied with the number ofpalms (table 02.04). The methods produceslightly different results.
2.4 Available Timber Volume
The timber volume was calculated as areacalculated from the diameter in breast height(1.3m) times height of trunk times form factor. Theform factor was established in Tonga. There is nobark reduction and separation of timber density.
5
Table 02.01:Coconut Area
Table 02.02: Number of palms
Table 02.03: Coconut production, calculated fromnuts/ha/plot
Table 02.05: Available timber volume [m3]
Table 02.04: Coconut production, calculated from nuts/palm/palms/ha
Class Area [HA] Palms/ha PalmsDense coconut 1,099 252 276,948
Medium dense coconut 3,697 71 262,487Scattered coconut 1,135 31 35,185Sum 574,620
Stratum Area [ha] Nuts / ha NutsDense 1,099 4,643 5,102,657Semi Dense 3,697 3,002 11,098,394Scattered 1,135 1,192 1,352,920
Stratum Area [ha] Palms/ha Palms Nuts / Palm NutsDense 1,099 162 178,038 29 5,163,102Semi Dense 3,697 87 261,209 34 8,881,106
Scattered 1,135 33 37,455 36 1,348,380Sum 5,931 476,702 15,392,588
Stratum Plots Area [ha] m3 / ha Sum m3Dense 5 1,099 65.2 71,655Semi Dense 82 3,697 38.1 140,856Scattered 13 1,135 14.4 16,344Sum 5,931 228,855
Stratum Outside Within Settlements Sum
Dense coconut 1,099 7 1,106
Semi dense coconut 3,697 18 3,715
Scattered coconut 1,135 18 1,153
Sum: 5,931 5,974
3 Area Delineation and CalculationThe mapping was an essential part of the task which also fits other purpose than coconut resourceinventory only. The mapping can be utilised for other parts food security mapping such as availablebread fruit in village areas.
3.1 The Satellite Image Data
The interpretation is based on pan-sharpened World View 2 providing 40 cm spatial resolution andcolour, recorded in 2015. The image data arrived as band combination blue, green, red and asband combination green, red, infra-red. So far only the natural colour combination of blue, green,red was utilised for the interpretation.
3.2 The Land Use and Coconut Palm Cover
The image interpretation delineated six vegetation classes and four none vegetation classes. Thefour vegetation classes are:
1. Left over patches of forest;
2. Mangrove areas;
3. Dense coconut palm stands, areas with more than 150 palms per hectare;
4. Medium dense coconut stands, areas with 51 to 150 palms per hectare;
5. Scattered coconut stands, areas with 25 to 50 palms per hectare;
The none vegetations classes are:
1. Settlement areas, which are areas dominated by houses with a buffer zone 75 metresaround;
2. Bare land or land with short grass cover;
3. Inland water bodies;
4. The class “unclear” which are areas covered by clouds or strong cloud shadow for whichany interpretation was difficult.
The area analysis was carried out in Access as area database. The actual area calculation forevery polygon was performed in GIS environment and afterwards the MapInfo table was copied toAccess. Table 03.01 provides an overview. The land cover class “Settlement Areas” also containscoconut. These coconut areas within settlement have to be added to the main coconut areas whichwill be performed for the next version of the report.
6
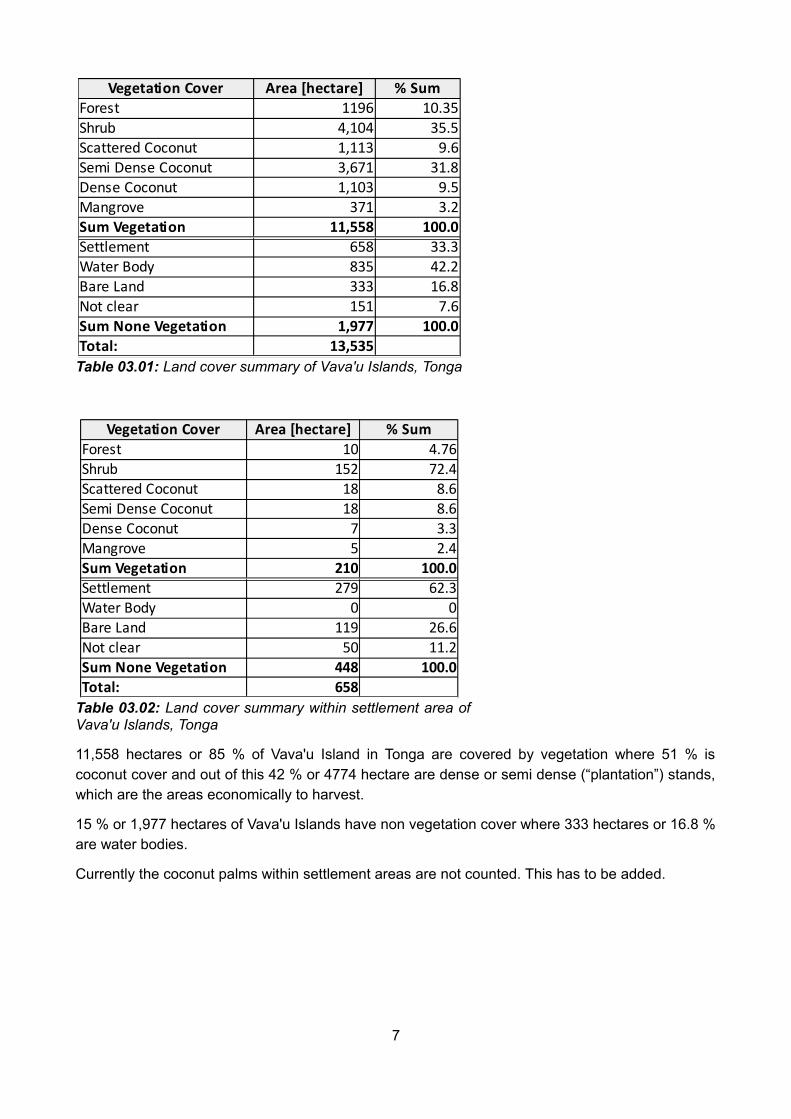
Table 03.01: Land cover summary of Vava'u Islands, Tonga
Table 03.02: Land cover summary within settlement area ofVava'u Islands, Tonga
11,558 hectares or 85 % of Vava'u Island in Tonga are covered by vegetation where 51 % iscoconut cover and out of this 42 % or 4774 hectare are dense or semi dense (“plantation”) stands,which are the areas economically to harvest.
15 % or 1,977 hectares of Vava'u Islands have non vegetation cover where 333 hectares or 16.8 %are water bodies.
Currently the coconut palms within settlement areas are not counted. This has to be added.
7
Vegetation Cover Area [hectare] % SumForest 1196 10.35Shrub 4,104 35.5Scattered Coconut 1,113 9.6Semi Dense Coconut 3,671 31.8Dense Coconut 1,103 9.5Mangrove 371 3.2Sum Vegetation 11,558 100.0Settlement 658 33.3Water Body 835 42.2Bare Land 333 16.8Not clear 151 7.6Sum None Vegetation 1,977 100.0Total: 13,535
Vegetation Cover Area [hectare] % SumForest 10 4.76Shrub 152 72.4Scattered Coconut 18 8.6Semi Dense Coconut 18 8.6Dense Coconut 7 3.3Mangrove 5 2.4Sum Vegetation 210 100.0Settlement 279 62.3Water Body 0 0Bare Land 119 26.6Not clear 50 11.2Sum None Vegetation 448 100.0Total: 658

4 Counting Number of PalmsThe the counting of coconuts palms is a semi-automatic process based on the number of palms
visible in 50 x 50m grid cells (UTM) displayedover the image data. Table 04.01. shows thethree different strata all coconut cover of lowlying islands is delineated. The stratificationprocess is explained in detail in themethodology chapter (not included in the
current report). There was adetailed comparison between thenumber of coconut palms visible inthe image data and measured inthe field which leaded to acorrection factor of 10.5 % fordense coconut stands as only the palms can be counted with image data which are part of the toplayer of canopy. Surprisingly a factor of 4.4% had to be added to semi dense coconutstands. There are obviously a few palmsunder the canopy of the dominating ones.The method and result will be explained ina separate chapter.
The table 04.02 represents the number ofpalms measured within the field sample plots calculated to palms per hectare from the 50 x 50metre plot. Table 04.03 shows the estimated number of coconut palms in Vava'u group based onthe average number of palms in the field plots (table 04.02).
5 Age of Coconut PalmsIn Vava'u Island coconut palms were actively planted. The age was estimated for every palm.However, the method of age estimation had to be revised. Nearly ¼ of the plots, for which theplanting age was known, the method explained as “old method of age estimation” calculated theage to young for areas were the planting year is known.
5.1 Old Method of Age Estimation
The Age of coconut palms were estimated by measuring the length of the stem covered by 11leave scars. This measurement starts from 1.5m upwards1. Assuming that produces 11 scars peryear and that leave scars a distributed equally over the trunk the age is calculated by dividing thetotal length of the trunk by the length of the measured 11 leave scars. As a coconut palm does nutproduce leave scars during the first 5 years, which are visible later, 5 is added to the age.
Age = length of trunk / length of 11 leave scars + 5
1 Details see “Inventory Measurement Instructions Image Interpretation and Field Work”
8
Figure 04.01: The three coconut palm strata basedon number of palms per hectare
Table 04.02: Measured palms per ha per plot in different strata
Stratum Plots Min Max Avg StDev StErr StdEr %Dense 5 84 192 162 44.7 20.0 12.4Semi Dense 82 56 140 87 21.3 2.4 2.7Scattered 13 24 48 33 7.3 2.0 6.2
Stratum Abbreviation Palms / ha Palms / cell
Scattered SC 25 – 50 7 - 12 Semi Dense SD 51 – 150 13 – 37Dense DE > 150 38 plus
Table 04.03: Estimated coconut palm resource inVava'u Islands
Stratum Area [ha] Avg Palms / ha PalmsDense 1,099 162 178,038Semi Dense 3,697 87 261,209Scattered 1,135 33 37,455Sum 476,702

5.2 Adjusted Method of Age Estimation
For the form factor establishment the diameter was measured every metre for 62 palm trunks. Atthe same time the number of leave scars were counted for every section. This dataset allowed acomparison between the old method of age calculation and the real number of leave scars pertrunk. The dataset is showing that the assumption: “the distance of leave scars is similar on allparts of the stem” is wrong. Leave scars on top are denser than on the lower part of the trunk. Themethod just dividing the trunk length by the length of 11 leave scars measured at the bottom had tobe adjusted.
Figure 05.01: Age of 62 palms “Old Age” = age estimated by old method, “New Age” = ageestimated by counting leave scars of the complete trunk, “New Age2” = age calculated by adjustedmethod.
The age difference between the age calculated with the old method and age calculated countingthe leave scars of the total trunk has an average of 12 years. However, the age difference isgreater for old palms ~16 years than for young ones < 1 year. The age difference of 16 years for 33years old palms was taken as ration (2.06) to adjust the age calculated with the old method to amore reliable age.
Age (adjusted) = Age old method + (age old method / 2.06)
Figure 05.01 shows the age calculated for 62 palms for which the trunk was measured and theleave scars were counted. “Age old” is the age calculated by the old method (blue) NewAge is theage calculated by counting the leave scars of the total trunk and NewAge2 is the age calculated bythe adjusted method.
9
1234567891011121314151617181920212223242526272829303132333435363738394041424344454647484950515253545556575859606162
0
10
20
30
40
50
60
OldAge
NewAge
NewAge2

5.3 Age Distribution
In all sample plots together 2091 palms were measured and the age estimated as explainedabove. The age distribution for all palms is shown in figure 05.02 where the palms were notstratified into different densities. There is a concentration in the productive age classes, however,young age classes are missing. This could result in a declining coconut production in the nearfuture.
Figure 05.03: Palm age distribution regeneration included.
6 Timber Volume of Palm TrunksThe timber volume was measured for every palm of all sample plots.
6.1 Purpose of Coconut Timber Volume Estimation
If senile coconut palms have to be cut and replaced by young palms the stems cannot be left in thefield as the rotten stems are an ideal breeding ground for the rhinoceros beetle which would spreadand decline the production.
There are several possibilities to eliminate the timber and not allow the rhinoceros beetle to breed,the trunks can be: (i) buried in the ground, (ii) they can be burned or (iii) they can be utilised asfence posts or construction timber. The last solution is normally the most cost effective one, wherethe most successful way would be a transportable saw mill.
The access to the coconut palms is granted in Vava'u as the infrastructure in terms of road network
10
Figure 05.02: Palm age distribution, most of the palms are between 25 and40 years. Young palms are missing.
10 – 1515 – 20
20 – 2525 – 30
30 – 3535 – 40
40 - 4545 – 50
50 – 5555 – 60
>= 60
0
100
200
300
400
500
600
700
Number of Palms / Age Class
Age Classes
Nu
mb
er
of P
alm
s
> 10 10 – 15 15 – 20 20 – 25 25 – 30 30 – 35 35 – 40 40 - 45 45 – 50 50 – 55 55 – 60 >= 6022 12 87 178 468 596 395 225 75 23 16 16

is recently upgraded. At a later stage the inventory results with 100 sample plots randomlydistributed over Vava'u can be linked to GIS and can explain where the coconut timber has to beremoved and how far the transport distance is. When the first trunks are utilised a figure can beproduced showing how much of the gross timber volume can be used for construction. Thepercentages of usable timber within one trunk published by Wulf Killmann have to be verified inVava'u.
6.2 Need of Form Factor
To calculate the overall timber, including the non usable part, the trunk volume has to be measuredin sections, which can be preformed by measuring the diameter every metre and calculating thevolumes of the sections and adding these together. The volume calculation is based on the formulaof the truncated cone. Using this formula it is assumed that the outside of the cone is straight whichis not the case, however, having diameter measurements every metre this is negligible. Thisformula can also be applied if the upper diameter R2 is bigger than the lower diameter R1 which isoften the case. This is also the reason that applying a spline function will create difficulties. Suchmeasurements cannot be performed for every trunk by the inventory team. However, the inventoryteam records the DBH (diameter at breast height, 1.3m), which is an international forest calculationfigure, and the height of the trunk. This allows to estimate the real volume.
The corresponding code of the database calculates a cylinder with the measurements diameterand trunk height. Then the code reduces this volume by the form factor to the real volume. Thepurpose of the field work was to establish this form factor. This is performed by measuring thesections every metre for a statistical sound number of palms and calculate the form factor, whichthen can be applied to all other palm trunks where only DBH and height was measured.
6.3 Form Factor in Vava'u
During the field work 62 trunks were measured including a few hybrids. The form factor reducingthe cylinder calculated from DBH and trunk height to the “real2” volume has an average of 0.72with a range of between 0.57 and 0.88 and a standard deviation of 0.09. The standard error iscalculated with 0.0135.
Another result is the knowledge that the percentage of palms having trunks where the sectiondiameters increase in the middle of the trunk, which could be related to optimal water supply duringthis period. So far only 1.6% had a trunk which was counted as “normal” where the diameters diddecrease with height on the trunk. It was counted as “normal” if even several section diameter hadthe same measurement and did not decrease with height. If the diameters increase somewhere onthe trunk the trunks was counted as “others”.
6.4 Volume Measurement
The timber volume measurement calculates the volume of the total trunk regardless of the wood
2 The real volume has to be measured by putting the trunk into a basin with liquid and measuring the overflow, which is very difficult for palm trunks. The calculation of sections is the closest to the real volume.
11

density. For timber utilisation purpose the different densities of the palm trunk have to be accessed.
The volume calculation is based on (i) diameter at 1.3m, (ii) trunk height and (iii) form factor3. Allpalms of a plot above 5 metre height were measured. The diameter is measured over bark in in cmwith two digits behind the point. The trunk height is calculated from the measured (i) angle thebottom, (ii) measured angle to the top of the trunk, where both measurement were read in per cent,and measured (iii) distance from view point to the tree in metre with two digits behind the point.The form factor was established from palms on the ground where every metre the diameter wasrecorded. Measurement were taken from 62 palms over all diameters resulting in a factor of 0.74.
The calculation transforms the diameter to area of a circle and multiplies this with the trunk heightresulting in a volume of cylinder. This volume is reduced to the volume of a cone by applying theform factor.
6.5 Timber Volume of Palms in Vava'u
The timber volume were measured for 100 plots or 2,091 palms. The smallest one with 00.3 m 3 inplot 043 with 11cm DBH and 4.5 m eight. The biggest palm in plot 035 of 5.45 m3 with a DBH of 58cm and an extreme height of 28.7 m.
Table 06.01: Timber volume per hectare of plots established in Vava'uGroup, Tonga.
Table 06.01 shows the timber volume per hectare in m3 for the plot with the lowest value, thehighest value and the average. The table also shows the standard deviation of the average and thestandard error which the standard deviation divided by the square root of the number of plots. Thestandard error % sets the standard error in percent of the average to make the standard errorcomparable to other inventories.
Table 06.02 shows the total available timber volume in Vava'u and the timber volume of the threedifferent coconut strata. These figures might be utilised to define the carbon stock of the land cover“coconut palms”.
In case a regeneration program wants to remove the old and senile palms the amount of timbervolume of palms over 40 or over 50 can be calculated with the database.
3 Details see “Inventory Measurement Instructions Image Interpretation and Field Work”
12
Table 06.02: Timber volume of coconut standsin Vava'u
Stratum Plots Min Max Avg StDev StErr StdEr %Dense 5 37.2 103.9 65.2 24.4 10.9 16.7Semi Dense 82 14.4 89.4 38.1 13.9 1.5 4.0Scattered 13 8.6 20.5 14.4 3.5 1.0 6.8
Stratum Plots Area [ha] m3 / ha Sum m3Dense 5 1,099 65.2 71,655Semi Dense 82 3,697 38.1 140,856Scattered 13 1,135 14.4 16,344Sum 5,931 228,855
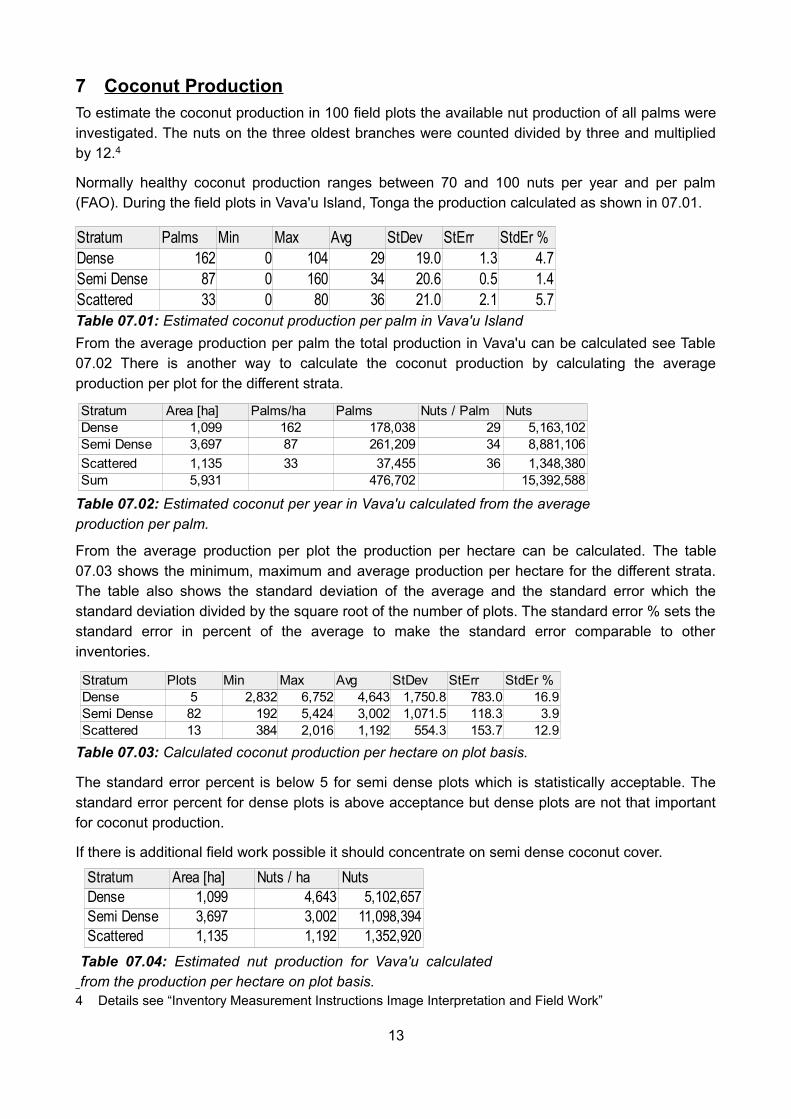
7 Coconut ProductionTo estimate the coconut production in 100 field plots the available nut production of all palms wereinvestigated. The nuts on the three oldest branches were counted divided by three and multipliedby 12.4
Normally healthy coconut production ranges between 70 and 100 nuts per year and per palm(FAO). During the field plots in Vava'u Island, Tonga the production calculated as shown in 07.01.
From the average production per palm the total production in Vava'u can be calculated see Table07.02 There is another way to calculate the coconut production by calculating the averageproduction per plot for the different strata.
From the average production per plot the production per hectare can be calculated. The table07.03 shows the minimum, maximum and average production per hectare for the different strata.The table also shows the standard deviation of the average and the standard error which thestandard deviation divided by the square root of the number of plots. The standard error % sets thestandard error in percent of the average to make the standard error comparable to otherinventories.
The standard error percent is below 5 for semi dense plots which is statistically acceptable. Thestandard error percent for dense plots is above acceptance but dense plots are not that importantfor coconut production.
If there is additional field work possible it should concentrate on semi dense coconut cover.
4 Details see “Inventory Measurement Instructions Image Interpretation and Field Work”
13
Table 07.01: Estimated coconut production per palm in Vava'u Island
Table 07.02: Estimated coconut per year in Vava'u calculated from the averageproduction per palm.
Table 07.03: Calculated coconut production per hectare on plot basis.
Stratum Palms Min Max Avg StDev StErr StdEr %Dense 162 0 104 29 19.0 1.3 4.7Semi Dense 87 0 160 34 20.6 0.5 1.4Scattered 33 0 80 36 21.0 2.1 5.7
Stratum Plots Min Max Avg StDev StErr StdEr %Dense 5 2,832 6,752 4,643 1,750.8 783.0 16.9Semi Dense 82 192 5,424 3,002 1,071.5 118.3 3.9Scattered 13 384 2,016 1,192 554.3 153.7 12.9
Stratum Area [ha] Palms/ha Palms Nuts / Palm NutsDense 1,099 162 178,038 29 5,163,102Semi Dense 3,697 87 261,209 34 8,881,106
Scattered 1,135 33 37,455 36 1,348,380Sum 5,931 476,702 15,392,588
Table 07.04: Estimated nut production for Vava'u calculatedfrom the production per hectare on plot basis.
Stratum Area [ha] Nuts / ha NutsDense 1,099 4,643 5,102,657Semi Dense 3,697 3,002 11,098,394Scattered 1,135 1,192 1,352,920
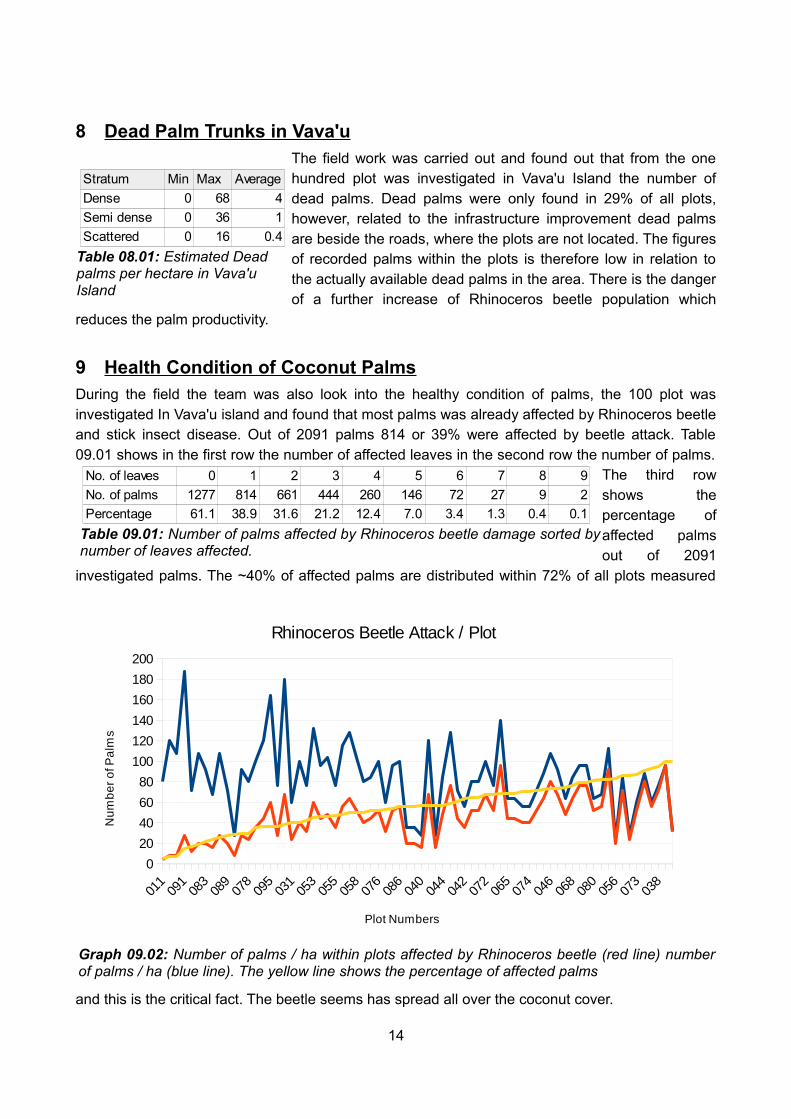
8 Dead Palm Trunks in Vava'uThe field work was carried out and found out that from the onehundred plot was investigated in Vava'u Island the number ofdead palms. Dead palms were only found in 29% of all plots,however, related to the infrastructure improvement dead palmsare beside the roads, where the plots are not located. The figuresof recorded palms within the plots is therefore low in relation tothe actually available dead palms in the area. There is the dangerof a further increase of Rhinoceros beetle population which
reduces the palm productivity.
9 Health Condition of Coconut PalmsDuring the field the team was also look into the healthy condition of palms, the 100 plot wasinvestigated In Vava'u island and found that most palms was already affected by Rhinoceros beetleand stick insect disease. Out of 2091 palms 814 or 39% were affected by beetle attack. Table09.01 shows in the first row the number of affected leaves in the second row the number of palms.
The third rowshows thepercentage ofaffected palmsout of 2091
investigated palms. The ~40% of affected palms are distributed within 72% of all plots measured
and this is the critical fact. The beetle seems has spread all over the coconut cover.
14
Table 09.01: Number of palms affected by Rhinoceros beetle damage sorted bynumber of leaves affected.
No. of leaves 0 1 2 3 4 5 6 7 8 9
No. of palms 1277 814 661 444 260 146 72 27 9 2
Percentage 61.1 38.9 31.6 21.2 12.4 7.0 3.4 1.3 0.4 0.1
Graph 09.02: Number of palms / ha within plots affected by Rhinoceros beetle (red line) numberof palms / ha (blue line). The yellow line shows the percentage of affected palms
0
20
40
60
80
100
120
140
160
180
200
Rhinoceros Beetle Attack / Plot
Plot Numbers
Nu
mb
er
of P
alm
s
Table 08.01: Estimated Dead palms per hectare in Vava'u Island
Stratum Min Max Average
Dense 0 68 4
Semi dense 0 36 1
Scattered 0 16 0.4
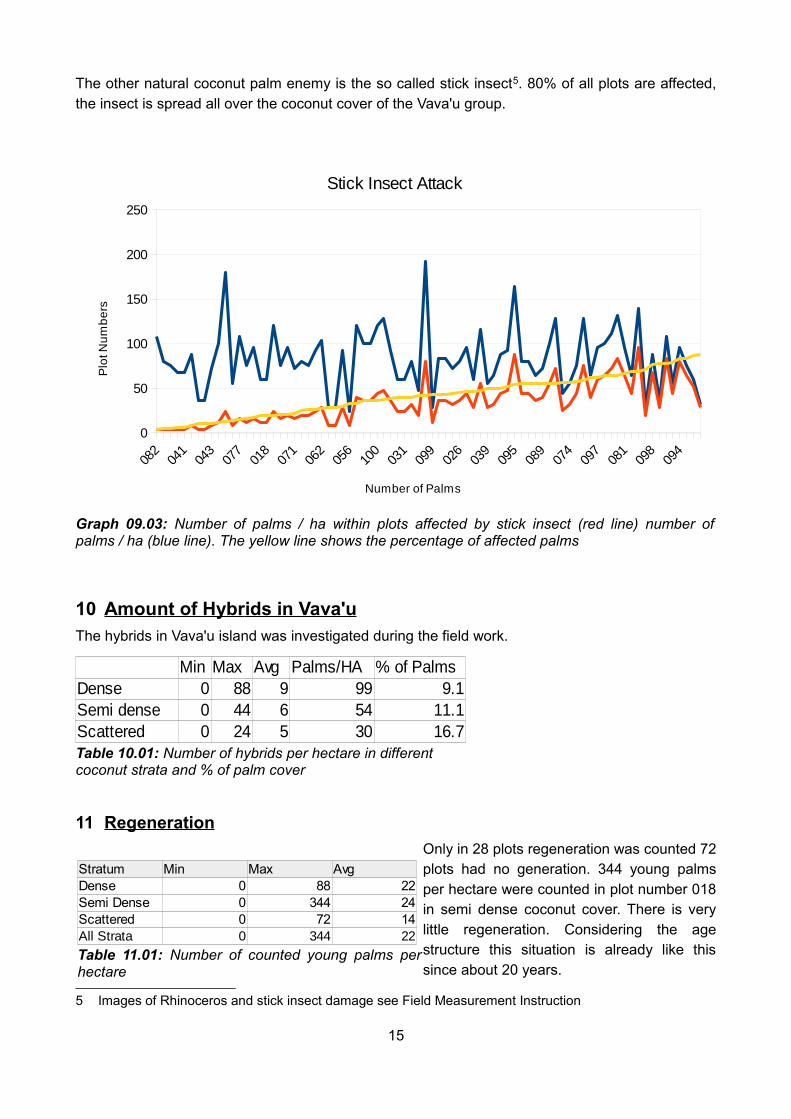
The other natural coconut palm enemy is the so called stick insect5. 80% of all plots are affected,the insect is spread all over the coconut cover of the Vava'u group.
10 Amou nt of Hybr ids in Vava'uThe hybrids in Vava'u island was investigated during the field work.
Table 10.01: Number of hybrids per hectare in different coconut strata and % of palm cover
11 Regeneration
Only in 28 plots regeneration was counted 72plots had no generation. 344 young palmsper hectare were counted in plot number 018in semi dense coconut cover. There is verylittle regeneration. Considering the agestructure this situation is already like thissince about 20 years.
5 Images of Rhinoceros and stick insect damage see Field Measurement Instruction
15
Min Max Avg Palms/HA % of PalmsDense 0 88 9 99 9.1Semi dense 0 44 6 54 11.1Scattered 0 24 5 30 16.7
Graph 09.03: Number of palms / ha within plots affected by stick insect (red line) number ofpalms / ha (blue line). The yellow line shows the percentage of affected palms
0
50
100
150
200
250
Stick Insect Attack
Number of Palms
Plo
t Nu
mb
ers
Table 11.01: Number of counted young palms perhectare
Stratum Min Max AvgDense 0 88 22Semi Dense 0 344 24Scattered 0 72 14All Strata 0 344 22
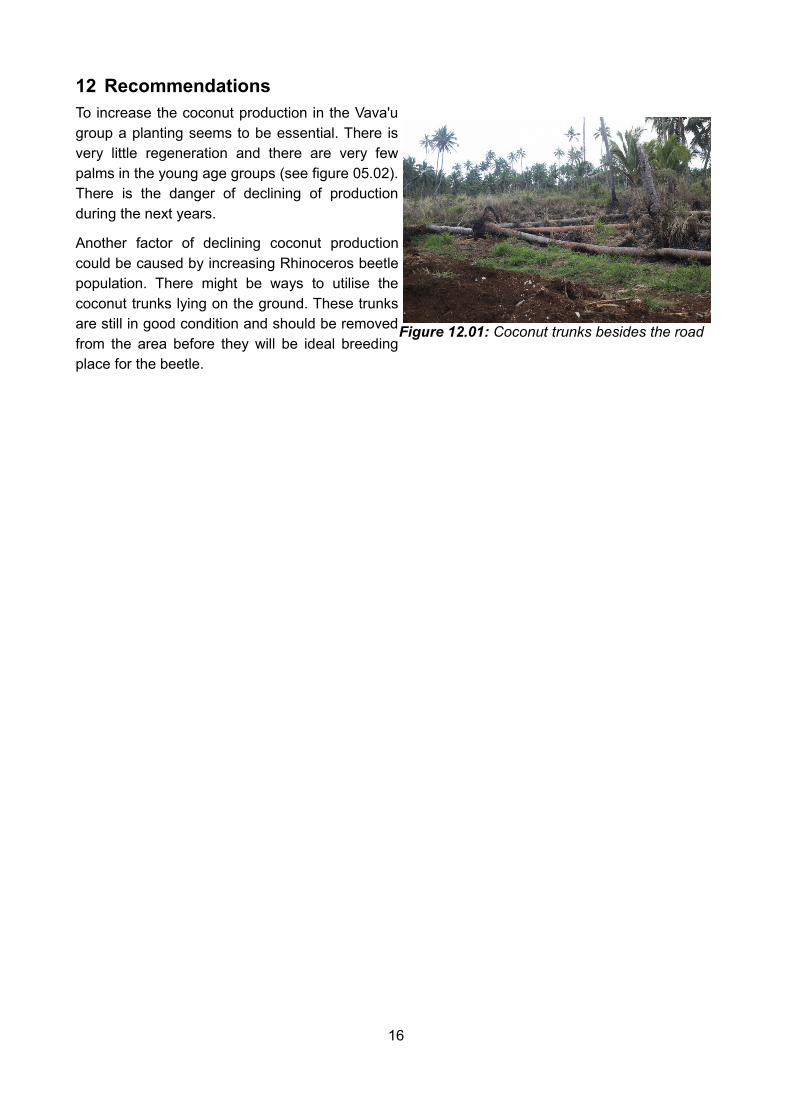
12 RecommendationsTo increase the coconut production in the Vava'ugroup a planting seems to be essential. There isvery little regeneration and there are very fewpalms in the young age groups (see figure 05.02).There is the danger of declining of productionduring the next years.
Another factor of declining coconut productioncould be caused by increasing Rhinoceros beetlepopulation. There might be ways to utilise thecoconut trunks lying on the ground. These trunksare still in good condition and should be removedfrom the area before they will be ideal breedingplace for the beetle.
16
Figure 12.01: Coconut trunks besides the road