varying significance of influencing factors in …
TRANSCRIPT
VARYING SIGNIFICANCE OF INFLUENCING
FACTORS IN DEVELOPING HIGH-TECH CLUSTERS
---using cities of The U.S. and China as example
A Thesis Presented to the Faculty of Architecture and Planning
COLUMBIA UNIVERSITY
In Partial Fulfillment
of the Requirements for the Degree
Master of Science in Urban Planning
by
Xia Chen
May 2012

Chen 2 / 76
Abstract
High-tech clusters have become a popular strategy for city development around the world since
1980s. There are many factors that will influence the development of high-tech clusters.
Researchers from a range of disciplines have researched to identify specific ingredients for
success of high-tech clusters. However, their perspectives are more confined to the theoretical
field, but have not solved the problem of the significance of these factors. This thesis tries to
answer the following questions: to what extent those factors proposed by researchers influence
the development of hi-tech clusters when compared to traditional industry clusters, and
compared to different locations. The analysis mainly builds regression models of the influencing
factors of high-tech clusters for both U.S. and China. There are also regression models built for
traditional industry clusters which played a role as a control group in the research. The result of
the regression analysis shows that in the U.S. venture capital is the most important factor in
developing high-tech clusters, while in China, the most powerful factors are the academic
institutes and government. Some recommendations are also provided to the planners in the U.S.
and China at the end of this thesis.
Chen 3 / 76
1 Introduction
1.1 Background
Science and technology have developed rapidly since the 1940s. Especially for advanced
technologies, such as information technology, biotechnology, new energy technology, industrial
clusters have become more and more prevalent. In 1951, Silicon Valley emerged as an
industrial cluster that integrated intelligence factors, financial capital and industrial clusters,
and achieved unprecedented success. Since the 1980s, high-tech clusters have become a
popular strategy for city development around the world. Successful high-tech clusters can
attract capital, creating jobs, attracting talent, levying taxes, and increasing the value of land, all
of which promote the economic development of a city.
Following Silicon Valley, more than 350 high-tech clusters have been built in the United States,
such as the Route 128 high-tech industry zone, North Carolina Research Triangle. In addition,
Italy, Spain, the Netherlands, Belgium, Ireland, Sweden, Canada, Australia, Israel and Japan had
also established a number of forms of high-tech clusters, as have the former Soviet Union and
later Russia, such as the science city of Novosibirsk. Newly emerged economic powers have also
created high-tech clusters, such as Zhangjiang-Shanghai in China, Hsinchu-Taipei in Taiwan.
1.2 Research Questions
High tech clusters are the result of several causes. Researchers from a range of disciplines have
researched to identify specific ingredients for success. But due to different social systems,
cultural traditions, and economic strengths, as well as at multiple stages of development, high-
tech clusters in different areas vary in inherent resources, management models, capital
resources. Take the United States and China for example: many of the high-tech clusters in the
U.S. are the products of a pure market economy, under the typical American "free economy"
concept. In contrast, high-tech clusters in China are mostly products of government planning,
and government funding comprises a large part of the investment.
This thesis draws upon the issues above and discusses how these factors play similar roles in
developing high-tech clusters and conventional industry clusters. It also discusses to what
degree local conditions influence the significance of these factors In other words, this thesis
examines to what extent those factors proposed by researchers influence the development of
hi-tech clusters when compared to traditional industry clusters, and compared to different
locations. The targeted areas chosen in this thesis are the United States and China: these two
Chen 4 / 76
countries have large differences in social formation, stages of development, and cultural
backgrounds. Furthermore, we need to compare the results of the first questions in order to
determine why different factors have different levels of significance. Based on the analysis of
the first and second questions, this paper will propose appropriate suggestions for developing
high-tech clusters in the U.S. and China.
2 Literature review
2.1 Overview
If we define the starting point of global information technology innovation as the set up of
Hewlett-Packard Development Company (HP) in California in 1939, then high technology
development dates back more than 70 years; related theories can be traced back more than
100 years. High-tech cluster can be counted as a core part of this innovation and played an
important role in the transformation of scientific and technological achievements. Since the
1950s when the first high-tech cluster emerged on the Stanford campus, high-tech clusters
have promoted and nurtured high-tech enterprises and entrepreneurs, as well as new
technological revolution and new industries.
However, before the 1980s there was little systematic research on high-tech clusters in the
academic world and relevant academic papers published. In the early 1980s, Western
scholars began to detailed study on the success story of Silicon Valley from different
perspectives, including entrepreneurial culture, legal environment, corporate governance,
venture capital operation and history. So far, there are two relevant international non-
governmental organizations related to high-tech clusters: The first is the International
Association of University Research Parks (AURP); the second is the International Association of
Science Parks (IASP). Their main functions are to organize research and communication
activities related to science and technology clusters, and regularly publish the latest
information and research of science and technology parks in different parts of the world.
2.2 Research on the dynamic mechanism of High-tech clusters
Several theories can be applied to the dynamic mechanism of high-tech clusters as followed:

Chen 5 / 76
2.2.1 “Innovation” theory
In Joseph Schumpeter’s well-known work The Theory of Economic Development, published in
1912, he proposed that innovation should be the critical dimension of economic growth, and
defined innovation as entrepreneurs’ selves to implement new combinations of production
factors. He pointed out that innovation would spread and cause significant changes in the
spatial distribution of industry. High-tech clusters, which are built on the basis of technological
innovation, are ruled by this technological innovation theory.
2.2.2 Growth pole theory
The theory of the growth pole appeared in the mid-1950s as an abstract economic concept, and
was introduced to the field of regional studies in the 1960s. It was first proposed by the French
economist Francois Perroux in 1955. In the field of regional planning, growth pole theory refers
to a leading industrial sector surrounded by a groups of joint industries in a region, which
demonstrate rapid growth and promote the growth of other sectors through multiplier effects.
Since their emergence, high-tech clusters have been playing positive roles as growth poles in
the region. High-tech clusters radiate the product, capital, technology, information and even
concepts of this area outward, using their powerful force and lead to the spread of high-tech
zones in geographic space.
2.2.3 Industrial cluster theory
The representative of The Positioning School Michael Porter believed that “A cluster is a
geographically proximate group of interconnected companies and associated institutions in a
particular field, linked by commonalities and complementarities.” It is able to gather up related
industries and companies to promote products business and the particular industry, thus
promote economic development. Industrial clusters help to improve "the opportunities of
coordination and cooperation,” because there is a complete supply chain existing in the
industrial cluster from the technology to market, and some technologies can be commercialized
and translated into real productivity through the industry cluster as soon as possible.[1] High-
tech clusters play a very important role. High-tech clusters can gather all the factors and
impetus for innovation together to make innovative industries flourish.
2.2.4 Research on the mode of High-tech clusters
The most famous research on this topic was done by Manuel Castells and Peter Hall from the
University of California, Berkeley. In their work, Technopoles of the world: The Masking of 21st
Century Industrial complexes, published in 1994, they divided the development modes of High-

Chen 6 / 76
tech clusters all over the world into four categories: (1) high-tech company industrial complex
(2) Science City (3) Technology Park (4) Japan’s high-tech city. [2]
The "high-tech development zone "research group of Chinese Academy of Sciences (1988) has
its own method, and concluded five types of development modes of high-tech clusters:
incubators, science and technology industrial parks, high-tech industrial zone, the city of
science and the city of technology. Xinzhen Wei and Jici Wang al (1993) from Peking University
challenged the above modes. They used function to divide the technology zone into three
categories: Science Park, city of technology, and high-tech processing zone.
Besides the above research, many methods have been used to analyze the development mode
of high-tech clusters. We can get different classifications of development mode from various
perspectives, such as development advantage, formation process, and investors,.
Based on Castells and Hall's method, high-tech clusters in the U.S, represented by Silicon
Valley, are mainly in the first category, which is based on high-tech companies
establishing comprehensive industrial bodies linking R & D and manufacturing. On the other
hand Chinese high-tech clusters can be approximated classified in the third category. They are
similar to new administrative divisions of industry, and aim to build concentrated high-tech
industrial companies in designated areas in order to enhance the survival and
development capabilities of the region in international competition and continue to
pursue sustained economic growth. From the above classification, it can be seen that this is
a government-led model. The influence from the government will become an important factor
in the development of the park, or even can be viewed as a crucial factor.
2.2.5 Research on the key factors of successful High-tech clusters
After the success of Silicon Valley, there has been thousands of high-tech clusters created or emerged throughout
the world. High-tech clusters are part of the macro economy. Apparently the development of high-
tech clusters cannot be realized without growth factors, such as raw materials, labor, capital,
technology, knowledge, entrepreneurship and, industrial clustering,. Beside these factors, much
research has sought to explain the characteristics of Silicon Valley and other examples of high-tech clusters.
Grabher (1993) proposed that knowledge accumulated system which based on knowledge
spillover mechanism are important in the high-tech clusters.
The knowledge accumulated system in high-tech clusters areas makes the cluster to
create unique productive knowledge and systematical knowledge, which are converted to
shareable knowledge through knowledge spillover mechanism. Therefore the level
of accumulation of knowledge in the cluster continues to increase as a whole. Knowledge

Chen 7 / 76
accumulation is one of the important determinants of innovation, and the knowledge
accumulation level of innovation subject directly affects the level of
technological innovation. Therefore, knowledge spillovers increase clusters’ levels of knowledge
accumulation and enhance technological innovation. At the same time, he developed the
innovative theory to the "regional innovation system" level, saying that new regional
innovation systems will affect the formation and development of industrial agglomeration,
and that the enterprises’ innovation cannot be separated from surrounding factors such as
management system, customs, laws, and culture. Since the innovation of enterprises has the
character of "path dependence" during the innovation process, it must interact with other
actors within the region to form the interaction network, and effectively integrated with the
systems, and cultural environment, in order to continuously innovate. Besides,
Grabher believed that organizations or institutions outside the enterprise such as
government, training organizations, universities, etc., have greater capability to improve the
regional innovation. [3]
When refers to study of spiritual characteristics of the high-tech clusters, Saxenian’s work did
ground-breaking contribution to this field. Since the early 1980s, her comparative research of
the regional advantages of Silicon Valley and Route 128 industrial zone, especially research on
regional innovation networks, immigrant culture and entrepreneurial spirit of Silicon Valley has
great value for the rest of world in awareness and understanding of Silicon Valley. [4]-[7] In her
work Regional Advantages: Culture and Competition in Silicon Valley and Route 128,
Saxenian(1994) chose to understand regional economic and industrial systems from the
perspective of industrial system and studied these two areas as examples of two industrial
system modes. Saxenian got the conclusion that the fundamental reason that why differences
between the two modes occur is because they existed in completely different institutional
environment and cultural backgrounds. Besides, Saxenian pointed out that an open regional
culture of mutual assistance and international industrial cooperation networks is critical to the
development of high-tech clusters.
Maillat (1996) asserted that the existence of related industries in industrial clusters provided
a convenient professional source of specialization inputs for these enterprises. The existence
of such a vendor can enable enterprises to quickly integrate; that is, the geographic
concentration of high-tech enterprises make their access to supporting industries and products
more convenient. [8]
GM. Peter Swann, Martha Prevezer and and David Stout (1998) pointed out that because of
the geographical concentration of many factors related to competition in the region, such
Chen 8 / 76
as the high-tech enterprises and information of the market, technology accumulates
extensively and rapid delivered. This is very important to the enterprises in the competition. [9]
Paul Westhead and Stephen Batstone (1998) proposed the importance of location factors of
the high-tech clusters through comparison of high-tech enterprises inside and outside high-tech
clusters in U.K. They pointed out several key factors that influence the decision of high-tech
firms whether to locate in a high-tech cluster are: Overall reputation of the area, parking
facilities, convenience of transportation, convenient information exchange and cost. [10]
Saxenian. A and Hsu. J. Y (1999) put forward that high-tech clusters consist of many companies
and institutions interconnected by technology, information, research, human resources, capital,
and other factors through close association industrial correlation. It is easier to form a variety
of highly specialized inputs inside the body of concentration. [11]
Based on the studies of several large industrial clusters in Africa, Mccormick (1999) suggested
that knowledge spillovers and technology sharing are the driving force of the high-tech industry
in Africa. [12]
Samuel Kortum and Josh Lemer (2000) showed with empirical tests that venture capital plays a
substantial role in technological innovation. They found that the number of patents generated
by $ 1 in venture capital investment is 3.1 times greater than that of $ 1 R & D investment in
traditional enterprises. [13]
Another discussion about this issue is The Errors: the Economist’s Discourse of Silicon Valley
Model edited by Yingyi Qian form University of California, Berkeley. The book combines
research on Silicon Valley by several economists such as Saxenian, Masahiko Aoki, Jinglian Wu.
The result is an important theory that in the process of developing high-tech industry “the
system is more important than technology”. [14]
In The Silicon Valley Edge: A Habitat for Innovation and Entrepreneurship, Silicon Valley’s
success is boiled down to its environmental conditions which can transform the pioneering
spirit into the technological innovation. The authors argue that Silicon Valley’s advantage
comes from the overall environment, the habitat for innovation and entrepreneurial, and the
technological breakthroughs are only results from those spirits. [15]
Athreye did detailed study on Cambridge high-tech industrial park, and attributed the
appearance of Cambridge high-tech clusters to the good environment of knowledge, abundant
human resource, and convenient port conditions of Cambridge Park. [16]
Chen 9 / 76
Chinese Scholars have also done much research on the key factors of high-tech clusters from
the experience of Chinese high-tech clusters.
Xinzhen Wei and Jici Wang (1993) analyzed the significant order of key factors in their book
New Industrial Space, finding out that intensive intelligence level should be in the first
place, followed by the development of technical conditions, talent labors, information
network, excellent infrastructure, appropriate basic production and living environment. [17]
Kai Yao(1996) believed that the most important factors that affect the location of high-
tech industry are: industrial clusters factor, intelligence-intensive areas, the environment and
quality of life, and transportation , especially highways and airports.[18]
Wen Liang (2003) believes that the impact of the traditional location factors on high-tech
clusters is weakening. The major factors in developing high-tech clusters are the intelligence-
intensive areas, venture capital-intensive areas, certain technical support conditions, the
government's preferential policies, better natural environment and better infrastructure .[19]
Yulin Zhao (2004) categorized the factors affecting high-tech clusters into the
production factors and the management factors. The production factors include: natural
environmental conditions, technical conditions, the quantity and quality of researchers,
entrepreneurs, capital factors, the market factors. The management factors include: good
transportation and communications infrastructure, a good atmosphere to attract scientists,
high-technological innovation system, traditional industries that support the development
of high-tech industries and industrial policy of the government. [20]
Zheng Wang (2005) proposed that the major influencing factors include: knowledge spillover,
intensive human capital, climate and environment, the supply chain environment,
transportation conditions and the trade market. [21]
Runbang Xie, Guanlin Hu (2006) did research on the relationship between venture
capital and high-tech clusters, the phenomenon of concentration of venture capital and the
impact of such concentration on high-tech clusters. They proposed that current mechanism of
China's venture capital was far from perfect, and Chinese must urgently take steps to improve
and perfect the venture capital system to achieve sustainable development of Chinese high-
tech clusters, thus creating positive interaction between the between venture capital and high-
tech clusters. [22]
Chen 10 / 76
2.2.6 Summary
It can be seen from the above discussion that former scholars have developed a
comprehensive discussion on the high-tech industry cluster, including the key factor of
developing high- tech industry cluster, dynamic mechanisms, and relationship with other
aspects of the regional economy.
When focus on the key factors field, all the factors proposed by them can be generalized in 5
categories, which are:
1) Technique resource, including educational institutions, skilled workers. 2) Capital resource, such as venture capital. 3) Location factors, such as the geographical condition, climate, supporting facilities. 4) Institutional factor, such as knowledge spillovers and technology sharing. 5) Spiritual factors.
Some researchers still emphasize the importance of traditional location factors and capital
factors, while others believed that the core factors has been changed to technique and
institutional factor, such as knowledge spillover environment, and intensive
intellectual resources. However, their perspectives are more confined to the theoretical
field. Although there are some empirical studies, they mainly discuss measures of the degree of
industrial clustering, and apply empirical methods to analyze the effects of each factor on
the high-tech industrial agglomeration. Overall, past research mainly discussed the factors
influence the high-tech industry cluster theoretically, but has not solve the problem of the
significance of these factors.
3 Conceptual Framework
3.1 Subject of the study
Based on the aforementioned industry cluster theory and innovation theory, high-tech clusters
play an important role in regional development as an innovative system. Therefore, this paper
does empirical analysis of significance of potential influencing factors in developing high-tech
clusters, which could further help in promoting regional development in both countries.
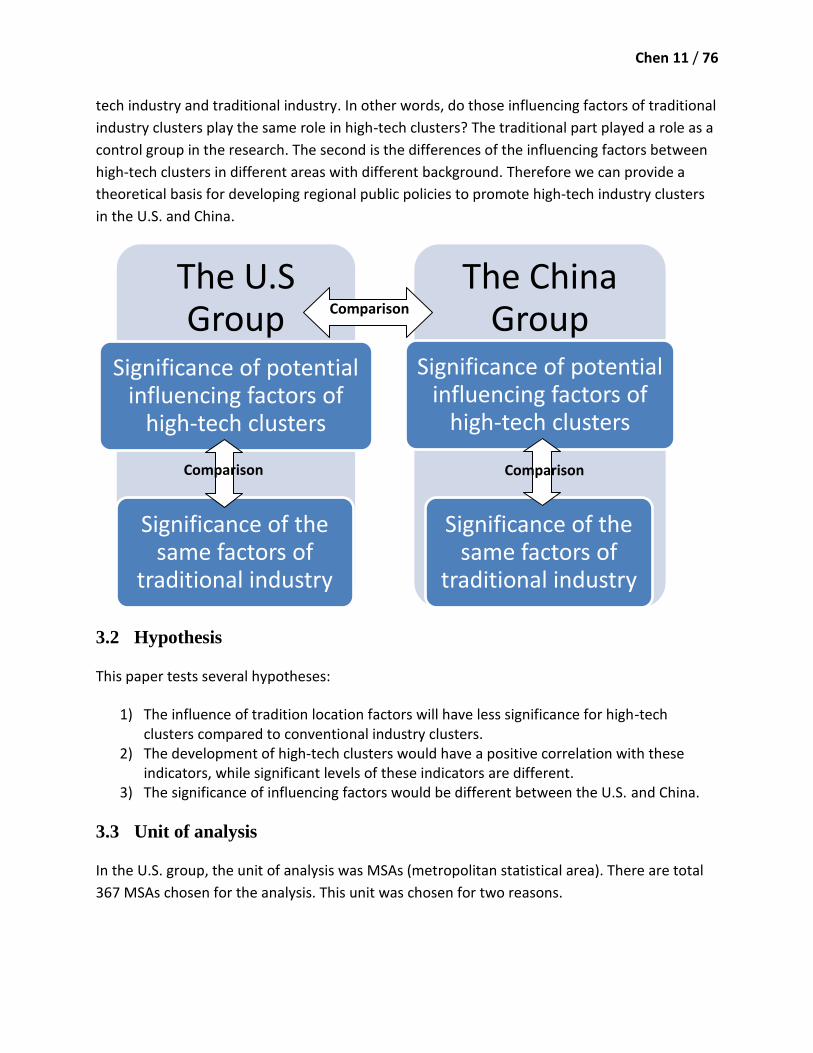
The method of empirical analysis mainly builds regression models of the influencing factors of
high-tech clusters for both U.S. and China. We can examine the influencing factors of high-
tech industry cluster from two perspectives. The first is the different influencing factors in high-
Chen 11 / 76
tech industry and traditional industry. In other words, do those influencing factors of traditional
industry clusters play the same role in high-tech clusters? The traditional part played a role as a
control group in the research. The second is the differences of the influencing factors between
high-tech clusters in different areas with different background. Therefore we can provide a
theoretical basis for developing regional public policies to promote high-tech industry clusters
in the U.S. and China.
3.2 Hypothesis
This paper tests several hypotheses:
1) The influence of tradition location factors will have less significance for high-tech clusters compared to conventional industry clusters.
2) The development of high-tech clusters would have a positive correlation with these indicators, while significant levels of these indicators are different.
3) The significance of influencing factors would be different between the U.S. and China.
3.3 Unit of analysis
In the U.S. group, the unit of analysis was MSAs (metropolitan statistical area). There are total
367 MSAs chosen for the analysis. This unit was chosen for two reasons.
The U.S Group
Significance of potential influencing factors of
high-tech clusters
Significance of the same factors of
traditional industry
The China Group
Significance of potential influencing factors of
high-tech clusters
Significance of the same factors of
traditional industry
Comparison
Comparison Comparison
Chen 12 / 76
1) The development of high-tech industry is usually a regional issue which sometimes
involves more than one city. The general concept of a metropolitan area is that of a
large population nucleus, together with adjacent communities with a high degree of
social and economic integration with that core. Metropolitan areas comprise one or
more entire counties, except in New England, where cities and towns are the basic
geographic units.[23] Thus metropolitan area is a better unit compared to other unit
which are most divided by political reason.
2) The Office of Management and Budget (OMB) defines metropolitan areas for purposes
of collecting, tabulating, and publishing federal data. Metropolitan area definitions
result from applying published standards to Census Bureau data. Since a big part of U.S.
data came from U.S. Census Bureau, using MSA as unit could get access to more types of
data.
In the China group, specific cities were used as analysis units. These specific cities were picked
based on the list of China National High-Tech Industrial Development Zone. China National High
-Tech Industrial Development Zones are national level high-tech clusters which were
established under the approval of the Chinese State Council. There are currently 87 China
National High-Tech Industrial Development Zones. Except Beijing and Shanghai, which have two
National High-Tech Industrial Development Zones, the cities selected all have one China
National High-Tech Industrial Development Zone. There were total 81 cities chosen after
removing some cities which have data missing.
3.4 Defined key concept
3.4.1 High-tech industry
There are many ways to identify high-tech industries. Usually there are two major approaches
to take: either the percentage of scientific and technical employment in a particular industry
compared to all industries or R&D dollars spent as a percent of total sales, a measure of
research intensity.
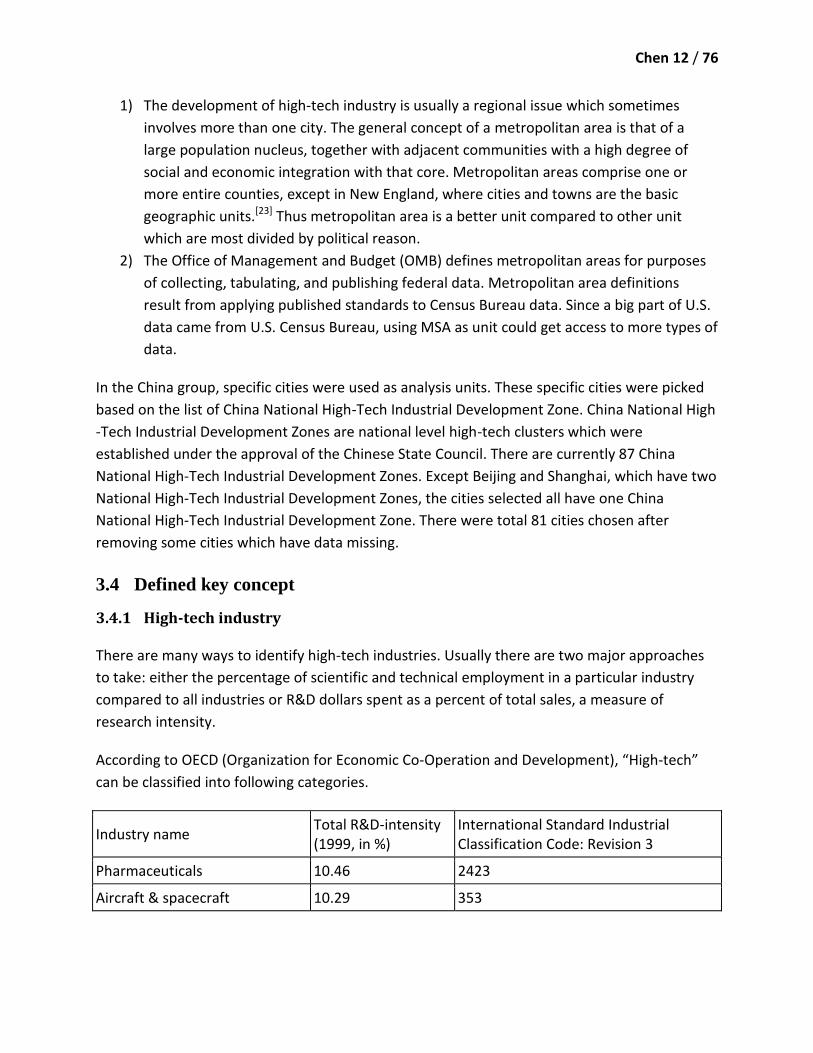
According to OECD (Organization for Economic Co-Operation and Development), “High-tech”
can be classified into following categories.
Industry name Total R&D-intensity (1999, in %)
International Standard Industrial Classification Code: Revision 3
Pharmaceuticals 10.46 2423
Aircraft & spacecraft 10.29 353

Chen 13 / 76
Medical, precision & optical instruments
9.69 33
Radio, television & communication equipment
7.48 32
Office, accounting & computing machinery
7.21 30
3.4.2 Traditional Industry
The conventional concept of traditional industry is an industrial sector that relies heavily on
manual labor and craft skills. This sector has existed for centuries. The Types of Traditional
Industries always includes but not limited to Agricultural Industries (Farming, Fishery,), Agro
processing industries (palm processing industries, fruit processing industries), Mining industries.
3.4.3 Terms used in this paper
The data collected for these two sectors of industry is as close as possible to the defined
concepts as mentioned. However due to the level of detail of the data accessible, in some part
of the analysis, this paper uses more general categories of these two sectors of industry. These
will be clearly stated in the data part of this paper.
3.5 Methods
According to the summary of former research on this topic, the analysis on this topic is always
done in qualitative methods such as case study. However the first three categories of
influencing factors are quantifiable with some indicators. Using quantitative analysis can make
the significance of these factors more intuitional and evaluate the level of significance. For the
last two categories, they will be discussed in a preliminary qualitative analysis, and although
they cannot be analyzed directly from this research, their importance can be evaluated by the
result of other three categories.
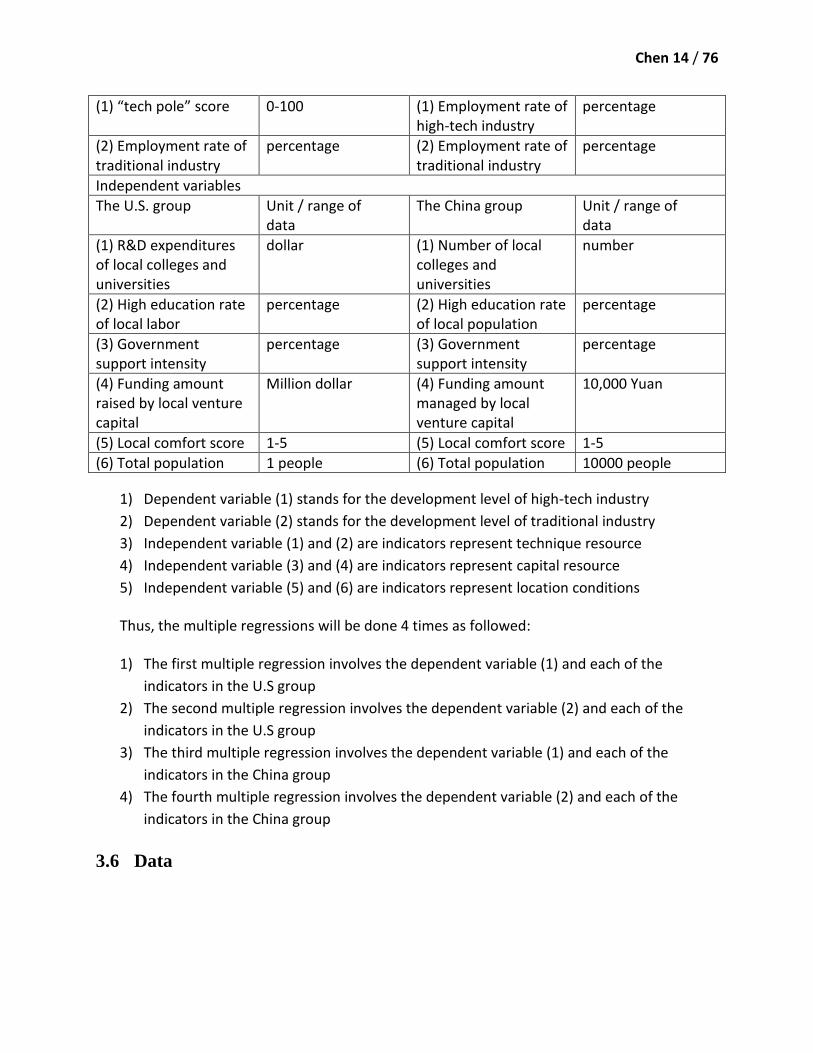
The quantitative analysis was done in multiple regression method using SAS software. The
dependent variables and independent variables in the U.S. and the China group are showed in
the following table. In this table, the variables in different groups with same number are
corresponding to each other.
Dependent variables
The U.S. group Unit / range of data
The China group Unit/ range of data
Chen 14 / 76
(1) “tech pole” score 0-100 (1) Employment rate of high-tech industry
percentage
(2) Employment rate of traditional industry
percentage (2) Employment rate of traditional industry
percentage
Independent variables
The U.S. group Unit / range of data
The China group Unit / range of data
(1) R&D expenditures of local colleges and universities
dollar (1) Number of local colleges and universities
number
(2) High education rate of local labor
percentage (2) High education rate of local population
percentage
(3) Government support intensity
percentage (3) Government support intensity
percentage
(4) Funding amount raised by local venture capital
Million dollar (4) Funding amount managed by local venture capital
10,000 Yuan
(5) Local comfort score 1-5 (5) Local comfort score 1-5
(6) Total population 1 people (6) Total population 10000 people
1) Dependent variable (1) stands for the development level of high-tech industry
2) Dependent variable (2) stands for the development level of traditional industry
3) Independent variable (1) and (2) are indicators represent technique resource
4) Independent variable (3) and (4) are indicators represent capital resource
5) Independent variable (5) and (6) are indicators represent location conditions
Thus, the multiple regressions will be done 4 times as followed:
1) The first multiple regression involves the dependent variable (1) and each of the
indicators in the U.S group
2) The second multiple regression involves the dependent variable (2) and each of the
indicators in the U.S group
3) The third multiple regression involves the dependent variable (1) and each of the
indicators in the China group
4) The fourth multiple regression involves the dependent variable (2) and each of the
indicators in the China group
3.6 Data

Chen 15 / 76
Data used in this study was secondary data since the research is at the city or metropolitan area
level. Data was gathered mainly from statistic reports released by governments or statistical
organizations and later manual arranged unit by unit.
3.6.1 Data for the U.S. group
The data used in U.S group were collected from:
1) American Community Survey 2010
Data from American Fact Finder
http://factfinder.census.gov/home/saff/main.html?_lang=en
2) NSF Survey of Research and Development Expenditures at Universities and Colleges
2009
Data from WebCASPAR Integrated Science and Engineering Resources Data System
https://webcaspar.nsf.gov/index.jsp?expired=expired&js=js
3) North America’s High-Tech Economy: The Geography of Knowledge-Based
Industries ranks
Data from Milken Institute
http://www.milkeninstitute.org/pdf/NAHTweb.pdf
4) Local Climatological Data Annual Summary (1971-2000)
Data from National Oceanographic Data Center (NODC)
http://ols.nndc.noaa.gov/plolstore/plsql/olstore.prodspecific?prodnum=C00095-PUB-
A0001#TABLES
5) Interactive Map: the United States of Venture Capital
Data from The Wall Street Journal
http://blogs.wsj.com/venturecapital/2011/08/04/interactive-map-the-united-states-of-
venture-capital/tab/interactive/
6) ZIP Code to County & Metro Equivalence Table
Data from Proximity Decision Making Information
http://proximityone.com/zipequiv.htm
3.6.2 Data for the China group
The data used in China group were collected from:
1) Annually City Database
Data from Chinese economic statistics database
http://162.105.138.185:90/scorpio/aspx/main.aspx?width=1014&height=708

Chen 16 / 76
2) The second national R&D resource survey
Data from National Bureau of Statistics of China database
http://www.stats.gov.cn/tjsj/qtsj/d2crd/
3) China Statistical Yearbook 2009
Data from National Bureau of Statistics of China database
http://www.stats.gov.cn/tjsj/ndsj/2009/indexch.htm
4) China Venture Capital Yearbook 2010
Data from China Yearbook
http://www.chinayearbook.com/yearbook/book_41815.htm
5) Monthly climate value of China ground international exchange station dataset (1971-
2000)
Data from China Meteorological Data Sharing Service System
http://cdc.cma.gov.cn/shuju/search1.jsp?dsid=SURF_CLI_CHN_MUL_MMON_19712000
_CES&tpcat=SURF&type=table&pageid=3
3.7 Validity Threats
In the model estimation, there will be missing variables since there are many factors can
influence the industry clusters. In addition, the correlation between independent variables may
also affect the final result.
This problem is common in almost all of the quantitative research, and what this paper do to
avoid bigger error is to analysis the independent variables one by one with the dependent
variable first, and perform the correlation analysis between the independent variables if
necessary.
This paper focuses on high-tech industry cluster theory to do some basic, general research
on high-tech industrial clustering in the U.S. and China. Limited by the information and
structure of knowledge, policy recommendations for promoting the development of high-tech
clusters in the U.S. and China require more in-depth study in the future.
Policy recommendations for promoting the development of high-tech clusters in both countries
will be based on the analysis result of the quantitative research, and on qualitative analysis of
the local conditions of the U.S. and China.
Chen 17 / 76
4 Research analysis
4.1 Preliminary Qualitative Analysis
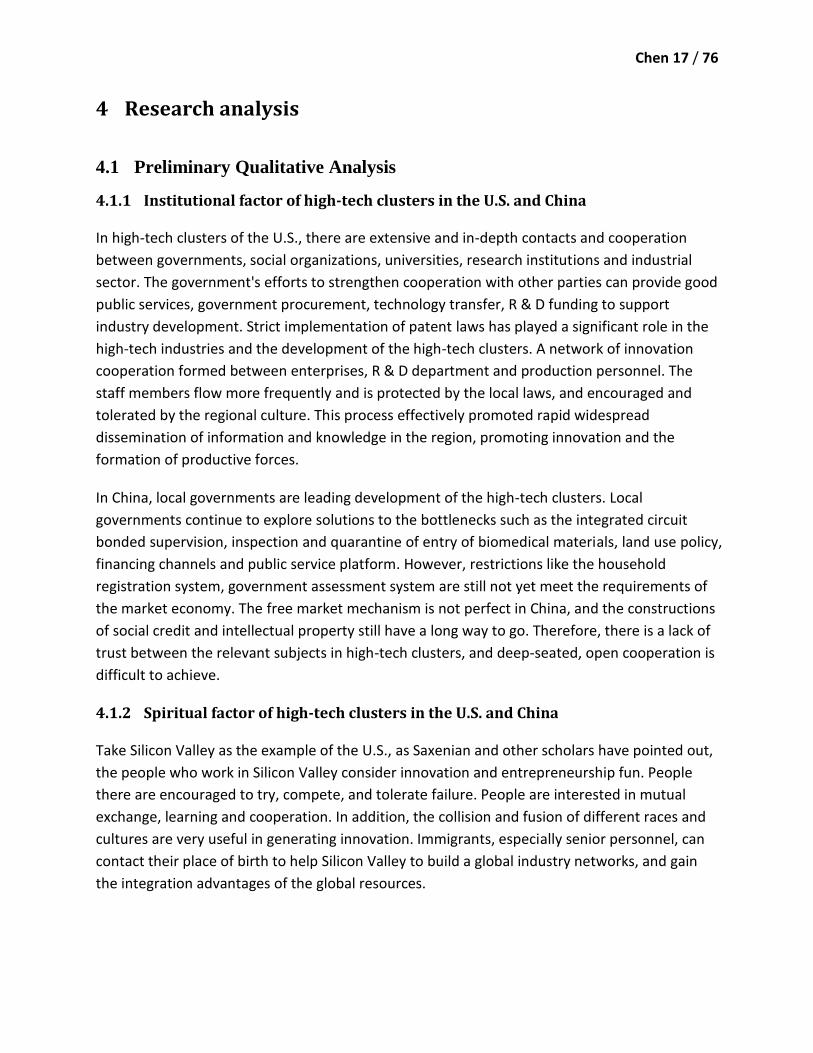
4.1.1 Institutional factor of high-tech clusters in the U.S. and China
In high-tech clusters of the U.S., there are extensive and in-depth contacts and cooperation
between governments, social organizations, universities, research institutions and industrial
sector. The government's efforts to strengthen cooperation with other parties can provide good
public services, government procurement, technology transfer, R & D funding to support
industry development. Strict implementation of patent laws has played a significant role in the
high-tech industries and the development of the high-tech clusters. A network of innovation
cooperation formed between enterprises, R & D department and production personnel. The
staff members flow more frequently and is protected by the local laws, and encouraged and
tolerated by the regional culture. This process effectively promoted rapid widespread
dissemination of information and knowledge in the region, promoting innovation and the
formation of productive forces.
In China, local governments are leading development of the high-tech clusters. Local
governments continue to explore solutions to the bottlenecks such as the integrated circuit
bonded supervision, inspection and quarantine of entry of biomedical materials, land use policy,
financing channels and public service platform. However, restrictions like the household
registration system, government assessment system are still not yet meet the requirements of
the market economy. The free market mechanism is not perfect in China, and the constructions
of social credit and intellectual property still have a long way to go. Therefore, there is a lack of
trust between the relevant subjects in high-tech clusters, and deep-seated, open cooperation is
difficult to achieve.
4.1.2 Spiritual factor of high-tech clusters in the U.S. and China
Take Silicon Valley as the example of the U.S., as Saxenian and other scholars have pointed out,
the people who work in Silicon Valley consider innovation and entrepreneurship fun. People
there are encouraged to try, compete, and tolerate failure. People are interested in mutual
exchange, learning and cooperation. In addition, the collision and fusion of different races and
cultures are very useful in generating innovation. Immigrants, especially senior personnel, can
contact their place of birth to help Silicon Valley to build a global industry networks, and gain
the integration advantages of the global resources.

Chen 18 / 76
In China, use Shanghai-Zhangjiang as example, although the managers of the high-tech park
tried to hold many cultural and sports brand activities and strive to create similar culture as
Silicon Valley, but it is still with limited success in nurturing innovative entrepreneurial culture.
This may mainly due to the following reasons: traditional Chinese culture such as moderation,
"valuing official titles", and the Shanghai local tradition to seek high salaries and the white-
collar culture, still deeply influence the people of the high-tech park.
4.2 Quantitative Variable Calculation and Selection
4.2.1 Dependent variables in the U.S. group
The variable (1) showing the development level of high-tech clusters is the “tech pole” score.
The score value came from a report made by the Milken Institute. They used the latest available
2007 data for U.S. and Canadian metros in their analysis. In the report, North America’s High-
Tech Economy: The Geography of Knowledge-Based Industries ranks, the researchers of Milken
Institute examined the locations and patterns of growth in nineteen high-tech industry
categories. They then aggregated those results to determine overall high-tech performance.
This benchmarking metric is based on employment and wages; it also looks at the
concentration of technology in the local economy and each metro’s relative share of aggregate
North American activity. [24]
1) Pharmaceutical and Medicine Manufacturing: NAICS 3524
2) Commercial and Service Industry Machinery Manufacturing: NAICS 3333
3) Computer and Peripheral Equipment Manufacturing: NAICS 3341
4) Communications Equipment Manufacturing: NAICS 3342
5) Audio and Video Equipment Manufacturing: NAICS 3343
6) Semiconductor and Other Electronic Component Manufacturing: NAICS 3344
7) Navigational, Measuring, Electro-medical, and Control Instruments Manufacturing:
NAICS 3345
8) Manufacturing and Reproducing Magnetic and Optical Media: NAICS 3346
9) Aerospace and Products and Parts Manufacturing: NAICS 3364
10) Medical Equipment and Supplies Manufacturing: NAICS 3391
11) Software Publishers: NAICS 5112
12) Motion Picture and Video Industries: NAICS 5121
13) Telecommunications: NAICS 517
14) Data Processing, Hosting, and Related Services: NAICS 518
15) Other Information Services: NAICS 5191
16) Architectural, Engineering, and Related Services: NAICS 5413
Chen 19 / 76
17) Computer Systems Design and Related Services: NAICS 5415
18) Scientific Research and Development Services: NAICS 5417
19) Medical and Diagnostic Labs: NAICS 6215
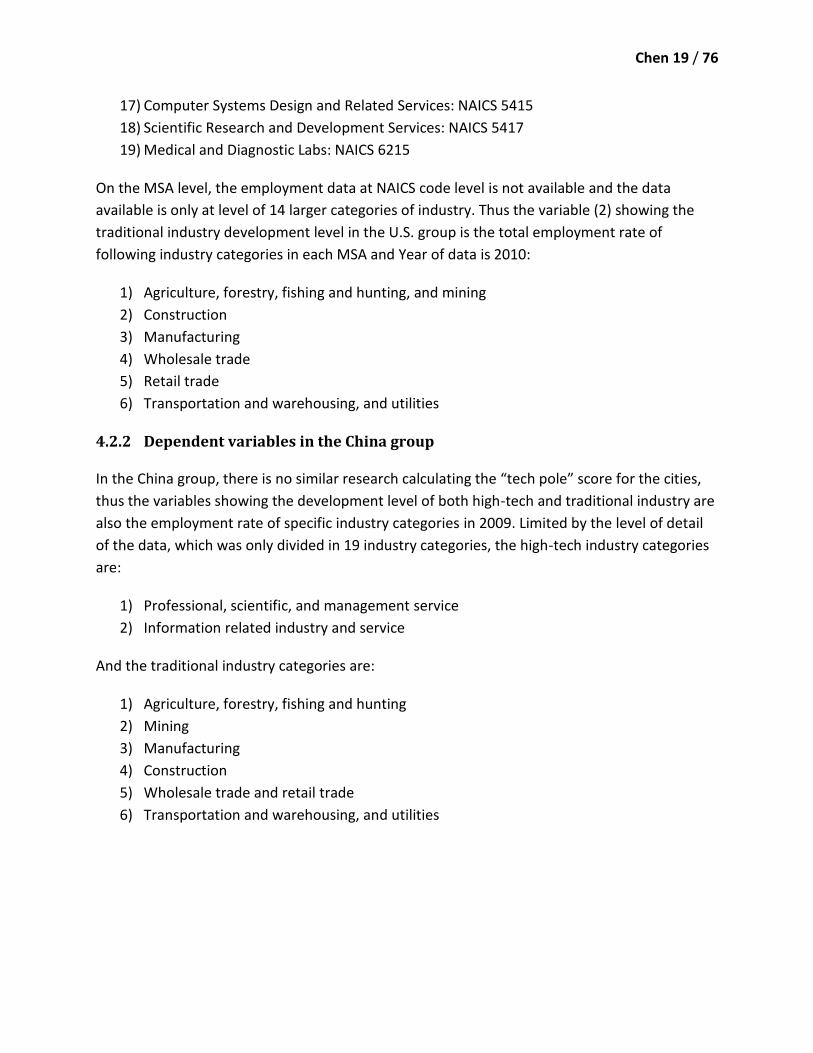
On the MSA level, the employment data at NAICS code level is not available and the data
available is only at level of 14 larger categories of industry. Thus the variable (2) showing the
traditional industry development level in the U.S. group is the total employment rate of
following industry categories in each MSA and Year of data is 2010:
1) Agriculture, forestry, fishing and hunting, and mining
2) Construction
3) Manufacturing
4) Wholesale trade
5) Retail trade
6) Transportation and warehousing, and utilities
4.2.2 Dependent variables in the China group
In the China group, there is no similar research calculating the “tech pole” score for the cities,
thus the variables showing the development level of both high-tech and traditional industry are
also the employment rate of specific industry categories in 2009. Limited by the level of detail
of the data, which was only divided in 19 industry categories, the high-tech industry categories
are:
1) Professional, scientific, and management service
2) Information related industry and service
And the traditional industry categories are:
1) Agriculture, forestry, fishing and hunting
2) Mining
3) Manufacturing
4) Construction
5) Wholesale trade and retail trade
6) Transportation and warehousing, and utilities
Chen 20 / 76
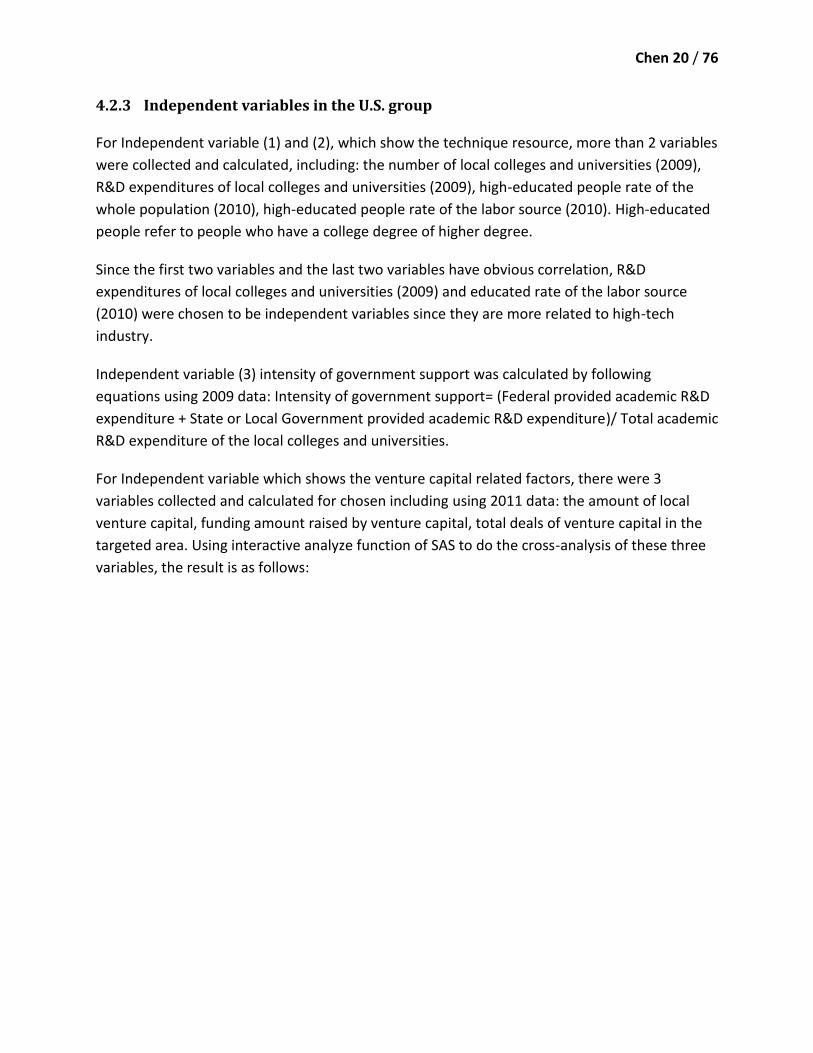
4.2.3 Independent variables in the U.S. group
For Independent variable (1) and (2), which show the technique resource, more than 2 variables
were collected and calculated, including: the number of local colleges and universities (2009),
R&D expenditures of local colleges and universities (2009), high-educated people rate of the
whole population (2010), high-educated people rate of the labor source (2010). High-educated
people refer to people who have a college degree of higher degree.
Since the first two variables and the last two variables have obvious correlation, R&D
expenditures of local colleges and universities (2009) and educated rate of the labor source
(2010) were chosen to be independent variables since they are more related to high-tech
industry.
Independent variable (3) intensity of government support was calculated by following
equations using 2009 data: Intensity of government support= (Federal provided academic R&D
expenditure + State or Local Government provided academic R&D expenditure)/ Total academic
R&D expenditure of the local colleges and universities.
For Independent variable which shows the venture capital related factors, there were 3
variables collected and calculated for chosen including using 2011 data: the amount of local
venture capital, funding amount raised by venture capital, total deals of venture capital in the
targeted area. Using interactive analyze function of SAS to do the cross-analysis of these three
variables, the result is as follows:

Chen 21 / 76
The cross-analysis scatter chart showed that these three variables have very strong correlation
to each other. Then only one of them was needed in the final analysis. The funding amount
raised by venture capital (2011) was chosen as independent variable (4) because of its greater
data value range.
Independent variable (5) Local comfort score is reclassified by human comfort index. Human
comfort index is biometeorology indicators developed based on the heat exchange
between the human and atmospheric environment. The human comfort index reflects the
feelings of the body of air temperature, humidity and other factors, and these factors were
“comfortable” digitized and graded [25]-[27]. Considering the influence of temperature and
humidity on human comfort, this paper chose the most widely used formula to calculate the
human comfort index IHC= T- (0.55- HR) × (T-58).[28] In this formula, IHC stands for human
comfort index, T stands for temperature in ℉ unit, and HR stands for humidity in percentage.
Data used for temperature and humidity was the annual average data from 1971-2000.

Chen 22 / 76
When the index is between 59-70, the human body will feel very comfortable. At higher index,
the body feels hotter and less comfortable. At lower index, the body feels colder and less
comfortable. Thus the comfort score was reclassified based on the comfort index value of each
analysis unit as following table:
Human Comfort Index
86-88 80-85 76-79 71-75 59-70 51-58 39-50 26-38 ≦25
Local Comfort Score
1 2 3 4 5 4 3 2 1
The last independent variable (6) also reflects the location condition. Total population (2010)
was chosen to show the size of the target area.
4.2.4 Independent variables in the China group
For Independent variable (1) and (2), which show technical resources in China, data is accessible
only on the number of local colleges and universities (2009) and high education rate of the
whole population (2009). Besides, the high-educated people rate of the population is only
accessible at province level. Thus the same high education rate of the whole population was
used for several different cities in the same cities.
Independent variable (3), intensity of government support, was calculated by the following
equations: Intensity of government support= Government provided R&D expenditure / Total
R&D expenditure of the area. Year of data is 2009. This data is also available at province level.
For the Independent variable, which shows the venture capital related factors, there were two
variables collected and calculated using 2009 data including: the amount of local venture
capital, funding amount managed by venture capital in the targeted area. Using interactive
analyze function of SAS to do the correlation analysis of these two variables, the result is as
follows:

Chen 23 / 76
There is also a strong correlation between these two variables in the China part. Thus Funding
amount managed by venture capital (2009) was chosen as independent variable (4) because of
its greater data value range.
For Independent variable (5) Local comfort score in the China group, the calculation and
reclassification is the same as the U.S. Group, and has the same year of data.
For Independent variable (6), total population, the year of data is 2009.
4.3 Linear regression analysis

Chen 24 / 76
4.3.1 The U.S. group
4.3.1.1 Linear regression of dependent variable (1) tech pole score and Independent
variable (1) total academic R&D expenditure of local colleges and universities
From the scatter chart we can tell there seems to be a relation between the tech pole score and
total academic R&D expenditure of local colleges and universities for most of the MSAs. There
are several exceptions, such as the rank 1 high-tech area San Jose-Sunnyvale-Santa Clara Metro
Area, which has a relatively medium academic R&D expenditure. And the total $5.8 million
annually academic R&D expenditure of the New York-Northern New Jersey-Long Island Metro
Area, which is more than twice of the second MSA in this field, does not make this area have
better performance on high-tech clusters.
Los Angeles-Long Beach-Santa Ana Boston-Cambridge-Quincy
San Jose-Sunnyvale-Santa Clara
San Francisco-Oakland-Fremont
Baltimore-Towson
New York-Northern New
Jersey-Long Island
Seattle-Tacoma-Bellevue
Washington-Arlington-Alexandria

Chen 25 / 76
4.3.1.2 Linear regression of dependent variable (1) tech pole score and Independent
variable (2) High education rate of labor
It can be observed that as the tech pole score rising, the correlation between the two factors is
more obvious. However, those MSAs have a low tech pole score, which formed a big part of the
data pool, the high education rate various in a large range and did not show a significant
relation.
San Jose-Sunnyvale-Santa Clara
Seattle-Tacoma-Bellevue Boston-Cambridge-Quincy Washington-Arlington- Alexandria
Los Angeles-Long Beach-Santa Ana
Bolder
Ithaca Ann Arbor
Dallas-Fort Worth-Arlington
Chen 26 / 76
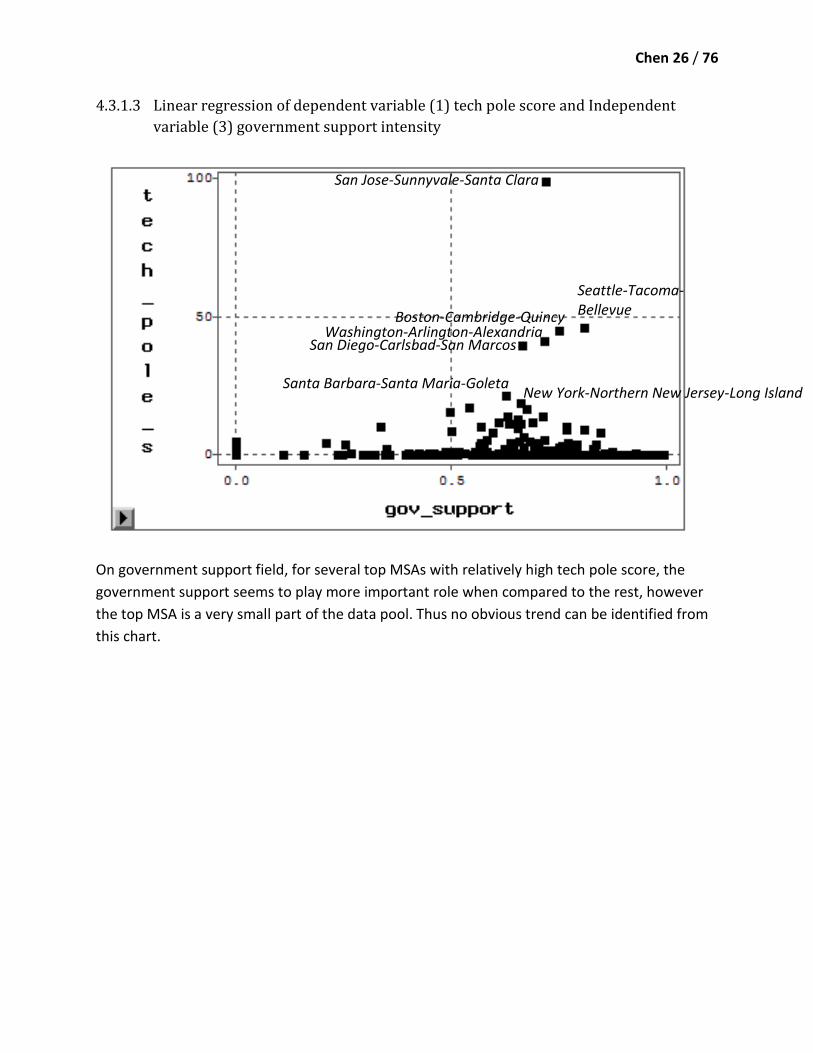
4.3.1.3 Linear regression of dependent variable (1) tech pole score and Independent
variable (3) government support intensity
On government support field, for several top MSAs with relatively high tech pole score, the
government support seems to play more important role when compared to the rest, however
the top MSA is a very small part of the data pool. Thus no obvious trend can be identified from
this chart.
San Jose-Sunnyvale-Santa Clara
Seattle-Tacoma-Bellevue Boston-Cambridge-Quincy
Washington-Arlington-Alexandria San Diego-Carlsbad-San Marcos
Santa Barbara-Santa Maria-Goleta New York-Northern New Jersey-Long Island
Chen 27 / 76
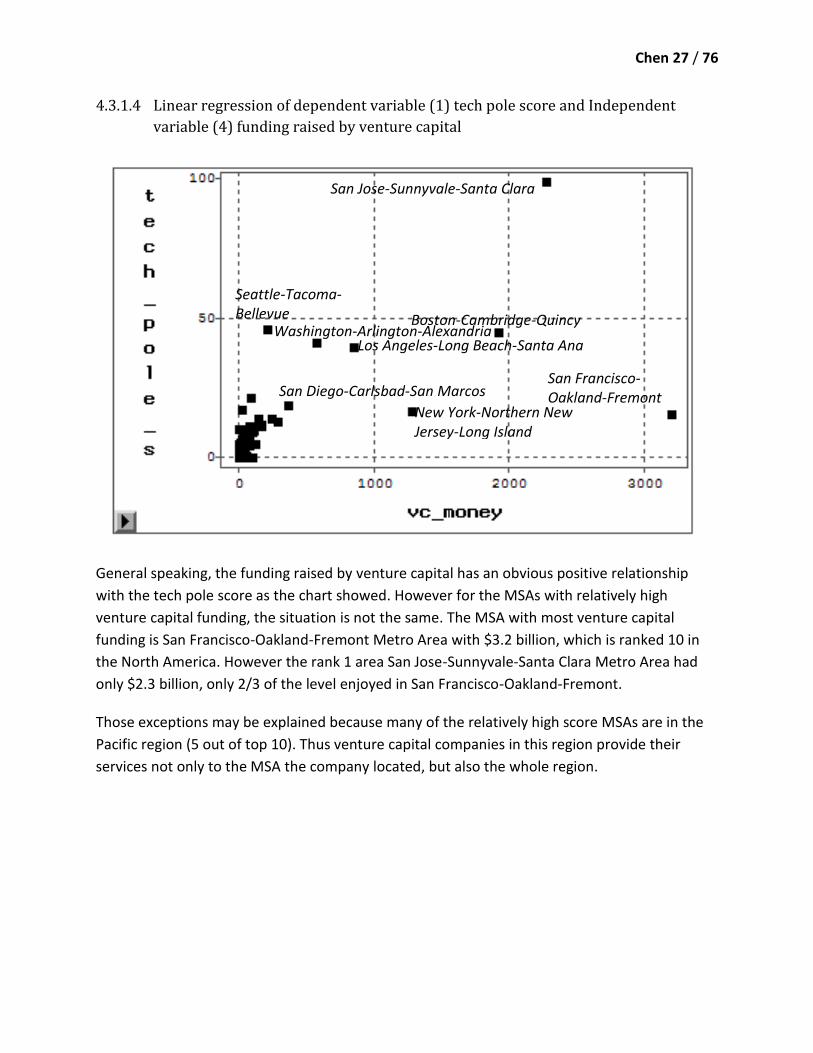
4.3.1.4 Linear regression of dependent variable (1) tech pole score and Independent
variable (4) funding raised by venture capital
General speaking, the funding raised by venture capital has an obvious positive relationship
with the tech pole score as the chart showed. However for the MSAs with relatively high
venture capital funding, the situation is not the same. The MSA with most venture capital
funding is San Francisco-Oakland-Fremont Metro Area with $3.2 billion, which is ranked 10 in
the North America. However the rank 1 area San Jose-Sunnyvale-Santa Clara Metro Area had
only $2.3 billion, only 2/3 of the level enjoyed in San Francisco-Oakland-Fremont.
Those exceptions may be explained because many of the relatively high score MSAs are in the
Pacific region (5 out of top 10). Thus venture capital companies in this region provide their
services not only to the MSA the company located, but also the whole region.
San Jose-Sunnyvale-Santa Clara
San Francisco-Oakland-Fremont
Boston-Cambridge-Quincy
New York-Northern New Jersey-Long Island
Los Angeles-Long Beach-Santa Ana Washington-Arlington-Alexandria
Seattle-Tacoma-Bellevue
San Diego-Carlsbad-San Marcos
Chen 28 / 76
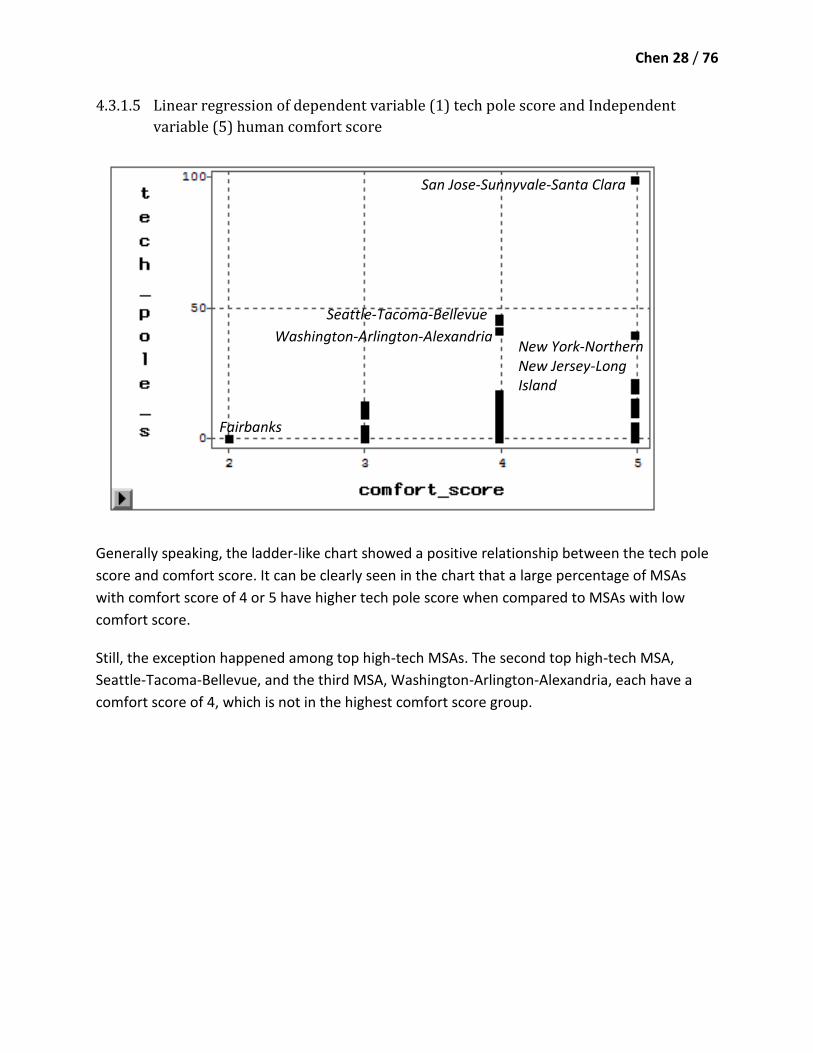
4.3.1.5 Linear regression of dependent variable (1) tech pole score and Independent
variable (5) human comfort score
Generally speaking, the ladder-like chart showed a positive relationship between the tech pole
score and comfort score. It can be clearly seen in the chart that a large percentage of MSAs
with comfort score of 4 or 5 have higher tech pole score when compared to MSAs with low
comfort score.
Still, the exception happened among top high-tech MSAs. The second top high-tech MSA,
Seattle-Tacoma-Bellevue, and the third MSA, Washington-Arlington-Alexandria, each have a
comfort score of 4, which is not in the highest comfort score group.
San Jose-Sunnyvale-Santa Clara
Seattle-Tacoma-Bellevue
Washington-Arlington-Alexandria New York-Northern New Jersey-Long Island
Fairbanks

Chen 29 / 76
4.3.1.6 Linear regression of dependent variable (1) tech pole score and Independent
variable (6) total population
In this chart, a positive trend showed clearly in the group of MSAs which has a population no
more than 10 million.
The San Jose-Sunnyvale-Santa Clara area is the location of Silicon Valley, and it can be explained
that it has a relatively low corresponding population because of the high technology density
there. Once again, New York-Northern New Jersey-Long Island, which has the largest
population of any U.S. MSA, became a strange point on the chart with worse performance than
expected.
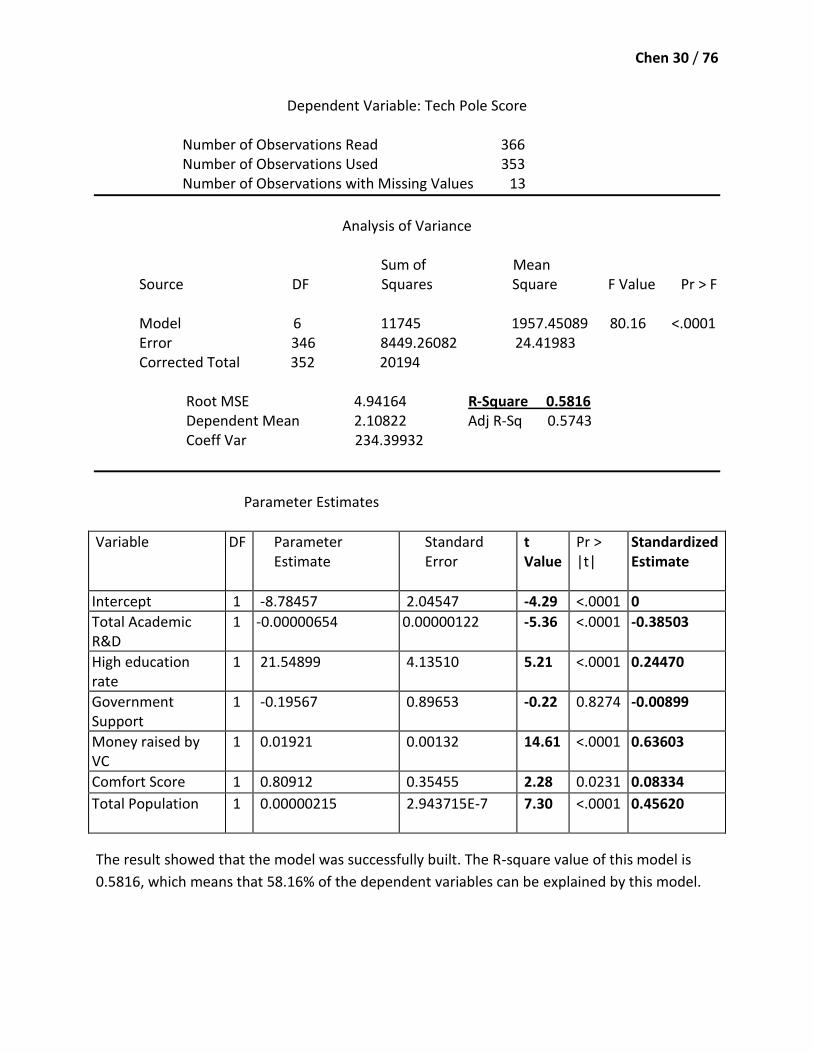
4.3.1.7 Multiple regression for dependent variable (1)
The first attempt at building a multiple regression model for the U.S. group had the following
result:
The REG Procedure Model: MODEL1
New York-Northern New Jersey-Long Island
San Jose-Sunnyvale-Santa Clara
Los Angeles-Long Beach-Santa Ana
Chicago-Joliet-Naperville
Dallas-Fort Worth-Arlington
Seattle-Tacoma-Bellevue Boston-Cambridge-Quincy
Washington-Arlington-Alexandria
Chen 30 / 76
Dependent Variable: Tech Pole Score Number of Observations Read 366 Number of Observations Used 353 Number of Observations with Missing Values 13
Analysis of Variance
Sum of Mean Source DF Squares Square F Value Pr > F Model 6 11745 1957.45089 80.16 <.0001 Error 346 8449.26082 24.41983 Corrected Total 352 20194 Root MSE 4.94164 R-Square 0.5816 Dependent Mean 2.10822 Adj R-Sq 0.5743 Coeff Var 234.39932
Parameter Estimates
Variable
DF
Parameter Estimate
Standard Error
t Value
Pr > |t|
Standardized Estimate
Intercept 1 -8.78457 2.04547 -4.29 <.0001 0
Total Academic R&D
1 -0.00000654 0.00000122 -5.36 <.0001 -0.38503
High education rate
1 21.54899 4.13510 5.21 <.0001 0.24470
Government Support
1 -0.19567 0.89653 -0.22 0.8274 -0.00899
Money raised by VC
1 0.01921 0.00132 14.61 <.0001 0.63603
Comfort Score 1 0.80912 0.35455 2.28 0.0231 0.08334
Total Population 1
0.00000215 2.943715E-7 7.30
<.0001
0.45620
The result showed that the model was successfully built. The R-square value of this model is
0.5816, which means that 58.16% of the dependent variables can be explained by this model.
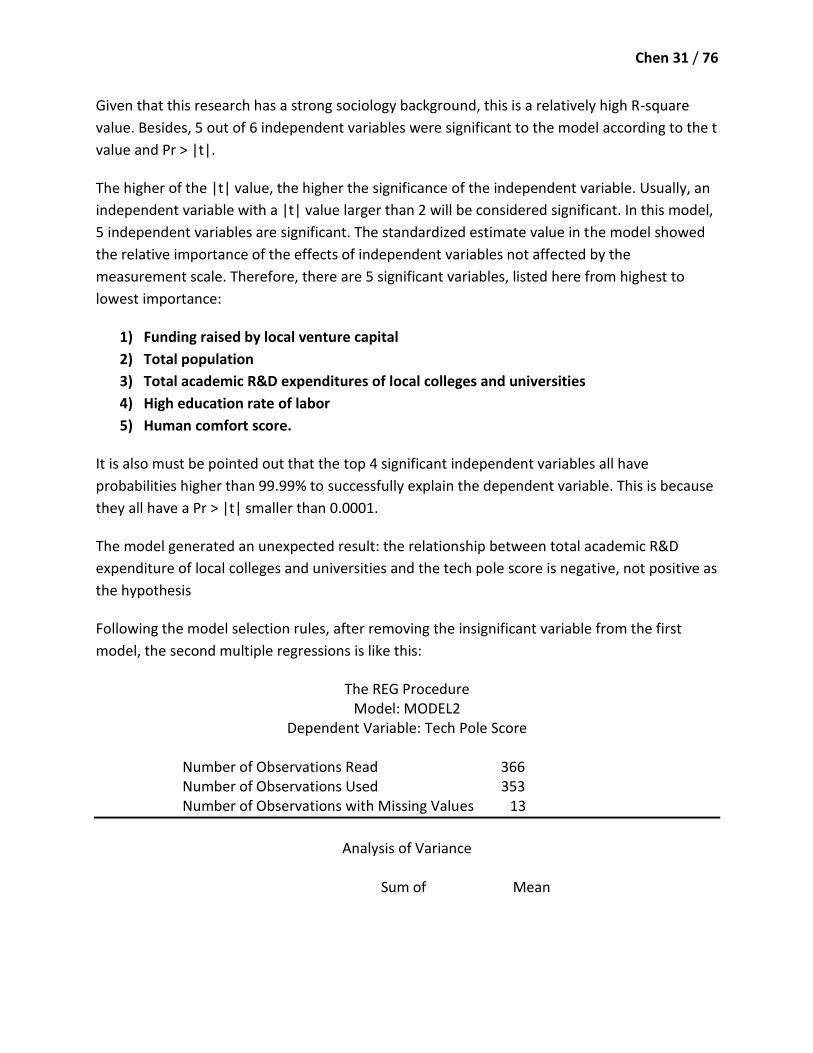
Chen 31 / 76
Given that this research has a strong sociology background, this is a relatively high R-square
value. Besides, 5 out of 6 independent variables were significant to the model according to the t
value and Pr > |t|.
The higher of the |t| value, the higher the significance of the independent variable. Usually, an
independent variable with a |t| value larger than 2 will be considered significant. In this model,
5 independent variables are significant. The standardized estimate value in the model showed
the relative importance of the effects of independent variables not affected by the
measurement scale. Therefore, there are 5 significant variables, listed here from highest to
lowest importance:
1) Funding raised by local venture capital
2) Total population
3) Total academic R&D expenditures of local colleges and universities
4) High education rate of labor
5) Human comfort score.
It is also must be pointed out that the top 4 significant independent variables all have
probabilities higher than 99.99% to successfully explain the dependent variable. This is because
they all have a Pr > |t| smaller than 0.0001.
The model generated an unexpected result: the relationship between total academic R&D
expenditure of local colleges and universities and the tech pole score is negative, not positive as
the hypothesis
Following the model selection rules, after removing the insignificant variable from the first
model, the second multiple regressions is like this:
The REG Procedure Model: MODEL2
Dependent Variable: Tech Pole Score Number of Observations Read 366 Number of Observations Used 353 Number of Observations with Missing Values 13
Analysis of Variance
Sum of Mean

Chen 32 / 76
Source DF Squares Square F Value Pr > F Model 5 11744 2348.70843 96.45 <.0001 Error 347 8450.42403 24.35281 Corrected Total 352 20194 Root MSE 4.93486 R-Square 0.5815 Dependent Mean 2.10822 Adj R-Sq 0.5755 Coeff Var 234.07744
Parameter Estimates
Variable
DF
Parameter Estimate
Standard Error
t Value
Pr > |t|
Standardized Estimate
Intercept 1 -8.70821 2.01256 -4.33 <.0001 0
Total Academic R&D
1 -0.00000652 0.00000122 -5.36 <.0001 -0.38397
High education rate
1 21.10744 3.60143 5.86 <.0001 0.23969
Money raised by VC
1 0.01924 0.00133 14.69 <.0001 0.63676
Comfort Score 1 0.80236 0.35271 2.27 0.0231 0.08264
Total Population 1
0.00000214 2.916377E-7 7.34
<.0001
0.45448
Compare the modified model to the first one, the R-square value is 0.5815, almost the same as
the former 0.5816, which means removing the government support factors from the first model
almost have no effect on the explanation ability of the other 5 independent variables. What’s
more, except the human comfort score, the rest 4 high significant variables all had a
standardized estimated value.
Therefore, the final equation between the tech pole score and the independent variables is:
Tech pole score = -8.70821-0.00000652 (total academic R&D expenditure of local colleges
and universities) + 21.10744 (High education rate of labor) +0.01924 (total money amount in
million dollar raised by local venture capital) + 0.80236 (human comfort score) +
0.00000214(total population)

Chen 33 / 76
4.3.1.8 Multiple regression for dependent variable (2)
The result of multiple regression of control group of traditional industry is as followed:
The REG Procedure Model: MODEL3
Dependent Variable: Traditional Industry Employment Rate Number of Observations Read 366 Number of Observations Used 347 Number of Observations with Missing Values 19
Analysis of Variance
Sum of Mean Source DF Squares Square F Value Pr > F Model 6 0.62831 0.10472 48.92 <.000 Error 340 0.72787 0.00214 Corrected Total 346 1.35618 Root MSE 0.04627 R-Square 0.4633 Dependent Mean 0.39126 Adj R-Sq 0.4538 Coeff Var 11.82559
Parameter Estimates
Variable
DF
Parameter Estimate
Standard Error
t Value
Pr > |t|
Standardized Estimate
Intercept 1 0.60273 0.01919 31.41 <.0001 0
Total Academic R&D
1 -1.46138E-8 1.143672E-8 -1.28 0.2022 -0.10484
High education rate
1 -0.4687 0.03884 -12.07
<.0001 -0.64444
Government Support
1 -0.01633 0.00847 -1.93 0.0547 -0.09034
Money raised by VC
1 0.00002409 0.00001232 1.96 0.0512 0.09731
Comfort Score 1 -0.01607 0.00333 -4.82 <.0001 -0.20085
Total Population 1
2.665631E-9 2.757811E-9 0.97 0.3344 0.0689

Chen 34 / 76
The result shows there are 2 independent variables: high educated employment rates and
human comfort scores are also significant with traditional industry. However, the relationship
between these two independent variables and the dependent variable is reverse. These two
variables have a negative relationship with the traditional industry employment rates.
4.3.2 The China group
4.3.2.1 Linear regression of dependent variable (1) High-tech industry employment rate
and Independent variable (1) number of local colleges and universities
The relation between the number of colleges and universities showed a positive relationship
with the high-tech industry employment rate.
Daqing Beijing
Mianyang Xian
Shanghai
Jinan
Wuhan
Chen 35 / 76
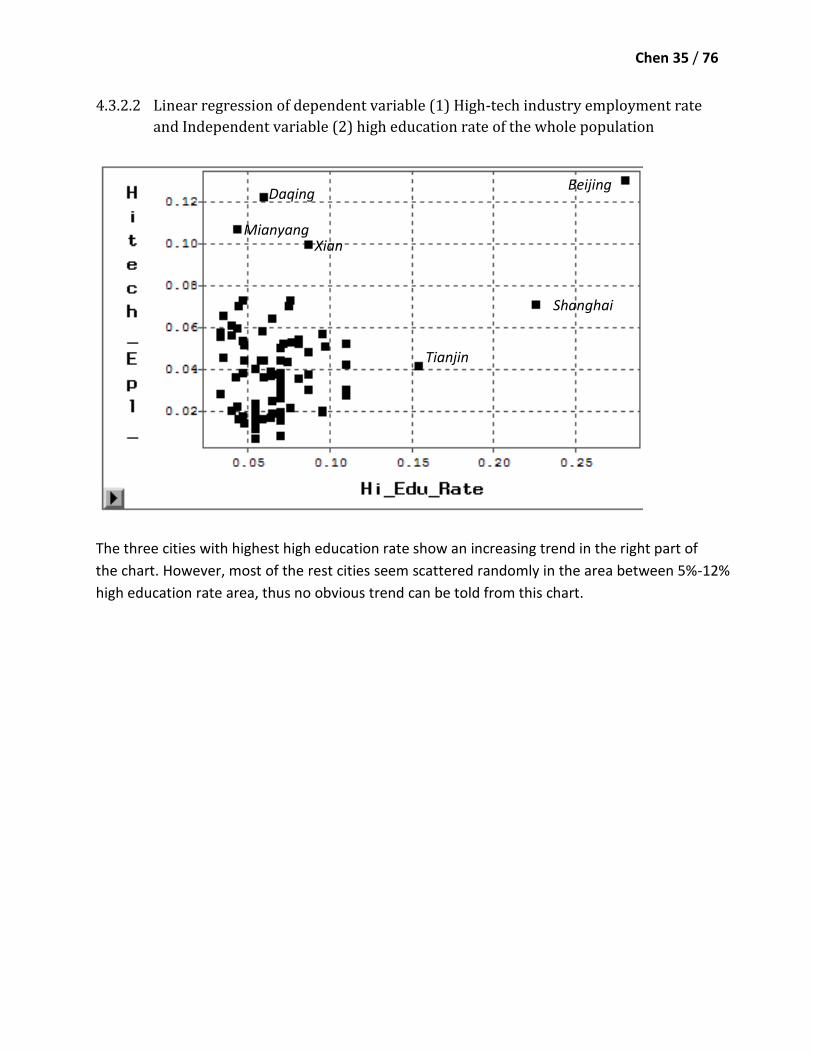
4.3.2.2 Linear regression of dependent variable (1) High-tech industry employment rate
and Independent variable (2) high education rate of the whole population
The three cities with highest high education rate show an increasing trend in the right part of
the chart. However, most of the rest cities seem scattered randomly in the area between 5%-12%
high education rate area, thus no obvious trend can be told from this chart.
Beijing
Shanghai
Tianjin
Daqing
Mianyang Xian

Chen 36 / 76
4.3.2.3 Linear regression of dependent variable (1) High-tech industry employment rate
and Independent variable (3) government support intensity
Generally speaking, a positive relationship exists between the intensity of government support
and resulting high-tech industry employment rate. It is noticeable that intensity of government
support is strongest for Xian, Xianyang, Weinan and Baoji. However, only Xian’s performance
matched its higher high-tech employment rate. This is because the data for intensity of
government support is at province level, and the three other cities are in the same province of
Xian. It is possible that much of the government’s support flowed to Xian because it is the
capital of the province.
Xian
Xianyang
Weinan Baoji
Haikou
Beijing
,Mianyang
,Chengdu
Zigong
Daqing
Kunming Lanzhou
Baiyin
Harbin
Qiqihar
Changchun
Jilin

Chen 37 / 76
4.3.2.4 Linear regression of dependent variable (1) High-tech industry employment rate
and Independent variable (4) funding managed by local venture capital
Most of the points are concentrated along or near the 0 axis of VC_Money. This is because half
of the cities do not have venture capital, and in those which have venture capital, most of they
have very few number of venture capital no more than 5. It is clear that most funding managed
by venture capital in China is concentrated in Beijing, Shanghai and Shenzhen, and as this
funding continues to rise, high-tech employment is also climbing.
Beijing
Shanghai
Shenzhen
Daqing
Mianyang Xian
Tianjin
Chen 38 / 76
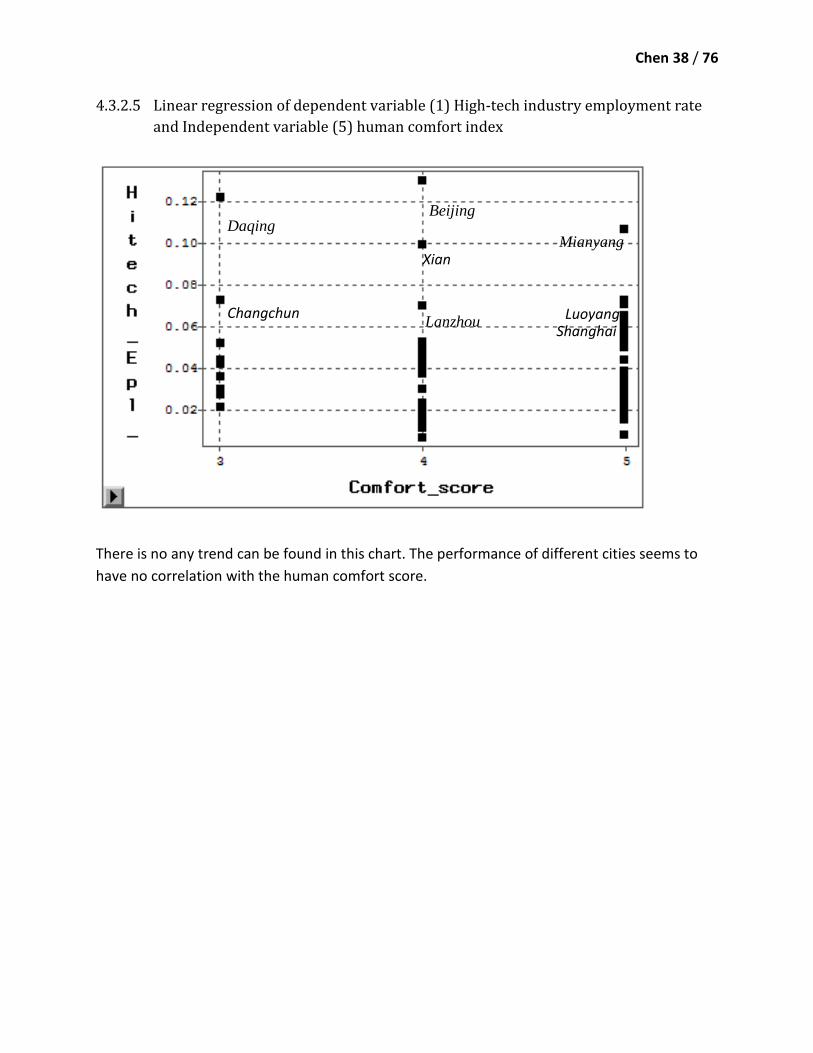
4.3.2.5 Linear regression of dependent variable (1) High-tech industry employment rate
and Independent variable (5) human comfort index
There is no any trend can be found in this chart. The performance of different cities seems to
have no correlation with the human comfort score.
Xian
Mianyang
Beijing
Daqing
Changchun Luoyang
Shanghai Lanzhou

Chen 39 / 76
4.3.2.6 Linear regression of dependent variable (1) High-tech industry employment rate
and Independent variable (6) total population
The chart can be divided in to two parts: those cities with population less than 5 million and
those cities with population more than 5 million (The unit of the population is 10,000 people).
However it only shows the percentage of cities with relative large population, but no trend
showed a clear relationship between population size and high-tech employment.
4.3.2.7 Multiple regression for dependent variable (1)
The first attampt of multiple regressions has the following result:
The REG Procedure Model: MODEL4
Dependent Variable: High-tech Industry Employment Rate Number of Observations Read 81 Number of Observations Used 80 Number of Observations with Missing Values 1
Analysis of Variance
Chongqing
Shanghai
Beijing
Guangzhou
Tianjin
Xian
Daqing
Mianyang

Chen 40 / 76
Sum of Mean Source DF Squares Square F Value Pr > F Model 6 0.02329 0.00388 11.91 <.0001 Error 73 0.02380 0.00032597 Corrected Total 79 0.04708 Root MSE 0.01805 R-Square 0.4946 Dependent Mean 0.04202 Adj R-Sq 0.4531 Coeff Var 42.96564
Parameter Estimates
Variable
DF
Parameter Estimate
Standard Error
t Value
Pr > |t|
Standardized Estimate
Intercept 1 0.02847 0.01900 1.50 0.1384 0
Total Academic institutions
1 0.00063471 0.00016766 3.79 0.0003 0.49526
High education rate 1 -0.09915 0.10151 -0.98 0.3320 -0.15031
Government Support 1 0.07071 0.01498 4.72 <.0001 0.41843
Money maneged by VC
1 4.161815E-9 2.04656E-9 2.03 0.0456 0.32655
Comfort Score 1 -0.0009263 0.00318 -0.29 0.7717 -0.02746
Total Population 1
-0.00001765 0.00001333 -1.32 0.1896 -0.18829
The R-square value of this model is 0.4946, which means that 49.46% of the dependent
variables can be explained by this model. Since this research has a strong sociology background,
this is also a relatively high R-square value.
Known from the t value and Pr > |t|, there were only 3 independent variables chosen as
significant in this model. They are as followed from higher significance to lower significance:
1) Number of local colleges and universities
2) Intensity of government support
3) Money managed by local venture capital
Chen 41 / 76
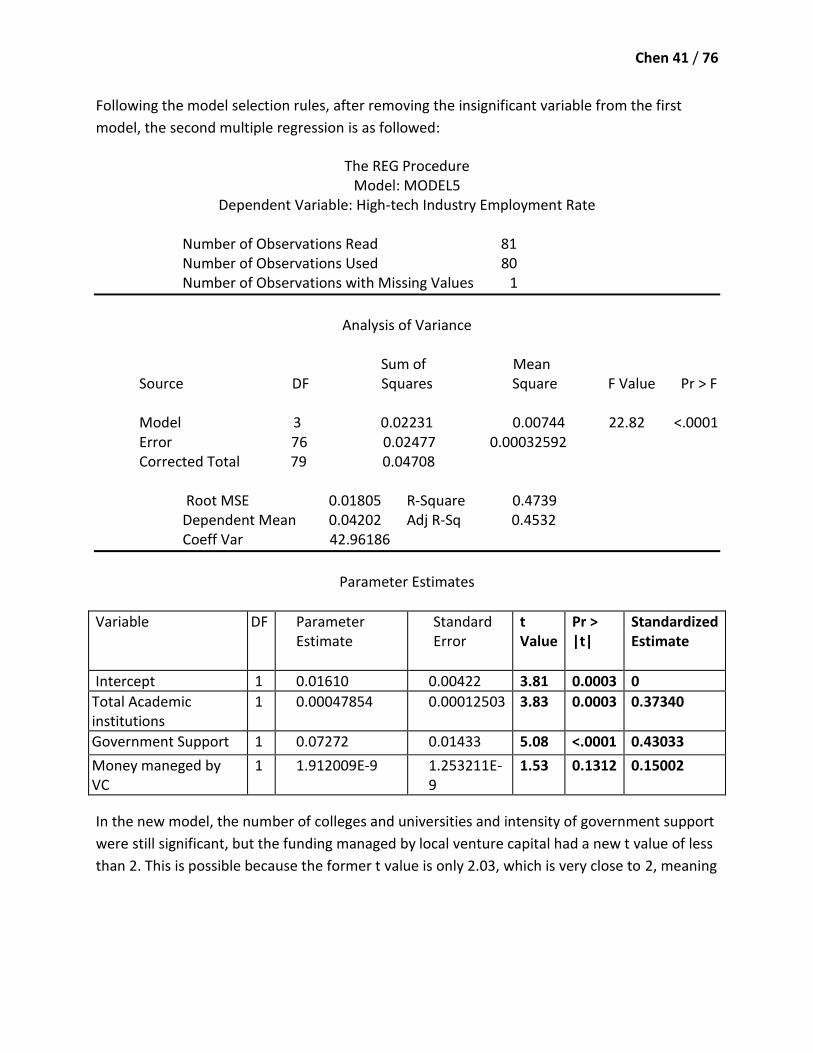
Following the model selection rules, after removing the insignificant variable from the first
model, the second multiple regression is as followed:
The REG Procedure Model: MODEL5
Dependent Variable: High-tech Industry Employment Rate Number of Observations Read 81 Number of Observations Used 80 Number of Observations with Missing Values 1
Analysis of Variance
Sum of Mean Source DF Squares Square F Value Pr > F Model 3 0.02231 0.00744 22.82 <.0001 Error 76 0.02477 0.00032592 Corrected Total 79 0.04708 Root MSE 0.01805 R-Square 0.4739 Dependent Mean 0.04202 Adj R-Sq 0.4532 Coeff Var 42.96186
Parameter Estimates
Variable
DF
Parameter Estimate
Standard Error
t Value
Pr > |t|
Standardized Estimate
Intercept 1 0.01610 0.00422 3.81 0.0003 0
Total Academic institutions
1 0.00047854 0.00012503 3.83 0.0003 0.37340
Government Support 1 0.07272 0.01433 5.08 <.0001 0.43033
Money maneged by VC
1 1.912009E-9 1.253211E-9
1.53 0.1312 0.15002
In the new model, the number of colleges and universities and intensity of government support
were still significant, but the funding managed by local venture capital had a new t value of less
than 2. This is possible because the former t value is only 2.03, which is very close to 2, meaning
Chen 42 / 76
the significant level of this variable has quite a low significance, and would be easily influenced
by any modification to the model.
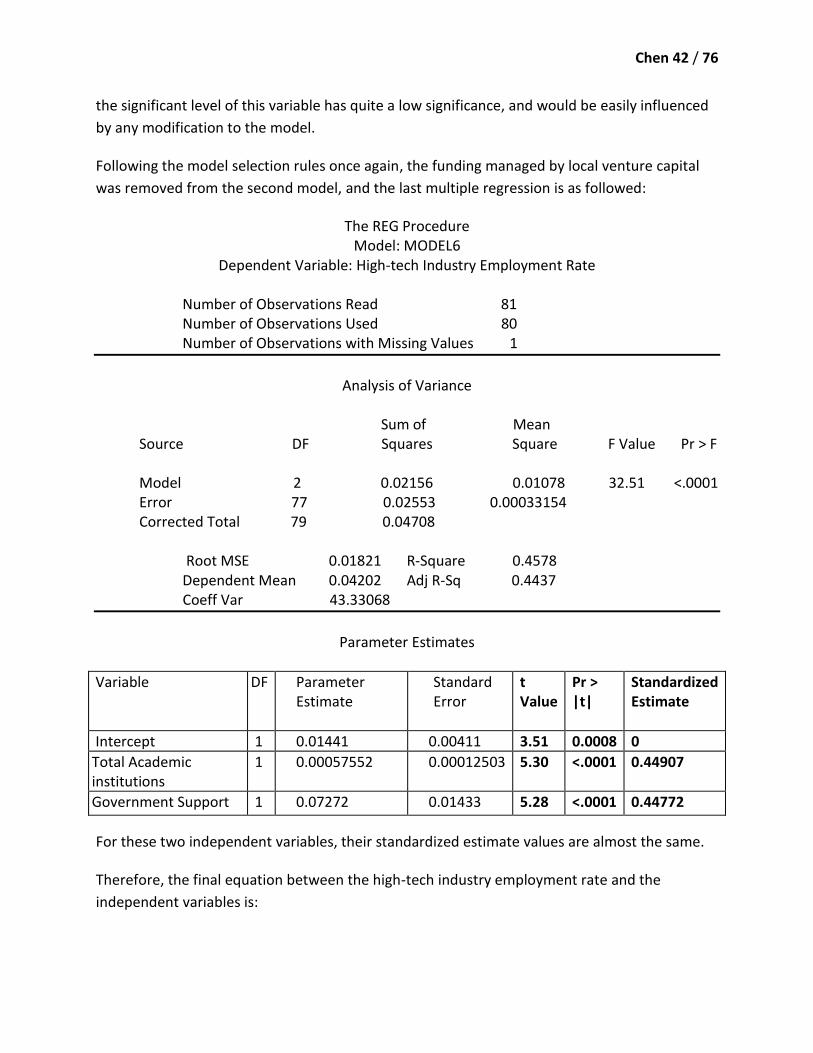
Following the model selection rules once again, the funding managed by local venture capital
was removed from the second model, and the last multiple regression is as followed:
The REG Procedure Model: MODEL6
Dependent Variable: High-tech Industry Employment Rate Number of Observations Read 81 Number of Observations Used 80 Number of Observations with Missing Values 1
Analysis of Variance
Sum of Mean Source DF Squares Square F Value Pr > F Model 2 0.02156 0.01078 32.51 <.0001 Error 77 0.02553 0.00033154 Corrected Total 79 0.04708 Root MSE 0.01821 R-Square 0.4578 Dependent Mean 0.04202 Adj R-Sq 0.4437 Coeff Var 43.33068
Parameter Estimates
Variable
DF
Parameter Estimate
Standard Error
t Value
Pr > |t|
Standardized Estimate
Intercept 1 0.01441 0.00411 3.51 0.0008 0
Total Academic institutions
1 0.00057552 0.00012503 5.30 <.0001 0.44907
Government Support 1 0.07272 0.01433 5.28 <.0001 0.44772
For these two independent variables, their standardized estimate values are almost the same.
Therefore, the final equation between the high-tech industry employment rate and the
independent variables is:

Chen 43 / 76
High-tech industry employment rate= 0.01441+0.00057552(number of local colleges and
universities) + 0.07272(government support rate)
4.3.2.8 Multiple regression for dependent variable (2)
The result of multiple regression of control group of traditional industry is as followed: The REG Procedure
Model: MODEL7 Dependent Variable: Trad_Epl_Rate
Number of Observations Read 81 Number of Observations Used 80 Number of Observations with Missing Values 1
Analysis of Variance
Sum of Mean Source DF Squares Square F Value Pr > F Model 6 0.11042 0.01840 2.65 0.0221 Error 73 0.50666 0.00694 Corrected Total 79 0.61709 Root MSE 0.08331 R-Square 0.1789 Dependent Mean 0.58867 Adj R-Sq 0.1115 Coeff Var 14.15222
Parameter Estimates
Variable
DF
Parameter Estimate
Standard Error
t Value
Pr > |t|
Standardized Estimate
Intercept 1 0.57605 0.08768 6.57 <.0001 0
Total Academic Institution
1 -0.00078420 0.00077363 -1.01 0.3141 -0.16903
High education rate
1 0.30049 0.46841 0.64 0.5232 0.12584
Government Support
1 -0.19349 0.06911 -2.80 0.0065 -0.31626
Venture Capital Money
1 -1.06476E-8 9.443453E-9 -1.13 0.2632 -0.23077

Chen 44 / 76
Comfort Score 1 0.01010 0.01467 0.69 0.4936 0.08268
Total Population 1 0.00003589 0.00006151 0.58 0.5614 0.1057
The multiple regression results show that intensity of government support was also a significant
factor of traditional industry in China. However it has a negative effect, but not a positive effect,
on traditional industry, and the level of significance of it is much lower when compared to the
high-tech industry sector. Other indicators were insignificant and this model can only explain
17.18% of traditional industry employment.
5 Conclusion
5.1 Comparison of the U.S. group and the China group
It is easy to tell from the result that there are many differences between the U.S. and China on
the high-tech clusters issue.
The first and most obvious difference is the different leading power in the two countries. In the
U.S., venture capital is prominent in while its corresponding part in China are the number of
academic institutions and government power.
The second point is the opposite situation for the factors we analyzed in the two groups. It is
noticeable the leading power in one country turned out to be insignificant in the other
countries. Some other things made the situation more interesting. The only two factors have a
positive significance on high-tech clusters in China were all not significant or had a negative
significance in the U.S group, and the same thing happened with the U.S. group.
These differences imply different development and management modes of high-tech clusters in
the two countries.
5.2 Explanation and discussion
5.2.1 For the U.S. group
First of all, the funding raised by venture capital is an important factor of the development of
high-tech clusters in the U.S. What is noticeable is the much higher significance of it when
compared to other significant factors. The standardized estimate values value of it was 0.63676
while that of the second factor is only 0.4544.
Chen 45 / 76
The total population factor, which generally can reflect the size and comprehensive economic
level of an area, was the second most significant factor in this research. The strong correlation
between this factor and the tech pole score showed the close relationship between high-tech
industry and those industries active in highly developed area, especially the financial industry.
The test on the human comfort score had a better result than expected. It turned out to have a
t value of 2.27, while the corresponding t value of the same variable is -4.82. It was expected
that the effects of the human comfort score should be close in both high-tech and traditional
sectors, since it is a basic natural condition of an area, and would be considered by most of the
industries The result showed a high human comfort score, which implies a more comfortable
climate, is especially important to high-tech industry when compared to others. This may be
because those high-tech industries always hire more intelligent labor force, who have higher
requirement of working environment.
The result of the high education rate corresponded to the hypothesis as expected, since labor
force with high intelligence is a basic factor of the high-tech industry. At the same time, strong
negative relationship with a standardized estimate value of -0.64444 between the high
education rate and traditional employment rate also corresponded to the facts that the
traditional industries are defined as labor-intensive and less need for high educated labor force.
The most unexpected result came from the high education institution part. From the
experience of Silicon Valley, the intellectual support from colleges and universities was the
most important original impetus of the high-tech clusters there. However, the factors related to
high education institution support turned out to have a negative relationship with the
development of high-tech clusters. The reason for this phenomenon may be explained from
two fields:
1) Many colleges and universities with more intellectual resources in the U.S. locate in rural areas rather than highly developed urban areas to have more space and a relatively quiet environment for scientific research and teaching activities. This makes the other support factors of high-tech clusters, such as capital resource and labor resource, hard to gather together near these famous colleges and universities. Since the generation of a high-tech cluster is a comprehensive process with many efforts from different fields, the low tech pole score of the area is understandable. For instance, schools such as Cornell University, the University of Illinois at Urbana-Champaign, and Purdue University, are all located in a rural place, and those MSAs all have a quite low tech pole score no more than 0.2.
Chen 46 / 76
2) The variable used in the regression is academic R&D expenditure of those schools. The initial objective of R&D expenditure is to benefit society as a whole through the new technologies and research, but not to only benefit the industry. Thus it is very possible that a large part of the R&D expenditure may had been used on research that not close to high-tech industry, or technologies cannot be applied to practice and generate industrial profit so far.
However, these two reasons may explain why academic R&D expenditure did not have a
positive relationship with the tech pole score. Nor does it explain why the relation between
them is negative with a relatively high standardized estimate value is open to question, and
requires further research on this topic.
There is another noticeable phenomenon found from the one-by-one linear regressions
research. Some of the top rated high-tech pole areas in the U.S. were exception points in the
chart and did not comply with the general trend. These top rated high-tech pole areas were all
build up in the early age of high-tech clusters development history, initially stimulated by high
intelligent factors of the area, and had developed their own characteristic in the long history.
Combined with the present important role of venture capital in the development of high-tech
clusters, we have reasons to believe that the leading factor of developing high-tech clusters
nowadays in U.S. has transferred from the intelligent factors to the capital factors.
5.2.2 For the China group
The most obvious character of the research of the China group is the close standardized
estimate values of the two significant factors. This result showed that the developments for
Chinese high-tech clusters are led by two strong powers.
The number of local colleges and universities was the factor with highest significance level
picked out from the research. It showed that the development of Chinese high-tech cluster
highly relied on the research abilities of academic institutes around high-tech clusters, and is
similar to those U.S. high-tech clusters such as Silicon Valley and Route 128 at their early stages.
This result implied that the developments of Chinese high-tech clusters are still in early stage.
The result may also be explained by the location of Chinese high education Institute. Different
from the U.S. universities, many of the Chinese universities locates near the center of economic
activities. This may be influenced by Chinese culture concept of Confucianism which advocating
and respecting education most. As a symbol of culture and education, the locations of the
universities are near developed areas. What’s more, a large part of Chinese universities
concentrated in several highly developed areas such as Beijing, Shanghai and Guangzhou,
where capital and labor force resources are also easily accessible.
Chen 47 / 76
The high significance of government support for high-tech clusters development was highly
expected before the research. China began to develop high –tech clusters in the mid-80s, much
later than Western countries. For historical reasons, China had just finished the implementation
of a planned economy at that time. Under the long-term planned economy the allocation of
resources for economic development relied mainly on the government. The power of
government can also be told from the research on traditional industry part. Even the traditional
industry is significantly influenced by the intensity of government support. The only difference
between the high-tech industry sector and traditional sector is that the significance are
different, with a higher standardized estimate value of 0.44907 in high-tech industry sector and
a value of 0.31226 in the traditional one. The initial development of high-tech clusters in China
was mainly guided by the government. The government had a decisive role in the construction
of the park. Although the business management model was also set up, there was still
involvement of government departments.
The influence of venture capital in the China group is at the edge of significance, mainly
because the high concentration level of venture capital in those developed area such as Beijing,
Shanghai and Shenzhen.
5.3 Planning implication
Since the inception of high-tech clusters in the 1950s, it has been an inevitable topic in urban
developing process. This is because high-tech clusters played an important role in the
transformation of scientific and technological achievements, and helped to promote high-tech
enterprises, and nurture new technological revolution and new industries. Therefore, the
analysis of the significance of influencing factors of high-tech clusters can be valuable to
planners in practical planning process. It is useful in launching new high-tech clusters plans, or
in redeveloping existing high-tech clusters.
5.3.1 Recommendations for the U.S. planners
The lack of government power in many of the U.S. high-tech clusters are considered as an
advantage of the U.S. high-tech clusters’ experience. However, we cannot deny that the
government can also be helpful in developing the high-tech clusters, especially on providing
good infrastructure for the high-tech clusters. Therefore, to better take advantage of this power
in the process of planning for the high-tech clusters, however not being controlled by it, is an
important lesson for the U.S. planners.
Chen 48 / 76
With capital’s power growing, planners should pay more attention during the building up and
development of high-tech clusters to attract venture capital to the potential high-tech
developing area. The development of venture capital power needs the support from the
environmental factors including the the macro economic development environment, legal
environment, policy environment, business environment, financial
environment and geographical environment. Among them, the environmental factor that
planners can more easily access is the policy environment. The policy environment which
attracts venture capital means to develop a special strategy to encourage and attract venture
capital. The methods include industrial policy, tax incentives, foreign exchange
management policy, and regional investment policy according to the local conditions.
The implementation of effective incentive policies which affect the fundamental economic
interests of the venture capitalists can directly lead to and increase the risk investors’ interest in
this area. In addition, through the implementation of special policies targeted at venture
capital industry can guide the direction of the venture capital power. These
implementations can further improve the investment structure of this area, and promote some
of the important industries or individual regional economic development objectives.
Besides, a special region in the U.S. requiring more attention on high-tech industry field is
noticed in the research analysis process—the New York-Northern New Jersey-Long Island, NY-
NJ-PA Metro Area. With the largest population, the best financial environment, and relatively
high performance on almost all the influencing factors, this area definitely has a potential to do
better on high-tech industry field, however this MSA were always one of the exception point in
the linear regression chart. The good news is that mayor Bloomberg fired a shot across the bow
of Silicon Valley last year, saying New York City’s efforts to attract a new science and
engineering campus will help the metropolis surpass the California region as the world capital
of technology startups. New York’s only shortage when compared to the top ranked tech pole
area is in venture capital. Thus the recommended policies of the above could be applied to New
York in the future.
5.3.2 Recommendations for the China planners
The result of the research clearly showed that, the leading characters in Chinese high-tech
clusters are the government and academic institutes. This is decided by Chinese socio-cultural
characteristics and economic system. Thus, from planners’ perspective, the task is to
strengthen and improve the influence from government and academic institutes.
On the one hand, as the resource of technologies and talents, the tasks of academic institutes
are to receive funding from the enterprise to reduce the government’s financial burden and

Chen 49 / 76
improve the conversion rate of scientific and technological achievements. Planners should
guarantee a good policy environment for the academic institute to work.
On the other hand, planners should promote to build government-led innovation platform in
the high-tech clusters, and bring the government’s functions into full play during the process.
Since the external environment for business innovation in China is not ideal, the government
occupies a dominant position in building innovative platform for high-tech clusters which
cannot be replaced by enterprises and academic institutes. The government should not
only finance public-benefit projects or basic research, but also play its functions of the
institutional innovation and policy arrangements in the region, in order to provide a good
system and policy environment for full and efficient interaction between the various actors in
high tech innovation.
6 Reference
1. Porter, M.E. The Competitive Advantage of Nations. The Free Press, New York, 1990
2. Castells, M. and Hall, P. Technopoles of the world: The Masking of 21st Century Industrial
complexes. Routledge, London, 1994.
3. Grabher, G. The Embedded Firm--On the Socioeconomics of Industrial Networks. London:
Routledge, London, 1993.
4. Saxenian, AnnaLee. Regional Advantages: Culture and Competition in Silicon Valley and
Route 128. Harvard University Press, Cambridge, MA, 1994.
5. Saxenian, AnnaLee. Silicon Valley’s New Immigrants Entrepreneurs. Public Policy Of
California, San Francisco, 1999.
6. Saxenian, AnnaLee. Regional Networks: Industrial Adaption in Silicon Valley and Route
l28.Harvard University Press, Cambridge, MA, 1993.
7. Saxenian, AnnaLee. The New Argonauts: Regional Advantage in a Global Economy.Harvard
University Press, Cambridge, MA, 2006.
8. Maillat, D. Innovative melieux and new generation of regional policies, Entrepreneurship
Regional Development, 1996(10):1-6.

Chen 50 / 76
9. GM.Peter Swann, Martha Prevezerand, David Stout: The Dynamics of industrial Clustering-
International Comparisons in Computing and Biotechnology, Oxford University Press, 1998.
10. Paul Westhead and Stephen Batstone, Independent Technology-based Firms: The
Perceived Benefits of a Science Park Location. Urban Studies, 1998(35): 2197-2219.
11. Saxenian. A. and Hsu. J. Y. The Silicon Valley - Hsinchu Connection: Technical Communities
and Industrial Upgrading, e-journal, 1999.
http://people.ischool.berkeley.edu/~anno/Papers/SV-Hsinchu-ICC-1.pdf
12. Mccormick D. African enterprise clusters and industrialization: theory and reality, Word
Development, 1999, 27(9):1531-1551.
13. Samuel Kortum, Josh Lemer. Assessing the contribution of venture capital to
innovation.Rand Journal of Economics, 2000(31):674-692.
14. Edited by Yingyi Qian, Meng Xiao. The errors: economist’s discourse of Silicon Valley model.
China Economy Publishing House, 2000.
15. Edited by Chong-Moon Lee, William F. Miller, Marguerite Gong Hancock, and Henry S.
Rowen. The Silicon Valley Edge: A Habitat for Innovation and Entrepreneurship. Stanford
University Press, 2000.
16. Athreye S. Agglomeration and growth: a study of the Cambridge high-tech clusters.
Building High-tech clusters Silicon Valley and Beyond. Cambridge University Press,
Cambridge, 2004.
17. Xinzhen Wei and Jici Wang, New Industrial Space. Peking University Press, Beijing, 1993.
18. Kai Yao. Locational factors of High-tech industry. Industrial Economics Research, 1996(1):
23-26.
19. Wen Liang. Analysis of locational factors of High-tech enterprises. Enterprise Management,
2003(1):103-109.
20. Yulin Zhao. Economics of High-tech Industry. China Economic Publishing House, Beijing,
2004.
Chen 51 / 76
21. Zheng Wang, Kejin Mao, Xiao Liu. Analysis of locational factors of High-tech clusters. Acta
Geographica Sinic, 2005,60(7):567-568.
22. Runbang Xie and Meilin Hu. Analysis of clustering of venture capital and its effect to the
development of high-tech industry cluster. Hunan University Journal social science version,
2006, 20(2):70-73.
23. U.S. Census Bureau. Metropolitan Statistical Area.
http://quickfacts.census.gov/qfd/meta/long_metro.htm
24. Milken Institute. North America’s High-Tech Economy: The Geography of Knowledge-Based
Industries. http://www.milkeninstitute.org/pdf/NAHTweb.pdf
25. Toros H, Deniz A, Saylan L,et al. Spatial variability of chilling temperature in Turkey and its
effect on human comfort. Meteorology and Atmospheric Physics, 2005, 88 (1-2): 107-108
26. Vanos J K, Warland J S, Gillespie T J, et al. Review of the physiology of human thermal
comfort while exercising in urban landscapes and implications for bioclimatic design.
International Journal of Biometeorology, 2010, 54(4): 319-334
27. Dui Wu. A discussion of several forecast human comfort index formula. Meteorological
Science and Technology, 2003, 31(6): 370-372
28. Yi Hu, Ping Li, Jiangong Yang et al. Applied Meteorology. China Meteorological Press,
Beijing, 2007.
7 Appendix
7.1 SAS scripts for each models
7.1.1 Model 1:
proc reg data=us;
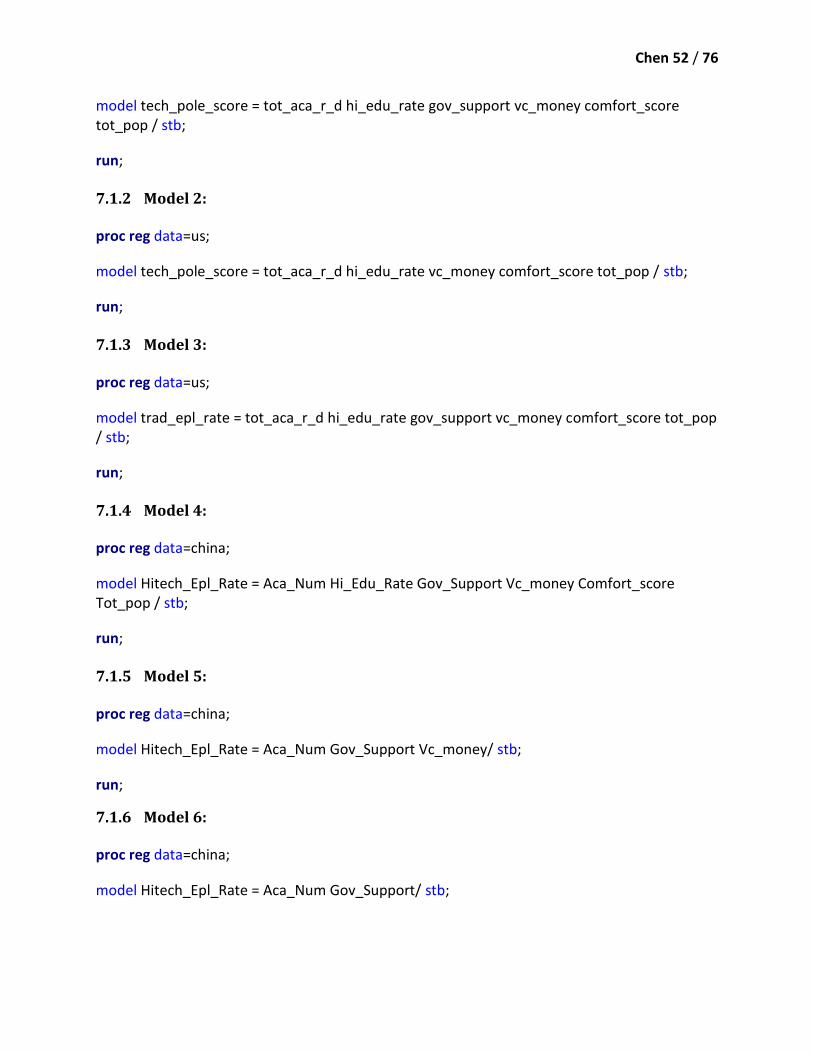
Chen 52 / 76
model tech_pole_score = tot_aca_r_d hi_edu_rate gov_support vc_money comfort_score tot_pop / stb;
run;
7.1.2 Model 2:
proc reg data=us;
model tech_pole_score = tot_aca_r_d hi_edu_rate vc_money comfort_score tot_pop / stb;
run;
7.1.3 Model 3:
proc reg data=us;
model trad_epl_rate = tot_aca_r_d hi_edu_rate gov_support vc_money comfort_score tot_pop / stb;
run;
7.1.4 Model 4:
proc reg data=china;
model Hitech_Epl_Rate = Aca_Num Hi_Edu_Rate Gov_Support Vc_money Comfort_score Tot_pop / stb;
run;
7.1.5 Model 5:
proc reg data=china;
model Hitech_Epl_Rate = Aca_Num Gov_Support Vc_money/ stb;
run;
7.1.6 Model 6:
proc reg data=china;
model Hitech_Epl_Rate = Aca_Num Gov_Support/ stb;

Chen 53 / 76
run;
7.1.7 Model 7:
proc reg data=china;
model Trad_Epl_Rate = Aca_Num Hi_Edu_Rate Gov_Support Vc_money Comfort_score Tot_pop / stb;
run;
7.2 Data tables
7.2.1 Data for the U.S. Group

Chen 54 / 76
CBSA MSA
Tech Pole Score
Traditional Industry Employment Rate
Total Academic R&D Expenditure
High Education Rate of Labor
Intensity of Government Support
Money raised by VC
Comfort Score
Total Population
10180 Abilene, TX Metro Area 0.1 32.29% 386 25.09% 79.79% 0 5 164,941
10420 Akron, OH Metro Area 0.5 40.21% 70840 33.85% 50.42% 0 3 702,951
10500 Albany, GA Metro Area 0.1 38.91% 1206 20.49% 87.56% 0 5 162,659
10580 Albany-Schenectady-Troy, NY Metro Area
2.1 30.09% 443078 38.29% 57.38% 23.26 3 870,832
10740 Albuquerque, NM Metro Area
5.2 32.65% 201769 32.99% 68.58% 9.31 4 892,014
10780 Alexandria, LA Metro Area 0 35.81% 0 21.47% 0.00% 0 5 154,120
10900 Allentown-Bethlehem-Easton, PA-NJ Metro Area
0.7 40.63% 33719 32.42% 79.59% 64.57 4 822,141
11020 Altoona, PA Metro Area 0.1 47.69% 0 21.74% 0.00% 0 4 127,031
11100 Amarillo, TX Metro Area 0.1 42.72% 5366 27.72% 74.51% 0 4 251,915
11180 Ames, IA Metro Area 0.1 31.90% 224311 52.23% 63.98% 0 3 89,575
11260 Anchorage, AK Metro Area 0.7 34.40% 7638 34.78% 87.81% 0 3 382,964
11300 Anderson, IN Metro Area 0.1 39.34% 0 20.91% 0.00% 0 4 131,642
11340 Anderson, SC Metro Area 0 49.80% 0 20.82% 0.00% 0 5 187,269
11460 Ann Arbor, MI Metro Area 1.5 26.37% 1012955 55.77% 63.62% 7.2 3 345,290
11500 Anniston-Oxford, AL Metro Area
0.2 41.29% 224 18.26% 55.80% 0 5 118,510
11540 Appleton, WI Metro Area 0.2 50.14% 458 30.29% 88.86% 0 3 225,952
11700 Asheville, NC Metro Area 0.2 35.53% 2933 32.46% 88.34% 52 4 422,752
12020 Athens-Clarke County, GA Metro Area
0.1 34.85% 349730 42.38% 44.85% 0 5 192,738
12060 Atlanta-Sandy Springs- 14 37.87% 1119890 38.28% 63.33% 246.13 5 5,288,302
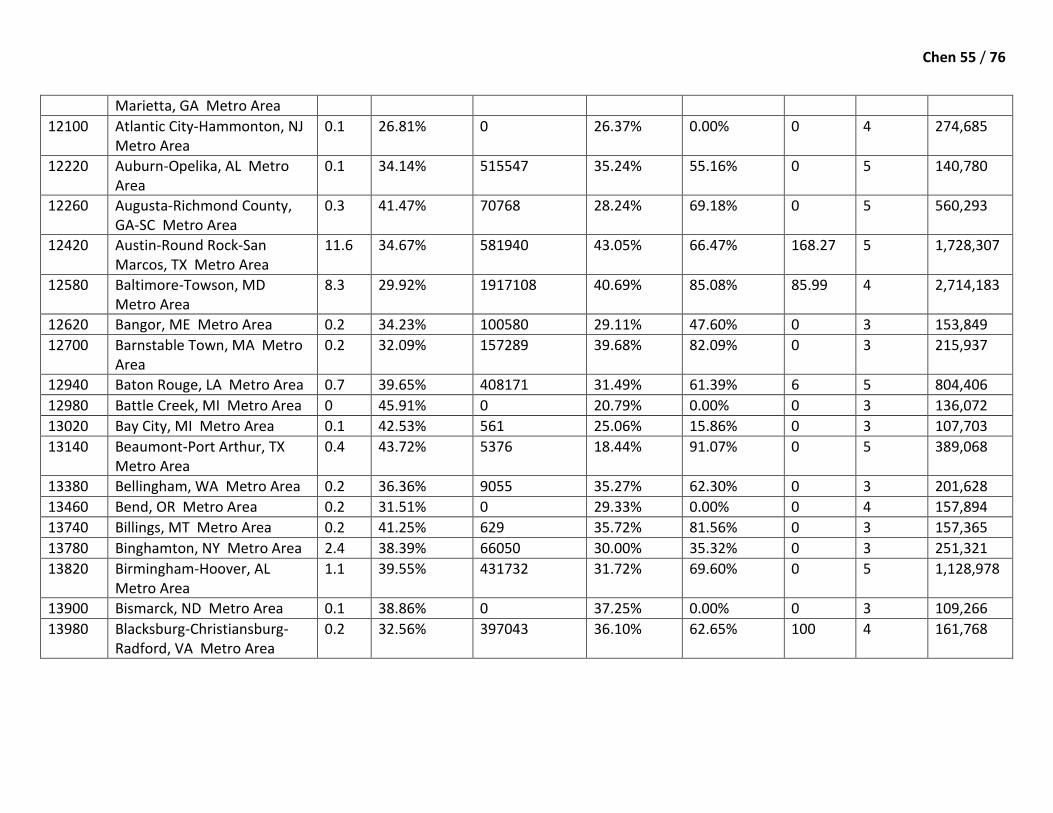
Chen 55 / 76
Marietta, GA Metro Area
12100 Atlantic City-Hammonton, NJ Metro Area
0.1 26.81% 0 26.37% 0.00% 0 4 274,685
12220 Auburn-Opelika, AL Metro Area
0.1 34.14% 515547 35.24% 55.16% 0 5 140,780
12260 Augusta-Richmond County, GA-SC Metro Area
0.3 41.47% 70768 28.24% 69.18% 0 5 560,293
12420 Austin-Round Rock-San Marcos, TX Metro Area
11.6 34.67% 581940 43.05% 66.47% 168.27 5 1,728,307
12580 Baltimore-Towson, MD Metro Area
8.3 29.92% 1917108 40.69% 85.08% 85.99 4 2,714,183
12620 Bangor, ME Metro Area 0.2 34.23% 100580 29.11% 47.60% 0 3 153,849
12700 Barnstable Town, MA Metro Area
0.2 32.09% 157289 39.68% 82.09% 0 3 215,937
12940 Baton Rouge, LA Metro Area 0.7 39.65% 408171 31.49% 61.39% 6 5 804,406
12980 Battle Creek, MI Metro Area 0 45.91% 0 20.79% 0.00% 0 3 136,072
13020 Bay City, MI Metro Area 0.1 42.53% 561 25.06% 15.86% 0 3 107,703
13140 Beaumont-Port Arthur, TX Metro Area
0.4 43.72% 5376 18.44% 91.07% 0 5 389,068
13380 Bellingham, WA Metro Area 0.2 36.36% 9055 35.27% 62.30% 0 3 201,628
13460 Bend, OR Metro Area 0.2 31.51% 0 29.33% 0.00% 0 4 157,894
13740 Billings, MT Metro Area 0.2 41.25% 629 35.72% 81.56% 0 3 157,365
13780 Binghamton, NY Metro Area 2.4 38.39% 66050 30.00% 35.32% 0 3 251,321
13820 Birmingham-Hoover, AL Metro Area
1.1 39.55% 431732 31.72% 69.60% 0 5 1,128,978
13900 Bismarck, ND Metro Area 0.1 38.86% 0 37.25% 0.00% 0 3 109,266
13980 Blacksburg-Christiansburg-Radford, VA Metro Area
0.2 32.56% 397043 36.10% 62.65% 100 4 161,768

Chen 56 / 76
14020 Bloomington, IN Metro Area 0.6 32.98% 440815 37.95% 46.19% 0 4 192,696
14060 Bloomington-Normal, IL Metro Area
0.3 28.05% 5888 45.82% 72.93% 0 4 169,832
14260 Boise City-Nampa, ID Metro Area
2.5 39.41% 11955 32.03% 83.49% 0 4 619,694
14460 Boston-Cambridge-Quincy, MA-NH Metro Area
45.2 30.64% 1888500 49.38% 75.48% 1931.99 4 4,560,689
14500 Boulder, CO Metro Area 9.3 31.38% 648417 60.13% 81.40% 102.66 3 295,166
14540 Bowling Green, KY Metro Area
0 42.32% 8516 32.99% 82.14% 0 4 127,280
14740 Bremerton-Silverdale, WA Metro Area
0.2 35.62% 0 30.51% 0.00% 10 3 251,809
14860 Bridgeport-Stamford-Norwalk, CT Metro Area
4.3 31.63% 2577 47.47% 21.15% 16.74 4 918,714
15180 Brownsville-Harlingen, TX Metro Area
0 33.75% 0 18.21% 0.00% 0 4 408,054
15260 Brunswick, GA Metro Area 0 33.95% 0 23.01% 0.00% 0 5 107,890
15380 Buffalo-Niagara Falls, NY Metro Area
1.5 35.80% 341261 34.82% 51.06% 17.29 3 1,135,198
15500 Burlington, NC Metro Area 0.2 41.19% 0 22.40% 0.00% 0 5 151,528
15540 Burlington-South Burlington, VT Metro Area
1.3 35.42% 123171 44.70% 75.68% 0 3 211,035
15940 Canton-Massillon, OH Metro Area
0.1 42.01% 0 23.76% 0.00% 0 4 403,238
15980 Cape Coral-Fort Myers, FL Metro Area
0.2 35.52% 3915 23.10% 88.74% 0 4 620,151
16180 Carson City, NV Metro Area 0 #VALUE! 0 24.44% 0.00% 0 4 55,226
16220 Casper, WY Metro Area 0 45.66% 0 18.69% 0.00% 0 3 75,507

Chen 57 / 76
16300 Cedar Rapids, IA Metro Area 1.2 45.58% 286 32.47% 52.10% 0 3 258,223
16580 Champaign-Urbana, IL Metro Area
0.2 28.63% 563710 41.63% 57.44% 1.2 4 234,445
16620 Charleston, WV Metro Area 0.2 37.20% 4017 27.86% 93.03% 0 4 304,571
16700 Charleston-North Charleston-Summerville, SC Metro Area
0.8 36.60% 221719 36.29% 53.38% 7.2 5 667,741
16740 Charlotte-Gastonia-Rock Hill, NC-SC Metro Area
2.4 39.20% 26687 36.82% 62.87% 0 3 1,764,313
16820 Charlottesville, VA Metro Area
0.4 26.95% 261604 48.45% 83.85% 7.5 4 199,776
16860 Chattanooga, TN-GA Metro Area
0.3 41.70% 0 27.76% 0.00% 0 4 530,205
16940 Cheyenne, WY Metro Area 0.1 32.51% 0 27.29% 0.00% 0 3 92,127
16980 Chicago-Joliet-Naperville, IL-IN-WI Metro Area
13.3 37.65% 1440464 39.34% 65.79% 296.04 3 9,474,211
17020 Chico, CA Metro Area 0.1 35.05% 1889 24.77% 73.21% 0 5 220,072
17140 Cincinnati-Middletown, OH-KY-IN Metro Area
2.9 40.01% 388329 34.49% 69.55% 25.5 4 2,133,203
17300 Clarksville, TN-KY Metro Area 0.1 41.18% 0 22.58% 0.00% 0 4 274,695
17420 Cleveland, TN Metro Area 0.1 46.16% 0 20.90% 0.00% 0 4 115,716
17460 Cleveland-Elyria-Mentor, OH Metro Area
2.3 37.53% 430183 32.66% 78.87% 33.17 3 2,075,758
17660 Coeur d'Alene, ID Metro Area 0.1 39.30% 0 25.04% 0.00% 0 4 138,901
17780 College Station-Bryan, TX Metro Area
0.2 31.30% 714286 38.22% 59.74% 0 5 230,141
17820 Colorado Springs, CO Metro Area
4 31.80% 49117 36.03% 79.66% 0 3 648,943
17860 Columbia, MO Metro Area 0.1 28.35% 245058 54.23% 57.11% 1.5 4 172,319

Chen 58 / 76
17900 Columbia, SC Metro Area 0.5 35.48% 188275 35.05% 58.90% 0 5 770,410
17980 Columbus, GA-AL Metro Area 0.9 33.40% 0 25.30% 0.00% 0 5 292,141
18020 Columbus, IN Metro Area 0.1 #VALUE! 0 30.96% 0.00% 0 4 76,855
18140 Columbus, OH Metro Area 4.4 35.37% 717189 38.18% 64.12% 0.68 4 1,840,631
18580 Corpus Christi, TX Metro Area
0.2 37.75% 27909 22.94% 60.07% 0 5 428,217
18700 Corvallis, OR Metro Area 0.6 31.62% 209345 53.17% 76.94% 0 4 85,575
19060 Cumberland, MD-WV Metro Area
0 40.15% 0 21.14% 0.00% 0 4 103,239
19100 Dallas-Fort Worth-Arlington, TX Metro Area
21.8 39.34% 587027 34.49% 63.00% 98.78 5 6,402,922
19140 Dalton, GA Metro Area 0.4 60.54% 0 13.71% 0.00% 0 5 142,493
19180 Danville, IL Metro Area 0 47.90% 0 17.33% 0.00% 0 4 81,551
19260 Danville, VA Metro Area 0.1 49.30% 0 17.82% 0.00% 0 4 106,416
19340 Davenport-Moline-Rock Island, IA-IL Metro Area
0.2 43.88% 3620 29.73% 40.19% 0 3 382,382
19380 Dayton, OH Metro Area 2 37.56% 172254 28.81% 74.54% 0 4 841,310
19460 Decatur, AL Metro Area 0.1 51.25% 0 17.75% 0.00% 0 5 153,968
19500 Decatur, IL Metro Area 0 45.00% 0 25.80% 0.00% 0 4 110,715
19660 Deltona-Daytona Beach-Ormond Beach, FL Metro Area
0.3 38.35% 10899 22.51% 81.68% 0 5 494,527
19740 Denver-Aurora-Broomfield, CO Metro Area
11.9 35.11% 52677 42.32% 69.34% 170.19 4 2,560,529
19780 Des Moines-West Des Moines, IA Metro Area
0.7 33.99% 1567 36.89% 26.80% 0 4 570,358
19820 Detroit-Warren-Livonia, MI Metro Area
2.7 39.74% 265565 33.16% 50.18% 40.54 4 4,291,843
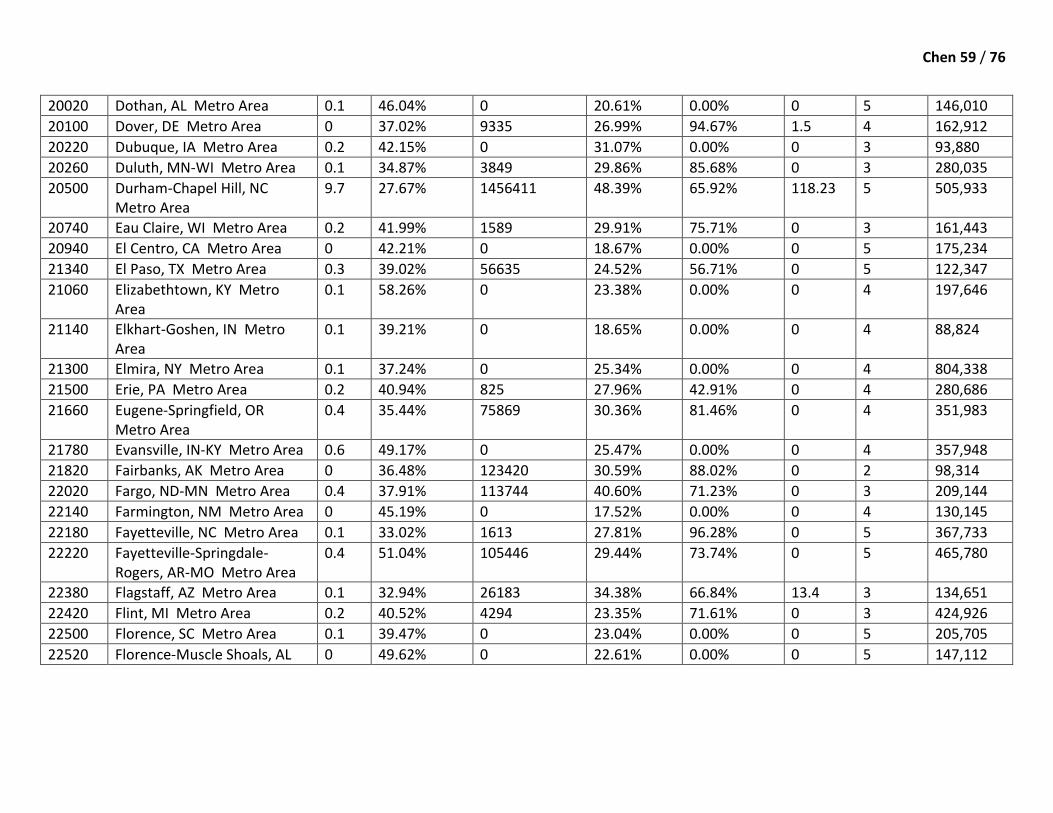
Chen 59 / 76
20020 Dothan, AL Metro Area 0.1 46.04% 0 20.61% 0.00% 0 5 146,010
20100 Dover, DE Metro Area 0 37.02% 9335 26.99% 94.67% 1.5 4 162,912
20220 Dubuque, IA Metro Area 0.2 42.15% 0 31.07% 0.00% 0 3 93,880
20260 Duluth, MN-WI Metro Area 0.1 34.87% 3849 29.86% 85.68% 0 3 280,035
20500 Durham-Chapel Hill, NC Metro Area
9.7 27.67% 1456411 48.39% 65.92% 118.23 5 505,933
20740 Eau Claire, WI Metro Area 0.2 41.99% 1589 29.91% 75.71% 0 3 161,443
20940 El Centro, CA Metro Area 0 42.21% 0 18.67% 0.00% 0 5 175,234
21340 El Paso, TX Metro Area 0.3 39.02% 56635 24.52% 56.71% 0 5 122,347
21060 Elizabethtown, KY Metro Area
0.1 58.26% 0 23.38% 0.00% 0 4 197,646
21140 Elkhart-Goshen, IN Metro Area
0.1 39.21% 0 18.65% 0.00% 0 4 88,824
21300 Elmira, NY Metro Area 0.1 37.24% 0 25.34% 0.00% 0 4 804,338
21500 Erie, PA Metro Area 0.2 40.94% 825 27.96% 42.91% 0 4 280,686
21660 Eugene-Springfield, OR Metro Area
0.4 35.44% 75869 30.36% 81.46% 0 4 351,983
21780 Evansville, IN-KY Metro Area 0.6 49.17% 0 25.47% 0.00% 0 4 357,948
21820 Fairbanks, AK Metro Area 0 36.48% 123420 30.59% 88.02% 0 2 98,314
22020 Fargo, ND-MN Metro Area 0.4 37.91% 113744 40.60% 71.23% 0 3 209,144
22140 Farmington, NM Metro Area 0 45.19% 0 17.52% 0.00% 0 4 130,145
22180 Fayetteville, NC Metro Area 0.1 33.02% 1613 27.81% 96.28% 0 5 367,733
22220 Fayetteville-Springdale-Rogers, AR-MO Metro Area
0.4 51.04% 105446 29.44% 73.74% 0 5 465,780
22380 Flagstaff, AZ Metro Area 0.1 32.94% 26183 34.38% 66.84% 13.4 3 134,651
22420 Flint, MI Metro Area 0.2 40.52% 4294 23.35% 71.61% 0 3 424,926
22500 Florence, SC Metro Area 0.1 39.47% 0 23.04% 0.00% 0 5 205,705
22520 Florence-Muscle Shoals, AL 0 49.62% 0 22.61% 0.00% 0 5 147,112

Chen 60 / 76
Metro Area
22540 Fond du Lac, WI Metro Area 0.1 50.14% 0 18.96% 0.00% 0 3 101,665
22660 Fort Collins-Loveland, CO Metro Area
1.5 35.20% 304397 49.89% 75.74% 16 3 300,637
22900 Fort Smith, AR-OK Metro Area
0.1 47.64% 0 19.63% 0.00% 0 5 299,749
23060 Fort Wayne, IN Metro Area 0.7 46.27% 0 28.57% 0.00% 0 4 415,013
23420 Fresno, CA Metro Area 0.3 42.13% 9837 23.88% 70.09% 0 5 933,248
23460 Gadsden, AL Metro Area 0 #VALUE! 0 16.90% 0.00% 0 5 104,462
23540 Gainesville, FL Metro Area 0.2 24.08% 592082 41.99% 55.87% 0 5 266,321
23580 Gainesville, GA Metro Area 0.1 47.56% 0 25.52% 0.00% 0 5 180,253
24020 Glens Falls, NY Metro Area 0.3 40.52% 0 27.49% 0.00% 0 4 128,985
24140 Goldsboro, NC Metro Area 0 46.74% 0 17.02% 0.00% 0 3 122,907
24220 Grand Forks, ND-MN Metro Area
0 38.62% 71656 32.21% 76.49% 0 3 99,586
24300 Grand Junction, CO Metro Area
0 38.06% 687 28.39% 72.63% 0 4 146,313
24340 Grand Rapids-Wyoming, MI Metro Area
0.6 44.00% 3061 31.23% 48.91% 7.96 3 774,540
24500 Great Falls, MT Metro Area 0 36.08% 0 29.95% 0.00% 0 3 81,519
24540 Greeley, CO Metro Area 0.1 45.69% 2387 28.93% 79.89% 0 3 254,270
24580 Green Bay, WI Metro Area 0.1 47.19% 979 26.74% 67.62% 0 3 306,730
24660 Greensboro-High Point, NC Metro Area
0.7 43.85% 38934 30.78% 71.29% 0 4 725,282
24780 Greenville, NC Metro Area 0.1 36.42% 24177 31.01% 80.36% 0 5 190,201
24860 Greenville-Mauldin-Easley, SC Metro Area
1 42.71% 188238 31.91% 40.27% 0 5 638,576
25060 Gulfport-Biloxi, MS Metro 0.1 34.33% 0 24.00% 0.00% 0 5 250,196
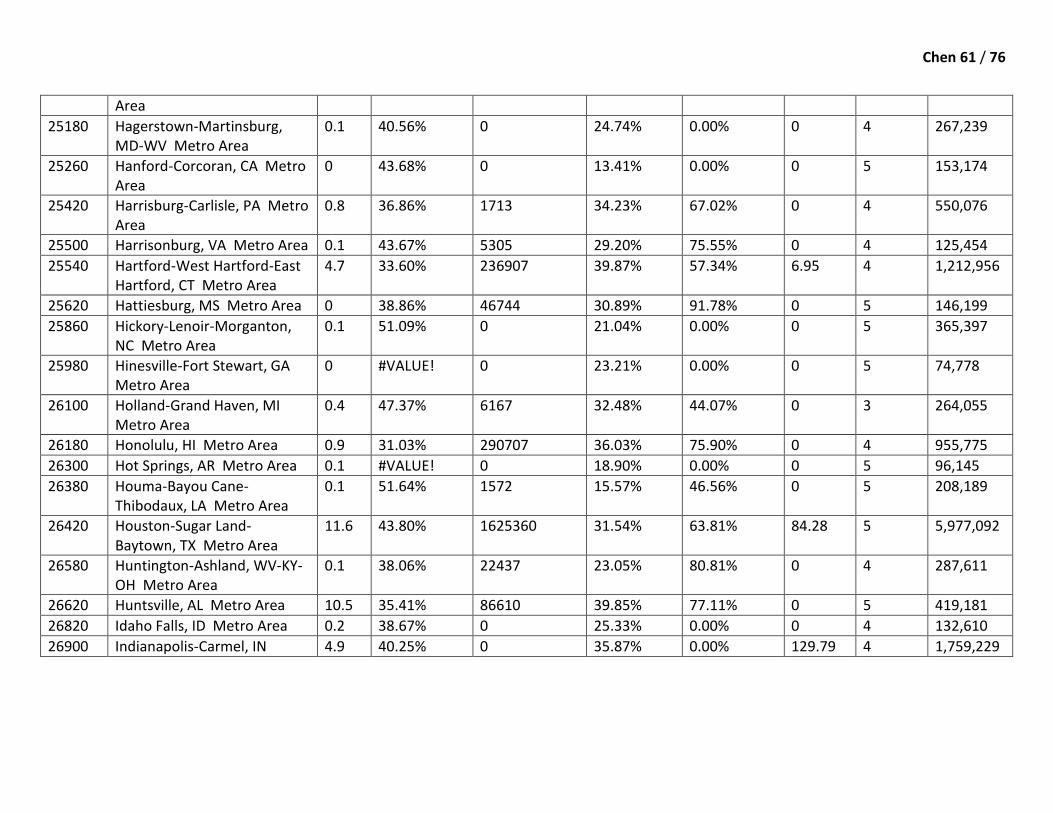
Chen 61 / 76
Area
25180 Hagerstown-Martinsburg, MD-WV Metro Area
0.1 40.56% 0 24.74% 0.00% 0 4 267,239
25260 Hanford-Corcoran, CA Metro Area
0 43.68% 0 13.41% 0.00% 0 5 153,174
25420 Harrisburg-Carlisle, PA Metro Area
0.8 36.86% 1713 34.23% 67.02% 0 4 550,076
25500 Harrisonburg, VA Metro Area 0.1 43.67% 5305 29.20% 75.55% 0 4 125,454
25540 Hartford-West Hartford-East Hartford, CT Metro Area
4.7 33.60% 236907 39.87% 57.34% 6.95 4 1,212,956
25620 Hattiesburg, MS Metro Area 0 38.86% 46744 30.89% 91.78% 0 5 146,199
25860 Hickory-Lenoir-Morganton, NC Metro Area
0.1 51.09% 0 21.04% 0.00% 0 5 365,397
25980 Hinesville-Fort Stewart, GA Metro Area
0 #VALUE! 0 23.21% 0.00% 0 5 74,778
26100 Holland-Grand Haven, MI Metro Area
0.4 47.37% 6167 32.48% 44.07% 0 3 264,055
26180 Honolulu, HI Metro Area 0.9 31.03% 290707 36.03% 75.90% 0 4 955,775
26300 Hot Springs, AR Metro Area 0.1 #VALUE! 0 18.90% 0.00% 0 5 96,145
26380 Houma-Bayou Cane-Thibodaux, LA Metro Area
0.1 51.64% 1572 15.57% 46.56% 0 5 208,189
26420 Houston-Sugar Land-Baytown, TX Metro Area
11.6 43.80% 1625360 31.54% 63.81% 84.28 5 5,977,092
26580 Huntington-Ashland, WV-KY-OH Metro Area
0.1 38.06% 22437 23.05% 80.81% 0 4 287,611
26620 Huntsville, AL Metro Area 10.5 35.41% 86610 39.85% 77.11% 0 5 419,181
26820 Idaho Falls, ID Metro Area 0.2 38.67% 0 25.33% 0.00% 0 4 132,610
26900 Indianapolis-Carmel, IN 4.9 40.25% 0 35.87% 0.00% 129.79 4 1,759,229
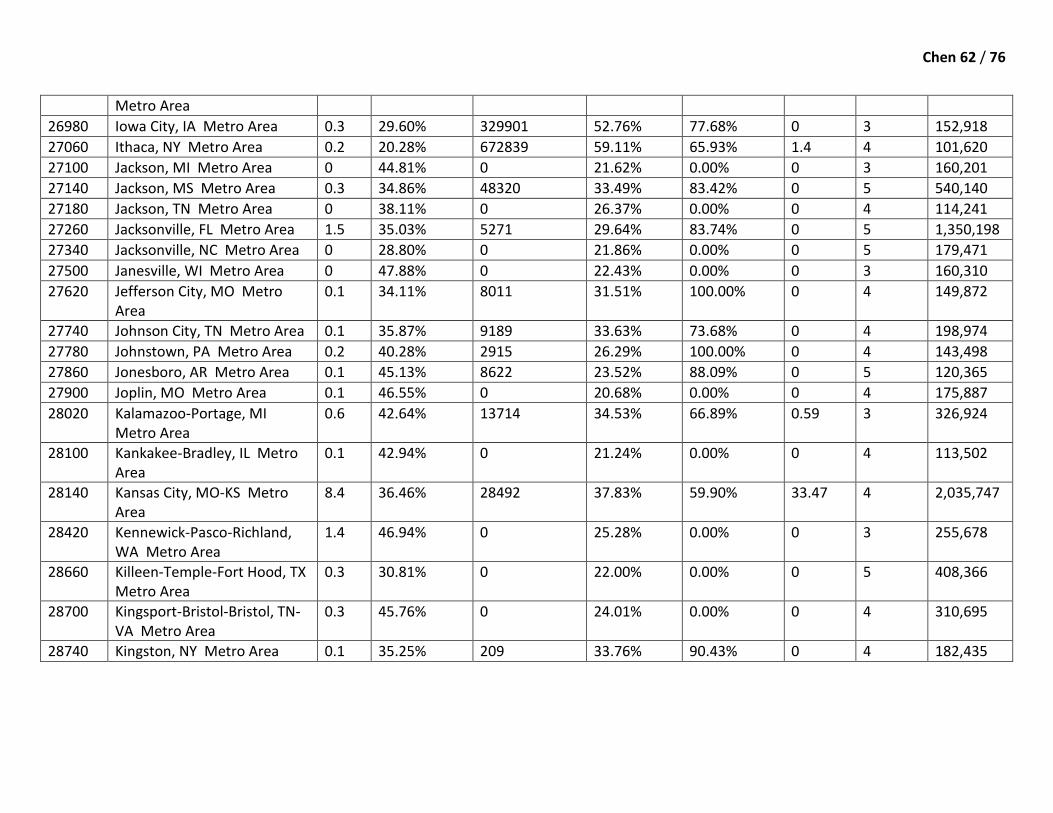
Chen 62 / 76
Metro Area
26980 Iowa City, IA Metro Area 0.3 29.60% 329901 52.76% 77.68% 0 3 152,918
27060 Ithaca, NY Metro Area 0.2 20.28% 672839 59.11% 65.93% 1.4 4 101,620
27100 Jackson, MI Metro Area 0 44.81% 0 21.62% 0.00% 0 3 160,201
27140 Jackson, MS Metro Area 0.3 34.86% 48320 33.49% 83.42% 0 5 540,140
27180 Jackson, TN Metro Area 0 38.11% 0 26.37% 0.00% 0 4 114,241
27260 Jacksonville, FL Metro Area 1.5 35.03% 5271 29.64% 83.74% 0 5 1,350,198
27340 Jacksonville, NC Metro Area 0 28.80% 0 21.86% 0.00% 0 5 179,471
27500 Janesville, WI Metro Area 0 47.88% 0 22.43% 0.00% 0 3 160,310
27620 Jefferson City, MO Metro Area
0.1 34.11% 8011 31.51% 100.00% 0 4 149,872
27740 Johnson City, TN Metro Area 0.1 35.87% 9189 33.63% 73.68% 0 4 198,974
27780 Johnstown, PA Metro Area 0.2 40.28% 2915 26.29% 100.00% 0 4 143,498
27860 Jonesboro, AR Metro Area 0.1 45.13% 8622 23.52% 88.09% 0 5 120,365
27900 Joplin, MO Metro Area 0.1 46.55% 0 20.68% 0.00% 0 4 175,887
28020 Kalamazoo-Portage, MI Metro Area
0.6 42.64% 13714 34.53% 66.89% 0.59 3 326,924
28100 Kankakee-Bradley, IL Metro Area
0.1 42.94% 0 21.24% 0.00% 0 4 113,502
28140 Kansas City, MO-KS Metro Area
8.4 36.46% 28492 37.83% 59.90% 33.47 4 2,035,747
28420 Kennewick-Pasco-Richland, WA Metro Area
1.4 46.94% 0 25.28% 0.00% 0 3 255,678
28660 Killeen-Temple-Fort Hood, TX Metro Area
0.3 30.81% 0 22.00% 0.00% 0 5 408,366
28700 Kingsport-Bristol-Bristol, TN-VA Metro Area
0.3 45.76% 0 24.01% 0.00% 0 4 310,695
28740 Kingston, NY Metro Area 0.1 35.25% 209 33.76% 90.43% 0 4 182,435

Chen 63 / 76
28940 Knoxville, TN Metro Area 0.8 39.87% 284896 34.30% 70.45% 0 4 699,180
29020 Kokomo, IN Metro Area 0.1 49.69% 0 23.08% 0.00% 0 4 100,485
29100 La Crosse, WI-MN Metro Area
0.1 42.44% 3010 34.07% 58.31% 0 3 133,896
29140 Lafayette, IN Metro Area 0.1 36.94% 453799 36.53% 49.62% 0 4 202,782
29180 Lafayette, LA Metro Area 0.4 41.24% 68018 30.38% 39.77% 0 5 274,265
29340 Lake Charles, LA Metro Area 0.1 40.69% 807 25.72% 67.41% 0 5 198,628
29460 Lakeland-Winter Haven, FL Metro Area
0.1 40.24% 0 21.41% 0.00% 9.02 4 602,788
29540 Lancaster, PA Metro Area 0.2 48.95% 6058 27.71% 58.65% 0 4 520,156
29620 Lansing-East Lansing, MI Metro Area
0.3 32.40% 373184 33.63% 55.46% 0 3 464,076
29700 Laredo, TX Metro Area 0 40.54% 1227 20.99% 95.27% 0 5 251,632
29740 Las Cruces, NM Metro Area 0.2 32.34% 149798 28.32% 72.16% 0 4 210,538
29820 Las Vegas-Paradise, NV Metro Area
0.9 28.29% 39148 23.29% 85.97% 7 5 1,954,260
29940 Lawrence, KS Metro Area 0 30.24% 226862 53.28% 59.45% 0 4 111,130
30020 Lawton, OK Metro Area 0 36.23% 0 20.41% 0.00% 0 5 125,368
30140 Lebanon, PA Metro Area 0.1 42.75% 0 23.30% 0.00% 0 4 133,688
30300 Lewiston, ID-WA Metro Area 0 #VALUE! 0 21.37% 0.00% 0 4 60,946
30340 Lewiston-Auburn, ME Metro Area
0 43.85% 1117 23.93% 68.49% 0 3 107,623
30460 Lexington-Fayette, KY Metro Area
1.3 37.57% 373364 36.03% 51.83% 0.02 4 473,547
30620 Lima, OH Metro Area 0.1 46.80% 167 21.54% 67.07% 0 4 106,205
30700 Lincoln, NE Metro Area 0.6 34.22% 366507 38.24% 42.87% 0 4 303,151
30780 Little Rock-North Little Rock-Conway, AR Metro Area
1.5 34.79% 117746 31.41% 63.48% 0 5 701,713
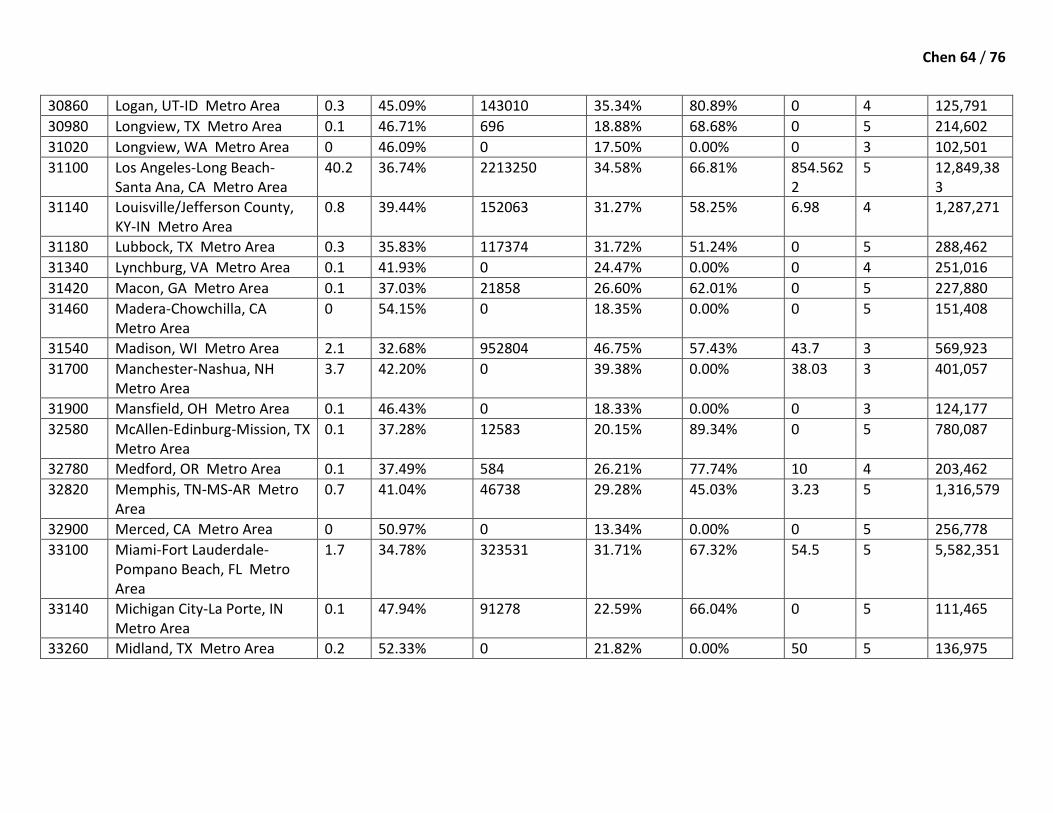
Chen 64 / 76
30860 Logan, UT-ID Metro Area 0.3 45.09% 143010 35.34% 80.89% 0 4 125,791
30980 Longview, TX Metro Area 0.1 46.71% 696 18.88% 68.68% 0 5 214,602
31020 Longview, WA Metro Area 0 46.09% 0 17.50% 0.00% 0 3 102,501
31100 Los Angeles-Long Beach-Santa Ana, CA Metro Area
40.2 36.74% 2213250 34.58% 66.81% 854.5622
5 12,849,383
31140 Louisville/Jefferson County, KY-IN Metro Area
0.8 39.44% 152063 31.27% 58.25% 6.98 4 1,287,271
31180 Lubbock, TX Metro Area 0.3 35.83% 117374 31.72% 51.24% 0 5 288,462
31340 Lynchburg, VA Metro Area 0.1 41.93% 0 24.47% 0.00% 0 4 251,016
31420 Macon, GA Metro Area 0.1 37.03% 21858 26.60% 62.01% 0 5 227,880
31460 Madera-Chowchilla, CA Metro Area
0 54.15% 0 18.35% 0.00% 0 5 151,408
31540 Madison, WI Metro Area 2.1 32.68% 952804 46.75% 57.43% 43.7 3 569,923
31700 Manchester-Nashua, NH Metro Area
3.7 42.20% 0 39.38% 0.00% 38.03 3 401,057
31900 Mansfield, OH Metro Area 0.1 46.43% 0 18.33% 0.00% 0 3 124,177
32580 McAllen-Edinburg-Mission, TX Metro Area
0.1 37.28% 12583 20.15% 89.34% 0 5 780,087
32780 Medford, OR Metro Area 0.1 37.49% 584 26.21% 77.74% 10 4 203,462
32820 Memphis, TN-MS-AR Metro Area
0.7 41.04% 46738 29.28% 45.03% 3.23 5 1,316,579
32900 Merced, CA Metro Area 0 50.97% 0 13.34% 0.00% 0 5 256,778
33100 Miami-Fort Lauderdale-Pompano Beach, FL Metro Area
1.7 34.78% 323531 31.71% 67.32% 54.5 5 5,582,351
33140 Michigan City-La Porte, IN Metro Area
0.1 47.94% 91278 22.59% 66.04% 0 5 111,465
33260 Midland, TX Metro Area 0.2 52.33% 0 21.82% 0.00% 50 5 136,975
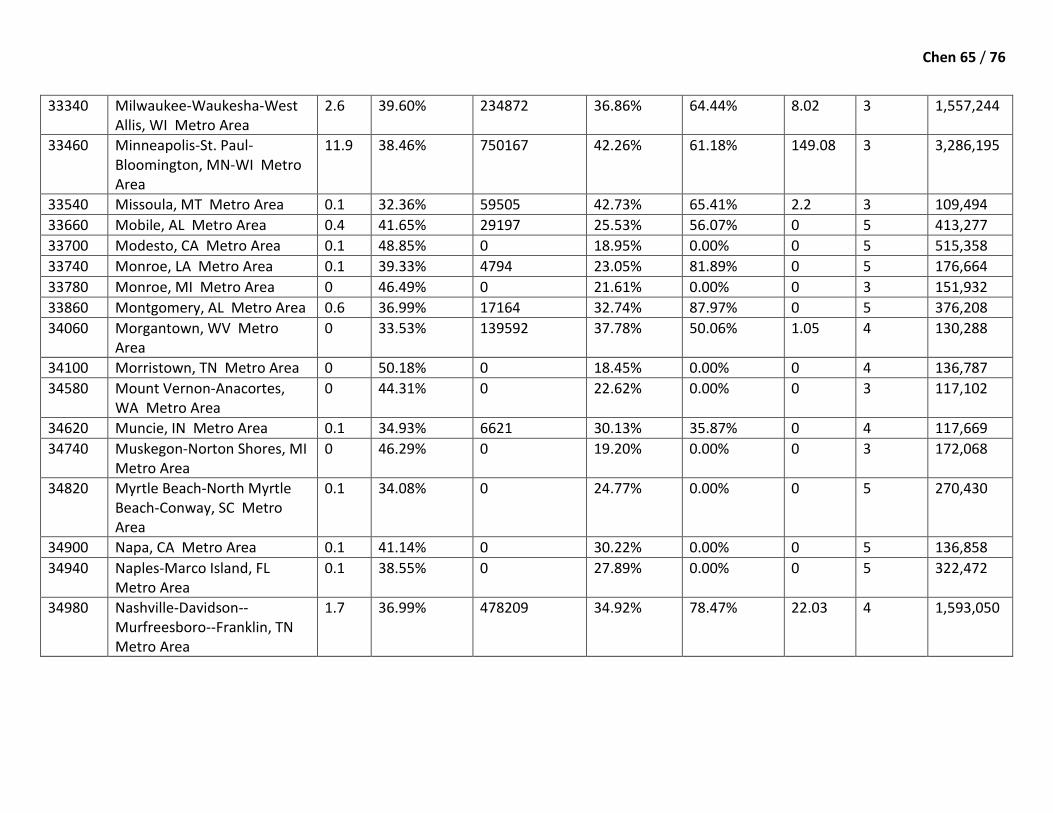
Chen 65 / 76
33340 Milwaukee-Waukesha-West Allis, WI Metro Area
2.6 39.60% 234872 36.86% 64.44% 8.02 3 1,557,244
33460 Minneapolis-St. Paul-Bloomington, MN-WI Metro Area
11.9 38.46% 750167 42.26% 61.18% 149.08 3 3,286,195
33540 Missoula, MT Metro Area 0.1 32.36% 59505 42.73% 65.41% 2.2 3 109,494
33660 Mobile, AL Metro Area 0.4 41.65% 29197 25.53% 56.07% 0 5 413,277
33700 Modesto, CA Metro Area 0.1 48.85% 0 18.95% 0.00% 0 5 515,358
33740 Monroe, LA Metro Area 0.1 39.33% 4794 23.05% 81.89% 0 5 176,664
33780 Monroe, MI Metro Area 0 46.49% 0 21.61% 0.00% 0 3 151,932
33860 Montgomery, AL Metro Area 0.6 36.99% 17164 32.74% 87.97% 0 5 376,208
34060 Morgantown, WV Metro Area
0 33.53% 139592 37.78% 50.06% 1.05 4 130,288
34100 Morristown, TN Metro Area 0 50.18% 0 18.45% 0.00% 0 4 136,787
34580 Mount Vernon-Anacortes, WA Metro Area
0 44.31% 0 22.62% 0.00% 0 3 117,102
34620 Muncie, IN Metro Area 0.1 34.93% 6621 30.13% 35.87% 0 4 117,669
34740 Muskegon-Norton Shores, MI Metro Area
0 46.29% 0 19.20% 0.00% 0 3 172,068
34820 Myrtle Beach-North Myrtle Beach-Conway, SC Metro Area
0.1 34.08% 0 24.77% 0.00% 0 5 270,430
34900 Napa, CA Metro Area 0.1 41.14% 0 30.22% 0.00% 0 5 136,858
34940 Naples-Marco Island, FL Metro Area
0.1 38.55% 0 27.89% 0.00% 0 5 322,472
34980 Nashville-Davidson--Murfreesboro--Franklin, TN Metro Area
1.7 36.99% 478209 34.92% 78.47% 22.03 4 1,593,050

Chen 66 / 76
35300 New Haven-Milford, CT Metro Area
3.1 34.23% 511725 36.82% 75.58% 1.3 4 862,989
35380 New Orleans-Metairie-Kenner, LA Metro Area
0.9 36.71% 166055 31.53% 76.09% 0 5 1,173,327
35620 New York-Northern New Jersey-Long Island, NY-NJ-PA Metro Area
16.8 31.29% 5805897 42.01% 67.96% 1287.34 4 18,919,983
35660 Niles-Benton Harbor, MI Metro Area
0.1 46.05% 494 25.39% 34.82% 0 3 156,805
35980 Norwich-New London, CT Metro Area
1 34.78% 1584 34.68% 93.37% 0.23 4 703,309
36100 Ocala, FL Metro Area 0.2 39.12% 0 19.13% 0.00% 0 5 331,290
36140 Ocean City, NJ Metro Area 0 31.06% 0 31.59% 0.00% 0 4 97,253
36220 Odessa, TX Metro Area 0 48.35% 797 14.75% 24.84% 0 5 137,145
36260 Ogden-Clearfield, UT Metro Area
0.6 38.22% 777 32.17% 45.69% 0 4 551,173
36420 Oklahoma City, OK Metro Area
1.2 36.07% 201821 32.22% 58.72% 0 5 1,257,845
36500 Olympia, WA Metro Area 0.1 30.53% 672 33.50% 96.88% 0 3 253,087
36540 Omaha-Council Bluffs, NE-IA Metro Area
1.6 35.86% 27104 37.75% 57.00% 0 4 868,238
36740 Orlando-Kissimmee-Sanford, FL Metro Area
4.7 32.39% 113433 31.59% 70.55% 45.51 4 2,140,795
36780 Oshkosh-Neenah, WI Metro Area
0.2 46.88% 1067 24.03% 60.07% 0 3 167,059
36980 Owensboro, KY Metro Area 0 50.92% 0 19.17% 0.00% 0 4 115,857
37100 Oxnard-Thousand Oaks-Ventura, CA Metro Area
3.8 38.01% 606 34.04% 25.74% 0 5 825,706

Chen 67 / 76
37340 Palm Bay-Melbourne-Titusville, FL Metro Area
4.1 37.80% 10389 29.24% 84.03% 11.71 5 543,573
37380 Palm Coast, FL Metro Area #VALUE! 0 24.47% 0.00% 0 5 95,928
37460 Panama City-Lynn Haven-Panama City Beach, FL Metro Area
0.2 33.08% 0 20.72% 0.00% 0 5 169,272
37620 Parkersburg-Marietta-Vienna, WV-OH Metro Area
0.1 42.60% 0 20.03% 0.00% 0 4 162,723
37700 Pascagoula, MS Metro Area 0.1 47.95% 0 18.26% 0.00% 0 5 162,384
37860 Pensacola-Ferry Pass-Brent, FL Metro Area
0.3 32.43% 3274 27.72% 91.97% 0 5 450,009
37900 Peoria, IL Metro Area 0.3 43.10% 1598 31.24% 23.97% 0 4 378,712
37980 Philadelphia-Camden-Wilmington, PA-NJ-DE-MD Metro Area
14.4 33.91% 1195695 39.44% 71.81% 144.26 4 5,971,483
38060 Phoenix-Mesa-Glendale, AZ Metro Area
10.4 36.26% 281588 30.71% 57.34% 49.68 5 4,211,213
38220 Pine Bluff, AR Metro Area 0 44.02% 7422 15.45% 55.62% 0 5 99,871
38300 Pittsburgh, PA Metro Area 4.3 37.12% 852211 36.89% 77.33% 86.56 4 2,356,381
38340 Pittsfield, MA Metro Area 0.2 34.01% 4907 32.99% 39.92% 0.37 3 131,144
38540 Pocatello, ID Metro Area 0 40.54% 20524 29.86% 62.33% 0 3 90,438
38940 Port St. Lucie, FL Metro Area 0.2 37.91% 0 24.01% 0.00% 0 5 425,082
38860 Portland-South Portland-Biddeford, ME Metro Area
0.9 35.17% 25304 38.06% 62.02% 0 3 513,899
38900 Portland-Vancouver-Hillsboro, OR-WA Metro Area
9.6 39.87% 349282 36.80% 77.31% 84.06 4 2,232,496
39100 Poughkeepsie-Newburgh- 1.3 36.03% 11439 35.99% 87.91% 0 4 670,932
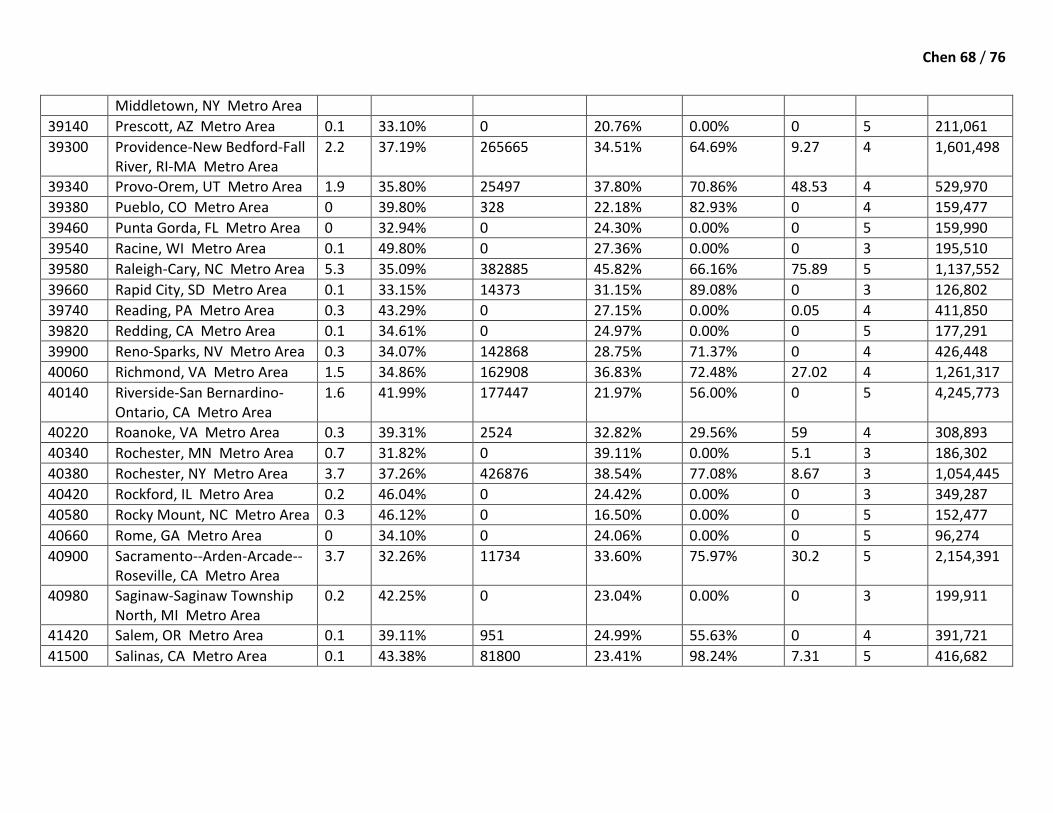
Chen 68 / 76
Middletown, NY Metro Area
39140 Prescott, AZ Metro Area 0.1 33.10% 0 20.76% 0.00% 0 5 211,061
39300 Providence-New Bedford-Fall River, RI-MA Metro Area
2.2 37.19% 265665 34.51% 64.69% 9.27 4 1,601,498
39340 Provo-Orem, UT Metro Area 1.9 35.80% 25497 37.80% 70.86% 48.53 4 529,970
39380 Pueblo, CO Metro Area 0 39.80% 328 22.18% 82.93% 0 4 159,477
39460 Punta Gorda, FL Metro Area 0 32.94% 0 24.30% 0.00% 0 5 159,990
39540 Racine, WI Metro Area 0.1 49.80% 0 27.36% 0.00% 0 3 195,510
39580 Raleigh-Cary, NC Metro Area 5.3 35.09% 382885 45.82% 66.16% 75.89 5 1,137,552
39660 Rapid City, SD Metro Area 0.1 33.15% 14373 31.15% 89.08% 0 3 126,802
39740 Reading, PA Metro Area 0.3 43.29% 0 27.15% 0.00% 0.05 4 411,850
39820 Redding, CA Metro Area 0.1 34.61% 0 24.97% 0.00% 0 5 177,291
39900 Reno-Sparks, NV Metro Area 0.3 34.07% 142868 28.75% 71.37% 0 4 426,448
40060 Richmond, VA Metro Area 1.5 34.86% 162908 36.83% 72.48% 27.02 4 1,261,317
40140 Riverside-San Bernardino-Ontario, CA Metro Area
1.6 41.99% 177447 21.97% 56.00% 0 5 4,245,773
40220 Roanoke, VA Metro Area 0.3 39.31% 2524 32.82% 29.56% 59 4 308,893
40340 Rochester, MN Metro Area 0.7 31.82% 0 39.11% 0.00% 5.1 3 186,302
40380 Rochester, NY Metro Area 3.7 37.26% 426876 38.54% 77.08% 8.67 3 1,054,445
40420 Rockford, IL Metro Area 0.2 46.04% 0 24.42% 0.00% 0 3 349,287
40580 Rocky Mount, NC Metro Area 0.3 46.12% 0 16.50% 0.00% 0 5 152,477
40660 Rome, GA Metro Area 0 34.10% 0 24.06% 0.00% 0 5 96,274
40900 Sacramento--Arden-Arcade--Roseville, CA Metro Area
3.7 32.26% 11734 33.60% 75.97% 30.2 5 2,154,391
40980 Saginaw-Saginaw Township North, MI Metro Area
0.2 42.25% 0 23.04% 0.00% 0 3 199,911
41420 Salem, OR Metro Area 0.1 39.11% 951 24.99% 55.63% 0 4 391,721
41500 Salinas, CA Metro Area 0.1 43.38% 81800 23.41% 98.24% 7.31 5 416,682
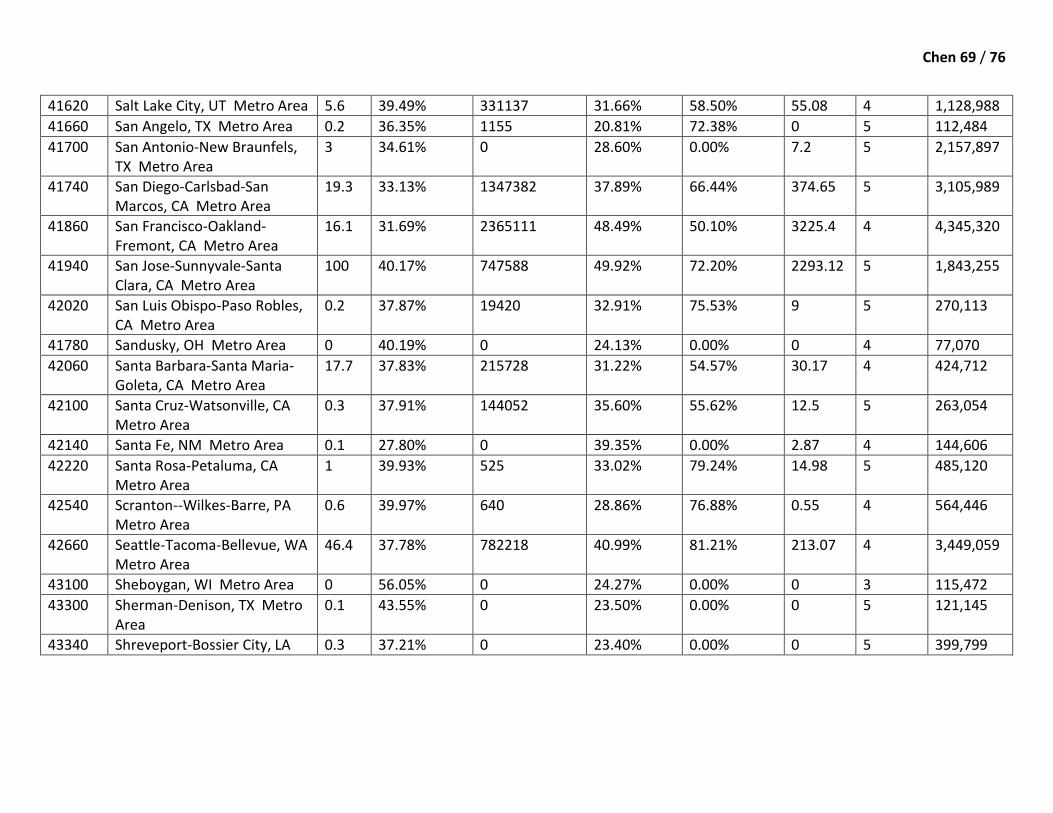
Chen 69 / 76
41620 Salt Lake City, UT Metro Area 5.6 39.49% 331137 31.66% 58.50% 55.08 4 1,128,988
41660 San Angelo, TX Metro Area 0.2 36.35% 1155 20.81% 72.38% 0 5 112,484
41700 San Antonio-New Braunfels, TX Metro Area
3 34.61% 0 28.60% 0.00% 7.2 5 2,157,897
41740 San Diego-Carlsbad-San Marcos, CA Metro Area
19.3 33.13% 1347382 37.89% 66.44% 374.65 5 3,105,989
41860 San Francisco-Oakland-Fremont, CA Metro Area
16.1 31.69% 2365111 48.49% 50.10% 3225.4 4 4,345,320
41940 San Jose-Sunnyvale-Santa Clara, CA Metro Area
100 40.17% 747588 49.92% 72.20% 2293.12 5 1,843,255
42020 San Luis Obispo-Paso Robles, CA Metro Area
0.2 37.87% 19420 32.91% 75.53% 9 5 270,113
41780 Sandusky, OH Metro Area 0 40.19% 0 24.13% 0.00% 0 4 77,070
42060 Santa Barbara-Santa Maria-Goleta, CA Metro Area
17.7 37.83% 215728 31.22% 54.57% 30.17 4 424,712
42100 Santa Cruz-Watsonville, CA Metro Area
0.3 37.91% 144052 35.60% 55.62% 12.5 5 263,054
42140 Santa Fe, NM Metro Area 0.1 27.80% 0 39.35% 0.00% 2.87 4 144,606
42220 Santa Rosa-Petaluma, CA Metro Area
1 39.93% 525 33.02% 79.24% 14.98 5 485,120
42540 Scranton--Wilkes-Barre, PA Metro Area
0.6 39.97% 640 28.86% 76.88% 0.55 4 564,446
42660 Seattle-Tacoma-Bellevue, WA Metro Area
46.4 37.78% 782218 40.99% 81.21% 213.07 4 3,449,059
43100 Sheboygan, WI Metro Area 0 56.05% 0 24.27% 0.00% 0 3 115,472
43300 Sherman-Denison, TX Metro Area
0.1 43.55% 0 23.50% 0.00% 0 5 121,145
43340 Shreveport-Bossier City, LA 0.3 37.21% 0 23.40% 0.00% 0 5 399,799

Chen 70 / 76
Metro Area
43580 Sioux City, IA-NE-SD Metro Area
0.1 48.61% 0 27.50% 0.00% 0 3 143,882
43620 Sioux Falls, SD Metro Area 0.3 37.13% 811 35.80% 96.55% 0 3 229,360
43780 South Bend-Mishawaka, IN-MI Metro Area
0.3 42.04% 97850 29.18% 59.00% 0 3 319,157
43900 Spartanburg, SC Metro Area 0.1 49.84% 0 26.12% 0.00% 0 5 284,713
44060 Spokane, WA Metro Area 0.5 36.18% 2694 31.92% 68.93% 6 3 472,147
44100 Springfield, IL Metro Area 0.2 28.28% 1347 35.82% 77.06% 0 4 210,390
44140 Springfield, MA Metro Area 0.3 35.77% 167116 34.34% 55.42% 0 3 693,141
44180 Springfield, MO Metro Area 0.2 37.04% 11244 30.00% 88.56% 0 4 435,175
44220 Springfield, OH Metro Area 0 39.83% 0 20.91% 0.00% 0 4 138,193
41060 St. Cloud, MN Metro Area 0.2 43.84% 3638 24.93% 32.63% 0 3 189,284
41140 St. Joseph, MO-KS Metro Area
0.1 45.10% 0 24.57% 0.00% 0 4 129,678
41180 St. Louis, MO-IL Metro Area 6.7 36.52% 711101 34.87% 67.23% 23.23 4 2,815,168
44300 State College, PA Metro Area 0.3 30.47% 753358 46.83% 66.72% 0 4 154,127
44700 Stockton, CA Metro Area 0.1 43.06% 5528 20.60% 44.81% 0 5 687,744
44940 Sumter, SC Metro Area 0 36.70% 0 18.74% 0.00% 0 5 107,570
45060 Syracuse, NY Metro Area 1.7 35.02% 97161 34.30% 63.95% 0 3 662,757
45220 Tallahassee, FL Metro Area 0.5 24.06% 220895 40.60% 71.28% 0 5 368,117
45300 Tampa-St. Petersburg-Clearwater, FL Metro Area
5.6 34.48% 309996 30.65% 72.14% 15.59 4 2,789,116
45460 Terre Haute, IN Metro Area 0.2 43.47% 4247 23.01% 31.13% 0 4 173,087
45500 Texarkana, TX-Texarkana, AR Metro Area
0 41.25% 0 19.64% 0.00% 0 5 136,252
45780 Toledo, OH Metro Area 0.3 40.84% 74532 28.86% 60.32% 0 3 651,020
45820 Topeka, KS Metro Area 0.1 35.90% 0 32.73% 0.00% 0 4 236,290

Chen 71 / 76
45940 Trenton-Ewing, NJ Metro Area
2 29.83% 203197 43.42% 64.35% 20 4 366,789
46060 Tucson, AZ Metro Area 3.3 31.17% 565292 32.39% 56.83% 16.2 5 982,154
46140 Tulsa, OK Metro Area 1.3 41.79% 12525 28.69% 49.01% 0 5 939,345
46220 Tuscaloosa, AL Metro Area 0.1 40.81% 36508 29.69% 71.03% 0 5 219,785
46340 Tyler, TX Metro Area 0.2 37.28% 3078 25.87% 94.77% 0 5 210,512
46540 Utica-Rome, NY Metro Area 0.4 34.39% 1344 27.80% 43.82% 0 4 299,347
46660 Valdosta, GA Metro Area 0 37.89% 0 23.66% 0.00% 0 5 137,657
46700 Vallejo-Fairfield, CA Metro Area
0.2 36.69% 681618 24.55% 51.84% 0 5 414,305
47020 Victoria, TX Metro Area 0.1 47.53% 0 17.35% 0.00% 0 5 115,396
47220 Vineland-Millville-Bridgeton, NJ Metro Area
0 40.43% 0 17.61% 0.00% 0 4 157,149
47260 Virginia Beach-Norfolk-Newport News, VA-NC Metro Area
2.8 34.06% 180496 32.03% 57.82% 0.22 5 1,675,343
47300 Visalia-Porterville, CA Metro Area
0 52.95% 0 14.08% 0.00% 0 5 443,688
47380 Waco, TX Metro Area 0.3 38.58% 11427 25.63% 42.75% 0 5 236,028
47580 Warner Robins, GA Metro Area
0.4 33.28% 0 23.98% 0.00% 0 5 140,713
47900 Washington-Arlington-Alexandria, DC-VA-MD-WV Metro Area
41.8 22.90% 1005671 50.44% 71.97% 582.27 4 5,610,082
47940 Waterloo-Cedar Falls, IA Metro Area
0.1 45.84% 2160 29.56% 62.13% 0 3 165,095
48140 Wausau, WI Metro Area 0.1 51.51% 0 22.48% 0.00% 0 3 134,104
48300 Wenatchee-East Wenatchee, 0.1 49.31% 0 18.44% 0.00% 0 3 111,324
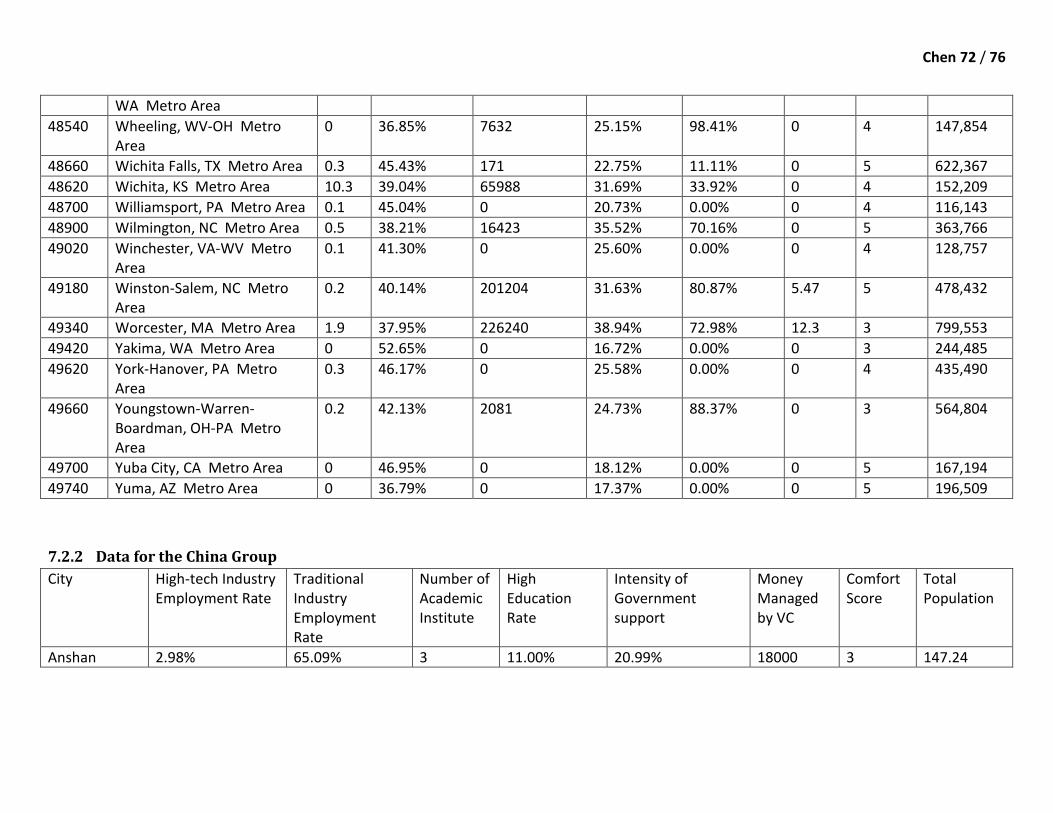
Chen 72 / 76
WA Metro Area
48540 Wheeling, WV-OH Metro Area
0 36.85% 7632 25.15% 98.41% 0 4 147,854
48660 Wichita Falls, TX Metro Area 0.3 45.43% 171 22.75% 11.11% 0 5 622,367
48620 Wichita, KS Metro Area 10.3 39.04% 65988 31.69% 33.92% 0 4 152,209
48700 Williamsport, PA Metro Area 0.1 45.04% 0 20.73% 0.00% 0 4 116,143
48900 Wilmington, NC Metro Area 0.5 38.21% 16423 35.52% 70.16% 0 5 363,766
49020 Winchester, VA-WV Metro Area
0.1 41.30% 0 25.60% 0.00% 0 4 128,757
49180 Winston-Salem, NC Metro Area
0.2 40.14% 201204 31.63% 80.87% 5.47 5 478,432
49340 Worcester, MA Metro Area 1.9 37.95% 226240 38.94% 72.98% 12.3 3 799,553
49420 Yakima, WA Metro Area 0 52.65% 0 16.72% 0.00% 0 3 244,485
49620 York-Hanover, PA Metro Area
0.3 46.17% 0 25.58% 0.00% 0 4 435,490
49660 Youngstown-Warren-Boardman, OH-PA Metro Area
0.2 42.13% 2081 24.73% 88.37% 0 3 564,804
49700 Yuba City, CA Metro Area 0 46.95% 0 18.12% 0.00% 0 5 167,194
49740 Yuma, AZ Metro Area 0 36.79% 0 17.37% 0.00% 0 5 196,509
7.2.2 Data for the China Group
City High-tech Industry Employment Rate
Traditional Industry Employment Rate
Number of Academic Institute
High Education Rate
Intensity of Government support
Money Managed by VC
Comfort Score
Total Population
Anshan 2.98% 65.09% 3 11.00% 20.99% 18000 3 147.24

Chen 73 / 76
Anyang 1.83% 63.44% 3 4.72% 15.89% 0 5 107.53
Baiyin 1.69% 65.08% 0 4.49% 38.00% 0 4 49.66
Banbu 5.71% 47.99% 5 4.01% 22.98% 0 5 92.52
Baoding 4.52% 63.53% 12 4.81% 21.73% 0 4 106.25
Baoji 3.12% 64.67% 3 8.68% 60.81% 0 4 141.37
Baotou 4.46% 55.97% 9 7.42% 15.76% 0 3 141.48
Beijing 13.18% 39.08% 88 28.12% 52.27% 13787240 4 1174.63
Changchun 7.38% 50.07% 26 7.57% 31.45% 88080 3 362.32
Changsha 6.52% 47.09% 35 6.51% 15.93% 58000 5 240.95
Changzhou 3.55% 56.61% 9 7.04% 12.88% 100 5 226.67
Chengdu 6.03% 61.62% 31 4.35% 48.69% 44300 5 520.86
Chongqing 3.73% 59.87% 50 4.24% 19.27% 22598 5 1542.77
Daqing 12.34% 58.23% 6 5.97% 37.57% 3796 3 132.53
Dlian 4.30% 61.30% 31 11.00% 20.99% 42600 3 302.01
Dongguan 1.94% 43.96% 5 7.04% 8.77% 0 5 178.73
Foshan 3.08% 57.28% 3 7.04% 8.77% 4000 5 367.63
Fuzhou 5.95% 51.09% 30 5.86% 10.82% 10100 5 187.33
Guangzhou 5.14% 57.36% - 7.04% 8.77% 264420 5 654.68
Guilin 5.69% 43.40% 8 3.29% 24.11% 0 5 75.79
Guiyang 4.66% 56.63% 24 3.50% 21.00% 4600 4 218.79
Haikou 4.50% 44.05% 10 5.77% 54.52% 3200 4 158.24
Hangzhou 5.80% 64.07% 35 9.53% 9.18% 293565 5 429.44
Harbin 4.51% 62.71% 46 5.97% 37.57% 135000 3 474.7
Hefei 6.17% 54.96% 43 4.01% 22.98% 259000 5 208.58
Huizhou 0.89% 81.88% 1 7.04% 8.77% 0 5 129.02
Jiangmen 1.95% 66.50% 3 7.04% 8.77% 0 5 137.57
Jilin 2.26% 50.63% 8 7.57% 31.45% 0 3 185.07
Jinan 4.10% 56.08% 65 5.47% 8.64% 159400 4 348.24
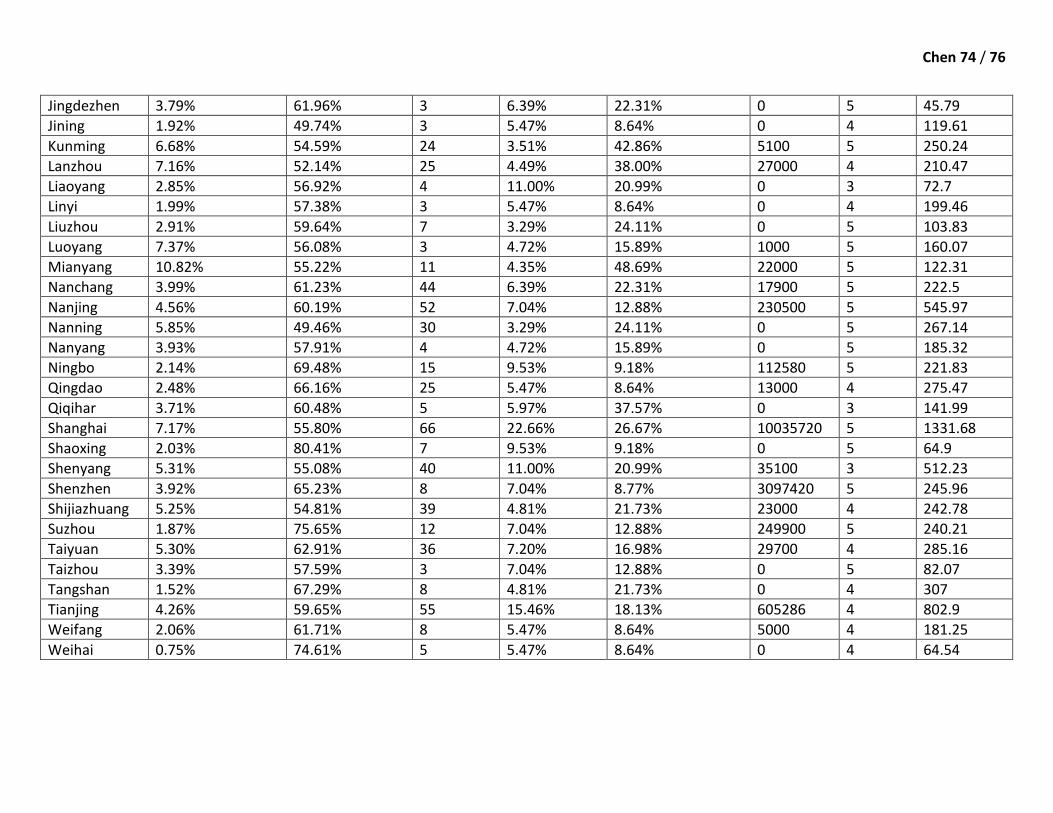
Chen 74 / 76
Jingdezhen 3.79% 61.96% 3 6.39% 22.31% 0 5 45.79
Jining 1.92% 49.74% 3 5.47% 8.64% 0 4 119.61
Kunming 6.68% 54.59% 24 3.51% 42.86% 5100 5 250.24
Lanzhou 7.16% 52.14% 25 4.49% 38.00% 27000 4 210.47
Liaoyang 2.85% 56.92% 4 11.00% 20.99% 0 3 72.7
Linyi 1.99% 57.38% 3 5.47% 8.64% 0 4 199.46
Liuzhou 2.91% 59.64% 7 3.29% 24.11% 0 5 103.83
Luoyang 7.37% 56.08% 3 4.72% 15.89% 1000 5 160.07
Mianyang 10.82% 55.22% 11 4.35% 48.69% 22000 5 122.31
Nanchang 3.99% 61.23% 44 6.39% 22.31% 17900 5 222.5
Nanjing 4.56% 60.19% 52 7.04% 12.88% 230500 5 545.97
Nanning 5.85% 49.46% 30 3.29% 24.11% 0 5 267.14
Nanyang 3.93% 57.91% 4 4.72% 15.89% 0 5 185.32
Ningbo 2.14% 69.48% 15 9.53% 9.18% 112580 5 221.83
Qingdao 2.48% 66.16% 25 5.47% 8.64% 13000 4 275.47
Qiqihar 3.71% 60.48% 5 5.97% 37.57% 0 3 141.99
Shanghai 7.17% 55.80% 66 22.66% 26.67% 10035720 5 1331.68
Shaoxing 2.03% 80.41% 7 9.53% 9.18% 0 5 64.9
Shenyang 5.31% 55.08% 40 11.00% 20.99% 35100 3 512.23
Shenzhen 3.92% 65.23% 8 7.04% 8.77% 3097420 5 245.96
Shijiazhuang 5.25% 54.81% 39 4.81% 21.73% 23000 4 242.78
Suzhou 1.87% 75.65% 12 7.04% 12.88% 249900 5 240.21
Taiyuan 5.30% 62.91% 36 7.20% 16.98% 29700 4 285.16
Taizhou 3.39% 57.59% 3 7.04% 12.88% 0 5 82.07
Tangshan 1.52% 67.29% 8 4.81% 21.73% 0 4 307
Tianjing 4.26% 59.65% 55 15.46% 18.13% 605286 4 802.9
Weifang 2.06% 61.71% 8 5.47% 8.64% 5000 4 181.25
Weihai 0.75% 74.61% 5 5.47% 8.64% 0 4 64.54
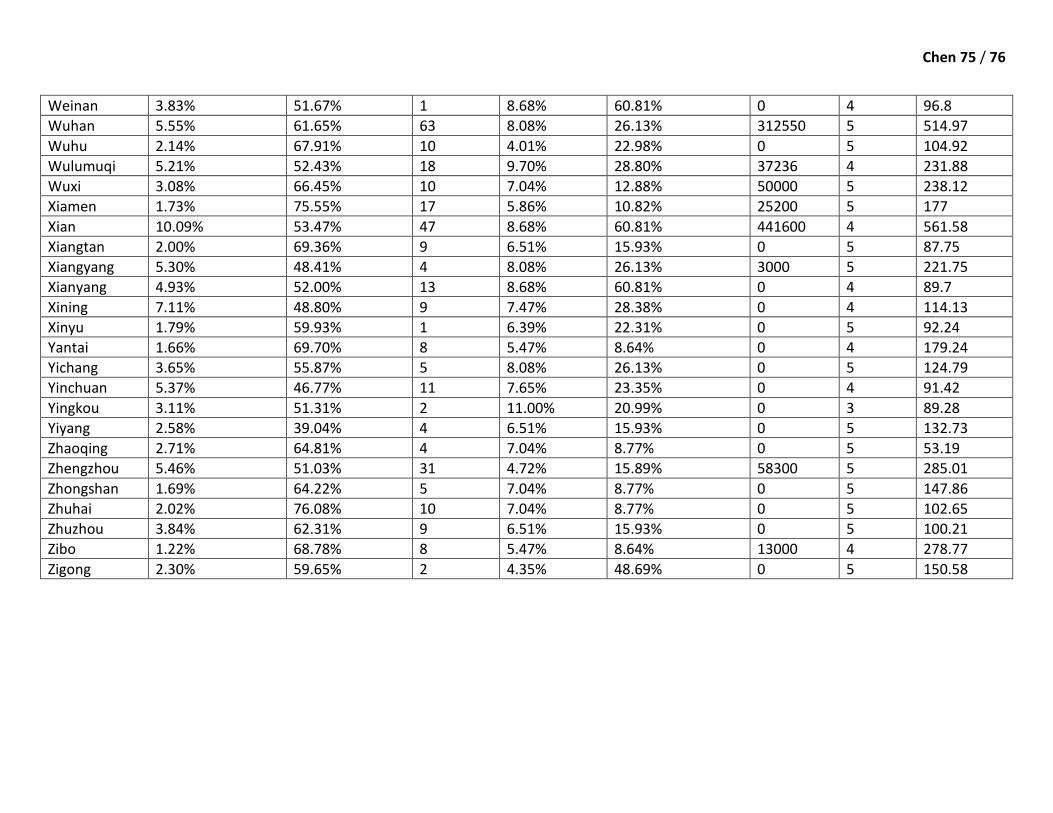
Chen 75 / 76
Weinan 3.83% 51.67% 1 8.68% 60.81% 0 4 96.8
Wuhan 5.55% 61.65% 63 8.08% 26.13% 312550 5 514.97
Wuhu 2.14% 67.91% 10 4.01% 22.98% 0 5 104.92
Wulumuqi 5.21% 52.43% 18 9.70% 28.80% 37236 4 231.88
Wuxi 3.08% 66.45% 10 7.04% 12.88% 50000 5 238.12
Xiamen 1.73% 75.55% 17 5.86% 10.82% 25200 5 177
Xian 10.09% 53.47% 47 8.68% 60.81% 441600 4 561.58
Xiangtan 2.00% 69.36% 9 6.51% 15.93% 0 5 87.75
Xiangyang 5.30% 48.41% 4 8.08% 26.13% 3000 5 221.75
Xianyang 4.93% 52.00% 13 8.68% 60.81% 0 4 89.7
Xining 7.11% 48.80% 9 7.47% 28.38% 0 4 114.13
Xinyu 1.79% 59.93% 1 6.39% 22.31% 0 5 92.24
Yantai 1.66% 69.70% 8 5.47% 8.64% 0 4 179.24
Yichang 3.65% 55.87% 5 8.08% 26.13% 0 5 124.79
Yinchuan 5.37% 46.77% 11 7.65% 23.35% 0 4 91.42
Yingkou 3.11% 51.31% 2 11.00% 20.99% 0 3 89.28
Yiyang 2.58% 39.04% 4 6.51% 15.93% 0 5 132.73
Zhaoqing 2.71% 64.81% 4 7.04% 8.77% 0 5 53.19
Zhengzhou 5.46% 51.03% 31 4.72% 15.89% 58300 5 285.01
Zhongshan 1.69% 64.22% 5 7.04% 8.77% 0 5 147.86
Zhuhai 2.02% 76.08% 10 7.04% 8.77% 0 5 102.65
Zhuzhou 3.84% 62.31% 9 6.51% 15.93% 0 5 100.21
Zibo 1.22% 68.78% 8 5.47% 8.64% 13000 4 278.77
Zigong 2.30% 59.65% 2 4.35% 48.69% 0 5 150.58

Chen 76 / 76