value in health care - sea pines
TRANSCRIPT

VALUE IN HEALTH CARE

No relevant disclosures

VALUE = QUALITY/COST“health outcomes achieved per dollar spent”
Porter M. NEJM. 2010. 363:2477-2481

Berwick et. al, 2008, Health Affairs
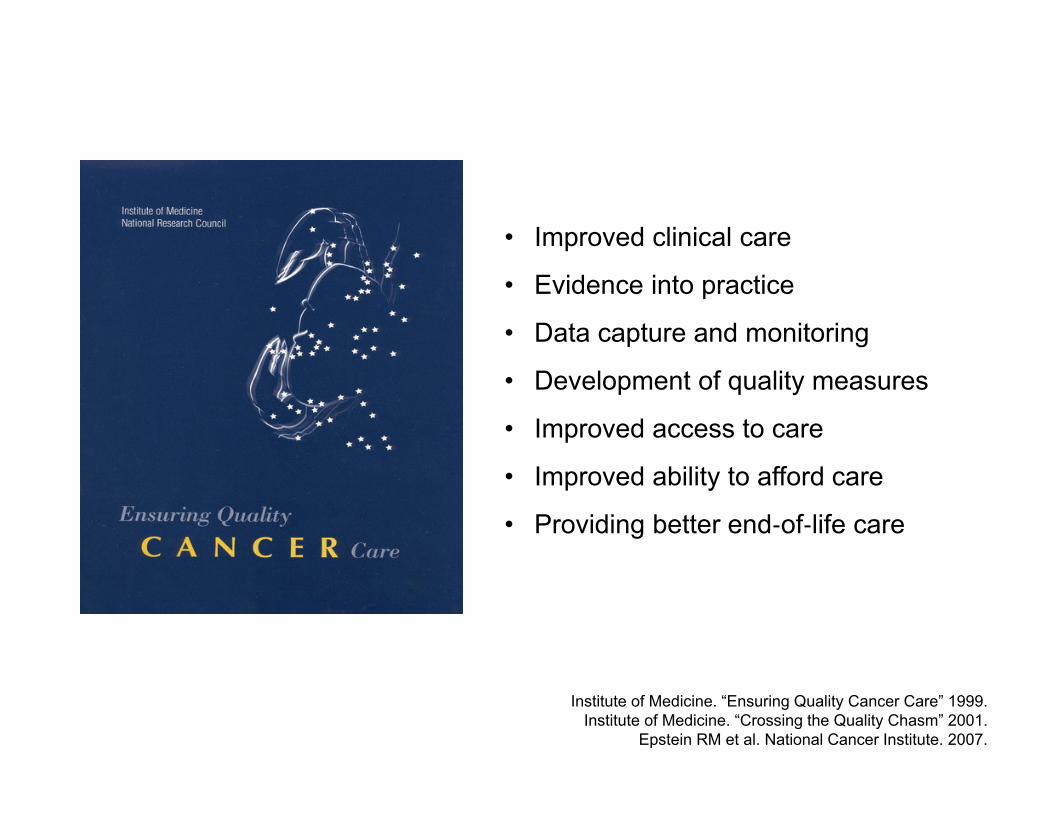
Institute of Medicine. “Ensuring Quality Cancer Care” 1999. Institute of Medicine. “Crossing the Quality Chasm” 2001.
Epstein RM et al. National Cancer Institute. 2007.
• Improved clinical care
• Evidence into practice
• Data capture and monitoring
• Development of quality measures
• Improved access to care
• Improved ability to afford care
• Providing better end‐of‐life care

Blumenthal D, McGinnis JM. JAMA. 2015. 313(19): 1901-1902.
Core metrics for better health at lower costs• Life expectancy• Well-being• Overweight and obesity• Addictive behavior• Unintended pregnancy• Health communities• Preventive services• Care access• Patient safety• Evidence-based care• Care match with patient goals• Personal spending burden• Population spending burden• Individual engagement• Community engagement

HIGH VALUE CANCER CARE
• Incorporating evidence into practice
• Foregoing treatment that lacks benefit
• Improving patient experience

N=856

VALUE IN BREAST CANCER
ACOSOG Z0011Fewer lymph node dissections Decreased LOS, Lower costs, Less lymphedema
Society of Surgical Oncology- ASTRO Margin GuidelinesEliminates 25K unnecessary surgeries each year $31 million savings per year
ASTRO Choosing Wisely Guidelines for Abbreviated Radiation RegimensShorter radiation for women $164 million savings per year
Risk-reducing Mastectomies in Women with BRCA Mutations After Ovarian CancerBilateral mastectomies within 5-years of ovarian cancer not cost-effective
Camp MS, et al. Ann Surg Onc. 220:836-41. 2013.Greenup RA, et al. Ann Surg Onc. 21:1512-1514. 2014.Greenup RA et al. Journal of Oncology Practice. 2017.
Gamble C, et al. Ann Surg Oncol. 24:3116–3123. 2017.

VALUE = QUALITY/COST“health outcomes achieved per dollar spent”
Porter M. NEJM. 2010. 363:2477-2481

HEALTH CARE COSTS
Agency for Health Care Research. 2014. Mariotto AB, et al. J Natl Cancer Inst. 2011; 103:117-28.
McGuire WL, et al. NEJM. 320: 525-527. 1989.Yabroff KR, et al. Cancer Epidemiol Biomarkers Prev. 2011; 20: 2006-14.

Kaiser Family Foundation.

HEALTH CARE COSTS
• Predicted to increase by 5.5% per year
• 20% of GDP by 2025
• $3.5 trillion in 2017
• $180 billion per year for cancer
• Breast cancer costs estimated at $20 billion by 2020
• Technology and politics greatest contributors
Himmelstein. Int Journal of Health Services. 48(1). 2018.Mariotto AB, et al. J Natl Cancer Inst. 2011; 103:117-28.

CONTRIBUTIONS TO HEALTHCARE SPENDING

Smith et al. Institute of Medicine. 2012.
$750 billion/year

GROWING POPULATION OF CANCER SURVIVORS
• Over 15 million cancer survivors in U.S.
• 25% with breast cancer.
• Side effects of treatment, surveillance, greater care use.
• Baby-boomers aging into Medicare.
• Overall life expectancy increasing in the U.S.
• Cancer leads to highest bracket of Medicare spending.
Lam MB, et al. Healthcare. 2018. 6(1):46-51.Keehan S, et al. Health Affairs. 2008. 27(2):w145-155.
Jr GPG, et al. Journal of Clinical Oncology. 2017. 35 (18):2053-2061.

BREAST CANCER SURVIVORSHIP COSTS
• Women ≥65 years old
• SEER-Medicare (parts A and B) data from 1997-2013
• Categorized based on year of diagnosis (1998, 2003, 2008)
• Propensity score matched using Elixhauser co-morbidity index (31)
• Compared costs of beneficiaries with and without breast cancer
• Adjusted for inflation to 2018 dollars (Consumer Price Index)
Greenup RA, Yashkin A, Akusevich I, Hwang ES. AACR. 2018.

BREAST CANCER SURVIVORSHIP COSTS
• Age at diagnosis consistent over time (76.5 years)
• 15% of women diagnosed ≥85 years old.
• Comorbidities increased across all time periods.
• Survival after breast cancer was worse than non-BC.
• Stage-specific survival improved over time.
Greenup RA, Yashkin A, Akusevich I, Hwang ES. AACR. 2018.

Greenup RA, Yashkin A, Akusevich I, Hwang ES. AACR. 2018.
BREAST CANCER REDUCES SURVIVAL

COSTS OF SURVIVORSHIP
• Breast cancer costs were lower due to mortality
• Among survivors, average per-person costs higher than controls.
– $143,293 in 1998 to $153,470 in 2008
• Costs increased over time and correlated with stage.
– DCIS: $14,792 in 1998 versus $19,652 in 2008
– Distant cancer: $37,667 in 1998 versus $43,675 in 2008
Greenup RA, Yashkin A, Akusevich I, Hwang ES. AACR. 2018.

COSTS OF SURVIVORSHIP
Greenup RA, Yashkin A, Akusevich I, Hwang ES. AACR. 2018.

SURVIVORSHIP COSTS• Medicare beneficiaries will require greater financial
support for healthcare after breast cancer.
• The oncology community needs to consider workforce and fiscal dollars to prepare for the growing number of cancer survivors in this country.
Greenup RA, Yashkin A, Akusevich I, Hwang ES. AACR. 2018.The State of Cancer Care in America. JOP. 13(4): 2017.

VALUE IN CANCER CAREAlternative payments
• Diagnostic Related Groups (DRG’s): accounts for case mix• Value-based purchasing: includes quality in payment
– Compliance with clinical practice guidelines– Patient experience– Quality Metrics
• Bundled payments: based on episodes of care– Lower Extremity Joint Replacement– Oncology Care Model
• MACRA: shifted Medicare towards bundled payments and limited fee-for-service – Justify value in drug use – Metrics of quality care– Cost and resource use
23

VALUE IN CANCER CAREEngaging Doctors
“Choosing Wisely” Initiative• Across multiple sub-specialties • Concordance ranges from 40-95% in cancer patients.• Estimated healthcare savings with adherence.
“Don’t perform PET/CT… in the staging of early breast cancer..”
“Don’t use white cell stimulating factors for primary prevention of febrile neutropenia..”
“Avoid...preoperative chest x‐rays for ambulatory patients with unremarkable physical exam.”
Choosing Wisely: Ten Things Physicians and Patients Should Know. Roque G, et al. JOP. 13(11): e935-943. 2017.

Zafar SY, et al. Oncologist. 2013; 27(2): 80-149.

Centers for American Progress
37% of US families report stress related to medical care

FINANCIAL TOXICITY
Zafar SY, et al. Oncologist. 2013; 27(2): 80-149.Bernard DSM et al. JCO. 2011; 29:2821-26.
Meropol NJ et al. JCO. 2007; 25(2): 180-186.Wheeler SB, et al. JCO. 36(17): 1695-1701. 2018.
Ramsey SD, et al. Health Affairs. 2013; 32:1143-1152.
• 40% of insured adults report difficulty affording deductibles.
• Up to 25% used most of their savings to pay for cancer.
• 40% reported financial hardship.
• Blacks are disproportionately at risk of financial harm.
• Two-fold increased risk of bankruptcy after cancer.

DECISIONS FOR BREAST CANCER SURGERY
=
Fisher B, et al. NEJM. 2002; 347(16):1233-1241. Veronesi U, et al NEJM. 2002. 347(16):1227-1232.
Hwang ES, et al. Cancer. 2013.119(7):1402-11.


CONTRALATERAL PROPHYLACTIC MASTECTOMY“double mastectomy”
• CPM rates have more than tripled from 1998-2012
• No oncologic or survival benefit
• Increased risk of surgical complications
• Surveillance? Improved symmetry? Peace of mind?
Rosenberg SM, et al. Ann Intern Med.159:373-381, 2013.King TA, et al. JCO. 29: 2158-2164. 2011.
Hwang ES, et al. JCO.34(13) :1518-27. 2016.Wong SM, et al. Annals of Surgery. 265(3):1 2016.

Boughey JC, et al. Annals of Surgical Oncology. 2016. 23:100-3105.
“CPM should be discouraged for an average-risk woman with
unilateral breast cancer. However, patients’ values, goals, and
preferences should be included to optimize shared decision
making... The final decision whether or not to proceed with
CPM is a result of the balance between benefits and
risks…and patient preference.”

• Recovery Time
• Risk of Recurrence
• Peace of Mind
• Side Effects/Complications
• Need for Surveillance
• Appearance
• COSTS?

“When did you first start learning about the costs of your treatment?”
9.17
36.85
2.140.46
24.01
0
5
10
15
20
25
30
35
40
Not Sure < 1 month 2-6 months 6-12 months Over 12 months I never knew thetotal cost
Perc
ent
Time from diagnosis
27%
33

1.383.82 1.83 2.14
21.71
0
10
20
30
40
50
60
70
80
Prefer not toanswer
0-20% 21-40% 41-60% 61-80% 81-100%
Perc
ent
Percent of Covered Cancer Treatment
“What percentage of your breast cancer care did insurance cover?”
69%
34

“How much of a financial burden did you experience as a result of your cancer treatment?”
0.46
39.6
25.23
18.5
13
3.21
0
5
10
15
20
25
30
35
40
45
Prefer not toanswer
None Slight Somewhat Significant Catastrophic
Perc
ent o
f Res
pond
ents
Level of Financial Burden
35%
35

“How much financial burden did you experience as a result of your breast cancer treatment?”
0
10
20
30
40
50
60
70
80
90
100
Refusedn-89
Up to $45Kn=78
$45K-$74Kn=119
$74K-$100Kn=113
$100K-$150Kn=121
Over $150Kn=134
Perc
ent o
f Res
pons
es
Household Income
Significant Catastrophic36

RESULTS• 78% reported never discussing costs with cancer team.
• 35% reported treatment costs were higher than expected.
• Median reported out-of-pocket costs = $4,000.
• 5% reported out-of-pocket costs >$40,000.
• Bilateral mastectomy, receipt of chemotherapy and breast reconstruction were associated with higher OOP costs (p<0.001).
37

FINANCIAL BURDEN BY SURGERY TYPE
Bilateral Mastectomy + Reconstructionn=130
Bilateral Mastectomyn=64
Mastectomy + Reconstructionn=89
Mastectomyn=66
Lumpectomyn=266
0 10 20 30 40 50 60 70PERCENT OF RESPONDENTS
Slight to Somewhat Significant to Catastrophic38

29%
71%Cost Was Considered
Cost Was Not Considered
“How important were costs when making surgical decisions?”
39


“How important were the following when making decisions for breast cancer surgery?”
41

“How important were the following when making decisions for breast cancer surgery?”
42

0
10
20
30
40
50
60
70
80
Cost Not ConsideredCost Considered
<$74K
IMPORTANCE OF COSTS BY INCOME
≥$74K
%
Annual Household Income 43

RESULTS• Younger, minority, privately insured women were
more likely to consider costs when making surgicaltreatment decisions (p<0.001).
• Women were more likely to consider costs insurgical decisions when addressed during theclinical encounter by patients (OR: 4.8) or themedical team (OR: 2.1) (p<0.001).
44

“I prefer to know about the out-of-pocket costs of my treatment before I am treated.”
0.312.14 3.21
15.44
33.33
45.57
0
5
10
15
20
25
30
35
40
45
50
Prefer Not ToAnswer
Stronglydisagree
Disagree Neither agreenor disagree
Agree Strongly Agree
Perc
ent
79%
45

0.76
15.75
21.41 22.17
29.36
10.55
0
5
10
15
20
25
30
35
Prefer Not ToAnswer
Stronglydisagree
Disagree Neither agreenor disagree
Agree Strongly Agree
Perc
ent
40%
“My doctor should consider my out-of-pocket costs as he/she makes a medical decision.”
46

9.17
27.37
36.85
2.140.46
0
5
10
15
20
25
30
35
40
Not Sure < 1 month 2-6 months 6-12 months Over 12 months I never knew thetotal cost
Perc
ent
Time from diagnosis
“When did you first start learning about the costs of your treatment?”
24%
47

• Self-employed and no insurance
• Borrowing from family and friends
• Fundraising
• Negotiating with hospitals (refusal to pay, monthly payments)
• Financial assistance programs
• Difficulty navigating the system
• Awareness of need for others
BURDEN OF CANCER CARE
Greenup RA, Lane WO, Rushing C, Hwang ES, Fish L. In preparation

WHAT DO ONCOLOGISTS THINK ABOUT THE COSTS OF CANCER CARE?
• Drug costs influenced treatment decisions (57%)
• Patient out-of-pocket costs influenced recommendations (84%)
• Discussed costs with patients (40-60%)
• Physicians should not discuss costs with patients (36%)
• More cost-sharing by patients is needed (30%)
• Doctors should determine value of cancer therapies (60%)
• Reimbursement influenced their practice (64%)
Neumann PJ, et al. Health Affairs. 29(1): 196-202. 2010Altomare I, et al. JOP. 12(3): 247-248. 2016
VALUE = QUALITY/COST“health outcomes achieved per dollar spent”
Porter M. NEJM. 2010. 363:2477-2481

MEASURING QUALITY
• Meaningful• Understandable• Accepted by stakeholders• Reflect system-wide performance• Feasible

QUALITY MEASURES
• STRUCTURAL MEASURES– the health care systems, environment, capacity to provide quality care
• PROCESS MEASURES– a provider or system’s ability to provide guideline concordant care
• OUTCOME MEASURES– how a health care service or intervention impact the status of patients
health (i.e. survival, recurrence)

2017• 23 total measures• 10 disease sites

COMPLIANCE ON QUALITY MEASURESsome predict outcomes while others don’t…
Nussbaum DP, et al. ACS. 2017

55
High Value Cancer
Treatment
Patient-Centered
Cancer Care

56
