value creation within the district heating value chain · value creation within the district...
TRANSCRIPT
Value Creation within the District Heating
Value Chain
Summary August 28, 2015

2
Contents
1. Introduction – Background and Objectives of the Study – Scope of the Study – Business Areas within the Scope – Approach of the Study
2. Growth and Profitability within the District Heating Value Chain – Sales and Distribution of District Heating – Construction and Maintenance of District Heating Networks – Other Services Related to Sales and Distribution of District Heating – HVAC Planning and Contracting (for DH customers) – Sales of DH Equipment (for DH customers) – Maintenance and Energy Efficiency Services (for DH customers) – Growth and Profitability of the Business Areas – Summary
3. Development of Roles and Value Creation within the DH Value Chain – Factors Influencing the Development and Value Creation of the Business Areas – Expanding District Heating Company's Role in Customer Sites – Summary
4. Overall DH Cost Structure from Customer Perspective – Summary
5. Future of District Heating – General Drivers for Change in District Heating Value Chain – Expected Development of Roles and Value Creation within the DH Value Chain – Development in Comparable Businesses

3
Introduction Background and Objectives of the Study
• Finnish Energy Industries’ strategy for district heating sector estimates that value creation within the value chain of district heating shifts from energy generation and distribution towards energy efficiency and other services to district heating customers (ie. properties)
• From the perspective of district heating (DH) customers, energy is only a portion of overall costs related to heating – some of the costs are incurred through annualized investments related to DH equipment, some from maintenance and some from the use of various kinds of energy-related services
Objectives Background
• This study examines the development of the DH value chain in recent years, and makes estimates of future development based on interviews of various actors in the value chain and financial key figures of such actors
• The study analyses the development of the DH value chain and businesses related to it and development in the roles of various actors
1. What does the historical growth and profitability of various actors within the DH value chain look like?
2. How have the roles and value creation changed within the value chain and what is the future outlook?
3. What portion of overall heating costs is incurred by parts of value chain other than purchased heat?
1 2 3 4 5

4
Sales and related services of DH customer installations
O&M services related to DH customer installations
DH consumption DH distribution DH sales DH generation Distribution of the fuels
Production and sales of the fuels
Operation and maintenance services related to generation
Operation and maintenance services related to distribution
Equipment sales to DH customers
Equipment sales to DH companies
Equipment sales and related services related to generation
Equipment sales and related services related to distribution
Services to DH companies
Introduction Scope of the Study
Services to DH customers
1 2 3 4 5

5
Introduction Business Areas within the Scope
Approach of the study is based on the following six business areas *)
District heating customer sites
District heating business
Generation Sales and distribution *)
*) HVAC planning and contracting
*) Maintenance and energy efficiency
services
*) Sales of DH equipment
*) construction and maintenance of
DH networks
*) Other services related to DH
business
1 2 3 4 5

6
Comparison and analysis
Introduction Approach of the Study
Financial statements of the companies
Two-part model was used to analyse relevant financial data • Information on sales and profitability of the companies within the scope were sought
from financial statements database • Financial information was refined and broadened in the interviews and with
information from other sources Other parts of the study except historical growth and profitability are based on interviews and publicly available information
Interviews and other sources
Volume, growth and profitability of each business area
1 2 3 4 5

7
11.2$%$ 10.8$%$ 7.1$%$ 6.5$%$ 6.7$%$
100$
108$111$
125$ 124$
110$
73$ 74$ 76$
0.0$%$
2.0$%$
4.0$%$
6.0$%$
8.0$%$
10.0$%$
12.0$%$
14.0$%$
16.0$%$
18.0$%$
20.0$%$
50$
60$
70$
80$
90$
100$
110$
120$
130$
140$
150$
2009$ 2010$ 2011$ 2012$ 2013$
Liiketulos7%$ Liikevaihtokehitys$(€)$ Liiketuloskehitys$(€)$Turnover (€) EBIT (€) EBIT %
Growth and Profitability within the District Heating Value Chain Sales and Distribution of District Heating
• The sales volume (TWh) of district heating hasn’t been growing but euro-denominated sales have grown strongly, mainly due to tax increases and fixed charges from the growth of the customer base
• The moderate growth of sales volume of thermal energy is affected by, among other things, mild winters, industry downturn, energy-efficient buildings and other energy efficiency measures
• The information presented here is based on a data sample of separately reported district heating companies – large energy companies do not usually report district heating performance separately
• It should be noted that the year 2010 was considerably colder than the following mild years
80
100
120
140
160
180
200
2005 2006 2007 2008 2009 2010 2011 2012 2013
DH sales, €
DH sales, TWh
Customers, mill. m3
# of customers Network, km
Indexed turnover and EBIT development for DH companies 2009-2013 (year 2009=100)
Indexed development of district heating volumes (year 2009=100)
1 2 3 4 5

8
Growth and Profitability within the District Heating Value Chain Construction and Maintenance of District Heating Networks
• Market for construction and maintenance of DH networks is approximately EUR 100 million, divided roughly as illustrated in the chart above
• The construction of new DH networks makes up about three-quarters of the overall market and the maintenance of networks around a quarter
• The average annual growth (CAGR) for net sales has been 5.5% and for operating profit around -4.6%
• The growth trend in sales is partly explained by focusing of growth into the (larger) companies of the analysed sample
• Profitability has been undermined in part by growth investments and partly by the decrease of total construction market volumes
Indexed development of turnover and EBIT for construction, maintenance and equipment suppliers for DH networks 2009-2013 (year 2009=100)
Market for construction and maintenance of DH networks (100%=100 million €)
12.2$%$9.2$%$ 5.3$%$
6.9$%$ 8.2$%$
100$ 96$
115$
136$124$
72$ 50$
76$ 83$
0.0$%$
2.0$%$
4.0$%$
6.0$%$
8.0$%$
10.0$%$
12.0$%$
14.0$%$
16.0$%$
18.0$%$
20.0$%$
0$
20$
40$
60$
80$
100$
120$
140$
160$
180$
200$
2009$ 2010$ 2011$ 2012$ 2013$
Liiketulos7%$ Liikevaihtokehitys$(€)$ Liiketuloskehitys$(€)$ RakenneAu$uusi$kaukolämpöverkko$(km)$Turnover (€) EBIT (€) EBIT % New DH network (km)
Refurbishment,.13.
Maintenance,.12.Construc7on,.
earthmoving,.30.Construc7on,.materials,.25.
Construc7on,.pipefi?ng.and.welding,.
20.
Construc7on,.75.
1 2 3 4 5

9
114#
99#
108#
101#
112#
135#
117# 118#
100#
117#120#
139# 137#
50#
60#
70#
80#
90#
100#
110#
120#
130#
140#
150#
2009# 2010# 2011# 2012# 2013#
Lämmön#myynnin#kehitys# Palvelujen#hankinnan#kehitys# Liikevaihdon#kehitys#Services procurement (€) Turnover (€) Thermal heat delivery
Growth and Profitability within the District Heating Value Chain Other Services Related to Sales and Distribution of District Heating
• Other services related to sales and distribution of district heating cover e.g. network operations management, customer service, billing, metering solutions and information systems
• The chart beside illustrates the development of turnover, delivery volumes (MWh) and external service procurement of 20 small standalone district heating companies
• Service procurement has grown at an average annual growth of 4.2% while the turnover has grown by about 8% p.a. and heat delivery volumes have remained unchanged
• It should be noted that although the sample represents about 20% of the number of DH companies, it represents a smaller share of overall service procurement in the sector
Indexed development of heat deliveries (MWh), turnover (€) and external service procurement of 20 standalone DH companies 2009-2013 (2009=100)
Other services related to sales and distribution of district heating
1 2 3 4 5

10
Growth and Profitability within the District Heating Value Chain HVAC Planning and Contracting (for DH customers)
• Overall turnover of HVAC planning companies has developed favourably with a CAGR of over 11%
• On the other hand, overall EBIT of the business area has increased by an average of just over 4% a year - the EBIT margin has therefore declined from about 15% to about 12% in five years, but profitability has still remained high
• The combined turnover of HVAC contracting companies has increased significantly with a CAGR of over 10%
• The combined EBIT has also increased by an average growth rate of nearly 8% annually
Indexed turnover and EBIT development for HVAC contracting companies 2009-2013 (year 2009=100)
Indexed turnover and EBIT development for HVAC planning companies 2009-2013 (year 2009=100)
15.3%%% 13.8%%% 13.7%%% 13.3%%% 11.8%%%
100% 101%107%
94% 92%
113%
126%
154% 155%
101%
112%
133%
119%
0.0%%%
2.0%%%
4.0%%%
6.0%%%
8.0%%%
10.0%%%
12.0%%%
14.0%%%
16.0%%%
18.0%%%
20.0%%%
50%
70%
90%
110%
130%
150%
170%
190%
2009% 2010% 2011% 2012% 2013%LVI1suunni6elu,%liiketulos%%% Uudisrakentaminen,%uudet%luvat% Korjausrakentaminen,%volyymi%LVI1suunni6elu,%liikevaihto% LVI1suunni6elu,%liiketulos%HVAC planning, turnover (€)
HVAC planning, EBIT %
HVAC planning, EBIT
Granted building permits Building renovation volume
3.4$%$ 2.3$%$ 2.8$%$ 3.3$%$ 2.8$%$
100$ 101$107$
94$ 92$
106$
131$
143$149$
59$
106$
156$
134$
0.0$%$
2.0$%$
4.0$%$
6.0$%$
8.0$%$
10.0$%$
12.0$%$
14.0$%$
16.0$%$
18.0$%$
20.0$%$
50$
70$
90$
110$
130$
150$
170$
190$
2009$ 2010$ 2011$ 2012$ 2013$LVI1urakoin9,$liiketulos$%$ Uudisrakentaminen,$uudet$luvat$ Korjausrakentaminen,$volyymi$
LVI1urakoin9,$liikevaihto$ LVI1urakoin9,$liiketulos$HVAC contracting, turnover (€)
HVAC contracting, EBIT %
HVAC contracting, EBIT
Granted building permits Building renovation volume
1 2 3 4 5
11
Growth and Profitability within the District Heating Value Chain Sales of District Heating Equipment (for DH customers)
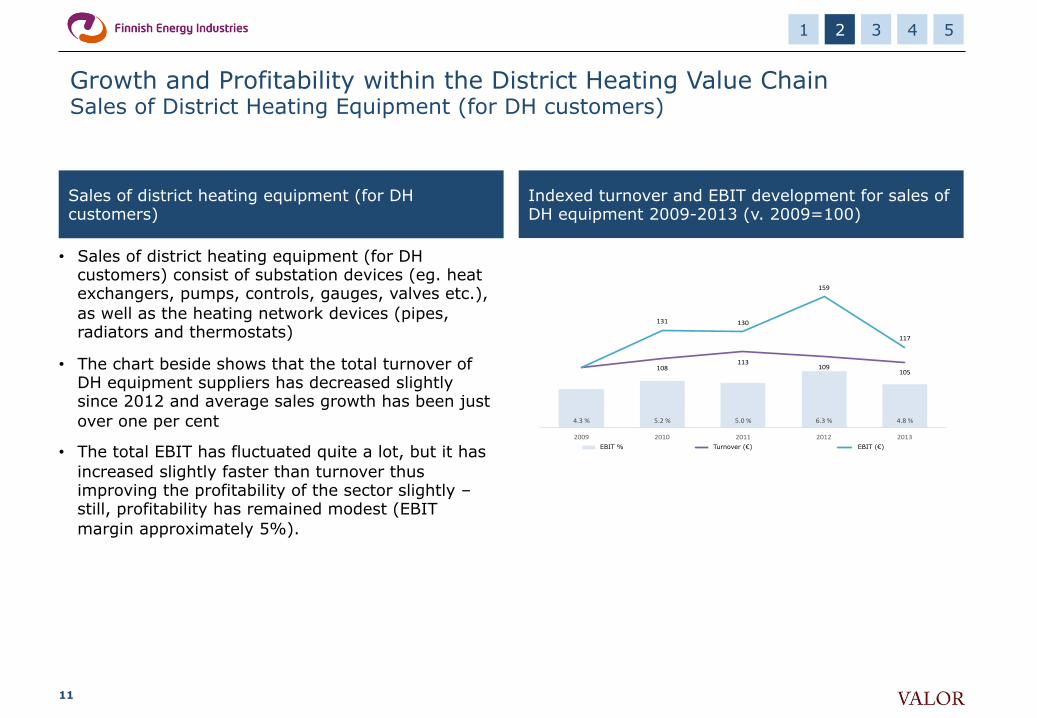
• Sales of district heating equipment (for DH customers) consist of substation devices (eg. heat exchangers, pumps, controls, gauges, valves etc.), as well as the heating network devices (pipes, radiators and thermostats)
• The chart beside shows that the total turnover of DH equipment suppliers has decreased slightly since 2012 and average sales growth has been just over one per cent
• The total EBIT has fluctuated quite a lot, but it has increased slightly faster than turnover thus improving the profitability of the sector slightly – still, profitability has remained modest (EBIT margin approximately 5%).
Indexed turnover and EBIT development for sales of DH equipment 2009-2013 (v. 2009=100)
Sales of district heating equipment (for DH customers)
1 2 3 4 5
4.3$%$ 5.2$%$ 5.0$%$ 6.3$%$ 4.8$%$
108$113$
109$105$
131$ 130$
159$
117$
0.0$%$
2.0$%$
4.0$%$
6.0$%$
8.0$%$
10.0$%$
12.0$%$
14.0$%$
16.0$%$
18.0$%$
20.0$%$
50$
70$
90$
110$
130$
150$
170$
190$
2009$ 2010$ 2011$ 2012$ 2013$Liiketulos$%$ Indeksoitu$liikevaihto$ Indeksoitu$liiketulos$Turnover (€) EBIT % EBIT (€)
12
Growth and Profitability within the District Heating Value Chain Maintenance and Energy Efficiency Services (for DH customers)
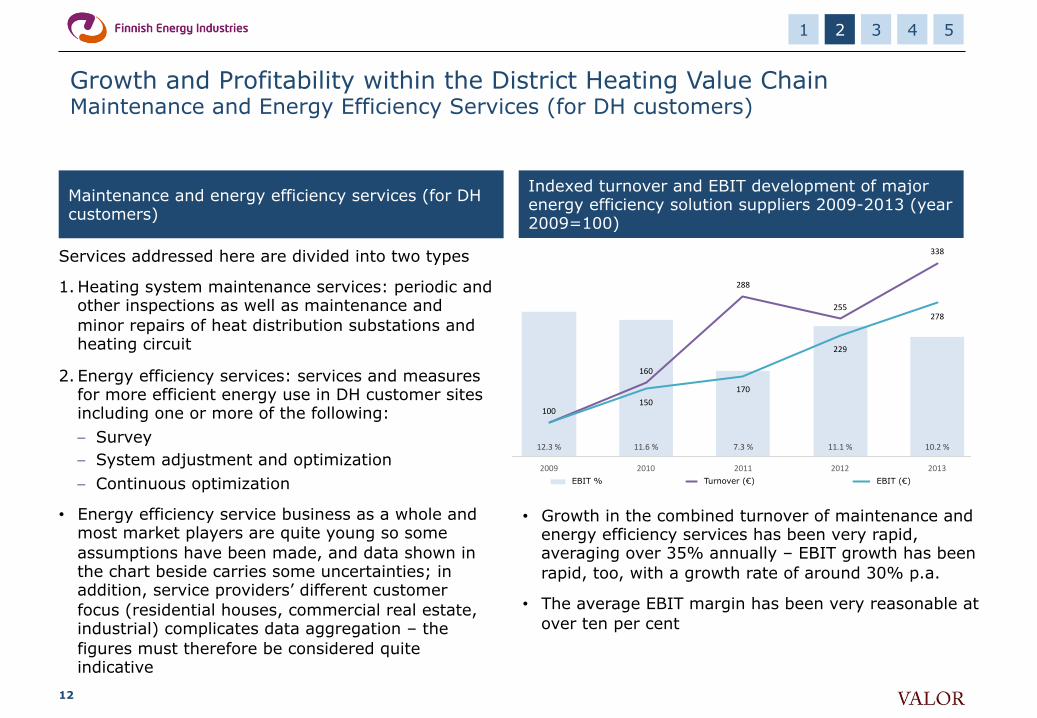
Services addressed here are divided into two types
1. Heating system maintenance services: periodic and other inspections as well as maintenance and minor repairs of heat distribution substations and heating circuit
2. Energy efficiency services: services and measures for more efficient energy use in DH customer sites including one or more of the following: – Survey – System adjustment and optimization – Continuous optimization
• Energy efficiency service business as a whole and most market players are quite young so some assumptions have been made, and data shown in the chart beside carries some uncertainties; in addition, service providers’ different customer focus (residential houses, commercial real estate, industrial) complicates data aggregation – the figures must therefore be considered quite indicative
• Growth in the combined turnover of maintenance and energy efficiency services has been very rapid, averaging over 35% annually – EBIT growth has been rapid, too, with a growth rate of around 30% p.a.
• The average EBIT margin has been very reasonable at over ten per cent
Indexed turnover and EBIT development of major energy efficiency solution suppliers 2009-2013 (year 2009=100)
Maintenance and energy efficiency services (for DH customers)
12.3%%% 11.6%%% 7.3%%% 11.1%%% 10.2%%%
100%
160%
288%
255%
338%
150%170%
229%
278%
0.0%%%
2.0%%%
4.0%%%
6.0%%%
8.0%%%
10.0%%%
12.0%%%
14.0%%%
16.0%%%
18.0%%%
20.0%%%
50%
100%
150%
200%
250%
300%
350%
400%
2009% 2010% 2011% 2012% 2013%Liiketulos%%% Liikevaihdon%kehitys% Liiketuloksen%kehitys%Turnover (€) EBIT % EBIT (€)
1 2 3 4 5

13
Growth and Profitability within the District Heating Value Chain Growth and Profitability of the Business Areas
1 2 3 4 5
!5%$
0%$
5%$
10%$
15%$
20%$
25%$
30%$
35%$
40%$
45%$
0%$ 2%$ 4%$ 6%$ 8%$ 10%$ 12%$ 14%$
Turnover$growth$
Profitability$(EBIT!%)$
Maintenance$and$energy$efficiency$services$
District$HeaJng$business$
Other$services$for$DH$businesses$
DH$networks$construcJon$and$maintenance$
HVAC$planning$and$contracJng$
Real$estate$DH$equipment$suppliers$

14
Growth and Profitability within the District Heating Value Chain Summary
Profitability and its development within the DH value chain
Division of net sales within the district heating value chain (100%=€2,33 billion)
1 2 3 4 5
District'hea+ng'sales,'1,900'
DH'network'construc+on'and'maintenance,'100'
Other'services'for'DH,'35'
HVAC'planning'and'contrac+ng,'
120'
Real'estate'DH'equipment'
suppliers,'150'
Maintenance'and'energy'efficiency'
services,'25'
7%# 8%# 8%# 4%# 5%# 10%#0%#
2%#
4%#
6%#
8%#
10%#
12%#
District#hea4ng#sales#
DH#network#construc4on#and#maintenance#
Other#services#for#DH#
HVAC#planning#and#contrac4ng#
Real#estate#DH#equipment#suppliers#
Maintenance#and#energy#efficiency#
services#
Less$than$)5% )5%$–$)2% )2%$–$+2% +2%$–$+5% Over$5%
Average'annual'growth'(CAGR)

15
Development of Roles and Value Creation within the DH Value Chain Factors Influencing the Development and Value Creation of the Business Areas
• Outside temperature and its distribution inside the year • Energy-efficient construction and renovation of buildings • Growth in energy efficiency services (e.g. heat recovery solutions) • Population growth and regional migration
Sales and distribution of district heating
Construction and maintenance of district heating networks
Other services related to sales and distribution of DH
Services for DH customer sites
• Downturn in new DH network construction • Increase in turn-key contracting • Increasing role of specialised construction/maintenance operators • Slight increase in DH network maintenance and renewal services
• Increased investments in IT systems (e.g. base systems renewal, metered data analysis, digitalisation / customer interfaces and network-related applications)
• Increase in sub-metering
• Diversification of building systems and challenges in their management • General interest in energy efficient and environmentally-friendly services • Increase in energy prices relative to other property-related costs • Rapid growth in remote monitoring/management services grow
1 2 3 4 5

16
Development of Roles and Value Creation within the DH Value Chain Expanding District Heating Company's Role in Customer Sites
DH companies have potential to move in the value chain to provide services to its customers, as long as the DH company has good technical know-how or a networked service business model - the role could be heating equipment checks, adjustments, maintenance and possibly ownership / finance
DH company could take care of the remote monitoring and management of its customers' heating systems as also the DH company would benefit from well-functioning customer equipment, reduced error messages and improved customer satisfaction
Energy efficiency services and measures are a "must" - someone will do it anyway; DH company could provide energy efficiency services themselves or through their partners and at the same time improve their customers' commitment to district heating
DH company could expand its offering and geographical operating area by selling decentralized heating and cooling equipment and services, such as heat pumps, geothermal heat pumps, cooling solutions and heat recovery systems – someone will provide these solutions anyway if the DH company does not
In expanding and shifting their role it is essential for DH companies to have close dialogue and co-operation with their customers, technology vendors, contractors and other service providers
Sum
mar
y of
the
inte
rvie
ws
1 2 3 4 5

17
Development of Roles and Value Creation within the DH Value Chain Summary
The role of housing managers and maintenance companies in real estate services is deteriorating because their expertise in energy management is considered to be limited
The role of a real estate service company is expected to divide into more than one operator, so that traditional real estate service companies will take care of less technical tasks, while more demanding energy related services are bought from other, specialized service providers
The role of HVAC contractors in the development of real estate energy management solutions has grown, while corresponding know-how of architects and HVAC planning is seen limited
The number of energy efficiency service providers has grown, and some providers are considered dubious due to the fact that the energy savings they report are achieved mainly by reducing the residents’ comfort of living (i.e. room temperature)
As holders of their customers’ consumption data, DH companies have substantial potential in utilising the data in different ways
Turn-key procurement is a growing trend in the construction of district heating networks (instead of dedicated services)
Sum
mar
y of
the
inte
rvie
ws
1 2 3 4 5

18
Overall DH Cost Structure from Customer Perspective Summary
• From the customer's point of view, the share of DH energy (including network construction and maintenance services as well as IT and similar costs which the DH company charges from the customer as energy costs) of average customer's total heating costs is 87%
• The share of district heat sales (as a separate item) of the total heating costs is 81% and its share has increased slightly from 2009 to 2013
• The "annualized" costs of the properties’ HVAC planning and construction and DH equipment is 12%
• Maintenance and energy efficiency services have the highest relative growth rate but their share of the entire value chain (and consequently of the average customer's total DH costs) is only 1.2%
Development of overall cost structure of district heating Trends in DH cost structure development
1 2 3 4 5
District'hea+ng'sales,'80%' District'hea+ng'sales,'81%'
DH'network'construc+on'and'maintenance,'4%'
DH'network'construc+on'and'maintenance,'4%'
Other'services'for'DH,'2%' Other'services'for'DH,'2%'
HVAC'planning'and'contrac+ng,'5%'
HVAC'planning'and'contrac+ng,'5%'
Real'estate'DH'equipment'suppliers,'8%'
Real'estate'DH'equipment'suppliers,'7%'
Maintenance'and'energy'efficiency'services,'1%'
Maintenance'and'energy'efficiency'services','1%'
0%'
10%'
20%'
30%'
40%'
50%'
60%'
70%'
80%'
90%'
100%'
2009' 2010' 2011' 2012' 2013'

19
Future of District Heating General Drivers for Change in District Heating Value Chain
1 2 3 4 5
Consolidation of municipalities
Changes in tax policy and other regulation
Increase in obligations and regulatory norms
Downturn in real estate construction
Increase in renovation of buildings
IoT and remote monitoring
Growth in property-specific heating
solutions
Increase in heating related business
concepts
The rise of environmentally-friendly
values
Digitalisation and e-services
Heating service markets
Improvements in real estate energy efficiency
Increase in consumption and other
data related to DH
20
Future of District Heating Expected Development of Roles and Value Creation within the DH Value Chain
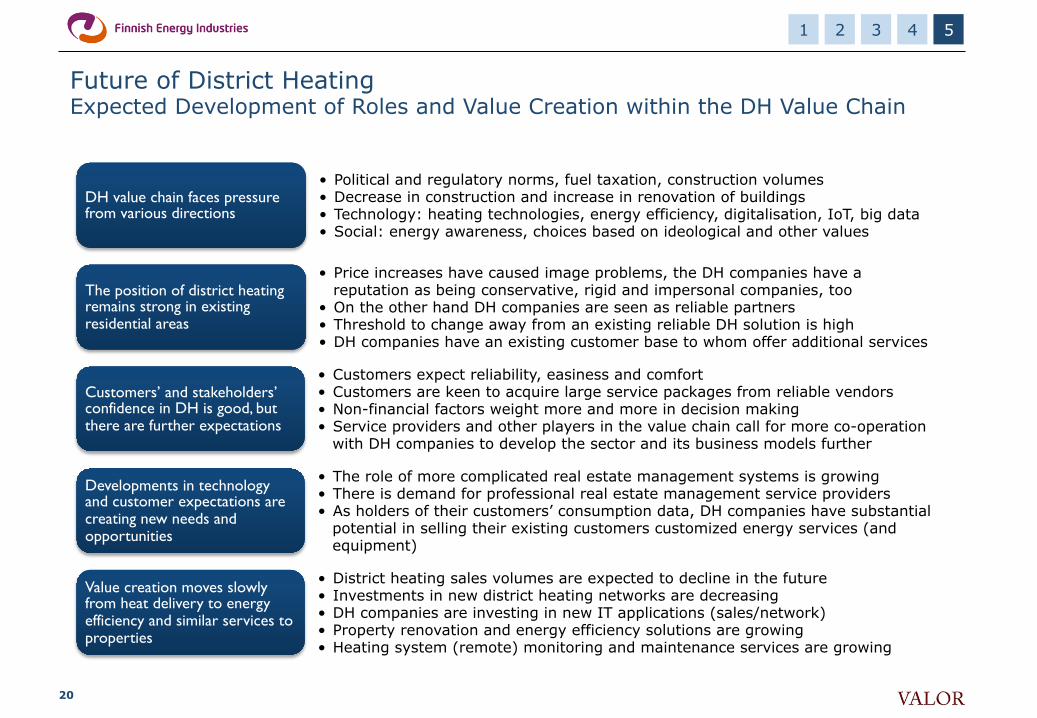
• Political and regulatory norms, fuel taxation, construction volumes • Decrease in construction and increase in renovation of buildings • Technology: heating technologies, energy efficiency, digitalisation, IoT, big data • Social: energy awareness, choices based on ideological and other values
DH value chain faces pressure from various directions
• Price increases have caused image problems, the DH companies have a reputation as being conservative, rigid and impersonal companies, too
• On the other hand DH companies are seen as reliable partners • Threshold to change away from an existing reliable DH solution is high • DH companies have an existing customer base to whom offer additional services
The position of district heating remains strong in existing residential areas
• Customers expect reliability, easiness and comfort • Customers are keen to acquire large service packages from reliable vendors • Non-financial factors weight more and more in decision making • Service providers and other players in the value chain call for more co-operation
with DH companies to develop the sector and its business models further
Customers’ and stakeholders’ confidence in DH is good, but there are further expectations
• The role of more complicated real estate management systems is growing • There is demand for professional real estate management service providers • As holders of their customers’ consumption data, DH companies have substantial
potential in selling their existing customers customized energy services (and equipment)
Developments in technology and customer expectations are creating new needs and opportunities
• District heating sales volumes are expected to decline in the future • Investments in new district heating networks are decreasing • DH companies are investing in new IT applications (sales/network) • Property renovation and energy efficiency solutions are growing • Heating system (remote) monitoring and maintenance services are growing
Value creation moves slowly from heat delivery to energy efficiency and similar services to properties
1 2 3 4 5
21
Future of District Heating Development in Comparable Businesses
1 2 3 4 5
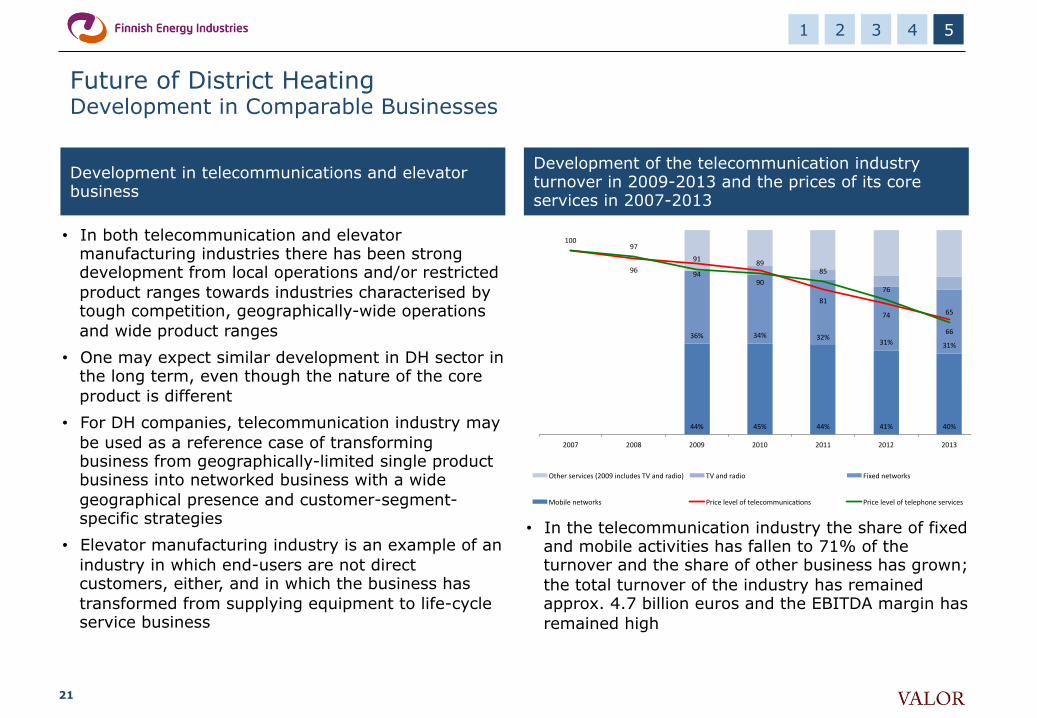
Development of the telecommunication industry turnover in 2009-2013 and the prices of its core services in 2007-2013
Development in telecommunications and elevator business
• In both telecommunication and elevator manufacturing industries there has been strong development from local operations and/or restricted product ranges towards industries characterised by tough competition, geographically-wide operations and wide product ranges
• One may expect similar development in DH sector in the long term, even though the nature of the core product is different
• For DH companies, telecommunication industry may be used as a reference case of transforming business from geographically-limited single product business into networked business with a wide geographical presence and customer-segment-specific strategies
• Elevator manufacturing industry is an example of an industry in which end-users are not direct customers, either, and in which the business has transformed from supplying equipment to life-cycle service business
• In the telecommunication industry the share of fixed and mobile activities has fallen to 71% of the turnover and the share of other business has grown; the total turnover of the industry has remained approx. 4.7 billion euros and the EBITDA margin has remained high
44%# 45%# 44%# 41%# 40%#
36%# 34%# 32%#31%# 31%#
96# 94#90#
81#
74#
66#
100#97#
91# 89#85#
76#
65#
0#
20#
40#
60#
80#
100#
120#
-0.1#
0.1#
0.3#
0.5#
0.7#
0.9#
1.1#
2007# 2008# 2009# 2010# 2011# 2012# 2013#
Other#services#(2009#includes#TV#and#radio)# TV#and#radio## Fixed#networks#
Mobile#networks# Price#level#of#telecommunicaKons# Price#level#of#telephone#services#

Eteläesplanadi 24
00130 Helsinki
www.valor.fi
Pekka Passi Project Manager Tel: +358 40 508 6367 [email protected]
Marko Rytilahti Consultant Tel: +358 45 126 6004 [email protected]
Aappo Kontu Senior Advisor Tel: +358 44 425 2210 [email protected]