valuation of (tech) startups and high growth private companies
TRANSCRIPT

Valuation of (Tech) Startups and high
growth private companies
Vikash Goel
CA, CFA, MS Finance, MBA, IIM-C, Registered Valuer (IBBI)
Author of Handbook on Valuation of Securities and Financial Assets
Director at Omnifin Solutions P Ltd
Vikash Goel | CA, CFA, MS Fin, MBA, Regd Valuer
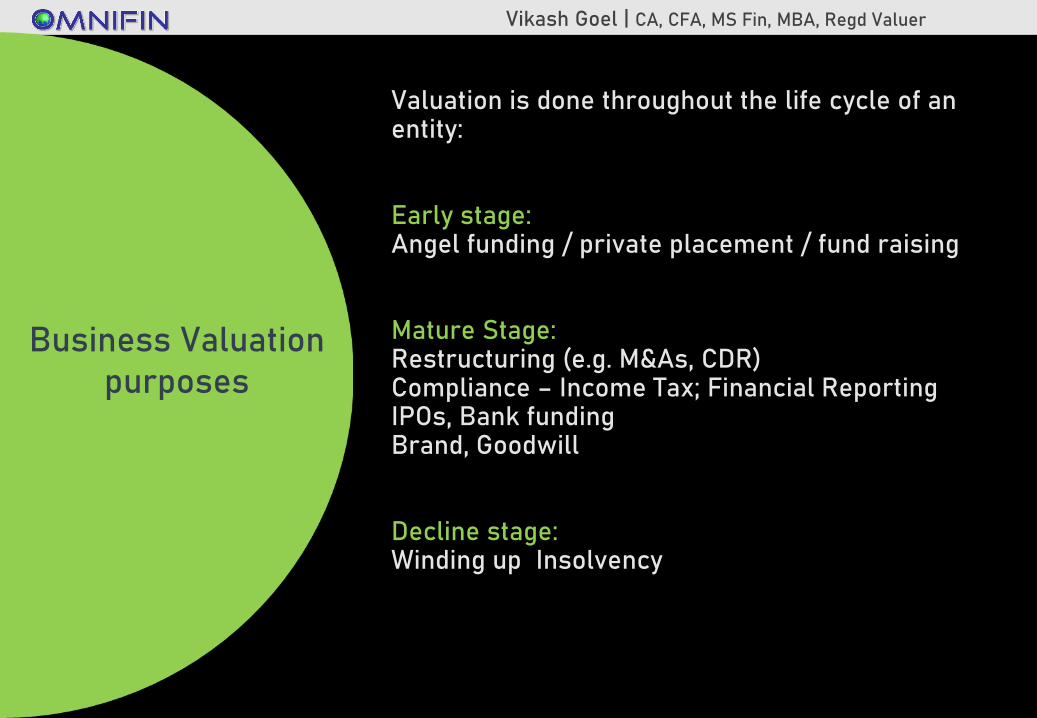
Valuation is done throughout the life cycle of an entity:
Early stage:Angel funding / private placement / fund raising
Mature Stage:Restructuring (e.g. M&As, CDR)Compliance – Income Tax; Financial ReportingIPOs, Bank fundingBrand, Goodwill
Decline stage:Winding up Insolvency
Business Valuation purposes
Vikash Goel | CA, CFA, MS Fin, MBA, Regd Valuer
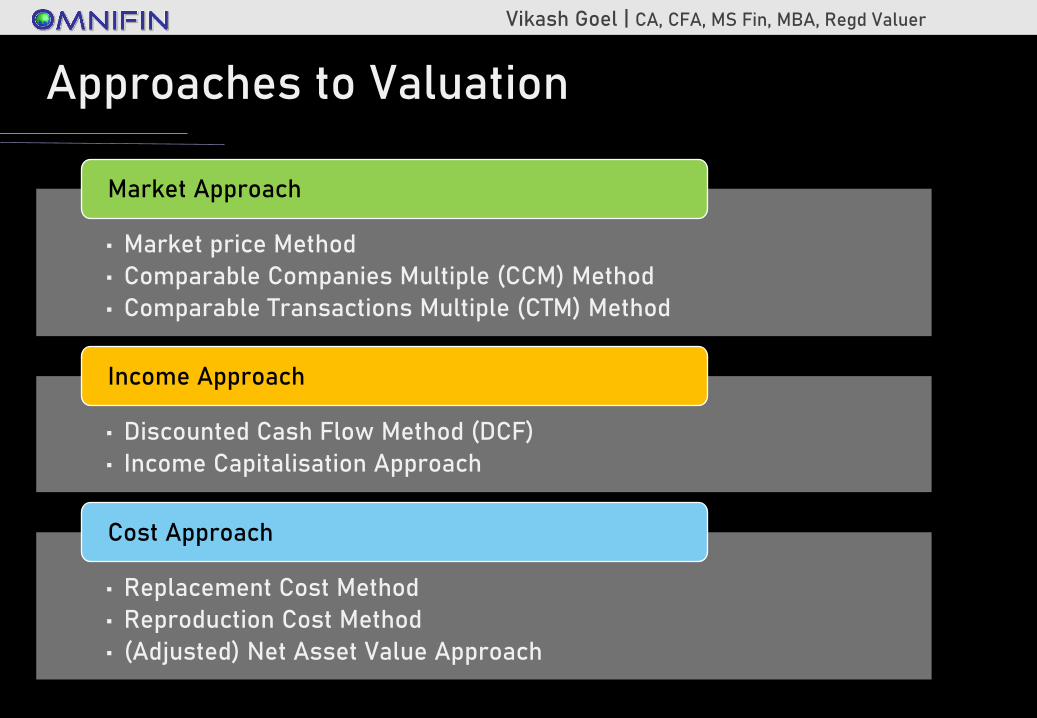
Approaches to Valuation
• Market price Method
• Comparable Companies Multiple (CCM) Method
• Comparable Transactions Multiple (CTM) Method
Market Approach
• Discounted Cash Flow Method (DCF)
• Income Capitalisation Approach
Income Approach
• Replacement Cost Method
• Reproduction Cost Method
• (Adjusted) Net Asset Value Approach
Cost Approach

Vikash Goel | CA, CFA, MS Fin, MBA, Regd Valuer
Early stage companies

Vikash Goel | CA, CFA, MS Fin, MBA, Regd Valuer
Early Stage Companies
• Net Asset Value Method
• Comparable Companies Multiple Method
• Comparable Transactions Method
• Venture Capital Method
• Discounted Cash Flow Method

Vikash Goel | CA, CFA, MS Fin, MBA, Regd Valuer
An entity shall be considered as a Startup:
i. Upto a period of 10 years from the date of incorporation/registration, if it is incorporated as a private limited company or registered as a partnership firm or a limited liability partnership in India. In the case of Startups in the biotechnology sector, the period shall be upto 10 years from the date of its incorporation/ registration.
ii. Turnover of the entity for any of the financial years since incorporation/ registration has not exceeded Rs. 100 crore
iii. Entity is working towards innovation, development or improvement of products or processes or services, or if it is a scalable business model with a high potential of employment generation or wealth creation.
Provided that an entity formed by splitting up or reconstruction of an existing business shall not be considered a ‘Startup’.
Ministry of commerce and industry (department of industrial policy and promotion)
What’s a Start-up

Vikash Goel | CA, CFA, MS Fin, MBA, Regd Valuer
The process of valuing private companies is not different from the process of valuing public companies.
• Estimate cash flows
• Attach a discount rate based upon the riskiness of the cash flows and
• Compute a present value.
Valuation of Start-ups

Vikash Goel | CA, CFA, MS Fin, MBA, Regd Valuer
So what’s different?
Source: Prof Aswath Damodaran

Vikash Goel | CA, CFA, MS Fin, MBA, Regd Valuer
Some of the standard problems while valuing private companies are:
• There is no market value for either debt or equity.
• There may not be enough comparable companies which could representative of the value of the company being valued.
• The financial statements for private firms are likely to: • go back fewer years
• have less detail and
• may even be less transparent.
• Private company valuation may require the valuation of key managerial person (usually the owner/promoter)
So what’s different?

Vikash Goel | CA, CFA, MS Fin, MBA, Regd Valuer
Profits of a company are forecast in a future year, when the company can be expected to go public
The profits are multiplied with the P/E multiple of a comparable publicly traded company to arrive at the value of the company.
This is called the Exit Value or the Terminal Value as this is the time when the venture capitalist would typically exit the investment.
This value is then discounted back to present using a ‘Target Rate of Return’ which is a justifiable discount rate for the venture capitalist based on the risk they are taking
On the flip side, it’s a shortcut way of valuing a company and may not uncover Real Value
Venture Capital Method of Valuation

Vikash Goel | CA, CFA, MS Fin, MBA, Regd Valuer
Example:
A young EdTech company Om Ltd is expected to go public in 10 years from now. The valuer expects that the net profits of the company 10 years from now will be INR 95 crores.
Average PE Multiple of publicly traded EdTech companies is 20. Om Ltd is evaluating fund raising from investors. Investors are expecting 45 percent from the investment until the company goes public.
[Note: VCs expected returns can range from 65-70% returns for an early stage start-up to 25-30% return for a mature start-up looking for an IPO]
Venture Capital Method of Valuation

Vikash Goel | CA, CFA, MS Fin, MBA, Regd Valuer
Example:
A young EdTech company Om Ltd is expected to go public in 10 years from now. The valuer expects that the net profits of the company 10 years from now will be INR 95 crores.
Average PE Multiple of publicly traded EdTech companies is 20. Om Ltd is evaluating fund raising from investors. Investors are expecting 45 percent from the investment until the company goes public.
Solution:
Exit Value = 95 x 20 = INR 1900 Crore
Value of the company today = 1900 / 1.45^10 = INR 46.25 Cr
Venture Capital Method of Valuation

Vikash Goel | CA, CFA, MS Fin, MBA, Regd Valuer
Comparable Companies Multiple Method
Valuation of Flipkart may be done on the basis of its listed comparable Amazon:
Inputs: • Amazon’s Market Capitalisation• Number of users on Amazon
• Number of users on Flipkart
Amazon’s Value per user = Amazon’s Market Cap / No. of users on Amazon
Flipkart Value (base point) = Number of users on Flipkart x Value per user
Possible adjustments include:• Less: Discount for lack of Marketability [DLOM]
• Less: Amazon’s global diversity• Less: Product diversification
• Adjustment for Currency differences
• Adjustment for Country specific factors [US Growth vs India growth]

Vikash Goel | CA, CFA, MS Fin, MBA, Regd Valuer
Valuing Flipkart
Amazon = Market Capitalisation
Number of Users on Amazon.
Value Driver: Value per user (ValuePU) = Market Cap / No. of users.
Flipkart Value = Number of users (given by Flipkart) x ValuePU
Adjustment for:
• Marketability [Listed vs Unlisted]
• Country specific growth factors – US Growth vs India growth
• Global presence
• Product diversification
• Currency differences
Valuing using Operating Value Drivers

Vikash Goel | CA, CFA, MS Fin, MBA, Regd Valuer
Year 2014, Valuation of a Text Messaging App ChatApp with 1.6 million users. The company does not report any revenues.
Valuing using Operating Value Drivers
Value as per Comparable Transactions Method AMOUNT
Enterprise Value of WhatsApp (USD) as part of acquisition 19,000,000,000
Daily Active Users of WhatsApp 450,000,000
Value per Daily Active User (USD) 42.22
Exchange Rate 70.00
Value per Daily Active User (INR) 2,955.56
Less: Adjustment for Size (99.64%) [Requires discussion] 2,945.05
Adjusted value per Daily Active User (A) 10.51
Daily Active Users of CHATAPP (B) 16,00,000
Value of CHATAPP (A) x (B) 1,68,13,852
Value of CHATAPP (Rounded) INR 1.68 Cr

Vikash Goel | CA, CFA, MS Fin, Regd Valuer
DCF Valuation Framework

Vikash Goel | CA, CFA, MS Fin, MBA, Regd Valuer
The cash flow can be pre-tax or post-tax
Nominal cash flows that include expectations regarding inflation
In the same currency in which the forecast is prepared
Accounting Profit
Add: Non Cash Expenses (e.g. Depreciation and Amortisation)
Less: Outflow towards Capital Expenditure (Change in Gross Fixed Assets)
Less: Outflow towards Working Capital (Change in Non Cash Working Capital)
Equals Cash Flows
DCF Framework – Free Cash Flows

Vikash Goel | CA, CFA, MS Fin, MBA, Regd Valuer
Free Cash Flows represent the after tax cash generated by the business, available for all the investors (stockholders and banks), excluding any impact of the financial structure.
DCF Framework – Free cash flows
Profit After TaxAdd: Non Cash Charges (E.g. Depreciation)Less: Capital ExpenditureLess: Changes in Working Capital(Excl Cash)Add: Interest (post of tax)Free Cash flows to the Firm (FCFF)Discounted at WACCValue of the Firm (Company)Less: Debt (Current Value)Value of Equity
Profit After TaxAdd: Non Cash Charges (E.g. Depreciation)Less: Capital ExpenditureLess: Changes in Working Capital (Excl Cash)Add: Net Borrowings (Long Term)Free Cash flows to Equity (FCFE)Discounted at Cost of EquityValue of Equity
FCFE FCFF
NB: We prefer FCFF approach when FCFE is negative or when capital structure is unstable

Vikash Goel | CA, CFA, MS Fin, MBA, Regd Valuer
Get as close to precise information as possible
Due Diligence is key
Check for personal expenses charged to business
Check for fictitious sales
Evaluate Revenue Models (Gross vs Net)
Consider Three Stage Model to factor in multiple stages in life cycle
Factor in the issue of scaling
Reaching 1000 vs 100,000 > 10,000,000 Users
Free vs Paid Users
Renewals – a big concern
DCF Framework – Key Issues

Vikash Goel | CA, CFA, MS Fin, MBA, Regd Valuer
Multiple Equity Claims
Multiple rounds of equity dilute stake and complicate valuation
Sustained competitive advantage
Fly by night companies vs Marathon runners
Revenue vs Profit
Check for positive contribution or EBITDA
Carefully assess risk parameters and discount rates.
Assess Beta
Estimate the probability of default
Value = PGoing concern x DCFValue Going Concern + (1 - PGoing concern) x Liquidation Value
DCF Framework – Key Issues
Vikash Goel | CA, CFA, MS Fin, MBA, Regd Valuer
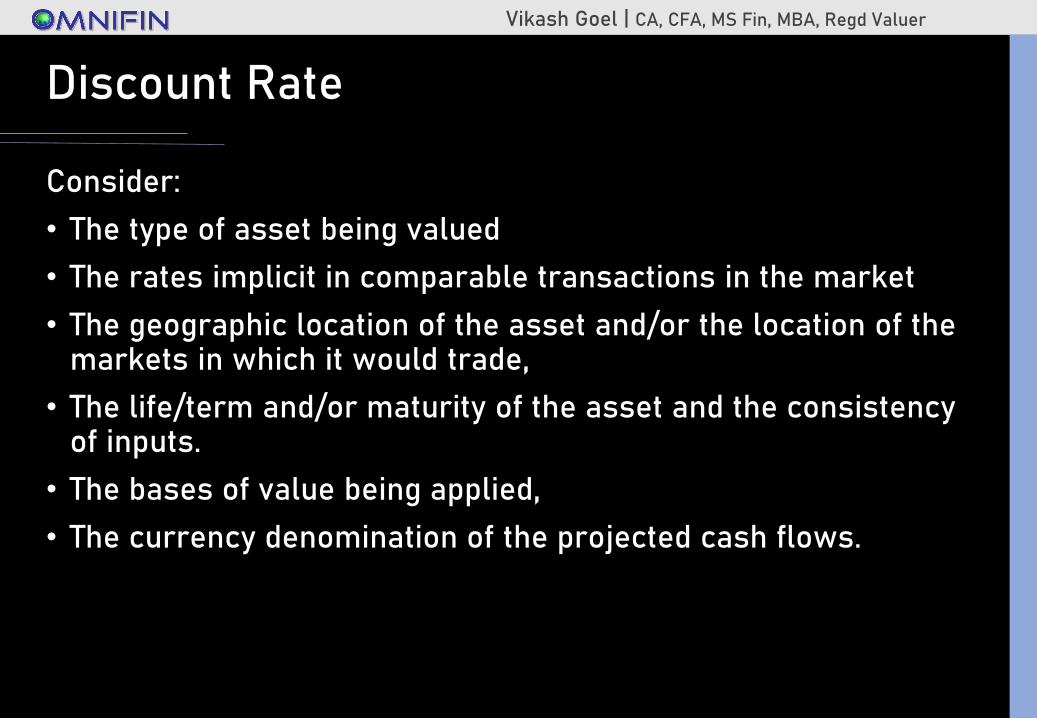
Consider:
• The type of asset being valued
• The rates implicit in comparable transactions in the market
• The geographic location of the asset and/or the location of the markets in which it would trade,
• The life/term and/or maturity of the asset and the consistency of inputs.
• The bases of value being applied,
• The currency denomination of the projected cash flows.
Discount Rate

Vikash Goel | CA, CFA, MS Fin, MBA, Regd Valuer
DCF Framework - Cost of Capital (WACC or Kc)
Cost of Capital (Kc) represents the cost of funds used for financing the business. It is the rate of return that the suppliers of capital—bondholders and owners—require as compensation for their contributions of capital.
• If business is financed solely through Equity, Kc is the same as Cost of Equity (Ke)
• If business is financed solely through Debt, Kc is the same as Cost of Debt (Kd)
• Usually companies use a mix of Debt and Equity while financing their business, thus the overall cost of capital is derived from a weighted average of cost of all capital sources, known as the Weighted Average Cost of Capital (WACC)
Cost of capital represents a minimum benchmark rate that a company must overcome before it can generate value for its financers.
Discount rate for FCFE: Cost of Equity (Ke)
Discount rate for FCFF: Cost of Capital (WACC)
Vikash Goel | CA, CFA, MS Fin, MBA, Regd Valuer
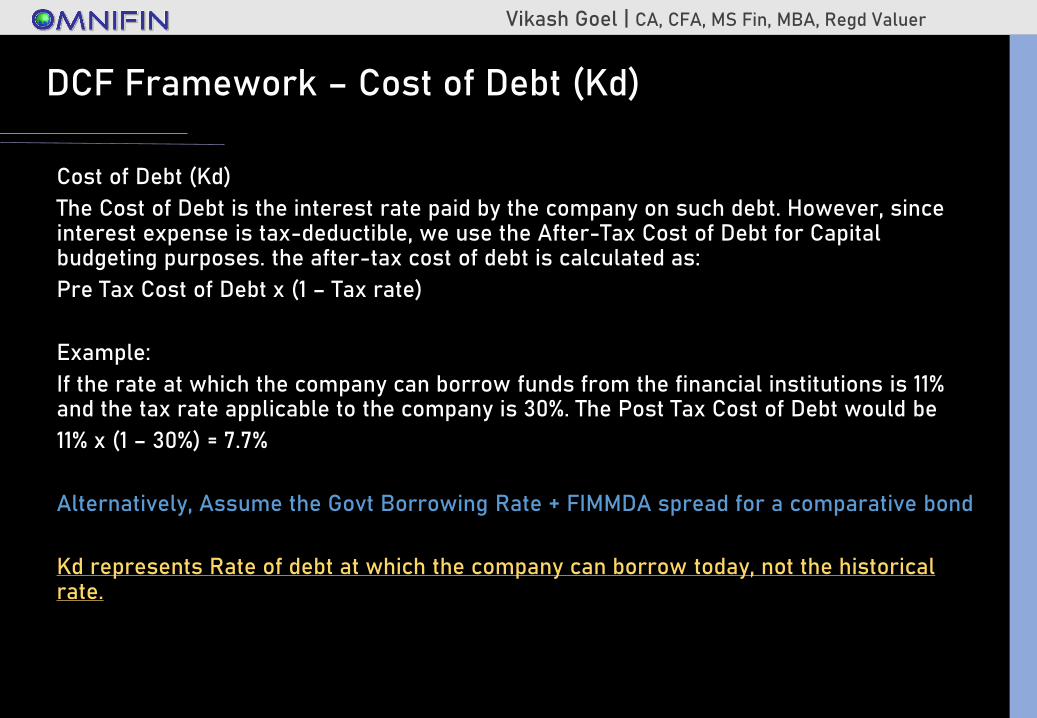
Cost of Debt (Kd)
The Cost of Debt is the interest rate paid by the company on such debt. However, since interest expense is tax-deductible, we use the After-Tax Cost of Debt for Capital budgeting purposes. the after-tax cost of debt is calculated as:
Pre Tax Cost of Debt x (1 – Tax rate)
Example:
If the rate at which the company can borrow funds from the financial institutions is 11% and the tax rate applicable to the company is 30%. The Post Tax Cost of Debt would be
11% x (1 – 30%) = 7.7%
Alternatively, Assume the Govt Borrowing Rate + FIMMDA spread for a comparative bond
Kd represents Rate of debt at which the company can borrow today, not the historical rate.
DCF Framework – Cost of Debt (Kd)

Vikash Goel | CA, CFA, MS Fin, MBA, Regd Valuer
Although the rate of return demanded by equity investors is not as clearly defined as it is by lenders, equity investors do expect a return on their investment. Cost of equity is approximated by the Capital Asset Pricing Model (CAPM).
Cost of Equity = Risk Free Rate + Beta x Market Risk Premium
Risk Free Rate: a return on an investment that has least likelihood of default e.g. 10 Year Government Bond Yield
Company’s Beta: Sensitivity of stock return with respect to the market return e.g. if beta is 1.8 and the market is expected to move up by 10%, then the stock should move up by 18% (1.8 x 10) [Cov / Var]
Market Risk Premium: Risk premium is what a particular market (E.g. BSE Sensex) earned over the rate that a risk free asset (e.g. Govt bond) earned. i.e. [Market Return – Risk Free Rate of Return]
DCF Framework – Cost of Equity (Ke)

Vikash Goel | CA, CFA, MS Fin, MBA, Regd Valuer
Since the companies are not traded, the ideal approach is to take a proxy beta of a closest listed competitor and adjust the beta for the company being valued. For adjustment, the proxy beta should be “unlevered” using the average debt-to-equity ratio for the proxy company (or the average industry D/E Ratio). The final step is re-levering beta, using private company’s target debt/equity ratio.
Example: Beta of a private company Om Ltd can be assessed based on the following information.
Average Beta of comparable listed companies = 1.64 (Levered Beta)
Average D/E Ratio of comparable listed companies = 0.34
Tax Rate = 30%
Target D/E Ratio of Om Ltd = 0.5
Unlevered Beta = Levered Beta / (1 + (1 – Tax Rate) x D/E ratio)
= 1.64 / (1+(1-0.3) x 0.34) = 1.32
Levered Beta = Unlevered beta x (1 + (1 – tax rate) x Target D/E Ratio)
= 1.32 x (1+(1-.3) x 0.5) = 1.78
DCF Framework – Beta
Vikash Goel | CA, CFA, MS Fin, MBA, Regd Valuer
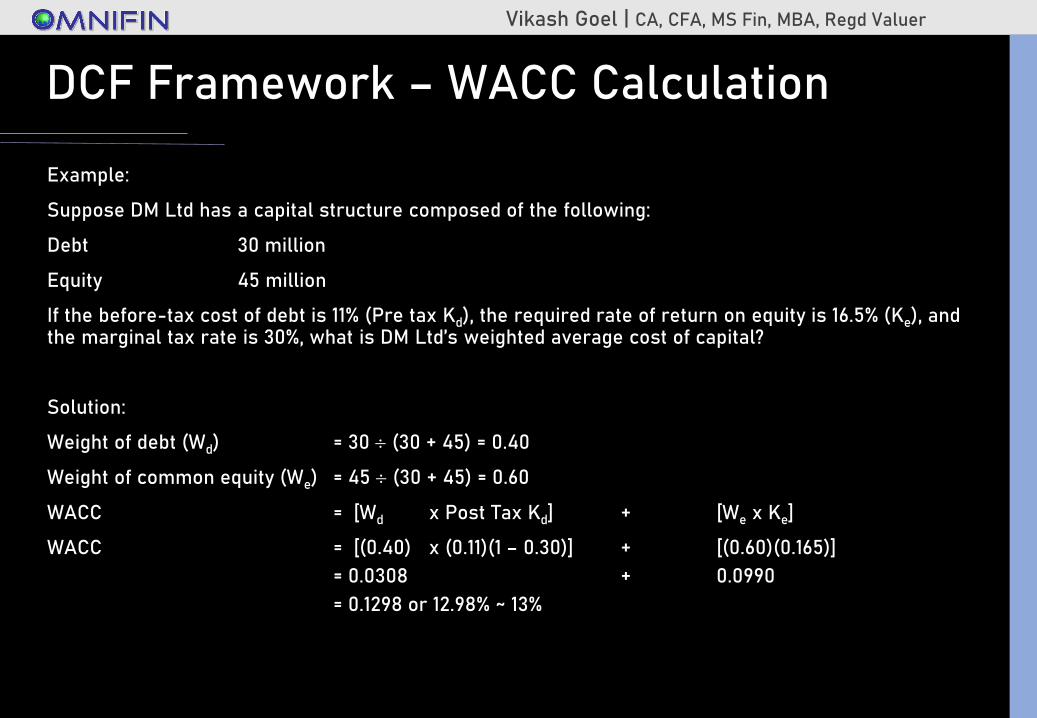
Example:
Suppose DM Ltd has a capital structure composed of the following:
Debt 30 million
Equity 45 million
If the before-tax cost of debt is 11% (Pre tax Kd), the required rate of return on equity is 16.5% (Ke), and the marginal tax rate is 30%, what is DM Ltd’s weighted average cost of capital?
Solution:
Weight of debt (Wd) = 30 (30 + 45) = 0.40
Weight of common equity (We) = 45 (30 + 45) = 0.60
WACC = [Wd x Post Tax Kd] + [We x Ke]
WACC = [(0.40) x (0.11)(1 – 0.30)] + [(0.60)(0.165)]
= 0.0308 + 0.0990
= 0.1298 or 12.98% ~ 13%
DCF Framework – WACC Calculation

Vikash Goel | CA, CFA, MS Fin, MBA, Regd Valuer
What if there is no listed comparable at all?
Size Risk: In case assessment of Beta of a private company is difficult due to absence in different capital structure information, an alternative may be to use the industry beta as a proxy and use a Size Risk to enhance the overall cost of Equity. This risk may not be factored into the Beta and thus may be added as an additional risk.
DCF Framework – Beta
Vikash Goel | CA, CFA, MS Fin, MBA, Regd Valuer
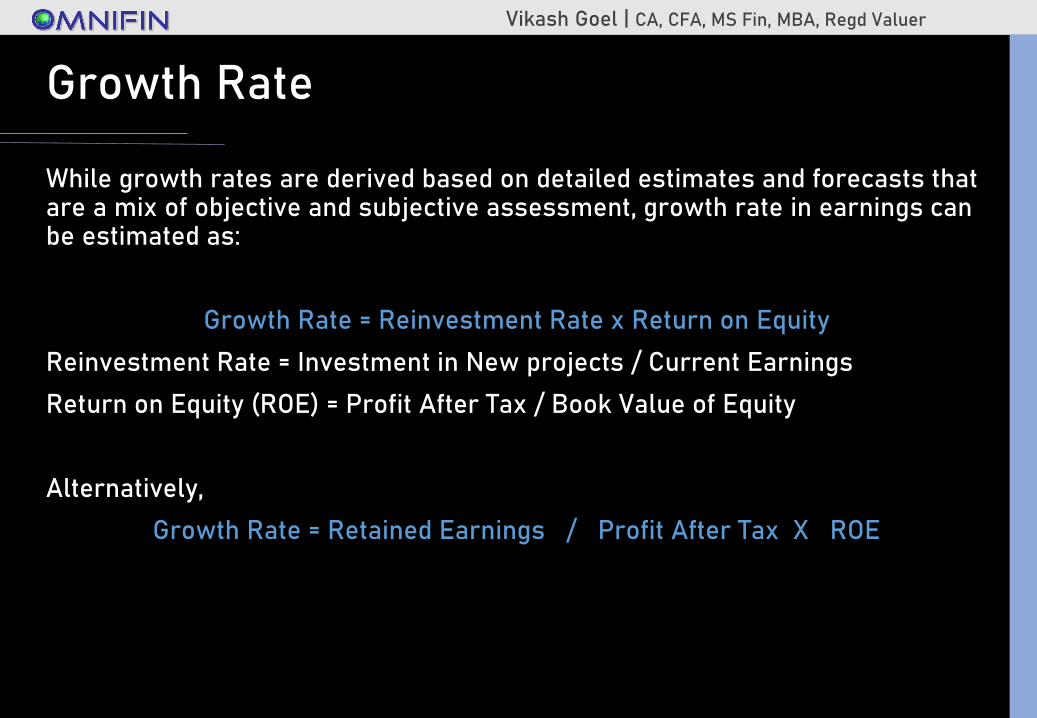
Growth Rate
While growth rates are derived based on detailed estimates and forecasts that are a mix of objective and subjective assessment, growth rate in earnings can be estimated as:
Growth Rate = Reinvestment Rate x Return on Equity
Reinvestment Rate = Investment in New projects / Current Earnings
Return on Equity (ROE) = Profit After Tax / Book Value of Equity
Alternatively,
Growth Rate = Retained Earnings / Profit After Tax X ROE
Vikash Goel | CA, CFA, MS Fin, MBA, Regd Valuer
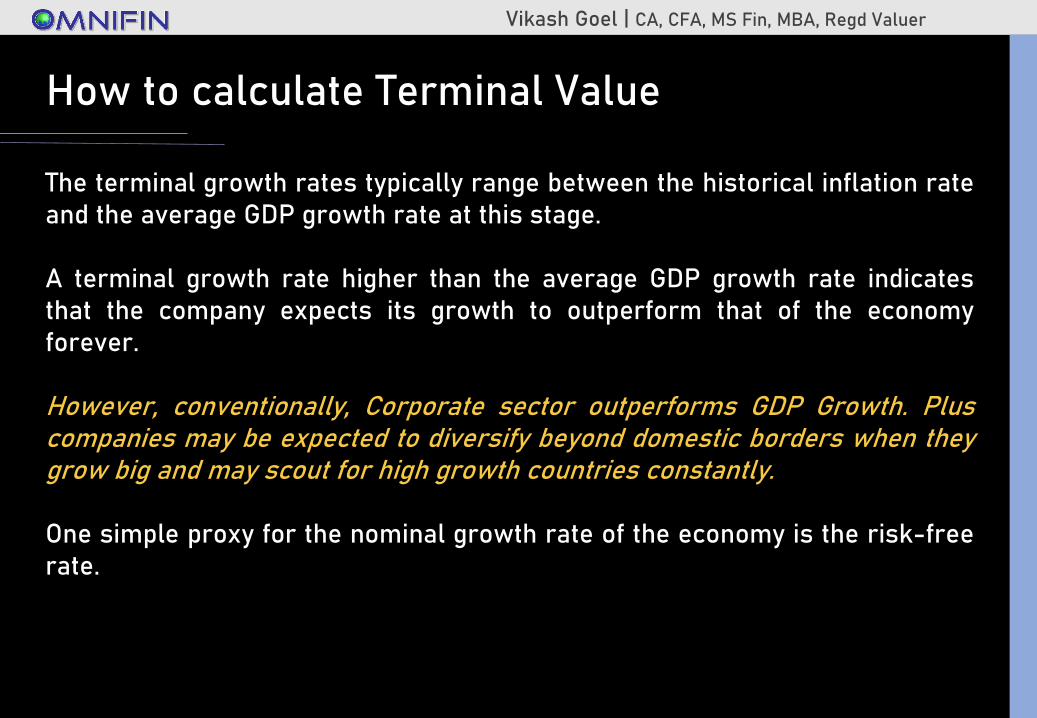
How to calculate Terminal Value
The terminal growth rates typically range between the historical inflation rateand the average GDP growth rate at this stage.
A terminal growth rate higher than the average GDP growth rate indicatesthat the company expects its growth to outperform that of the economyforever.
However, conventionally, Corporate sector outperforms GDP Growth. Pluscompanies may be expected to diversify beyond domestic borders when theygrow big and may scout for high growth countries constantly.
One simple proxy for the nominal growth rate of the economy is the risk-freerate.

Vikash Goel | CA, CFA, MS Fin, MBA, Regd Valuer
How to calculate Terminal Value
Common methods
• Gordon growth model/constant growth model - appropriate only forindefinite-lived assets
• Market Approach/Exit Value - appropriate for both deteriorating/finite-lived assets and indefinite-lived assets, and
• Salvage Value/Disposal Cost - appropriate only for deteriorating/ finite-lived assets.
• No growth Company Terminal Value = Cash flow for next Year / Discountrate
• Stable Growth Company Terminal Value = Cash flow for next Year /(Discount rate – Growth Rate)
Vikash Goel | CA, CFA, MS Fin, MBA, Regd Valuer
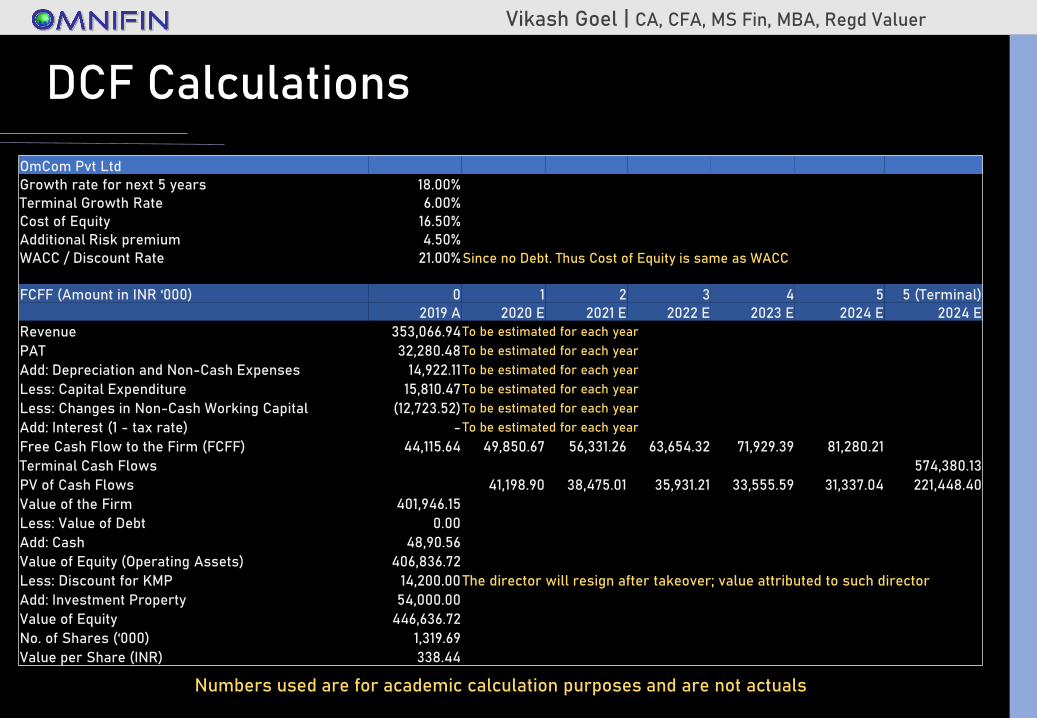
OmCom Pvt Ltd Growth rate for next 5 years 18.00%Terminal Growth Rate 6.00%Cost of Equity 16.50%Additional Risk premium 4.50%WACC / Discount Rate 21.00%Since no Debt. Thus Cost of Equity is same as WACC
FCFF (Amount in INR ‘000) 0 1 2 3 4 5 5 (Terminal)2019 A 2020 E 2021 E 2022 E 2023 E 2024 E 2024 E
Revenue 353,066.94 To be estimated for each year
PAT 32,280.48 To be estimated for each year
Add: Depreciation and Non-Cash Expenses 14,922.11 To be estimated for each year
Less: Capital Expenditure 15,810.47 To be estimated for each year
Less: Changes in Non-Cash Working Capital (12,723.52)To be estimated for each year
Add: Interest (1 - tax rate) -To be estimated for each year
Free Cash Flow to the Firm (FCFF) 44,115.64 49,850.67 56,331.26 63,654.32 71,929.39 81,280.21
Terminal Cash Flows 574,380.13
PV of Cash Flows 41,198.90 38,475.01 35,931.21 33,555.59 31,337.04 221,448.40
Value of the Firm 401,946.15
Less: Value of Debt 0.00
Add: Cash 48,90.56
Value of Equity (Operating Assets) 406,836.72
Less: Discount for KMP 14,200.00The director will resign after takeover; value attributed to such director
Add: Investment Property 54,000.00
Value of Equity 446,636.72
No. of Shares (‘000) 1,319.69
Value per Share (INR) 338.44
DCF Calculations
Numbers used are for academic calculation purposes and are not actuals

Vikash GoelOmnifin Solutions
www.investmentvaluation.inwww.omnifin.in
For Valuation enquiries, [email protected]
THANK YOU