validity of inertial sensor based 3d joint kinematics of
TRANSCRIPT

RESEARCH ARTICLE
Validity of inertial sensor based 3D joint
kinematics of static and dynamic sport and
physiotherapy specific movements
Wolfgang TeuflID1,2*, Markus Miezal1, Bertram Taetz1, Michael FrohlichID
2,
Gabriele Bleser1
1 Department of Computer Science, Technische Universitat Kaiserslautern, Kaiserslautern, Germany,
2 Department of Sport Science, Technische Universitat Kaiserslautern, Kaiserslautern, Germany
Abstract
3D joint kinematics can provide important information about the quality of movements. Opti-
cal motion capture systems (OMC) are considered the gold standard in motion analysis.
However, in recent years, inertial measurement units (IMU) have become a promising alter-
native. The aim of this study was to validate IMU-based 3D joint kinematics of the lower
extremities during different movements. Twenty-eight healthy subjects participated in this
study. They performed bilateral squats (SQ), single-leg squats (SLS) and countermovement
jumps (CMJ). The IMU kinematics was calculated using a recently-described sensor-fusion
algorithm. A marker based OMC system served as a reference. Only the technical error
based on algorithm performance was considered, incorporating OMC data for the calibra-
tion, initialization, and a biomechanical model. To evaluate the validity of IMU-based 3D
joint kinematics, root mean squared error (RMSE), range of motion error (ROME), Bland-
Altman (BA) analysis as well as the coefficient of multiple correlation (CMC) were calcu-
lated. The evaluation was twofold. First, the IMU data was compared to OMC data based on
marker clusters; and, second based on skin markers attached to anatomical landmarks.
The first evaluation revealed means for RMSE and ROME for all joints and tasks below 3˚.
The more dynamic task, CMJ, revealed error measures approximately 1˚ higher than the
remaining tasks. Mean CMC values ranged from 0.77 to 1 over all joint angles and all tasks.
The second evaluation showed an increase in the RMSE of 2.28˚– 2.58˚ on average for all
joints and tasks. Hip flexion revealed the highest average RMSE in all tasks (4.87˚– 8.27˚).
The present study revealed a valid IMU-based approach for the measurement of 3D joint
kinematics in functional movements of varying demands. The high validity of the results
encourages further development and the extension of the present approach into clinical
settings.
PLOS ONE | https://doi.org/10.1371/journal.pone.0213064 February 28, 2019 1 / 18
a1111111111
a1111111111
a1111111111
a1111111111
a1111111111
OPEN ACCESS
Citation: Teufl W, Miezal M, Taetz B, Frohlich M,
Bleser G (2019) Validity of inertial sensor based 3D
joint kinematics of static and dynamic sport and
physiotherapy specific movements. PLoS ONE 14
(2): e0213064. https://doi.org/10.1371/journal.
pone.0213064
Editor: John Leicester Williams, University of
Memphis, UNITED STATES
Received: August 13, 2018
Accepted: February 14, 2019
Published: February 28, 2019
Copyright: © 2019 Teufl et al. This is an open
access article distributed under the terms of the
Creative Commons Attribution License, which
permits unrestricted use, distribution, and
reproduction in any medium, provided the original
author and source are credited.
Data Availability Statement: All relevant data are
within the manuscript and its Supporting
Information files. A detailed description of the IMU
to segment calibration method, the rigid
transformation of IMU to rigid marker cluster, the
initialization process and the joint angle calculation
is accessible on protocols.io via the DOI dx.doi.org/
10.17504/protocols.io.vwye7fw. The additional
Bland-Altman plots of the hip, knee and ankle joint
and pelvis global 3D motion of both evaluation
methods is accessible on protocols.io under the
DOI: dx.doi.org/10.17504/protocols.io.sj4ecqw.

1 Introduction
The assessment of functional movements has become an important part of physical therapy and
the practice of sports medicine [1]. Functional movement, or fundamental movement, describes
a kind of complex 3D movement along several jointsand the incorporating muscle synergies.
Three functional movements used for analysis in these professions are the bilateral squat (SQ)
[2], the single-leg squat (SLS) [3,4], and the countermovement jump (CMJ) [5,6]. These func-
tional movements can provide information about rehabilitation status or injury risks [7,8]. It is
not only important to assess the movement performance (e.g., speed, repetitions, jump height,
etc.), but also how the movement is executed. The joint kinematics recorded during functional
movements can reveal information about the correctness of the movement. Optical motion cap-
ture systems (OMC) are commonly used to evaluate joint kinematics [9]. However, OMC sys-
tems do not always allow the subject to move in his/her accustomed environment. In this
context, inertial measurement units (IMU) present a local independent alternative [10], and
their use has been widely accepted. A single IMU has been used to examine the horizontal and
vertical displacement of the pelvis during a CMJ [11], to evaluate kinetic data from three differ-
ent jumping tasks [12], and to assess the performance of a CMJ [13]. The 3D joint kinematics of
the hip and ankle, as well as the 1D joint kinematics of the knee during a SLS, were evaluated
using a set of three IMU’s attached to the pelvis, thigh and shank [7]. However, some of these
studies only used one IMU and focused only on performance measures [11–13]. Others exam-
ined joint kinematics but did not compare their results to a reference system [7].
The accuracy of IMU-based joint kinematics, or spatio-temporal parameters, have been
examined in several studies on gait analysis [14–18]. Despite the increasing application of
IMU’s the availability of validity studies regarding the measurement of 3D joint kinematics in
functional movements is limited. Al-Amri et al. [14] examined the reliability and validity of
SQ and vertical jumping 3D joint kinematics of the lower extremity. However, they failed to
report detailed results concerning the validity of the transversal and frontal plane joint kine-
matics. Robert-Lachaine et al. [19] evaluated the accuracy of full body joint kinematics during
ergonomic tasks. However, IMU’s aim to be used in rehabilitation and sports medicine. The
functional movements mentioned above differ from common gait inasmuch as they incorpo-
rate almost no global translation, usually demand higher ranges of motion (ROM) and, in the
case of the CMJ, higher global accelerations. Thus, the validity of IMU-based 3D joint kine-
matics of slow and dynamic functional movements has to be further investigated.
A recently described sensor-fusion algorithm for the estimation of 3D IMU kinematics
[20,21] revealed long-term stable results of the joint kinematics estimation of the lower extremi-
ties in a gait analysis [18]. These results proved to be unaffected by drift, despite omitting magne-
tometer information. Based on those results, the primary aim of this study was to evaluate the
performance of this algorithm in estimating 3D joint kinematics in dynamic, clinically-relevant
movements with high ROM. As in [18], this evaluation focuses on the technical differences
between IMU- and OMC-based joint kinematics associated to algorithmic issues. Thus, the IMU
initialization, calibration, and the biomechanical model were derived from the OMC system.
Like optical markers, IMU’s are prone to artefacts caused by the displacement of the sensor
and that of the underlying tissue with respect to the bone [22]. These artefacts are commonly
referred to as soft tissue artefacts (STA). The effect of STA on OMC- and IMU-based joint
kinematics [9,23–25] and possible compensation mechanisms [26–29] have been intensively
examined in the recent literature. It was an objective of the present study to minimize the dif-
ferences between the two systems associated to STA. Researchers use rigid marker clusters
(RMC) affixed to the IMU for the calculation of OMC-based joint kinematics to achieve this
goal [11,17,19]. The alternative calculation of OMC-based joint kinematics involves skin
Validity of inertial sensor based 3D joint kinematics of static and dynamic movements
PLOS ONE | https://doi.org/10.1371/journal.pone.0213064 February 28, 2019 2 / 18
Funding: This work was performed by the
interdisciplinary Junior Research Group
wearHEALTH, funded by the Federal Ministry of
Education and Research (BMBF), Grant numbers:
16SV7115 to GB, and 03IHS075B to GB. For more
information, please visit the website www.
wearhealth.org. The fundershad no role in study
design, data collection and analysis, decision to
publish, or preparation of the manuscript.
Competing interests: The authors have declared
that no competing interests exist.
markers attached to anatomical landmarks. Examinations have shown that the OMC-based
joint kinematics derived from RMC are less susceptible to errors caused by STA than markers
mounted on bony prominences [30]. However, both methods are commonly used in research
as well as clinical settings. Furthermore, few studies have reported results that compare IMU
joint kinematics with OMC joint kinematics based on skin markers attached to anatomical
landmarks [14,16,31].
Therefore, the second aim of the study was to compare IMU-based joint kinematics with
OMC- based joint kinematics derived from skin markers attached to anatomical landmarks
instead of RMC.
2 Methods and materials
2.1 Subjects and data acquisition
Twenty-eight healthy subjects (15 females, 13 males; 24 ± 2.70 years; 70 ± 12.70 kg; 176 ± 9.00
cm) participated in the study. The subjects were recruited via e-mail, bulletins, and presenta-
tions in specific lectures at the local university. The study was approved by the local ethical
committee of the Technische Universitat Kaiserslautern (TUK) and meets the criteria of the
declaration of Helsinki. After receiving all relevant study information, the participants signed
an informed consent to the study including a permission to publish the data. A test session
consisted of one static neutral zero position (n-pose) sequence [32]; three trials of five, right-
legged SLS; three trials of five SQ; and, three trials of three CMJ. A SLS and SQ cycle was
defined as the time from maximum knee extension to the next maximum knee extension. A
CMJ cycle was defined as the time from the first downward movement of the pelvis marker
until it reached the next static phase. Every SLS, SQ, and CMJ considered for evaluation was
normalized to 100% movement cycle.
OMC lower extremity 3D joint kinematics was captured using OptiTrack Motive 1.10 (Nat-
uralPoint, Inc., Oregon, USA). IMU raw data was recorded by means of seven Xsens MTw
Awinda IMU and Xsens MVN Biomech software version 4.3.7 (Xsens Technologies BV,
Enschede, Netherlands). Both systems were synchronized and recorded at 60 Hz.
All IMU’s were activated 20 minutes prior to each test session and before the subjects were
instrumented. Before testing, a static trial was conducted by laying all IMU’s on the ground for
about 10 seconds. These measurements were used to estimate and subtract the gyroscope bias
according to [33].
Thirty-two retroreflective markers were attached to anatomical landmarks according to
[34]. Six additional markers were applied following the OptiTrack recommendations. Each
IMU was inserted into a matching 3D printed box equipped with four retroreflective markers
(Fig 1). These boxes were attached to the body segments of the lower extremities using straps
and double-sided adhesive tape. The IMU and RMC for the thigh and shank were placed
according to recommendations by Manal et al. [35,36]. The IMU and RMC attached to the pel-
vic segment was placed on top of the sacrum according to Cutti et al. [37]. The IMU and RMC
for the feet could only be placed on the dorsum of the foot due to their size and visibility. Sche-
matic marker protocol and IMU placement are shown in Fig 2.
To exclude possible errors in the IMU-derived data based on different coordinate systems,
calibration, or the initialization process, the biomechanical model [34] and IMU-to-segment
calibrations were calculated based on the OMC data of the recorded n-pose sequence. Addi-
tionally, the initialization of the IMU-based kinematics estimation incorporated data from the
OMC system.
The IMU raw data was processed with a sensor-fusion algorithm using an iterated extended
Kalman Filter (EKF) approach based on [20] and enhanced with global translation estimation
Validity of inertial sensor based 3D joint kinematics of static and dynamic movements
PLOS ONE | https://doi.org/10.1371/journal.pone.0213064 February 28, 2019 3 / 18

[21] that used only accelerometer and gyroscope data; magnetometer information was omit-
ted. The complete algorithm is described in [18]. The same filter settings and tuning parame-
ters that are described in [18] were used in this study. The estimated segment orientations
were used to derive relative joint orientations. These were decomposed into joint angles using
Euler angle decomposition [38]. The OMC joint angle data was calculated based on the RMC
and the skin markers according to the recommendations by Visual 3D (C-Motion, Inc, Ger-
mantown, MD, USA). A more detailed description of the calibration, initialization and joint
angle calculation can be found at dx.doi.org/10.17504/protocols.io.vwye7fw.
2.2 Statistical analysis
The analysis of the IMU system was twofold. First, the joint kinematics data from the IMU was
compared to the OMC joint kinematics data based on the RMC, in order to minimize the
error between the systems caused by different positioning of the IMU and markers respectively
(RMC evaluation). In a secondary analysis, the IMU data was compared to the OMC data
from the skin markers attached to anatomical landmarks (skin marker evaluation).
To determine the validity of the IMU system, the following statistical measures were calcu-
lated for each evaluation of the hip, knee, ankle joint, and global 3D pelvis orientations per
Fig 1. Sensor fixation. Inertial Measurement Unit (IMU) inserted into a matched, 3D-printed Rigid Marker Cluster (RMC).
https://doi.org/10.1371/journal.pone.0213064.g001
Validity of inertial sensor based 3D joint kinematics of static and dynamic movements
PLOS ONE | https://doi.org/10.1371/journal.pone.0213064 February 28, 2019 4 / 18

movement cycle: the root mean squared error (RMSE), the range of motion error (ROME), as
well as 95% confidence interval (CI). A Bland-Altman (BA) analysis was conducted to evaluate
the bias and limits of agreement between the OMC- and IMU-based joint kinematics accord-
ing to [39]. For the BA analysis, the average of all movement cycles for each subject was used.
This approach was deemed appropriate given that the mean of a similar number of movement
cycles is usually examined in clinical measurements [40]. Further, the coefficient of multiple
correlation (CMC) was calculated for each parameter per movement cycle according to [41].
CMC values were rated according to [42]. For further interpretation, the mean of the statistical
measures of all subjects and movement cycles was calculated.
Fig 2. Marker protocol and IMU placement. Retroreflective markers attached to the anatomical landmarks and the RMC. IMU are
not inserted in the RMC in this schematic picture.
https://doi.org/10.1371/journal.pone.0213064.g002
Validity of inertial sensor based 3D joint kinematics of static and dynamic movements
PLOS ONE | https://doi.org/10.1371/journal.pone.0213064 February 28, 2019 5 / 18

An ANOVA was conducted to identify significant differences in the RMSE between the
three different functional movements. Additionally, the data from a previous study [18] that
used the same approach for the calculation of IMU-based 3D joint kinematics during gait, was
included in the comparison. The significance level was set to α = 0.05. The Chi-square good-
ness-of-fit test was conducted to check for normal distribution in the data. A post hoc analysis
revealed which groups differed in the case of significant p-values.
The changes in RMSE and ROME between the RMC evaluation and the skin marker evalu-
ation were graphically represented.
The segmentation of the joint angles and all statistics were conducted in Matlab 2017
(Mathworks Inc.) using custom written scripts.
3 Results
3.1 RMC evaluation
RMSE and ROME of all joint angles for SQ, SLS and CMJ are shown in Table 1. For the read-
ers convenience, Table 1 includes the RMSE of the gait data from [18]. S1–S3 Figs in the sup-
porting information show the mean joint angle waveforms of one exemplary subject for all
three tasks and all three planes.
The following considers only the results of the functional movements. The RMC evaluation
of the IMU data revealed RMSE and ROME to be below 3˚ for all joints and all movements.
The highest RMSE was evident in the frontal and transversal plane. The sagittal plane revealed
a RMSE between 0.93˚ and 1.22˚ and a ROME between 0.60˚– 1.29˚ for SQ and SLS. CMJ
showed a higher RMSE and ROME than SQ and SLS with respect to the hip, knee, and ankle
in the sagittal plane; values ranged from 1.44˚– 2.48˚ RMSE and 1.32˚– 2.19˚ ROME, respec-
tively. The best outcome in the sagittal plane for all tasks was in global pelvis flexion (RMSE
0.70˚– 1.03˚). Concerning the joint angles in the frontal and transversal plane, SQ, SLS, and
CMJ revealed similar RMSE’s. However, ankle inversion and rotation were again highest in
the CMJ task. ROME in the frontal and transversal plane was also higher in the CMJ task. The
global pelvis obliquity and rotation showed the best results in the frontal and transversal plane
with a RMSE below 1.00˚ and a ROME below 0.70˚.
Table 2 shows the results of the ANOVA for the inter-task comparison of the RMSE. The
most significant differences were found between the CMJ task and the remaining functional
movements and Gait. No significant differences were found between SQ and SLS.
The CMC values were good to excellent for all joints in the SLS, SQ and CMJ tasks. The
CMC values of the joint angles of the right lower extremity are plotted in Fig 3. The SQ task
showed higher variances of CMC in the transversal plane as compared to SLS and CMJ tasks.
SLS displayed higher uncertainties in the hip and knee rotations.
A BA analysis was conducted to evaluate the limits of agreement between the IMU and
OMC data in all joint angles. The SQ data revealed biases from −1.10˚– 1.20˚ and limits rang-
ing from ± 1.07˚–± 5.06˚. The SLS data displayed biases from −1.10˚– 1.36˚ and limits ranging
from ± 0.96˚–± 3.25˚. In the CMJ data, biases ranged from −1.34˚– 1.35˚ and limits were
between ± 1.18˚–± 4.48˚. Exemplary BA diagrams of the right knee flexion and abduction for
all tasks are shown in Fig 4.
3.2 Skin marker evaluation
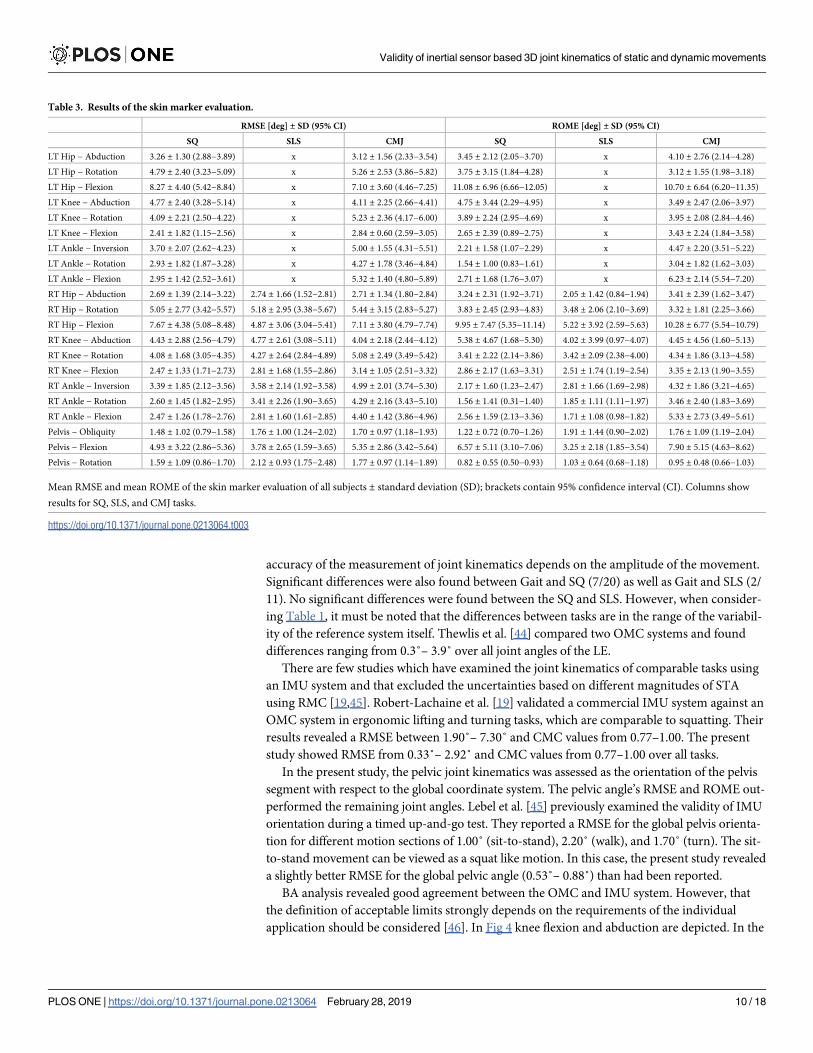
The RMSE and ROME of all joint angles for SQ, SLS, and CMJ are shown in Table 3. S4–S6
Figs in the supporting information show the mean joint angle waveforms of one exemplary
subject in all three tasks and for all three planes.
Validity of inertial sensor based 3D joint kinematics of static and dynamic movements
PLOS ONE | https://doi.org/10.1371/journal.pone.0213064 February 28, 2019 6 / 18

As compared to the RMC evaluation, RMSE increased by 2.28˚ for SLS, 2.35˚ (left) and
2.40˚ (right) for SQ, and 2.58˚ (left) and 2.55˚ (right) for CMJ on average for all joints. The
most affected joint angle was the hip joint in the sagittal plane. Hip flexion showed a RMSE of
8.27˚ and 7.10˚ in SQ and CMJ, respectively. Hip flexion in the SLS revealed a RMSE of 4.87˚.
The ROME was also highest for hip flexion in all three tasks with values ranging from 5.22˚ up
to 11.08˚. Figs 5 and 6 show the differences in the RMSE and ROME between the two evalua-
tion methods for the different tasks and joint angles.
The CMC primarily declined concerning the frontal and transversal plane. The CMC values
of the joint angles of the right lower extremity are plotted in Fig 7. In the SLS task, CMC values
for the mentioned planes were moderate to excellent. In the SQ and CMJ tasks, the CMC val-
ues were moderate to good. Overall, the CMC showed distinctively higher variances between
the subjects in the transversal and frontal plane, which can be seen in the wide quartiles and
whiskers in Fig 7.
The BA analysis in the skin marker evaluation revealed higher biases and limits in all tasks
as compared to the RMC evaluation. SQ showed biases of −2.11˚– 5.82˚ and limits of ± 3.09˚–
± 11.44˚; SLS revealed biases of −1.45˚– 2.89˚ and limits of ± 3.16˚–± 9.55˚; and, CMJ dis-
played biases of −3.54˚– 4.45˚ and limits of ± 3.22˚–± 12.47˚. According to the BA analysis,
the hip joint in the sagittal plane was again the most affected joint (biases 2.21˚– 5.82˚ and
limits ± 9.55˚–± 12.47˚ for all tasks). Exemplary BA diagrams of right knee flexion and abduc-
tion in all tasks are shown in Fig 8. The movements in the remaining sagittal joint angles, as
well as the global pelvis rotation, were the least affected joints.
Table 1. Results of the RMC evaluation.
RMSE [deg] ± SD (95% CI) ROME [deg] ± SD (95% CI)
Gait [18] SQ SLS CMJ SQ SLS CMJ
LT Hip − Abduction 1.05 ± 0.42 (0.78−1.11) 1.70 ± 0.89 (1.12−1.81) x 1.23 ± 0.43 (1.03−1.37) 1.72 ± 1.26 (0.83−1.80) x 1.20 ± 0.57 (0.89−1.33)
LT Hip − Rotation 1.94 ± 0.92 (1.49−2.20) 2.28 ± 1.25 (1.65−2.62) x 1.78 ± 0.78 (1.12−1.73) 1.19 ± 0.90 (0.50−1.20) x 1.01 ± 0.38 (0.78−1.08)
LT Hip − Flexion 1.02 ± 0.35 (0.79−1.06) 1.17 ± 0.45 (0.94−1.29) x 1.55 ± 0.31 (1.42−1.66) 0.89 ± 0.54 (0.55−0.97) x 1.42 ± 0.81 (0.97−1.59)
LT Knee − Abduction 1.59 ± 0.48 (1.22−1.59) 2.06 ± 0.72 (1.62−2.18) x 2.02 ± 0.68 (1.67−2.20) 1.49 ± 0.84 (0.84−1.50) x 2.20 ± 1.13 (1.49−2.37)
LT Knee − Rotation 2.34 ± 1.08 (1.63−2.48) 2.66 ± 1.55 (1.71−2.91) x 2.75 ± 0.97 (2.39−3.14) 1.59 ± 0.87 (0.98−1.66) x 1.85 ± 0.86 (1.41−2.07)
LT Knee − Flexion 1.47 ± 0.34 (1.25−1.51) 1.10 ± 0.28 (0.93−1.15) x 1.83 ± 0.46 (1.54−1.89) 1.29 ± 0.62 (1.03−1.51) x 1.72 ± 1.00 (1.10−1.87)
LT Ankle − Inversion 1.61 ± 0.39 (1.42−1.73) 1.83 ± 0.74 (1.31−1.88) x 2.46 ± 0.73 (1.98−2.55) 2.06 ± 1.30 (1.29−2.30) x 2.43 ± 1.17 (1.82−2.73)
LT Ankle − Rotation 2.16 ± 0.68 (1.80−2.33) 2.01 ± 1.15 (1.50−2.39) x 2.92 ± 0.94 (2.50−3.22) 0.91 ± 0.62 (0.51−0.99) x 2.28 ± 0.83 (1.68−2.32)
LT Ankle − Flexion 1.55 ± 0.34 (1.46−1.72) 1.22 ± 0.51 (0.92−1.32) x 2.48 ± 0.53 (2.29−2.71) 0.60 ± 0.23 (0.47−0.65) x 2.11 ± 0.97 (1.60−2.35)
RT Hip − Abduction 1.09 ± 0.54 (0.63−1.05) 1.39 ± 0.80 (0.78−1.40) 1.26 ± 0.68 (0.78−1.30) 1.30 ± 0.61 (0.90−1.37) 1.29 ± 0.78 (0.74−1.34) 1.34 ± 0.87 (0.77−1.45) 1.14 ± 0.61 (0.73−1.21)
RT Hip − Rotation 1.64 ± 1.00 (1.00−1.77) 1.77 ± 1.05 (1.21−2.02) 2.11 ± 0.99 (1.51−2.28) 2.01 ± 1.07 (1.29−2.12) 1.03 ± 0.83 (0.38−1.02) 0.69 ± 0.38 (0.39−0.69) 1.05 ± 0.63 (0.79−1.28)
RT Hip − Flexion 0.98 ± 0.51 (0.68−1.07) 1.07 ± 0.30 (0.96−1.19) 1.01 ± 0.69 (0.60−1.13) 1.44 ± 0.35 (1.23−1.51) 0.82 ± 0.49 (0.51−0.88) 0.95 ± 0.84 (0.46−1.11) 1.32 ± 0.72 (0.95−1.51)
RT Knee − Abduction 1.26 ± 0.51 (0.90−1.30) 1.54 ± 0.75 (0.96−1.54) 1.49 ± 0.74 (1.18−1.76) 1.48 ± 0.51 (1.22−1.62) 1.40 ± 0.98 (0.68−1.44) 1.23 ± 0.96 (0.48−1.22) 1.33 ± 0.59 (0.97−1.43)
RT Knee − Rotation 1.75 ± 0.63 (1.38−1.87) 1.86 ± 1.28 (0.80−1.79) 2.06 ± 1.46 (1.30−2.44) 2.29 ± 1.14 (1.53−2.41) 0.94 ± 0.82 (0.36−0.99) 0.74 ± 0.36 (0.45−0.74) 1.46 ± 0.82 (0.97−1.60)
RT Knee − Flexion 1.51 ± 0.43 (1.31−1.64) 1.01 ± 0.27 (0.84−1.05) 1.03 ± 0.63 (0.62−1.10) 1.83 ± 0.38 (1.61−1.91) 1.13 ± 0.48 (0.99−1.37) 0.88 ± 0.54 (0.51−0.93) 1.80 ± 0.92 (1.02−1.73)
RT Ankle − Inversion 1.33 ± 0.35 (1.09−1.36) 1.18 ± 0.51 (0.85−1.24) 1.26 ± 0.71 (0.80−1.35) 1.77 ± 0.48 (1.42−1.79) 0.64 ± 0.37 (0.43−0.71) 0.77 ± 0.32 (0.63−0.88) 1.71 ± 0.65 (1.50−2.00)
RT Ankle − Rotation 1.52 ± 0.41 (1.27−1.59) 1.23 ± 0.61 (0.89−1.36) 1.22 ± 1.01 (0.58−1.39) 2.27 ± 0.83 (1.79−2.44) 0.84 ± 0.44 (0.60−0.93) 0.82 ± 0.58 (0.35−0.81) 1.78 ± 0.90 (1.30−2.00)
RT Ankle − Flexion 1.60 ± 0.36 (1.43−1.71) 0.93 ± 0.51 (0.55−0.95) 1.01 ± 0.47 (0.67−1.03) 2.41 ± 0.51 (2.20−2.59) 0.61 ± 0.24 (0.47−0.66) 0.72 ± 0.43 (0.44−0.78) 2.19 ± 1.17 (1.67−2.58)
Pelvis − Obliquity 0.64 ± 0.18 (0.55−0.69) 0.53 ± 0.37 (0.25−0.54) 0.60 ± 0.28 (0.39−0.61) 0.76 ± 0.27 (0.67−0.87) 0.36 ± 0.21 (0.21−0.37) 0.44 ± 0.26 (0.24−0.44) 0.62 ± 0.20 (0.54−0.70)
Pelvis − Flexion 0.62 ± 0.16 (0.57−0.69) 0.70 ± 0.28 (0.54−0.76) 0.71 ± 0.51 (0.38−0.78) 1.03 ± 0.28 (0.86−1.08) 0.45 ± 0.28 (0.26−0.47) 0.45 ± 0.27 (0.28−0.48) 1.24 ± 0.62 (0.86−1.35)
Pelvis − Rotation X 0.88 ± 0.64 (0.45−0.95) 0.92 ± 0.46 (0.64−1.00) 0.84 ± 0.37 (0.56−0.85) 0.33 ± 0.13 (0.25−0.35) 0.44 ± 0.18 (0.30−0.44) 0.53 ± 0.23 (0.42−0.60)
Mean root mean squared error (RMSE) and mean range of motion error (ROME) of the rigid marker cluster (RMC) evaluation of all subjects ± standard deviation
(SD); brackets contain 95% confidence interval (CI). Columns show the results for gait, bilateral squat (SQ), single-leg squat (SLS), and countermovement jump (CMJ).
https://doi.org/10.1371/journal.pone.0213064.t001
Validity of inertial sensor based 3D joint kinematics of static and dynamic movements
PLOS ONE | https://doi.org/10.1371/journal.pone.0213064 February 28, 2019 7 / 18

4 Discussion
The primary aim of this study was to validate the accuracy of a sensor-fusion algorithm used
in calculating IMU-based 3D lower extremity joint kinematics of three typical functional
movements as compared to OMC joint kinematics based on RMC. The secondary aim of the
analysis was to determine the error between the IMU data and the OMC data based on skin
markers.
4.1 RMC evaluation
The RMC evaluation of 3D joint kinematics based on the IMU data of the SQ, SLS, and CMJ
tasks revealed excellent correspondence with the OMC data. However, it appeared that the
CMJ task revealed the highest RMSE and ROME in the sagittal plane and in ankle inversion
and rotation. These findings indicate that the IMU data was influenced by the high accelera-
tions that can occur during the landing phase in a jumping task [43]. The IMU’s used in this
study employ an accelerometer with a maximum resolution of ± 16 g. A probable limitation
was that the IMU recorded data with 60 Hz due to software restrictions.
The results of the ANOVA (Table 2) also revealed significantly higher RMSE in most joint
angles for the CMJ (33/54) compared to the remaining tasks. The sagittal plane displayed most
of the significant differences between the four tasks. That might be connected to the higher
changes recorded in the ROM concerning this plane. These findings implicate that the
Table 2. Results of the ANOVA.
RMSE
p-value
Gait vs SQ Gait vs SLS Gait vs CMJ SQ vs SLS SQ vs CMJ SLS vsCMJ
LT Hip − Abduction < 0.001 x 0.124 x 0.015 x
LT Hip − Rotation 0.255 x 0.475 x 0.078 x
LT Hip − Flexion 0.177 x < 0.001 x < 0.001 x
LT Knee − Abduction 0.007 x 0.009 x 0.859 x
LT Knee − Rotation 0.376 x 0.139 x 0.790 x
LT Knee − Flexion < 0.001 x 0.002 x < 0.001 x
LT Ankle − Inversion 0.173 x < 0.001 x 0.003 x
LT Ankle − Rotation 0.553 x 0.001 x 0.002 x
LT Ankle − Flexion 0.006 x < 0.001 x < 0.001 x
RT Hip − Abduction 0.104 0.305 0.170 0.515 0.658 0.796
RT Hip − Rotation 0.634 0.079 0.189 0.211 0.407 0.696
RT Hip − Flexion 0.403 0.829 < 0.001 0.679 < 0.001 0.005
RT Knee − Abduction 0.122 0.198 0.121 0.812 0.752 0.969
RT Knee − Rotation 0.681 0.314 0.031 0.599 0.187 0.498
RT Knee − Flexion < 0.001 0.002 0.004 0.885 < 0.001 < 0.001
RT Ankle − Inversion 0.200 0.666 < 0.001 0.597 < 0.001 0.003
RT Ankle − Rotation 0.038 0.162 < 0.001 0.987 < 0.001 < 0.001
RT Ankle − Flexion < 0.001 < 0.001 < 0.001 0.567 < 0.001 < 0.001
Pelvis − Obliquity 0.193 0.544 0.043 0.470 0.011 0.030
Pelvis − Flexion 0.228 0.386 < 0.001 0.900 < 0.001 0.005
Pelvis − Rotation x x x 0.815 0.788 0.518
P-values of the ANOVA for inter-task comparison of the RMSE. Rows show joint angles. Each column represents the comparison between two movements. Pelvis
rotation was not compared between Gait and the remaining functional movements due to drift in the global pelvis rotation of the gait data (see [18])
https://doi.org/10.1371/journal.pone.0213064.t002
Validity of inertial sensor based 3D joint kinematics of static and dynamic movements
PLOS ONE | https://doi.org/10.1371/journal.pone.0213064 February 28, 2019 8 / 18

Fig 3. Coefficient of multiple correlation (CMC) of the RMC evaluation. CMC of the right lower extremity for all functional
movements: (a) indicates SQ, (b) indicates SLS, and (c) indicates CMJ.
https://doi.org/10.1371/journal.pone.0213064.g003
Fig 4. Bland-Altman (BA) diagrams of the right knee flexion (a) and abduction (b) for all subjects for the RMC evaluation. In
(a), negative values on the x-axis indicate knee flexion. In (b), negative values on the x-axis indicate knee adduction. The solid line
indicates the mean difference, dashed lines indicate ± 1.96 � standard deviation (SD).
https://doi.org/10.1371/journal.pone.0213064.g004
Validity of inertial sensor based 3D joint kinematics of static and dynamic movements
PLOS ONE | https://doi.org/10.1371/journal.pone.0213064 February 28, 2019 9 / 18
accuracy of the measurement of joint kinematics depends on the amplitude of the movement.
Significant differences were also found between Gait and SQ (7/20) as well as Gait and SLS (2/
11). No significant differences were found between the SQ and SLS. However, when consider-
ing Table 1, it must be noted that the differences between tasks are in the range of the variabil-
ity of the reference system itself. Thewlis et al. [44] compared two OMC systems and found
differences ranging from 0.3˚– 3.9˚ over all joint angles of the LE.
There are few studies which have examined the joint kinematics of comparable tasks using
an IMU system and that excluded the uncertainties based on different magnitudes of STA
using RMC [19,45]. Robert-Lachaine et al. [19] validated a commercial IMU system against an
OMC system in ergonomic lifting and turning tasks, which are comparable to squatting. Their
results revealed a RMSE between 1.90˚– 7.30˚ and CMC values from 0.77–1.00. The present
study showed RMSE from 0.33˚– 2.92˚ and CMC values from 0.77–1.00 over all tasks.
In the present study, the pelvic joint kinematics was assessed as the orientation of the pelvis
segment with respect to the global coordinate system. The pelvic angle’s RMSE and ROME out-
performed the remaining joint angles. Lebel et al. [45] previously examined the validity of IMU
orientation during a timed up-and-go test. They reported a RMSE for the global pelvis orienta-
tion for different motion sections of 1.00˚ (sit-to-stand), 2.20˚ (walk), and 1.70˚ (turn). The sit-
to-stand movement can be viewed as a squat like motion. In this case, the present study revealed
a slightly better RMSE for the global pelvic angle (0.53˚– 0.88˚) than had been reported.
BA analysis revealed good agreement between the OMC and IMU system. However, that
the definition of acceptable limits strongly depends on the requirements of the individual
application should be considered [46]. In Fig 4 knee flexion and abduction are depicted. In the
Table 3. Results of the skin marker evaluation.
RMSE [deg] ± SD (95% CI) ROME [deg] ± SD (95% CI)
SQ SLS CMJ SQ SLS CMJ
LT Hip − Abduction 3.26 ± 1.30 (2.88−3.89) x 3.12 ± 1.56 (2.33−3.54) 3.45 ± 2.12 (2.05−3.70) x 4.10 ± 2.76 (2.14−4.28)
LT Hip − Rotation 4.79 ± 2.40 (3.23−5.09) x 5.26 ± 2.53 (3.86−5.82) 3.75 ± 3.15 (1.84−4.28) x 3.12 ± 1.55 (1.98−3.18)
LT Hip − Flexion 8.27 ± 4.40 (5.42−8.84) x 7.10 ± 3.60 (4.46−7.25) 11.08 ± 6.96 (6.66−12.05) x 10.70 ± 6.64 (6.20−11.35)
LT Knee − Abduction 4.77 ± 2.40 (3.28−5.14) x 4.11 ± 2.25 (2.66−4.41) 4.75 ± 3.44 (2.29−4.95) x 3.49 ± 2.47 (2.06−3.97)
LT Knee − Rotation 4.09 ± 2.21 (2.50−4.22) x 5.23 ± 2.36 (4.17−6.00) 3.89 ± 2.24 (2.95−4.69) x 3.95 ± 2.08 (2.84−4.46)
LT Knee − Flexion 2.41 ± 1.82 (1.15−2.56) x 2.84 ± 0.60 (2.59−3.05) 2.65 ± 2.39 (0.89−2.75) x 3.43 ± 2.24 (1.84−3.58)
LT Ankle − Inversion 3.70 ± 2.07 (2.62−4.23) x 5.00 ± 1.55 (4.31−5.51) 2.21 ± 1.58 (1.07−2.29) x 4.47 ± 2.20 (3.51−5.22)
LT Ankle − Rotation 2.93 ± 1.82 (1.87−3.28) x 4.27 ± 1.78 (3.46−4.84) 1.54 ± 1.00 (0.83−1.61) x 3.04 ± 1.82 (1.62−3.03)
LT Ankle − Flexion 2.95 ± 1.42 (2.52−3.61) x 5.32 ± 1.40 (4.80−5.89) 2.71 ± 1.68 (1.76−3.07) x 6.23 ± 2.14 (5.54−7.20)
RT Hip − Abduction 2.69 ± 1.39 (2.14−3.22) 2.74 ± 1.66 (1.52−2.81) 2.71 ± 1.34 (1.80−2.84) 3.24 ± 2.31 (1.92−3.71) 2.05 ± 1.42 (0.84−1.94) 3.41 ± 2.39 (1.62−3.47)
RT Hip − Rotation 5.05 ± 2.77 (3.42−5.57) 5.18 ± 2.95 (3.38−5.67) 5.44 ± 3.15 (2.83−5.27) 3.83 ± 2.45 (2.93−4.83) 3.48 ± 2.06 (2.10−3.69) 3.32 ± 1.81 (2.25−3.66)
RT Hip − Flexion 7.67 ± 4.38 (5.08−8.48) 4.87 ± 3.06 (3.04−5.41) 7.11 ± 3.80 (4.79−7.74) 9.95 ± 7.47 (5.35−11.14) 5.22 ± 3.92 (2.59−5.63) 10.28 ± 6.77 (5.54−10.79)
RT Knee − Abduction 4.43 ± 2.88 (2.56−4.79) 4.77 ± 2.61 (3.08−5.11) 4.04 ± 2.18 (2.44−4.12) 5.38 ± 4.67 (1.68−5.30) 4.02 ± 3.99 (0.97−4.07) 4.45 ± 4.56 (1.60−5.13)
RT Knee − Rotation 4.08 ± 1.68 (3.05−4.35) 4.27 ± 2.64 (2.84−4.89) 5.08 ± 2.49 (3.49−5.42) 3.41 ± 2.22 (2.14−3.86) 3.42 ± 2.09 (2.38−4.00) 4.34 ± 1.86 (3.13−4.58)
RT Knee − Flexion 2.47 ± 1.33 (1.71−2.73) 2.81 ± 1.68 (1.55−2.86) 3.14 ± 1.05 (2.51−3.32) 2.86 ± 2.17 (1.63−3.31) 2.51 ± 1.74 (1.19−2.54) 3.35 ± 2.13 (1.90−3.55)
RT Ankle − Inversion 3.39 ± 1.85 (2.12−3.56) 3.58 ± 2.14 (1.92−3.58) 4.99 ± 2.01 (3.74−5.30) 2.17 ± 1.60 (1.23−2.47) 2.81 ± 1.66 (1.69−2.98) 4.32 ± 1.86 (3.21−4.65)
RT Ankle − Rotation 2.60 ± 1.45 (1.82−2.95) 3.41 ± 2.26 (1.90−3.65) 4.29 ± 2.16 (3.43−5.10) 1.56 ± 1.41 (0.31−1.40) 1.85 ± 1.11 (1.11−1.97) 3.46 ± 2.40 (1.83−3.69)
RT Ankle − Flexion 2.47 ± 1.26 (1.78−2.76) 2.81 ± 1.60 (1.61−2.85) 4.40 ± 1.42 (3.86−4.96) 2.56 ± 1.59 (2.13−3.36) 1.71 ± 1.08 (0.98−1.82) 5.33 ± 2.73 (3.49−5.61)
Pelvis − Obliquity 1.48 ± 1.02 (0.79−1.58) 1.76 ± 1.00 (1.24−2.02) 1.70 ± 0.97 (1.18−1.93) 1.22 ± 0.72 (0.70−1.26) 1.91 ± 1.44 (0.90−2.02) 1.76 ± 1.09 (1.19−2.04)
Pelvis − Flexion 4.93 ± 3.22 (2.86−5.36) 3.78 ± 2.65 (1.59−3.65) 5.35 ± 2.86 (3.42−5.64) 6.57 ± 5.11 (3.10−7.06) 3.25 ± 2.18 (1.85−3.54) 7.90 ± 5.15 (4.63−8.62)
Pelvis − Rotation 1.59 ± 1.09 (0.86−1.70) 2.12 ± 0.93 (1.75−2.48) 1.77 ± 0.97 (1.14−1.89) 0.82 ± 0.55 (0.50−0.93) 1.03 ± 0.64 (0.68−1.18) 0.95 ± 0.48 (0.66−1.03)
Mean RMSE and mean ROME of the skin marker evaluation of all subjects ± standard deviation (SD); brackets contain 95% confidence interval (CI). Columns show
results for SQ, SLS, and CMJ tasks.
https://doi.org/10.1371/journal.pone.0213064.t003
Validity of inertial sensor based 3D joint kinematics of static and dynamic movements
PLOS ONE | https://doi.org/10.1371/journal.pone.0213064 February 28, 2019 10 / 18

SQ right knee flexion, the IMU data tended to underestimate the flexion, and conversely
tended to overestimate the extension. Similar findings were revealed in the SLS right knee
abduction. In this case, knee adduction tended to be underestimated, and knee abduction
tended to be overestimated. However, the ROM should be unaffected by an offset, assuming
that it is constant. This is important considering the value of ROM measurements in the
Fig 5. RMSE change. The mean difference in RMSE between the RMC evaluation and the skin marker evaluation in all three tasks
for all joints (± SD).
https://doi.org/10.1371/journal.pone.0213064.g005
Fig 6. ROME change. The mean difference in ROME between the RMC evaluation and the skin marker evaluation in all three tasks
for all joints (± SD).
https://doi.org/10.1371/journal.pone.0213064.g006
Validity of inertial sensor based 3D joint kinematics of static and dynamic movements
PLOS ONE | https://doi.org/10.1371/journal.pone.0213064 February 28, 2019 11 / 18

Fig 7. CMC in the skin marker evaluation. CMC of the right lower extremity for all functional movements: (a) indicates SQ, (b)
indicates SLS, and (c) indicates CMJ.
https://doi.org/10.1371/journal.pone.0213064.g007
Fig 8. BA diagrams of the right knee flexion (a) and abduction (b) for all subjects in the skin marker evaluation. In (a), negative
values on the x-axis indicate knee flexion. In (b), negative values on the x-axis indicate knee adduction. The solid line indicates the
mean difference, dashed lines indicate ± 1.96 � standard deviation (SD).
https://doi.org/10.1371/journal.pone.0213064.g008
Validity of inertial sensor based 3D joint kinematics of static and dynamic movements
PLOS ONE | https://doi.org/10.1371/journal.pone.0213064 February 28, 2019 12 / 18
clinical evaluation of rehabilitation progresses, for example [47]. The remaining knee joint
angles seemed equally distributed within their limits.
4.2 Skin marker evaluation
The secondary validation of the IMU data revealed results distinctively inferior to the RMC
evaluation. RMSE and ROME increased on average by approximately 2˚ to 3˚ for all tasks. The
increase of the statistical error measures between the two evaluation methods was mainly asso-
ciated to different effects of STA on the two systems due to the unrelated positioning of the
skin markers and the IMU on the segments.
The BA analysis showed wider limits but only slightly higher mean differences. As shown
in Fig 8, the data points of right knee flexion in all tasks seemed equally distributed between
the limits. However, right knee abduction in all tasks tended to be overestimated by the IMU
data, whereas the knee adduction tended to be underestimated.
In the skin marker evaluation, the hip flexion joint angle revealed the highest errors in the
SQ and CMJ tasks. These findings are comparable to the results shown by Al-Amri et al. [14].
They found deviations of the maximum sagittal joint angle of the hip between IMU and OMC
systems in the SQ and jumping tasks of approximately above 20˚. However, Al-Amri et al. [14]
found a static offset in their kinematic data, especially in hip flexion as well as knee and ankle
rotation. An offset in the hip flexion occurred in the present study as well (S4 Fig). This might
explain the rather poor results concerning the RMSE. However, CMC of the hip flexion
revealed excellent correlations.
The relatively good results of the knee joint angles indicated that the offset concerning the
hip sagittal joint angle did not originate from the IMU attached to the thigh. However, it
appeared that the pelvis’ global sagittal angle also exhibited an offset, which directly influences
the hip joint angle. However, the RMC evaluation showed no offset between the OMC and
IMU data. Furthermore, the RMSE and ROME of the hip flexion in the SLS task revealed
lower values compared to the SQ and CMJ tasks. Examination showed that the pelvis flexion
ROM of the SLS was approximately 7.84˚ smaller than in the SQ task. In this case, it could
have been that the skin marker based OMC system was more influenced by STA than the IMU
data because markers attached to the left and right Spina Iliaca Anterior Superior were more
prone to STA during increased pelvis and hip flexion. Fiorentino et al. [48] previously showed
that the hip joint angle of the OMC systems based on skin markers is significantly influenced
by STA, using dual fluoroscopy as a reference. They stated that the ROM of the skin marker
based measurement was reduced compared to dual fluoroscopy. This is consistent with the
present findings. The ROM of the hip flexion of the RMC-based OMC joint kinematics calcu-
lation was approximately 8˚ higher than in the skin marker based calculation, concerning the
SQ task. However, the IMU based ROM calculation of the hip flexion showed similar values
compared to the RMC alternative. As mentioned above, the RMC based joint kinematics cal-
culation was shown to reveal results more immune to STA compared to joint kinematics for
markers attached to anatomical landmarks [30]. Thus, the RMC calculation was considered
the gold standard reference in this study. It should be considered that the susceptibility to STA
of the RMC depends on their positioning on the regarding segments. However, the primary
evaluation of this study focused on the performance of the sensor-fusion algorithm. In this
case, accuracy should not have been sensitive to variations in the IMU placement since IMU
and RMC were rigidly connected. However, future studies should investigate the effects of dif-
ferent IMU placement on the accuracy of 3D joint kinematics.
The RMC evaluation revealed differences between the tasks regarding the RMSE and ROME
of the sagittal plane joint angle. However, in the skin marker evaluation, the hip flexion RMSE
Validity of inertial sensor based 3D joint kinematics of static and dynamic movements
PLOS ONE | https://doi.org/10.1371/journal.pone.0213064 February 28, 2019 13 / 18

and ROME of the SQ task for the left lower extremity were higher than in the CMJ task. This
could again be due to the above-mentioned susceptibility of the hip joint angle based on four
markers to STA. However, differences in the error measures were around 1˚ between the tasks.
There are few studies that have examined the validity of IMU-derived 3D joint kinematics
of dynamic tasks. Fasel et al. [31] analyzed the validity of IMU data during indoor skiing. How-
ever, their examination was performed on an indoor skiing carpet operator, thus ignoring
global locomotion. They found ROME for hip and knee joint angles of 10.7˚ and 0.1˚ in the
sagittal plane, 3.3˚ and 4.2˚ in the frontal plane, and 0.5˚ and 0.0˚ in the transversal plane.
Thus, their results are more accurate concerning the transversal plane and the sagittal plane of
the knee joint. Interestingly, the ROME regarding the hip flexion was similarly high compared
to that of the present study. However, both studies differ concerning the method for joint kine-
matics estimation. While both studies used only gyroscope and accelerometer data for IMU
joint kinematics estimation, Fasel et al. [31] also introduced a functional calibration method
and initialized segment orientation using a strap down integration and joint drift reduction
according to Fasel et al. [49]. In contrast, the present study obtained the calibration and seg-
ment orientation initialization of the OMC system, excluding errors regarding these issues.
5 Conclusion
In conclusion, the examined sensor-fusion algorithm for the calculation of IMU-based joint
kinematics showed excellent correspondence with an OMC system in all three functional
movements, when considering the technical error. The most dynamic task, the CMJ, showed
slightly higher values for RMSE (below 3˚), and ROME (below 2.5˚), given a limited measure-
ment rate of 60 Hz.
For skin markers, which are influenced by different STA compared to the IMU, the error
measures increased mostly concerning the hip joint angle in the sagittal plane. However, it
should be kept in mind that the reference system itself suffers from STA and uncertainties due
to marker positioning. The findings mentioned above indicate that in certain cases, compared
to OMC joint kinematics based on skin markers, IMU data could deliver more confident
results. However, these suggestions need to be confirmed by conducting validation studies
using dual fluoroscopy or comparable systems as a reference [50]. Additionally, further studies
are necessary to add stepwise IMU information to the joint kinematics calculation (i.e,. an
IMU-to-segment calibration, initialization from IMU data and a biomechanical model based
on anthropometric tables). It is critical to separate the magnitude of error associated with each
of these issues. Nevertheless, the present examination revealed results that encourage the con-
tinued research and development of an IMU system aimed at applications in rehabilitative and
sports medical contexts.
Supporting information
S1 Fig. Mean sagittal plane right joint angle waveforms. Joint angle waveforms of the sagittal
plane of the rigid marker cluster (RMC) evaluation of one exemplary subject. Solid lines show
the joint angles of the optical motion capture system (OMC), and dashed lines show the joint
angles of the inertial measurement system (IMU).
(TIF)
S2 Fig. Mean frontal plane right joint angle waveforms. Joint angle waveforms of the frontal
plane of the RMC evaluation of one exemplary subject. Solid lines show the joint angles of the
OMC, and dashed lines show the joint angles of the IMU.
(TIF)
Validity of inertial sensor based 3D joint kinematics of static and dynamic movements
PLOS ONE | https://doi.org/10.1371/journal.pone.0213064 February 28, 2019 14 / 18

S3 Fig. Mean transversal plane right joint angle waveforms. Joint angle waveforms of the
transversal plane of the RMC evaluation of one exemplary subject. Solid lines show the joint
angles of the OMC, and dashed lines show the joint angles of the IMU.
(TIF)
S4 Fig. Mean sagittal plane right joint angle waveforms. Joint angle waveforms of the sagittal
plane of the skin marker evaluation of one exemplary subject. Solid lines show the joint angles
of the OMC, and dashed lines show the joint angles of the IMU.
(TIF)
S5 Fig. Mean frontal plane right joint angle waveforms. Joint angle waveforms of the frontal
plane of the skin marker evaluation of one exemplary subject. Solid lines show the joint angles
of the OMC, and dashed lines show the joint angles of the IMU.
(TIF)
S6 Fig. Mean transversal plane right joint angle waveforms. Joint angle waveforms of the
transversal plane of the skin marker evaluation of one exemplary subject. Solid lines show the
joint angles of the OMC, and dashed lines show the joint angles of the IMU.
(TIF)
Acknowledgments
The authors would like to thank Gregor Zolynski for constructing and crafting the 3D printed
boxes for the inertial measurement units.
This work was performed by the Interdisciplinary Junior Research Group wearHEALTH,
funded by the BMBF (16SV7115, 03IHS075B). For more information, please visit the website
www.wearhealth.org.
Author Contributions
Conceptualization: Wolfgang Teufl, Bertram Taetz, Michael Frohlich, Gabriele Bleser.
Data curation: Wolfgang Teufl, Markus Miezal, Bertram Taetz, Gabriele Bleser.
Formal analysis: Wolfgang Teufl, Gabriele Bleser.
Investigation: Gabriele Bleser.
Project administration: Wolfgang Teufl, Michael Frohlich, Gabriele Bleser.
Software: Markus Miezal, Gabriele Bleser.
Supervision: Michael Frohlich, Gabriele Bleser.
Writing – original draft: Wolfgang Teufl.
Writing – review & editing: Wolfgang Teufl, Markus Miezal, Michael Frohlich, Gabriele
Bleser.
References1. Cook G, Burton L, Hoogenboom BJ, Voight M. FUNCTIONAL MOVEMENT SCREENING: THE USE
OF FUNDAMENTAL MOVEMENTS AS AN ASSESSMENT OF FUNCTION—PART 1. Int J Sports
Phys Ther. 2014; 9: 396–409. PMID: 24944860
2. Brauner T, Wearing S, Ramisch E, Zillober M, Horstmann T. Can Measures of Limb Loading and
Dynamic Stability During the Squat Maneuver Provide an Index of Early Functional Recovery After Uni-
lateral Total Hip Arthroplasty? Arch Phys Med Rehabil. 2014; 95: 1946–1953. https://doi.org/10.1016/j.
apmr.2014.06.003 PMID: 24953251
Validity of inertial sensor based 3D joint kinematics of static and dynamic movements
PLOS ONE | https://doi.org/10.1371/journal.pone.0213064 February 28, 2019 15 / 18

3. de Baldon RM, Piva SR, Scattone Silva R, Serrão FV. Evaluating Eccentric Hip Torque and Trunk
Endurance as Mediators of Changes in Lower Limb and Trunk Kinematics in Response to Functional
Stabilization Training in Women With Patellofemoral Pain. Am J Sports Med. 2015; 43: 1485–1493.
https://doi.org/10.1177/0363546515574690 PMID: 25790834
4. Weeks BK, Carty CP, Horan SA. Kinematic predictors of single-leg squat performance: a comparison of
experienced physiotherapists and student physiotherapists. BMC Musculoskelet Disord. 2012; 13: 207.
https://doi.org/10.1186/1471-2474-13-207 PMID: 23098061
5. Gathercole R, Sporer B, Stellingwerff T, Sleivert G. Alternative Countermovement-Jump Analysis to
Quantify Acute Neuromuscular Fatigue. Int J Sports Physiol Perform. 2015; 10: 84–92. https://doi.org/
10.1123/ijspp.2013-0413 PMID: 24912201
6. Menzel H-J, Chagas MH, Szmuchrowski LA, Araujo SRS, de Andrade AGP, de Jesus-Moraleida FR.
Analysis of Lower Limb Asymmetries by Isokinetic and Vertical Jump Tests in Soccer Players: J
Strength Cond Res. 2013; 27: 1370–1377. https://doi.org/10.1519/JSC.0b013e318265a3c8 PMID:
22796999
7. Kianifar R, Lee A, Raina S, Kulic D. Automated Assessment of Dynamic Knee Valgus and Risk of Knee
Injury During the Single Leg Squat. IEEE J Transl Eng Health Med. 2017; 5: 1–13. https://doi.org/10.
1109/JTEHM.2017.2736559 PMID: 29204327
8. McPherson AL, Dowling B, Tubbs TG, Paci JM. Sagittal plane kinematic differences between dominant
and non-dominant legs in unilateral and bilateral jump landings. Phys Ther Sport. 2016; 22: 54–60.
https://doi.org/10.1016/j.ptsp.2016.04.001 PMID: 27583649
9. Leardini A, Chiari L, Croce UD, Cappozzo A. Human movement analysis using stereophotogrammetry.
Gait Posture. 2005; 21: 212–225. https://doi.org/10.1016/j.gaitpost.2004.05.002 PMID: 15639400
10. Picerno P. 25 years of lower limb joint kinematics by using inertial and magnetic sensors: A review of
methodological approaches. Gait Posture. 2017; 51: 239–246. https://doi.org/10.1016/j.gaitpost.2016.
11.008 PMID: 27833057
11. McGinnis RS, Cain SM, Davidson SP, Vitali RV, Perkins NC, McLean SG. Quantifying the effects of
load carriage and fatigue under load on sacral kinematics during countermovement vertical jump with
IMU-based method. Sports Eng. 2016; 19: 21–34. https://doi.org/10.1007/s12283-015-0185-3
12. Setuain I, Martinikorena J, Gonzalez-Izal M, Martinez-Ramirez A, Gomez M, Alfaro-Adrian J, et al. Ver-
tical jumping biomechanical evaluation through the use of an inertial sensor-based technology. J Sports
Sci. 2015; 34: 843–851. https://doi.org/10.1080/02640414.2015.1075057 PMID: 26256752
13. Picerno P, Camomilla V, Capranica L. Countermovement jump performance assessment using a wear-
able 3D inertial measurement unit. J Sports Sci. 2011; 29: 139–146. https://doi.org/10.1080/02640414.
2010.523089 PMID: 21120742
14. Al-Amri M, Nicholas K, Button K, Sparkes V, Sheeran L, Davies JL. Inertial Measurement Units for Clini-
cal Movement Analysis: Reliability and Concurrent Validity. Sensors. 2018; 18: 719. https://doi.org/10.
3390/s18030719 PMID: 29495600
15. Kluge F, Gaßner H, Hannink J, Pasluosta C, Klucken J, Eskofier BM. Towards Mobile Gait Analysis:
Concurrent Validity and Test-Retest Reliability of an Inertial Measurement System for the Assessment
of Spatio-Temporal Gait Parameters. Sensors. 2017; 17. https://doi.org/10.3390/s17071522 PMID:
28657587
16. Nuesch C, Roos E, Pagenstert G, Mundermann A. Measuring joint kinematics of treadmill walking and
running: Comparison between an inertial sensor based system and a camera-based system. J Bio-
mech. 2017; 57: 32–38. https://doi.org/10.1016/j.jbiomech.2017.03.015 PMID: 28366438
17. Zhang J-T, Novak AC. Concurrent validation of Xsens and MVN measurement of lower limb joint angu-
lar kinematics. Physiol Meas. 2013; 34.
18. Teufl W, Miezal M, Taetz B, Frohlich M, Bleser G. Validity, Test-Retest Reliability and Long-Term Stabil-
ity of Magnetometer Free Inertial Sensor Based 3D Joint Kinematics. Sensors. 2018; 18: 1980. https://
doi.org/10.3390/s18071980 PMID: 29933568
19. Robert-Lachaine X, Mecheri H, Larue C, Plamondon A. Validation of inertial measurement units with an
optoelectronic system for whole-body motion analysis. Med Biol Eng Comput. 2017; 55: 609–619.
https://doi.org/10.1007/s11517-016-1537-2 PMID: 27379397
20. Miezal M, Taetz B, Bleser G. On Inertial Body Tracking in the Presence of Model Calibration Errors.
Sensors. 2016; 16: 1132. https://doi.org/10.3390/s16071132 PMID: 27455266
21. Miezal M, Taetz B, Bleser G. Real-time inertial lower body kinematics and ground contact estimation at
anatomical foot points for agile human locomotion. 2017 IEEE International Conference on Robotics
and Automation (ICRA). 2017. pp. 3256–3263.
Validity of inertial sensor based 3D joint kinematics of static and dynamic movements
PLOS ONE | https://doi.org/10.1371/journal.pone.0213064 February 28, 2019 16 / 18

22. Benoit DL, Damsgaard M, Andersen MS. Surface marker cluster translation, rotation, scaling and defor-
mation: Their contribution to soft tissue artefact and impact on knee joint kinematics. J Biomech. 2015;
48: 2124–2129. https://doi.org/10.1016/j.jbiomech.2015.02.050 PMID: 25935684
23. Forner-Cordero A, Mateu-Arce M, Forner-Cordero I, Alcantara E, Moreno JC, Pons JL. Study of the
motion artefacts of skin-mounted inertial sensors under different attachment conditions. Physiol Meas.
2008; 29: N21–N31. PMID: 18401071
24. Fiorentino NM, Atkins PR, Kutschke MJ, Goebel JM, Foreman KB, Anderson AE. Soft tissue artifact
causes significant errors in the calculation of joint angles and range of motion at the hip. Gait Posture.
2017; 55: 184–190. https://doi.org/10.1016/j.gaitpost.2017.03.033 PMID: 28475981
25. Barre A, Jolles BM, Theumann N, Aminian K. Soft tissue artifact distribution on lower limbs during tread-
mill gait: Influence of skin markers\textquotesingle location on cluster design. J Biomech. 2015; 48:
1965–1971. https://doi.org/10.1016/j.jbiomech.2015.04.007 PMID: 25920897
26. Bonnet V, Richard V, Camomilla V, Venture G, Cappozzo A, Dumas R. Joint kinematics estimation
using a multi-body kinematics optimisation and an extended Kalman filter, and embedding a soft tissue
artefact model. J Biomech. 2017; 62: 148–155. https://doi.org/10.1016/j.jbiomech.2017.04.033 PMID:
28551098
27. Cockcroft J, Louw Q, Baker R. Proximal placement of lateral thigh skin markers reduces soft tissue arte-
fact during normal gait using the Conventional Gait Model. Comput Methods Biomech Biomed Engin.
2016; 19: 1497–1504. https://doi.org/10.1080/10255842.2016.1157865 PMID: 26929983
28. Dumas R, Cheze L. Soft tissue artifact compensation by linear 3D interpolation and approximation
methods. J Biomech. 2009; 42: 2214–2217. https://doi.org/10.1016/j.jbiomech.2009.06.006 PMID:
19640540
29. Cappello A, Stagni R, Fantozzi S, Leardini A. Soft tissue artifact compensation in knee kinematics by
double anatomical landmark calibration: performance of a novel method during selected motor tasks.
IEEE Trans Biomed Eng. 2005; 52: 992–998. https://doi.org/10.1109/TBME.2005.846728 PMID:
15977729
30. Angeloni C, Cappozzo A, Catani F, Leardini A. Quantification of relative displacement of skin- and
plate-mounted markers with respect to bones. J Biomech. 1993;26.
31. Fasel B, Sporri J, Schutz P, Lorenzetti S, Aminian K. Validation of functional calibration and strap-down
joint drift correction for computing 3D joint angles of knee, hip, and trunk in alpine skiing. PLOS ONE.
2017; 12: e0181446. https://doi.org/10.1371/journal.pone.0181446 PMID: 28746383
32. Robert-Lachaine X, Mecheri H, Larue C, Plamondon A. Accuracy and repeatability of single-pose cali-
bration of inertial measurement units for whole-body motion analysis. Gait Posture. 2017; 54: 80–86.
https://doi.org/10.1016/j.gaitpost.2017.02.029 PMID: 28279850
33. Bergamini E, Ligorio G, Summa A, Vannozzi G, Cappozzo A, Sabatini AM. Estimating orientation using
magnetic and inertial sensors and different sensor fusion approaches: accuracy assessment in manual
and locomotion tasks. Sensors. 2014; 14: 18625–18649. https://doi.org/10.3390/s141018625 PMID:
25302810
34. Leardini A, Sawacha Z, Paolini G, Ingrosso S, Nativo R, Benedetti MG. A new anatomically based pro-
tocol for gait analysis in children. Gait Posture. 2007; 26: 560–571. https://doi.org/10.1016/j.gaitpost.
2006.12.018 PMID: 17291764
35. Manal K, McClay I, Stanhope S, Richards J, Galinat B. Comparison of surface mounted markers and
attachment methods in estimating tibial rotations during walking: an in vivo study. Gait Posture. 2000;
11: 38–45. https://doi.org/10.1016/S0966-6362(99)00042-9 PMID: 10664484
36. Manal K, McClay I, Richards J, Galinat B, Stanhope S. Knee moment profiles during walking: errors due
to soft tissue movement of the shank and the influence of the reference coordinate system. Gait Pos-
ture. 2002; 15: 10–17. https://doi.org/10.1016/S0966-6362(01)00174-6 PMID: 11809576
37. Cutti AG, Ferrari A, Garofalo P, Raggi M, Cappello A, Ferrari A. ‘Outwalk’: a protocol for clinical gait
analysis based on inertial and magnetic sensors. Med Biol Eng Comput. 2009; 48: 17–25. https://doi.
org/10.1007/s11517-009-0545-x PMID: 19911214
38. Eie M, Wei C-S. Generalizations of Euler decomposition and their applications. J Number Theory.
2013; 133: 2475–2495. https://doi.org/10.1016/j.jnt.2013.01.010
39. Bland JM, Altman DG. Measuring agreement in method comparison studies. Stat Methods Med Res.
1999; 8: 135–160. https://doi.org/10.1177/096228029900800204 PMID: 10501650
40. Bland JM, Altman DG. Agreement Between Methods of Measurement with Multiple Observations Per
Individual. J Biopharm Stat. 2007; 17: 571–582. https://doi.org/10.1080/10543400701329422 PMID:
17613642
Validity of inertial sensor based 3D joint kinematics of static and dynamic movements
PLOS ONE | https://doi.org/10.1371/journal.pone.0213064 February 28, 2019 17 / 18

41. Ferrari A, Cutti AG, Cappello A. A new formulation of the coefficient of multiple correlation to assess the
similarity of waveforms measured synchronously by different motion analysis protocols. Gait Posture.
2010; 31: 540–542. https://doi.org/10.1016/j.gaitpost.2010.02.009 PMID: 20303272
42. Koo TK, Li MY. A Guideline of Selecting and Reporting Intraclass Correlation Coefficients for Reliability
Research. J Chiropr Med. 2016; 15: 155–163. https://doi.org/10.1016/j.jcm.2016.02.012 PMID:
27330520
43. Elvin NG, Elvin AA, Arnoczky SP. Correlation between ground reaction force and tibial acceleration in
vertical jumping. J Appl Biomech. 2007; 23: 180–189. PMID: 18089915
44. Thewlis D, Bishop C, Daniell N, Paul G. Next-generation low-cost motion capture systems can provide
comparable spatial accuracy to high-end systems. J Appl Biomech. 2013; 29: 112–117. PMID:
22813783
45. Lebel K, Boissy P, Nguyen H, Duval C. Inertial measurement systems for segments and joints kinemat-
ics assessment: towards an understanding of the variations in sensors accuracy. Biomed Eng OnLine.
2017; 16. https://doi.org/10.1186/s12938-017-0347-6 PMID: 28506273
46. Giavarina D. Understanding Bland Altman analysis. Biochem Medica. 2015; 25: 141–151. https://doi.
org/10.11613/BM.2015.015 PMID: 26110027
47. Davis KE, Ritter MA, Berend ME, Meding JB. The Importance of Range of Motion after Total Hip Arthro-
plasty. Clin Orthop. 2007; 5.
48. Fiorentino NM, Atkins PR, Kutschke MJ, Goebel JM, Foreman KB, Anderson AE. Soft tissue artifact
causes significant errors in the calculation of joint angles and range of motion at the hip. Gait Posture.
2017; 55: 184–190. https://doi.org/10.1016/j.gaitpost.2017.03.033 PMID: 28475981
49. Fasel B, Sporri J, Chardonnens J, Kroll J, Muller E, Aminian K. Joint Inertial Sensor Orientation Drift
Reduction for Highly Dynamic Movements. IEEE J Biomed Health Inform. 2017; 1–1. https://doi.org/10.
1109/jbhi.2017.2659758 PMID: 28141537
50. Peters A, Galna B, Sangeux M, Morris M, Baker R. Quantification of soft tissue artifact in lower limb
human motion analysis: A systematic review. Gait Posture. 2010; 31: 1–8. https://doi.org/10.1016/j.
gaitpost.2009.09.004 PMID: 19853455
Validity of inertial sensor based 3D joint kinematics of static and dynamic movements
PLOS ONE | https://doi.org/10.1371/journal.pone.0213064 February 28, 2019 18 / 18