using the mss to create youth profiles of developmental ... · using the mss to create youth...
TRANSCRIPT
Using the MSS to Create Youth Profiles of Developmental
Skills, Supports, & Challenges
Michael C. RodriguezCampbell Leadership Chair in Education & Human Development
Minnesota Youth Development Research Group
Department of Educational Psychology Michael C. RodriguezCollege of Education & Human Development Campbell Leadership Chair
Anthony AlbanoOkan BulutJulio CabreraYu-Feng ChangRaul GuzmanTahoe Jung
Youngsoon KangStacy KarlYukiko MaedaBrett MorrowKyle NickodemJose Palma
Luke StankeMartin Van BoekelKory VueAri Warshawsky
Research Potential
• MSS is a rich database• Data on student background provides unique access to investigate unique group differences
• Large data base that provides access to deeply investigate unique communities, and to examine variability within a single group

Minnesota Student Survey
• Population survey of students in grades 5, 8, 9, 11• Three forms of the survey (5th, 8th, 9th/11th)• 336 questions on the 9th/11th grade forms• Optional for schools (84% of public districts in 2013)• Administered every 3 years (2013 most recently)• 162,034 students
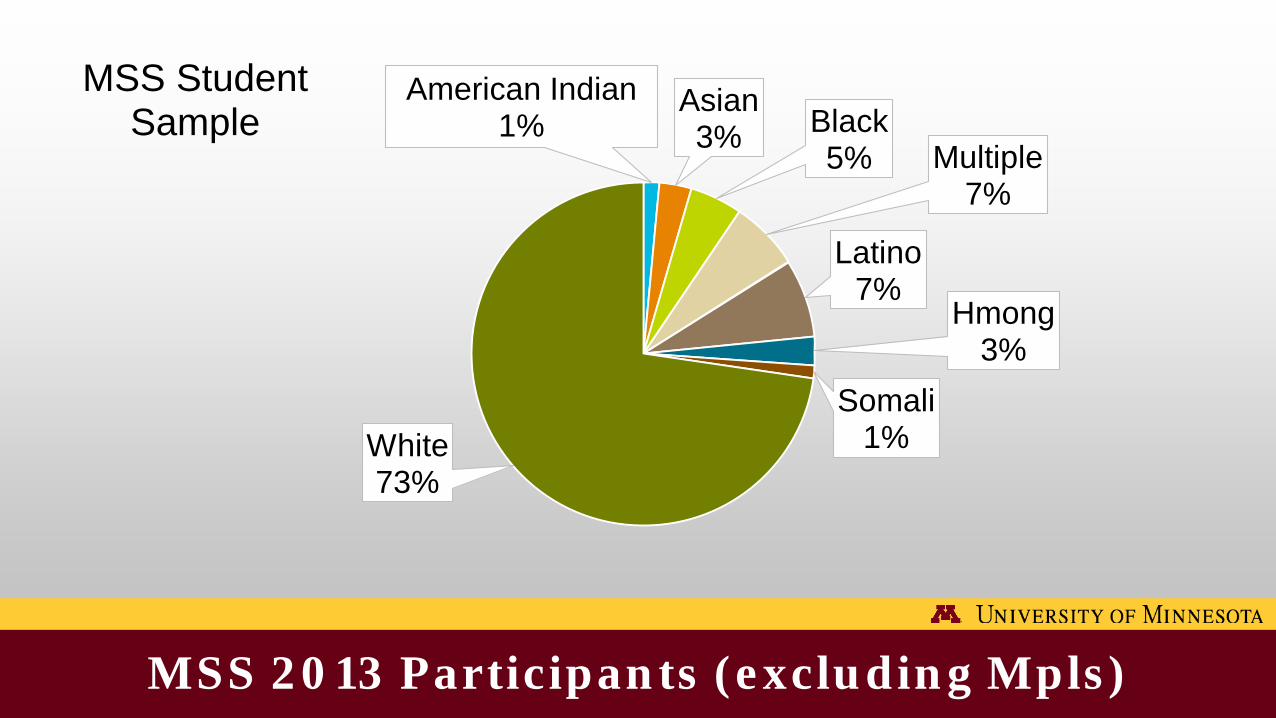
MSS 2013 Participants (excluding Mpls)
American Indian1%
Asian3% Black
5% Multiple7%
Latino7%
Hmong3%
Somali1%White
73%
MSS StudentSample

What we hear from schools
• Too many variables (336)• Item-level data are less meaningful at program, system, and policy levels
• Many districts have limited capacity to work with large databases
• Student group disaggregation is promising• Composite measures are desired

Our Process

Scaling Process
• Using a positive youth development framework and ecological models of development, we identify items related to research-based constructs
• Confirmatory factor analysis is employed to test model-data fit
• Items are calibrated using the Rasch family of measurement models
• Scores are estimated and transformed to support score interpretation
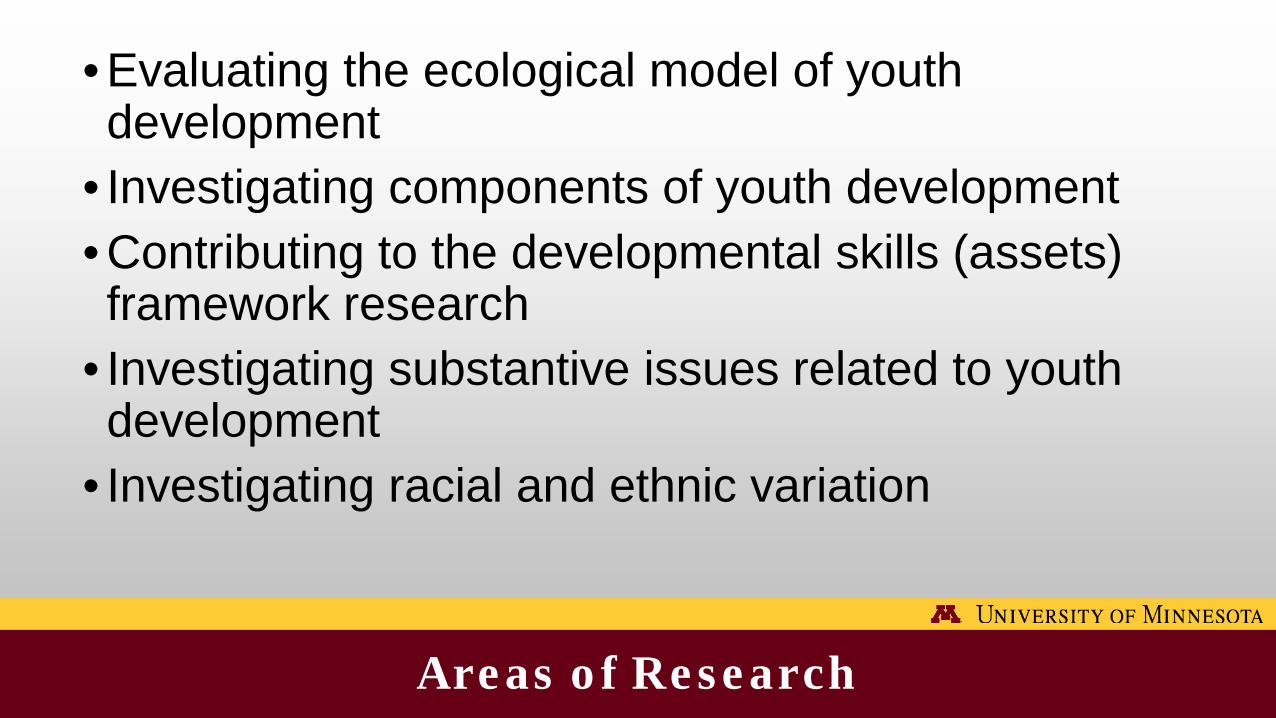
Areas of Research
• Evaluating the ecological model of youth development
• Investigating components of youth development• Contributing to the developmental skills (assets) framework research
• Investigating substantive issues related to youth development
• Investigating racial and ethnic variation

Positive Youth Development
• Youth have an inherent capacity for positive development
• That is enabled and enhanced through multiple meaningful relationships, contexts, and environments
• Where community is a critical delivery system • And youth are major actors in their own development

The work in this area is exploring many aspects of context, all which might influence positive youth development, including success in school and beyond – providing useful information for strong policy development and positive youth development programming.

Ecology of Youth Development
PEERSFAMILY
STUDENT
SCHOOL
NEIGHBORHOOD - COMMUNITY
SOCIETY

Our Current Efforts

Current Efforts
• Demonstrate how items can be used to create meaningful and useful measures to monitor school and district-wide efforts and special programs
• Respond to the efforts of Generation Next to measure aspects of social-emotional learning (providing support for the 6th goal area)
• Provide composite scores to schools regarding developmental skills, supports, and challenges
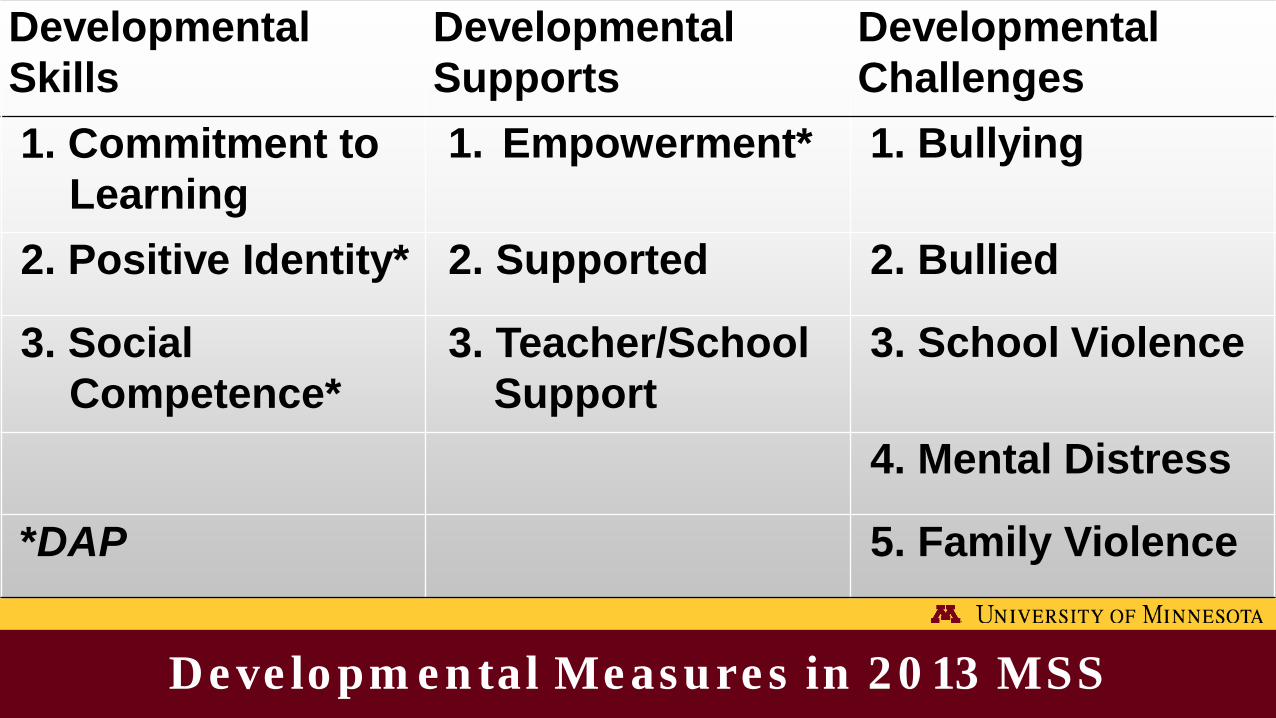
Developmental Measures in 2013 MSS
Developmental Skills
Developmental Supports
Developmental Challenges
1. Commitment to Learning
1. Empowerment* 1. Bullying
2. Positive Identity* 2. Supported 2. Bullied
3. Social Competence*
3. Teacher/School Support
3. School Violence
4. Mental Distress
*DAP 5. Family Violence
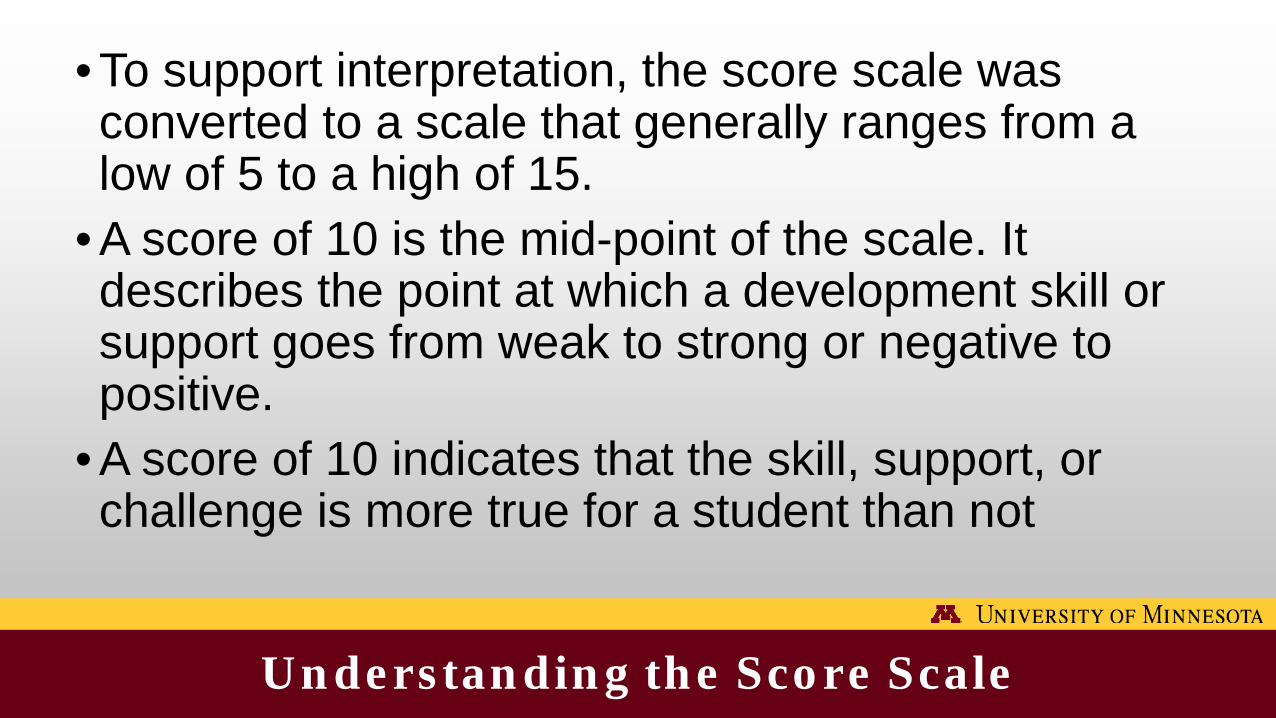
Understanding the Score Scale
• To support interpretation, the score scale was converted to a scale that generally ranges from a low of 5 to a high of 15.
• A score of 10 is the mid-point of the scale. It describes the point at which a development skill or support goes from weak to strong or negative to positive.
• A score of 10 indicates that the skill, support, or challenge is more true for a student than not
Learning about MN Students
Commit to Learning
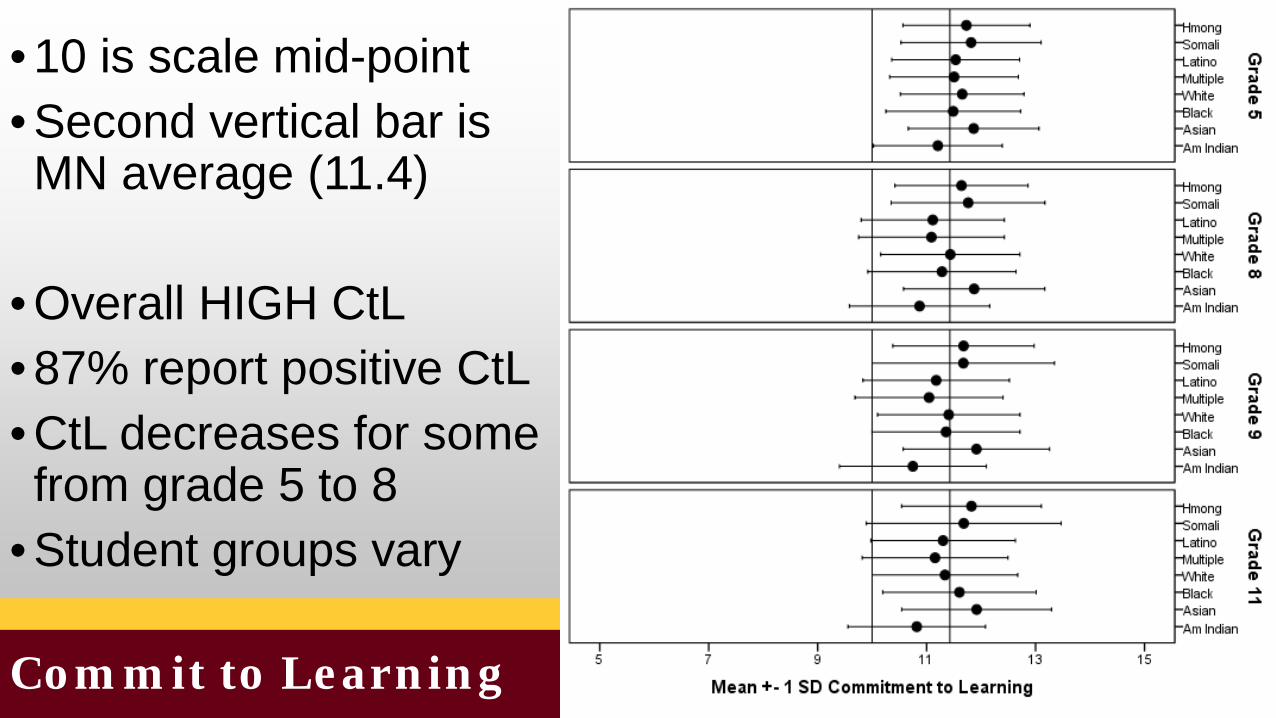
• 10 is scale mid-point• Second vertical bar is MN average (11.4)
• Overall HIGH CtL• 87% report positive CtL• CtL decreases for some from grade 5 to 8
• Student groups vary
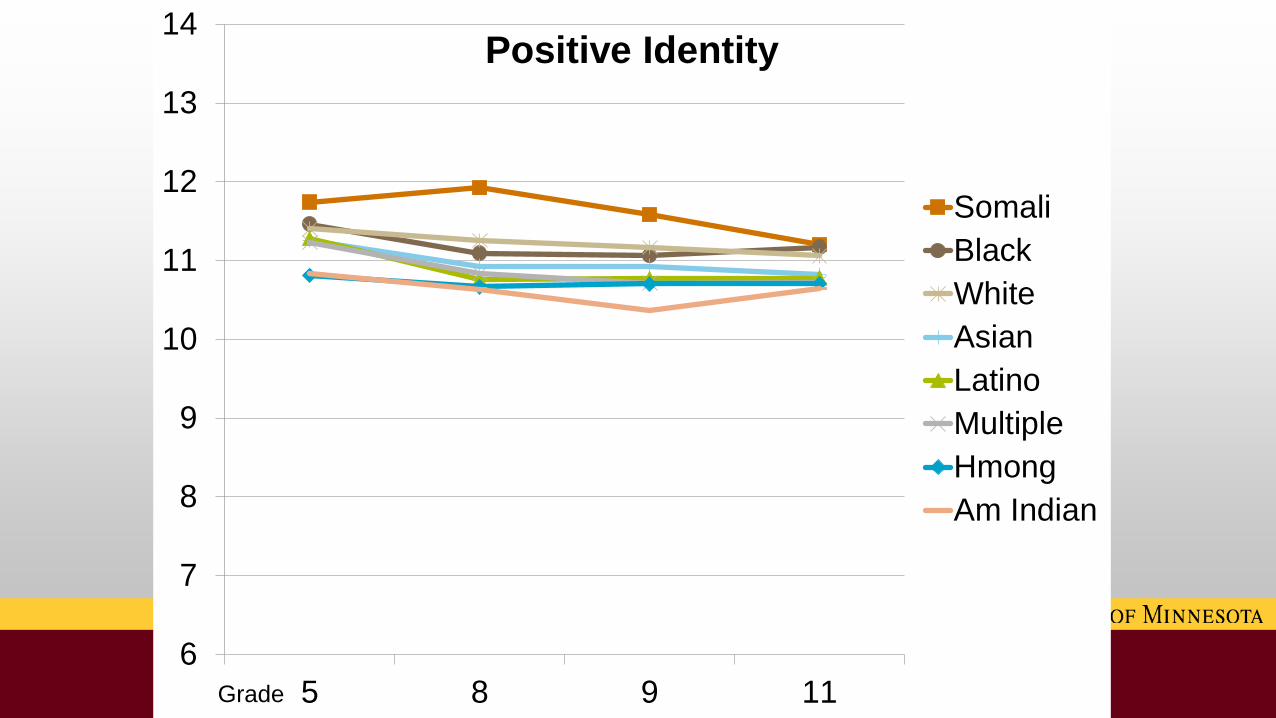
Positive Identity
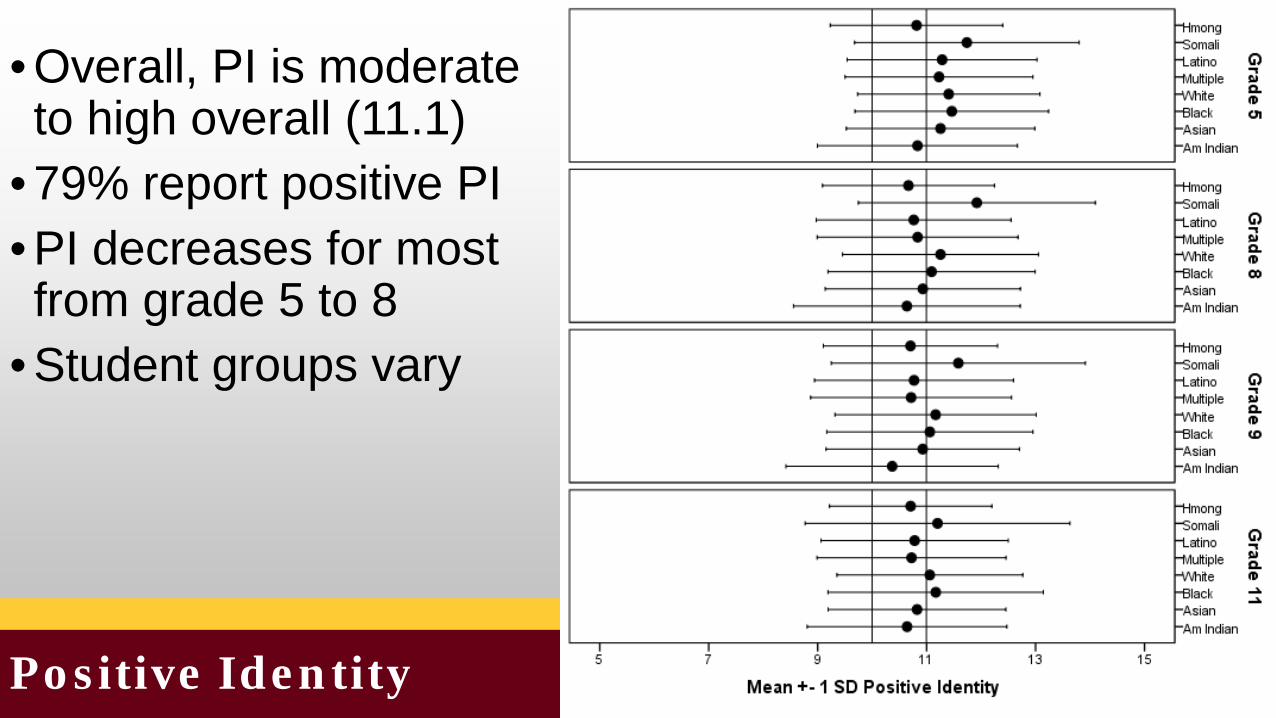
• Overall, PI is moderate to high overall (11.1)
• 79% report positive PI• PI decreases for most from grade 5 to 8
• Student groups vary
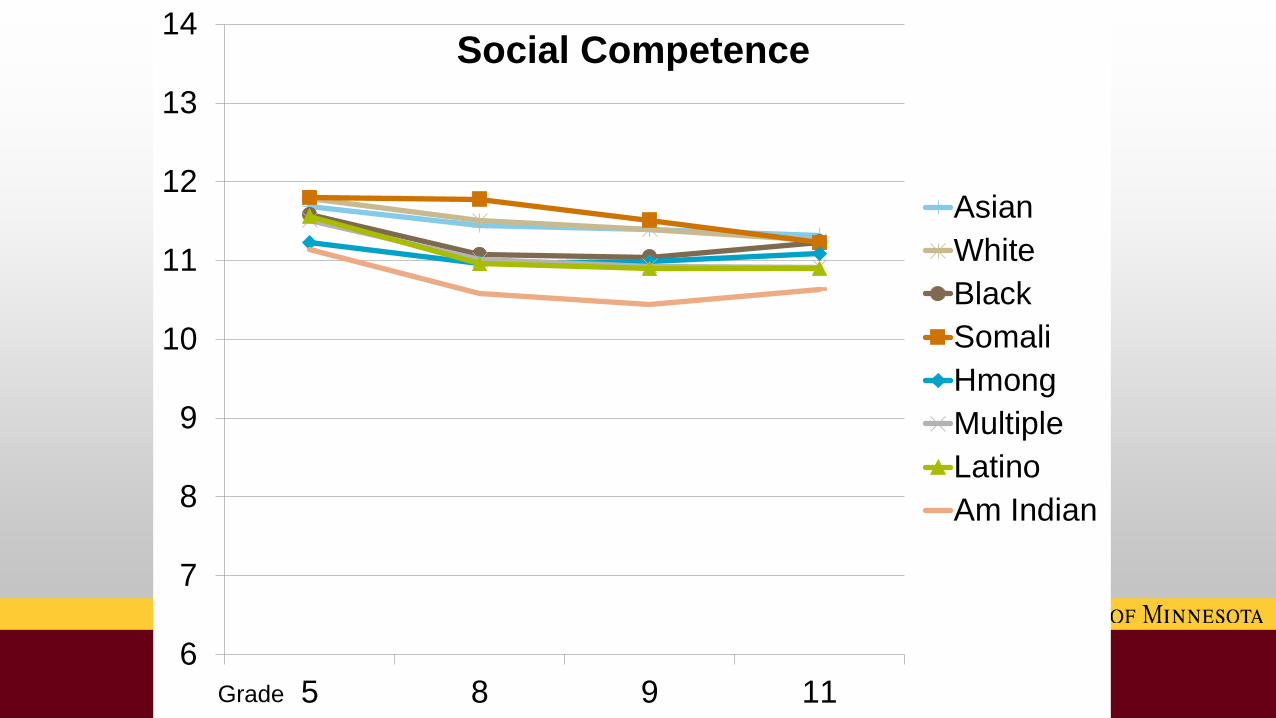
Social Competence
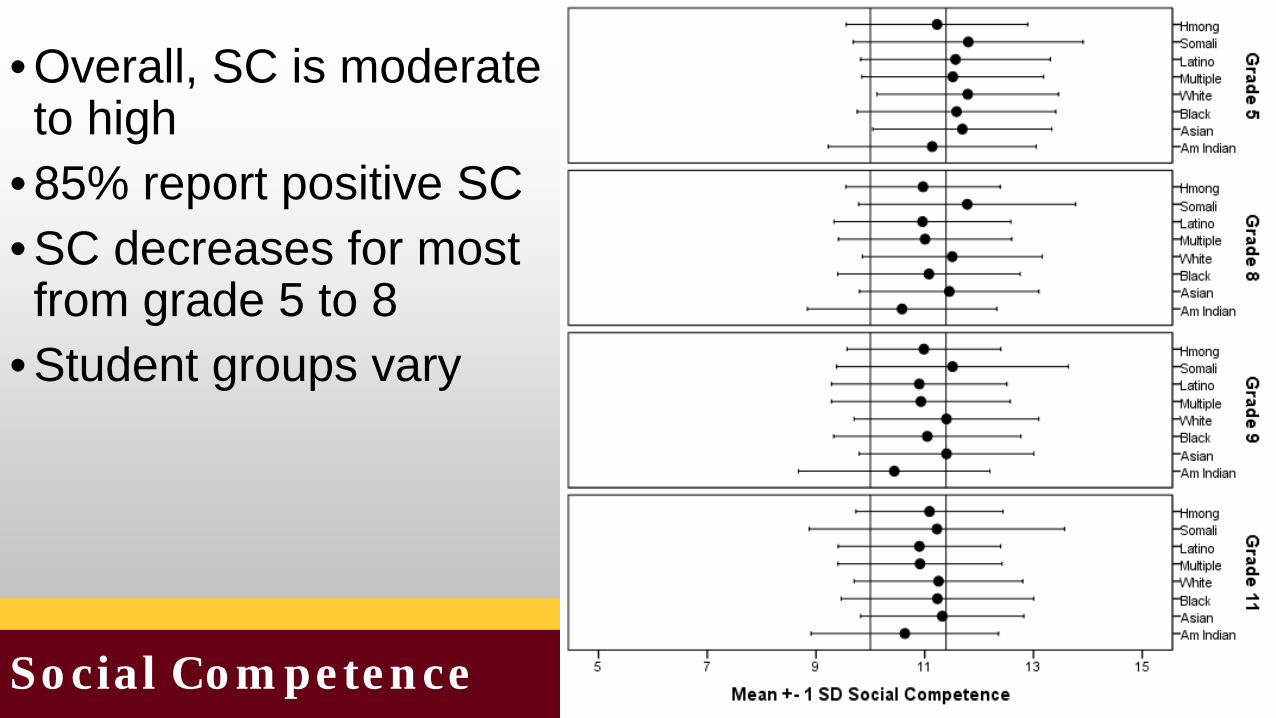
• Overall, SC is moderate to high
• 85% report positive SC• SC decreases for most from grade 5 to 8
• Student groups vary
6
7
8
9
10
11
12
13
14
5 8 9 11
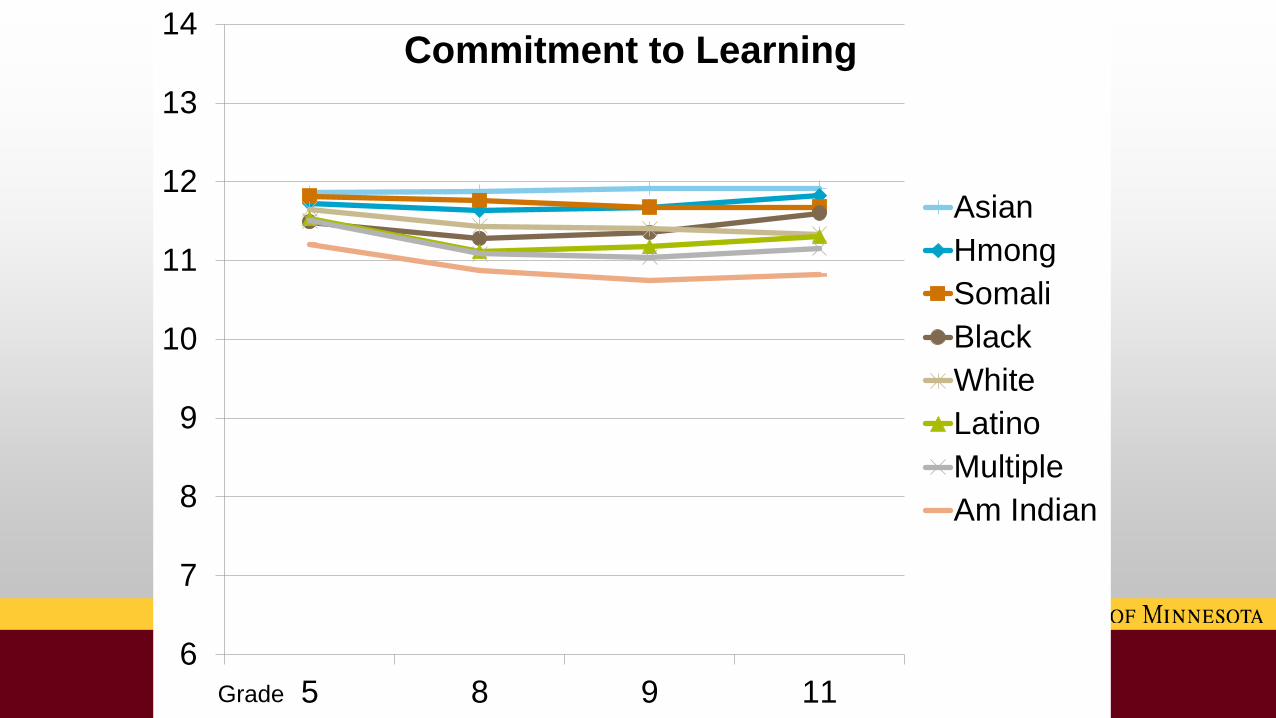
Commitment to Learning
AsianHmongSomaliBlackWhiteLatinoMultipleAm Indian
Grade
6
7
8
9
10
11
12
13
14
5 8 9 11
Social Competence
AsianWhiteBlackSomaliHmongMultipleLatinoAm Indian
Grade
6
7
8
9
10
11
12
13
14
5 8 9 11
Positive Identity
SomaliBlackWhiteAsianLatinoMultipleHmongAm Indian
Grade

6
7
8
9
10
11
12
13
14
5 8 9 11
Empowerment
WhiteSomaliBlackAsianLatinoMultipleAm IndianHmong
Grade
6
7
8
9
10
11
12
13
14
5 8 9 11
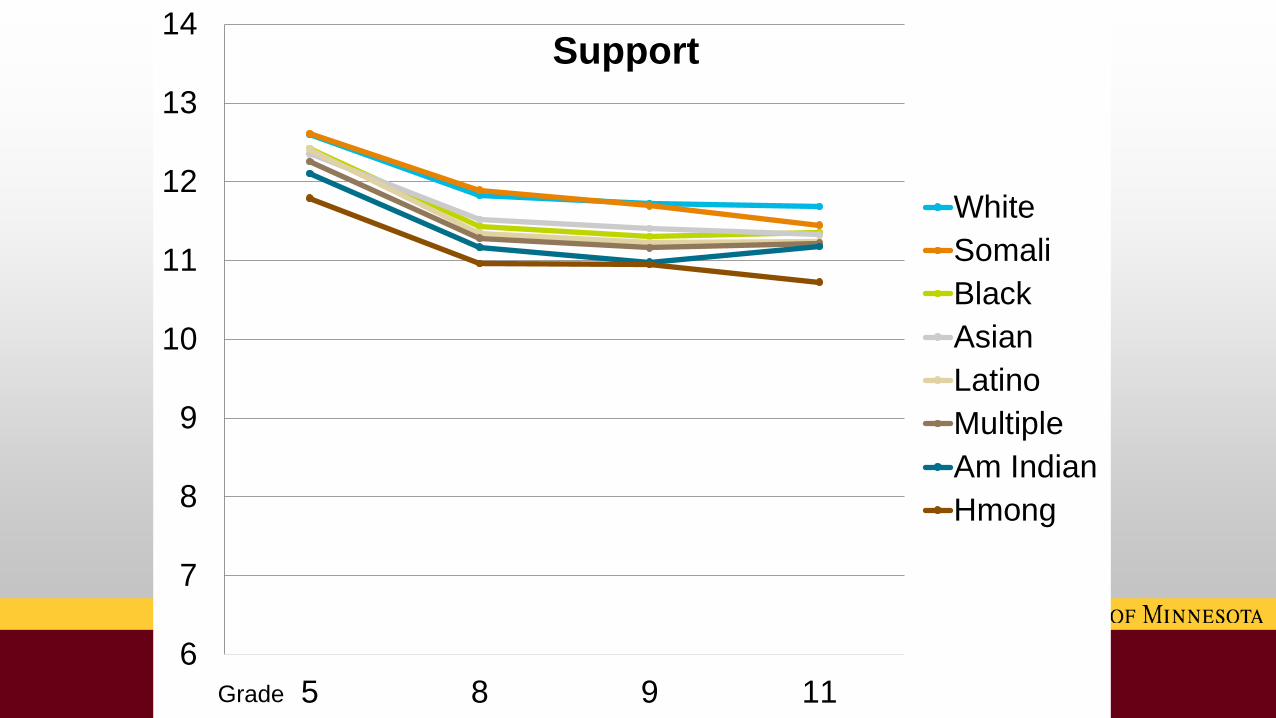
Support
WhiteSomaliBlackAsianLatinoMultipleAm IndianHmong
Grade

6
7
8
9
10
11
12
13
14
5 8 9 11
Teacher/School Support
AsianWhiteHmongSomaliLatinoBlackMultipleAm Indian
Grade
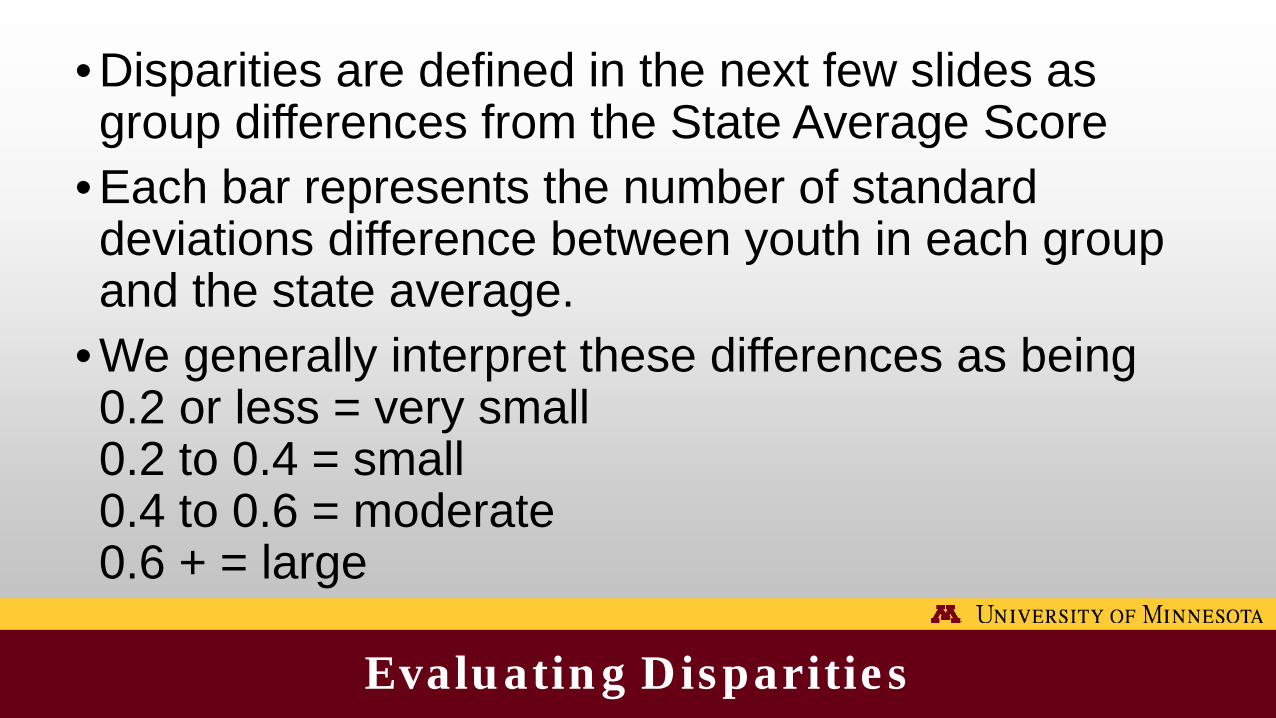
Evaluating Disparities
• Disparities are defined in the next few slides as group differences from the State Average Score
• Each bar represents the number of standard deviations difference between youth in each group and the state average.
• We generally interpret these differences as being 0.2 or less = very small0.2 to 0.4 = small0.4 to 0.6 = moderate0.6 + = large
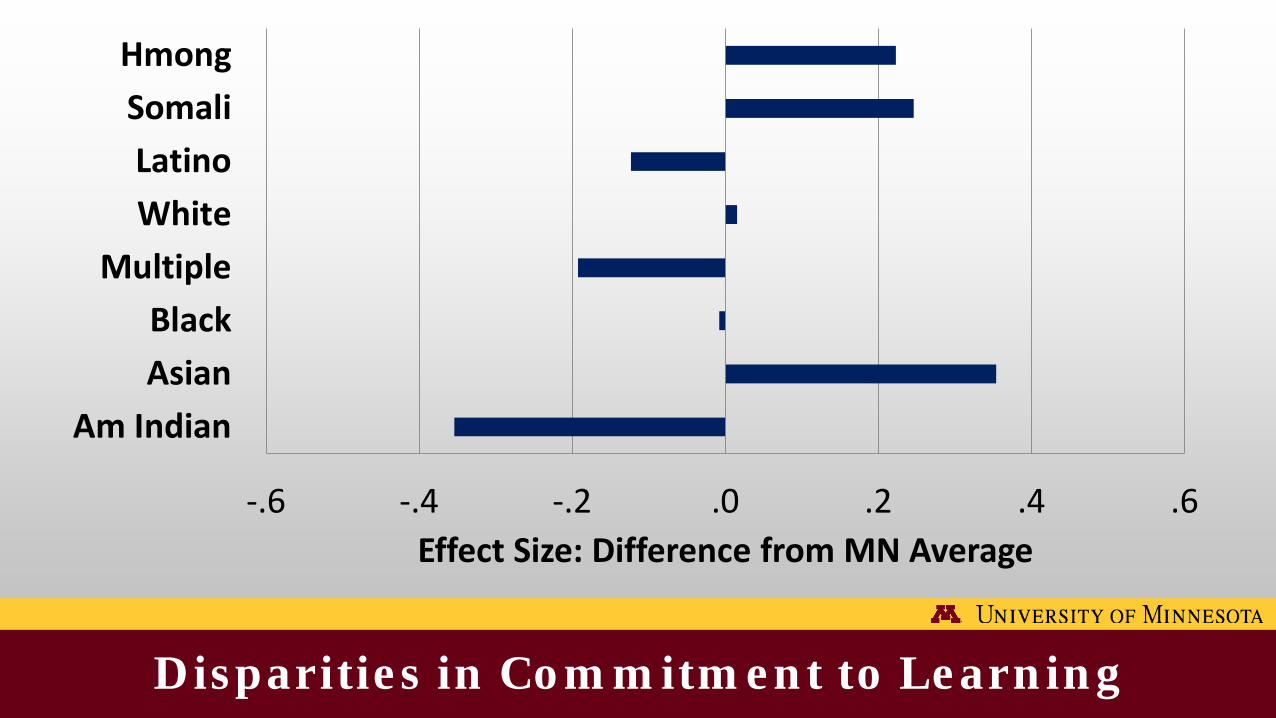
Disparities in Commitment to Learning
-.6 -.4 -.2 .0 .2 .4 .6
Am IndianAsianBlack
MultipleWhiteLatino
SomaliHmong
Effect Size: Difference from MN Average

Disparities in Positive Identity
-.6 -.4 -.2 .0 .2 .4 .6
Am IndianAsianBlack
MultipleWhiteLatino
SomaliHmong
Effect Size: Difference from MN Average

Disparities in Social Competence
-.6 -.4 -.2 .0 .2 .4 .6
Am IndianAsianBlack
MultipleWhiteLatino
SomaliHmong
Effect Size: Difference from MN Average
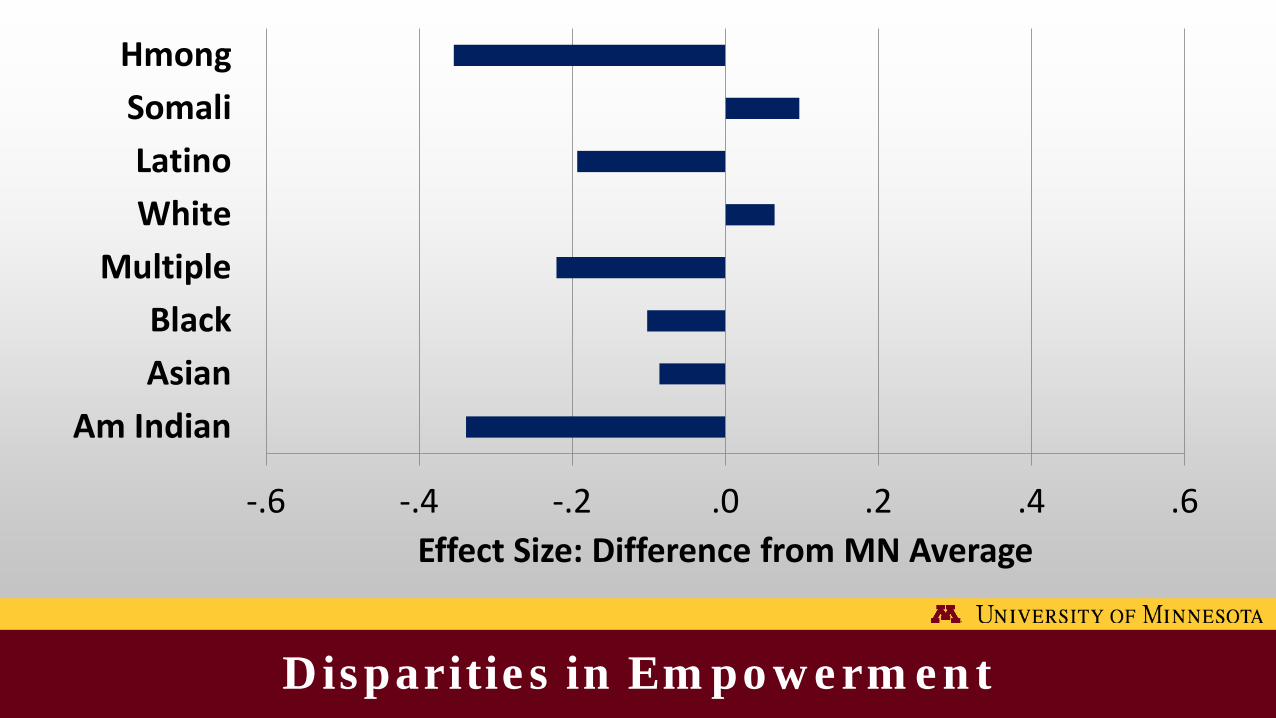
Disparities in Empowerment
-.6 -.4 -.2 .0 .2 .4 .6
Am IndianAsianBlack
MultipleWhiteLatino
SomaliHmong
Effect Size: Difference from MN Average

Disparities in Supported
-.6 -.4 -.2 .0 .2 .4 .6
Am IndianAsianBlack
MultipleWhiteLatino
SomaliHmong
Effect Size: Difference from MN Average
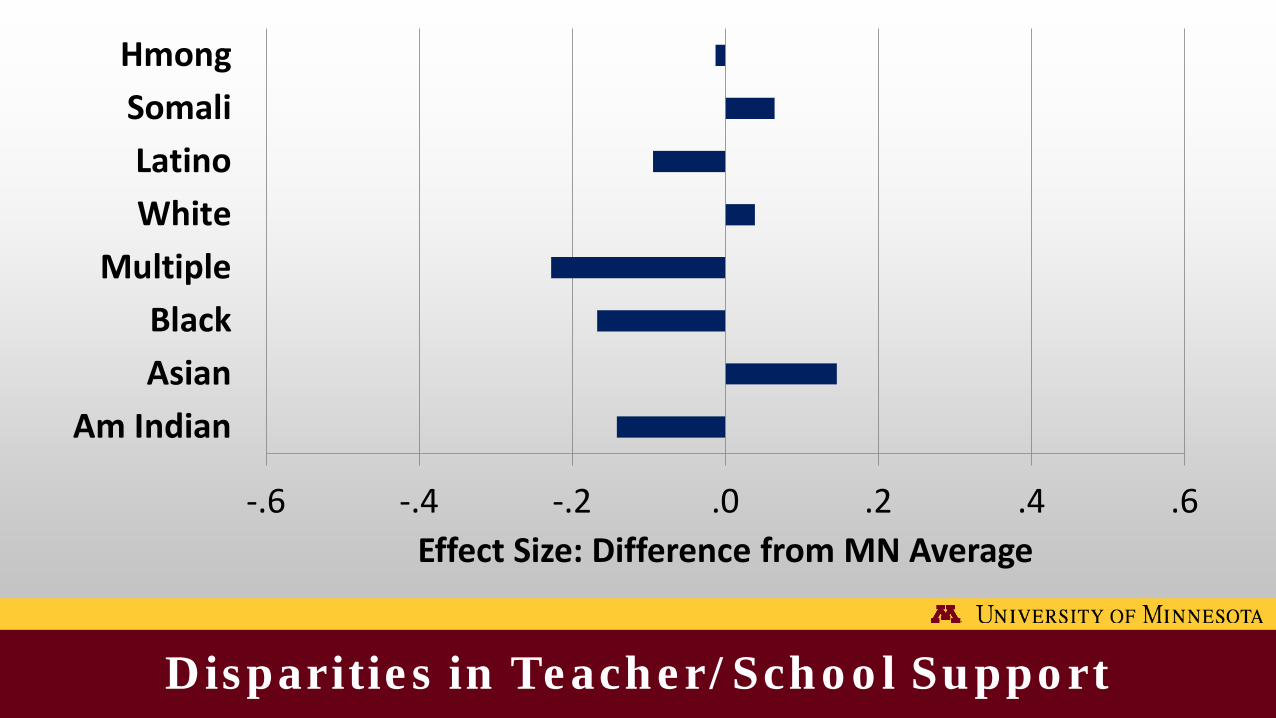
Disparities in Teacher/School Support
-.6 -.4 -.2 .0 .2 .4 .6
Am IndianAsianBlack
MultipleWhiteLatino
SomaliHmong
Effect Size: Difference from MN Average
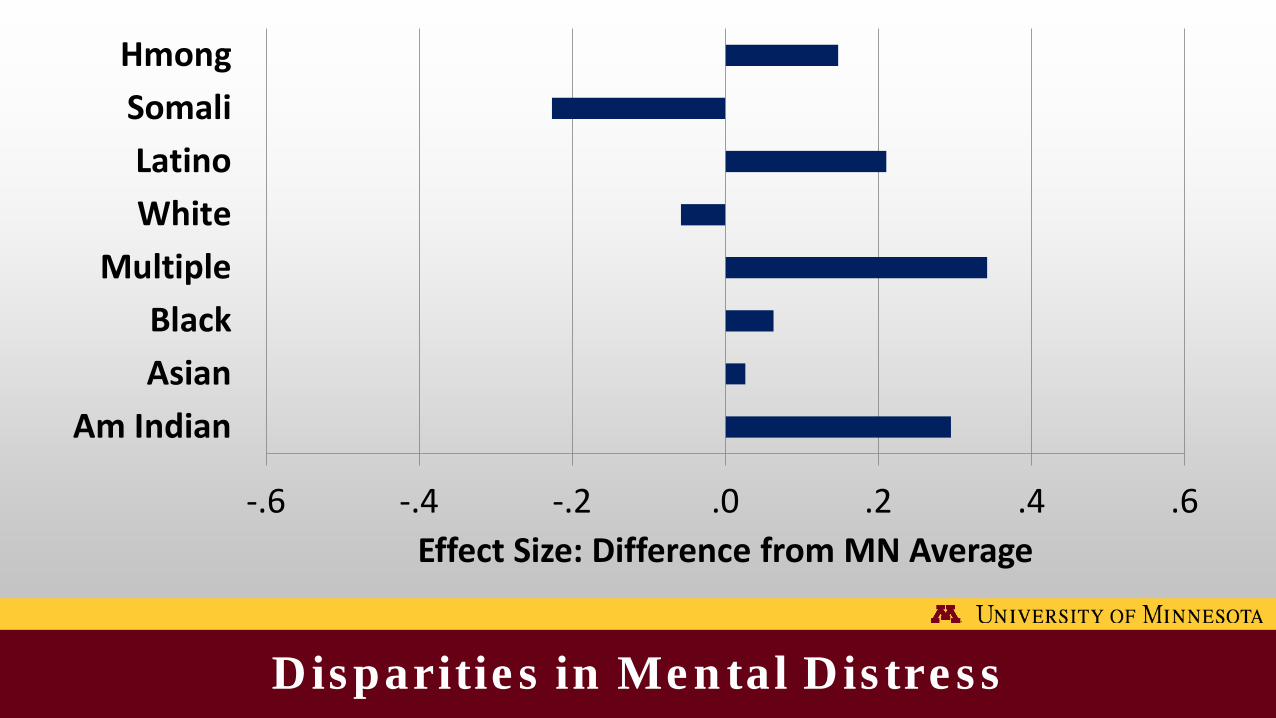
Disparities in Mental Distress
-.6 -.4 -.2 .0 .2 .4 .6
Am IndianAsianBlack
MultipleWhiteLatino
SomaliHmong
Effect Size: Difference from MN Average
Disparities in Developmental Skills v. Achievement
• Since we use a common effect size – the difference between groups in standard deviations, we can compare disparities in developmental skills with those we see in achievement (achievement gaps).
• Similar data was obtained for 2013 MN Student Survey and the 2013 state MCA tests in Reading and Mathematics.
• We see much larger disparities in achievement than we do with Developmental Skills.

8th Grade MCA & CtL Disparities v. White
-1.0 -0.8 -0.6 -0.4 -0.2 0.0 0.2 0.4
Am Indian
Asian
Black
Latino
Reading Math CTL Commitment to Learning
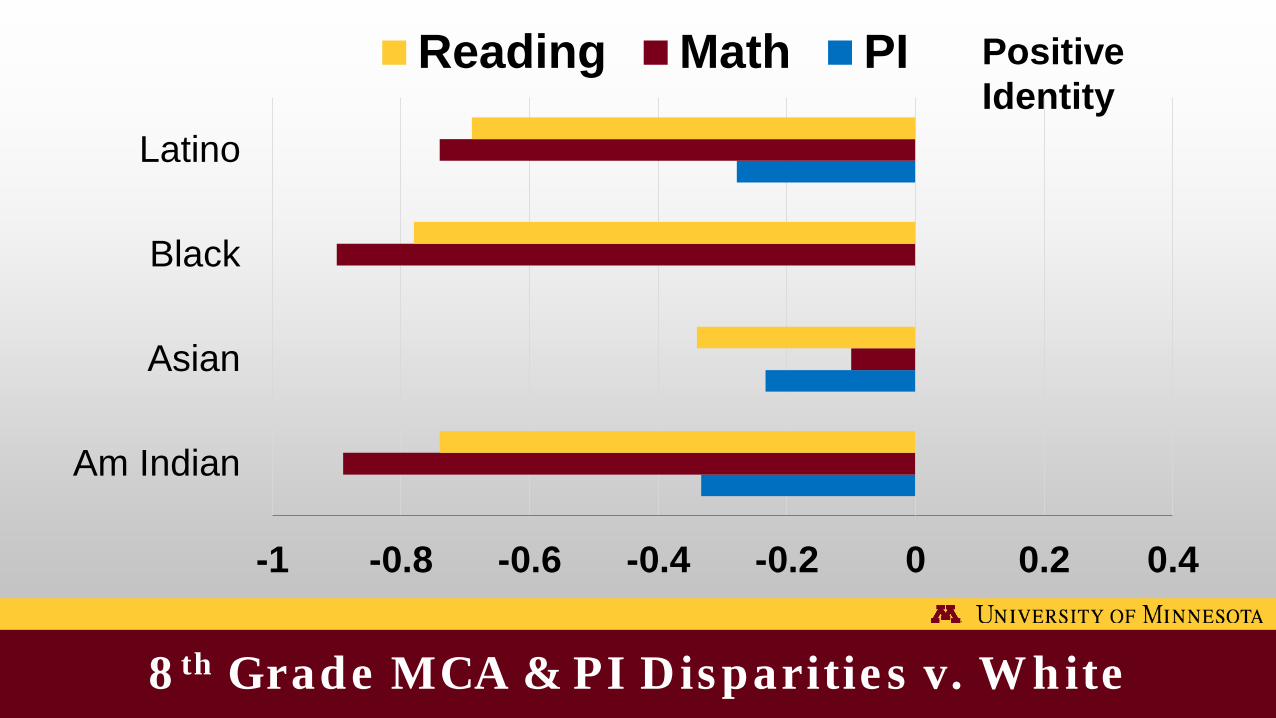
8th Grade MCA & PI Disparities v. White
-1 -0.8 -0.6 -0.4 -0.2 0 0.2 0.4
Am Indian
Asian
Black
Latino
Reading Math PI Positive Identity
Generation Next
Equipped for Learning
Equipped for Learning
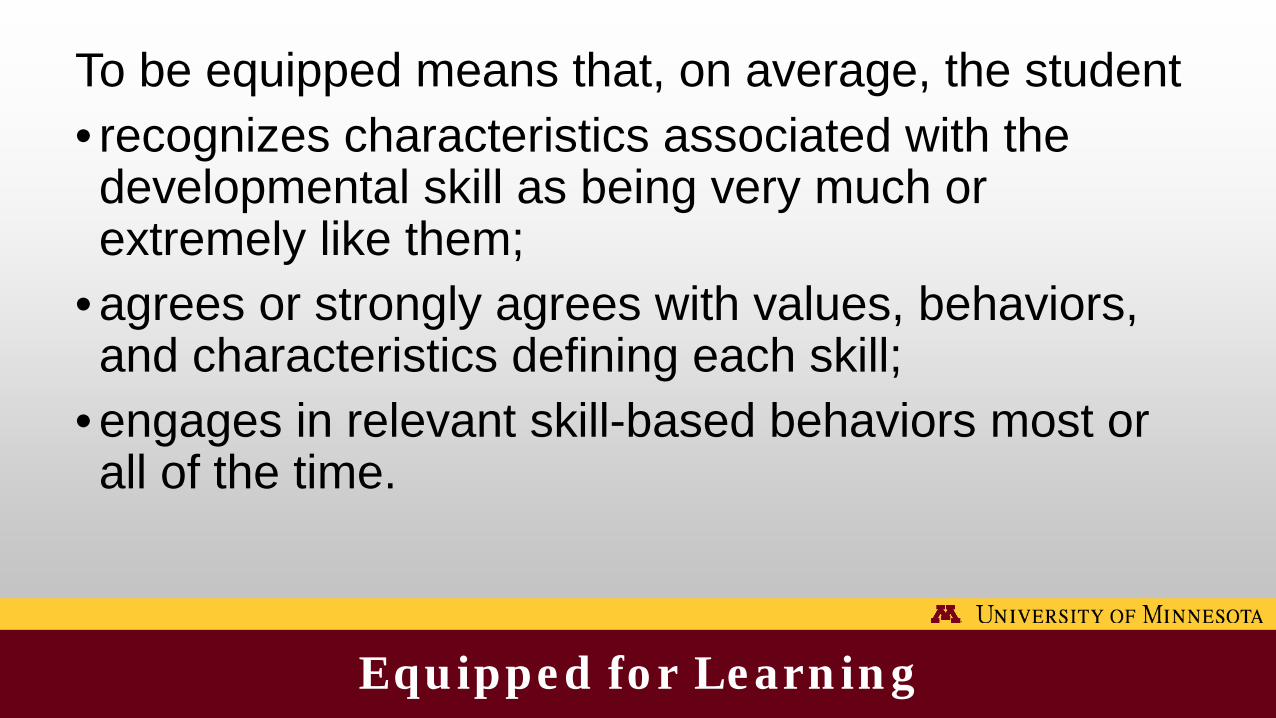
To be equipped means that, on average, the student• recognizes characteristics associated with the developmental skill as being very much or extremely like them;
• agrees or strongly agrees with values, behaviors, and characteristics defining each skill;
• engages in relevant skill-based behaviors most or all of the time.
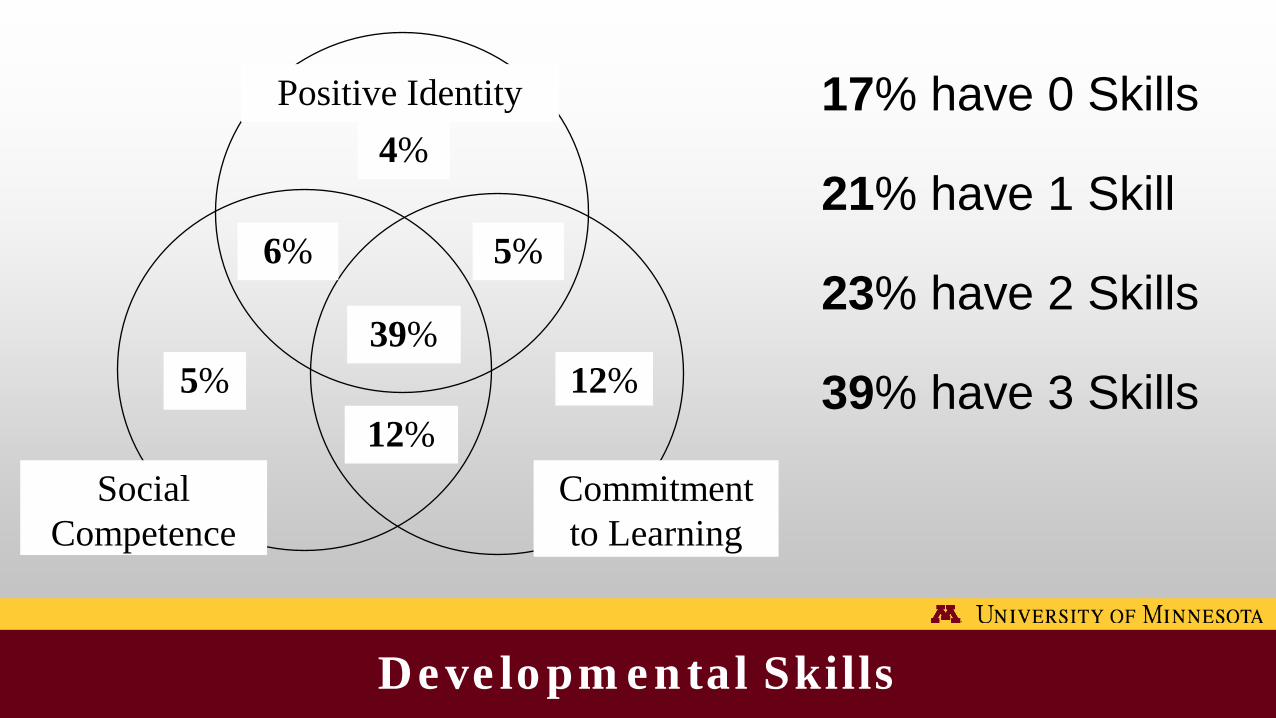
Developmental Skills
Positive Identity
Social Competence
Commitment to Learning
4%
5% 12%
6% 5%
39%
12%
17% have 0 Skills
21% have 1 Skill
23% have 2 Skills
39% have 3 Skills
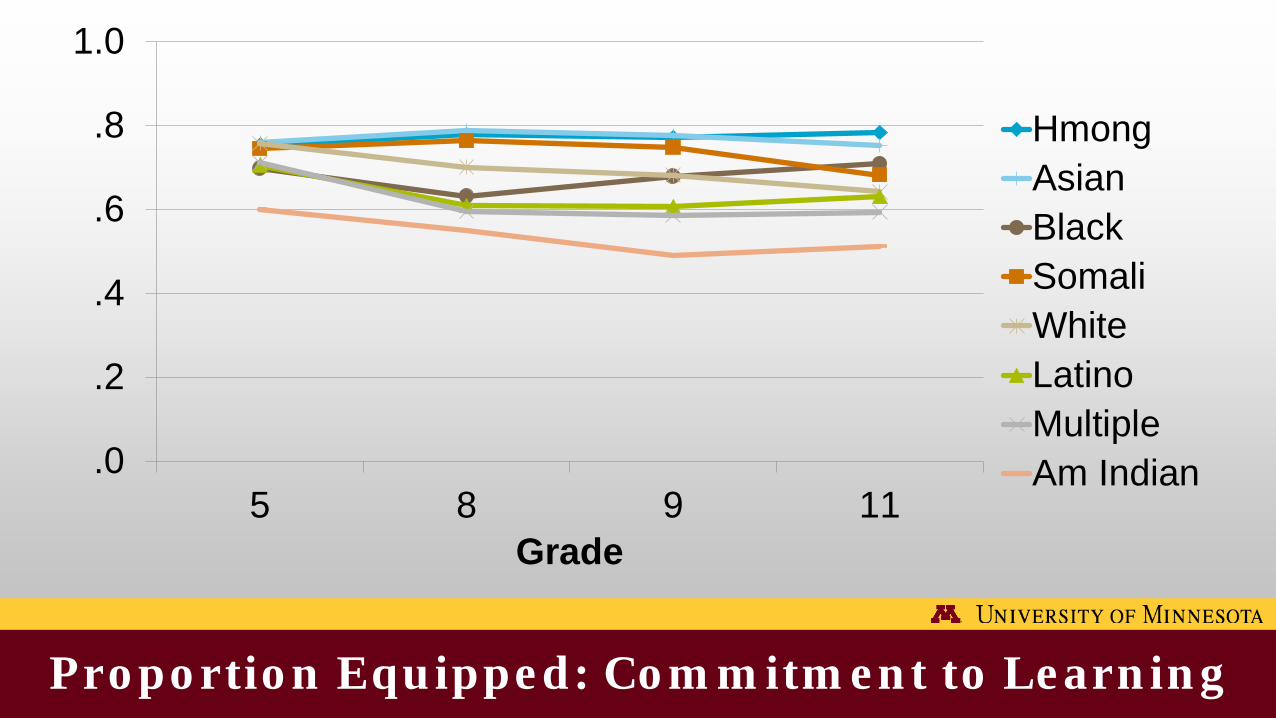
Proportion Equipped: Commitment to Learning
.0
.2
.4
.6
.8
1.0
5 8 9 11Grade
HmongAsianBlackSomaliWhiteLatinoMultipleAm Indian
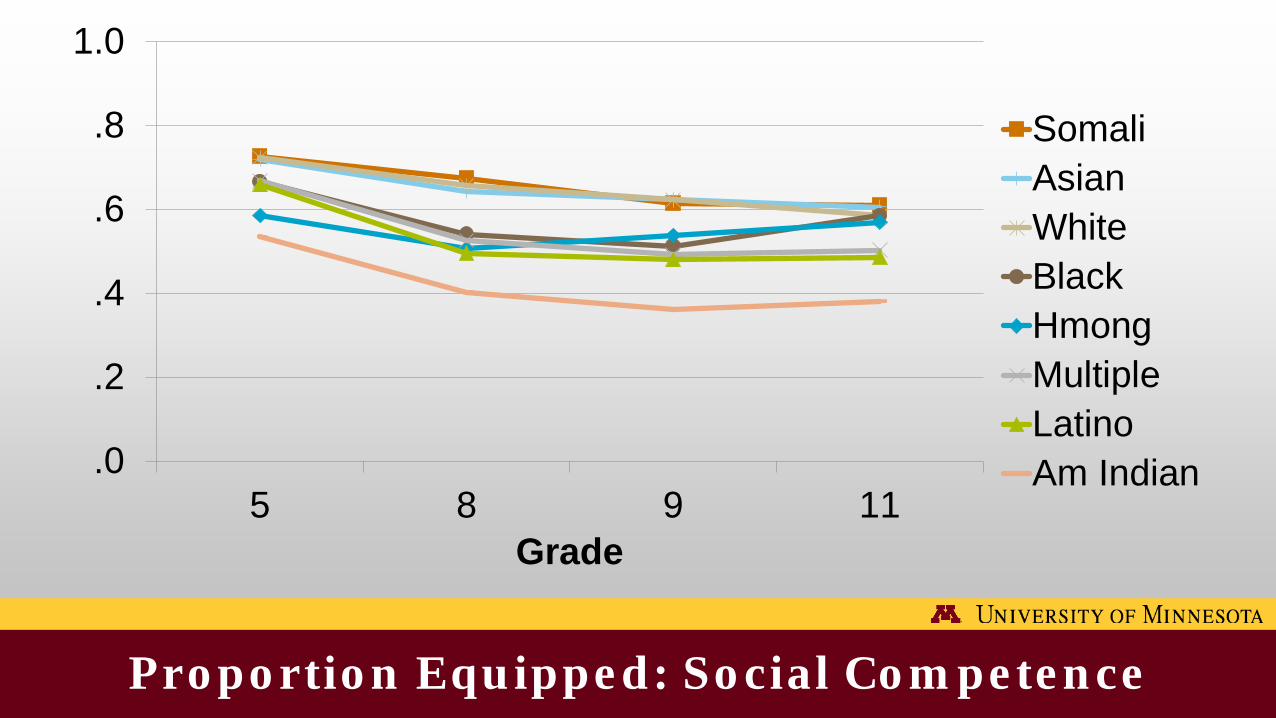
Proportion Equipped: Social Competence
.0
.2
.4
.6
.8
1.0
5 8 9 11Grade
SomaliAsianWhiteBlackHmongMultipleLatinoAm Indian
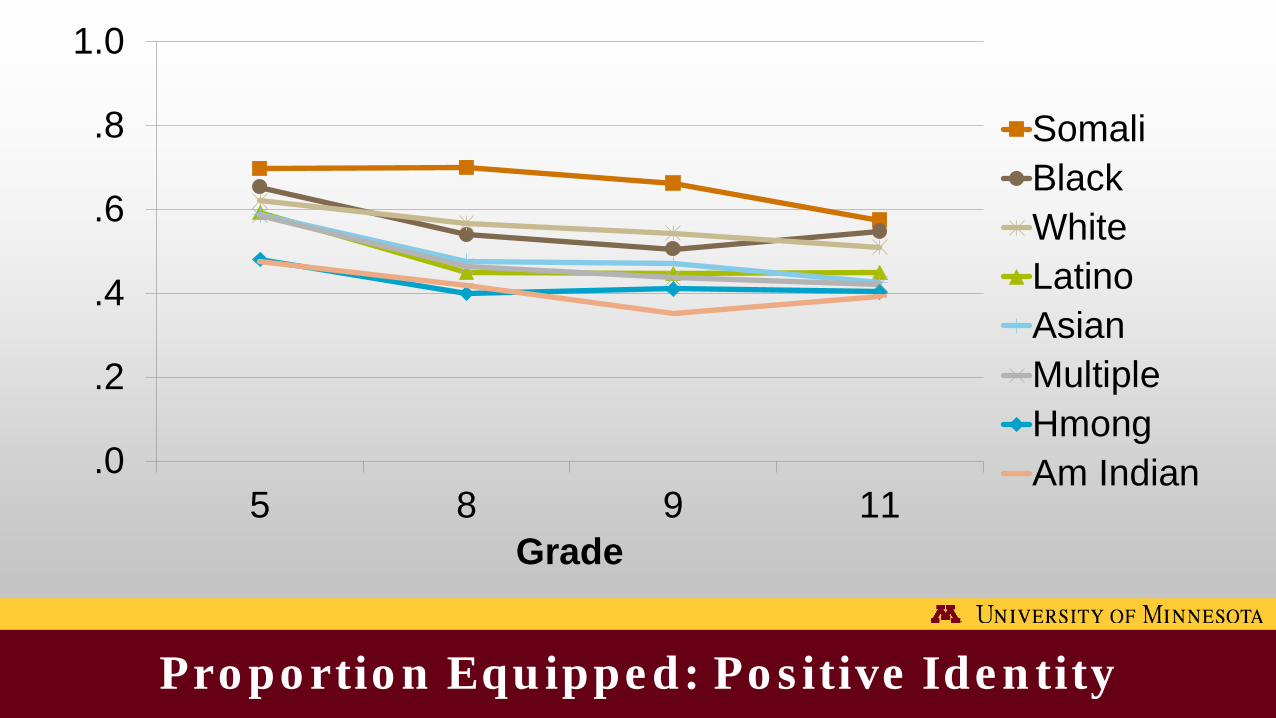
Proportion Equipped: Positive Identity
.0
.2
.4
.6
.8
1.0
5 8 9 11Grade
SomaliBlackWhiteLatinoAsianMultipleHmongAm Indian

Unending Questions…
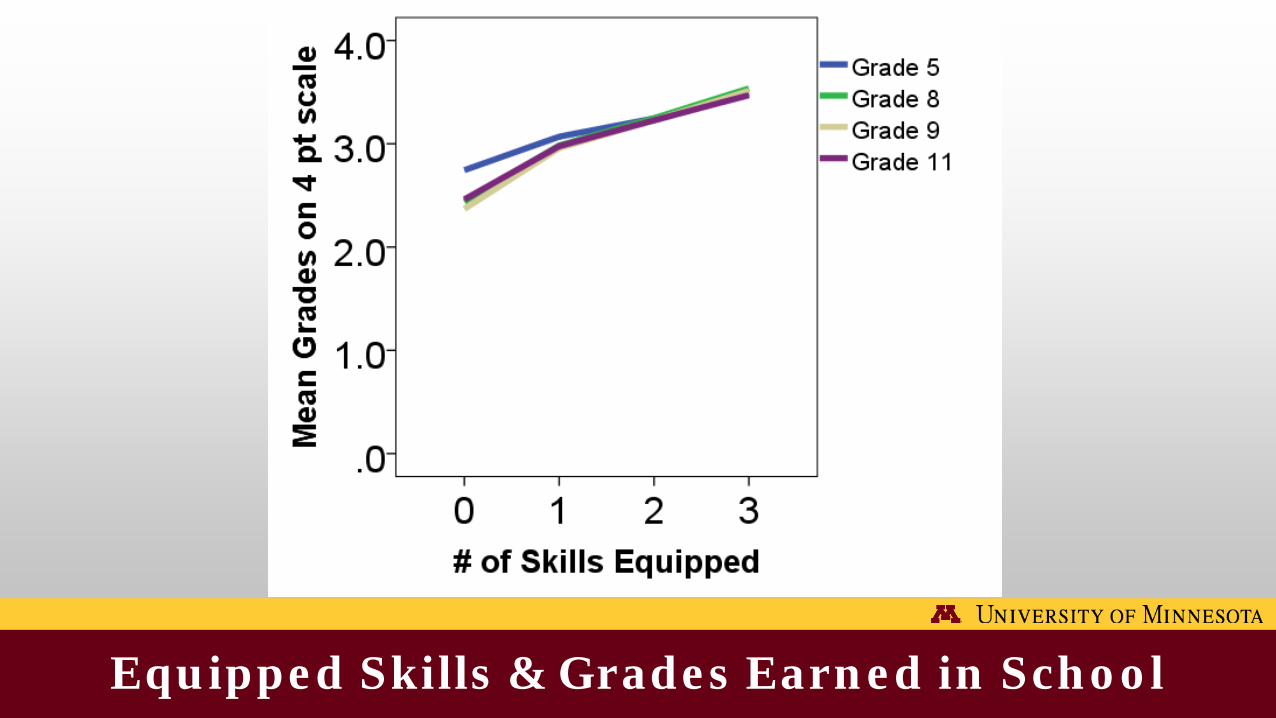
Equipped Skills & Grades Earned in School

Equipped Skills & Afterschool Participation
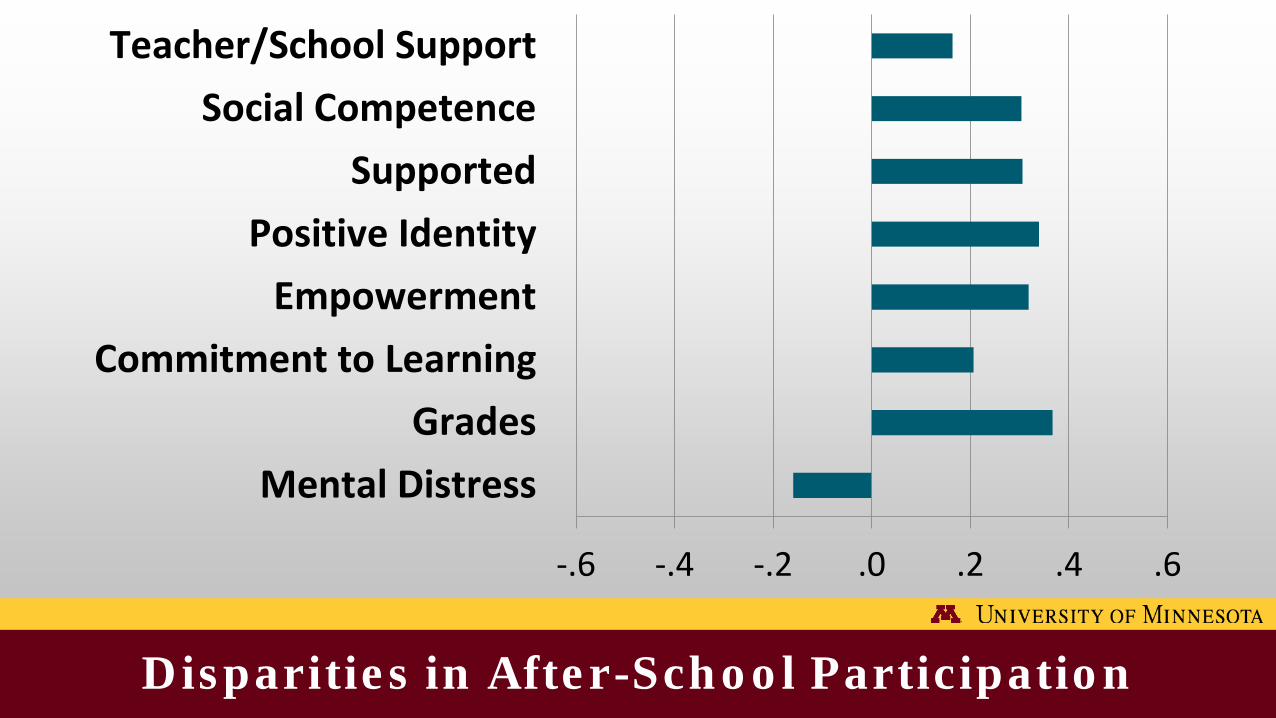
-.6 -.4 -.2 .0 .2 .4 .6
Mental DistressGrades
Commitment to LearningEmpowerment
Positive IdentitySupported
Social CompetenceTeacher/School Support
Disparities in After-School Participation
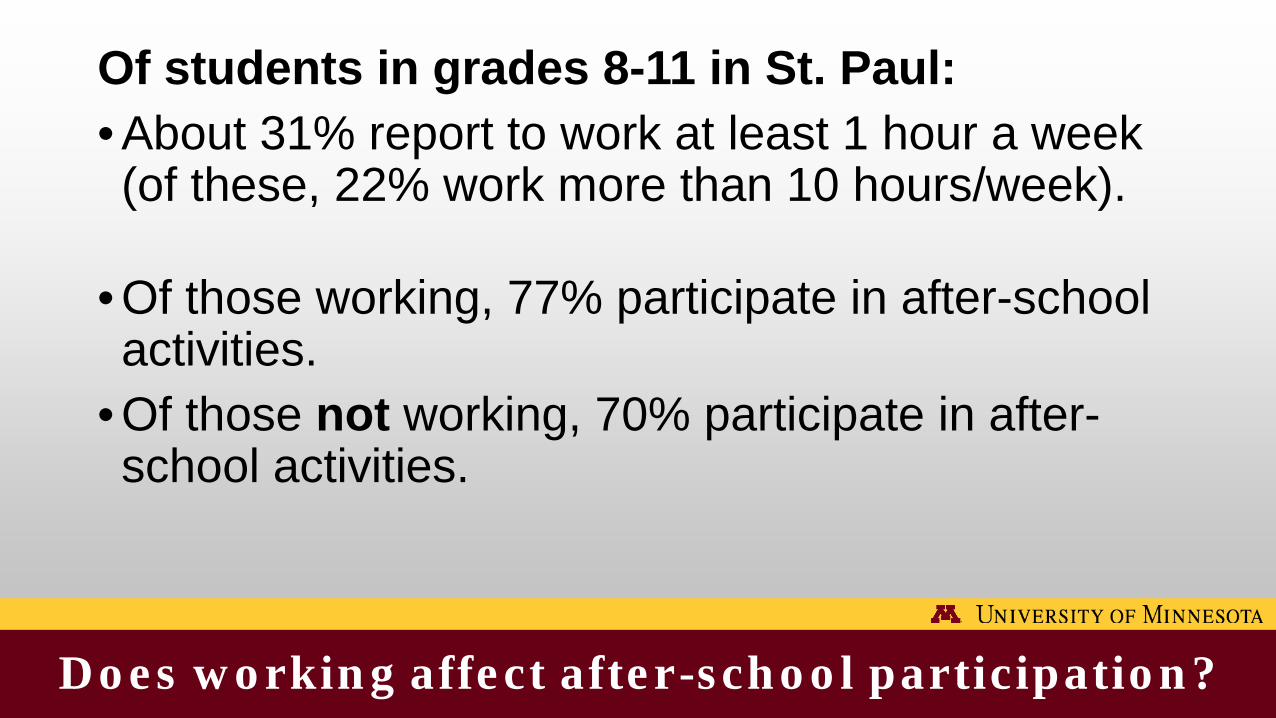
Of students in grades 8-11 in St. Paul:• About 31% report to work at least 1 hour a week (of these, 22% work more than 10 hours/week).
• Of those working, 77% participate in after-school activities.
• Of those not working, 70% participate in after-school activities.
Does working affect after-school participation?
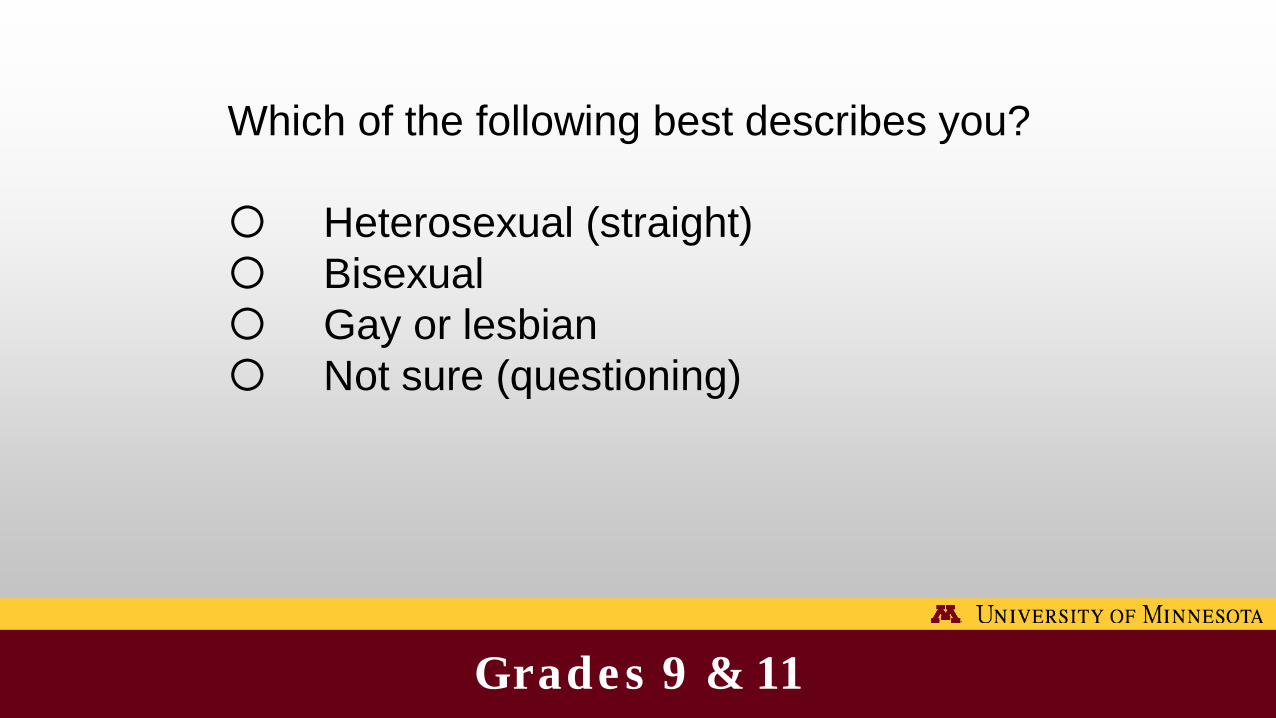
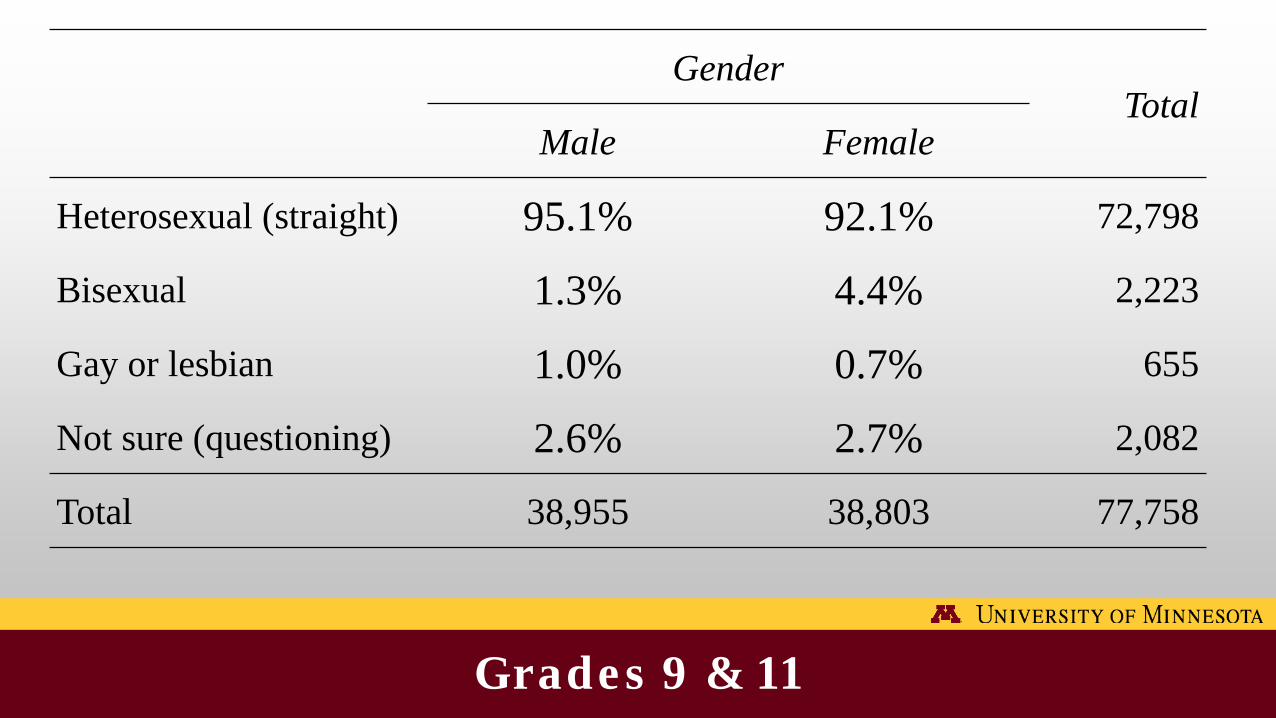
Grades 9 & 11
Which of the following best describes you?
Heterosexual (straight) Bisexual Gay or lesbian Not sure (questioning)
Grades 9 & 11
GenderTotal
Male Female
Heterosexual (straight) 95.1% 92.1% 72,798
Bisexual 1.3% 4.4% 2,223
Gay or lesbian 1.0% 0.7% 655
Not sure (questioning) 2.6% 2.7% 2,082
Total 38,955 38,803 77,758
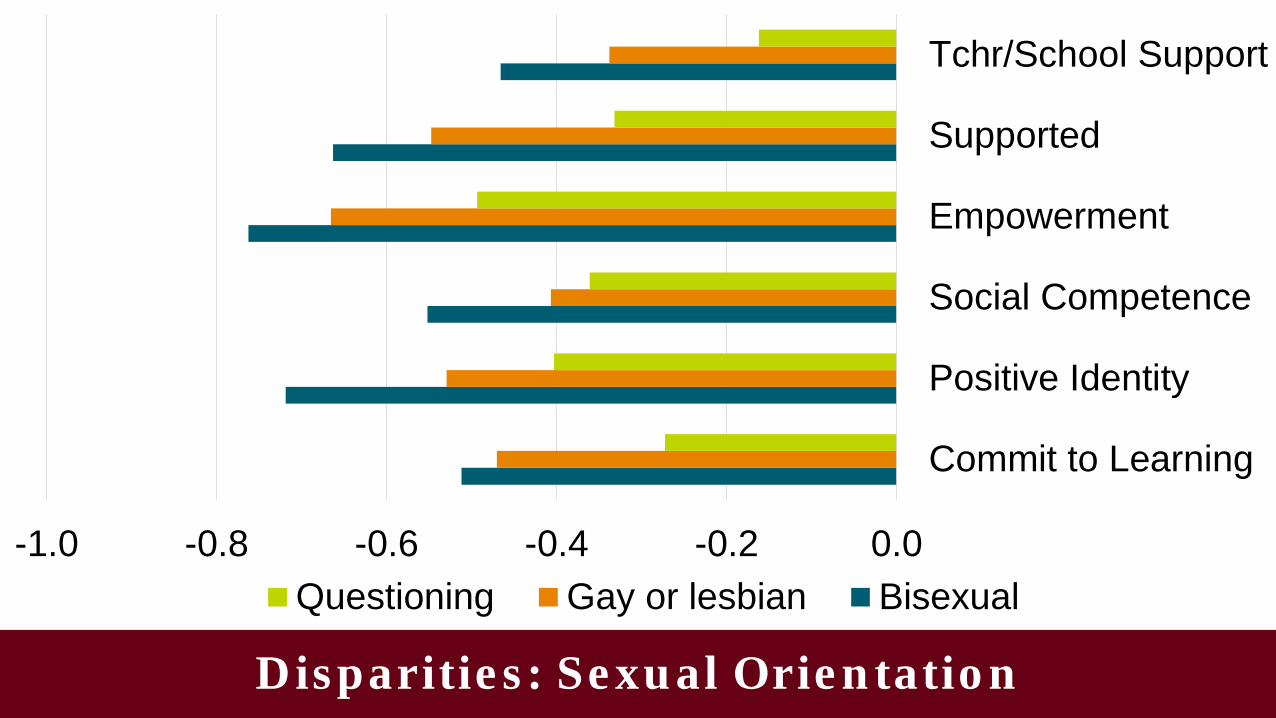
Disparities: Sexual Orientation
-1.0 -0.8 -0.6 -0.4 -0.2 0.0
Commit to Learning
Positive Identity
Social Competence
Empowerment
Supported
Tchr/School Support
Questioning Gay or lesbian Bisexual
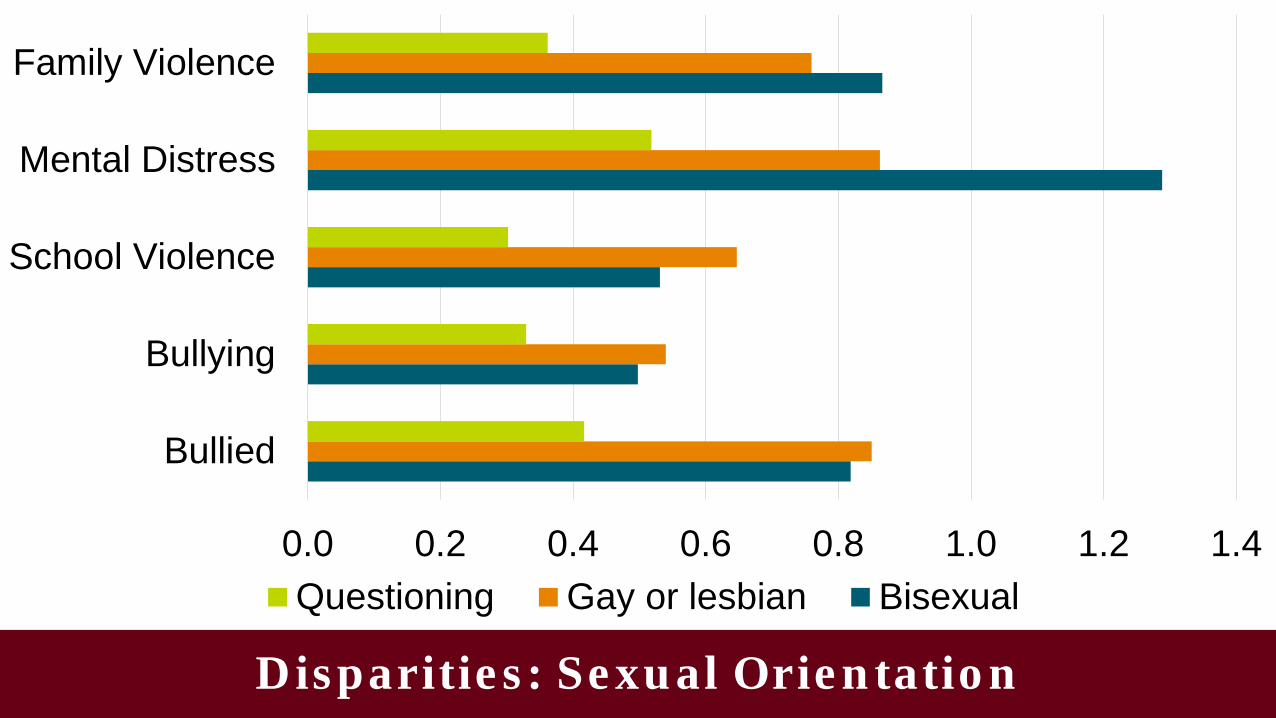
Disparities: Sexual Orientation
0.0 0.2 0.4 0.6 0.8 1.0 1.2 1.4
Bullied
Bullying
School Violence
Mental Distress
Family Violence
Questioning Gay or lesbian Bisexual
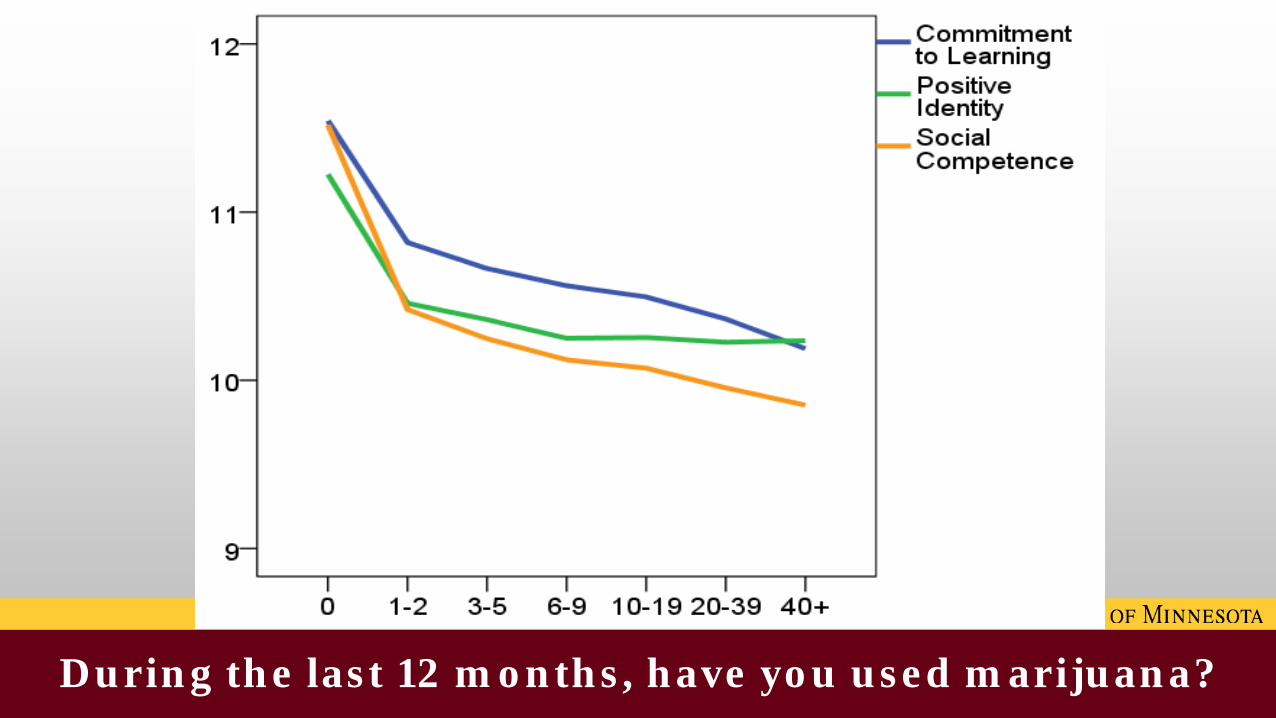
During the last 12 months, have you used marijuana?
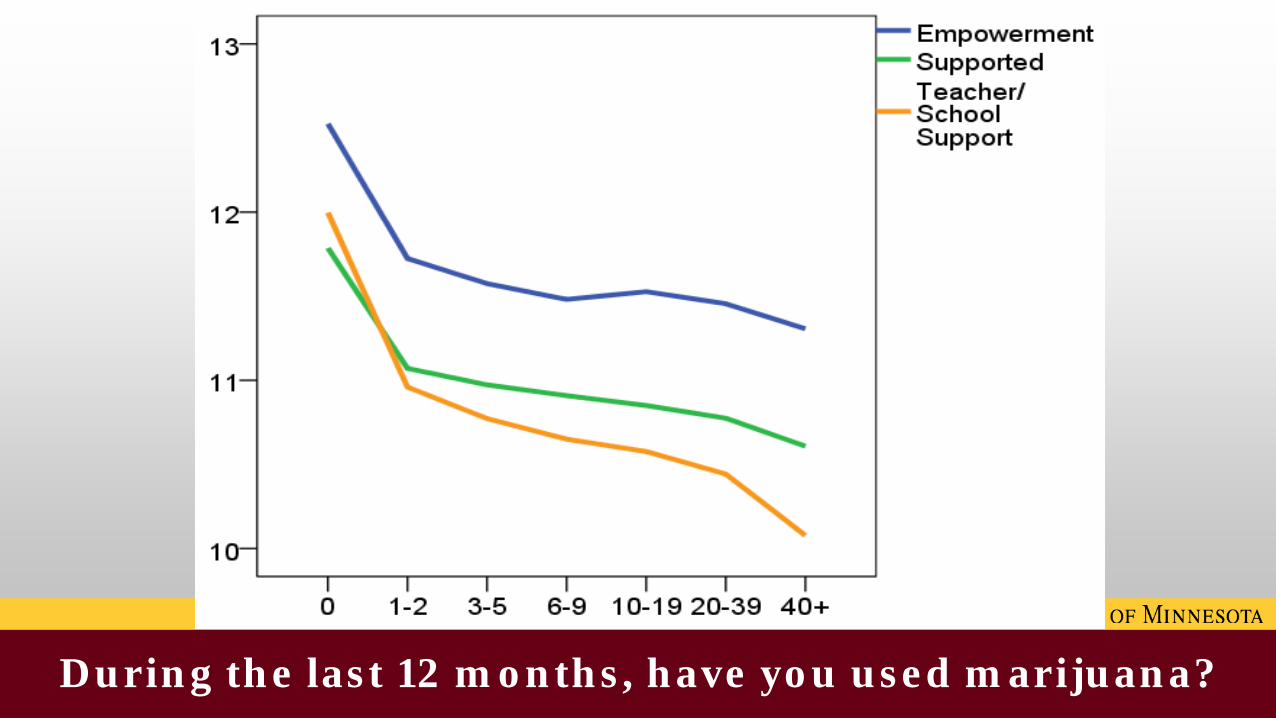
During the last 12 months, have you used marijuana?

During the last 12 months, have you used marijuana?
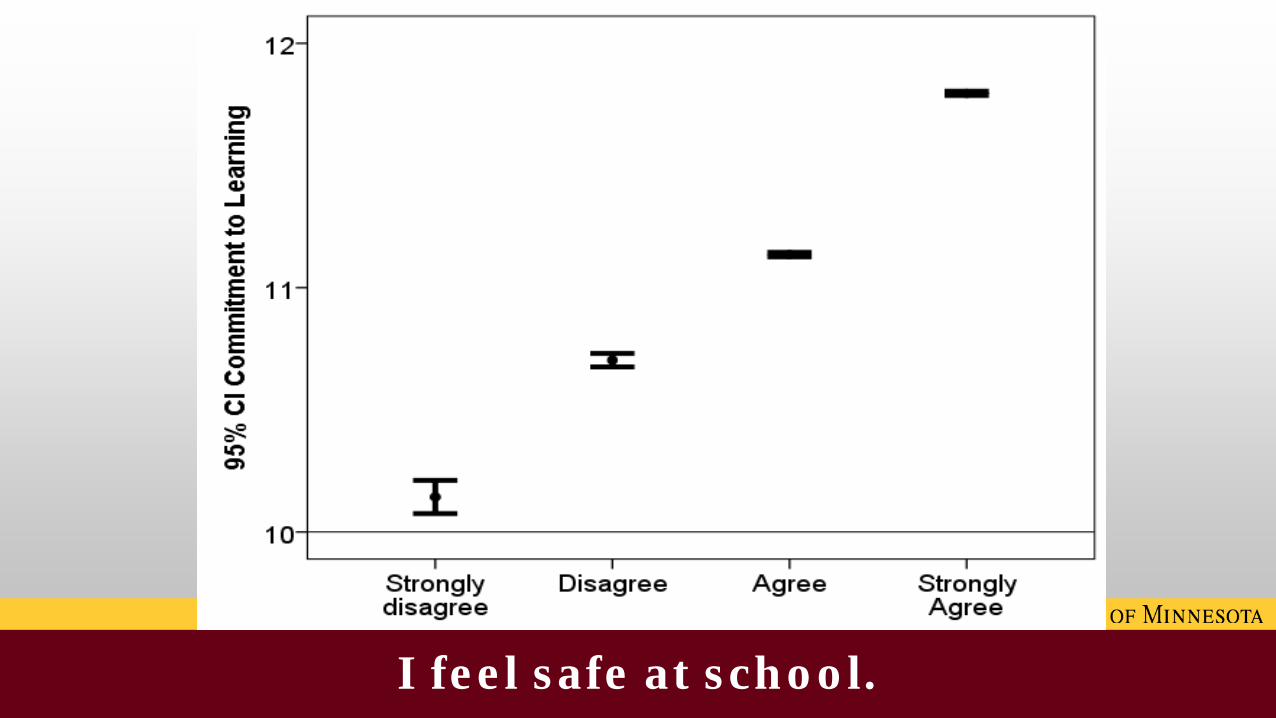
I feel safe at school.

I feel safe at school.
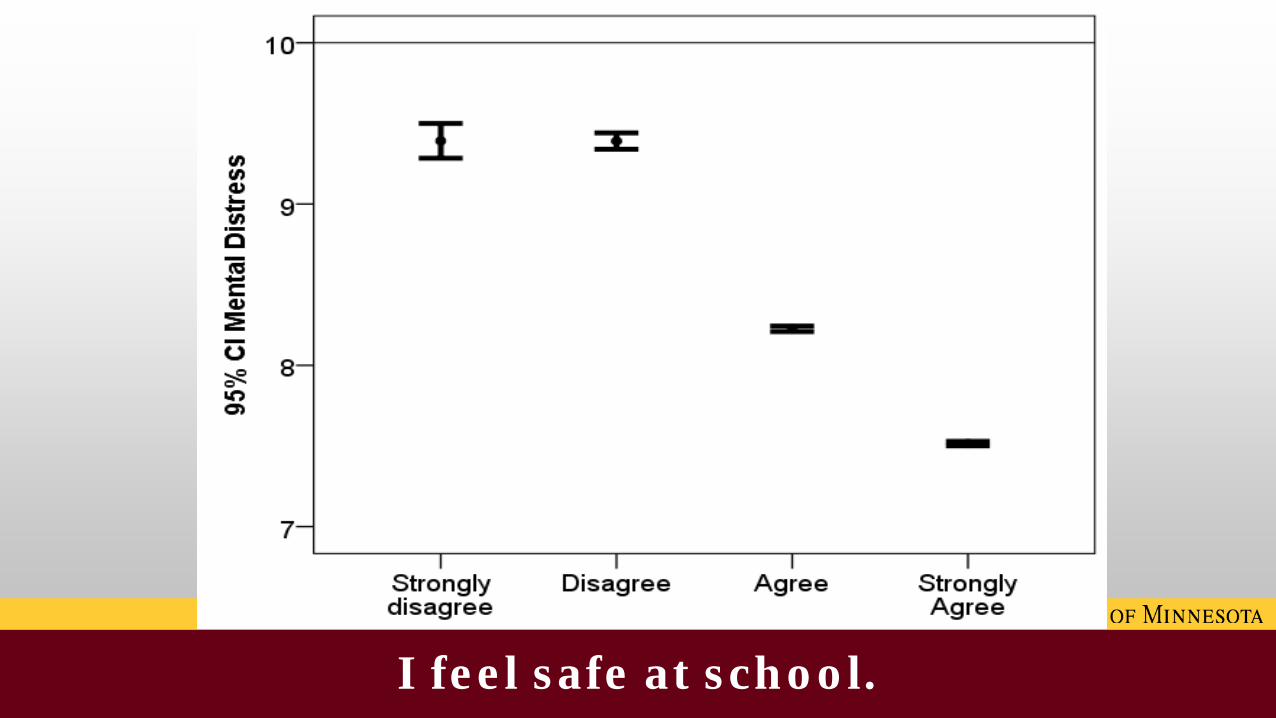
I feel safe at school.
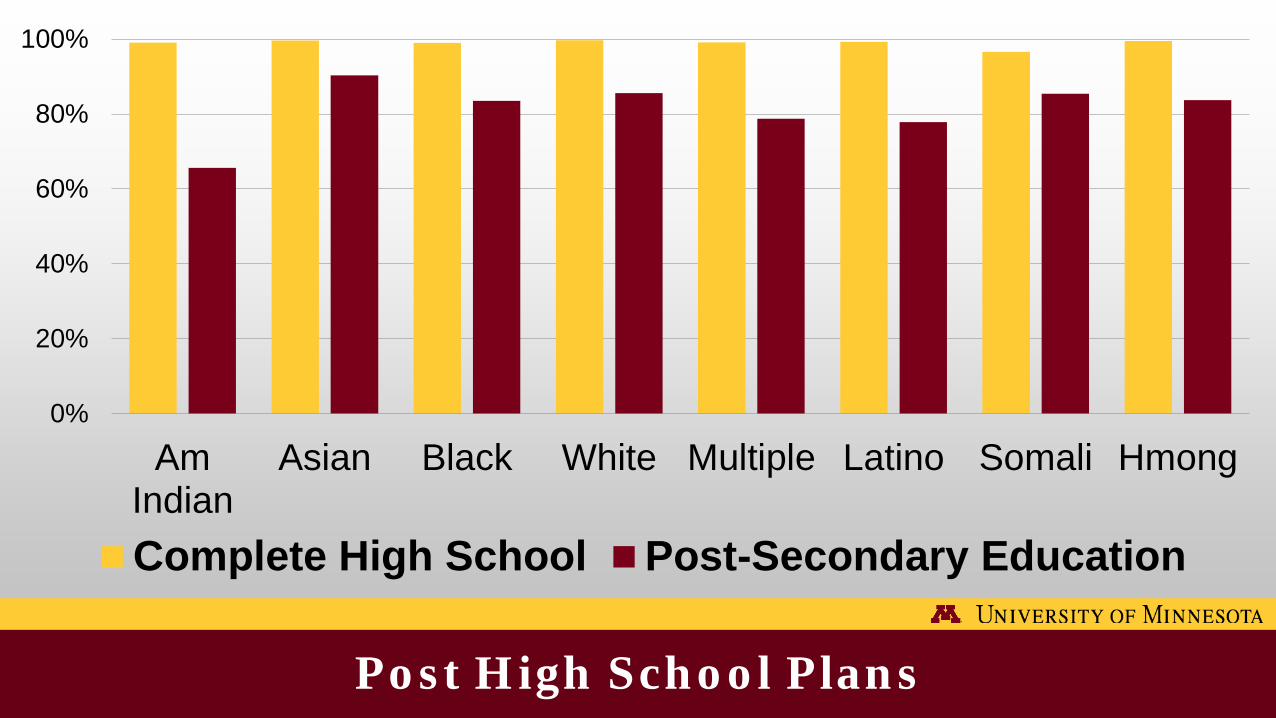
Post High School Plans
0%
20%
40%
60%
80%
100%
AmIndian
Asian Black White Multiple Latino Somali Hmong
Complete High School Post-Secondary Education

More to come…