using the hedonic approach to value natural land uses in
TRANSCRIPT
Économie publique/Public economics 20 | 2007/1Varia
Using the Hedonic Approach to Value Natural LandUses in an Urban Area: An Application to Genevaand ZurichCaroline Schaerer, Andrea Baranzini, José V. Ramirez et Philippe Thalmann
Édition électroniqueURL : http://journals.openedition.org/economiepublique/7332DOI : 10.4000/economiepublique.7332ISSN : 1778-7440
ÉditeurIDEP - Institut d'économie publique
Édition impriméeDate de publication : 1 février 2008ISBN : 45-31-94-NISSN : 1373-8496
Référence électroniqueCaroline Schaerer, Andrea Baranzini, José V. Ramirez et Philippe Thalmann, « Using the HedonicApproach to Value Natural Land Uses in an Urban Area: An Application to Geneva and Zurich », Économie publique/Public economics [En ligne], 20 | 2007/1, mis en ligne le 12 mars 2008, consulté le12 septembre 2020. URL : http://journals.openedition.org/economiepublique/7332 ; DOI : https://doi.org/10.4000/economiepublique.7332
© Tous droits réservés

public economics
économiepublique
Revue de l’Institut d’Économie Publique
Deux numéros par an
no 20 – 2007/1

économiepublique sur internet : www.economiepublique.fr
© Institut d’économie publique – IDEP
Centre de la Vieille-Charité
2, rue de la Charité – F-13002 Marseille
Tous droits réservés pour tous pays.
Il est interdit, sauf accord préalable et écrit de l’éditeur, de reproduire (notammentpar photocopie) partiellement ou totalement le présent ouvrage, de le stocker dansune banque de données ou de le communiquer au public, sous quelque forme et dequelque manière que ce soit.
Imprimé en France.
La revue économiepublique bénéficie du soutien du Conseil régional Provence-Alpes-Côte d’Azur
ISSN 1373-8496
Dépôt légal février 2008 – no imprimeur 453194N
recherchesarticles
Using the Hedonic Approach to Value Natural Land Uses inan Urban Area: An Application to Geneva and Zurich
Caroline Schaerer, Andrea Baranzini, José V. Ramirez ∗
Philippe Thalmann ∗∗
SummaryWe apply the hedonic model to the rental markets of theGeneva and Zurich urban areas, Switzerland, in order toassess the value of natural land uses and land use diversity.In order to construct variables to quantify land uses and pat-terns in the neighbourhoods of the buildings, we make useof the Zurich and Geneva geographic information system(GIS). Then, by merging these GIS-calculated neighbour-hood variables with data on the dwellings’ structure andnoise exposure levels, we obtain a database of about 3 200observations for each urban area. We find that proximity
∗. Geneva School of Business Administration (HEG-Ge); Center for Applied Research in Management(CRAG); University of Applied Sciences of Western Switzerland (HES-SO).∗∗. Swiss Institute of Technology Lausanne (EPFL) Research lab on the economics and management
of the environment (REME).Addresses: HEG-Ge, CRAG and HES-SO, 7 route de Drize, CH-1227 Carouge, Geneva, Switzerland ;
EPFL Station 16, 1015 Lausanne, Switzerland.E-mails : [email protected] ; [email protected] ; [email protected] ;
[email protected] are grateful for financial support from the Swiss National Science Foundation, National
Research Programme NRP 54 “Sustainable Development of the Built Environment”. We thank theSwiss federal statistical office for providing the data on rents and on some dwellings and buildingscharacteristics; the Geneva and Zurich Cantonal Office for protection against noise for the noise data;the Information System of the Geneva Territory (SITG) and the Zurich GIS-centre of the office of landuse regulation and measurement (ARV) for providing the GIS data. A special thank to Eva Robinson forexcellent assistance support in calculating GIS variables and to Alain Dubois for technical assistancewith GIS data. The paper benefited from the comments and suggestions of two anonymous referees.The usual disclaimer applies.
économiepubliqueno 20 (2007 / 1), 147-167

recherches Caroline Schaerer, Andrea Baranzini, José V. Ramirez, Philippe Thalmann
to various environmental amenities as well as their size inthe surrounding areas has a statistically significant impacton rents. In addition, homogeneity in land use commandshigher rents. The estimated impacts are relatively similar inthe two regions.
Résumé
Dans cet article, nous appliquons la méthode hédoniste auxmarchés immobiliers des régions urbaines de Genève et Zu-rich, Suisse, afin d’évaluer la valeur du paysage naturelet de sa diversité. En utilisant les systèmes d’informationgéographiques (SIG) de Genève et Zurich, nous construi-sons des variables permettant de quantifier les différentstypes de paysage naturel, ainsi que leur configuration, danschacun des quartiers de ces deux régions. Ensuite, en fu-sionnant ces nouvelles variables SIG avec des données surla structure des appartements et sur leurs niveaux d’exposi-tion au bruit, nous obtenons une base de données d’environ3200 appartements pour chacune des régions urbaines étu-diées. Nos résultats montrent que la proximité ainsi que lataille des différents types de paysage naturel ont un impactstatistiquement significatif sur les loyers des appartementsenvironnants. De plus, l’homogénéité du paysage dans lesquartiers est valorisée par des loyers plus élevés. Les coef-ficients estimés sont relativement similaires dans les deuxrégions.
Keywords: Hedonic Model; Rental Market; Housing Market; Land-scape Value; Geographic Information System (GIS).
Mots clés : Modèle hédoniste ; marché immobilier ; marché dulogement ; valeur du paysage; Système d’InformationGéographique (SIG).
J.E.L. : R14, R52, R31, D62
no 20 - 2007 / 1148

Using the Hedonic Approach to Value Natural Land Uses in an Urban Area
1. Introduction
Cities are growing almost everywhere and they are seen as powerful enginesof economic growth. Yet, their sprawl is increasingly challenged, the emphasisnow being placed on densification. However, city densification puts pressure onopen urban spaces such as parks and forests. Those green areas are essential forthe beauty of the urban landscape and for air and water quality in the city. Theyprovide opportunities for recreation and relief from urban stress and congestionto city dwellers. Thus, green areas are just as vital for their well-being as thedensity of built amenities. Reason enough for the Smart Growth Network to defendurban greens and mixed land uses (see Congress of New Urbanism, 2002). Inthe trade-off between preserving open urban spaces and developing housing andbusiness surfaces, economic arguments play a central role. To give green areas achance, it is essential to assess their value. This research aims at supporting policiespreserving or improving the quality of the urban natural and built environmentin order to meet economic, environmental and social needs of current and futuregenerations.
The economic literature proposes various methods for assessing the value ofnon-marketed goods such as environmental quality (for a survey, see e.g. Mälerand Vincent, 2006). Among the methods based on revealed preferences, thehedonic approach is a very popular one (see Boyle and Kiel, 2001; Navrud, 2002).The seminal work of Rosen (1974) provides the theoretical foundation of theproperty-hedonic model, by assuming that heterogeneous goods are valued fortheir utility-bearing characteristics. Given the key assumption that the housingmarket is competitive (see Freeman, 1993), the equilibrium hedonic price scheduleP results from the market interaction between households’ willingness to payfor the housing characteristics and landlords’ costs for providing them, and isgiven by the vector of the house characteristics, z, P = P(z) (see Palmquist, 1999).The vector of characteristics z is often decomposed in a vector of structural (forexample the number of rooms), accessibility (such as the proximity to an urbanpark), neighbourhood (for example proportion of green areas) and environmentalquality (such as quietness) variables. Hence, even if there is a missing market forenvironmental quality (such as open spaces), by unbundling the housing productit is possible to assess the (implicit) value that individuals are revealing by their(explicit) choice in the housing market. Surveys of the hedonic approach literatureapplied to housing markets are provided by e.g. Bateman et al. (2001), Day (2001),Palmquist (2005) and Sheppard (1999).
The economic valuation of land uses is a relatively recent development in thehedonic literature. A recent survey on this topic by McConnell and Walls (2005)shows that the early studies on the value of urban open spaces focused generally on
économiepublique149

recherches Caroline Schaerer, Andrea Baranzini, José V. Ramirez, Philippe Thalmann
the presence of urban parks and simply used dummy variables indicating a nearbylocation. In contrast, latest studies characterise more precisely the open spaces, bydifferentiating them by land use types and by accounting for their size (see e.g.Lutzenhiser and Netusil, 2001; Anderson and West, 2006). In addition, startingwith the contribution of Geoghegan et al. (1997), a few papers in the literaturefocus on the impact of land use patterns on housing prices. Referring to theecology domain, this literature uses various spatial land use indices measuring e.g.land use diversity, fragmentation and contagion (see also Dumas et al., 2006). Theexpected impact of land use patterns on house prices is a priori not known, since ahigher diversity may imply in some cases potential proximity to various desirableactivities (such as recreation, shopping, workplaces), whereas in other cases itmight lower housing prices, if it is associated with undesirable activities or chaoticland use. Geoghegan et al. (1997) show that land use diversity and fragmentationin the immediate neighbourhood of the properties have generally a negative impacton their prices, while the impact is reversed for the highly developed suburbs (ofWashington DC) of their sample. Using the same diversity index and an additionalone measuring “richness” of land use, Acharya and Bennet (2001) confirm thatthe presence of open spaces increases property prices, while diversity and richnessdecrease them. On the same topic, Song and Knaap (2004) analyse the impact ofthe land use diversity on the property value of single-family houses in WashingtonCounty, Oregon. They account for the proximity of the different land uses, theirpercentage in the neighbourhood, as well as a diversity index. They find that theproximity to public parks and to commercial area increases property value of single-family houses, while property prices are higher in neighbourhoods dominated bysingle-family residential land use, in which non-residential land uses are evenlydistributed. Therefore, despite the premium associated with accessibility to parksand to commercial uses, they find that property owners still value homogeneoussingle-family residential neighbourhoods.
In Switzerland, there are numbers of studies applying the hedonic approach tothe Swiss rental or real estate markets. While Rieder (2005) and Fahrländer (2006)specify nation-wide hedonic models, most of these studies are region specific andfocus on the valuation of a particular environmental amenity. For instance, theimpact of road traffic or airport noise on the rental/housing market, is studied inBaranzini and Ramirez (2005) and Baranzini et al. (2006) using data from Geneva;Grosclaude and Soguel (1992) from Neuchâtel; Pommerehne (1987) from Basle;Iten and Maibach (1992), Sommer et al. (2000), Salvi (2003) and Banfi et al. (2006)from Zurich. Salvi et al. (2004) and Baranzini and Schaerer (2007) assess the valueof view on the Zurich property prices and Geneva rents, respectively, whereasTangerini and Soguel (2004) analyse the value of the landscape in the Alps for bothresidents and tourists. However, in spite of the relatively important internationalliterature on the impact of the land uses on the housing market, there exists no
no 20 - 2007 / 1150

Using the Hedonic Approach to Value Natural Land Uses in an Urban Area
study that addresses this question explicitly in Switzerland. Consequently, in thispaper we apply the hedonic model to assess the value of land uses in the Genevaand Zurich rental markets. While considering these two major Swiss urban areaswill allow inter-regional comparisons, the choice of Geneva and Zurich is alsodictated by their similar morphology (end of lake location), their world-top rankingin terms of quality of life 1, the relatively large rental market, and by the fact thatfor both we can access several rich databases, including Geographical InformationSystem (GIS) data. After merging datasets from different sources, and by addingGIS data, we obtain a relatively large sample of about 3 200 dwellings in each ofthe two urban areas.
The paper is organised as follows. In Section 2, we discuss how we constructedthe land use and diversity variables and we present the datasets. The results arediscussed in Section 3, while we conclude in Section 4.
2. Land Use Variablesand Datasets Description
Since in this paper we concentrate on an urban context, we focus the analysison the municipality of Zurich and on the Greater Geneva area 2. The two urbanareas are of relatively comparable sizes of about 64 square kilometres for Genevaand 92 square kilometres for Zurich, contained in a radius of about 6 kilometres.We divide the urban areas into different districts, by using administrative sub-areasboundaries of the municipalities. As a result, the Greater Geneva is divided into14 districts, which have a mean surface of 4.56 square kilometres, and Zurich isdivided into 12 districts, with a mean surface of 7.6 square kilometres. Differencesof relevance between the two regions are that the Canton of Zurich is larger(1 729 square kilometres) than the Canton of Geneva (282 square kilometres), butpopulation density is much higher in Geneva (1 525 persons per square kilometre)compared to Zurich (736). Moreover, in the Zurich Canton, in addition to themain Lake of Zurich, there are two small lakes (one of which is in the regionunder consideration), whereas there is only one lake in Geneva. Finally, in theareas considered for this study, the agricultural surface in Zurich is relatively small,representing 1 percent maximum of the district surface, while in Geneva the districtwith the maximum surface devoted to agricultural land use amounts to about 30percent.
1. See http://www.citymayors.com/features/quality_survey.html2. We use the Greater Geneva area instead of the municipality of Geneva alone, because this latter
has a relatively small size (about 16 square kilometres) and is divided in four district divisions only.
économiepublique151

recherches Caroline Schaerer, Andrea Baranzini, José V. Ramirez, Philippe Thalmann
2.1. Land Use Variables
The analysis of the impact of land uses in the two urban regions is performedby accessing GIS data and defining land use variables at the district level in whichthe building is located. The Information System of the Geneva Territory (SITG) andthe GIS-centre of the Zurich office of land use regulation and measurement (ARV) 3
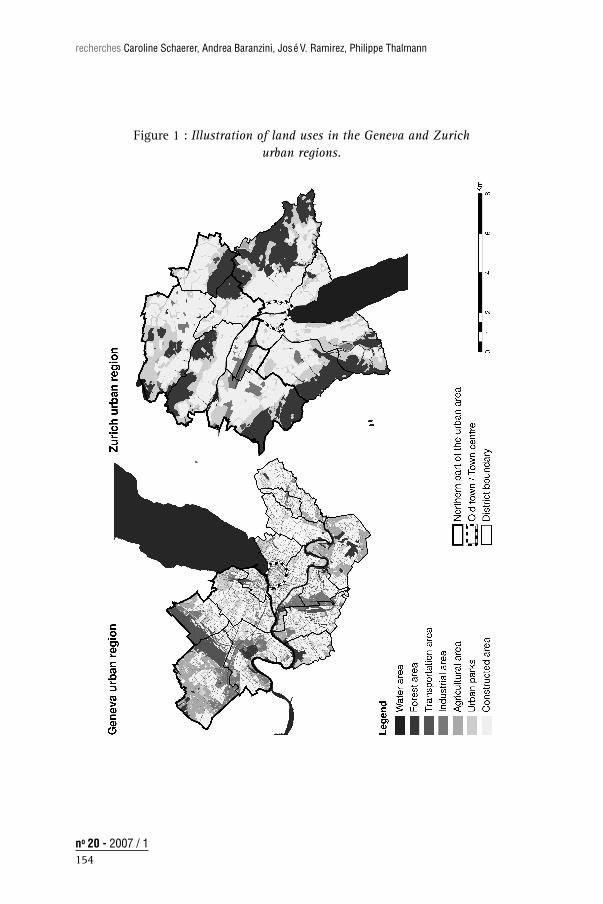
provide two very rich and well-developed GIS databases, from which we are ableto differentiate various land uses in each region. Therefore, we are working withreal land uses and not with planned areas. However, although the two regionalland use maps are relatively similar, they do not present the same aggregationlevel for the different land uses. Consequently, for comparison purposes, and alsoto limit multicolinearity issues, we reduce the number of variables in both regionsby grouping similar land uses. For both regions we define seven categories:
1. Forest area, which includes the delimited wood and forest areas in the landuse maps of the two regions. For Geneva it also includes scattered trees.
2. Agricultural area.
3. Water area, which includes the water-covered surfaces (lakes and rivers).
4. Built area, which includes all the constructed areas (mixed and residentialareas). In the case of Geneva, it includes scattered housing outside of thebuilt areas.
5. Urban parks: natural parks, recreation parks, cemeteries as well as sportcourts.
6. Transportation area, which include all area devoted to transport facilities, likeroads, railways and airport. Note that in the Zurich region, the transportationsurface cannot always be distinguished from the general built area.
7. Industrial area.
Figure 1 represents the seven above-defined land uses in the Geneva region(left) and Zurich region (right), at the district level.
Using these seven land uses categories, we compute two different types ofvariables.
Firstly, we calculate accessibility variables, which measure precisely the prox-imity to environmental amenities. We calculate the distance from each buildingto each one of the seven above-mentioned land uses, e.g. the distance from thebuilding to the nearest urban park.
Secondly, based on landscape ecology, we compute neighbourhood variablesand use them to characterise the pattern of land uses surrounding the buildings.
3. In German: GIS-Zentrum des Amtes für Raumordung und Vermessung des Kantons Zürich.
no 20 - 2007 / 1152

Using the Hedonic Approach to Value Natural Land Uses in an Urban Area
Those variables are computed as the percentage of each land use type in theneighbourhood of the building. We delimit the building’s neighbourhood by thedistrict boundaries in which it is located 4. Then, referring to Geoghegan et al.(1997), we calculate a “land use diversity index”, which measures the variety ofthe land uses in the vicinity of the buildings of our two samples:
H = –K∑
k=1
(Pk)ln(Pk) (1)
where Pk is the proportion of the area dedicated to land use k in the neighbourhoodof the building, relatively to the total neighbourhood area. A larger value for H,indicates a more diverse landscape.
To be able to analyse the impact of the land uses on the housing markets ofthe two regions, these GIS-calculated variables are combined with data on thedwellings’ characteristics.
2.2. Dataset Description
The main source of data is the 2003 Statistical Information Survey on RentStructure from the Swiss Federal Statistical Office. This dataset is based on a surveyof 320 000 randomly selected households, in all regions of Switzerland (12 900for the Zurich municipality and 15 001 for the Greater Geneva area) and containsdetailed information on the rents, quality and quantity characteristics of thedwellings. In our analysis, we keep only the dwellings located in the municipalityof Zurich, and those located in Greater Geneva area. From the original samples, weexclude the home-owners (who account for only about 10% of all households inthe areas examined) and the recipients of special rent discounts, such as caretakers,relatives of the property owner, beneficiaries of housing subsidies and members ofreal estate cooperatives, in order to have comparable rents. Note that the datasetdoes not include single-family houses.
From the Cantonal offices of protection against noise of Geneva and Zurich, weobtained the yearly averaged daytime and night-time road traffic noises, expressedin the A-weighted decibel scale (dB(A)). The daytime noise level represents theequivalent continuous noise level averaged over 15 hours and averaged over 9hours for the night-time noise level. The data refer to the level of noise caused byroad traffic, measured at some fixed points, and then extrapolated for each facadeof the buildings, using noise level curves.
4. Different definitions of “neighbourhood” have been used in the literature. Most commonly, theneighbourhood is delimited by the predefined administrative boundary in which the building is located(such as census blocks, postal codes or municipalities’ boundaries). Other studies used a radius ofdifferent distances around each building (see Baranzini and Schaerer, 2007).
économiepublique153
recherches Caroline Schaerer, Andrea Baranzini, José V. Ramirez, Philippe Thalmann
Figure 1 : Illustration of land uses in the Geneva and Zurichurban regions.
no 20 - 2007 / 1154

Using the Hedonic Approach to Value Natural Land Uses in an Urban Area
After merging all the information on the dwellings and noise levels withour GIS-calculated variables, dropping observations for which noise exposure isunreliable 5, as well as a few outliers using the Welsch distance criteria, we obtaintwo final samples of 3 327 observations for Geneva and of 3 194 observations forZurich. Our samples are representative of the full Statistical Information Surveyon Rent Structure, e.g. in terms of number of rooms and construction period. Thedescriptive statistics are reported in Table 1.
The mean gross monthly rent 6 in 2003 is somewhat lower in Geneva (aboutCHF 1 355) than in Zurich (about CHF 1 517), while the rent distribution is broaderin Geneva 7. The Zurich sample contains slightly older buildings than the Genevasample: about 50 per cent of the buildings were constructed before 1946 inZurich, while only about 38 per cent in Geneva. Conversely, the share of buildingsconstructed between 1960 and 1980 is higher in Geneva than in Zurich. Thepercentage of dwellings that have been totally renovated is comparable.
The percentage of buildings owned by a public entity (municipality, cantonor confederation) is about the same in the two cities, while the share of privatelyowned buildings appears to be higher in Zurich (54 per cent against 23 per cent inGeneva). However, this difference might result from the higher share of “unknownownership” reported in the survey in the Geneva region (41 per cent), a share whichamounts only to 10 per cent in Zurich.
With a mean number of rooms of about 3, for a mean surface per room of27 square metres, the size of the dwellings are about the same in the two urbanareas. 8 Interestingly, the mean duration of residence in the same dwelling is quitelong: about 13 years in Zurich and about 15 years in Geneva, with a very largedistribution. Note that long-tenure dwellings are not concentrated in specificdistricts.
The accessibility variables to the different land uses have all a low mean, whichillustrates that the studied regions are relatively small and dense. About 2 percentof the dwellings are located in the old part of each city. Concerning noise levels,the mean exposure to the daily road traffic noise amounts to 66 dB(A) in Genevaand to 67.5 dB(A) in Zurich, which exceed the legal limit of 60 dB(A) set in the
5. Observations for which the noise exposure lies above 75 dB(A) are dropped because noisemeasures at those levels are unreliable (see acoustic literature, e.g. Miedema et al., 1998; 2001). Inthe same vein, we restricted our samples to the observations for which the noise levels exceeded, orequalled, 55 dB(A) during the day, or 45 dB(A) during the night. These thresholds correspond to theplanning regulations for housing areas in Swiss law (see Swiss Noise Abatement Ordinance, 1986, art.43). See Baranzini et al. (2006) for a discussion about low exposure to noise levels and the use ofscientific vs. subjective noise measures in hedonic models.
6. The gross rent includes the monthly charges for electricity and hot water, but excludes any extracharges for e.g. the use of a parking car.
7. Currently, CHF 1 = USD 0.83 or EURO 0.61.8. The number of rooms includes living room and bedrooms, but excludes the kitchen and bathrooms.
économiepublique155

recherches Caroline Schaerer, Andrea Baranzini, José V. Ramirez, Philippe Thalmann
Table 1 : Descriptive statistics.Geneva Zurich
(N = 3 327) (N = 3 194)Variables Mean Std. Dev. Min Max Mean Std. Dev. Min Max
Structural VariablesGross monthly rent 1 355 615 200 9 396 1 517 644 236 6 600Building was built before 1920 0,22 0,41 0 1 0,26 0,44 0 1Building was built between1920 & 1945
0,16 0,37 0 1 0,26 0,44 0 1
Building was built between1946 & 1960
0,18 0,39 0 1 0,2 0,4 0 1
Built between 1960 & 1970 0,2 0,4 0 1 0,09 0,29 0 1Built between 1970 & 1980 0,12 0,33 0 1 0,07 0,26 0 1Built between 1980 & 1990 0,05 0,23 0 1 0,04 0,21 0 1Built between 1990 & 2000 0,06 0,24 0 1 0,07 0,26 0 1Totally renovated building 0,16 0,37 0 1 0,18 0,38 0 1Elevator in the building 0,78 0,41 0 1 0,29 0,46 0 1Floor level 3,58 2,51 0 19 2 1,97 0 46Privately owned building 0,23 0,42 0 1 0,54 0,5 0 1Publically owned building 0,03 0,17 0 1 0,05 0,23 0 1Building belongs to ainsurance or a pension fund
0,37 0,48 0 1 0,28 0,45 0 1
Ownership is unknown 0,41 0,49 0 1 0,1 0,31 0 1Number of rooms 3,02 1,16 1 6 3,02 1,06 1 10Surface per room (m2) 26,75 7,16 7 60 26,55 7,25 7 100Dwelling with terrasse/garden 0,1 0,3 0 1 0,19 0,39 0 1Penthouse dwelling 0,07 0,25 0 1 0,1 0,3 0 1Balcony 0,62 0,49 0 1 0,7 0,46 0 1Separated toilet 0,22 0,42 0 1 0,15 0,36 0 1Duration of residence (years) 15,47 13,36 0 92 12,77 12,56 0 95
Aesthetic variablesView on the lake 0,07 0,25 0 1 0,07 0,26 0 1View on the mountains 0,46 0,5 0 1 0,23 0,42 0 1
Environmental variablesRoad traffic daytime noise(dB(A))
65,7 4,73 50 75 67,53 3,55 55 77
Accessibility variablesOld town (dummy) 0,03 0,16 0 1 0,02 0,14 0 1Northen part of the urban area 0,37 0,48 0 1 0,36 0,48 0 1Distance to the lake (km) 1,7 1,26 0,05 5,98 1,84 1,15 0,05 5,68Distance to nearest forest (km) 0,45 0,27 0,01 1,3 0,62 0,42 0,01 1,92Distance to nearest park (km) 0,16 0,12 0 1,24 0,14 0,09 0 0,47
Neighbourhood variablesPercent of water area 2,61 2,39 0 6 6,15 10,93 0 36Percent of forest area 24,15 7,19 11 47 22,39 14,16 0 44Percent of agricultural area 1,98 5,92 0 30 0,2 0,31 0 1Percent of urban parks 12,89 5,39 4 21 19,12 6,75 4 31Land-use diversity index 1,43 0,14 1,18 1,67 1,14 0,14 0,71 1,41
no 20 - 2007 / 1156
Using the Hedonic Approach to Value Natural Land Uses in an Urban Area
Swiss noise regulation for residential areas (Swiss Noise Abatement Ordinance, art.43). However, the average noise level in our sample may overestimate the effectiveaverage noise exposure in the regions, because noise is often measured where theroad traffic noise is suspected to be high.
The Statistical Information Survey on Rent Structure contains two questionsasking whether or not the dwellers enjoy a view on the lake and on the mountains.Table 1 shows that the share of dwellings enjoying a view on the lake is aboutthe same in the two regions, reflecting the fact that the morphology of both citiesis similar. By contrast, the share of dwellings in the Geneva region benefitingfrom a view on the mountains (46 percent) is twice the one of Zurich. This is notsurprising given that Geneva is wedged between two mountains (the Jura chainand the Mont Blanc Massif).
Concerning the neighbourhood variables, the percentages of forest area andurban parks land uses in the proximity of the sample buildings are almost the samein the two urban areas. As already mentioned, the major difference between themin terms of land uses is the share of agricultural surface, which is ten times greaterin Geneva than in Zurich (2.0 percent vs 0.2 percent) and the percentage of water,which is smaller in Geneva. Indeed, the municipality of Zurich includes a smalllake in its North. Finally, the mean and the distribution of the land use diversityindex are slightly greater for Geneva, which implies that in our samples land useis more homogeneous in the Zurich area.
3. Results
In this section, we examine whether the Geneva and Zurich regions rentalmarkets award a premium to those dwellings that are located in the vicinity ofenvironmental amenities, and compare the results obtained for the two differentregions.
The literature does not dictate any functional form for the hedonic equa-tion, which has to be determined empirically. Box-Cox transformations of thedependent and independent variables were jointly and alternatively tested. Thesemi-logarithmic functional form appears to be the most adequate form. In fact,we allowed for a more flexible functional form by introducing the square of theduration of residence, in order to account for the non-linearity of the impact of theduration of residence on the rent 9. More specifically, we estimate the following
9. As suggested by a reviewer, we (roughly) tested for the possible non linear impact of distancesby considering the square of all the distances. However, all the square terms were not statisticallysignificant and introduced problems of multicolinearity.
économiepublique157

recherches Caroline Schaerer, Andrea Baranzini, José V. Ramirez, Philippe Thalmann
hedonic equation:
lnYi = α+M∑
m=1
βimSim +X∑
x=1
δixVix +K∑
k=1
γjkAjk +Z∑
z=1
λjzEjz +K∑
k=1
φjkNjk +µi (2)
where ln Yi is the natural logarithm of the 2003 monthly rent of dwelling i, Sim
corresponds to structural or ownership characteristic m of dwelling i, Vix stands forview indicator x from dwelling i, Ajk represents the accessibility to land use k frombuilding j sheltering dwelling Ejz stands for the environmental characteristic z atbuilding j,Njk refers to the land use indicator k in the neighbourhood of building j,and µi is an error term reflecting all the unobservable.
For each of the two regions, we fit a hedonic equation and estimate two differentmodels in order to determine for which environmental amenities householdspay a premium or get compensation on the housing market. Model 1 is thebase model, which in addition to the “classic” hedonic variables contains theaccessibility variables and the road traffic noise exposure levels. In Model 2 weadd the neighbourhood land use variables 10. Note that, in order to account forunobservable at the district level, we divided the regions in two higher spatial levelareas (North and South) and introduced one dummy accordingly 11. The results arereported in Table 2.
The analysis of Pearson’s correlations indicates that there are no significantdependencies between the explanatory variables. Moreover, the variance inflationfactor (vif) tests confirm that there are no problems of multicolinearity in themodels (e.g. the mean vif is 2.13 for Zurich and 2.56 for Geneva). In order tominimise heteroskedasticity, the White’s consistent estimators of variances are used.The two models for the Geneva region explain about 65 per cent of the varianceof rents in that region, while the model for the Zurich regions explains about 60per cent of the rents’ variance. We checked for the robustness of the results in twoways. Firstly, we estimated the models with other neighbourhood boundaries (thepostal code division) and found that the coefficients are not statistically differentfrom those used here (the administrative sub-areas boundaries). 12 Secondly, weperformed a bootstrap estimation with 1 000 replications in order to check for thesignificance of the coefficients. Results, available upon request, show that ourestimations are robust.
10. As expected, the F and LR tests rejected at the 0.01 level pooled models with the two regionstogether.
11. We thank one reviewer for suggesting this.12. As pointed out by a referee, we acknowledge that this is not a proof that our results are not
affected by the so-called modifiable areal unit problem (MAUP). In addition, in order to test whether aspecific district drives the result on land use variables, we run our model alternatively by suppressingthe observations from each sector in turn and tested whether the coefficients of the land use variableschange significantly due to the exclusion of a particular sector. The results (available upon request)show that all the land use coefficients remain statistically the same as those in Model 2.
no 20 - 2007 / 1158
Using the Hedonic Approach to Value Natural Land Uses in an Urban Area
The comparison of the coefficients for the models within each of the two regionsshows that the coefficients are remarkably stable across the two models and verysimilar between the two urban areas. Almost all the coefficients are statisticallysignificant with the expected signs. Given the semi-logarithmic functional formof the estimated hedonic equation (2), the coefficients of the continuous variablesrepresent semi-elasticities, i.e. the percentage change in the rent for a small changein the independent variables, all the other characteristics remaining the same. Forinstance, the results show that, all else equal, the surface per room has a positiveimpact on the rents amounting to 1.1 per cent per additional square metre perroom in Geneva and to 0.8 per cent in Zurich. All the other coefficients canbe interpreted in the same fashion, except the duration of residence. Since theduration of residence enters with a quadratic effect, the decreasing impact on rentamounts to –3 per cent in Geneva after 2 years of tenancy and to – 20.2 per centby the mean duration of residence of 15 years. For Zurich, these rent discountsamount to –2.4 per cent after 2 years, and to –14.4 per cent after 13 years ofresidence in the same dwelling. This result confirms the suspicion that the rent isusually raised at changes in tenancy (see Thalmann, 1987).
For the dummy and the discrete variables, the coefficients are not directly inter-pretable. Indeed, as shown by Halvorsen and Palmquist (1980), those coefficientsmust be transformed using the formula (eβ –1) to obtain the percent change in thedependent variable. Therefore, for instance, a dwelling with a terrace or gardenwill be rented 8.9 per cent higher in Geneva, respectively 5 per cent higher inZurich, while the rent differential for a balcony amounts to 2.9 per cent in Genevaand to 5.3 per cent in Zurich. Professionals in the Swiss urban rental marketsconsider that the existence of a second toilet in the dwelling or a separated onetraduces generally a higher “standard living” of the dwelling. Our results confirmthat dwellings with a separated toilet are, ceteris paribus, rented 8.6% higher inGeneva and 20.6% in Zürich.
Except for the floor level, which is not statistically significant in any of the tworegions, the coefficients obtained for the structural variables are very similar toresults obtained in other studies focusing on these two Swiss rental markets (see e.g.Baranzini et al., 2006, for Geneva; and Banfi et al., 2006, for Zurich). Although thefloor level is not significant, it is interesting to note that the interaction betweenthe floor level at which the dwelling is located and the presence of an elevator inthe building is statistically significant with the expected sign in Zurich. Note thatSwiss building managers often charge a constant premium per floor level, whenthere is an elevator. Younger buildings generally command higher rents, althoughthere is a small discount in buildings built in the last ten years. This reflects thesupply side, as construction and particularly land prices declined after the boom ofthe 1980s.
économiepublique159

recherches Caroline Schaerer, Andrea Baranzini, José V. Ramirez, Philippe Thalmann
Concerning the impact of noise on rents, an increase by 1 dB(A) reduces therent by 0.2 per cent on average in the Geneva region and by 0.38 per cent in theZurich region, although the coefficients are not statistically different at the 5 percent level. The impact of noise on rents is slightly reduced once the neighbourhoodvariables are introduced in Model 2. Those results are comparable, although in thelower range of impacts, with those obtained by Iten and Maibach (1992), Sommeret al. (2000), and Banfi et al. (2006) for the Zurich rental/housing market, and byBaranzini and Ramirez (2005), Baranzini el al. (2006) and Baranzini and Schaerer(2007) for Geneva.
Table 2 : Results of the estimations
Geneva ZurichModel 1 Model 2 Model 1 Model 2
Dependent variable: ln(grossmonthly rent)
Coefficient Coefficient Coefficient Coefficient
Structural VariablesBuilt between 1960 & 1970 0,023∗ 0,023∗ –0,008 –0,010
(0,013) (0,013) (0,014) (0,014)Built between 1970 & 1980 0,049∗∗∗ 0,053∗∗∗ 0,036∗∗ 0,038∗∗
(0,013) (0,013) (0,017) (0,017)Built between 1980 & 1990 0,157∗∗∗ 0,159∗∗∗ 0,174∗∗∗ 0,175∗∗∗
(0,017) (0,017) (0,018) (0,018)Built between 1990 & 2000 0,091∗∗∗ 0,095∗∗∗ 0,116∗∗∗ 0,118∗∗∗
(0,018) (0,018) (0,017) (0,017)Totally renovated building 0,036∗∗∗ 0,037∗∗∗ 0,108∗∗∗ 0,106∗∗∗
(0,012) (0,012) (0,012) (0,012)Elevator in the building 0,056∗∗∗ 0,049∗∗∗ 0,038∗∗ 0,037∗∗
(0,018) (0,018) (0,016) (0,016)Floor level –0,000 –0,001 –0,003 –0,003
(0,004) (0,004) (0,004) (0,004)Floor level x Elevator 0,001 0,002 0,012∗∗ 0,012∗∗
(0,005) (0,005) (0,006) (0,006)Privately owned building 0,056∗∗∗ 0,055∗∗∗ 0,084∗∗∗ 0,082∗∗∗
(0,011) (0,011) (0,009) (0,009)Number of rooms 0,253∗∗∗ 0,253∗∗∗ 0,209∗∗∗ 0,208∗∗∗
(0,005) (0,005) (0,006) (0,006)Surface per room (m2) 0,011∗∗∗ 0,011∗∗∗ 0,008∗∗∗ 0,008∗∗∗
(0,001) (0,001) (0,001) (0,001)Dwelling with terrasse/garden 0,085∗∗∗ 0,084∗∗∗ 0,049∗∗∗ 0,049∗∗∗
(0,015) (0,015) (0,013) (0,013)Penthouse dwelling 0,094∗∗∗ 0,093∗∗∗ 0,057∗∗∗ 0,054∗∗∗
(0,020) (0,020) (0,019) (0,019)Balcony 0,026∗∗∗ 0,025∗∗ 0,052∗∗∗ 0,054∗∗∗
(0,010) (0,010) (0,011) (0,011)Separated toilet 0,083∗∗∗ 0,080∗∗∗ 0,187∗∗∗ 0,187∗∗∗
(0,011) (0,011) (0,015) (0,015)Duration of residence (years) –0,015∗∗∗ –0,015∗∗∗ –0,013∗∗∗ –0,013∗∗∗
(0,001) (0,001) (0,001) (0,001)Square of the duration 0,013∗∗∗ 0,013∗∗∗ 0,012∗∗∗ 0,012∗∗∗of residence (x 100) (0,002) (0,002) (0,002) (0,002)
no 20 - 2007 / 1160

Using the Hedonic Approach to Value Natural Land Uses in an Urban Area
Table 2 : Results of the estimations (continued)
View VariablesView on the lake 0,065∗∗∗ 0,063∗∗∗ 0,081∗∗∗ 0,068∗∗∗
(0,019) (0,019) (0,019) (0,019)View on the mountains 0,010 0,012 0,004 0,004
(0,010) (0,010) (0,013) (0,013)Environmental Variables
Road traffic daytime noise(dB(A)) (x 100)
–0,204∗∗ –0,166∗ –0,381∗∗∗ –0,369∗∗∗
(0,095) (0,096) (0,119) (0,121)Accessibility Variables
Old town (dummy) 0,096∗∗∗ 0,079∗∗ 0,088∗∗ 0,078∗(0,034) (0,037) (0,038) (0,044)
Northen part of the urbanarea
0,022∗∗ –0,015 –0,014 0,004
(0,010) (0,014) (0,011) (0,012)Distance to the lake (km) –0,027∗∗∗ –0,014∗∗ –0,020∗∗∗ –0,016∗∗∗
(0,004) (0,001) (0,004) (0,005)Distance to nearest forest (km) –0,081∗∗∗ –0,052∗∗ –0,055∗∗∗ –0,042∗∗∗
(0,019) (0,002) (0,011) (0,015)Distance to nearest park (km) –0,056 –0,069∗ 0,130∗∗∗ 0,107∗∗
(0,039) (0,004) (0,049) (0,050)Neighbourhood Variables
Percent of water area (x 100) –0,023 0,223∗∗∗(0,273) (0,073)
Percent of forest area (x 100) –0,135 0,149∗∗∗(0,098) (0,049)
Percent of agricultural area (x100)
0,231∗ 4,394∗∗
(0,119) (1,995)Percent of urban parks (x 100) 0,560∗∗∗ –0,165
(0,108) (0,109)Land-use diversity index –0,120∗∗ –0,053
(0,050) (0,053)R2 0,649 0,651 0,601 0,604N 3327 3327 3194 3194
Notes: *** significant at the 0.01 level; ** significant at the 0.05 level; * significant at the 0.10 level;standard errors in brackets. The reference for the period of construction is a building built before 1960.The reference for the privately owned buildings is all the other buildings (publicly owned, owned by aninsurance or pension fund, owner unknown).
In Model 1, the premium associated with a view on the lake is on averagehigher in Zurich than in Geneva. However, after the land use characteristics ofthe neighbourhood are added in Model 2, the coefficients of the lake view arealmost the same in the two regions. The positive impact of view on residentialvalues has been found in the majority of the studies focusing on the aestheticbenefits of landscapes (see e.g. Bourassa et al., 2004). By contrast, we note thatthe coefficients associated with the view on the mountains are not statisticallysignificant. This latter result is quite surprising and in contradiction with previous
économiepublique161

recherches Caroline Schaerer, Andrea Baranzini, José V. Ramirez, Philippe Thalmann
studies by Rieder (2005) and Baranzini et al. (2006), which both found that theview on the mountain implies an increase in rents by respectively 0.7 per centand 2.6 per cent on average. However, the results of those studies are not directlycomparable. Indeed, Rieder (2005) considers Switzerland as a unique housingmarket, applying spatial econometric techniques in order to account for rentdifferentials at the regional level, while Baranzini et al. (2006) use data for thewhole Canton of Geneva. In addition, Salvi et al. (2004) for Zurich and Baranziniand Schaerer (2007) for Geneva analyse the impact of the view on the housingmarket. Both studies find a statistically significant impact of the lake view, whileBaranzini and Schaerer (2007) find also a significant impact for the view on themountains. However, the results of those papers are again not comparable sincethe view variables were calculated using the functionalities of GIS rather thanbased on survey data.
Concerning the GIS-constructed accessibility and the neighbourhood land usevariables, added in Model 2, note that some accessibility and neighbourhoodvariables (e.g. distance to the nearest agricultural area, percentage of land devotedto transportation and to constructions) are dropped due to correlation with anothervariable. However, the seven different types of land uses were accounted for inthe calculation of the land use diversity index. To account for the accessibilityto city centre, but in order to avoid correlation problems, we do not introduced avariable for the distance to the centre, but instead a dummy indicating whetherthe dwelling is located in the old town (or city centre) 13. On average, being in thecity centre commands a premium of 10.5 per cent in Geneva and to 9.1 per cent inZurich.
Dwellers of both regions are willing to pay a premium to live close to the largelake bordering the city, but the percentage of water area in the neighbourhood hasa statistically significant impact on rents only in Zurich, where there is anothersmall lake. Similar results can be found in the literature, see e.g. Mahan et al.,2000. The proximity and extent of forest area influence also positively the rentsin Zurich. For Geneva however, although the proximity to a forest has a positiveimpact on rents, the percentage of forest area has a negative, albeit not significantcoefficient. This kind of ambiguous results can also be found in the literatureconcerning the impact of forest area on rents or property prices. For example,Tyrväinen (1997) showed that although the size of forest area increases apartmentprices in Joensuu, Finland, proximity to a forest lowers them. She explainedthat result by the possible shading effect of dense forests on nearby houses. This
13. Since the distance to the lake and distance to city centre are highly correlated, which introducesmulticolinearity problems, we decided to keep only the distance to the lake in our estimations and tointroduce a dummy “old town” to account for the proximity to the urban centre. Nevertheless, it ispossible that the coefficient of distance to the lake still captures some impacts related to the distance tothe city centre.
no 20 - 2007 / 1162

Using the Hedonic Approach to Value Natural Land Uses in an Urban Area
interpretation seems to be confirmed by Garrod and Willis (2002), who found thatdeciduous trees increase house prices located near them, while spruce conifersdecrease them.
From Table 2, we observe that the impact of the share of agricultural area inthe neighbourhood is positive and statistically significant in both regions. Therelatively high coefficient for Zurich is probably due to the higher scarcity ofagricultural land, as the maximum surface percentage of agricultural areas amongthe districts amounts to 1 per cent only (see Table 1).
Concerning the proximity and percentage of land devoted to urban parks,they have a positive impact on rents in the Geneva region, while in Zurich thereverse is observed, although the associated coefficients are not significant. In fact,Lutzenhiser and Netusil (2001) distinguished between three categories of parks,namely the “urban” parks (devoted mainly to non-natural recreation activities, suchas sport courts), “natural area” park (consisting above all of natural vegetation),and “specialty” parks (dedicated primarily to a special activity, e.g. a boat rampfacility). The authors show that, in Portland, Oregon, while the proximity andsize of natural or speciality parks induce higher property prices, the proximity toan urban park decreases them, although the size of the urban park has a positiveimpact on prices. Other studies have confirmed that urban parks may command alower housing price given the negative externalities resulting from busy recreationactivities in those parks (e.g. see Schultz and King, 2001). Remembering that our“urban parks” include natural parks, recreational parks, cemeteries as well as sportcourts, a more stable result could be obtained by differentiating between thosetypes. Unfortunately, the data do not allow us to perform this distinction.
Finally, we find that the coefficients of the land use diversity indices arenegative in both urban areas, but statistically significant only in Geneva. Theseresults are in line with what was found by Geoghegan (1997), Acharya and Bennet(2001), and Baranzini and Schaerer (2007) for the Canton of Geneva. Homogeneityin land use thus commands somewhat higher rents.
4. Conclusion
Using a hedonic approach, the aim of this paper was to develop, test andcompare the impact of land uses on the two Swiss urban rental markets of Genevaand Zurich. To our knowledge, this paper is the first empirical comparison ofland use valuation performed on the Swiss urban rental market using the hedonicmodel. After calculating precise measures of land uses in the neighbourhoods ofeach building, we estimated two different hedonic models for each region: to a
économiepublique163

recherches Caroline Schaerer, Andrea Baranzini, José V. Ramirez, Philippe Thalmann
relatively classic hedonic model, we added type-specific land uses variables as wellas a land use diversity index.
Our results show that land use variables significantly affect Geneva and Zurichregions’ rents, in addition to the mere proximity of the different land use types.The estimated impacts are relatively similar in the two regions. More precisely,we find that proximity, size and view on water amenities increase rents in Zurich.Similar results are obtained for Geneva, except that the size of water area inthe neighbourhood is not significant. The proximity to forest as well as its sizein the neighbourhood implies a higher rent in Zurich, while only the proximityof forest (and not its size) is rewarded on the Geneva rental market. The sizeof the agricultural area in the neighbourhood increases rents unambiguously inGeneva and Zurich, while there are some differences concerning the urban parks.In Geneva, the proximity and the size of urban parks in the neighbourhoods actpositively and significantly on the rents, whereas they are not significant in Zurich.Finally, we find that diversity in land uses in the building neighbourhood has anegative impact on rents in the Geneva region.
We are currently working to expand this paper by including socio-economiccharacteristics of the households in order to test for the presence of spatial concen-tration (socio-economic segregation), and in that event to determine whether thissocio-economic pattern has an impact on rents, in addition to land uses patterns.This will also allow us to analyse if some categories of households in Geneva orZurich are more exposed to environmental nuisances than others, without adequatecompensation through lower rents. This future research will open the doors todiscussing the existence of a household effect (cf. price discrimination) and/or aneighbourhood effect (cf. prejudice) on the Geneva and Zurich rental market.
References
Acharya, G., and Bennett, L.L. 2001. “Valuing Open Space and Land-Use Patterns inUrban Watersheds.” Journal of Real Estate Finance and Economics, 22(2): 221-237.
Anderson, S.T. and West, S.E. 2006. “Open Space, Residential Property Values, andSpatial Context.” Regional Science and Urban Economics, 23: 776-789.
Banfi, S., Horehajava, A., and Filippini, M. 2006. “Hedonic Price Functions forZurich and Lugano with Special Focus on Electrosmog.” Paper presented at the 3rdWorld Congress Environmental and Resource Economists, Kyoto, Japan, 3-7 July2006.
no 20 - 2007 / 1164

Using the Hedonic Approach to Value Natural Land Uses in an Urban Area
Baranzini, A., and Schaerer, C. 2007. “A Sight for Sore Eyes. Assessing the Value ofView and Landscape Use on the Housing Market.” Genève: Haute École de Gestionde Genève, Cahier de recherche HES-SO/HEG-GE/C-07/1/1-07, available at SSRN :http://ssrn.com/abstract=981189.
Baranzini, A., Schaerer, C. Ramirez, J. V., and Thalmann, P. 2006. “Feel it orMeasure it. Perceived vs. Measured Noise in Hedonic Models.” Genève: HauteÉcole de Gestion de Genève, Cahier de recherche HES-SO/HEG-GE/C-06/7/1-CH,available at SSRN : http://ssrn.com/abstract=937259.
Baranzini, A., and Ramirez, J. V. 2005. “Paying for Quietness: the Impact of Noiseon Geneva Rents.” Urban studies, 42(4): 633-646.
Bateman, I., Day, B., Lake, I., and Lovett, A. 2001. “The Effect of Road Traffic onResidential Property Values: a Literature Review and Hedonic Price Study.” ScottishExecutive Transport Research Series. The Stationery Office, Edinburgh.
Bourassa, S.C., Hoesli, M., and Sun, J. 2004. “What’s in a View?” Environment andPlanning A, 36: 1427-1450.
Boyle, M.A., and Kiel, K.A. 2001. “A Survey of House Price Hedonic Studiesof the Impact of Environmental Externalities.” Journal of Real Estate Literature9(2):117-144.
Congress of New Urbanism. 2002. http://www.cnu.org.
Day, B. 2001. “The Theory of Hedonic Markets: Obtaining Welfare Measures forChanges in Environmental Quality Using Hedonic Market Data.” Economics for theEnvironment Consultancy.
Dumas, E., Geniaux, G., and Napoleone, C. 2006. “Effects of Landscape EcologyIndices on a Real Estate Market.” Presented at the 1ère Rencontres du Logement,Marseille, October 2006.
Fahrländer, S.S. 2006. “Semiparametric Construction of Spatial Generalized He-donic Models for Private Properties.” Swiss Journal of Economics and Statistics,142(4): 501-528.
Freeman, A. M. 1993. The Measurement of Environmental and Resource Values:Theory and Methods. Washington, DC: Resources for the Future.
Garrod, G.D., and Willis K.G. 1992. “Valuing Good’s Characteristics: An Appli-cation of the Hedonic Price Method to Environmental Attributes.” Journal ofEnvironmental Management, 34: 59-76.
économiepublique165

recherches Caroline Schaerer, Andrea Baranzini, José V. Ramirez, Philippe Thalmann
Geoghegan, J., Wainger, L.A., and Bockstael, N.E. 1997. “Spatial Landscape Indicesin a Hedonic Framework: An Ecological Economics Analysis Using GIS.” EcologicalEconomics 23: 251–264.
Grosclaude, P., and Soguel, N. 1992. “Coûts externes du trafic routier: évaluationen milieu urbain.” Swiss Journal of Economics and Statistics, 128(3): 453-469.
Halvorsen, R., and Palmquist, R. 1980. “The Interpretation of Dummy Variables inSemilogarithmic Equations.” American Economic Review, 70(3): 474-475.
Iten, R., and Maibach, M. 1992. “Externe Kosten durch Verkehrslärm in Stadt undAgglomeration Zürich.” Swiss Journal of Economics and Statistics, 128(1): 51-68.
Lutzenhiser, M., and Netusil, N.R. 2001. “The Effect of Open Spaces on a Home’sSale Price.” Contemporary Economic Policy, 19 (3): 291-298.
Mahan, B. L., Polasky, S., and Adams, R. M. 2000. “Valuing Urban Wetlands: AProperty Price Approach.” Land Economics, 76(1): 100-113.
Mäler, K.-G., and Vincent, J. (ed.). 2006. Handbook of Environmental Economics.Volume 2, Valuing Environmental Changes, Elsevier, North-Holland.
McConnell, V., and Walls, M. 2005. “The Value of Open Space: Evidence fromStudies of Non-Market Benefits.” Washington DC: Resources for the Future, RFFReport.
Palmquist, R.B. 1999. “Hedonic Models.” In J.C.J.M van den Bergh (Eds.), Handbookof Environmental and Resource Economics. Cheltenham: Edward Elgar, 765-776.
Palmquist, R.B. 2005. “Property Value Models”. In K.-G. Mäler and J. Vincent,Handbook of Environmental Economics, Vol. 2. Amsterdam: North Holland.
Pommerehne, W.W. 1987. “L’évaluation des gains et des pertes d’aménités: le casdu bruit provenant du trafic”. In: P. Burgat and C. Jeanrenaud, Services publicslocaux. Paris: Economica, 197-220.
Rieder, T. 2005. “Die Bestimmung des Mieten in der Schweiz.” Lizenzarbeit,Volkswirtschfliches Institut, Abteilung Ökonometrie, Universität Bern.
Rosen, S. 1974. “Hedonic Prices and Implicit Markets: Product Differentiation inPure Competition.” Journal of Political Economy, 82: 34-55.
Salvi, M. 2003. Spatial Estimation of the Impact of Airport Noise on ResidentialHousing Prices. Zurich: Zurich Kantonal Bank, Switzerland.
Salvi, M., Schellenbauer, P., and Schmid, H. 2004. Preise, Mieten und Renditen:Der Immobilienmarkt transparent gemacht. Zurich: Zurich Kantonal Bank.
no 20 - 2007 / 1166

Using the Hedonic Approach to Value Natural Land Uses in an Urban Area
Schultz, S.D., and King, D.A. 2001. “The Use of Census Data for Hedonic PriceEstimates of Open-Space Amenities and Land Use.” Journal of Real Estate Financeand Economics, 22 (2,3): 239 – 252.
Sheppard, S. 1999. “Hedonic Analysis of Housing Markets.” In E.S. Mills and P.Cheshire (eds), Handbook of Regional and Urban Economics, Vol.3, Applied Urbaneconomics: 1595-1635.
Sommer, H., Suter, S., Lenz, C., and Salvi, M. 2000. Externe Lärmekosten desVerkhers – Hedonic Pricing Analyse. Bern: ECOPLAN.
Song, Y., and Knaap, G.-J. 2004. “Measuring the Effects of Mixed Land Uses onHousing Values.” Regional Science and Urban Economics 34: 663-680.
Swiss Noise Abatement Ordinance. 1986. SR 814.41. AS 1987 338. Bern.
Tangerini, A., and Soguel, N. 2004. “L’évaluation monétaire de la qualité dupaysage”. Working papers de l’IDHEAP 6/2004. UER : Finances Publiques.
Thalmann, P. 1987. “Explication empirique des loyers lausannois.” Swiss Journalof Economics and Statistics, 123(1): 47-69.
Tyrväinen, L. 1997. “The Amenity Value of the Urban Forest: An Application ofthe Hedonic Pricing Method.” Landscape and Urban Planning, 37: 211–222.
économiepublique167