using raster-based time-series analysis to define temporal streamflow variability; keeping the...
TRANSCRIPT
Using raster-based time-series Using raster-based time-series analysis to define temporal analysis to define temporal
streamflow variability; streamflow variability;
Keeping the ‘natural’ Keeping the ‘natural’ in natural streamflowin natural streamflow
Richard Koehler, Ph.D.Richard Koehler, Ph.D.
National Weather Service, NOAANational Weather Service, NOAA

Quote:Quote:
““There’s a saying among prospectors: There’s a saying among prospectors:
‘‘Go out looking for one thing, and that’s Go out looking for one thing, and that’s all you’ll ever find.’ ”all you’ll ever find.’ ”
Robert Flaherty (1884 – 1951)Robert Flaherty (1884 – 1951)
legendary documentary filmmakerlegendary documentary filmmaker

Presentation outlinePresentation outline
Study sitesStudy sites BackgroundBackground Theoretical overviewTheoretical overview
Raster-based imageRaster-based image Grid-correlogramsGrid-correlograms Patch analysisPatch analysis
ResultsResults Other applicationsOther applications QuestionsQuestions
Study sitesStudy sites
Snake and Colorado RiversSnake and Colorado Rivers Snowmelt runoff dominated Snowmelt runoff dominated Highly regulatedHighly regulated Tributaries with minimal human disturbancesTributaries with minimal human disturbances
San Pedro RiverSan Pedro River Rainfall dominatedRainfall dominated UnregulatedUnregulated

Map of study sitesMap of study sites
Weiser River at Cambridge, ID
Snake River at Irwin, ID andat Heise, ID
San Miguel Riverat Placerville, CO
Colorado Riverat Lees Ferry, AZ
San Pedro Riverat Charleston, AZ
BackgroundBackground
Streamflow patterns Streamflow patterns Occur on different timescalesOccur on different timescales Show cumulative effect of disturbancesShow cumulative effect of disturbances Include flow volume and timing Include flow volume and timing
Multiple existing methods (170+ indices )Multiple existing methods (170+ indices ) Many correlated or redundantMany correlated or redundant Adequate for volume (composition)Adequate for volume (composition) Weak for timing (configuration)Weak for timing (configuration)
Large daily datasets existLarge daily datasets exist Possibility for many types of patterns within flow recordPossibility for many types of patterns within flow record
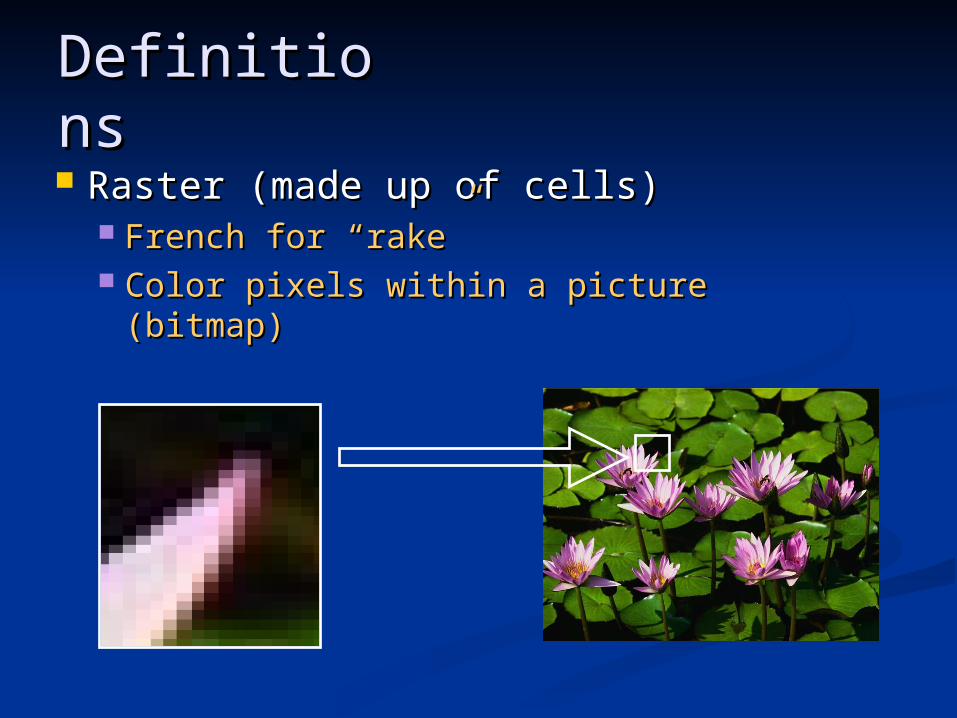
DefinitionsDefinitions Raster (made up of cells)Raster (made up of cells)
French for “rake”French for “rake” Color pixels within a picture (bitmap)Color pixels within a picture (bitmap)
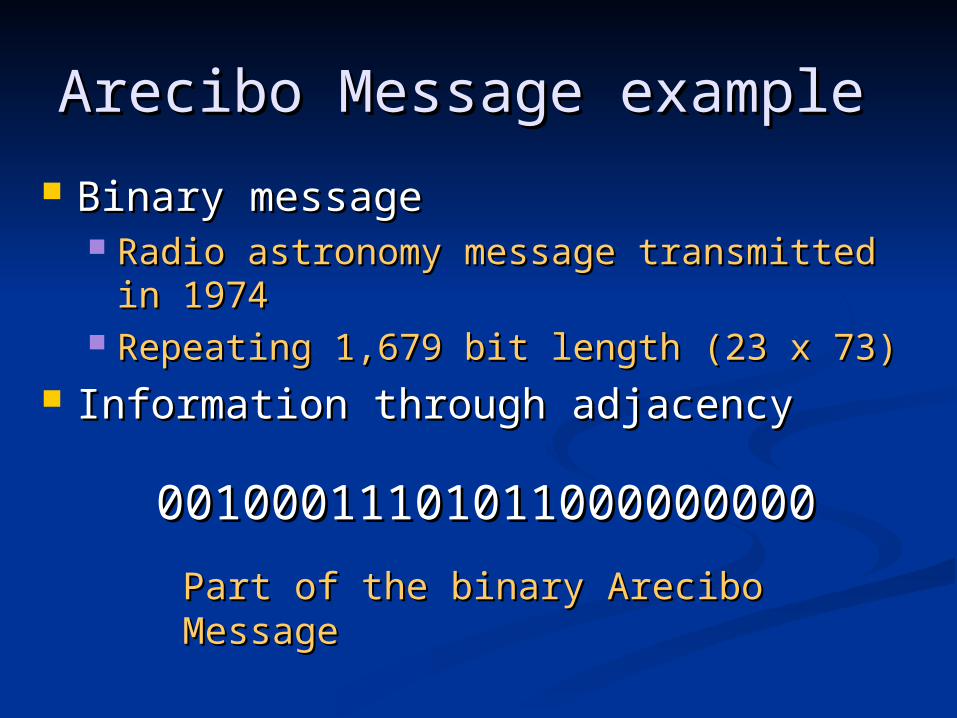
Arecibo Message exampleArecibo Message example
Binary messageBinary message Radio astronomy message transmitted in 1974Radio astronomy message transmitted in 1974 Repeating 1,679 bit length (23 x 73)Repeating 1,679 bit length (23 x 73)
Information through adjacencyInformation through adjacency
0010001110101100000000000100011101011000000000
Part of the binary Arecibo MessagePart of the binary Arecibo Message

Arecibo Message exampleArecibo Message example
NumbersNumbers
Chemical elements, Chemical elements,
sugars, bases for DNAsugars, bases for DNA
DNA double helixDNA double helix
Human figureHuman figure
Solar system Solar system
Arecibo antennaArecibo antenna
00000000101010000000000001010001010000000001001000100010001001011001010101010101010100100100000000000000000000000000000000000001100000000000000000001101000000000000000000011010000000000000000001010100000000000000000011111000000000000000000000000000000001100001110001100001100010000000000000110010000110100011000110000110101111101111101111101111100000000000000000000000000100000000000000000100000000000000000000000000001000000000000000001111110000000000000111110000000000000000000000011000011000011100011000100000001000000000100001101000011000111001101011111011111011111011111000000000000000000000000001000000110000000001000000000001100000000000000010000011000000000011111100000110000001111100000000001100000000000001000000001000000001000001000000110000000100000001100001100000010000000000110001000011000000000000000110011000000000000011000100001100000000011000011000000100000001000000100000000100000100000001100000000100010000000011000000001000100000000010000000100000100000001000000010000000100000000000011000000000110000000011000000000100011101011000000000001000000010000000000000010000011111000000000000100001011101001011011000000100111001001111111011100001110000011011100000000010100000111011001000000101000001111110010000001010000011000000100000110110000000000000000000000000000000000011100000100000000000000111010100010101010101001110000000001010101000000000000000010100000000000000111110000000000000000111111111000000000000111000000011100000000011000000000001100000001101000000000101100000110011000000011001100001000101000001010001000010001001000100100010000000010001010001000000000000100001000010000000000001000000000100000000000000100101000000000001111001111101001111000
2323
7373

Year 1984
Day 329 330 331
...1985
329 330 331
...1986
329 330 331
1 yr 1 yr
Year
1986
1985
1984
Day 329 330 331
Short-term timescale "i" (daily)
Long-term timescale
"j"(yearly)
Gridded time series RasterGridded time series RasterNovember 1985
Sunday Monday Tuesday Wednesday Thursday Friday Saturday
1
6 7 83 4
2
5
13 14 1510 11
9
12
20 21 2217 18
16
19
27 2924 25
23
26 28 30
Short-term timescale (daily)
Long-term
timescale
(weekly)

Colorado River exampleColorado River example Colorado River at Lees Ferry, AZ linear hydrographColorado River at Lees Ferry, AZ linear hydrograph
10
100
1000
10000
Oct-1921
Oct-1931
Oct-1941
Oct-1951
Oct-1961
Oct-1971
Oct-1981
Oct-1991
Oct-2001
Date
Flo
w (
cm
s)
1
2
3
45

Colorado River exampleColorado River example Colorado River at Lees Ferry, AZ raster hydrographColorado River at Lees Ferry, AZ raster hydrograph
30 60 90 120 150 180 210 240 270 300 330 360
Day of Water Year
1930
1940
1950
1960
1970
1980
1990
2000
Wa
ter
Yea
r
100
1000
Flow (cms)
2.00
3.00
22
11
3
4
5

Raster-based approachRaster-based approach Display Display allall daily data daily data
Don’t hide/cover pointsDon’t hide/cover points Show large range and amount of dataShow large range and amount of data Compare between and within yearsCompare between and within years Identify short/long term natural/artificial patternsIdentify short/long term natural/artificial patterns Identify outliers and unusual valuesIdentify outliers and unusual values Keep graph size to a minimumKeep graph size to a minimum
Gain new insight/interpretation of dataGain new insight/interpretation of data

San Pedro RiverSan Pedro River
30 60 90 120 150 180 210 240 270 300 330 360
D ay of C alendar Year
1940
1950
1960
1970
1980
1990
2000
Ca
len
da
r Y
ea
r
San Pedro River at Charleston, AZ.Daily Flow Values
Jan Feb M ar Apr M ay Jun Ju l Aug Sep O ct N ov D ec
-1
0
1
2
3
4 10,000
1,000
100
10
1
0.1
Flow (cfs)+
+
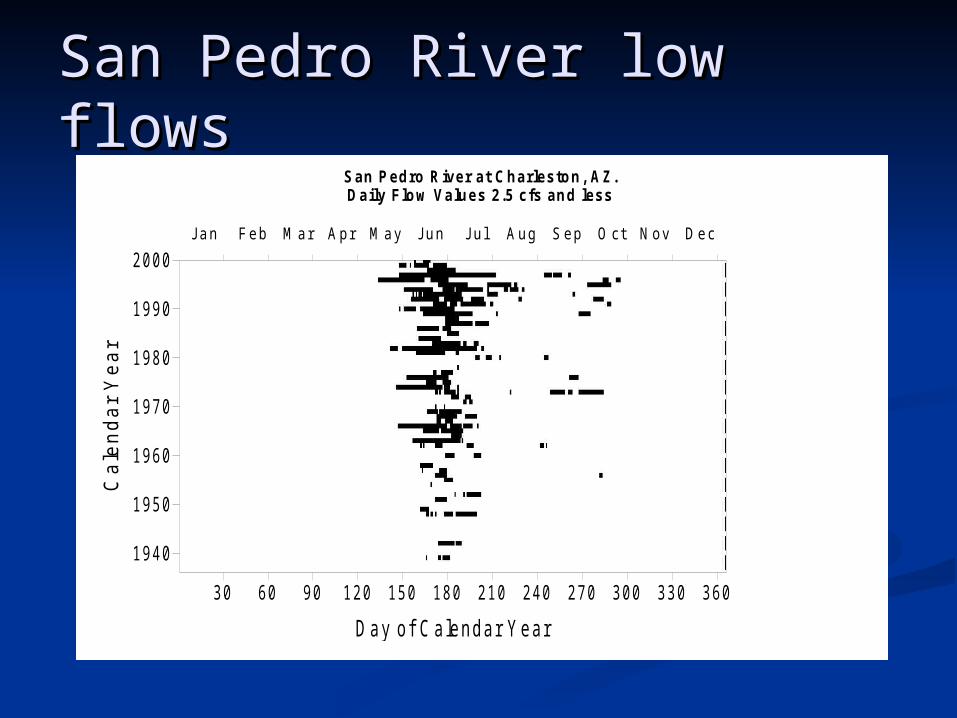
San Pedro River low flowsSan Pedro River low flows
30 60 90 120 150 180 210 240 270 300 330 360
D ay of C alendar Year
1940
1950
1960
1970
1980
1990
2000
Ca
len
da
r Y
ea
r
San Pedro River at Charleston, AZ.Daily Flow Values 2.5 cfs and less
Jan Feb M ar Apr M ay Jun Ju l Aug Sep O ct N ov D ec
30 60 90 120 150 180 210 240 270 300 330 360
D ay of C alendar Year
1940
1950
1960
1970
1980
1990
2000
Ca
len
da
r Y
ea
r
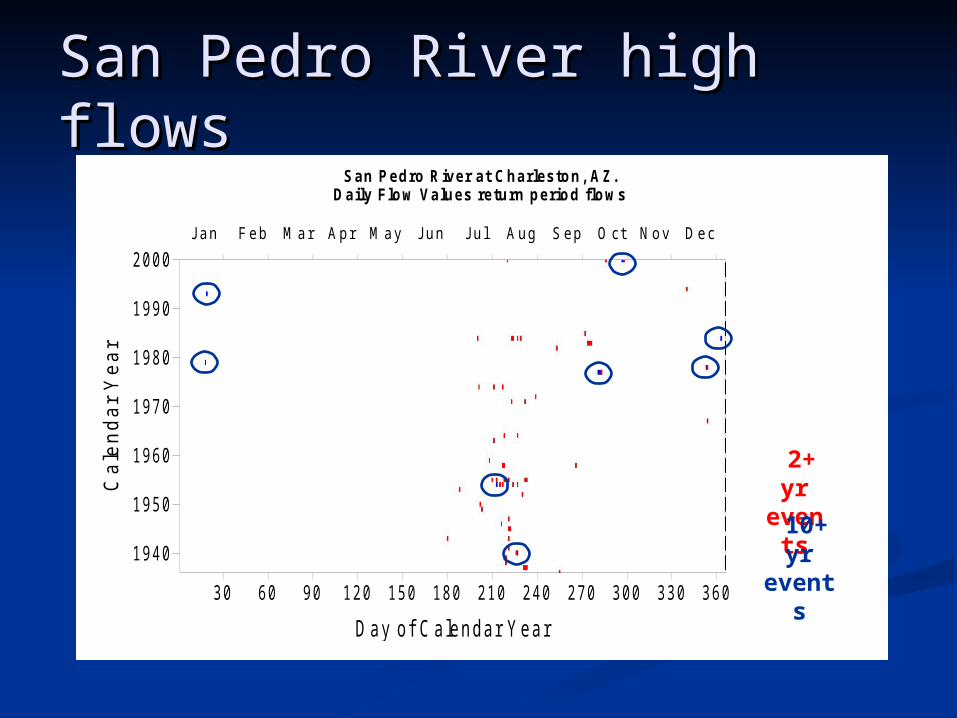
San Pedro River at Charleston, AZ.Daily Flow Values return period flows
Jan Feb M ar Apr M ay Jun Ju l Aug Sep O ct N ov D ec
2+ yr
events
10+ yr
events
San Pedro River high flowsSan Pedro River high flows
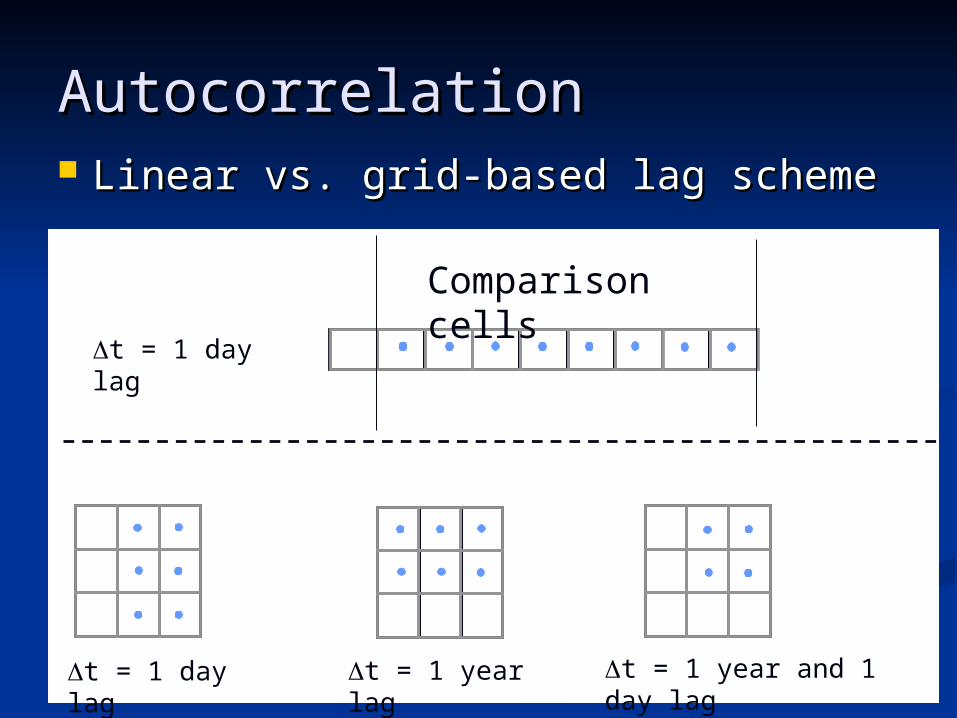
Autocorrelation Autocorrelation Linear vs. grid-based lag schemeLinear vs. grid-based lag scheme
t = 1 day lag
Comparison cells
t = 1 day lag t = 1 year lag t = 1 year and 1 day lag
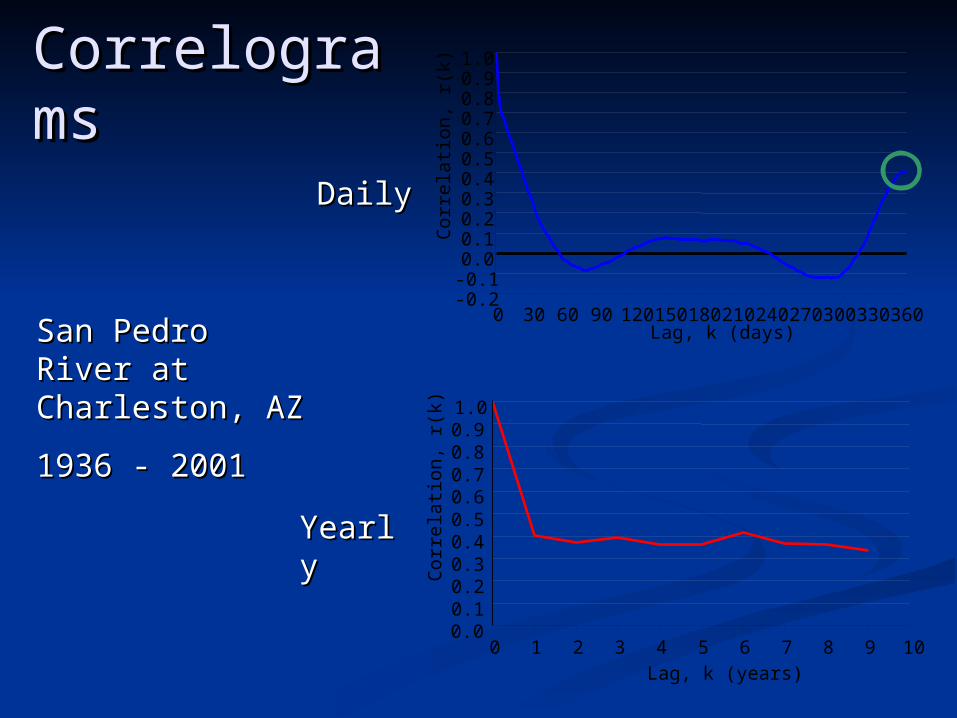
CorrelogramsCorrelograms
San Pedro River at San Pedro River at Charleston, AZCharleston, AZ
1936 - 20011936 - 2001
-0.2-0.10.00.10.20.30.40.50.60.70.80.91.0
0 30 60 90 120150 180 210240 270300 330 360Lag, k (days)
Cor
rela
tion,
r(k
)
DailyDaily
YearlyYearly
0.00.10.20.30.40.50.60.70.80.91.0
0 1 2 3 4 5 6 7 8 9 10Lag, k (years)
Cor
rela
tion,
r(k
)
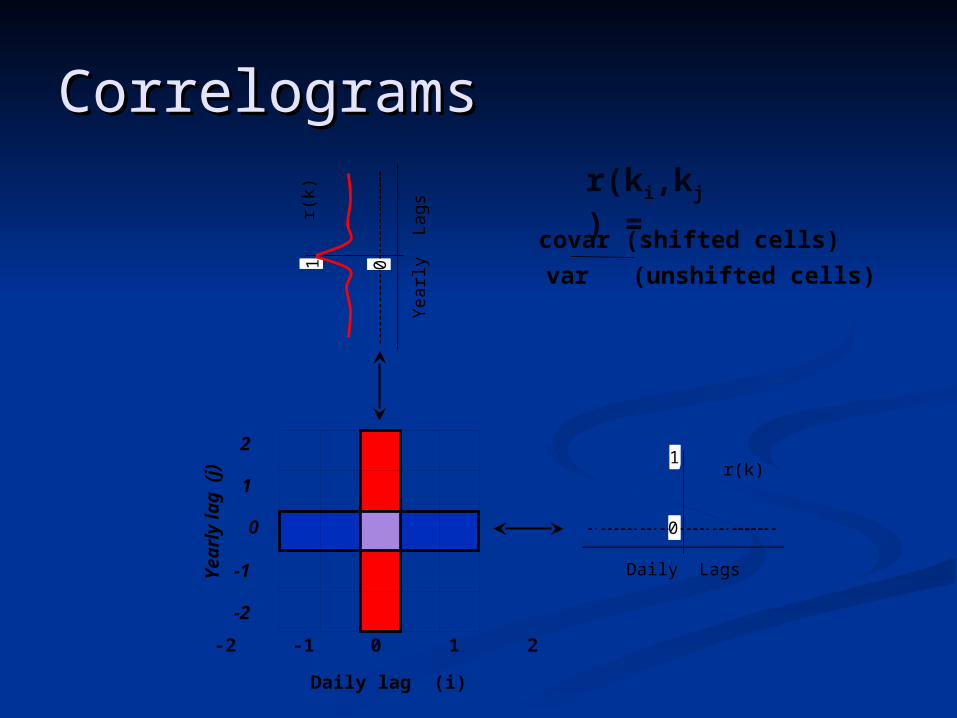
Correlograms Correlograms r(ki,kj) =
var (unshifted cells) covar (shifted cells)
1r(k)
0
1
Daily Lags
0
1r(
k)
01
Yea
rly L
ags
0
2
1
Yea
rly
lag
(j
)
-1
-2
-2 -1 0 1 2
Daily lag (i)
0
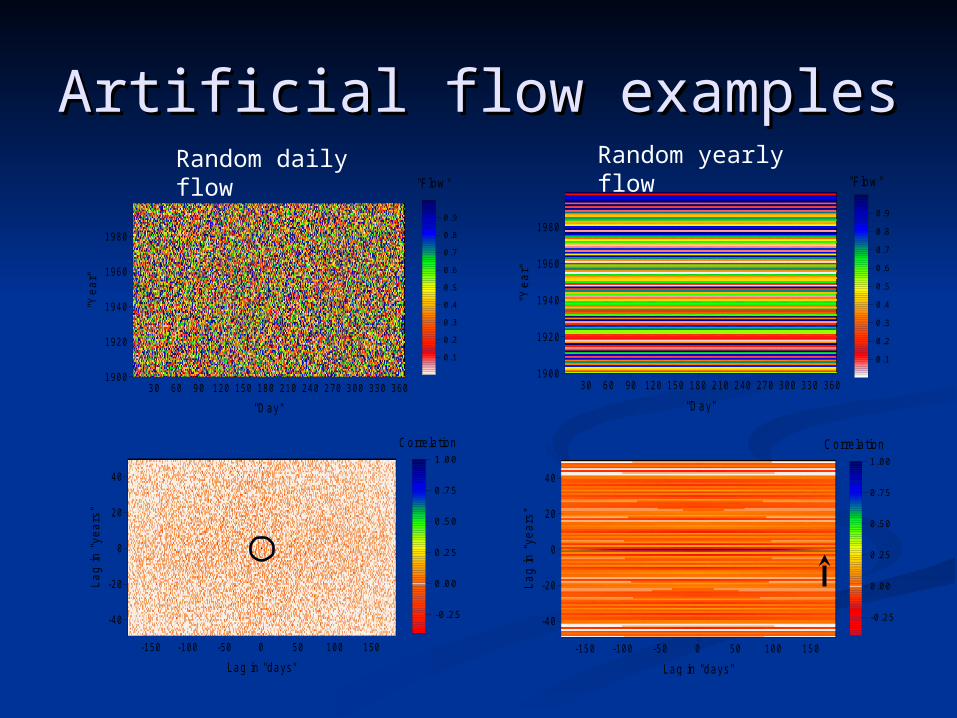
Artificial flow examplesArtificial flow examples
30 60 90 120 150 180 210 240 270 300 330 360
"Day"
1900
1920
1940
1960
1980
"Yea
r"
0.1
0.2
0.3
0.4
0.5
0.6
0.7
0.8
0.9
"F low"
-150 -100 -50 0 50 100 150
Lag in "days"
-40
-20
0
20
40
La
g in
"ye
ars
"
-0.25
0.00
0.25
0.50
0.75
1.00
C orre la tion
30 60 90 120 150 180 210 240 270 300 330 360
"Day"
1900
1920
1940
1960
1980
"Yea
r"
0.1
0.2
0.3
0.4
0.5
0.6
0.7
0.8
0.9
"F low "
-150 -100 -50 0 50 100 150
Lag in "days"
-40
-20
0
20
40
Lag
in "
year
s"
-0.25
0.00
0.25
0.50
0.75
1.00
Corre lation
Random daily flow Random yearly flow
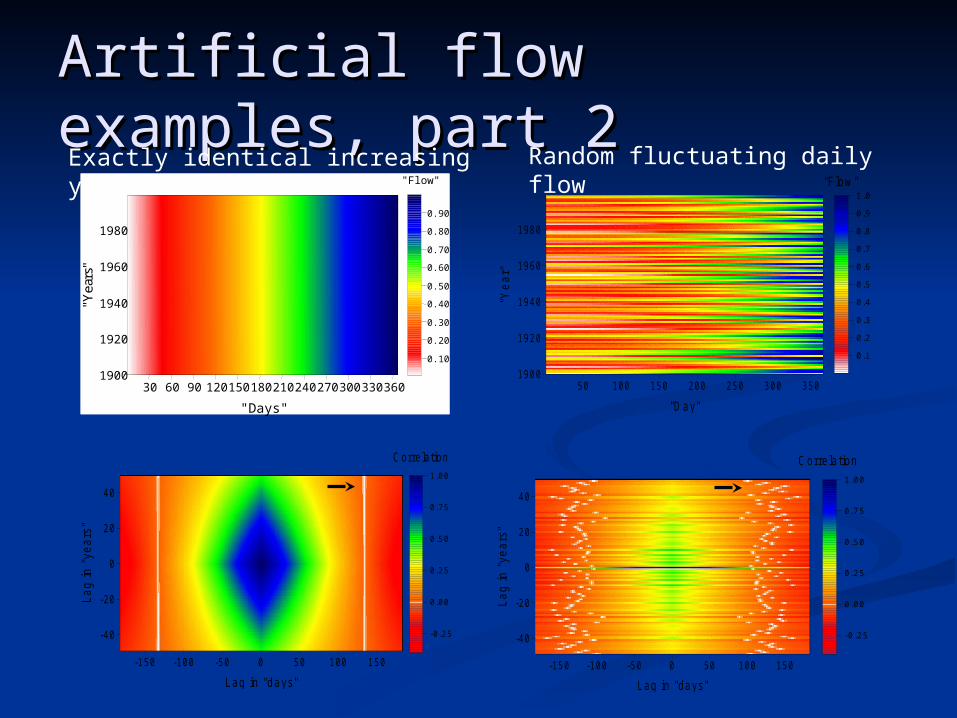
Artificial flow examples, part 2Artificial flow examples, part 2
-150 -100 -50 0 50 100 150
Lag in "days"
-40
-20
0
20
40
Lag
in "
year
s"
C orre la tion
-0.25
0.00
0.25
0.50
0.75
1.00
50 100 150 200 250 300 350
"Day"
1900
1920
1940
1960
1980
"Yea
r"
0.1
0.2
0.3
0.4
0.5
0.6
0.7
0.8
0.9
1.0
"F low"
-150 -100 -50 0 50 100 150
Lag in "days"
-40
-20
0
20
40La
g in
"ye
ars"
-0.25
0.00
0.25
0.50
0.75
1.00
Correlation
Exactly identical increasing yearly flow Random fluctuating daily flow"Flow"
30 60 90 120 150 180 210 240 270 300 330 360
"Days"
1900
1920
1940
1960
1980
"Yea
rs"
0.10
0.20
0.30
0.40
0.50
0.60
0.70
0.80
0.90
"Flow"
30 60 90 120 150 180 210 240 270 300 330 360
"Days"
1900
1920
1940
1960
1980
"Yea
rs"
0.10
0.20
0.30
0.40
0.50
0.60
0.70
0.80
0.90

Patch analysis – definitionsPatch analysis – definitions
Square shape
Linear shape
Intermediate shape
Cell of interest
Neighbor
Non-neighbor
Eight-cell neighbor Four-cell neighbor
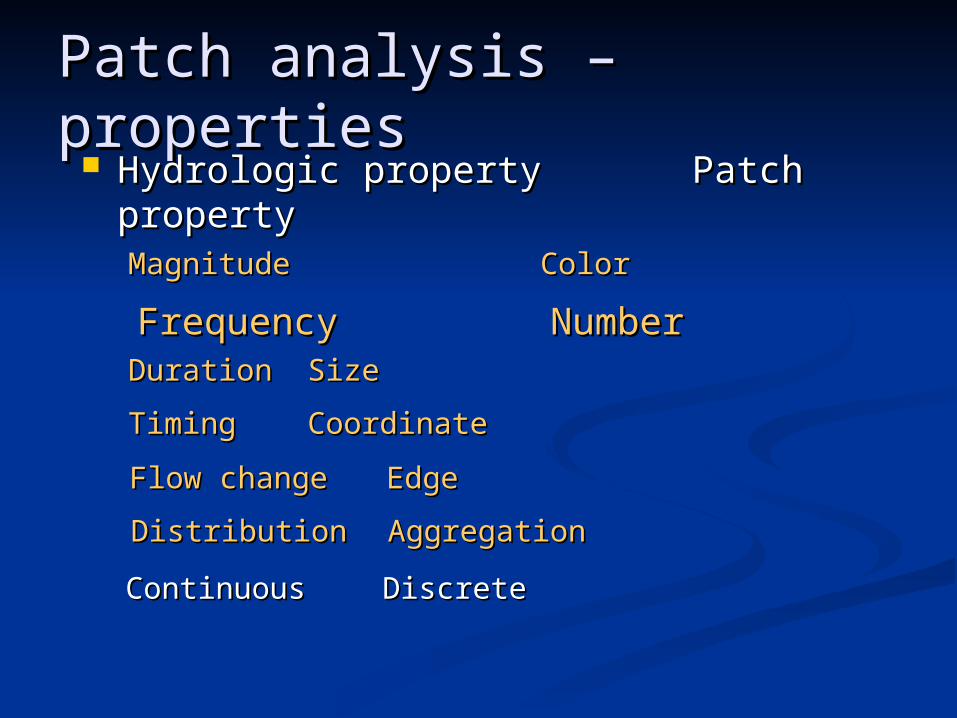
Patch analysis – propertiesPatch analysis – properties Hydrologic propertyHydrologic property Patch propertyPatch property
MagnitudeMagnitude ColorColor
FrequencyFrequency NumberNumberDurationDuration SizeSize
TimingTiming CoordinateCoordinate
Flow changeFlow change EdgeEdge
DistributionDistribution AggregationAggregation
ContinuousContinuous DiscreteDiscrete

Reclassify dataReclassify data Needed to create discrete categoriesNeeded to create discrete categories
10
100
1000
10000
1/1/51 4/2/51 7/2/51 10/1/51 12/31/51
Date
Flo
w (
cms)
Source
Category
4
3
2
1
Log
(flo
w in
cm
s)
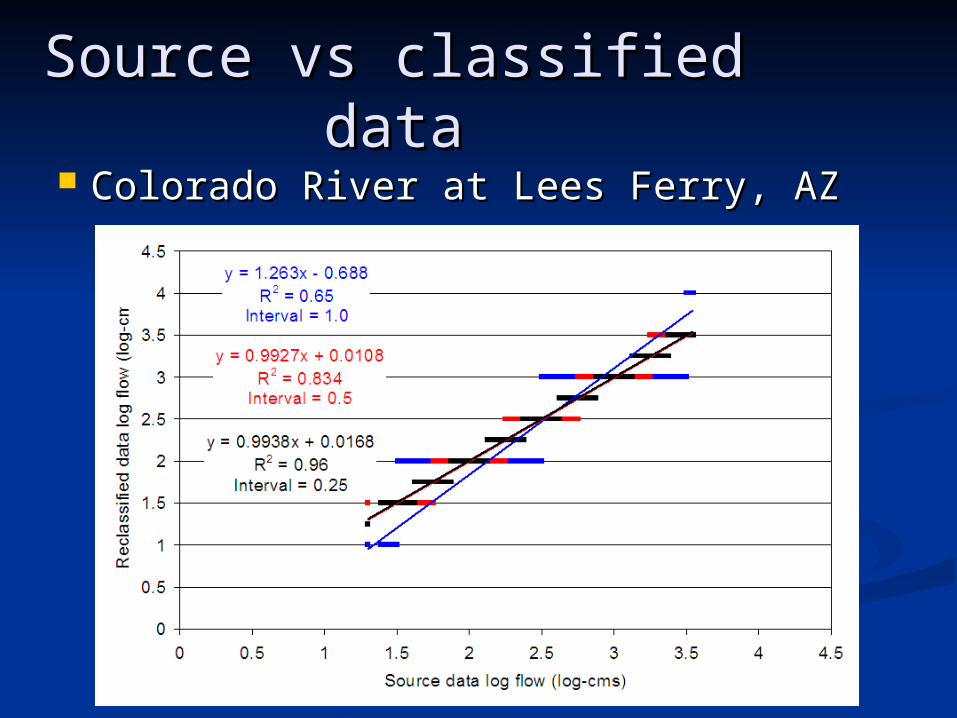
Source vs classified dataSource vs classified data Colorado River at Lees Ferry, AZColorado River at Lees Ferry, AZ
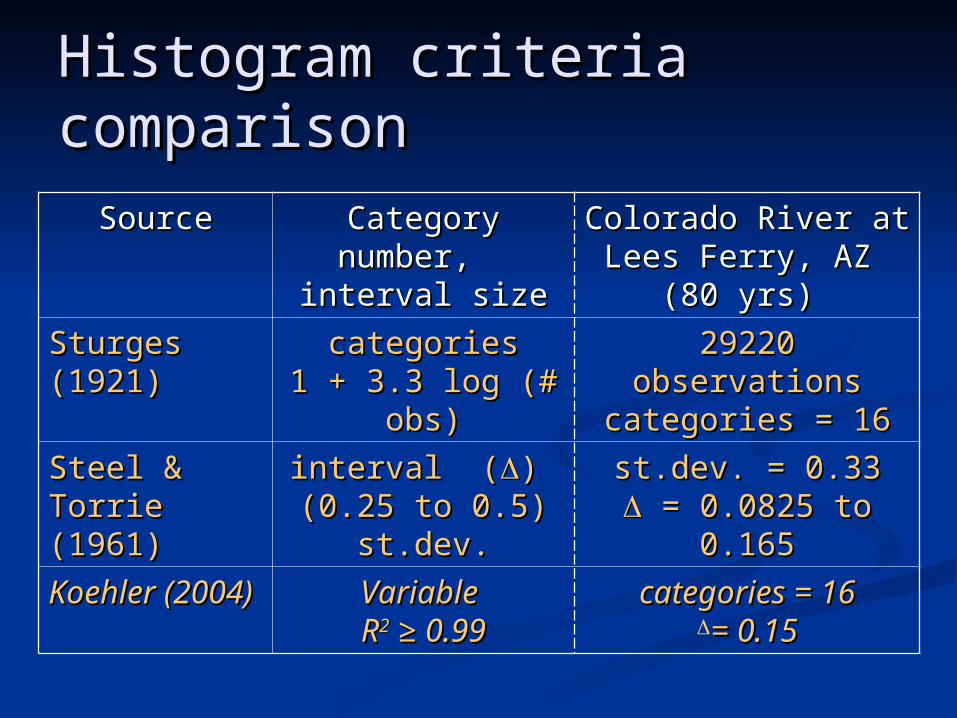
Histogram criteria comparisonHistogram criteria comparison
SourceSource Category number, Category number, interval sizeinterval size
Colorado River at Colorado River at Lees Ferry, AZ Lees Ferry, AZ
(80 yrs) (80 yrs)
Sturges (1921)Sturges (1921) categoriescategories1 + 3.3 log (# obs)1 + 3.3 log (# obs)
29220 observations29220 observationscategories = 16categories = 16
Steel & Torrie Steel & Torrie (1961)(1961)
interval (interval () ) (0.25 to 0.5) st.dev.(0.25 to 0.5) st.dev.
st.dev. = 0.33st.dev. = 0.33 = 0.0825 to 0.165= 0.0825 to 0.165
Koehler (2004)Koehler (2004) Variable Variable RR22 ≥ 0.99 ≥ 0.99
categories = 16categories = 16= 0.15= 0.15
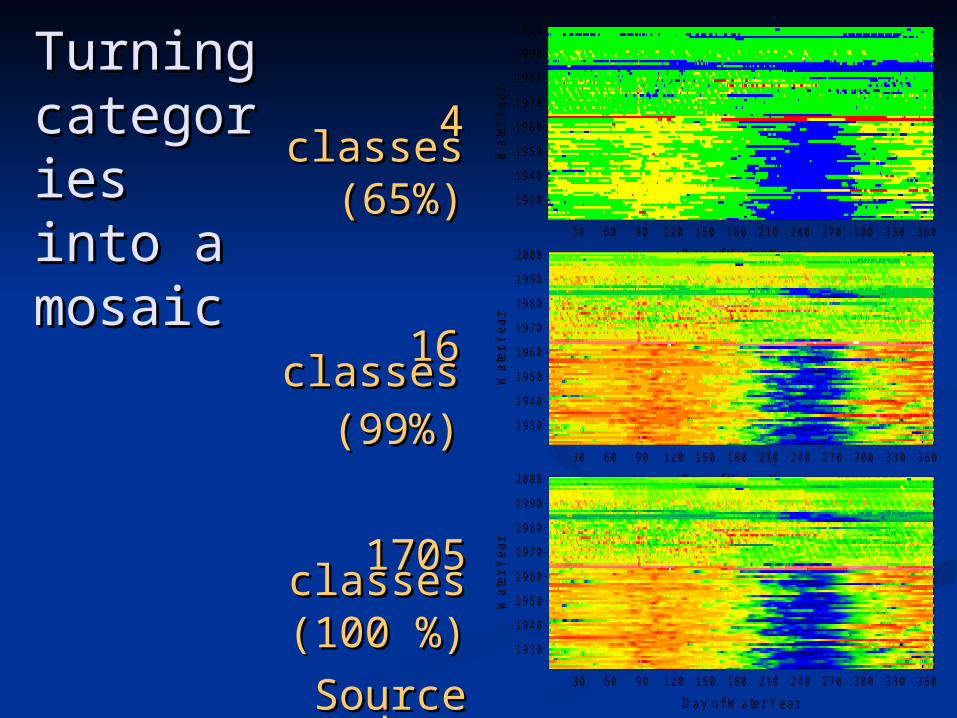
Turning Turning categoriescategoriesinto a into a mosaicmosaic
4 classes4 classes(65%)(65%)
16 classes16 classes(99%)(99%)
1705 classes1705 classes(100 %)(100 %)
Source dataSource data
30 60 90 120 150 180 210 240 270 300 330 360
Day of W ater Year
1930
1940
1950
1960
1970
1980
1990
2000
Wa
ter
Ye
ar
30 60 90 120 150 180 210 240 270 300 330 360
D ay of W ater Year
1930
1940
1950
1960
1970
1980
1990
2000
Wat
er
Yea
r
30 60 90 120 150 180 210 240 270 300 330 360
D ay of W ater Year
1930
1940
1950
1960
1970
1980
1990
2000
Wat
er Y
ear
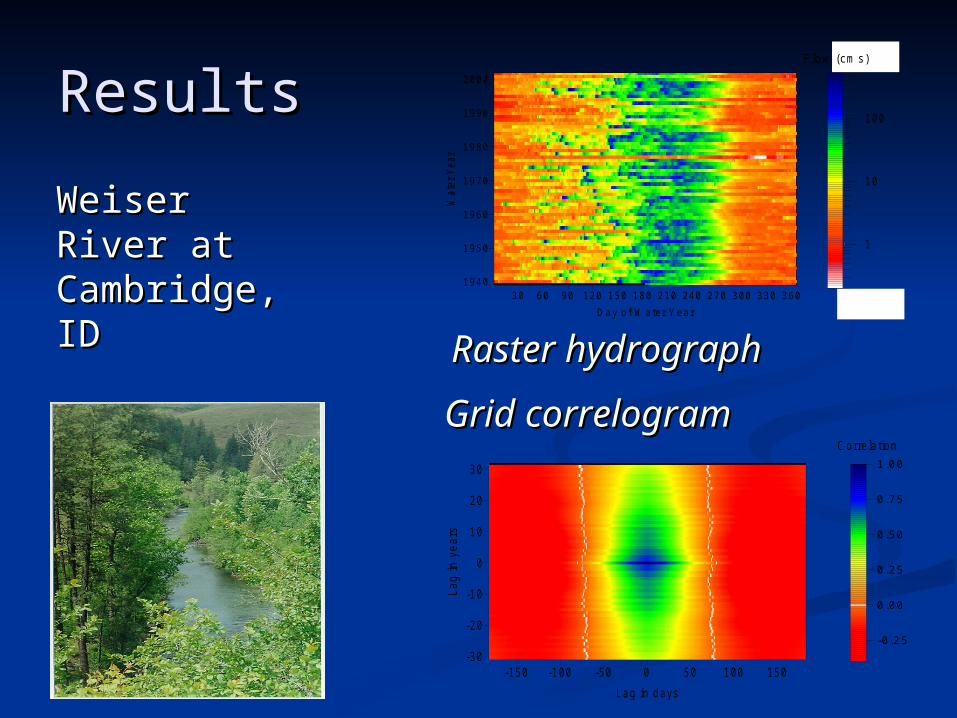
ResultsResults
0.1
1
10
100
1000
30 60 90 120 150 180 210 240 270 300 330 360
D ay of W ater Y ear
1940
1950
1960
1970
1980
1990
2000
Wat
er Y
ear
0
1
2
Flow (cm s)
-150 -100 -50 0 50 100 150
Lag in days
-30
-20
-10
0
10
20
30La
g in
yea
rs
-0.25
0.00
0.25
0.50
0.75
1.00
C orre lation
Weiser River at Weiser River at Cambridge, IDCambridge, ID
Control siteControl site Raster hydrographRaster hydrograph
Grid correlogramGrid correlogram
-150 -100 -50 0 50 100 150
Lag in days
-30
-20
-10
0
10
20
30La
g in
yea
rs
-0.25
0.00
0.25
0.50
0.75
1.00
C orre lation
30 60 90 120 150 180 210 240 270 300 330 360
D ay of W ater Year
1950
1960
1970
1980
1990
2000
Wat
er Y
ear
0 .0
1 .0
1
10
Flow (cm s)
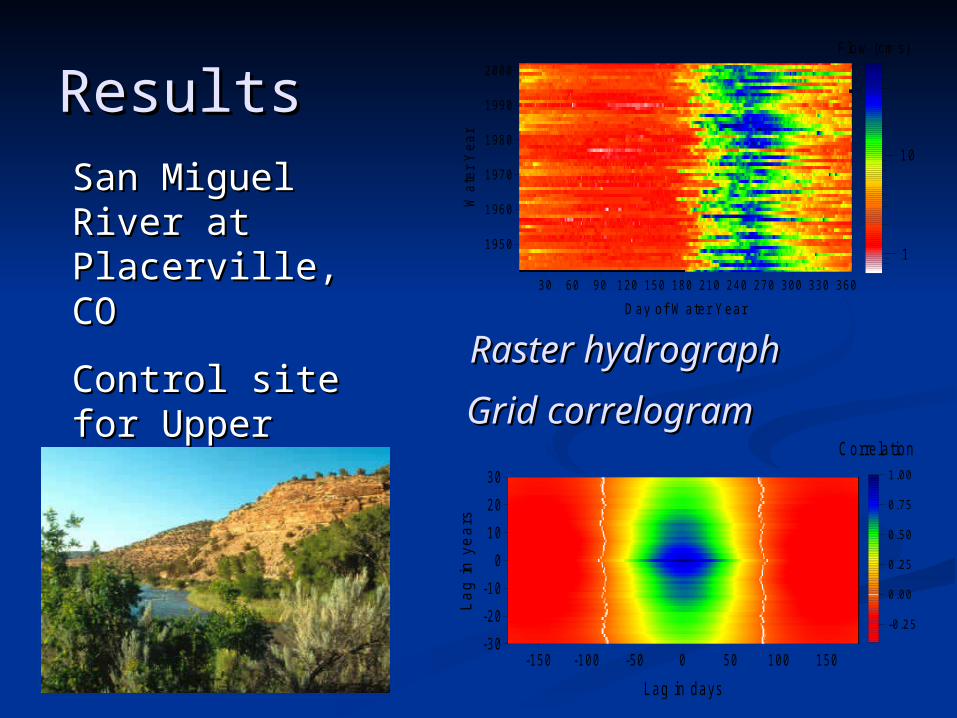
ResultsResultsSan Miguel River San Miguel River at Placerville, COat Placerville, CO
Control site for Control site for Upper Colorado Upper Colorado River BasinRiver Basin
Raster hydrographRaster hydrograph
Grid correlogramGrid correlogram
1000
10000
100000
30 60 90 120 150 180 210 240 270 300 330 360
D ay of W ater Year
196019651970197519801985199019952000
Wa
ter
Ye
ar
3 .00
3 .50
4 .00
4 .50
Flow (cm s)
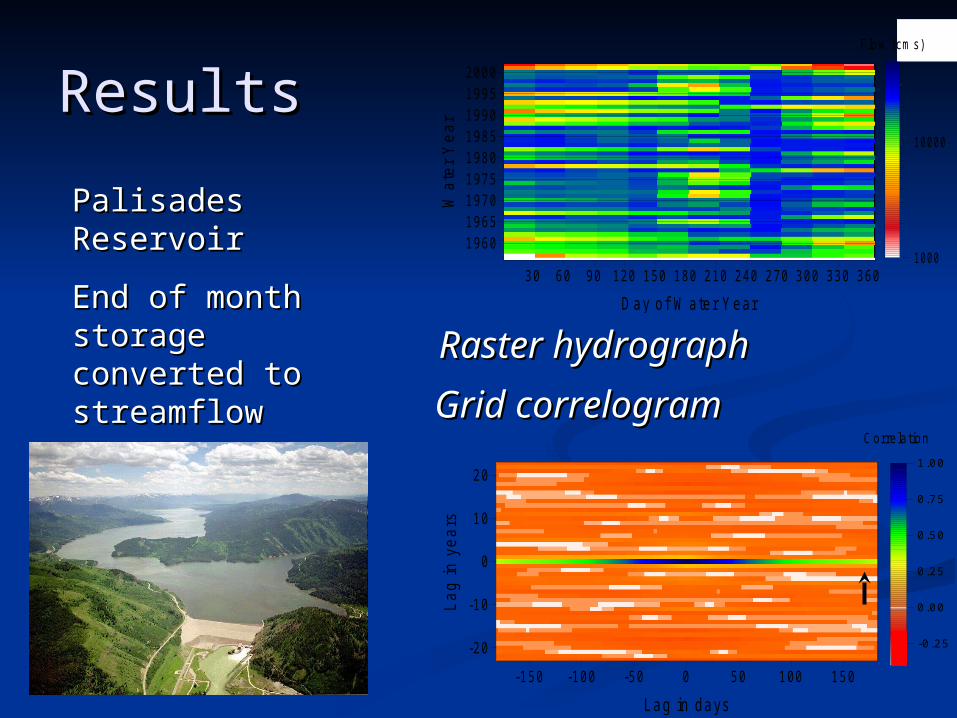
ResultsResults
Palisades Palisades ReservoirReservoir
End of month End of month storage converted storage converted to streamflowto streamflow
Raster hydrographRaster hydrograph
Grid correlogramGrid correlogram
-150 -100 -50 0 50 100 150
Lag in days
-20
-10
0
10
20
Lag
in y
ears
-0 .25
0.00
0.25
0.50
0.75
1.00
C orre lation

-150 -100 -50 0 50 100 150
Lag in D ays
-20
-10
0
10
20
Lag
in y
ears
Correlation
-0.25
0.00
0.25
0.50
0.75
1.00
-150 -100 -50 0 50 100 150
Lag in days
-20
-10
0
10
20
Lag
in y
ears
-0.25
0.00
0.25
0.50
0.75
1.00
C orre lation
ResultsResultsSnake River at Snake River at Heise, IDHeise, ID
Downstream from Downstream from Palisades ReservoirPalisades Reservoir
(1911 through 1951)(1911 through 1951) (1960 through 2000)(1960 through 2000)Grid correlogramsGrid correlograms
10
100
1000
30 60 90 120 150 180 210 240 270 300 330 360
Day of W ater Year
1920
1930
1940
1950
1960
1970
1980
1990
2000
Wat
er Y
ear
F low (cm s)
Raster hydrographRaster hydrograph
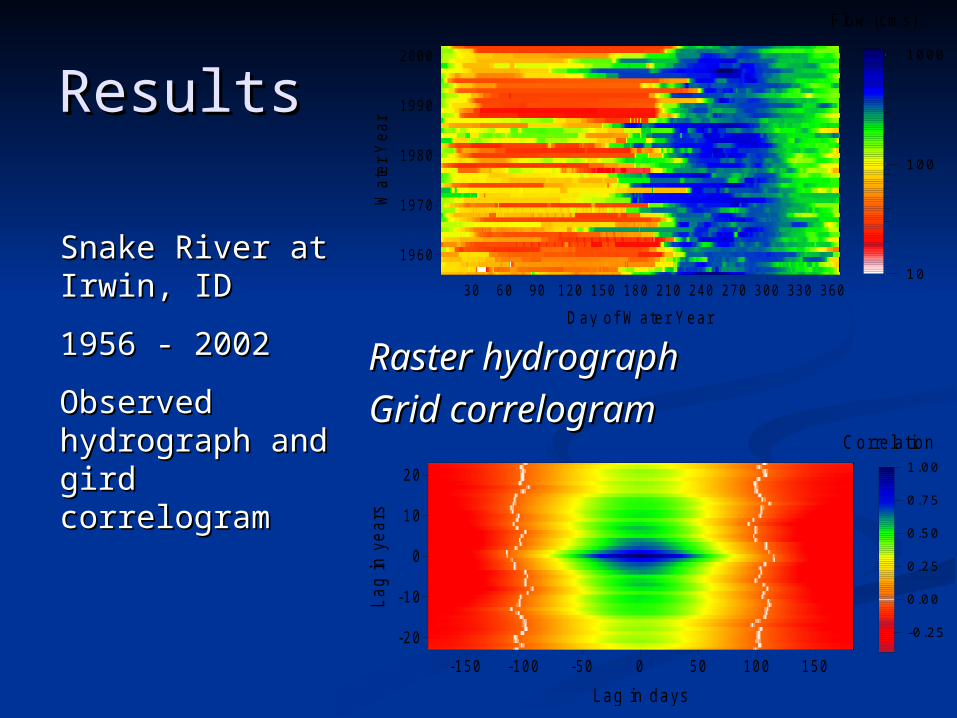
ResultsResults
Snake River at Snake River at Irwin, IDIrwin, ID
1956 - 20021956 - 2002
Observed Observed hydrograph and hydrograph and gird correlogramgird correlogram
10
100
1000
30 60 90 120 150 180 210 240 270 300 330 360
D ay of W ater Year
1960
1970
1980
1990
2000
Wa
ter
Yea
r
1
2
3
Flow (cm s)
-150 -100 -50 0 50 100 150
Lag in days
-20
-10
0
10
20
Lag
in y
ears
-0.25
0.00
0.25
0.50
0.75
1.00
Corre lation
Raster hydrographRaster hydrograph
Grid correlogramGrid correlogram
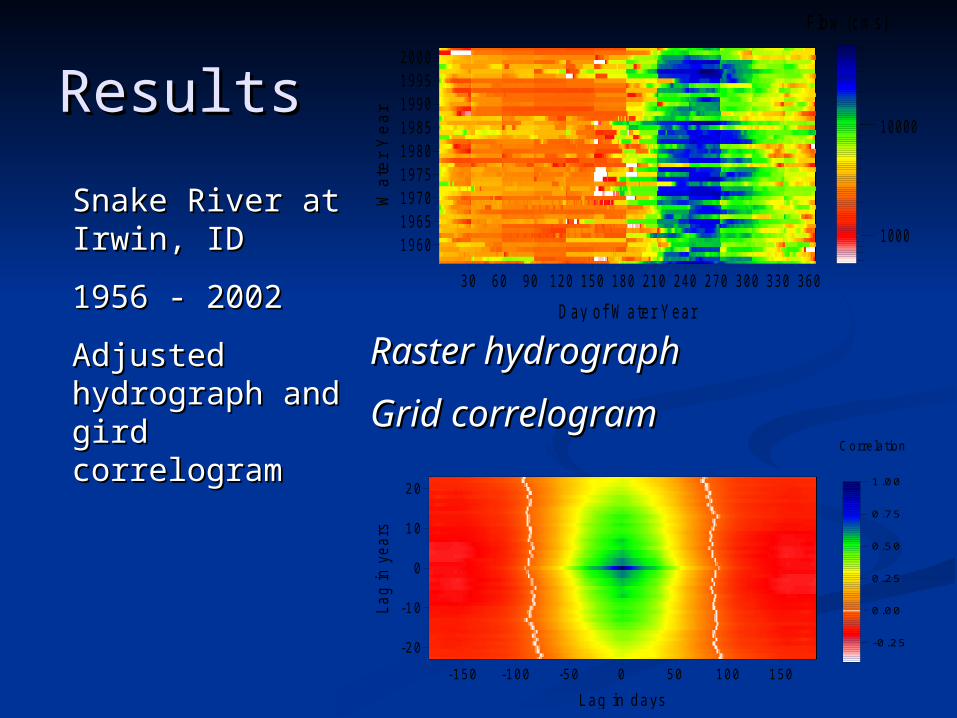
ResultsResults
Snake River at Snake River at Irwin, IDIrwin, ID
1956 - 20021956 - 2002
Adjusted Adjusted hydrograph and hydrograph and gird correlogramgird correlogram
Raster hydrographRaster hydrograph
Grid correlogramGrid correlogram
30 60 90 120 150 180 210 240 270 300 330 360
Day of W ater Year
196019651970197519801985199019952000
Wa
ter
Ye
ar
3.00
4.00 10000
1000
Flow (cm s)
-150 -100 -50 0 50 100 150
Lag in days
-20
-10
0
10
20
Lag
in y
ears
C orre la tion
-0 .25
0.00
0.25
0.50
0.75
1.00
-150 -100 -50 0 50 100 150
Lag in days
-10
0
10
Lag
in y
ears
C orre lation
-0 .25
0.00
0.25
0.50
0.75
1.00
-150 -100 -50 0 50 100 150
Lag in days
-10
0
10
Lag
in y
ears
-0.25
0.00
0.25
0.50
0.75
1.00
C orre lation
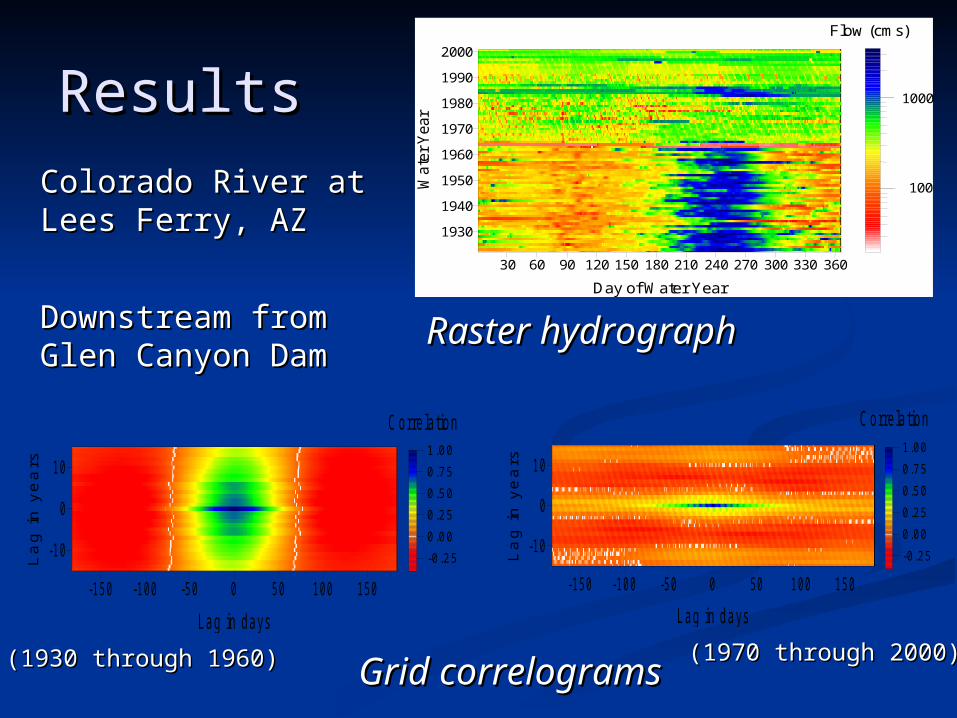
ResultsResults
Colorado River at Lees Colorado River at Lees Ferry, AZFerry, AZ
Downstream from Glen Downstream from Glen Canyon DamCanyon Dam
(1930 through 1960)(1930 through 1960) (1970 through 2000)(1970 through 2000)Grid correlogramsGrid correlograms
30 60 90 120 150 180 210 240 270 300 330 360
Day of Water Year
1930
1940
1950
1960
1970
1980
1990
2000
Wa
t er
Yea
r
100
1000
Flow (cms)
2.00
3.00
30 60 90 120 150 180 210 240 270 300 330 360
Day of Water Year
1930
1940
1950
1960
1970
1980
1990
2000
Wa
t er
Yea
r
100
1000
Flow (cms)
2.00
3.00
Raster hydrographRaster hydrograph

Patch analysis resultsPatch analysis results Weiser River at Cambridge, IDWeiser River at Cambridge, ID
Percent days per flow classPercent days per flow class Mean patch size (days)Mean patch size (days)
0%
5%
10%
15%
20%
25%
30%
35%
0.1 1 10 100 1000
Per
cent
of d
ays
per
flow
cat
egor
y
median
0
5
10
15
20
25
0.1 1 10 100 1000
Mea
n pa
tch
size
(da
ys)
median
Flow (m3/s) Flow (m
3/s)

Patch analysis resultsPatch analysis results Snake River at Heise, IDSnake River at Heise, ID
Percent days per flow classPercent days per flow class Mean patch size (days)Mean patch size (days)
Flow (m3/s)
0%
5%
10%
15%
20%
25%
30%
35%
10 100 1000 10000
0
10
20
30
40
50
60
10 100 1000 10000
Mea
n pa
tch
area
(da
ys)
median flow
Per
cent
of d
ays
per
flow
cat
egor
y
Flow (m3/s)
1911 - 1951 (Pre-dam)1960 - 2000 (Post-dam)
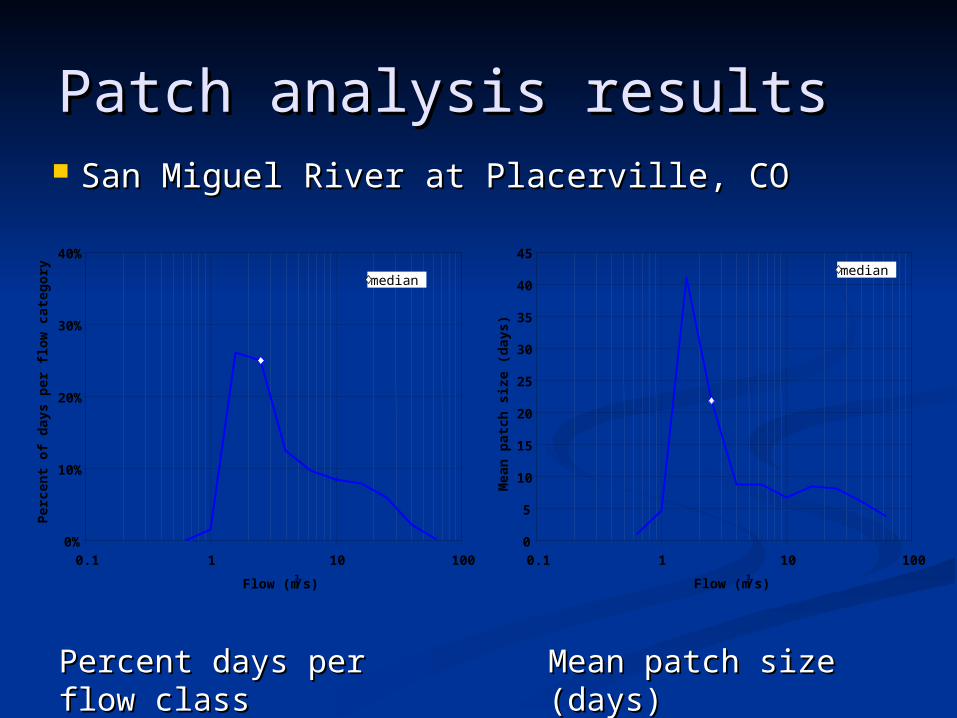
Patch analysis resultsPatch analysis results
Percent days per flow classPercent days per flow class
San Miguel River at Placerville, COSan Miguel River at Placerville, CO
Mean patch size (days)Mean patch size (days)
0%
10%
20%
30%
40%
0.1 1 10 100
Flow (m3/s)
Per
cen
t o
f d
ays
per
flo
w c
ateg
ory
0
5
10
15
20
25
30
35
40
45
0.1 1 10 100
Flow (m3/s)
Mea
n p
atch
siz
e (d
ays)
median median
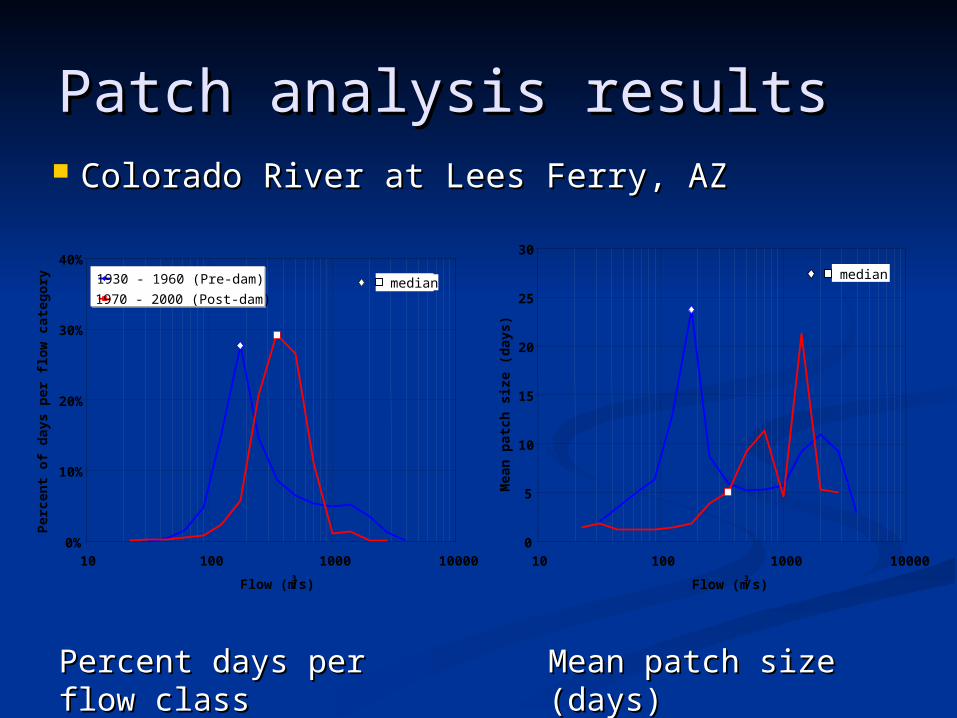
Patch analysis resultsPatch analysis results
Percent days per flow classPercent days per flow class
Colorado River at Lees Ferry, AZColorado River at Lees Ferry, AZ
Mean patch size (days)Mean patch size (days)
0%
10%
20%
30%
40%
10 100 1000 10000
Flow (m3/s)
Per
cen
t o
f d
ays
per
flo
w c
ateg
ory
0
5
10
15
20
25
30
10 100 1000 10000
Flow (m3/s)
Mea
n p
atch
siz
e (d
ays)
1930 - 1960 (Pre-dam)
1970 - 2000 (Post-dam) median
median

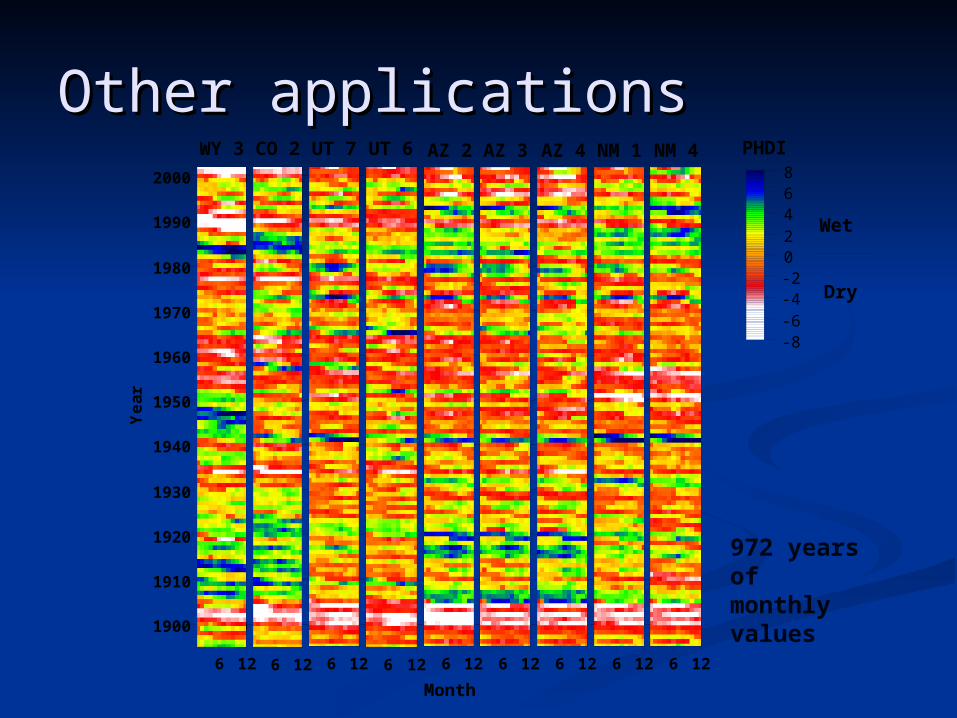
Other applicationsOther applications
WY 3
CO 2
UT 6
UT 7
NM 1
NM 4
AZ 2
AZ 3AZ 4
Temporal and spatial analysisTemporal and spatial analysis
1895
2002
Other applicationsOther applications
6 12
NM 4
1900
1910
1920
1930
1940
1950
1960
1970
1980
1990
2000
6 12
NM 1
1900
1910
1920
1930
1940
1950
1960
1970
1980
1990
2000
6 12
AZ 4
1900
1910
1920
1930
1940
1950
1960
1970
1980
1990
2000
6 12
AZ 3
1900
1910
1920
1930
1940
1950
1960
1970
1980
1990
2000
6 12
Month
AZ 2
1900
1910
1920
1930
1940
1950
1960
1970
1980
1990
2000
6 12
UT 6
1900
1910
1920
1930
1940
1950
1960
1970
1980
1990
2000
6 12
UT 7
1900
1910
1920
1930
1940
1950
1960
1970
1980
1990
2000
6 12
CO 2
1900
2000
6 12
WY 3
1900
1910
1920
1930
1940
1950
1960
1970
1980
1990
2000
Ye
ar
-8-6-4-202468
PHDI
Wet
Dry
972 years of monthly values

Other applicationsOther applications
6 12
UT 6
1900
1910
1920
1930
1940
1950
1960
1970
1980
1990
2000
6 12
UT 7
1900
1910
1920
1930
1940
1950
1960
1970
1980
1990
2000
6 12
Month of Cal Year
CO 2
1900
2000
6 12
WY 3
1900
1910
1920
1930
1940
1950
1960
1970
1980
1990
2000
100 200 300
Day of Cal Year
Colorado River at Lees Ferry, AZ
100,000
10,000
1,000
Flow (cfs)
-8-7-6-5-4-3-2-1012345678
PDSI

SummarySummary Traditional methods limited Traditional methods limited Raster-based approachRaster-based approach
Greater visualizationGreater visualization Raster hydrographRaster hydrograph
New tools to analyze streamflowNew tools to analyze streamflow Grid correlogramGrid correlogram Patch analysisPatch analysis
Numerous applications / research directionsNumerous applications / research directions New approach to identify temporal variabilityNew approach to identify temporal variability Enhance and replicate streamflow conditionsEnhance and replicate streamflow conditions

QuestionsQuestions??