using administrative data cohort of women infected with ... · chart diagnosis for presence or...
TRANSCRIPT

Using Administrative Data to Assemble a Cohort of Women Infected with Hepatitis C
Latifa Tse Fung Yeung, MD, FRCPC
A thesis submitted in conformity with the requirements for the Degree of Masters of Science (Clinical Epidemiology), Graduate Department of
Health Policy, Management & Evaluation, University of Toronto
O Copyright Latifa T.F. Yeung 200 1

National Library Bibliothèque nationale du Canada
Acquisitions and Acquisitions et Bibliographie Services services bibliographiques 395 Weflington Street 395, rue Wellington OnawaON KlAON4 OaawaON K l A W Canada canada
The author has granted a non- exclusive licence aliowing the National Library of Canada to reproduce, loan, distribute or seil copies of this thesis in microfom, paper or electronic foxmats.
The author retains ownership of the copyright in this thesis. Neither the thesis nor substantial extracts fkom it may be printed or otherwise reproduced without the author's permission.
L'auteur a accordé une Licence non exclusive permettant a la Bibliothèque nationale du Canada de reproduire, prêter, distribuer ou vendre des copies de cette thèse sous la forme de microfiche/film, de reproduction sur papier ou sur format électronique.
L'auteur conserve la propriété du droit d'auteur qui protège cette thèse. Ni la thèse ni des extraits substantiels de celle-ci ne doivent être imprimés ou autrement reproduits sans son autorisation.

ABSTRACT
Title: Using Administrative Data to Assemble a Cohort of Women hfected with Hepatitis C
Degree: Masters of Science (Clinical Epidemiology)
Year of Convocation: 2001
Name: Latifa Tse Fung Yeung
Graduate Department: Health Policy, Management & Evaluation
University: University of Toronto
Objectives:
1. To identify the optimal OHIP code for identifying women infected with HCV using ROC
plot, Kappa statistic, and logistic regression.
2. To test combinations requiring more than one submission of a diagnostic code.
3. To test the combination of different codes using serial and parallel methods.
Study Design: Cross-sectional comparative.
Study Subjects: 2372 women
Primary Outcome Measure: ROC plot
Methods: OHIP code combinations (experimental tests) were 1 in ked to an abstracted c h i c
chart diagnosis for presence or absence of hepatitis C (reference standard). The ability of codes
to identify infected women was evaluated using ROC plot, Kappa, and logistic regression.
Results: "Viral hepatitis" was the optimal code on ROC plot and predicted HCV infection in
logistic regression. "Drug dependence/addictionW had the highest Kappa. Multiple code
submissions and parallel codes improved specificity but lost sensitivity. Serial codes increased
specificity but lost sensitivity.
Conclusions: "Viral hepatitis" best identified women infected with HCV.

ACKNOWLEDGMENTS
1 would like to thank the Canadian Institutes of Health Research/Health Canada Hepatitis C Fellowship Prograrn and the Hospital for Sick Children Trainee Startup Program for helping to fund this research study. I would also like to thank the Institute of Clinical Evaluative Sciences and the Paediatric Gastroentology and Nutrition Research Fellowship Prograrn, University of Toronto for providing the necessary support to conduct this research.
1 would like to thank the doctors who generously shared their clinic charts with me for this project. I am also grateful to Dr. Jack Williams who chdlenged me to ernbrace the obstacles of database research.
1 am greatly indebied to my thesis supervisor, Dr. Teresa To, who provided instrumental advice and support.
1 am especially grateful to my research supervisor and mentor, Dr. Eve Roberts. She began training me as a junior resident and offered guidance and feedback through many years. She is both an admirable role mode1 and friend.
Deepest thanks also to Drs. Paul Dick, Jan Hux, and Elizabeth Lin whose course teachings in Health Care Research and Design introduced me to the world of administrative data. Furthermore, Dr. Paul Dick provided regular injections of enthusiasm and perspective to facilitate the pursuit and completion of this project. Many thanks to Dr. Susan King who continued to offer support and feedback while working at the Centre for Diseases Control.
Finally, and most importantly, 1 thank my parents, my in-laws, and my husband, for their loving support. My husband's patience and sense of humour continue to be instrumental for me to grow as a person, as well as a researcher and physician.
1 dedicate this work to my husband, Dr. Patrick Cham Fai Cheung.

Table of Contents
Chapter 1:
1.1 CLINICAL BACKGROUND ............................................................... 1 1.1.1 Tenninology of HCV Infection .................................................... 1 1.1.2 Hepatitis C: Burden of Disease ..................................................... 1
...................... 1.1.2.1 Incidence of Acute Hepatitis C in Canada 2 .................. 1.1.2.2 Prevalence of Chronic Hepatitis C in Canada 2
.................................... 1.1.2.3 Other Measures of Prevalence 3 ......................................... 1.1.2.4 Future Burden of Disease -4
1.1.3 Mother-to-Infant Transmission of HCV .......................................... - 4 1.1.4 Fertility Rate of Women Infected with HCV ..................................... 6
1 -2 ADMINISTRATIVE DATABASES ....................................................... S 1.2.1 Canadian Institute for Health Information ........................................ 8 1.2.2 Ontario Heath Insurance Pro gram ................................................. 9 1.2.3 Registered Persons Data Base ...................................................... -9 1.2.4 Notifiable Diseases Database ....................................................... 10
1.3 USING ADMINISTRATIVE DATA TO STUDY DISEASE INCIDENCE AND PREVALENCE ............................................................................... 11
1.4 USING ADMINISTRATIVE DATA TO STUDY HEPATITIS C .................... 12
Chapter 2: STUDY HYPOTHESIS AND OBJECTIVESeem. eeaw.m 14
2.1 STUDY RATIONALE ....................................................................... 14 2.1.1 Sarnple Size Considerations ........................................................ 15
..................................................................... 2.2 STUDY HYPOTHESIS -16
2.3 STUDY OBJECTIVES ....................................................................... 17
3.1 OVERVIEW OF STUDY METHODS .................................................... 18
3.2 STUDY DESIGN .............................................................................. 20
3.3 STUDYSUBJECTS ........................................................................... 20
3.4 REFERENCE STANDARD .................................................................. 20 3.4.1 Definition and Rationale ............................................................. 20

3.4.2 Choice of Physicians' Clinics ...................................................... - 2 1 3.4.3 Inclusion of Cnteria for Reference Standard ..................................... 22
..................................................................... 3.4.4 Chart Abstraction 22 ...................................................... 3.4.5 Description of Study Subjects 23
..................................................................... 3.5 EXPERIMENTAL TEST 23 ................................................................ 3.5.1 OHIP Code Selection 23
.................................................. 3.5.1.1 Diagnostic Codes -24 .................................................... 3.5.1.2 Procedure Codes 25
........................................................ 3.5.2 Panel of Experimentai Tests 26 ................................. 3.5.3 Identifying Al1 Patients with OHIP Test Codes -27
......... 3.5.4 Incorporating Experimental Test Codes into the Sarnple Population 28
3.6 ANALYSIS: DETERMINING THE OlTIMAL EXPERIMENTAL TEST ......... 29 3.6.1 OverviewofAnalysis ............................................................... 29
........................................................... 3.6.2 Baic Test Characteristics 30 ................................... 3.6.3 Receiver Operating Characteristic (ROC) Plot 32
......................................... 3.6.4 Test Reliability: Cohen's Kappa Statistic 32 3.6.5 Logistic Regression .................................................................. 32
...................................... 3.6.6 Multiple Submissions of a Diagnostic Code 33 .................................................. 3.6.7 Senal and Paraltel Test Strategies 34
........................................................................ 3.7 FEASIBILITY STUDY 34
........................................................... 3.8 SAMPLE SIZE CALCULATION 37
3.9 RESEARCHETHICS .......................................................................... 39
Chapter 4: R E S U L T S m . . a m a a a a a a a a m a a a . m . .mmmmaaa. rmaa .omaaaamoaoa o . o a m a m m m o a 4 0
............ REFERENCE STANDARD: DESCRIPTION OF STUDY SUBJECTS -40 .............................. 4.1.1 Proportion of Clinic Charts Assessed for Inclusion 40
............................................................ 4.1.2 Prevalence of Hepatitis C 41 ...................................................................... 4.1.3 Age Distribution -41
................................................................................... 4.1.4 Death -41 ................................................................ 4.1.5 Multiple Cornparisons 42
EXPERIMENTAL TEST: NUMBER OF OHIP CODE COMBINATIONS ..................................................................................... ( 1995.2ooO) 43
......... ANALYSIS: DETERMINING THE OPTIMAL EXPERIMENTAL TEST 44 ................................................................... 4.3.1 Overview of Results 44
......................................... 4.3.2 Single Codes (Binary Predictor Variable) 46 ........................ 4.3.2.1 Basic Test Characteristics and ROC Plot 46
4.3.2.1.1 Impact of Adding Procedure Code Liver Biopsy ..... 47 ....................... 4.3.2.2 Test Reliability: Cohen's Kappa Statistic 48

Chapter 5:
Logistic Regression .................................................................. -49 ......................... 4.3.3.1 Univariate Regression of Single Codes 49
4.3.3.1.1 B i n q Predictor Variable ................................ 49 4.3.3.1.2 Discrete Predictor Variable ............................... 49 4.3.3.1.3 Impact of Adding Procedure Code Liver Biopsy ..... 49
........................... 4.3.3.2 Multiple Regression of Binary Codes -51 4.3.3.2.1 Impact of Adding Procedure Code Liver Biopsy ..... 52
Multiple Submissions of a Diagnostic Code (Binary Predictor Variable) .... 53 4.3.4.1 Basic Test Characteristics and ROC Plot ........................ 53
4.3.4.1.1 Impact of Adding Procedure Code Liver Biopsy ..... 53 ....................... 4.3.4.2 Test Reliability: Cohen's Kappa Statistic 55
....................... Serial and ParaIIel Methods (Binary Predictor Variable) 56
........................ 4.3.5.1 Basic Test Charactenstics and ROC Plot 56 ....................... 4.3.5.2 Test Reliability: Cohen's Kappa Statistic 57
DISCUSSION ............................................... 58
.................................................................. 5.1 SUMMARY OF RESULTS 58
............................................................... 5.2 RELEVANCE OF FINDINGS 59
........................................................ 5.3 STRENGTHS OF STUDY DESIGN 60
...................................................... 5.4 LIMITATIONS OF STUDY DESIGN 61 .......................................................................... 5.4.1 Sampling Bias 61 .......................................................................... 5.4.2 Spectrum Bias 61
............................................................. 5.4.3 Selection of OHIP Codes 62
...................................................................... 5.5 FUTURE DIRECTIONS 62

List of Tables
1 . 1 . Canadian Fertility Rate by Age Group and Year .......................................... 7
Clinics chosen for Chart Abstraction ....................................................... 22 Candidate Codes for Identifying Patients with Hepatitis C .............................. 24 Definitions of Experimentai Test Codes .................................................... 26 Measures of Test Performance and Test Reliability ...................................... 31 Number of Test Code Combinations - Fiscal 1996 ...................................... -36 Sample Size Determination - Variables .................................................... 37 Sample Size Determination - 25% Prevalence ........................................... -38 Sample Size Determination - 60% Prevalence ........................................... 39
................................................................. Results of Chart Abstraction 41 Number of Test Code Combinations - 1995.20 ....................................... - 43 Optimal OHIP Code Combinations Determined by ROC plot. Kappa statistic. and
Logistic Regression ................................. .. ............................... 44 Test Characteristics (%) for Sites Toronto . 3", London . 3". Toronto . 2" ........... 46 Kappa statistics for Sites Toronto . 3". London . 3". Toronto . 2 O ................... 48 Goodness of Fit for Models with Single Codes as Binary and Discrete Variables ... 49 Comparing Models E2 and D2 with and without Liver Biopsy ......................... 50 Goodness of Fit for Models with Multiple Codes ......................................... 51 Test Characteristics (%) - Code Submitted >1 ............................................ 53 Kappa statistics - Code Submitted >1 ...................................................... 55 Test Characteristics (%) for Codes Combined by Serial and Parallel Methods ....... 56
List of Figures
................................................................................. 3- 1 . Overall S trategy 65 ......... 3.2 . Number of Female Case of HCV Reported in Ontario by Year of Reporting 66
4- 1 .(a) Female Cases of HCV in Ontario by Age Group Reported to Notifiable Diseases ... 67 ...... 4-1 . (b) Number of Women with Hepatitis C in Sample Population by Decade of Birth 68
....................................................... 4.2 . Sensitivity and Specificity of Codes -69 4.3 . Sensitivity and Specificity of Codes (96) - Code Submitted > 1 ........................ -70 4.4 . Sensitivity and Specificity of Codes Combined by Serial and Parallel Methods ..... 71
List of Appendices
......................................................... Appendix 1 Glossary and Abbreviations 72 ...... Appendix 2 Addiction Research Foundation Methadone C h i c (Site Toronto - 1 O) 74
Appendix 3 Ethics Approval Letters ............................................................. 75 ............................................. Appendix 4 Feasibility Study: SAS Programming -80
.................................. Appendix 5 Testing of Code Accuracy: SAS Programrning 89
vii

References.. . . . . . . . . . . . . . . . . . . . . . . . . . . . . . . . . . . . . . . . . . . . . . . . . . . . . . . . . . . . . . . . . . . . . . . . . . . . . . . . 1 û4
Chapter 1: Introduction
The objective of this chapter is to provide the background and rationale for esrimaring the
fertility rate of women infected with hepatitis C virus (HCV) and its irnpact on mother-to-infant
transmission of HCV. The chapter also introduces uses of administrative databases for this
project and discusses the challenges of using aàministmtive data to study the diseuse incidence
and prevalence for hepatitis C.
1. Clinical Backaround
1.1.1 Terminology of HCV Infection
"Hepatitis C" indicates inflammation of the liver as a result of infection with hepatitis C
virus (HCV). Hepatitis C may be classified as acute or chronic. By convention, "acute
hepatitis" refers to recent infection of less than six months duration whereas "chronic hepatitis"
refers to prolonged infection of greater than six months duration (1). As most cases of hepatitis
C are initidly asymptomatic, cases of acute hepatitis C often escape detection. In practice, the
majority of identified cases of hepatitis C are considered chronic (2). For purposes of this study,
no attempt will be made to distinguish between acute and chronic hepatitis C. Rather, "hepatitis
C" will be used to represent past or current infection with HCV.
1.1.2 Hepatitis C: Burden of Disease
Hepatitis C virus was discovered in 1989 (3). Subsequently it was established that
approximately 90% of "non-A non-B (NANB) post-transfusional hepatitis" were caused by
HCV. The disease spectrum of hepatitis C has been derived from the experience of patients
identified with HCV infection over the last decade and past understanding of NANB hepatitis (4-
6).
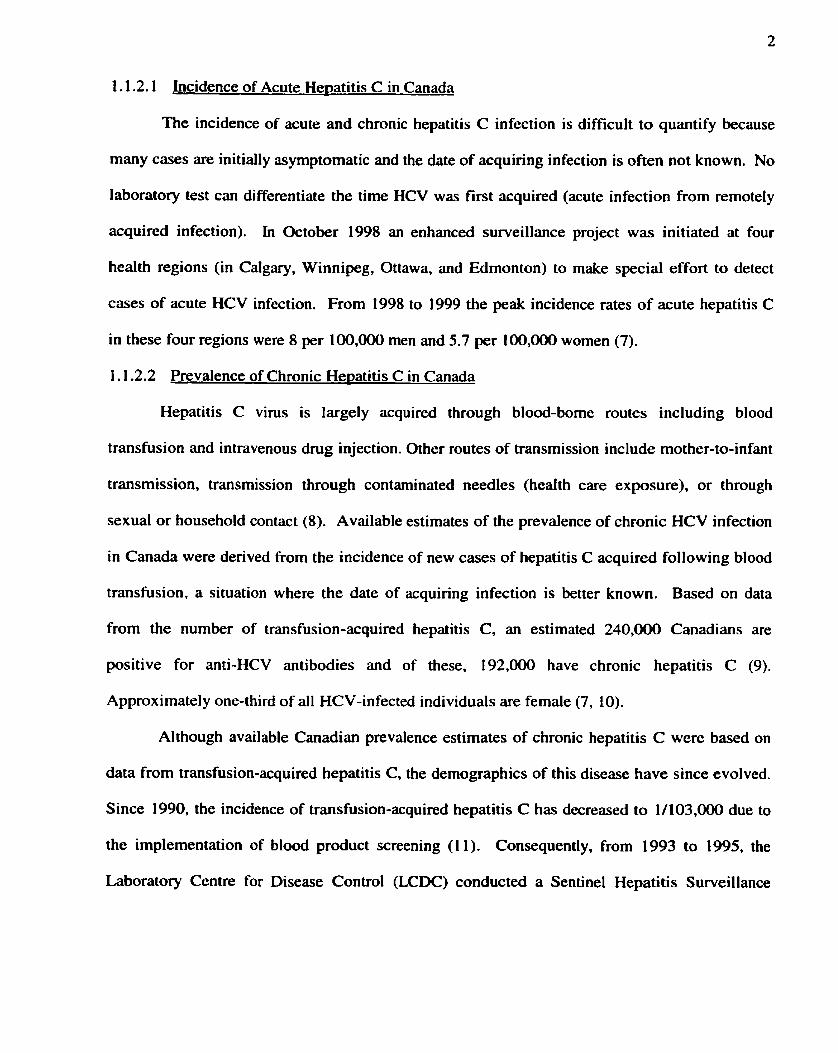
1.1 .S. 1 Incidence of Acute Hepatitis C in Canada
The incidence of acute and chronic hepatitis C infection is diffïcult to quantify because
many cases are initially asymptomatic and the date of acquiring infection is often not known. No
laboratory test can differentiate the time HCV was first acquired (acute infection from remotely
acquired infection). In October 1998 an enhanced surveillance project was initiated at four
health regions (in Calgary, Winnipeg, Ottawa, and Edmonton) to make special effort to detect
cases of acute HCV infection. From 1998 to 1999 the peak incidence rates of acute hepatitis C
in these four regions were 8 per 100,000 men and 5.7 per 100,000 women (7).
1.1.2.2 Prevalence of Chronic Hepatitis C in Canada
Hepatitis C virus is largely acquired through blood-borne routes including blood
transfusion and intravenous dmg injection. Other routes of transmission include mother-to-infant
transmission, transmission through contarninated needles (health care exposure), or through
sexual or household contact (8). Available estimates of the prevalence of chronic HCV infection
in Canada were derived from the incidence of new cases of hepatitis C acquired following blood
transfusion, a situation where the date of acquiring infection is better known. Based on data
from the number of transfusion-acquired hepatitis C, an estimated 240,000 Canadians are
positive for anti-HCV antibodies and of these, 192,000 have chronic hepatitis C (9).
Approximately one-third of al1 HCV-infected individuals are female (7, 10).
Although available Canadian prevalence estimates of chronic hepatitis C were based on
data from transfusion-acquired hepatitis C, the dernographics of this disease have since evolved.
Since 1990, the incidence of transfusion-acquired hepatitis C has decreased to 1 /103 ,0 due to
the implementation of blood product screening (1 1). Consequently, from 1993 to 1995, the
Laboratory Centre for Disease Control (LCDC) conducted a Sentine1 Hepatitis Surveillance

Study. This study took place at eight health units across Canada and found that injection drug
use is now the major risk factor for acquiring HCV infection (12-14). However, given the slowly
progressive nature of HCV infection, new infections are unlikely to have an imrnediate impact
on the disease burden. As a result, the fact that injection dmg use has replaced blood transfusion
as the main route of acquiring acute hepatitis C is unlikely to impact on the estimated prevalence
of chronic hepatitis C in the near future (7).
1.1.2.3 Other Measures of Prevalence
Other attempts to measure the prevalence of hepatitis C (usually defined as positive for
anti-HCV antibody) tend to involve selected patient groups or volunteer blood donors. The
World Health Organization estimates that the prevalence of hepatitis C ranges frorn 0.003% (in
Sweden) to 18.14 (in Egypt) (1 5). Among US hospitalized veterans, 1 1 3% - 35% proved
positive for anti-HCV antibody and a history of intravenous dmg use was a major risk factor (16,
17). By contrat, a 1990 survey of a single Canadian hospital found that 0.5% (95% confidence
interval 0.1 % - 0.9%) of al1 weekday admissions were positive for anti-HCV antibody ( 1 8). A
French population-based survey of volunteer blood donors found that 1.15% of 6 1,283 donors
were anti-HCV antibody positive (19). Comprehensive population-based determination of the
prevalence of hepatitis C has been limited to a single population-based U.S. study using semm
samples from the third National Health and Nutrition Examination Survey which studied 2 1,241
individuals six years old and older. This large-scale study found that the overall prevalence of
anti-HCV antibody was 1.8%- corresponding to an estimated 3.9 million Americans with HCV
infection. Seventy-four percent were positive for HCV RNA, indicating that an estimated 2.7
million Americans were chronically infected. Arnong subjects 17 to 59 years of age, the
strongest factors independently associated with HCV infection were illegal dmg use and high-
risk sexud behavior (2).
1.1.2.4 Future Burden of Disease
The significant burden of disease attributable to chronic infection with HCV has becorne
increasingly apparent. Within the next decade, the prevalence of cases of cirrhosis due to
hepatitis C is expected to increase by 92% and the prevalence of cases of end-stage liver disease
and hepatocel1ular carcinoma related to hepatitis C is predicted to increase by 126% and 102%
respectively. The prevalence of liver-related deaths associated with hepatitis C is predicted to
increase by 126% (7). In North America, hepatitis C is already the leading indication for liver
transplantation. The World Health Organization estimates that 170 million people have HCV
infection worldwide (20). These results indicate the importance of controlling disease
progression in those infected with hepatitis C as well as the need for primary prevention of HCV
infection. The five-year Health Canada / CMR Research Initiative on Hepatitis C initiative
reflects recent government efforts to respond to this important burden of disease (2 1).
The burden of disease of hepatitis C in women and children is just beginning to be
elucidated. Children tend to acquire hepatitis C from contaminated blood products or mother-to-
infant transmission. Since the implementation of blood product screening for HCV in 1990, the
proportion of prevalent children infected with HCV through blood transfusion has diminished
(1 1 22). Mother-to-infant transmission of HCV is now the increasingly important route of
transmission for children.
1.1.3 Mother-to-Infant Transmission of HCV
Determining the rate of mother-to-infant transmission is important for counseling
pregnant women infected with HCV and for predicting the burden of disease in pediatric
populations. Small sample sizes, variations in the definition of mother-to-infant transmission,
and heterogeneity in the reporting of risk factors hinder precise determination of this rate. Taken

altogether, available studies of mother-to-infant transmission provide a weighted rate of mother-
to-infant transmission in the range of 1.0% to 5.0%. Arnong viremic (HCV RNA-positive)
women, this rate increases to 3.1 % to 6.9%. The rate appears higher in Japanese studies of
viremic women. Matemal risk factors for increased mother-to-infant transmission include
maternal virernia, CO-infection with human immunodeficiency virus (HIV), and history of
intravenous dmg use ( W U ) . By contrast, mode of delivery and breastfeeding do not appear to
result in significantly different rates of mother-to-infant transmission. For details regarding the
weighted rates of mother-to-infant transmission of HCV, please see reference #22. More precise
measurements of the rate of mother-to-infant HCV transmission will require larger studies and
better tests for HCV. No Canadian data exist regarding mother-to-infant transmission of HCV.
Although the rate of matemal-infant transmission is nurnerically small, its impact is
substantial. Of the estimated 170 million people worldwide who are chronically infected with
HCV, if 35% of these are femaies of child-bearing age, and assuming an anncal fertility rate of
2%, conservative estimates suggest that 10,000-60,000 newborn babies will be infected with
HCV each year (23). Indeed, mother-to-infant transmission of hepatitis C virus will be an
important determinant of the burden of HCV disease in future generations.
The utility of antenatal screening of pregnant women for HCV infection is currently a
subject of debate. Advocates for screening suggest that asymptomatic women who are identified
with a chronic disease are likely to benefit from therapy with interferon and ribavirin (when they
are not pregnant) and that such diagnosis occurs during a time when they are most receptive to
medical intervention. Those identified with HCV infection may be counseled to avoid alcohol
intake, offered hepatitis A and B vaccination, and reminded of body substance precaution
practices. On the other hand, others are uncertain whether the benefits of screening to reduce
mortaiity outweigh the psychologicd h m caused by the screening procedure. They further
argue that the relatively low rate of transmission and lack of treatment options for hepatitis C
during pregnancy limit the benefit achieved by screening pregnant women (24-26).
In contrast to materna1 screening, the screening of ail infants bom to women infected
with HCV is recommended (27). Infants with HCV infection deserve ongoing monitoring and
management. Although most cases of pediatric hepatitis C are slowly progressive (22), only
careful monitoring can identify children with more severe disease who would benefit from early
treatment. If children with fibrosis do not receive treatment, progressive cirrhosis would leave
eventual liver transplantation as the on1 y remaining option (28). Furthemore, treatment options
for pediatric hepatitis C are expected to improve in the near future. Replacement of standard
interferon-alfa with pegylated-interferon-alfa has increased the sustained treatment response rate
from 20% to 45% (29, 30). The addition of ribavirin to standard interferon-aifa offers a
treatment response rate of almost 50% (31). Thus it is anticipated that trial of pegylated-
interferon-alfa combined with ribavirin will yield even more promising results in adults with
hepatitis C. Pediatric trials will follow. Compared with adults, children appear to respond better
to treatment due to their shorter duration of infection (32-34).
1.1.4 Fertility Rate of Women lnfected with HCV
The arguments conceming mother-to-infant transmission assume that women infected
with HCV have a fertility rate comparable to that of the general population. In Canada, the age-
specific-fertility rate (defined as the annual number of live births per lûûû women aged 15-49
years) ranged from 0.2 to 103.88 per 1 ûûû women in 1997 (Table 1 - 1 ) (35). The fertility rate of
women infected with HCV has never k e n established.
Determination of the fertility rate of women infected with HCV has two important
consequences. Firstly, the assumption that the fertility rate of women infected with HCV

matches that of the general population may be tested. If the fertility rate of women with hepatitis
C is greater than that of the general population, then the estimated burden of disease resulting
from matemal-infant transmission of HCV will be even larger than previously thought. On the
other hand, if the fertility rate of women with hepatitis C is less than that of the general
population, then the estimated burden of disease resulting from mother-to-infant transmission of
HCV may actually be reduced. Secondly, measurement of fertility rate is instrumental during the
provision of obstetncal counseling to women with hepatitis C.
Table 1-1. Canadian Fertility Rate by Age Group and Year
The fertility rate of women infected with HCV has never k e n measured. While some
speculate that the fertility rate of women infected with HCV is lower than the population fertility
rate, others argue the converse. The use of intravenous drugs or cocaine (intravenous or use of
"crack cocaine) is a significant risk factor for acquiring HCV infection (2, 36). Women who
use cocaine have an increased rate of spontaneous abortion (37-39). Extrapolation of these
relationships suggests that women with hepatitis C are more likely to have spontaneous
abortions. As a result, the fertility rate of women with infected with HCV may be lower than the
population fertility rate. On the other hand, some women with infected with HCV may take part
in high-risk sexual practices (higher sexual promiscuity without contraception) resulting in an
increased pregnancy - and hence, fertility - rate.

Once pregnant. the obstetrical course of women with hepatitis C resembles that of the
general population. Women with other foms of liver disease, such as non-cirrhotic portal
hypertension, have fertility rates and pregnancy outcomes comparable to controls (40, 41).
Furthemore, the child-bearing years of most women usually precede the time frame for
progression to advanced liver disease from hepatitis C. It is only during the later, advanced
stages of liver disease that amenorrhea and anovulation tend to occur and compromise fertility
(42) - The direct impact of hepatitis C on pregnancy has also been exarnined. In an Irish cohort
of rhesus-negative women who becarne infected with HCV from contarninated anti-D
immunoglobuiin, 36 women were studied for pregnancy outcomes. When compared with
controls, women infected with HCV showed neither increase in spontaneous miscarriage rate nor
significant differences in obstetnc complications or birth weights (43). Other studies have also
failed to identify increased complications of pregnancy as a result of matemal HCV infection
(44, 43, although a higher incidence of cholestasis of pregnancy has been reported arnong
women positive for anti-HCV antibodies compared with those who were negative for anti-HCV
antibody (46). From the perspective of liver disease, small case-control studies suggest that
semm ALT decreases, HCV RNA titres increase, and liver histology worsens as a result of
pregnancy in women infected with hepatitis C (47, 48). Taken together. no study of pregnant
women with hepatitis C reports significant complications in pregnancy.
1.2.1 Canadian lnstitute for HeaRh Information
in Ontario, Canada, ail discharges from acute care facilities are recorded in the Canadian
Institute for Health Information (CIHI) database. This population-based, non-profit, non-
govemment, federally-chartered Company was established to collect information on health for

purposes of health-care planning, resource allocation, utilization management, and health
services research. The accuracy of CMI data compared to the hospital record has been assessed.
While demographic and procedure information were highly accurate, coding of in hospital
comorbidities and complications had high false negative rates (63% - 70%) (49).
1.2.2 Ontario Heaith Insurance Program
The Ontario Health hsurance Program (OHIP) database contains administrative
information generated from physician billings. It is estimated that 95% of al1 physicians in
Canada are reimbursed in a fee-for-service manner. This database does not capture health care
provided by physicians on salary, physicians on Alternate Funding Plans, and services paid for
by patients, Workers' compensation, or other third party payers. Records with unique health
care numbers are available from 1991 onwards. The accuracy of OHIP data is maintained with
regular audits. The demographic data (patient age, sex, and place of residence) on physician's
claims are 99% complete (50-53).
The accuracy of OHIP data is considered poorer than hospitd discharge data with respect
to procedure codes and even worse with regards to diagnosis codes because completion of this
field is optional. In 1989, the accuracy of diagnostic codes compared to hospital chart data
ranged from 37%-8 1 % in a study by the Ontario Hospital Association of 3000 records from 43
hospitals. Procedure codes accuracy was 88%-95% in the same study. By cornparison, a 1992
study abstracted 300 records at Doctors Hospital and found 95%-96% accuracy for diagnosis
codes and 96% for procedure codes. However, studies comparing OHIP diagnosis data with
patient charts have al1 been hospital-based (54-56). No studies have specifically assessed the
accuracy of OHIP diagnostic codes when compared to charts in physicians' office.
1.2.3 Registereâ Persons Data Base
The Registered Persons Data Base (RPDB) contains data on al1 individuals registered

within the OHIP plan. OHIP coverage is available to individuals who are Canadian citizens,
landed immigrants, or refugees who make Ontario their permanent and principal home and are
present in Ontario for at least 153 days in any 12-month period. Tourists, transients, or visitors
are not e1igibIe for OHIP coverage. No premium is required for Ontario health coverage; federal
and provincial taxes fund health care. Each individual has a unique heaith care number (HCN).
Using patient HCN as the unique identifier, patient gender, date of birth, and death date
(if applicable) are recorded. This database dates back to April 1, 1990. Prior to that date,
Ontario assigned an OHIP number that was shared by al1 members of a family.
1.2.4 NotHiable Diseases Database
The Notifiable Diseases Database is maintained by the Population and Public Health
Branch of Health Canada. It contains surveillance data on notifiable disease in Canada,
including hepatitis C since 1991. Each disease under national surveiIlance has a case definition.
A confirmed case of hepatitis C requires iaboratory confirmation of infection with (1) HCV RNA
PCR positive regardless of results of anti-HCV antibody testing if > l year of age, (2) anti-HCV
antibody positive, or (3) HCV RNA positive if anti-HCV antibody negative. The provinces and
territories have mandated reporting of notifiable diseases. When a provincial or commercial
laboratory finds a positive anti-HCV antibody result, it notifies the local health authority.
Subsequently the local health authonty notifies the provincial health authority. If the provincial
health authority determines that a positive anti-HCV antibody result meets the case definition of
a confirmed case, aggregated data is then provided to the national database. This database does
not capture individuais infected with HCV who have never been tested (Le. unaware of infection)
and Canadians who tested positive for anti-HCV antibody outside of Canada. The main
limitation of this database is the failure to determine the date of acquiring infection, since the
first positive test result may oçcur years following the time of initial infection.

1.3 Usina Administrative Data To Studv Disease Incidence and Prevalence
Large computerized databases have become an integrai feature of health care delivery
and administration. Nthough primarily intended for administrative purposes, these databases are
proving increasingly usefùl to researchers for several reasons. Firstly, administrative data offer a
breadth of information regarding events that involve the utilization of health care, including
medical office visits, surgical procedures, and hospitalizations. Using predefined codes,
hospital-based procedures such as liver biopsy and childbinh are readily identified. Secondly,
unlike research using primary data collection, administrative data does not rely upon individual
subjects to consciously participate in the research process. As a result, research using
administrative data pemits the inclusion of a large and diverse population and these data tend to
be highly generalizable. Thirdly, linkage of administrative data systems allows ongoing accrual
over long periods without the need to contact individuals, thereby yielding continuous
longitudinal follow-up with a relatively low drop-out rate. Such population-based research often
enables the capture of rare events. Founhly, research using administrative data does not involve
patients directly and is therefore less prone to the Hawthorne effect (subjects may systematically
alter their behavior when they know that they are being obsewed). Fifth, administrative data is
readily available, comprehensive, and rapidly accessible. As data have already ken collected,
analysis may occur with little delay. Finally, compared with the cost of conducting clinical
trials, research using administrative data is inexpensive to analyze. (57-60).
For some purposes of research, the accuracy of coding for inpatient administrative data is
deemed reasonable (61). Although cornparison of hospital records and Canadian Institute for
Health Information (CIHI) data highlighted a tendency for under-coding of CO-morbidities and
in-hospital complications (49), such inaccuracy still compared favorabl y to chart review (62). In

the United States, diagnostic codes in hospital charts have been studied for their accuracy in
predicting complications of diabetes and found to have modest sensitivity (73% - 95%) and
positive predictive value (80% - 8846) compared with chart data (57).
1.4 Usina Administrative Data To Studv He~atitis C
Although administrative data offers multiple advantages, research in HCV disease using
administrative data has several limitations. in Canada, ambulazory diagnostic codes are
considered to be inaccurate and unreliable when compared to inpatient hospital charis (54). Such
standards are extrapolated from abstraction of inpatient hospital charts; ambulatory clinic charts
have never been evaluated for accuracy in diagnostic coding. Secondly, no specific diagnostic
code exists for hepatitis C. in the Ontario Health Insurance Program (OHIP) administrative
database, hepatitis A, B, and C share the ICD-9 diagnostic code "070 viral hepatitis". Thirdly,
although the quality of inpatient ( C M discharge data) is considered more reliable than
ambulatory data, it will only capture a limited spectmrn of patients with hepatitis C; HCV
infection seldom requires hospitalization untit end-stage liver disease occurs. Fourthly,
laboratory testing for HCV infection (for example, semm antibody to hepatitis C v i n s , anti-HCV
antibody) cannot be linked to OHIP administrative data because testing is not uniformly billed to
OHIP. Tests performed within hospitals do not generate OHIP billings. While commercial
laboratories submit OHIP billings, their billing codes are not specific for hepatitis C. Finally,
results of laboratory testing are not accessible due to rules of patient confidentiality. The Health
Canada Notifiable Diseases database receives reports of new cases of HCV through mandatory
reporting at the level of the provincial laboratory. Data collection is only in the form of
aggregated data, and confidentiaiity laws prevent follow-up of individual patients.
Fischer et al. used administrative data to diagnose hepatitis C. This U.S. study developed

a risk algorithm for diagnosing HCV infection based on lifestyle factors and specific medical
diagnoses. Serological evidence of HCV infection obtained during an exercise of anonymous
HCV screening was compared against patient lifestyle factors and medical diagnoses data from
the intemal database of a Heaith Maintenance Organization. The strong correlation between risk
factors and the diagnosis of HCV infection suggested that a database risk algorithm for screening
for hepatitis C was a useful approach. However, this study was possible because the intemal
database possessed a unique diagnostic code for hepatitis A, B, and C, whereas Canadian
administrative databases cannot differentiate between diagnoses of hepatitis A, B, and C (63).
In order to use administrative data to study hepatitis C, particularly in mother-to-infant
transmission, a valid cohort of HCV-infected individuals rnust be created. If such a cohort can
be assembled successfully from OHIP billing data, then it may be linked to the CIHI database.
By calculating the number of live births from this cohort, the fertility rate of women with
hepatitis C can be measured.
Chapter 2: Study Hypothesis and Objectives
The objective of this chapter is t o explain the rationale for the study, to state the study
hypothesis, and to lis? the objectives of the study.
2.1 Studv Rationale
Maternal-infant transmission of HCV will soon become the major route of transmission
of HCV for children with chronic hepatitis C. The incidence of perinatal HCV transmission
must be estimated to enable appropriate counseling of child-bearing women who are infected
with HCV and to predict the burden of illness of HCV on future generations. Current estimates
of maternal-infant transmission of HCV assume that women infected with HCV have a fertility
rate comparable to that of the general population. This assumption has never been proven.
Rather, women infected with HCV may have a fertility rate different from the general
population. Lf women infected with HCV have a fertility rate that is higher than that of the
general population, then the estimated number of children infected by maternal-infant HCV
transmission may be greater than previously thought. On the other hand, if women infected with
HCV have a fertility rate that is lower than that of the general population, then the estimates of
matemal-infant HCV transmission may be less than previously thought and the anticipated
burden of illness of HCV on future generations rnay be reduced. This burden of illness from
HCV must be properly characterized in order for strategic allocation of health care resources for
people infected with HCV.
Measurement of the fertility rate of women infected with HCV would require that a large
number of infected women be identified, enrolled, and followed prospectively through their
child-bearing years. Such a study design is subject to sarnpling bias because wornen would
likely be sampled from teniary care facilities, where recruitment would be relatively efficient

given the higher prevaience of disease. The long follow-up duration required would be
prohibitively expensive and a significant number of subjects may be lost to follow-up (64).
In view of the sampling bias, high cost, and prolonged duration required by a prospective
study, a population-based method for detemining the fertility rate of women infected with HCV
deserves consideration. If a cohort of women infected with HCV can be assernbled, then the
number of live births can be determined using administrative data from hospital discharges.
Using this strategy, sampling bias from tertiary care clinics can be minimized, and the fertility
rate can be determined at relatively iow cost.
This thesis will address the assembly of a cohort of women with HCV infection through
the use of administrative ambulatory OHIP diagnostic codes. A selection of OHIP diagnostic
codes are compared for their accuracy in identifying women infected with HCV. As patients
with hepatitis C may be candidates for undergoing liver biopsy, diagnostic codes are combined
with the procedural codes for liver biopsy. After the accuracy of such diagnostic codes are
characterized, then the code with highest sensitivity and specificity, as reflected by plotting as
close as possible to the left upper corner of a ROC plot, will be used to assemble the desired
cohort. Supplementary measures to characterize the reliability and predictive value of different
diagnostic codes will be measured using Kappa statistic and logistic regression. Furthemore,
additional experimental tests will be created by (a) requiring more than one submission of a code
and (b) combining test codes using senal ("and") and parallel ("or"), and evaluated using ROC
plot and Kappa statistic.
2.1.1 Sample Size Considerations
In order to ensure that the resultant cohon is representative of women with hepatitis C,
higher specificity (lower false positive rate) was desired at the sacrifice of lower sensitivity
(higher false negative rate). Although some women infected with HCV may be missed. the

women captured by the experimental code would likely be infected with HCV. If cases of
hepatitis C were not captured as a result of low sensitivity, the final fertility rate would
underestimate the true fertility rate of women with hepatitis C. Based on these considerations, an
upper limit of 15% for the false positive rate (calculated using a 95% binomial confidence
interval) and a specificity of 80% to 95% were chosen. Furthemore, the prevalence of hepatitis
C among women of child-bearing age in the chosen clinics was estimated to range from 25% to
60%. This range =-#as in agreement with a published prevalence of 47% of acute and chronic
vira1 hepatitis in an urban. Canadian hospital-based practice (65).
2.2 Studv Hmothesis
The combination of OHTP diagnostic code "viral hepatitis" together with procedure code
"liver biopsy" is optimal for identifying women of child-bear-ing age infected with HCV as
characterized by plotting closest to the Ieft upper corner on ROC plot.

2.3 Studv Obiectives
1. To identify the optimal OHIP code combination (experimental test) for identifying women
infected with HCV as characterized by:
A. ROC plot (a measure of sensitivity and specificity) where the OHIP code plotting
closest to the left upper corner is the optimal test @rimary objective).
B. Kappa statistic where the OHIP code with the highest Kappa statistic value is the
most reliable.
C. logistic regression using the binary outcome of HCV-infected or not infected:
i) univariate regression using OHIP codes as
a) binary predictor variables, or
b) discrete predictor variables
ii) multiple regression using OHIP codes as binary predictor variables.
The predictor variables of the most parsimonious mode1 will be deemed the most
predictive.
2. To create additional OHIP experimental code combinations by requiring more than one
submission of a diagnostic code and evaluate using
A. ROC plot and
B. Kappa statistic.
3. To create additional OHIP experimental code combinations by combining different codes
using parallel ("or") and serial ("'and") methods and evaluate using
A. ROC plot and
B. Kappa statistic.
Chapter 3: Methods
The objective of this chapter is to describe the overall strategy, the study design, the study
subjects, the development of the reference standard (chart diagnosis of HCV infection), the
developmenr of the experimental test (OHIP code combinations), and the analysis of OHIP codes
using va rious strateg ies to detennine the optimal experimental test code. The feasibiliiy study,
the sample size calculation, and approval fiom research ethics boards are also included.
3.1 Overview of Studv Methods
The strategy of comparing an experimental test against a reference standard was used to
detennine the accuracy of OHIP codes in identifying women infected with HCV. OHIP codes
served as various "experirnental tests" and were tested for their ability to identify women
infected with HCV. The patient's arnbulatory chart record of HCV infection served as the
reference standard for determining whether or not a woman is infected with HCV.
The process entailed five main steps (Figure 3-1). First, OHIP diagnostic and procedural
codes were selected. Second, these codes were used in isolation or in combination to form a
panel of experirnental test codes. Third, al1 OHIP billings containing any of the experimental
test codes were identified over a five-year period. Al1 patients in this group were positive for at
least one of the experimental test codes. The accuracy of the experimental test codes was
determined in a subset of these code-positive patients. This subset, or sarnple population, must
have a known reference standard. That is, the chart record of HCV infection (positive or
negative) was required for this subset of patients. To obtain this gold standard, the fourth step
required abstraction of systematically sampled patient charts. During chart abstraction at four
medical clinics, arnbulatory clinic charts were assessed for the presence or absence of HCV
infection. The patients whose charts were abstracted formed the sample population. Finally, this
sample population was identified within the larger group of code-positive patients through
linkage using the patient's health care number. These patients with known HCV status (presencc
or absence of the diagnosis of hepatitis C) and known experimental test status (OHIP code
combination positive or negative) thus formed the sample population for evaluating the accuracy
of OHIP code combinations in identifying women infected with HCV.
The optimai experimental test (OHIP code combinations) was characterized by plotting
closest to the left upper corner on ROC plot (primary analysis), by a high Kappa statistic (a
mesure of test reliability), and by contributing significantly as a predictor variable in a logistic
regression mode1 for predicting diagnosis of HCV infection. As well, additional experimental
tests were created by (a) by requiring more than one submission of a diagnostic code and (b)
combining different codes using serial ("and") and parallel ("or") methods. These additional
experimental tests were each evaluated using ROC plot and Kappa statistic.

3.2 Studv Desian
The study design is a cross-sectional comparative study.
3.3 StudvSubiects
The study subjects are women of child-bearing age, defined by Statistics Canada as 15-49
years of age inclusive (born between January 1, 1941 and December 3 1, 1984), with valid OHIP
health care number who were seen at one of four physicians' clinics between January 1, 1995
and March 3 1,2000.
3.4 Reterence Standard
3.4.1 Definition and Rationale
The reference standard for diagnosis of HCV infection ("hepatitis C present") was
defined as any positive serum anti-HCV antibody or detectable serum HCV RNA recorded in the
patient chart. Given the limited level of clinical detail offered by administrative databases, no
attempts were made characterize the precise timing and duration of infection. Similarly,
resolution of HCV infection through spontaneous clearance or following medicd therapy was
not pursued. Acute infection was not distinguished from chronic infection. For purposes of this
study, the ability of administrative codes to reflect chart status of ever having k e n infected with
HCV was assessed. This definition, which does not differentiate viremic (detectable senim HCV
RNA) from non-viremic women, will yield a more conservative estimate of the fertility rate for
women infected with HCV.
Serum HCV RNA (measured by RT-PCR) is the laboratory gold standard for diagnosing
infection with HCV. However, anti-HCV antibody (measured by ELISA) is a comparable test
with sensitivity of 97.2% and specificity of 100% when used for screening of the general
population. If applied to individuals with chronic liver disease, the sensitivity increases to 98.9%
(66). Limitations of anti-HCV antibody testing may be due to a 5-6 week window between date

of acquinng infection and detection of seroconversion, delayed seroconversion in
immunocompromised hosts, and the inability of serological tests to confirm active HCV
infection. In practice, infrequent cases of false-positive and false-negative anti-HCV antibody
results are addressed by incorporating HCV RNA testing with clinical and histological findings.
Most patients are tested using anti-HCV antibody. When HCV RNA is also ordered, its presence
confirms ongoing infection with HCV (67).
Tne definition for diagnosis of HCV infection used in this study agrees with the case
definition of a confirmed case of hepatitis C that is used by the Health Canada Notifiable
Diseases national surveillance program (35). The presence of positive anti-HCV anti body has
also been used in other chart reviews as diagnosis of infection with HCV (65).
3.4.2 Choice of Phydcians' Clinics
The selection of ambulatory clinics for chart abstraction was detemined by two main
critena. Firstly, to ensure an efficient process of chart abstraction, the physician should have a
reputation for caring for patients with hepatitis C. Such physicians were expected to have a
reasonable prevalence of hepatitis C in their practice. Furthemore, the chosen clinics should
differ in their type of practice to ensure some heterogeneity in the final chart sample. Tertiary
(3"), secondary (SO), and primary care (1") practices were chosen.
Based on these criteria, the following four physicians were chosen: Dr. A is an
international authority on hepatitis C who works at the University Health Network (site Toronto
- 3"). Dr. C is a secondary care gastroenterologist at Etobiocoke General Hospital who is
recognized in the Greater Toronto community for his interest in hepatitis C (site Toronto - 2").
Dr. D cares for many individuals with dmg addiction, particularly pregnant women in the city's
methadone program at the Addiction Research Foundation (site Toronto - 1"). As the patient
population in Toronto may be unique from other areas in Ontario, a site with high prevalence of

hepatitis C in London, Ontario was included. Dr. B is a London hepatologist with a strong
reputation in hepatitis C (site London - 3") (Table 3-1).
Table 3-1. Clinics chosen for Chart Abstraction
1 A 1 Hepatologist 1 Toronto ( Tertiary - University Hedth Network 1 Toronto - 3" 1 I
- --
B 1 Hepatologist 1 London Tertiary 1 ond don - 3 O 1
2.4.3 Inclusion Criteria for Reference Standard
Only charts meeting the following criteria were eligible for inclusion: (1) female gender
(2) date of birth between January 1, 1941 and December 31, 1984 inclusive (3) valid OHIP
number and (4) seen by a physician between January 1, 1995 and March 3 1, 2000 inclusive.
3.4.4 Chart Abstraction
At each site, a sample of patient charts of females of childbearing age was manually
abstracted for the diagnosis of hepatitis C, as defined as chart evidence of any positive serum
anti-HCV antibody or HCV RNA result. If the clinical notes or laboratory values did not contain
any evidence of a diagnosis of hepatitis C, then the patient was not considered to have a
diagnosis of hepatitis C . Systematic sampling of patient charts was obtained in the following
manner: At each office, shelves of charts were numbered by row and column. A random
numbers table was used to generate a row number and column number to determine the shelf
from which charts would be sarnpled. Numbers from the random numbers table were taken
consecutively until a shelf was identified. Charts of the chosen shelf were then consecutively
reviewed. When a shelf was completed, a new shelf was chosen from the random numbers table.
With consent from the responsible physician, a record of ail charts composed of the
heaith care number, birth date, and presence o r absence of hepatitis C were compiled. The 10-
digit OHIP health care number, date of birth, hepatitis C status (O for absence of diagnosis, 1 for
C D
Gastroenterologist Familv Phvsician
Toronto Toronto
Secondary - Etobicoke Generai Hospital Primarv -Addiction Research Foundation
Toronto - 2" Toronto - 1 "

presencc of diagnosis), and clinic site were entered into an Excel datasheet using a laptop
computer. The datasheet required password access, used coded column headings (with no
reference to hepatitis C), and was stored o n floppy diskette and kept in a locked facility.
Organizational limitations prevented pseudo-randomized chart abstraction from Dr.
Selby's clinic. As a result, the charts of dl active patients from his methadone c h i c at the
Addiction Research Foundation were abstracted. However, the number of active patient charts
was limited. Therefore, non-active patients from the Addiction Research Foundation database
were also included to maximize the sarnple size from this site (site Toronto - 1 O).
3.4.5 Description of Study Subjects
Among the study subjects, the prevalence of hepatitis C was established. To verify that
the sample population reflected the true spectrum of women infected with HCV, the age
distribution of the study subjects infected with HCV was determined and compared with the
known age distribution of women infected with HCV from Notifiable Diseases. As well, to
confirm that the severity of HCV disease in the sample population was similar to that of most
women infected with HCV, the proportion of sarnple subjects who had died was compared
among those infected with HCV and those not infected with HCV. As death from hepatitis C is
uncornmon for most women of child-bearing age, the death rates of women infected with HCV
was expected to resemble that of women not infected with HCV.
3.5 Exmrimental Test
Ely combining OHIP diagnostic and procedure codes, a panel of experimental test codes was
created.
3.5.1 OHIP Code Seledion
The OHlP Schedule of Benefits was reviewed to select candidate diagnostic and
procedure codes that might be used by a physician assessing a patient with hepatitis C. The
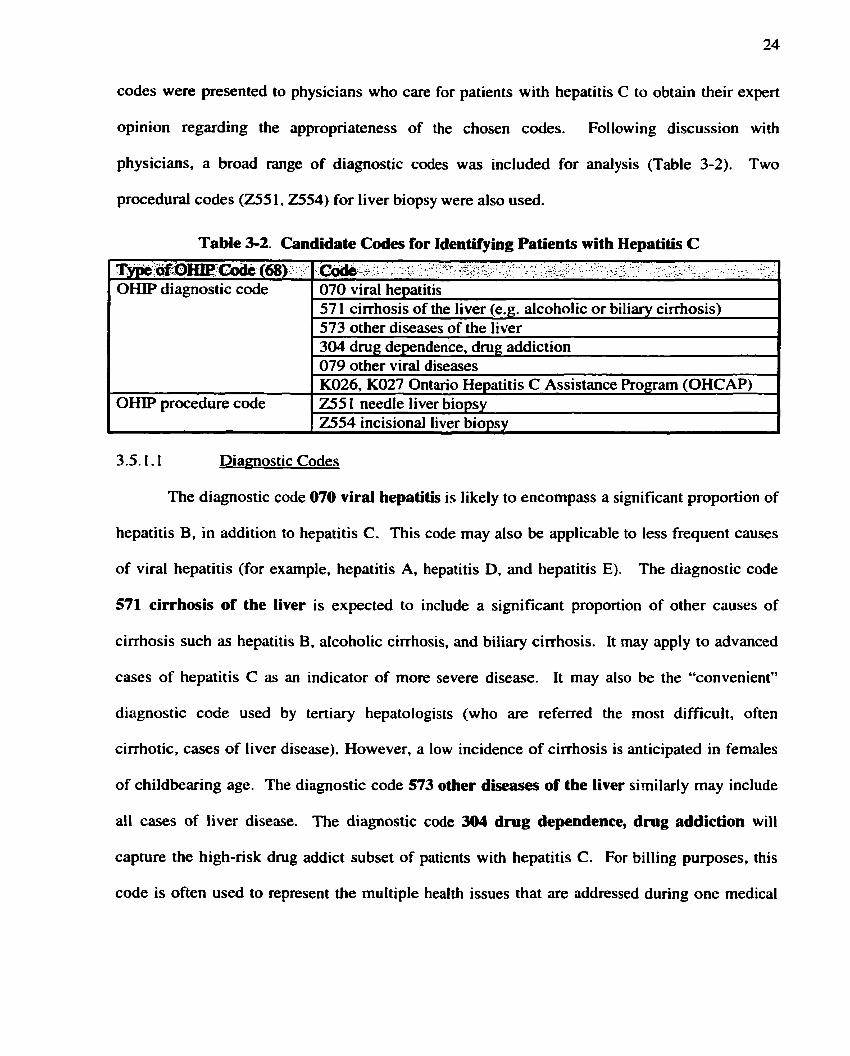
codes were presented to physicians who care for patients with hepatitis C to obtain their expert
opinion regarding the appropriateness of the chosen codes. Following discussion with
physicians, a broad range of diagnostic codes was included for anaiysis (Table 3-2). Two
procedural codes (Z55 1,2554) for liver biopsy were also used.
Table 3-2. Candidate Codes for Identifying Patients with Hepatitis C
Diagnostic Codes
' Typt ag:omC& (68). 0I-W diagnostic code
OHIP procedure code
The diagnostic code 070 viral hepatitis is likely to encompass a significant proportion of
, &&,7<. . , - . . - , * . - ,*-r . .- 2, - * , . C I . . *: . - (
. . < r. , , .. 1. . I c . . _.- - - . - ' a , " . . - .
070 viral hepatitis 57 1 cirrhosis of the liver (e.g. alcoholic or biliary cirrhosis) 573 other diseases of the liver 304 d m g dependence, dmg addiction 079 other viral diseases K026, K027 Ontario Hepatitis C Assistance Program (OHCAP) 255 t needle liver biopsy 2554 incisional liver biopsy
hepatitis B, in addition to hepatitis C. This code may also be applicable to less frequent causes
of viral hepatitis (for exarnple, hepatitis A, hepatitis D, and hepatitis E). The diagnostic code
571 cirrhosis of the liver is expected to include a significant proportion of other causes of
cirrhosis such as hepatitis B, alcoholic cirrhosis, and biliary cirrhosis. It may apply to advanced
cases of hepatitis C as an indicator of more severe disease. It may also be the "convenient"
diagnostic code used by tertiary hepatologists (who are referred the rnost difficult, often
cirrhotic, cases of liver disease). However, a low incidence of cirrhosis is anticipated in females
of childbearing age. The diagnostic code 573 other diseases of the liver similarly may include
al1 cases of liver disease. The diagnostic code 304 d m g dependence, dmg addiction will
capture the high-nsk dmg addict subset of patients with hepatitis C. For billing purposes, this
code is often used to represent the multiple health issues that are addressed during one medical

assessment. In particular, a patient with this code who aiso undergoes liver biopsy will have a
significant probability of having hepatitis C. The diagnostic code 079 other viral diseases may
take account of any case of virai illness, not necessarily just hepatitis.
Effective December 1, 1998, the Ontario Hepatitis C Assistance Program (OHCAP)
provides financial compensation to patients infected with hepatitis C resulting from a blood
transfusion in an Ontario hospital prior to 1986 and after 1990. Those who became infected with
HCV following blood or blood product transfusions, as well as those infected from a partner or
parent who received blood or blood products are eligible. This program is not applicable to
individuals without a history of blood transfusion who likely acquired their HCV infection from
intravenous dmg use. There is strong financial incentive for the patient ($10,000 - $25,000) to
submit an application. Every OHCAP application must be completed in part by the patient's
attending physician who certifies the patient's history of hepatitis C infection. These OHCAP
fee codes are used by the physician for completing the OHCAP application fom. Both family
physicians and specialists may claim these fees. K026 covers any insured service and
completion of the OHCAP application whereas KO27 covers form completion without an
associated consultation or visit on the same day.
3.5.1.2 Procedure Codes
The procedure code 2551 is used for percutaneous needle liver biopsy whereas code
2554 is used for incisional liver biopsy. Intemists commonly use the former code whereas
interventional radiologists favour the latter code. These codes will apply to a proportion of
patients with hepatitis C. Tertiary care hepatologists estimate that 67-80% of al1 liver biopsies
involves cases of hepatitis C (69). Current Canadian Consensus Guidelines recommend that al1
patients undergoing treatment have a liver biopsy (70). Treatment rates for hepatitis C patients

have increased from 30% to 50% while treatment rates for hepatitis B patients have increased
from 5% to 10%. A 1997 U S . survey found that 46% of physicians would obtain a liver biopsy
if HCV infection were confirmed with normal ALT, but only 15% would treat. In a similar
scenario but abnormal ALT, 90% physicians would obtain liver biopsy, and 60% would treat
with interferon (71). Thus a patient with a diagnosis code of viral hepatitis and a procedure code
of liver biopsy will be more likely to have hepatitis C rather than hepatitis B. In Ontario liver
biopsies are performed by hepatologists, gastroenterologists, and a less commonly, by
interventionai radiologists. Most procedures occur in day surgery and do not necessarily involve
an ovemight stay in hospital. C W may be used to verify this procedure code, as it captures data
on day surgery procedures.
3.5.2 Panel of Experimental Tests
A panel of experimental test codes was formed. Individual diagnostic codes as well as
combinations of a diagnostic code with the procedure codes for "liver biopsy" were included
(Table 3-3).
Table 3-3. Definitions OF Experimenbl Test Codes
1 El 1 070 vkal hepatitis and 255 1, 2554 liver biopsy 1 --- -
. - - - - - - -
E2 1 070 viral hepatitis 1 --
E3 E4 ES E6 E7 ES E9
E l 0 El1
57 1 cirrhosis of liver 573 other diseases of liver 304 drug dependence, dmg addiction 079 other viral diseases 57 1 cirrhosis of liver and 255 1,2554 liver biopsy 573 other diseases of liver and 255 1,2554 liver biopsy 304 drug dependence, drug addiction and 255 1,2554 liver biopsy 079 other virai diseases and 255 1,2554 liver biopsy K026/7 Ontario Hepatitis C Assistance Program (OHCAP)

3.5.3 Identifying All Patients wiai OHlP Test Codes
Ali patients with OHIP billing data from January 1, 1995 to March 3 1, 2000 containing
any of the experimental test codes E 1 -ES inclusive and E 1 1 OHCAP were identified. Test codes
E9 and El0 were not used because they did not identify any patients during a feasibility study
(please see section 3.7). The five-year time frame was chosen to reflect the onset of a markedly
increased number of hepatitis C cases reported to the Notifiable Diseases Database (Figure 3-2)
and cover as much recent OHIP data as possible. OHIP billings were limited to those with a fee
for service code with suffix 'A' (feesuff 'A') to avoid multiple counts of a single procedure.
Only those billings submitted by farnily physicians, intemists, and gastroenterologists were
included (speciaity code = 00, 13, or 41, respectively). Patients with hepatitis C who may see
any other types of specialists are likely to have concomitant assessrnent by farnily physicians,
intemists, or gastroenterologists. Duplicate visits (a patient with the sarne service date and same
feecode) were eliminated. The dataset was further reduced to rnake individual patients the unit
of anaiysis. This was accomplished by using an encrypted version of each patient's health care
number, called the ICES key number (MN). Each entry corresponded to a unique MN.
Variables were introduced to (a) count the total number of tirnes a unique IKN satisfied a code
combination and (b) track in binary fashion whether o r not a unique iKN had satisfied a code
combination. The resulting dataset was merged with the Registered Persons Data Base by
unique encrypted IKN to permit further limitation to female sex. Limitation of the dataset to
women aged 15-49 years included women who were bom after January 1, 194 1 and before
December 3 1, 1984.

3.5.4 Incorporating Experimental Test Codes into the Sampk Population
The reference standard, the presence or absence of a chart diagnosis of HCV infection,
was known for al1 patients in the sarnple population. In order to obtain the experimentd test (the
presence or absence of OHIP test codes) for al1 patients of the sample population, linkage of the
chart records to the OHIP test code records was achieved using the patients' health care nurnber.
The unique health care numbers obtained from chart abstraction were encrypted to an equivalent
MN. The unique IKN was used to link OHIP billing data test codes to the abstracted chart
diagnosis of HCV infection. Mr. Don Deboer at the Institute of Clinical Evaluative Sciences
(ICES) performed the encryption. The encryption process used a confidentid, predefined ICES
algorithm that was not divulged to the investigators of this study.

3.6.1 Ovewiew of Analysin
The definition of the "optimal test" must acknowledge the interdependent rclationship
between sensitivity and specificity, positive and negative predictive value. For example,
excellent specificity may often be achieved at significant loss of sensitivity (72). in order to
recognize the "relative cost" that each characteristic of a test may bear, three separate methods
were applied separately to determine the optimal test. In the principal analysis (prirnary
objective IA), the optimal experimental test was determined by plotting closest to the left upper
corner of a ROC plot of sensitivity by 1-specificity. As a secondary analysis, test performance
was expressed in terrns of test reliability, as characterized by measuring Cohen's Kappa statistic.
The test with the highest Kappa statistic value was deemed optimal (objective 1B). As well, the
most parsimonious mode1 from logistic regression was used to identify the experimental tests
that were most accurate in predicting the diagnosis of hepatitis C. Experimental codes were
treated as binary predictor variables (objective 1Cia) or discrete predictor variables (objective
1 Cib). Multiple logistic regression using binary predictor
variables was also performed (objective 1Cii).
An additional secondary objective was to evaluate the accuracy of experimental tests
created by requiring more than one submission of a diagnostic code (objective 2) or by
combining different codes using serial ("and) and parallel ("or") methods (objective 3). These
additional experimental test strategies were also evaluated using ROC plot and Kappa statistics.
The 95% confidence interval was caiculated for al1 estimates of sensitivity, specificity,
positive predictive value, negative predictive value, and Kappa statistic. However, for ease of
reading, these confidence intervals were presented only when necessary for purposes of
cornparison. In instances where the confidence intervals were omitted, the ranges of the
estimates were narrow and did not affect the stated conclusions.
3.6.2 Basic Test Charactsristica
The basic test characteristics include sensitivity, specificity, positive predictive vatue, and
negative predictive value. They may be derived from the traditional 2 x 2 table of experimental
test (OHIP code combinations) and truth (diagnosis of hepatitis C), which has separate boxes for
true positives, false negatives, false positives, and true negatives. By dividing these boxes by the
total number of women (Le. set N=l), the prevalence of hepatitis C is represented by P (where
P=TP+FN). Table 3-4 foms the basis for calculating the basic test characteristics of a diagnostic
or experimental test relative to a reference standard (diagnosis of hepatitis C) (73 ,74).

Table 3-4. Measures of Test Performance and Test Reliability
Test Performance
sensitivity = SE = TP/P positive predictive value = PPV= TP/Q specificity = SP = TNP' negative predictive value = NPV= TN/Q'
Test Reliability
Cohen's Kappa statistic (K) = Obsewed agreement - Agreement bv chance 1 - Agreement by chance
= (EW-PQ-P*Q')/( I -PQ-P'Q')
Where efficiency = EFF = TP + TN P =TP+FN P'= 1 - P = FP+TN Q = TP+FP Q'= 1 - Q = FN+TN
- .- --
Sensitivity (SE) is defined as the probability of having a positive test result arnong those
patients who have a positive diagnosis. This refiects the probability that a diagnosed case of
hepatitis C will be detected by the test. Specifïcity (SP) is the probability of having a negative
test result arnong those patients who have a negative diagnosis. This reflects the likelihood that a
case that is not diagnosed as hepatitis C will not be detected by the test. The positive predictive
value (PPV) of a test is the probability of having a positive diagnosis arnong patients having a
positive test. The negative predictive value (NPV) of a test is the probability of having a
negative diagnosis among patients having a negative test. These terms may be expressed in
equation form (Table 3-4) (73). Al1 statistical analyses were performed using the Statistical
Analysis Software (SAS Institute, Cary, NC, USA) version 8.0.

3.6.3 Rscsiver Operating Chatacteristic (ROC) Plot
One common method for evaluating the performance of diagnostic systems based on the
basic test characteristics is the receiver operating characteristic (ROC) plot, a discontinuous
graph of sensitivity (the true positive rate) versus 1-specificity (the false positive rate) for a set of
experimental tests compared against the same reference diagnosis. These tests are plotted to
illustrate different sensitivities and specificities. The left upper corner of the graph is considered
the ideal test point, where both sensitivity and specificity are 100%. The experimental test that
plots closest to the left upper corner is therefore the optimal test (75).
The discontinuous ROC plot, a two-dimensional graph of sensitivity and 1 -specificity, is
distinct from the continuous ROC curvc, which demonstrates the relationship between sensitivity
and 1-specificity across a range of some continuous variable (a "diminishing signal") (72). In
this study, no continuous variable existed to permit the use of a ROC curve.
3.6.4 Test Reliability: Cohen's Kappa Statistic
The degree of agreement between the experimental test and the reference sttmdard, or the
overall reliability of a test may be expressed using Cohen's Kappa statistic (K). As an
alternative measure of test performance, Kappa statistic quantifies the degree of reliability of a
test while correcting for the degree of agreement expected by chance alone. A formula for
calculating Kappa statistic is shown in Table 3-4. By convention, qualitative interpretation of
Kappa statistic values are as follows: 4.20, poor agreement; 0.2 1-0.40, fair agreement; 0.4 1 -
0.60, moderate agreement; 0.6 1-0.80, good agreement; 0.8 1 - 1 .O, very good agreement. The
most reliable experimental test has the highest Kappa statistic value (75).
3.6.5 Logistic Ragmsdon
Logistic regression offers another strategy for evaluating the accuracy of experimental
tests. By identiQing the most significant predictor variables in a model, logistic regression

focuses on the predictive value of a test. The diagnosis of hepatitis C (presen t or absent) is used
as the dichotomous outcome variable. Logistic regression offers a mathematical rnodel for
evaluating test codes separately (univariate analysis) as well as in combination (multiple
regression). Also, both binary (present or absent) and discrete (1, 2, 3, etc.) forms of predictor
variables may be evaluated. Logistic regression facilitates the evaluation of these variations of
the predictor variables.
The different experimental test codes, codes E2 - E6 inclusive, with or without the
procedure of liver biopsy, were each evaluated as predictor variables. For each predictor
variable, both binary (Ex) and discrete (Dx) values were tested in separate models. For example,
if a patient had 5 bilIing records with the diagnosis of viral hepatitis (E2), then E2=1 as a binary
variable, and D2=5 as a discrete variable. Models containing multiple test codes as predictor
variables were also constructed using multiple logistic regression through stepwise elimination
of non-significant predictor variables.
The most parsimonious model of predictor variables was determined by comparing the
log likelihood and deviance values (mesures of goodness of fit) of each model. By calculating
the difference of deviance and degrees of freedom between two models that differ by one
predictor variable, a chi-square value may be generated. If the chi-square value corresponded to
a p-value 4 . 0 5 then the predictor variable was considered to belong in the most parsimonious
model. The variables in the most parsimonious model represented the experimental codes that
were most useful in predicting the diagnosis of hepatitis C (76, 77).
3.6.6 Multiple Submissions of a Diagnostic Code
Hepatitis C is generally a chronic condition requiring multiple visits to a physician for
adequate assessment. A patient with hepatitis C is likely to be labeled with a diagnostic code
more than once, in contrast to a patient with a mild viral illness who may only require a single

assessrnent. The lag time required between initial blood work and subsequent discussion of
blood test results suggests that a minimum of two medical visits will be required. Thus patients
with repetition of code entnes may be more likely to have hepatitis C. In attempt to improve the
specificity of the experirnental test, test characteristics were evaluated with the requirement that a
"positive" diagnostic code must be submitted more than once for a patient. These expenmental
tests were evaluated using ROC and Kappa statistic (73).
3.6.7 Serial and Parailel Test Stmtegies
Once the optimal codes were identified, serial assembly of codes (code X "and" code Y)
and parallel assembly of codes (code X "or" code Y) were tested as additional test strategies in
attempt to improve the specificity of the experimental test. These experimental tests were also
evaluated using ROC and Kappa statistic (73).
3.7 Feasibilitv Studv
The possible unreliability of diagnostic codes in OHIP billing data raised the concern that
the diagnostic codes may be ornitted in a significant number of billing claims. In order to ensure
that the candidate codes would identify a reasonabte number of patients, a feasibility study was
conducted using data from Notifiable Diseases as an estimate of disease prevalence. If the
diagnostic code was never completed in a daim, then a candidate code would identify close to
zero patients and the study would not be feasible.
Newly detected cases of hepatitis C are reported to Notifiable Diseases. As many cases
of hepatitis C are asymptomatic, the majority of newly diagnosed cases represent the prevalence
of hepatitis C rather than the true incidence. For most cases, the date of acquiring infection
likely preceded the first positive test for HCV. Nevertheless, if a candidate code is to be feasible,
its ability to detect cases of hepatitis C that are king monitored by physicians would identiQ at
l es t a proportion of the number of newly reported cases of hepatitis C. To avoid using codes

that fail to detect a reasonable number of patients, at least 50% of the number of cases reported
to Notifiable Diseases should be identified by a candidate code. This cutoff was increased to
60% to guard against an insufficient number of patients.
From July 1, 1996 to June 30, 1997, the Notifiable Diseases Database reported 1507
newiy reported cases of hepatitis C for women 15-39 years of age and 916 newly reported cases
of hepatitis C for women 40-59 years of age (10) (Figure 3-2). It was assumed that half of the
9 16 cases represented women aged 4049 years of age, yielding a total of 1965 new cases of
women aged 15-49 years with hepatitis C. In order to justify the feasibility of using diagnostic
codes to assemble a cohort of women with hepatitis C, a candidate code would be expected to
generate at least 60% of these cases, or 1200 women aged 15-49 years.
The proposed experimental test codes El -El0 (from Table 3-3) were pulled from fiscal
1996 OHIP data. The Ontario Hepatitis C Assistance Program [OHCAP (El l)] code was not
used because it was not in effect until December 1, 1998. These OHlP billing data were reduced
in the same manner as the five-year OHIP billing data described in section 3.5.3.
The feasibility study of fiscal 1996 OHIP data identified a total of 125,345 hits based on
the proposed experimental test codes ELE8 (Table 3-5). Test codes E9 (drug
dependence/addiction & liver biopsy) and El0 (other viral diseases and Iiver biopsy) did not
identify any patients. Thus the code combinations of "drug dependence" and %ver biopsy" as
well as "other viral diseases" and "liver biopsy" were eliminated from further study. The
experimental test code viral hepatitis alone found 17,500 patients, almost nine-fold the 1965
cases of women aged 15-49 years with hepatitis C reported by Notifiable Diseases. The large
number of patients identified with the proposed codes supported the feasibility of this study.

Table 3-5. Number of Test Code Combinations - Fiscal 1996
As the code of "viral hepatitis" (E2) aione was able to identiQ nine-times more cases of
E 1 viral hepatitis & l&& b i G E2 viral hepatitis E3 cirrhosis of Iiver E4 other diseases of liver E5 drug dependence/addiction E6 other viral diseases E7 cirrhosis of liver & liver biopsy E8 other diseases of liver & liver biopsy E9 drug dependence/addiction & liver biopsy E l 0 other viral diseases & liver biopsy
Total
hepatitis C than the Notifiable Diseases Database. this reinforced the different nature of the
188 17500 1709 4074
2 1255 80415
38 166
O O
125,345
Notifiable Diseases and OHIP data. The Notifiable Diseases Database records newly identified
* an individual may have more than one experimerital test code combination
cases of hepatitis C (an incidence of disease detection, rather than disease incidence), whereas
OHIP data reflects the prevalence of individuals with hepatitis C seen by physicians.

3.8 Sam~le Size calculation
For this study, rather than calculate the number of cases required to have a 95%
confidence interval of a fixed distance for a given point estimate (such as the proportion of
women with hepatitis C who test positive), the sample size calculation was based on the desire to
build a clinically valid 2 x 2 table of experimental test (OHP code combinations) and tmth
(diagnosis of hepatitis C). For OHIP test codes to be useful, a high false positive rate was
prohibitive. As a result, as discussed in the study rationale (section 2.1. l), the sarnple size was
required to exclude a false positive rate of no higher than 15% and provide a range of specificity
from 80% - 95%, across a range of prevalence from 25% - 60%. Based on these assumptions,
the 2 x 2 table was generated to yield the total number of charts required for abstraction.
To clarify the calculations for estimating an appropriate sarnple size, please refer to the
following 2 x 2 table:
Table 3-6. Sample Size Determination - Variables
A sample of 180 patients defined by the algorithm as having hepatitis C would provide an
upper limit of 15% for the false positive rate (for s 95% binomial confidence interval). That is, if
(a + b) (C + d) N = ( a + b + c + d )
Test Coae..+ Test Code -
the maximum false positive rate = b/(a + b) = 0.15 and (a + b) = 180, then based on the formula
for the 95% upper limit of any proportion, (maximum p) = p + 1.96*{square root [p*(l-p)/Nj),
HepatitisC,+ .
a (tme positive) c (false negative) (a + C)
in this case:
HepatitisC: - . - b (false positive) d (true negative) (b + d)
0.15 = b/180 + I.96*(square root [(b/180) *(1- (b/180))/N]} which rearranges to:

0.000030864b2 - 0.50446b + 13.8 = O. By using the quadratic formula, b = 27 or 163 15. Since
b must be c (a + b), b = 27 is used. Since (a + b) = 180 and b = 27, then a = 180 - 27 = 153.
Assuming a specificity of 95%, and given that specificity = d/(b + d), 0.95 = d/(27 + d), and d =
513. Thus (b + d) = 27 + 5 13 = 540. Assuming a prevalence of 25% (in the medical chic),
and given that prevalence = (a + c)/(a + b + c + d), then 0.25 = (153 + c)/(153 + 27 + c + 540)
and thus c= 27. Therefore, N = (a + b + c + d) = (153 + 27 + 27 + 540) = 720 total charts. This
would provide a sensitivity a/(a +c) of 85%.
By similar calculations, the algorithm that defines 540 patients as not having hepatitis C
would permit a maximum false negative rate of 5%, based on a 95% binomial confidence
interval (Table 3-7).
Table 3-7. Sample Size Determination - 25% Prevalence
- -. -
Differences in the prevalence of hepatitis C among clinics affect sample size estimates.
if prevalence increased from 25% to 608, a sample of 320 patients defined by the algorithm as
having hepatitis C would give an upper limit of 15% for the false positive rate (for a 99.9%
binomial confidence interval). Assuming a specificity of 80%, 600 total charts would provide a
sensitivity of 76%. 280 patients defined by the algorithm as not having hepatitis C would permit
a maximum false negative rate of 30%, based on a 95% binomial confidence interval (Table 3-
8).
Total
180 540
Test Code,. ;. . ' Positilie , --. . , - - . . .. -
Negative . ,
Total 180 540 720
Hm*,. ,I
153 27
.'Y . HGy-.
27 513

Table 3-8. Sample Size Determination - 60% Prevalence
The number of total charts required for abstraction was inflated to 800 per site to
accommodate variability in prevalence and false positive rate across the sites.
3.9 Research Ethics
Ethicai approval for this study was obtained from the Research Ethics Boards of the
University of Toronto (protocol #638 l) , the University Health Network (protocol #00-0295-U),
the Centre for Addiction and Mental Health (protocol #128/2000). and the Hospital for Sick
Children (protocol#2000/324) (please see Appendix 3).

Chapter 4: Results
The objective of this chapter is to characterize the sample population and the reference
standard, to describe the prevdence of the OHIP code combinations (experirnental tests), and tu
present the analysis of the experirnental tests as outlined in the study objectives.
The medical charts of 2548 women were abstracted from the four physicians' clinics.
Arnong the 2548 records, no duplication of health care numbers occurred, indicating 2548
unique study subjects. The health care numbers were encrypted into a corresponding ICES key
number (MN). For successful record linkage, the MN'S needed to be recognized by the ICES
database of validated IKN's. This validation process eliminated sixteen invalid records (Table 4-
1). These sixteen mismatched records likely represented errors in data entry during the chart
abstraction. By linkage of valid IKN's, the remaining sarnple population of 2532 unique records
with chart diagnosis of hepatitis C status was combined with OHIP billing data to form the
sarnple population for evaluation of OHIP diagnostic code accuracy.
4.1.1 Proportion of Clinic Charts Assessed for Inclusion
The number of charts in a clinic and the number of charts assessed for this study were
estimated by counting shelves. In Dr. A's clinic (site Toronto - 3") 25 out of 3 1 shelves (80.6%)
were assessed for inclusion into the study. In Dr. B's clinic (site London - 3") al1 22 shelves
(100%) were assessed for inclusion into the study. In Dr. C's c h i c (site Toronto - 2") 12 out of
21 shelves (57.1%) were assessed for inclusion into the study. Each shelf contained
approximately 200-400 charts. in Dr. D's c h i c (site Toronto - 1") al1 active charts were
assessed.

The prevalence of hepatitis C ranged from 2% - 60% arnong the 5 various sources of
patient charts (Table 4-3). The low prevalence of hepatitis C in the secondary care clinic (site
Toronto - 2") resulted from the heavy presence of other diagnoses in that practice arnong women
of child-bearing age. The prevalence of HCV infection in the total sarnple was 27.2%.
Table 4-1. Results of Chart Abstraction
1 Toronto - 3O 1 Toronto 796 1 40 % I London - 3"
Toronto - 2"
Toronto - 1 O
London
Toronto - 1"
4.1.3 Age Distribution
Etobicoke
ARF database
i
The age distribution of women with hepatitis C reported to Notifiable Diseases (Figure 4-
tcrtiary care Hepatology -
ARF active
la) and abstracted charts of women with hepatitis C (Figure 4- lb) shared similar peaks for
tertiary care Gastroenterology - secondary care Farnily Prrrctice -
prirnary care
women born in the 1940s to 1960s (aged 30-60 yezs in 1995-2000). This suggested that the
B
prirnary care Family Practice -
sampled charts reflect the national database's distribution of women with hepatitis C. This peak
C
D
Total
of hepatitis C cases also agreed with U.S. estimates that persons born between 1940 and 1965
757
D
have the highest lifetime risk of acquiring the infection (2,78).
828
87
2548
4.1.4 Death
75 1
7 8
The date of death, if applicable, was available from the RPDB dataset. Of 2532 women
35 %
825
83
2532
in the sarnple population, 29 (1.1 %) had died. Ten of these women had been infected with HCV.
2 %
60 %
77
27% i
At time of death, the mean age of these women was 45.1 years for those not infected with HCV
48 %

and 43.6 years for those infected with HCV (psO. 1).
4.1.5 Muftiple Cornparisons
Particularly when large administrative databases are utilized, the large sample size tends to
facilitate the ability to demonstrate statistical significance. As well, the cornparison of multiple
test codes for different test characteristics are likely to identify a statistically significant outcome
due to random chance. To address these issues, the traditional alpha value (type 1 error) of 0.05
may be decreased to lower the threshold for detection of significance. The most conservative
approach would be to utilize the Bonferroni correction, whereby the alpha value of 0.05 is
divided by the number of possible combinations (79). As the results from logistic regression
reveal that the p-values of the test codes E2 and E5 are eQ.000001 (table 4-8), any adjustment of
the type 1 error to correct for multiple cornparisons is unlikely to impact on the study results.
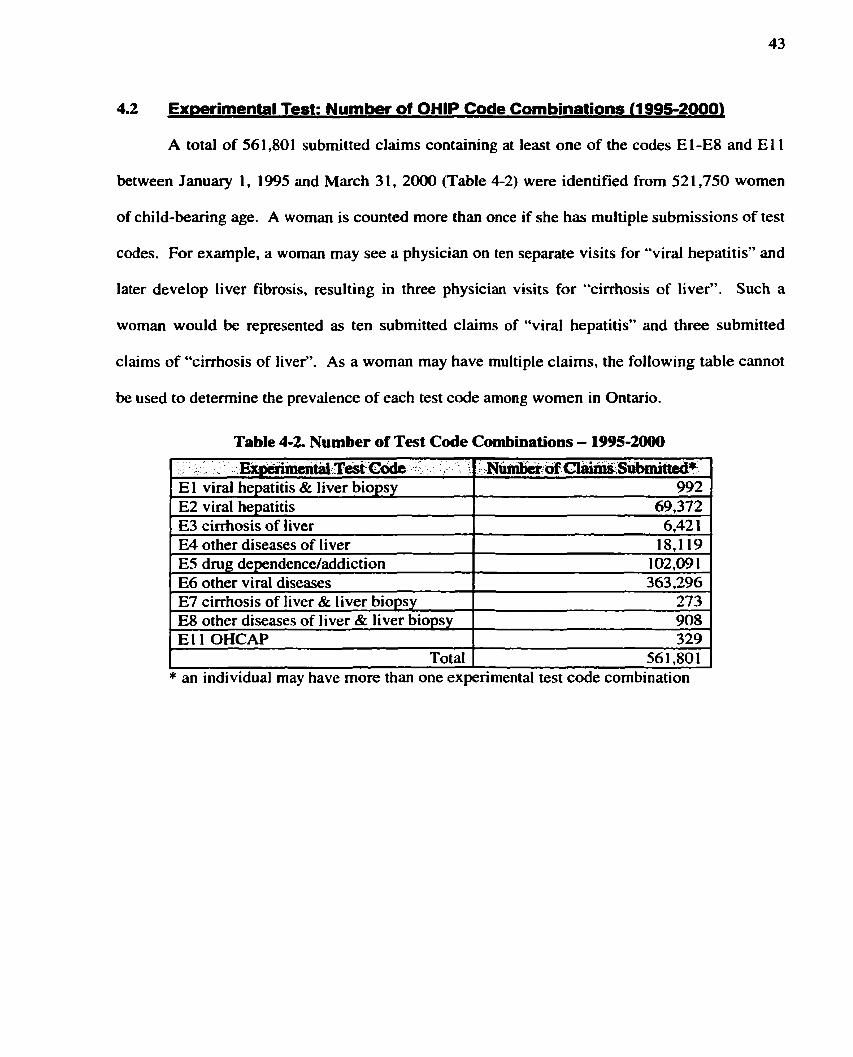
4.2 Exmrimental Test: Number of OHlP Code Combinations (1995-20001
A total of 561,801 submitted claims containing at least one of the codes El-E8 and E 1 1
between January 1, 1995 and March 3 1, 2000 (Table 4-2) were identified from 52 1,750 women
of child-bearing age. A woman is counted more than once if she has multiple submissions of test
codes. For example, a woman may see a physician on ten separate visits for "viral hepatitis" and
later develop liver fibrosis, resulting in three physician visits for "cirrhosis of liver". Such a
woman would be represented as ten submitted claims of "viral hepatitis" and three submitted
claims of "cirrhosis of liver". As a woman may have multiple claims, the following table cannot
be used to determine the prevaience of each test code among women in Ontario.
Table 4-2. Number of Test Code Combinations - 1995-20
.. . . Expirimma ,T& ,,' - 1 ' ,.N-- -6 Cl-', Subniitted* E 1 viral hepatitis & liver biopsy ES viral hepatitis E3 cirrhosis of liver E4 other diseases of liver E5 drug dependence/addiction E6 other viral diseases E7 cirrhosis of liver & liver biopsy E8 other diseases of liver & liver biopsy E 1 1 OHCAP
Total
992 69,372 6,42 1
18,119 1 02,09 1 363,296
273 908 329
56 1 $0 1 * an individual may have more than one experimental test code combination

4.3 Analvsis: Determinina the Optimal ExDerimental Test
4.3.1 Ovarview of Results
Table 4-3 summarizes the results for the optimal codes detennined using ROC plot,
Kappa statistic, and logistic regression for the various experimental test strategies: individual
codes, multiple submissions of a diagnostic code, and serial and parallel methods.
Table 4-3. Optimal OHIP Code Combinations Determined by
ROC plot, Kappa statistic, and Logistic Regression
* The model using counts of a diagnostic code (Dx) was inferior to the corresponding model using the binary form (Ex). 8 Models E2 and (E2 or E5) are comparable on ROC plot.
The ROC plot is the traditional, widely utilized measure of test performance
characterized by measures of sensitivity and specificity. It identifies E2 "viral hepatitis" as the
optimal code. As a supplernentary evaluation of test performance, Kappa statistic is utilized.
Although Kappa statistic is also derived from the same traditional 2 x 2 table of experimental test
(OHIP code combinations) and truth (diagnosis of hepatitis C), it focuses on the degree of
agreement between the tme positives and tme negatives. Using this measure, Kappa statistic
finds ES "dmg dependence/addictionW to be the optimal code. However, by convention, the
range of Kappa values from 70% - 80% indicate good agreement, and the Kappa values of the

majority of the diagnostic codes (including E2 "viral hepatitis") fall within this range. Finally,
logistic regression uses modeling to evaluate the ability of different test codes to predict an
outcome of hepatitis C infection. The mode1 containing E2 "viral hepatitis" and ES "dmg
dependence/addictionW is deemed the most parsimonious. Taken together, these three different
approaches to evaluating test performance yield consistent findings - codes E2 "viral hepatitis"
and ES "dmg dependence/addictionT' are most usefut for identifying a case of HCV infection.

4.3.2 Single Codes (Binary Prsdictor Variable)
4.3.2.1 Basic Test Characteristics and ROC Plot
The accuracy of OHIP diagnostic codes was evaluated using the sarnple population of
2372 women (from sites Toronto - 3", London - 3", and Toronto - 3"). As pseudo-randomized
sampling of charts was not feasible at site Toronto - Io, only a small number of charts (160)
were available for abstraction. Such a small sample size would generate estimates of test
characteristics such as sensitivity and specificity with large confidence intervals. Thus, these
women from ARF were exciuded in the following results and described separately in Appendix
The chart diagnosis of hepatitis C served as the reference standard while various OHIP
code combinations served as the experimental tests. The prevdence of HCV infection in this
sample of three clinics was 25.3%. Table 4-4 reports the basic test characteristics of each
experimental test code. Each test code was a binary variable. For example, a patient who has
ever been diagnosed as "viral hepatitis" would have E2=1. If a patient has never k e n diagnosed
as "viral hepatitis", then E2=0.
To address objective lA, the ROC plot of sensitivity and 1-specificity is shown in Figure
Table 44 . Test Characteristics (%) for Sites Toronto - 3", London - 3", and Toronto - 2""
NPV , 75.8 76.1 75.0 78.7 75.6 74.7 81.6 92.1 82.3
*Bolded results indicate values > 50%.
Test Code Combination El 1 OHCAP El viral hepatitis & liver biopsy E7 cirrhosis of liver & liver biopsy ES drug dependence/addiction ES other diseases of liver & liver biopsy E6 other viral diseases E3 cirrhosis of liver E2 viral hepatitis E4 other diseases of liver
,.SE 6.0 8.7 3.5
23.5 11.8 14.5 49.3 81.0 65.2
SP 99.9 98.5 98.4 95.8 92.8 85.9 76.5 74.5 54.7
EPV 97.3 65.8 42.0 65.3 35.9 25.8 41.6 51.9 32.8

4-2. The combination of diagnostic OHIP code "viral hepatitis" together with procedure code
"liver biopsy" does not plot closest to the left upper corner on ROC plot, disproving the study
hypothesis. Instead, E2 (viral hepatitis) is the optimal code because it lies closest to the left
upper comer on the ROC plot (Figure 4-2). It has the highest sensitivity (8 1.0%) and offers a
specificity of 74.5%.
4.3.2.1. Impact of Addinp; Procedure Code Liver Bio~sv
In Figure 4-2, the triangular points represent combinations of a diagnostic code with the
addition of liver biopsy. While E2 (viral hepatitis), E3 (cirrhosis of liver), and E4 (other
diseases of liver) plot in the left upper quadrant, al1 corresponding codes which include b e r
biopsy (triangles) plot toward the left lower comer, reflecting an small increase in specificity
with great loss of sensitivity. Indeed, the combination of diagnostic and procedural
administrative codes (e.g. viral hepatitis & liver biopsy) has greater specificity than a single
diagnostic code (e.g. viral hepatitis). However, the gain in specificity is accompanied by a
substantial loss in sensitivity.

Test Reliabilitv: Cohen's Kappa Statistic
To address objective IB, table 4-5 reports the Kappa statistic of each experimental test code.
Table 4-5. Kappa statistics for Sites Toronto - 3", London - 3", and Toronto - 2"'
Evaluation using Kappa statistic identifies ES (dmg dependencehddiction) as the
ES drug dependence/addiction E 1 1 OHCAP E 1 viral hepatitis & liver biopsy E7 cirrhosis of liver & liver biopsy E8 other diseases of liver & liver biopsy E2 viral hepatitis E6 other viral diseases E3 cirrhosis of liver E4 other diseases of liver
optimal code with a Kappa statistic of 76.58. If the 95% confidence interval of the Kappa
statistic values is taken into account, the accuracy of E5 (dmg dependence/addiction) is
*Bolded results indicate values sharing 95% confidence interval of ES dmg dependence/addiction.
76.5 76.0 75.4 74.1 71.2 71.1 65.6 64.9 45.2
comparable to El 1 (OHCAP), El (viral hepatitis & liver biopsy), and E7 (cirrhosis of liver &
74.8 - 78.2 74.3 - 77.7 73.6 - 77.1 72.3 - 75.8 69.4 - 73.1 69.3 - 73.0 63.7 - 67.5 63.0 - 66.9 43.2 - 37.2
1 iver biopsy).
With the exception of E4 (other discases of liver), the predominance of weighted Kappa
statistic values within the 60% - 80% range indicates good agreement. Compared to the other
codes, E4 (other diseases of liver) has a low true negative rate (41%). In other words, a patient
without a diagnosis of "other diseases of liver" may still be infected with HCV. The low true
negative rate results in a lower efficiency (57.4%) and consequently, a low weighted Kappa
statistic (45.2%).
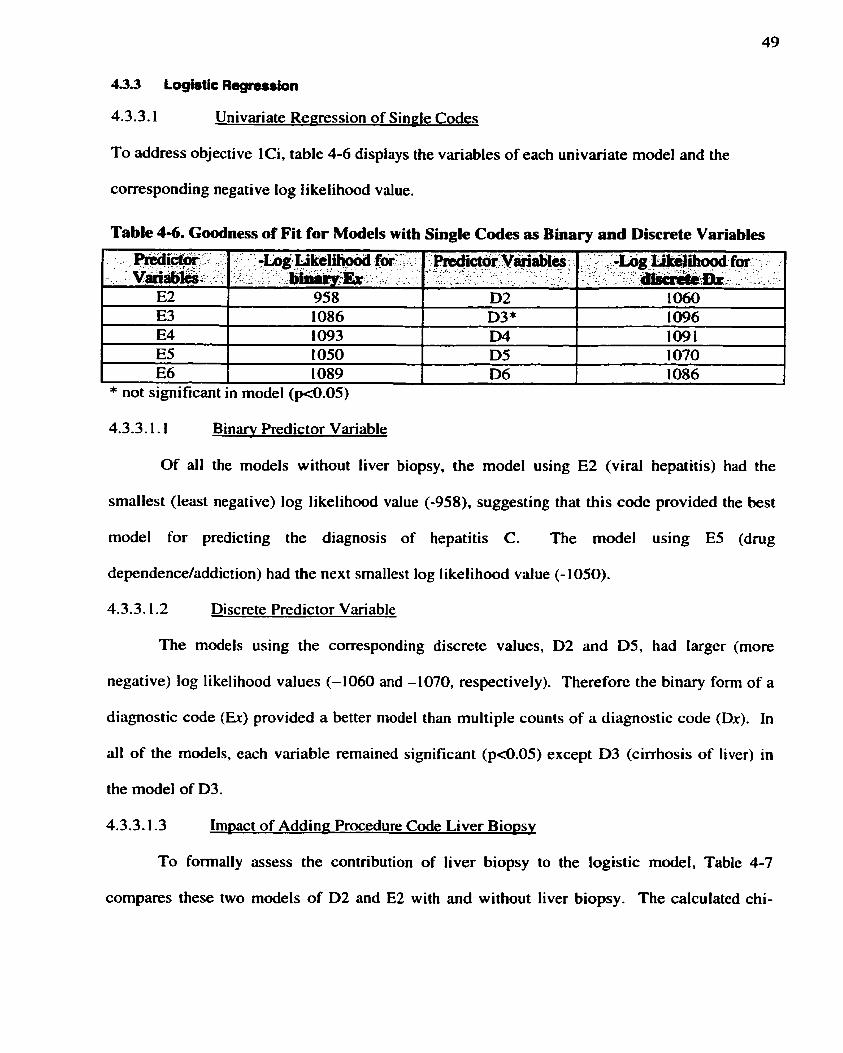
4.3.3.1 Univariate Regression of Single Codes
To address objective Ici, table 4-6 dispiays the variables of each univariate model and the
corresponding negative log tikelihood value.
4.3.3.1.1 Binarv Predictor Variable
Table 4-6. G d n e s s of Fit for Models with Single Codes as Binary and Discrete Variables
Of al1 the models without liver biopsy, the model using E2 (viral hepatitis) had the
PrÈdim . r . .-. ., varialil&; , .
E2 E3 E4 ES E6
smallest (least negative) log likelihood value (-958), suggesting that this code provided the best
model for predicting the diagnosis of hepatitis C. The model using E5 (dmg
* not significant in rnodel (pd.05)
-' -Log I&i k e l h d foi ' . . I . , , - . <
- , . h m : & . = - , - %
958 1 086 1093 1050 1089
dependence/addiction) had the next smallest log likelihood value (-1050).
4.3.3.1.2 Discrete Predictor Variable
Redict6i VMabl* : .-- . . - . .- ,. " . . _ - - . :- - . . ,
D2 D3* D4 D5 D6
The models using the corresponding discrete values, D2 and D5, had larger (more
.: ': .,:-Log Ucéf ihood fm - + . - . . fe+ir8ar-Ibru;br - -
A . ? I. ... 1 0 6 0 1096 1091 1 070 1086
negative) log likelihood values (-1060 and -1070, respectively). Therefore the binary form of a
diagnostic code (Er) provided a better model than multiple counts of a diagnostic code (Dx). In
al1 of the models, each variable remained significant ( ~ 4 . 0 5 ) except D3 (cirrhosis of liver) in
the model of D3.
4.3.3.1.3 Impact of Adding: Procedure Code Liver Bio~sv
To formally assess the contribution of liver biopsy to the logistic model, Table 4-7
compares these two models of D2 and E2 with and without liver biopsy. The calculated chi-

square values are not significant (p=0.22208 and 0.14234). supporting the lack of predictive
utility offered by the inclusion of liver biopsy.
Table 4-7. Comparing Models E2 and D2 with and without Liver Biopsy
8 (deviance of given model) - (deviance of preceding model) q (degrees of freedom of given model) - (degrees of freedom of preceding model) LBx = liver biopsy Bolded variables were eliminated in the subsequent model.

Multiple Regression - of Binarv Codes
TO address objective lCii, each subsequent model in table 4-8 has one less variable
compared to the preceding model. The difference of deviances and the difference of degrees of
freedom between two models yield a chi-square value (deviance/degrees of freedom). The p-
value of the chi-square reflects the contribution of the eliminated variable to the model.
Table 4-8. Goodness of Fit for Models with Multiple Codes
5 (deviance of given model) - (deviance of preceding rnodel)
Fdida:Yki&ks*: . . . . . . - - . - - .
E2 E3 E4 ES E6 LBx
E2 E4E5E6LBx , E2 E5 E6 LBx E2 ES E6 E2 ES E2
E2 E5 ES
. - -., . ,-,,,.,
E2 E5 LBx* E2 E5
q (degrees of freedom of given model) - (degrees of freedom of preceding model) LBx = liver biopsy Bolded variables were eliminated in the subsequent model. * This model is equivdent to predictor variables E l and ES; liver biopsy borderline signifiant pa.0696
- ' -Lag - - Likelibood *
909
909 9 10 91 1 915 958
915 1050
. .
.- 913
By multiple regression, the most parsimonious model included E2 (viral hepatitis) or E5
: - A . - - : p ~ m -;':pC&cs - - . - -
(dmg dependencdaddiction). The addition of E6 (other viral diseases) to the model of [E2
1 1 1 1 1
1
. . , -
1
(viral hepatitis) or E5 (drug dependence/addiction)] significan tly improved the model (p-value of
- a : . .-writr;irnc#d . A.
. . . -
0.48 13 1.8932 2.8 136 6.6638
86.4087 . -
. . 27 1 -579 1
< *
" .
.DevwqCe- ( w j . gDoa#ss of fit) . .
18 17.2030
1 8 17.6843 1 8 1 9.5775 1 822.39 1 1 1829.0549 1915.4636
. -
1829.0549 2 1 ûû.6340
/ , -
1 825.7798
0.48783 0.16884 0.09347 0.00984
<0.000001
<0.000001 .. -
0.070339
0.00984). However, its p-value was remarkably greater than that value offered by E2 (viral
3.275 1
iw-of :. -'fieüb-m - :
1687
1688 1689 1 690 1691 1692
, +
1691 1692
I I - ' . .
1 690 9 15 1829.0549 1
hepatitis) and ES (drug dependence/addiction), each with p-value of cû.000001. As a result. E6
169 1
was removed from the final model.

4.3.3.2.1 Irn~act of Adding - Procedure Code Liver Biopsy
The addition of liver biopsy to the model containing E2 (viral hepatitis) or ES (drug
dependence/addiction) rninimally improved the model's predictive value (-log likelihood
changes from 915 to 913) and did not significantly improve the model (p4.070339). Since E l
represented viral hepatitis (E2) and liver biopsy, these results echoed earlier findings that E2
(viral hepatitis) and ES (drug dependenceladdiction) were most predictive for the diagnosis of
hepatitis C.

4.3.4 Multiple Submissions of a Diagnostic Code (8inary Predictor Variable)
Basic Test Characteristics and ROC Plot
For a code to be counted, the diagnostic code must have k e n submitted more rhan once.
Table 4-9 reports the basic test characteristics of each experimental test code. To address
objective 2A, the ROC plot of sensitivity and 1-specificity is shown in Figure 4-3.
Table 4-9. Test Characteristics (% ) - Code Submitted >1*
- -
1 E6 other viral diseases I 9 5 ~ 4.7 I 24.3 I 74.6 I
Tèst Code 'Combiiatim- .
E 1 1 OHCAP El viral hepatitis & liver biopsy E7 cirrhosis of liver & liver biopsy ES other diseases of liver & liver biopsy ES dmg dependence/addiction
*Bolded results indicate values >50%.
:. PPV 100.0 83.3
O 26.3 76.4
E3 cirrhosis of liver E2 viral hepatitis E4 other diseases of liver
Cornparison of the plot of codes submitted more than once (Figure 4-3) to the previous
-:IW.V. , 74.7 74.8 74.6 74.7 78.0
- . sp . , :: 100.0 99.9 99.8 99.2 98.1
plot of single codes (Figure 4-2) shows that when a code must be submitted more than once in
SE ': 0.3 0.8
O 0.8
18.3
order to count as a "positive test", the sensitivity of al1 codes decreases while specificity
83.6 82.4 68.3
increases. The overall ranking of codes remains similar to initial analyses that required that a
38.7 54.9 30.4
30.4 62.9 40.9
code be submitted only once. E2 (viral hepatitis) continues to have highest sensitivity (62.9%)
78.0 86.8 77.3
and a specificity of 82.4%; it plots closest to the left upper corner in Figure 4-3.
4.3.4.1.1 Impact of Adding Procedure Code Liver Bioiisv
While E2 (vira1 hepatitis), E3 (cirrhosis of liver), and E4 (other diseases of liver) plot
in the upper half, al1 corresponding codes that include liver biopsy (triangles) crowd the left
lower corner, reflecting an improved specificity with loss of sensitivity. Similar to the
experimental codes requiring only one submission of a diagnostic code, the combination of

diagnostic and procedural administrative codes (e.g. viral hepati tis & liver biopsy) bas greater
specificity than a single diagnostic code (e-g. viral hepatitis).

4.3.4.2 Test Reliabilitv: Cohen's Kama Statistic
To address objective 2B, table 4-10 reports the Kappa statistic of each experimental test
code (submitted more than once).
Table 4-10. Kappa statistics - Code Submitted >1*
The Kappa statistic coefficients of codes requiring multiple submissions indicate that ES
ES drug dependence/addiction E 1 viral hepatitis & liver biopsy E 1 1 OHCAP E7 cirrhosis of liver & liver biopsy ES other diseases of liver & liver biopsy E2 viral hepatitis E6 other virai diseases E3 cirrhosis of liver E4 other diseases of liver
(dmg dependeacdaddiction) is optimal. Similar to the findings of Kappa statistic coefficients
on once-submitted codes in section 4.3.2.2, if the 95% confidence interval of the Kappa statistic
*Bolded results indicate values sharing 95% confidence interval of E5 dmg dependence/addiction.
77.3 74.8 74.7 74.5 74.2 74.2 71.6 67.3 54.5
values is taken into account, the accuracy of ES (drug dependenceladdiction) is comparable to
75.6 - 78.9 73.1 - 76.5 73.0 - 76.4 72.8 - 76.3 72.4 - 76.0 72.4 - 75.9 69.8 - 73.4 65.4 - 69.2 52.5 - 56.5
most of the other codes, once multiple submissions of a diagnostic code are required.
With the exception of E4 (other diseases of liver), the predominance of weighted Kappa
statistic values within the 60% - 80% range indicates good agreement. Compared to the other
codes, multiple submissions of E4 (other diseases of liver) bear a low true negative rate (5 1 .O%).
In other words, a patient without a diagnosis of "other diseases of liver" may still be infected
with HCV. The low true negative rate results in a lower efficiency (61.3%) and consequently, a
low weighted Kappa statistic (54.5%).

4.3.5 Serial and Parallel Methods (Binary Prsdictor Variable)
Earlier results using ROC plot, Kappa statistic, and logistic regression identified codes
E2 (viral hepatitis) and ES (dmg dependenceladdiction) as the most predictive variables for
identifying hepatitis C. Based on these results, additional algorithms were created using serial
("and) and parallel ("or") methods and compared with each individual code using ROC plot and
Kappa statistic. To address objective 3, table 4-1 1 reports the basic test characteristics and
Kappa statistic of each code combination and the ROC plot of sensitivity and 1-specificity is
shown in Figure 4-4.
Table 4-11. Test Characteristics (9%) for Codes Combined by Serial and Parallel Methods*
*Bolded results indicate values > 50%.
dependence/addiction E2 viral hepatitis E2 or E3
4.3.5.1 Basic Test Characteristics and ROC Plot
Serial combination of codes [E2 and ES (viral hepatitis or drug dependence/addiction)]
. - . P w - w c I ) - i .
, -
85.7 (79.9-91.5) 65.3 (58.9-71.6)
. .T&câb - . Co'..,-
E2 and ES E5 drug
lNw
78.5 78.7
resulted in improved specificity but signifiant loss of sensitivity. Parallel combination of codes
, KhpphQir . (954bCI) - 78.3 (76.7-80.0) 76.5 (74.8-78.2)
74.5 (72.5-76.6) 7 1.4 (69.3-73.5)
[E2 or E5 (viral hepatitis or drug dependenceladdiction)] had maximal sensitivity of 84.5% with
.SP(%%a). . . .
98.9 (98.4-99.4) 95.8 (94.8-96.7)
specificity of 7 1.4% and PPV of 50.1%. In fact, E2 (viral hepatitis) and [E2 or ES (viral
, sE(%%;cr). : , . .. . . 20.0 ( 16.8-23.2) 23.5 (20.1-26.8)
81 .O (77.9-84.2) 84.5 (81.6-87.4)
hepatitis or drug dependenceladdiction)] were remarkably comparable: E2 (viral hepatitis)
offered slightly ktter specificity (74.5% compared to 71.4%) and PPV (5 1.9% compared to
5 1.9 (48.7-55.1) 50.1 (47.0-53.2)
50.1 1) than [E2 or E5 (viral hepatitis or dmg dependenceladdiction)]. On the other hand, [E2
or E5 (viral hepatitis or dnig dependence/addiction)] offered mildly higher sensitivity (84.5%
92.1 93.2
compared to 8 L %), and NPV (93.2% compared to 92.18). Therefore parallel combination of
7 1.1 (69.3-73.0) 68.9 (67.0-70.7)
these codes increased sensitivity without significant loss of specificity. These findings agree
with the results of multiple regression from Table 4-9 that also found that the mode1 containing
[E2 or ES (viral hepatitis or drug dependence/addiction)] to be the most parsimonious.
Figure 4 4 shows that borh E2 (viral hepatitis) and [E2 or E5 (viral hepatitis or h g
dependenceladdiction)] most closely approach the left upper comer. AI1 other algorithms cluster
around the left lower comer, indicating high specificity but low sensitivity.
4.3.5.2 Test Reliabilitv: Cohen's Kama Statistic
The code combination of E2 and ES (viral hepatitis or drug dependence/addiction) has
the highest Kappa statistic of 78.38, although the 95% confidence interval of this estimate
overlapped with that of E5 (drug dependence/addiction) alone. By convention, the fact that al1
weighted Kappa statistic values were within the 60% - 80% range indicates good agreement
between the code combinations and the reference standard.

Chapter 5: Discussion
The objective of this chapter is to summarize the results of the stuây, discuss the relevance of
the findings, discuss the strengths and limitations of the study design, and describe future
directions.
5.1 Summarv of Results
The OHIP diagnostic code "viral hepatitis" (E2) is the optimal test for identifying women
of child-bearing age infected with HCV as characterized by plotting closest to the left upper
corner of the ROC plot. "Viral hepatitis" is also the most significant predictor variable in a
logistic regression model for predicting the diagnosis of hepatitis C. The OHIP diagnostic code
for "viral hepatitis" has a sensitivity of BI%, specificity of 758, and positive predictive value of
52% when used to assemble a cohort of women infected with HCV. Alternate codes with
improved positive predictive value and specificity incur a loss of sensitivity.
The OHIP diagnostic code "dmg dependence/addictionW (E5) is worthy of mention
because parallel combination of "E2 or ES" (viral hepatitis and drug dependence/addiction) is
comparable to E2 alone by ROC plot. The serial combination of "E2 and ES' (viral hepatitis and
drug dependence/addiction) is most reliable with the highest Kappa statistic estimate. As well,
"viral hepatitis," together with "dmg dependence/addiction," are significant predictors of a
diagnosis of hepatitis C by multiple logistic regression.
Multiple submissions of a diagnostic code improve the specificity of a code combination,
but often result in a loss of sensitivity. Similarly, the addition of the procedure code liver biopsy
improves specificity at a loss of sensitivity. Kappa statistics, a measure of test reliability, tend to
be high when a test has high specificity.
5.2 Relevance of Findinns
Characterization of the accuracy of the assembled cohort is a necessary step before
outcome measures derived from the cohort can be interpreted. The positive predictive value of
52% for OHIP diagnostic code "viral hepatitis" (E2) suggests that more than half of al1 women
identified in the OHIP database using this diagnostic code will have a diagnosis of hepatitis C.
Other causes of viral hepatitis, aside from hepatitis C, will contribute to the proportion of false
positives generated by administrative data using OHIP diagnostic codes. As hepatitis C and
hepatitis B are the most common forms of viral hepatitis @O), it is conceivable that hepatitis B
accounts for the majority of the remaining cohort. In fact, the cohort assembled using E2 might
be better described as "women of child-bearing age with viral hepatitis".
Fortunately, combination codes can be selected, based on their test characteristics, to form
a cohort to meet the requirements of any particular research question. Indeed, for the purpose of
assembling a cohort of women of child-bearing age to measure their fertility rate, higher positive
predictive value and specificity at a cost of less sensitivity is necessary. The most accurate code
combination of "E2 and EST (viral hepatitis and drug dependence/addiction) offers a sensitivity
of 2096, specificity of 99%, and positive predictive value of 86%.
In fact, the higher accuracy offered by including the diagnostic code "dmg
dependence/addictionW (ES) was not foreseen but parallels the current epidemiology of hepatitis
C. Since the testing of donor blood for HCV was implemented in 1990, the incidence of post-
transfusional hepatitis C h a decreased (81). injection drug use is now the major risk factor for
HCV infection in Canada (14). It is likely that many individuals with hepatitis C are primarily
being treated for their drug dependence. Only some of these individuals will see a specialist to
be assessed for treatment.

5-3 Strenaths of Studv Desian
in Canada, d l previous work assessing the accuracy of diagnostic codes has focused on
inpatient hospitai charts and C W codes. This is the first study to evaluate the ability of OHIP
diagnostic codes to identify a clinic chart diagnosis of hepatitis C. For this study, a panel of
experimental tests (OHIP code combinations) was analyzed against a reference standard
(ambulatory chart diagnosis of hepatitis C).
Experimental tests were forrned using multiple strategies - single codes of at least one
submission, codes submitted more than once, and combinations of codes using senal and pardlel
methods. These multiple strategies provided insight into the behavior of diagnostic codes under
different circumstances. While "viral hepatitis" is deemed the optimal code, the inclusion of
"drug dependence/addiction" or "liver biopsy" cm be used to adjust the measures of sensitivity
and specificity.
The reference standard consisted of over 2300 abstracted clinic charts for the diagnosis of
hepatitis C. The large number of abstracted charts improves the precision of the test
characteristics and Kappa statistics. By cornparison, other studies of administrative data
abstracted less than 500 charts (49,57).
Although the p n m q analysis evaluated OHIP codes using ROC plot, alternate measures
of test performance including Kappa statistic and logistic regression also found comparable
results. Whereas the ROC plot measured sensitivity and specificity, Kappa statistic measured
the degree of agreement, and logistic regression measured predictive value. These different
measures consistently ranked experimental tests containing the diagnostic codes E2 (viral
hepati tis) andor ES (drug dependenceladdiction) highest.

5.4 Limitations of Studv Desian
5.4.1 Sampling Bis8
Despite the attempt to assemble a population-based cohon of women with hepatitis C ,
this project is subject to the same limitations of al1 studies of HCV prevalence: namely, the
background prevalence of hepatitis C is unknown, particularly because rnany infected individuals
are asymptomatic and have yet to be identified and tested. However, the age distribution of the
chart cohon and Notifiable Diseases data are comparable, suggesting that the chart cohort
reflects the population of women already identified to have hepatitis C.
5.4.2 Spectrum Bias
For purposes of analysis, only three clinic sites were used. Yet diagnostic indices can
Vary substantially, depending on the composition of tested patients (82). The patients of the
sample population used in this study yielded a range of diagnostic indices that may be subject to
change when OHIP test codes are applied to the provincial population. Namely, the decreased
prevalence of hepatitis C within the provincial population wili result in a lower positive
predictive value and lower specificity. The degree to which the findings from the three sites
reflect the population of clinics remains unknown. Although the potential spectrum bias can
diston the study results, the ideal sarnpling approach of systematically gathering al1 eligible cases
from al1 clinical facilities through continued surveillance (64) was not feasible.
In attempt to capture a broad spectrum of women identified to have hepatitis C, chart
abstraction was performed at a diversity of sites, including primary, secondary, and tertiary care
clinics. A c h i c in London was chosen to sarnple beyond the unique multi-cultural composition
of Toronto. The Addiction Research Foundation Methadone C h i c with its particularly high
prevalence of hepatitis C was utilized to include patients with drug dependence or addiction.
The choice of the secondary care clinic was made based on its reputation as a popular referral

destination for cases of hepatitis C; even then the actual prevalence of hepatitis C among wornen
of child-bearing age was 28 . Other clinics are expected to have an even lower prevalence of
hepatitis C, limiting the feasibility of a more exhaustive chart abstraction at additional sites.
Given the lower prevalence of hepatitis C, the inclusion of additional sites is unlikely to
contribute iùrther to the sarnple population.
Further attempts to diminish sampling bias of charts within the clinic were made by
sampling charts using a pseudo-randomization procedure. However. pseudo-randomized
sampling was not possible at the Addiction Research Foundation Methadone C h i c . The
difficulties of pseudo-randomized chart sampling, coupled with a low prevalence of hepatitis C
in other clinics, suggest that current degree of sampling bias is unavoidable.
5.4.3 Selection of OHIP Codes
OHIP codes were seIected without available data regarding the nature of OHIP billing
practices for diagnostic codes. Several factors may contnbute to wide variation in the use of
diagnostic codes during claims subrnission. Diagnostic codes are not mandatory and do not
directly affect the amount the health care provider is reimbursed. Furthemore, the familiarity
with the variety of eligible diagnostic codes listed in the OHIP Schedule of Benefits may also
Vary between clinics. In fact, OHIP billing is often delegated to a medical secretary whose
appreciation of an accurate diagnosis may be limited. Despite these concems. it may be argued
that the current electronic OHIP billing system encourages the use computerized billing
programs. These billing programs offer key-word search capabilities that facilitate the
completion of diagnostic codes.
5 J Future Directions
The assembled cohort of women infected with HCV can be linked to other databases to
provide population-based data on women infected with HCV. In particular, linkage to hospital

discharge data, using the unique health care number, will permit measure of the number of iive
births for these women. The resultant age-specific fertility rates can help refine estimates of
matemal-infant transmission of HCV. If the fertility rate of the cohort is significantly higher
than that of the general population, than the estimated number of infants who will acquire
hepatitis C from their infected mother will be greater than previously thought. These estimates
can influence public health planning decisions as the government prepares to meet the increasing
burden of disease from hepatitis C.
As the burden of disease from hepatitis C gains attention, the unmet needs of individuals
infected with hepatitis C have become more apparent. Patients with hepatitis C have followed
the lead of AIDS activists in raising awareness of their disease in public and professional
domains. These patient-driven groups (e.g. HepCure, Canadian Hemophila Society) are highly
rnotivated to cultivate an international network for promoting hepatitis C education, support, and
research. Their efforts strongly suggest that patients with hepatitis C do not have adequate
access to rnedical care and support (83).
By raising such concems, these patients succeeded in organizing the 1" Canadian
Conference on Hepatitis C in May 2001 with full support from the Canadian govemment. This
multi-disciplinary meeting was not only attended by experts in the field of medicine and public
health, but also by HCV-infected individuals. The priority of the conference was to emphasize
the accessibility and practicality of information regarding hepatitis C and to ensure the widest
dissemination of such information to the community of persons infected with and affected by
hepatitis C. This meeting highlighted the need for Canadian population-based research to assess
the needs of patients with hepatitis C (84).
An administrative cohort of patients infected with hepatitis C c m help characterize the

burden of disease of hepatitis C in Canada. Such a cohort can be used to evaluate regional
variation of health care services to patients with hepatitis C. Longitudinal follow-up of an
assembled cohort c m provide measures of health care utilization for infected women. Linkage
through health care number to the National Population Health Survey can yield disease-specific
utility measures for Canadians with viral hepatitis to facilitate measures of health-related quality
of life. Future linkage to dmg dispensing and laboratory databases can provide further detail to
help characterize the disease spectrum of patients with of hepatitis C. Such population-based
data are relatively inexpensive and are a necessary adjunct to Canadian surveillance studies of
hepatitis C.
Finally, the resultant basic test characteristics of OHIP diagnostic codes rneasured in this
study suggest that certain diagnostic codes may be more useful than previously thought. It is
invalid to assume that al1 diagnostic codes have poor accuracy. Rather, the combination of
different codes can offer a spectrum of accuracy. Diagnostic code combinations cm be
strategically manipulated to assemble different groups of patients with different characteristics.
By understanding the behavior of test characteristics such as sensitivity and specificity when
codes are combined, one can harness the information in diagnostic codes to enrich the
opportunities for research using administrative data.
Diagnostic codes represent an uncharted frontier in the realm of population-based research.
Population-based cohorts have k e n recognized for their many advantages. They offer a
relatively inexpensive, efficient mechanism for tracking province-wide disease burden, selecting
high risk patient groups for intensive intervention, and evaluating the effect of changes in disease
management on outcornes over time. The time is ripe for expanding the utility of diagnostic
codes in medical conditions above and beyond hepatitis C.

Figure 3- 1. Overall S trategy
Experimental Tests I 1 Select OHIF' diagnostic & procedure codes. 1
1 Create panel of code cornbinations. I
Reference Diagnosis
Select al1 OHIP billings with any of the Chart abstraction of women to determine code combinations: positive or negative. Hepatitis C status: present or absent.
+
Linkage by 11 *;IV . 1 Study subjects with known: P Hepatitis C status: present or absent. & Code combination: positive or negative.
Analvsis
1. Evaluate Experimental Tests (code combinations) using: A. ROC plot B. Kappa statistic C. logistic regression (binary and discrete predictor variables)
2. Create additional Experimental Tests by requiring more than one submission of a code and evaluate using: A. ROC plot B. Kappa statistic
3. Create additional Experimental Tests by combining test codes using serial or parallel method and evaluate using: A. ROC plot B. Kappa statistic

66
Figure 3-2. Number of Female Cases of HCV Reported in Ontario by Year of Reporting
Number of Female Cases of HCV
3000m
1992 1993 1994 1995 1996 1997 1998
Year of Reporting
Asie Grouos O women aged 15-39 years
women aged 15-59 years
Data source: Notifiable Diseases Database, LCDC, 1992- 1998, http:/lcythera.ic.gc .ca/dsol/ndislc~age~e. html

Figure 4-1. (a) Female Cases of HCV in Ontario by Age Group Reported to Notifiable
Diseases
Number of Female Cases of HCV
400 -l
Year of
1998
15-19 20-24 25-29 30-39 40-59 >60
Women's Age Groups (years)
Data source: Notifiable Diseases Database, LCDC, 1995-1998, htt~://cvthera.ic.~c.ca/dsol/ndis/c age e-html
This age distribution of women with hepatitis C reported to Notifiable Diseases has peaks for women aged 30-60 years in 1995- 1998. These peaks match the peaks of Figure 4-lb of wornen aged 30 -59 years from abstracted charts of wornen with hepatitis C (Figure 4-1 b), suggesting chat the sampIed charts reflect the national database's distribution of women with hepatitis C.

Figure 4-1. (b) Number of Women with Hepatitis C in Sample Population by Age Croup
Birth
Number of Female Cases of HCV
15-19 20-29 3û-39 4049 50159
Women's Age Groups (years)
Sites
Toronto - 3 " OLondon - 3 "
Toronto - 2 "
OToronto - 1 Odatabase
MToronto - l0 current
Toronto - 3" = tertiary care hepatologist, Dr. A London - 3" = tertiary care hepatologist, Dr. B Toronto - 2" = secondary care gastroenterologist, Dr. C Toronto - 1" = primary care family physician in methadone c h i c , Dr. D

Figure 4-2. Sensitivity and Specificity of Codes for Sites Toronto - 3", London - 3", and
Toronto - 2"
Test Codes
El Viral hepatitis & liver biopsy
E2 Viral hepatitis E3 Cirrhosis of liver E4 Other diseases of liver E5 Drug dependence,
addiction E6 Other viral diseases E7 Cirrhosis of liver & liver
biopsy ES Other diseases of liver &
liver biopsy El1 OHCAP
20 40 60 80 100
1 - Specificity (%)
* = ldeal Test Location
Sensitivity = probability of having a given test code among those patients with a diagnosis of hepatitis C. Specificity = probability of not having a given test code among those patients without a diagnosis of hepatitis C.
Toronto - 3" = University Health Network tertiary care hepatologist: Dr. A London - 3" = London tertiary care hepatologist: Dr. B Toronto - 2" = Etobicoke General Hospital secondary care gastroenterologist: Dr. C
E2 Viral hepatitis plots closest to the left upper corner.

Figure 4-3. Sensitivity and Spficity of Codes (%) - Code Submitted >1 for Sites Toronto
- 3", London - 3", and Toronto - 2"
Test Codes
El Viral hepatitis 8 liver biopsy
E2 Viral hepatitis E3 Cirrhosis of liver E4 m e r diseases of liver E5 Drug dependence,
addiction E6 Other viral diseases E7 Cirrhosis of livei & liver
biopsy E8 Other diseases of liver &
liver biopsy El1 OHCAP
E8 1 1 - Specificity (O/ )
Sensitivity = probability of having a given test code among those patients with a diagnosis o f hepatitis C. Specificity = probability of not having a given test code arnong those patients withour a diagnosis of hepatitis C.
Toronto - 3" = University Health Network tertiary care hepatologist: Dr. A London - 3" = London t e r t i q care hepatologist: Dr. B Toronto - 2" = Etobicoke Genenl Hospital secondary care gastroenterologist: Dr. C
E2 Viral hepatitis plots closest to the left upper corner.

Figure 44. Sensitivity and SpeciCicity of Codes Combined by Serial and Parallel Methods for Sites Toronto - 3", London - 3", and Toronto - 2"
Test Codes
E2 Viral Hepatitis
ES Drug
O E2 and 5
OE2or5
O 20 40 60 80 100 1 - Specificity (%)
* ldeal Test Location
Sensitivîty = probability of having a given test code among those patients with a diagnosis of hepatitis C. Specificity = probability of not having a given test code among those patients without a diagnosis of hepatitis C.
Toronto - 3" = University Health Network tertiary care hepatologist: Dr. A London - 3" = London tertiary care hepatologist: Dr. B Toronto - 2" = Etobicoke General Hospital secondary care gastroenterologist: Dr. C
E2 (viral hepatitis) and ES or ES (viral hepatitis or dmg dependenceladdiction) both plot closest to the left upper corner.

Appendix 1:
an ti-HCV
ARF
child-bearing age
CIHI
CMG
EFF
ELISA
HCN
HCV
hepatitis C
ICES
MN
LCDC
OHCAP
OHIP
NPV
P
PPV
Q
RIBA
RNA
Glossary and Abbreviations
antibody tu hepatitis C virus
Addiction Research Foundation
15-49 years of age inclusive (This age range agrees with the definition of
child-bearing age used by Statistics Canada) (35).
Canadian Institute for Health Information
Case Mix Group
efficiency
enzyme linked immunosorbent assay
health care number
hepatitis C virus
serum anti-HCV antibody or HCV RNA positive on at least one occasion
Institute of Clinical Evaluative Sciences
ICES key number
Laboratory Centre for Disease Control
Ontario Hepatitis C Assistance Program
Ontario Hospital Insurance Program
negative predictive value
prevalence
positive predictive value
level of a test
recombinant immunoblot assay
ribonucleic acid

ROC
RPDB
RT-PCR
SE
SP
receiver operator characteristic
Registered Persons Data Base
reverse transcriptase polymerase chain reaction
sensitivity
specificity

Appendix 2: Addiction Research Foundation Methadone Clhic (Site
Toronto - 1")
The small number of charts available for abstraction precluded the incorporation of this
site into the chart cohort for evaluation. Similarly, the small sample size prohibits valid
determination of basic statistics of test performance such as sensitivity and specificity.
Nonetheless, these 160 charts provide a descriptive overview of hepatitis C among women from
a methadone clinic. Ninety-nine percent of al1 women from ARF received a diagnosis of "drug
dependence or drug abuse" (E5).
According to the clinic chart, 54% of women in this group had hepatitis C. Studies from
other addiction clinics and young injection drug users also report high prevalence of HCV
infection (85, 86), reinforcing the significance of drug use as a risk factor for acquiring hepatitis
C (2, 17). Although these cases from ARF were excluded in the chart cohort. the diagnostic code
of "drug dependence or drug abuse" (ES) still emerged as a significant predictor of the chart
diagnosis of hepatitis C. If these 160 cases are adCed to the chart cohort, the sensitivity of E5
increases from 23.5% to 33.1% with mild loss in specificity (95.8% to 92.0%) and PPV (65.3%
to 60.8%). The trend toward improved sensitivity and high prevalence of hepatitis C among
drug users suggest that code ES will detect additional cases of hepatitis C in the population,
arguing for the use of [E2 or E5] as the optimal algorithm for assembling a cohort of women
with hepatitis C rather than ES alone. The age distribution of the cases from ARF (site Toronto -
1 O) peaked in the 1960s- reflecting a younger group.

Appendix 3: Ethics Approval Letters
University of Toronto
University Health Network
Centre for Addiction and Mental Health
Hospital for Sick Children

University of Toronto
OFFICE OF RESEARCH SERVICES
PROTOCOL REFERENCE #63 8 1
Dr. Teresa To Hospitai for Sick Children 555 University Ave. Toronto, ON fax: 8 13-5979
Dear Dr. To:
Re: Your rcsearch protowl entitled, "Assembling a Cohort of Women with Hepatitis C in Ontario"
We are writing ta advise you that a Review Cornmittee composed of Dr. 3. Hux and Prof. R. Hutchinson has granted appmvd to the above-named research study.
During the course. of the research, any significant deviations fiorn the approvcd protocol (that is, any dmiatioo which woald lead to an iacrease in riak or a decrcase in benefit to humia rubjccis) andlor any unanticipated developments within the research should be brought to the attention of the Office of Research Services.
, --.
Best wishes for the successful completion of your project.
Yours sincerely,
Tom Fleming Ethics Review Of'Ficer
' \
TF/dn Enclosure
cc: Dr. L- Yeung fax: 8 13-653'1 Hospital for Sick Chîldren Dr. H. O'Brodovich
Simcœ ml, 27 King's College Circle, Room IO4 T o r d 6 Ontario MSS 1 A l Telephome 416/ 946-3389 F u 416/ 965763 enuil tan.flerning8utoConto.ca

Universlb Health Ne twork
[ Ir . I.atifa Ycung I lospital for Sick Children 555 University Avneuc t'iiediat rics Department Black Wing. 8th Floor Toronto, Ontario MSti 1x8
Dear Or. Yeung:
Tlic chart review protocol entitled "Assembling a Cohort of Women with Hepatitis C in Ontario" lias been reviewcd by the University Health Network Research Ethics Board. The proposa1 is appruvrd îrom an ethical standpoint for the next 12 months.
If. during the course of the research, there are any serious adverse events, substantial changes in the approvcd pro~ocol or any new information or developments which must be considered w i h respect to the study. these should be brought to the attention of the Board.
Ronald l-lcslegrave.~h. D. Choir. University Heatth Nctwork Rcscarch Ethics Doard

PROTOCOL REFERENCE #128/2000
September 8,2000
Latifa Yeung, MD, FRCPC Division of Gastroenterology and Nutrition Department of Paediatrics The Hospital for Sick Children 555 University Avenue Toronto, ON MSG 1x8 FAX: 416-813-6531
Dear Dr. Yeung:
Re: Research protocol 1128/2000 entitied "Assembling a cohort of women with Hepatitis C in Ontario" by Dr. Letifa Yeung
We are writing to advise you that the Centre for Addiction and Mental Health Research Ethics Board has granted approval to the above-named research protocol (received August 18,2000).
We understand that consent documents are not applicable. as no subjccts wiii bc contacted.
During the coursc of the research, any significant deviations from the approved protocol (that is, any devlatlod which would lead to an increase in rïsk o r a decrease in benefit to human subjects) a d o r any unanticipated devclopments within the research should be brought to the attention of the Research Ethics Office.
Best wishes for the successful completion of your project.
Yours sincerely,
SUSG Pilon Executive Officer, Research Ethics Board Centre for Addiction and Mental Heatth, ARF site
cc: A. Lmani P. Darby F. Vaccarino P. Garfinkel
J. Simpson
B o t t e r u n d e r s r a n d i r ? ~ , p r e v e n t i o n a n d C a r o
M i e u x c o m p r e n d r e - p r e v e n i r - s o i g n e r
>Ids TOTAL i%E. 02 **

M u Pcrlman M B. BS. F RCP(Lond1. FRCP(C) Staff Neonarologisc Chair. Rescarch Erhics Board Thc Hospital for Sick ChiIdrcn
Profcssor of Pacdiarrics University oiToronco Phone (4 16) 8 13-634015432 Fax (416) 81 3-5245 [email protected]
RESEARCH ETHICS BOARD
May 9,2001
Dr. Latifa Yeung Di vision of Gastroenterology & Nutrition Thc Hospital for Sick Children
Dear Dr. Yeung,
Your study Assembling a Cohort of Womcn with Hepatitis C in Ontario
REB File No. 2000/324
On behalf of the Rcsearch Ethics Board, 1 am writing to provide approval for the abovc noied study until September 200 1.
Yours sincercly
Max Perlrnan Chair, Research Ethics Board

Appendix 4: Feasibility Study: SAS Prograrnming

Feasibility Study
# observations # variables Descript ion 4
Ohip96.sas combos.sas
Original data Added combos 1 - IO Limit to feesufPA Limit to spec 00 13 41 Each line = unique DATE, specialist, combo Added cons (O if seen by fmd, 1 if ever seen by specialist) Cons2, cons3, cons4, cons5, cons6 (= 1 if seen by specialist for combax, O if never) Added tr= total #rimes c o m b per pt Tx>O implies combo assigned at le& once Ti t2 î3 t4 tS t6 t7 t8 Tcons=O means pt only s/b find Tcons>O shows #thes pt saw specialist Tconsx>O shows #times pt saw specialist For corn bar
freq shows # entries per ikn I Work.justîhd 1 358255 1 16 1 385838-358255=27583 (7%) s/b spec 1
+
work.virgrp 385838 29 Vhb vh vc vo vhco Link.sas Viral dx also given liver dx (1 %) u
,
Data. link 385838 28 Work-women 20 1560 28 Limit to female Work.fma1 20 1 560 31 Calculate age in years
Datarefcombo Data.count
c)' wofk.druggrp 12 1 187 36 Dhb dh dc do dhco Drug also given liver dx (3%)
work.virgrp 12 1 187 36 Vhb vb vc vo vbco Viral dx also eiven liver dx ( 1 %)
Drug also given liver dx (5%) L work.druggrp
27583 27583
385838
-b workjustfmd data.rfmal
16 24
Limit to tcons >= 1 (has been s/b spec) Create BïNARY cx
29 Dhb dh dc do dhco
- - - - - - - - .- -, S/b fmd only Has k e n S/b spec
I
114012 7175
3 1 31

This file will read i n OHIP fiscal 96 data for viral hep and liver
biopsy * /
jname data "/&ta8;
i tohip ( start1199604.
urd=199703,
subset=%atr (
if dxcode in: (a0708.8571','573a,a3048,9079a) or
feecode in ('Z5518, a25548) ;
1 , dir=data,
out=ohip96,
keep=ikn servdate feecode dxcode feesuff spec totpaid

libname data '-/datao; / * classify billings into differenc combo
1 . cake original data.ohip96 977041 obs, 7 var 2. form data.ohip96b - lncludes combos 977041 obs 17 var * /
set and feecode in ( ' 2 5 5 1 * . 8 2 5 5 4 ' 1 then combol=l; elsc corrbol=O;
i f dxcode= : * 070' if dxcode=:'571' if dxcode=:'573' if dxcode=:'304' if dxcode=:'079' i f dxcode=:'S71' i f dxcode=:'573' if dxcode=:'304' ~f dxcode=:'079'
run ;
then combo2=1; else combo2=0; then combo3=1; else combo3=0; then combo4=l; else combo4=0: then combo!i=l; eise cornbo5-0; then co;nbo6=l; else combo6=0: and feecode in ('2551'.'2554') then comboï=l; else combo7=0; and teecode in 1'2551'.'2554'1 then comb08=1; elsc combo8=0; and feecode in 1'2551':2554'1 then combo9=1; else combo9=0; and feecode in 1'2551' . 2556' ) then combo10=l; else conbolO~0
proc sort; by ikn feesuff; run;
if feesuff = 'A'; run ;
/ ' rrrajorlty of blllinqs for pertinent codes arc Iirnited to 3 spcc qroups
if spec='00' or spec='13' or spec='Cl'; run;
proc freq data=data.somemd; titlel '3 specialists'; tables spec'combol; tables spec*combo2: tables spec*combo3. tables spec'combo4; tables spec'combo5; tables spec8corrh6; tables spec'combo7; tables spec'combo8; tables spec*combo9; tables spec*combolO; run ; ..***....*..******... * ~ ~ ~ . * * * * * * ~ * . * * * * * * .
proc means sum data=data var combol comb02 combo3 run: / * dropped cornbas 9 and
/ * pick out one ikn and
:::a*?m!L"d:
somemd; cornbal comb05 combo6 c0mb07 ~0mb08:
O since no hits * /
ook ac its data * /
run;
/ ' chus far. haven't removed erroneous duplicace entries ' f
libname data '-/data'; proc sort data=data.somemd:
by ikn servdate cornbol combo2 combo3 comboJ combo5 combo6 combo7 combo8 spec I
escending cotpaid; run;
/ * delece multiple entries for the samc encounter 1.e. each linezunique date/specialist/cornbo the tollowing only deletes subsequent cntries if the listed variables 811 inatch the resulting data.nodb1s has 685929 obs and 17 variables, less entries than i f we rnercly deleted enrries where totpaid<5 * /
by ikn servdate combol combo2 cornbo3 combo4 combo5 combo6 combo7 cornbo8 spec . if first.spec;
run;
/ * let's repeat above counts of combos by spec: similar conclusions * I
proc freq data=data.nodblsi ticlel tables tables tables tables tables tables tabler, tables run ;
' each line = unique DATE, specialisc, combo ' ; spec*combal; spec'combo2; spec'cornbo3 ; spec'combo4; spec 'combo5; spec'combo6; specgcombo7; specgcombo8;
1' kecp spec: cons=O =only seen hy fmd; cons>l i f ever seen by inL med/CI ' I
set ~f spcc='l3' or spec='ClP then cons-1; clse cons=O;
run;
/ ' pick out the combos 2-6 which are associatcd wlth a specialist wliere consx=l means combox vas associated with a specialist data.nodbls now has 685929 obs with 24 vars * /
data set - data no if (combo2rO and cons>O) then cons2=1; else cons2=0; if (combo3>0 and cons>Ol then cons3=l; else cons3=0; i f Icomba4>0 and cons>0) then cons(=l; else cons4=0; if (combo5>0 and cons>O) then cons5=l; else cons5=0; if (combo6>0 and cons>O) then cons6=1; else cons6=0;
run ;
/ ' next step vil1 yield the SMALLEST DATASET so far oneikn shrinks datasec so each line = one Ikn

t x : total #cimes a combo was assiqned to a patient tx >O represents thac a given coinbo was assiyned nt loast once CO that patient
no frepuency of visits noted, since ihis info difficult to interpret
ccons=O means patient only seen by FW tcons>O shows ltimes patient saw a specialist l m t medlliverl tconsw0 shows #cimes patlent saw a specialisc for combox
data.oneikn has 385383 obs and 16 vars -frep_ will represenc @separate entries per ikn * I
proc means sum noprint data=daca.nodbls: by ikn; var cornbol combo2 combo3 comboC combo5 combo6 combo7 combo8 cons cons2 cons3 con s4 cons5 cons6; output out=data.oneikn sum=tl c2 cl t4 CS t6 c7 cB ccons tcons2 ccons3 cconsl tcons5 ccoris6;
drop -type-; run;
/ ' re-surmrrarize daca. now that each line = one ikn calculate cotal tlmes combos are hit will see thac combos 6 6 7 lother viral h drugi still most popular . . . m y b e should limrc these to codes only to specialiscs? KEEP IN MIND . . . ' I
libname data '-/data'; proc means sum data=data.onelkn; var cl c2 el t4 tS c8 cl t8 ccons2 tcons3 tcons4 tcons5 tcons6; titlel ' A . 0times a combo vas invoked amongst. Our patlents Leach line=l ikn)'; run; ..,..................................ri.,
I' hou much redundancy in Che syscem? That is. if seen by f d and then also by specialist then can restrtict CO specialisf entries. i . e . ASSUHE chat any casas of hep C get reterred for consultation find chat justfmd had 358255 obs and 16 vars i.e. 385383-358255=27128 I 1 t I pts seen by specialist which STILL gives a lot of hics. much more chan 1200 women ' I
data p; set a.oneikn: il tcons=O;
run; proc means swn dara=3ustfmd; var tl t2 t3 t4 c5 t6 c7 t8 tcons2 tcons3 ccons4 tcons5 tcons6; titlel ' B. cotal ltimes a combo vas invoked amongst patients seen only by FMD'; N n i
I' ao reasonable lop~ionall to only care ~f combos2-6 are from specialists create data.rcfcombo which 3 data.oneikn wlrefined combos (2-6 ONLY from spec
ialists) note: tconsx no longer =O ' i
if ccons >= 1;
run;
proc means sum data=data.refcombo; var tl t2 t3 t4 t5 c6 t7 t a ccons2 tcons3 tcons4 wons5 tcons6; ciclel * C. total Itimes a combo was invoked amongst patients NOT seen only by I MD' ; run:
1' above 'sum' will total ALL entries. NOT counc them cx refers to (at least one d x j of combox for chat patient daca count = s w r y data for refcombo, where cx is BINARY ' 1
daca m; sec data.refcombo;
if c1>0 then cl=l; else c1=0; i f t2>0 then ~2.1; else ~2.0; i f t3>0 chen ~3.1; else ~3.0; i f t4>0 then ~4.1: else cC=O; i f t5>0 then ~5.1; else CS-O. i f cl>O then c6-1; elce ~6.0; i f c7>0 then ~7.1; else ~ 7 x 0 ; ~f tB>O chen cB=l; else cB=O; run;
proc means sum daca=data.count; var cl c? c3 c4 CS c6 cl c8 ; titlel ' D. count #cimes a combo occurred for an ~ k n ' ; run;
I ' what if we DIDN'T refine combos 2-6 and included fd-related combos 2-6? repeat above WITHOUT refined combos 1.e. stick wich oneikn given che 2190 viral heps pulled IWITHOU'P refined codes! this looks betcer ' ,
data set d m
if tl>0 then cl=l; else cl-O; if t2>O chen ~2.1; else c2=O; if t3>0 then ~3.1; elae ~3.0; if t4r0 chen c4=li else c4-O; if t5>0 then ~5.1; else cS=9; if t6>0 then ~6.1; else ~6.0; i t t7,O then ~7.1; else c7=0; i f ter0 then cB=l; else cB=O; run;
proc means sum dacaadata.ctoneikn, var cl c2 c3 c4 CS c6 c7 c8 I
titlel ' E. count atimes a combo occurred for an ikn - NO REFINED COHBOÇ ' ; run:
1' How m n y drug addicts were also describeil as 070. 511, 573, or had LBx? count aikn's with 304 who also had 070, 571. 573. or Lbx $ 1
data set data.ctoneikn; i f tS>O and clzO chen dhb = 1; else dhb.0. i f tS>O and t?>O then dh c 1 ; else dh=O; i f t5>0 and t3>0 then dc = 1 ; else dc=O:

u C C C C U U 0 0 1 h ZCCC O

libname data '-/data';
r~ ~~ - keev ikn sex bdate - t r e ~ tl i2. t3 t4 c 5 1 6 t7 t8 tcons tcons2 tcons3 tcons4 t
cons5 tcons6 cl c2 cl c4 CS c6 c7 c8 dthdate dch; by ikn: if inl; run;
f ' limit to women œ h a s 201560 obs and 28 varç * /
data uomen; set data.link: if sex='P':
run:
/ * need to limit dataset C O thoçe aged<50y on Jan 1. 1991 Ii.e. DOB AFTER OlJANl 94 11
and those aged z15y on Dec 31. 1999 li.e. DOB BEFORE 31DEC1980)
set today = latest date allowed. 31DEC1984 ' I
set wo today = iridy112.31,19841 :
age=floor(lintck14month'.bdate.todayl - tdayItoday~*daylMatel)ll2)1: / ' gives age in months * i
1' gives age in yeùrs ' 1
run:
1 . data.fin2039 = fernales aged 20-39y from ctoneikn 92771 obs 31 vars d~fference of 28416 womcn compared to final 115-49y)
' 1 proc sort data=data.fin2039: by Mate:
run:
i f yragec 4 4 and yrage>O; :un;
/ ' data.fina1 represents temales aged 15-49y from ctoneikn 121187 obs 31 vars * I
proc sort data=data.final: by bdate;
run ;
/ * limit to aged 20-39y (rather than 15-49yl need to limit dataset to those agedc4ùy on Jan 1 , 1991 1i.e. DOB AFTEH OlJANl
9501 and those aged >20y on Dec 3 1 . 1999 1i.e. DO0 BEFORE 31DEC19791
set today = latest date allowed, 31DEC1979 * / - set
if yragog J O and yrapei0;

w v v v v - - r n c v 0 0 0 0 0
a n n n n 5 . m
o z z r z x n a m m m r o m 3 3 3 3
-- - a nCIw C. WI n 3 m ID n I1 VI m u .
m 0 4 4 w 4 m * q w w W I n

proc means sum datazdata rf inal;
var cl c2 c3 c4 C S c6 c7 CS; titlel 'counc #cimes a combo occurred for an ikn - thesc arc reflned combos ' ; run :
1' comparing p7 wlth pl irefined combos vs. notl using refined combos i=only speciallsts coding codes 2-6 m t t c r ; other codes are only coded by specialists anyuayl still cZ..c6 y i e l d s ~ c o d e s ! ! llYuch more than expccted 1200 hep C cascsl
7p'y BUT to restrict only O pecialists would assume that al1 codes are pretty accur a t e , and would HISS cases of hep C seen only by FM and not specialist
So no restriction for now. but keep in mind for later the possibility of limitin Q c2-c6 only to specialists . /

Appendix 5: Testing of Code Accuracy: SAS Programming

Flowcbart of Programming
' Dataset Data.pull
Data.com bop
Keep if feecode=A / exclude B, C Keep if spec = 00, l3,4l Delete multiple entries using some encounter (sarne IKN servdate corn bo 1. . . combo 1 1 ) introduce cons, cons2..cons6, cons Il (O=never seen by specialisthon-FMD) Each line = ikn Ccombox = tx Cconsx = tconsx
#var 9
#obs 5,586,450
Data-noAp Data.somemdp Nodblesp
description from OHIP 1995-2000
5,586,450
1 1,533,3 19 1 18 1 Limits to cases where tcons=O (never s/b specialist) 1
5,582,395 4,55597 1 4,019,526
Datare fcom bop 104,065
Data-countp 104,065
4 ( Da@-etoneiknp 1 1,637,384 1 27 1 All codes kept (no limit to specialirts), counted i
I
20
20 20 20
1 ( L * I V ~ W P P 1 1,637,384 ( 33 1 Considers viral dx -+ liver dx overlap (3%) 1
apply cornbos 1-1 1 to represent algorithm
1 8
27
Reîined combos Limits to cases s/b specialists (at least once) BINARY cr (If tx>O then CF 1)
Datalinkp - 1,637,384 Womenp 859,229
k Work.tinaip 859,229 34 Catc yrage
1 Data-core* 6 1 2532 1 32 1 Cold std + test topethcr!! -* 1
I 3 1
Dahfinalp
Linked with rpdb Female only
vaiidikn. sas
521,750
+ Work.agegrps 2532 9 Added agegrps variable :in Dataset Data.cleanedy Data-validikn
95OOfmal1549.sas
# observations 2548 2532
X variables 8 8
Calc boxes "A/B/e for each test '
code (e.g. totc2A = box A for combo 2) Calculate test characteristics
34
+ + + +
Description Original dataset fkom D. Deboer Eliminated invalid ikn
59
Varies
+ Work.calculate
+ Work.calctble
Aged 15-49
2532
Varies by site
Dmggrpp Virgrpp justfmd rfinalp
dmg use + liver dx overlap (6%) viral dx + Iiver dx overlap (3%) tcons=O Tcons>O
52 1,750 52 1,750 493,570 28,180
40 40 34 34

/ * This file will read ln OHIP data
Jan 1 , 1995 - narch 31, 2000 chcodes 070 viral hep 571 clrrhosis of liver 573 other diseases of liver 304 durg dependence, drug addict ion 079 other viral diseases
f eecodes 2551 liver biopsy 2554 liver biopsy K026 OHCAP K027 OHCAP ' /
libname data '-/data';
9getohipl scart=199501. end=200003, subset=tstrf
if dxcode in: ( ' 0 7 0 ' , ' 5 7 1 ' , ' 5 7 3 ' , ' 3 0 4 ' , ' 0 7 9 ' ) or feecode in ('2551'.'2554','K026','K027');
1 , dir=data, out=pull, keep=ikn servdatc feecodc dxcode feesuff spec totpald
v physnurn 1 ;

.A
VI .4 d
a .- U w P D
a
P u .YI a -4 + P) a l4 .. 4 O
Y a a u1 c Y a A S 4 Y .4
g 3 ? ~ u a
N al > Y
VI 4 - O 4 -
2 gr: O V I Y U V ) -
4 2
f V I 1 " a n Y
3 O 3 x w O O N
X E 2 v o - -rr U O
O C 1, L, a
u 3 U E Z C1 P" 9 II a
X VI
: ag O U O Y c al - "L. a C a l 0
230 . . .
VI c 2 Y A u
O u - a al
U c al w a m
c A." n
VI U O c
O e U W u
% .4
o u
V I A d.-.
C a 3 * 0 al u > al > - O O P a u U r . a w m a al u * O
VI C
- Q Y c w -4 4- . . . .
* .... .. .. - -- ..--.-O.-, Y ~ , . , m l V I . m ~ m m a -
~ ~ ~ m ~ @ & Z ! 4 0 0 0 0 0 0 0 0 0 0 0
Y U u U U u U u U O ~ u y m . . . . . . . . . ~ U U u u u u O U O U u A X E E P X E ~ E ~ Z . n m w a w m w m w n ~ ?

O 0 0 0 0 0 0 0 0 n . . . A A A * A * A M -NCI. ,U1WCLP- U ~ u u Y c l u u u
U U U U U U U W Y .- -, * 4 .d .., .4 r d
0 0 0 0 0 0 A A e A A A
-.NP7-,V)V> Y Y Y Y Y Y
.4 VI r( Y
4 VI u .- VI-

run ;
proc means 6um data=data.ctoneiknp. var cl c2 c3 cd C S c6 c7 c0 cl1 : titlsl ' count ltirnes a comba occurred for an ikn - NO REFINED COHBOS ' : run;
/ * How mr.y drug addicts werc alsa descrlbed as 070, 571, 573. or had LBx or OHC A??
count l ikn's with 304 who also had 070. 571. 573. or Lbx or OHCAP ' I
%a&%%hnp; il r5>0 and c1>0 then dhb = 1; else dhb=O; i f t5,O and t2>0 then dh = 1: else dh.0: l f t5>0 and r3>0 then dc = 1: else dc=O. I L tS>0 and tP>O thin do = 1; e l se do=0; if t5,D and tllrO then dp=l ; else dp-O; i f t5>0 and lt2>0 or c3>0 or t4zO or tllzOl
then dall=l; else dall=O: tun;
proc means sum data=druggrgp; var dhb âh dc do dp dall ; run;
1'304 with 070 and Lbx . . . = 500 hics, out of 266032 entries of 304 304 wich 070 . . . 15908 304 wlch 571 . . . 3525 JO4 wlth 571 . . . 5162 304 w i t h OHCAP. . . 174 104 with any . . . 20419 (BCI
89 of 304 drug users get subsecruent -1iver- diaqnosia/follo~up code 304 icomtm51 targets largcly FKD drug uslng hepC grolrp o t h e r codes rrwy B
15s ' 1
/ ' Hou many other vlrals werc also dsscribcd as 070. 571, 573. or had ].Lx o r OHC A P ?
count tikn's with 079 who alsc had 070, 571. 573. or Lbx or OHCAP ' 4 daca vir rpp s e t d&elkop* if c6>0 and t1>0 then vhb = 1: elsc vhb.0, i f t630 and t2rO then vh = 1; else vh-O: i f t6,O and ~ 3 z 0 then vc = 1: else vc=O. i f t6>O and t4rO thcn va = 1; else vo.0; i f t6s0 and t 1 1 4 then vpa 1; else vp=O; i f t 6 1 0 and (t2>0 or t3>0 or t4>O or tll.Ol chan vaIl-1; else vall=O;
run;
proc means sum drcawirgrpp; var vhb vh vc vo vp vall; run;
079 u l t h 573 . . . 7363 hitr 079 with OHCAP . . . 93 hits 079 with any . . .30922 hits ( 3 4 1 Only 3@ of 079 other virals pot 'livcr' diagnos~e/followup code 079 Icombo6) largely FHD rho rmy code hepC as other viral d i s e a s s orher ct
des may miss * /
/*O79 with 070 and Lbx . . . got 438 hits, out of 1178488 encries of 079 079 with 070 . . . 24564 h i c 5 079 wich 571 . . . 2947 hits
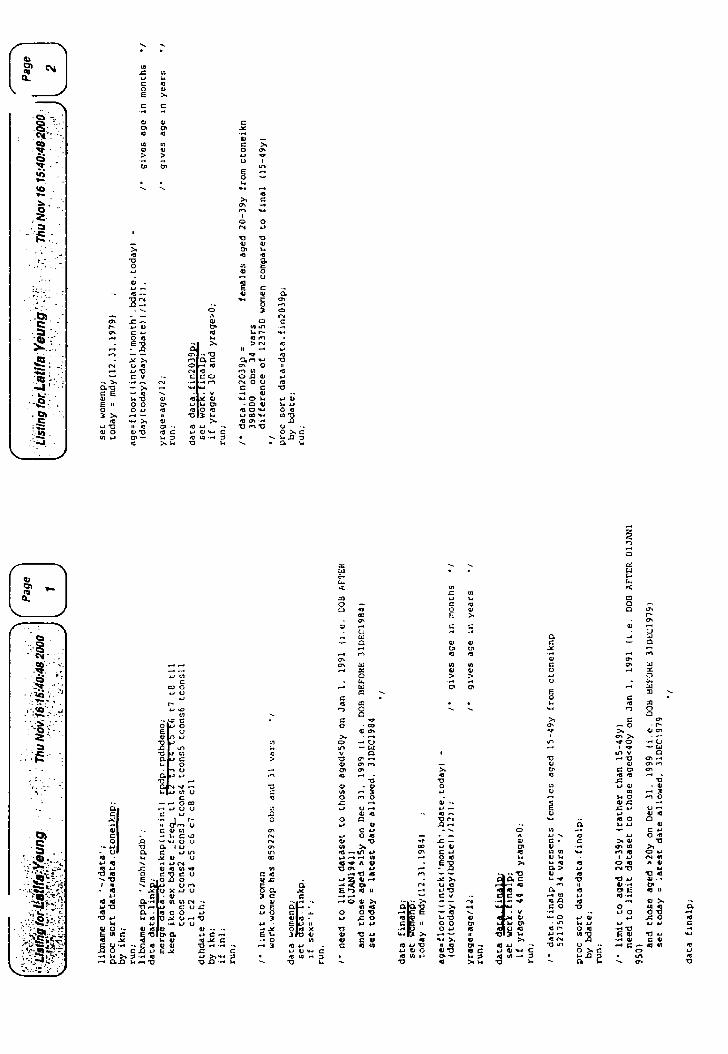
U E r n : 2 Q C
1 ln -- L C W 4- .
, t 2 2 2 r?
a m "4 - 0 ; n m 5 O P U Y N O U a C C U .r U .. '-OL d o
- O W * U 4 0 - 0 1 urn*. am-.. " 2 u-TJ u --
0 X C . .La2 . . a L

L
,- X -n -4
VI X c- O c u O Y
C w a l VI O C YI
UÉ; Ln
Z VI n c u O C U O u ..(
Y Q I YI a O Y U YI
Y m C ri 0
VI E C a
U Q Y w
x N O
VI > C C 0 --. U .- Y VI
a 5 d.4 3 Ir( 5 - O
w-9 L i u 0
u m c Y U Q
P r o n n u * 4 C Y Ln .A 4 Y Y
rn * - 5 u: m o u
ci O VI Y
C e 4 a u - w & - -
u O u + O k U b4 m - D > U
F.
X C1 2
u n s
i o. n. 4 U
q "7 L. r- O fi a - < - U P Z
rri O . -
O * C r- o m VI - 4 -
t- u-
U n - .- O 4 ,- U O VI
al u u 0 C
.n O - L7 a - . U a 1 0 U S 3 3
V I * Y O U-.
- 4
4 .., O Y
"l U Y
2 .4 Y VI al h U d .4
2 - VI 0 n
w c - O - .. Y 2. Y U w n VI 1
C o -
. "2 a VI - ., Y 4
VIS A
-0 VI-
-E O I I U d 0 0 ou> m m m. FI
S m U m
x - U V I . u X U U

l * count total rpatients hit with given combos - only refined combos * / proc mcans sum data=data.rfinalp;
var cl c2 123 c4 CS c6 c7 c8 cll; titlel 'count rtimes a combo occurred for an lkn - these are refined combos ' ; run;
t g comparing pzwith pl (refined coinbas vs. not) using rcfined combos (=only specialists coding codes 2 - 6 , 1 1 matter; other codes only coded by specialists anywayl still cZ..c6.cll ylelds =codes!! {Much more than expected 1 2 0 0 x 6 ~ hep C ca ses i
2q 7% BUT to restrlct only co spcctallsts would assume that al1 codes arc pretty accur ate. and would MISS cases of hep C seeii only by FMIi and not specialist
So no restriction for now, but kcep in mind f o r later t h e possibility of 1irn:cin Ll c 2 - ~ 6 . ~ 1 1 only co special~srs - /

................................................. Starc w i t h data sec from D.Deboer 1. eliminate invalid IKN's 2. s-rire resulting dataset 3 . link wich iarger OHIP dataset of combos data.finalp
.................................................... libname data '-/data'. proc contents data=daca.cleanedy; ruIl;
data data.validikn; set data.cleanedy; i f valikn * ' V ' ;
run;
proc means range min max n data=data.validlkii; vdr by bd cond bdate; run:
proc sort; by site Ik;
run;
proc freq data=data.validikn; tables cond'sita;
nin ;
data agegrps; set data.validikn,
if by ~ 5 0 rhen agegrp = 4 , x f by <60 and by r49 then agegrp = 5; if by ~ 1 0 and by 159 rhen agegrp a 6, if by <80 and by r69 then agegrp = 7; l f by <86 and by >79 then agegrp = 8 ; run;
proc frep data=agegrps; tables cond'ageprp; run;
proc freq daca=agegrps; rables si te'cond'aqegrp: run;
proc sort data=data.validikn; by ikn M a t e ; run; proc sort daca=data.finalp; by ikn M a t e ; run ;
proc contents data=data.finalp; run ;
Iiere we 1 ink. . . ..*..*...............*............../
data data.core; merge data.validikn(in=inlI data.finalp; keep ikn cond site M a r e
cl c2 t3 t4 c5 c6 t7 c8 cil tcons tcons2 tcons3 tconsl tcons5 tcons6 tconsll
cl c2 c 3 c4 c5 c6 c7 c0 cl1 dthdate dth yrage ;
by ikn ;
I I inl; run;
S u m r i z e new dataset (sirnilar to 9500f1na11549.sas1 ..*.......................**.......*/ /..........'...................I..........'...'..'............'......*...
tiow many dru0 addicts had othcr dx? .................................... 1 data drggrp; set data.core;
i f t 5 ~ 0 and t1>0 chen dhb = l , else dhb=O; i f t5r0 and t2rO then dh s i : else dh 90. if tSz0 and t3s0 then dc = l a clse dc *O; if t5>0 and td>O chcn do 2 1 : else do =O; if t520 and tllzO then dp 31; elsc dp =O; if c5>0 and (t2>O or t3>0 or t4>O or tll>Ol then dall-1: else dall=O:
run;
proc means sum data=drggrp; var dhb dh dc do dall: run;
/..................*................. 238/2532 drug addicts have othec dx 1901 ..................................... /..........................*......... How many vlrals had other dx? .................................... 1
data virgrp; set data.core;
if t6>O and t1>0 chen vhb = 1 ; else vhb=O; if cGsO and t2>0 then vh = l . eise vh = O . i f t6>O and t3>0 then vc = l ; else vc =O; i f t620 and t4,O chen va = I ; elsc vo =O; i f t6>O and t11>0 then vp a l : else vp =O; i f t62O and Lt2,O or 23>0 or t420 or tllzOl rhcn vall.1; elsc va!l=O;
run;
Proc means sum data=virgrp; var vhb vh vc vo vall; run;

. . . . . . . . . . . - . . - . . V I .
: 2 : . m . ne . 0. . .d .
: n: L,.
Q I m 5. . -4 . . C(. . . 0 .
: m: . Y. . - . C . . 0 .
: =': . m . . - .
. . . . . . . . . . . . . . . . . . . . P. . . a. - r. . I... . . X *
: ":
4
r: . ry -. . d . . . . Ln.
- 0 . .o. . Ln. . . . .,. i 2: . . . . . -- . . -. .
m . . U . . -4 . c. . . 4 . . u. . .

nov repeat site analysis on J+U+C lspecialists onlyl; ................................................. Site JMC -results comparable to al1 sites data (lose 160 patients) .................................................. I libname data '-/data'; data calculate ; set data.com ; if site in ('J'.'H'.'C'); if cond=l and cl.1 then clA=l; else clA=O; if cond=l and c2=1 then c2A=l; else c2A.O; if cond=l and cI=l then c3A.1; else c3A.0; i f cond=l and c4.1 then c4A-1; else cdA.0: if cond.1 and c5=1 then c5A.l: else c5A=0. if cand=l and c6=1 then c6A.1; else cbA=O; if cond.1 and c7.1 then c7A.1: else c7A=O; i f cond=l and cB=l then cBA=l, else cBA.5; i f cond.1 and cll=l then cllA.1; else cllA=O, i f condal and cl NE 1 then clB=l; else clB.0; i f cond=l and c2 NE 1 then c 2 B = 1 : else cZB=O; i f cond=l and cl NE 1 then c3B=1; else ~38.0; i € cond=l and c4 NE 1 then c4B.l; else c4B.O; ~f conda1 and c5 NE 1 then ~58.1; else cSB=O; if cond=l and c6 NE 1 then ~68.1; else c6B=0; i f cond.1 and c7 NE 1 then c7B=1; else c7B.0; i f condal and ce NE 1 then c0ik1; else cBB=O; I f cond.1 and cl1 NE 1 then cllB-1; else cllB=O; if cond=O and cl=l then clC=l; elçe clC=O; i f cond.0 and c2:l then c2C=l; else c2C.O; i f cond.0 and c3=1 then c3C=1; else c3C.0; a f cond=O and c4.l then c4C-1; elçe c4C=O; ~f cond.0 andc5-1 then c5C=1: else c5C-0; if cond.0 and c6=l then c6C.1; else c6C=O; if cond.0 and c7=1 then c7C-1; else c7C.O; if cond.0 and cB-l then cBC=l; else c0C=O; if cond=O and cll=l then cllC=l; else cllC=O;
N n ;
proc means sum data=calculate noprint; var clA clB clC
c2A c2B c2C c3A c3B c3C c4A c4B c4C c5A c58 c5C c6A c60 c6C c7A c70 c7C c8A c80 cBC cllA cl10 cllC
output out=calctble sum=Al 81 Cl
A 2 B2 C2 A3 83 C3 A4 84 CO A5 BS C5 A6 B6 C6 A7 87 C7 AB Ba CB Al1 Dl1 Cl1
run; proc print data=calctble; titlel 'site=JCM'; run;
data calctblei set calctble; combo=l; A=Al; 8-01; C=C1: output; combo=2; A=A2i B=B2r C=C2; output; combo=3: A=A3; B=B3: C=C3; OuCput; combo-4; A=A4; 8 ~ 8 4 ; C-Cd; Output; combo=5; A=A5i b05; C=C5; Output; combo=b; A=A6; B=B6; C=C6; output; comb0=7; A=A7; B=B7; C=C7; Output; combo=l; A=AB; B=B8; CcC8: output; combo=11: A=All; B=till; C=Cll; output; drop -type- -freq- Al A2 A3 A4 A5 n6 A7 A8 Al1
BI 82 83 BO R5 86 87 BB 811 Cl C2 C3 CC C5 C6 C7 CB C11;
run. data calctble;
set calctble; NO= 2372; D = NO-A-B-Ci TP n AINO; FN = BINO; FP - CINO; TN a DINO; P = TPtFN; PZ = FP+TN; Q = TP*FP; QZ = FN+TNi SP = TNIPZ; VARSP = (SP* (1-SPI I / (NO'PZ); ULSP = SP + 1,96*sqrt(VARSPl i LLSP = SP - 1.96.sqrt (VARSPI : SE = TPIP; VARSE = (SE* (]-SEI I /(NO0P) ; ULSE = SE + 1.96*aqrclVARSE); LLSE = SE - 1.96*sqrtLVARSEJ; PPV = TP/Q; VARPPV= (PPV* (1-PPV) 1 I (NO'OJ ; ULPPV= PPV* 1.96'sqrt (VARPPVI ; LLPPv= PPV- 1. 96'sqrt IVRRPPVI ; NPV = TNIQZ; VARNDV=INPVgI1-NPV) )I(NO*QZ); ULNPV= NPV* 1.96'sqrt lVARNPV) ; LLNPV= NPV- 1.96.sqrtlV;iRNPV); EFF=TP*TN; KlO= ISE-Q) IQZ; K00= (SP-QZ11Q; P02P.Q; PQZ=r'2'r'O. KSzIEFF-PO-POZJI(1-PO-POLI; VARKS; fK5'(1-K5I 1 /NO; ULk5= k5 . 1,96'tqrt(VARK51, LLkS- k5 - 1,96'sqrtiVARK5); OH=KlO/KOO; run;

proc print; run; ....................................... L......... Limit test=l to pts wlmorc than once for any code - 2372 obs kept ................................................... data mltcode;
set data.core; if site in {'J','n1;C'); if condil and tl>l then c1A:l; else clA=O; if cond.1 and t2>1 then c2A.l; else c2A=0; if cond.1 and t3>1 thcn c3A.1; elso c3A.O; if cond=l and t4>1 then c4Aal; else c4A.O; i f cond.1 and t5zl then cSA=l; else c5A.0; i f cond.1 and t621 then c6A.l; else c6A.O; i f cond=l and r7>1 then c7A.l; else c7A=0; i f condtl and t 8 ~ 1 chen cBA.1; else cEA=O; ;f cond=l and t l l ~ l then cllA.1; else cllA.0; if condel and tl notrl then clB=l; else clB=O; if condnl and t2 notrl thcn cZB=l; else c2B=O; if cond.1 and t3 not>l then c3B=1; else c3B-0; if cond=l and t4 nota1 then c48=li else c48=0; if cond.1 and t5 n o t ~ l chen c5B.l; else c5B.O; if cond=l and r6 noc>l then c6B-1; elte c6B=01 i f cond=l and t7 notrl then c?B=i; elsc c7B=0; if cond.1 and c8 noczl then c8B.l; else c8B=O; z f cond=l and tll notrl then cllB=l; else cllB=O; if cond.0 and tl>l then clC-1; else clC=O; i f cond.0 and c2>1 then c2C=\; else cZC=O; if cond.0 and t 3 ~ 1 then c3C.1; else c3C=O; i f cond.0 and t4zl then c4C.1; else c4C.0; if cond.0 and t5>1 then cSC=l; else c5C.O; i f cond=O and t 6 ~ l then c6C=1; else c6C.O; i f cond.0 and t7>1 then c7C=1; else c7C-O: i f cond=O and tErl then cRC=l; else c8C=O; i f cond.0 and tllzl rhen cllC=l; else cllC=O;
runi
proc rneans sum data=multcode noprlnt; var clA cl8 clC
c2A c2B c2C c3A c3B c3C c4A c4B c4C c5A c5B c5C c6A c6B c6C c7A c7B c7C cBA cBB c8C cllA cllB cllC
output out=calctble surn=Al 81 Cl
A2 82 C2 A3 03 C3 A4 8 4 C4
run; proc print data=calctble; ticlel +site=JCn - demand given code entered ~ 1 ' ; run;
data calctble; set calctble; combo=l; A=A1; k R 1 ; C-Cl; output; combo=2; A=A2i 8.82; C=C2; output; combo=3; ArP.3) 8x831 C=C3; Output; comba=d; A d 4 1 8-04; CeC4; output; combo=5: A=A5; 0185; CzCS: output; combo=6; AnA6; B=B6; C=C6: output; combo=7; A=A7; b B 7 ; C=C7; output; combo=8; A-AB; B=BB; C=C8; outpot; combo-11; A=A114 0.811; CaC11; output; drap -type- - f r e ~ Al A2 A3 A4 A5 A6 A7 A8 ~ l l
01 02 83 04 85 86 87 BB 011 Cl C2 C3 C4 C5 C6 Cl CE C11;
run ; data calctble;
set calctble; NO= U = NO-A-8°C; 2372;
TP = AINO; FN = B/NO; FP = CINO; TN = DINO; P = TPIFN; PZ = FP*TN; Q = TP*FP: OZ = FN+TN; SP = TN/PZ; VARSP = ISP'Il-SPI)/INO'PZI; VLSP = SP t 1.96*sqrtlVARSPI; LLSP = SP - 1.96'sart lVARSPl; SE = TP/P; VARSE = (SE'(1-SE))/lNO'P); ULSE = SE * 1.96*sqrt(VARSEI; LLSE = SE - 1.96*sqrt~VARSEI; PPV = TPIQ; VARPPV=(PPV'(l-PPV)l/(NO*QI; ULPPVz PPVI 1.96*sqrt(VARPPVI; LLPPV. PPV- 1.96*sqrclVARPPVI. NPV = TN1Q2; VARNPV= (NPV* (1-NPV) 1 / INO'QZ) ;
ULNPV= NPV* 1.96*sqrtlVARNPVj; LLNPV. NPV- 1.96*sqrtlVARNPVI; EFF=TP+TN: KlO=ISE-Q)/QZ; KOO:(SP-Q211Q; PO-P'Q; Poz=Pz'Pa; K5u(EFF-PQ-PQZ\l(l-PQ-PQZ\; VARXS=(K5'Il-K5)I/NO; ULkSc k5 a 1.96*sqrtIVARKS); LLki= k5 - 1.96'sqrt(VARKSI; OA=KlO/KOO; run;

5 now repeat site analysis on J*M*C (specialists only); * last revised : May 15/01 - added details to genmod; /................................................ Site JHC -results comparable to al1 sites data llose 160 patients)
need CO flag whether patient ever had LBx left with cornboa 2. 3, 4, 5. 6 ./- LBx .................................................. 1 libname data '-/datai; daca calculate ; set data.core ; if site in ('J'.'M'.'C'l: if c 1 ~ 0 or CIDO or c 8 ~ O then LBx-1: clse LDx=O; run;
proc Nn; proc un; proc un; proc un; proc un; proc un; proc a n ; proc mi proc m; proc N n ;
genmod; model cond s c2 c3 c4 c5 c6 Lbx / dist=binomial link=loglt typc3;
genmod; model cond = c2 / disc=binomial link=logit cype3 ;
qenmod; model cond = c3 / dist=binomial liiik=logit type3;
genmod; rnodel cond = c4 1 disc=binomial link=logit type3;
genmod; model cond = c5 J distcbinomial link=logic typel:
qenmod; modcl cond = c6 / disttbinomial link=logit type3;
genmod; mode1 cond = c2 Lbx / dist=binomial linkalogic type);
genmod; mode1 cond = c3 Lbx 1 disc=binomial link=logit type];
genmod; model cond = c4 Lbx / dist=binomial link=logit type3;
genmod; model cond = CS Lbx / dist=binomial linkalogit type3;
proc genmod; model cond = c6 Lbx / dist=binomial link=logit type3; m n ;
proc genmod; runi proc genmod; un ; proc genmod; n; proc genrnod; un; proc genmod; un; proc genmod; un; proc genmod; runi proc genmod; run; proc genmod; run; proc genmod; run ; proc genmod; nin:
model cond = t2
model cond = t2
model cond = t3
mode1 cond = t4
model cond = t5
model cond : t6
model cond z t2
rnodel cond = t3
model cond = t4
model cond = t5
rnodel cond = c b
t3 c4 t5 c6 Lbx / dist=binomial link=logit cype3;
/ d1st:binomial link=logic cype3; r
1 dist=binomial link=logit type3:
1 dist=binomial link=logic type3.
/ dist=binomlal lirik=logic type3.
Lbx 1 dist~binomial link-logit typc3,
Lbx / dist=binomial link=logi~ t y p e 3
Lbx 1 dist=binom~al link=logic typc3:
Lbx 1 dist-binomial link=iogic type3.
/........................*....................... Cornparison of c vs. t variables show better LL with c's c3 and c4 NS in complete rnodel try sirnplifying model .................................................. / proc genmod; model cond = c2 c4 CS CS Lbx / dist=binomial link=logit type); rut
proc genmod; model cond = c2 CS c6 Lbx / dist=binomial linkzlogit type3; run; proc genmod; model cond = c2 c5 c6 / disc=binornial linkslogit type3; run; proc genmod; model cond = c2 CS / dist=binomial link=logit cype3; run; proc genmod; model cond = c2 c5 LBx 1 dist=binomlal link=logit type3; r u ;
/............".'......................*......... Locus on combos 1.2, 5! .................................................. 1 daca calculate; set calculate;
i f cond.1 and cl.1 thcn clA=l. else clA.0; i f cond.1 nnd c2=1 then c2A.l; else c2A=O: i f cond=l and c5=1 chen cSA=l; else c5A=O; if cond.1 and cl NE 1 chen clBel; else clB=O: if cond.1 and c2 NE 1 then c2B=l; else c2B.0; i f cond=l and CS NE 1 then c5D=1; else c58=0: if cond:Q and ci=l rhen cLC.1; else clC=Oi i f cond=O and c2.l then c2C.1; else c2C-O: if cond.0 and c5.1 then c5C.1; else cSC.0;
/......................**.********............... Create new combo combinations! combo 15n= combol AND comSo5 aka combo 151 combo 15r= combol OR combo5 152 combo 25n= combo2 AND combo5 251 combo 25r= cornbol OR combo5 252 .................................................. / if cl=! and c5.1 then cl5n.l; else c15n=0; i f cl=l or cS=i then ~ 1 5 ~ ~ 1 ; else cl5r=0; if c2=1 and c5=1 chen c25n=1; else c25ii=0; if c2.1 or cS=l then c25r=l; else c25r.O;
if cond=l and cl5n=l then clSnA=l; else cl5nA=O; if cond.1 and c15r=1 chen clSrA=l; else clSrA=O; if cond.1 and c25n.1 then c25nA=i; else c25nA=O; if cond.1 and c25r:l then c25rA.l: else c25rA=0;
if cond=l and c15n NE 1 chen c15nB=1: else c15nB=0; i f cond.1 and c15r NE 1 then c15rB=1; else cl5rB=O; i f cond=l and c25n NE 1 chrn c25nB=l; else c25nB=O; if condcl and c25r NE 1 then c?5r9=1; clse c25rB=0;
i f cond.0 and c15n-1 then cl5nC.l; else clSnC=O; l t cond.0 and c15r;l then clSrC=l; else clSrC=O; i f cond-0 and c25n.1 then c2SnC:l; else c25nCnO; if cond.0 and c25r.l then c25rC.l; else cZSrC=O;
run i
proc mearis sum data=calcuiate noprinc:

-hL. - 0 . - 5 w t i D a.. . z w -
1 m m
U U U U C h C i v rmmm 4 d N N U U U U
m m m m C k C * mrnmin 4 4 N N U U U U
3 2 2 5 m m m m - - N N U U U U
* L i * inmrn N N N 4 m u C C C inmm NNN 4 m U
........ C I C * "lrnYl.nNNN 4 - N r y 4 m u m m m m II II Il . 4 A A
m m m m a m o
CI .- - 0 9 -- 4 " a u Y " A m ...... u a .- i 0 0 0 . - . U N 4 S Z Z 4 Pl... o ~ n 0 4 m U
U N 2 .. 4 YI II II " s u ii t i
.... -- -- W W - w u 7
"2% & > > 2,, .Li& - w u - w w W.. UIwiO I m m 4 . . -44

References
1. Canadian Association for Smdy of the Liver (CASL) Consensus Conference Rapporteur
Group. Canadian Consensus Conference on the Management of Viral Hepatitis. Can J Gastro
2000; 14 Supp B:5B-20B.
2. Alter MJ, Kruszon-Moran D, Nainan OV, McQuillan GM, Gao F, Moyer LA, Kaslow
RA, et al. The prevalence of hepatitis C virus infection in the United States, 1988 through 1994.
N Engl J Med 1999;34 1 556-62.
3. Choo W, Kuo G, Weiner A, Overby L, Bradley D, Houghton M. Isolation of a cDNA
clone derived from a blood-borne non-A, non-B viral hepatitis genome. Science 1989;244:359-
64.
4. Alter HJ, Houghton M. Hepatitis C virus and eliminating post-transfusion hepatitis. Nat
Med 2000;6: 1082-6.
5. Wasley A, Alter MJ. Epidemiology of hcpatitis C: geographic differences and temporal
trends. Semin Liver Dis 2000;20: 1 - 16.
6. Lavanchy D, Gavinio P. Hepatitis C. Can J Gastroenterol2000; 14:67B-76B.
7. Zou S, Tepper M, Giulivi A. Current status of hepatitis C in Canada. Can J Pub Health
2ûûû;9 1 :S 10-5.
8. Alter M, Margolis H, Krawczynski K, Judson F, Mares A, Alexander J, et al. The natural
history of community-acquircd hepatitis C in the United States. NEJM 1992;327: 1899-905.
9. Remis R, Hogg R, Krahn M, Preiksaitis J, Sherman M. Estimating the number of blood
transfusion recipients infected by hepatitis C virus in Canada, 1960-85 and 1990-92. Report to
Health Canada. www.hc-sc.gc.ca/hpb/Icdc/bid/bbp/schabase.pdf 1998.
10. http://cythera.ic.gc.ca/dsol/ndis/c~age~e.html.

1 I . Schreiber GB, Busch MP, Kleinrnan SH, Korelitz JJ. The risk of transfusion-transmitted
viral infections. The Retrovirus Epidemiology Donor Study. N Engl J Med 1996;334: 1685-90.
12. Patrick DM, Buxton JA, Bigharn M, Mathias RG. Public health and hepatitis C. Can J
Public Heal th 2000;9 1 : S 1 8-2 1.
13. Stratton E, Sweet L, Latorraca-Walsh A, Gully PR. Hepatitis C in Prince Edward Island:
a descriptive review of reported cases, 1990- 1995. Can J Public Health l997;88:9 1 -4.
14. Chaudhary R, Tepper M, Eisaadany S, Gully P. Distribution of hepatitis C virus
genotypes in Canada: results from the LCDC Sentinel Health Unit Surveillance System. Can J
Infect Dis 1999; 1053-6.
15. World Health Organization. Ports designated in application of the International Health
Regulations. Wkly Epidemiol Rep 1999;74:425-7.
16. Austin GE, Jensen B, Leete J, De L'Aune W, Bhatnagar J, Racine M, Braun JE.
Prevalence of hepatitis C virus seropositivity among hospitalized US veterans. Am I Med Sci
2000;3 193353-9.
17. Cheung RC. Epidemiology of hepatitis C virus infection in American veterans. Am J
Gastroenterol 2OûO;95: 740-7.
18. Louie M, Low DE, Feinman SV, McLaughlin B, Simor AE. Prevalence of bloodborne
infective agents among people admitted to a Canadian hospital. CMAJ 1992; 146: 133 1-4.
19. Dubois F, Desenclos JC, Mariotte N, Goudeau A. Hepatitis C in a French population-
based survey, 1994: seroprevalence, frequency of viremia, genotype distribution, and nsk
factors. The Collaborative Study Group. Hepatology l997;2S: 1490-6.
20. The World Health Report. WHO 1998.

2 1. http://www.cihr.calfundingdecisions/council~decisions/2~~comp~decisio~e~
0003e.shtml.
22. Bortolotti F, Resti M, Giacchino R, Crivellaro C, Zancan L, Azzari C, Gussetti N, et al.
Changing epidemiologic pattern of chronic hepatitis C virus infection in Italian children. J
Pediatr 1998; 133:378-8 1.
23. Yeung L, King S, Roberts E. Mother-to-infant transmission of hepatitis C virus.
Hepatology 200 1 ;in press.
24. Ward C, Tudor-Williams G, Cotzias T, Hargreaves S, Regan L, Foster GR. Prevalence of
hepatitis C arnong pregnant women attending an inner London obstetnc department: uptake and
acceptability of named antenatal testing. Gut 2000;47:277-80.
25. Pembrey L, Newell ML, Tovo PA. European paediatric hepatitis C virus network.
Antenatal hepatitis C virus screening and management of infected women and their children:
policies in Europe. Eur J Pediatr 1999; 158:842-6.
26. Sfameni SF, Francis B, Wein P. Seroprevalence and assessrnent of risk factors for
hepatitis C virus infection in pregnancy. Aust N Z J Obstet Gynaecol2000;40:263-7.
27. Par A. Diagnosis and management of chronic hepatitis C. Can J Gastroenterol
2000; 14:83B-88B.
28. Jonas M. Hepatitis C in children. NEJM 2000;342:20!-S.
29. Zeuzem S, Feinman SV, Rasenack J, Heathcote EJ, Lai MY, Gane E, O'Grady J, et al.
Peginterferon Alfa-2a in Patients with Chronic Hepatitis C. N Engl J Med 2000;343: 1666-1672.
30. Heathcote EJ, Shiffman ML, Cooksley WG, Dusheiko GM, Lee SS, Balart L, Reindollar
R, et al. Peginterferon Alfa-2a in Patients with Chronic Hepatitis C and Cinhosis. N Engl J Med
2000;343: 1673- 1680.
31. Lai MY. Firstline treatment for hepatitis C: combination interferodribavirin versus
interferon monotherapy. J Gastroenterol H e p a t o l 2 0 ; 15:E 130-3.
32. Francavilla R, Mieli-Vergani G. Treatment of hepatitis C virus infection in children. Can
J Gastroenterol2000; 14:4 1 B-44B.
33. Christensson B, Wiebe T, Akesson A, Widell A- Interferon-alpha and ribavirin treatment
of hepatitis C in children with malignancy in remission. Clin Infect Dis 2000;30:585-6.
34. Lackner H, Moser A, Deutsch J, Kessler HH, Benesch M, Kerbl R, Schwinger W, et al.
Interferon-alpha and ribavirin in treating children and young adults with chronic hepatitis C after
malignancy . Pediatrics 2000; 1 O6:E53.
35. www.statcan.ca/english/Pgdbffeople/Population/demo04a.htm.
36. Alter MJ, Hadler SC, Judson F, al. e. Risk factors for acute non-A, non-B hepatitis in the
United States and association with hepatitis C virus infection. JAMA 1 99O;S64:223 1-5.
37. Ness RB, Grisso JA, Hirschinger NT Markovic N, Shaw LM, Day NL, Kline J. Cocaine
and tobacco use and the nsk of spontaneous abortion. N Engl J Med l999;340:333-9.
38. Singer L, Arendt R, Song LY, Warshawsky E, Kliegman R. Direct and indirect
interactions of cocaine with childbirth outcornes. Arch Pediatr Adolesc Med 1994; 148:959-64.
39. Lutiger B, Graham K, Einarson TR, Koren G. Relationship between gestational cocaine
use and pregnancy outcome: a meta-analysis. Teratology 199 1 ;44:405- 14.
40. Kochhar R, Kumar S, Goel RC, Sriram PV, Goenka MK, Singh K. Pregnancy and its
outcome in patients with noncirrhotic portal hypertension. Dig Dis Sci 1999;44: 1356-6 1.
41. Aggarwal N, Sawhney H, Vasishta K, Dhiman RK, Chawla Y. Non-cirrhotic portal
hypertension in pregnancy. Int J Gynaecol Obstet 2001 ;72: 1-7.

42. Lee WM. Pregnancy in patients with chronic liver disease. Gastroenterol Clin North Am
l992;2 I :889-903.
43. Jabeen T, Cannon B, Hogan J, Crowley M, Devereux Cl Fanning L, Kenny-Walsh E, et
al. Pregnancy and pregnancy outcome in hepatitis C type I b. Qjm 2000;93:597-601.
44. Latt NC, Spencer JD, Beeby PJ, McCaughan GW, Saunders JB, Collins E, Cossart YE.
Hepatitis C in injecting dmg-using women dunng and after pregnancy. J Gastroenterol Hepatol
2000;15:175-81.
45. Hillemanns P, Dannecker C, Kimmig R, Hasbargen U. Obstetric risks and vertical
transmission of hepatitis C virus infection in pregnancy. Acta Obstet Gynecol Scand
2ûûû;79: 543-7.
46. Locatelli A, Roncaglia N, Arreghini A, BelIini P, Vergani P, Ghidini A. Hepatitis C virus
infection is associated with a higher incidence of cholestasis of pregnancy. Br J Obstet Gynaecol
1999; 106:498-500.
47. Fontaine H, Nalpas B, Carnot F, Brechot Cl Pol S. Effect of pregnancy on chronic
hepatitis C: a case-control study. Lancet 2000;356: 1328-9.
48. Gervais A, Bacq Y, Bemuau J, Martinot M, Auperin A, Boyer N, Kilani A, et al.
Decrease in serum ALT and increase in serum HCV RNA during pregnancy in women with
chronic hepatitis C. J Hepatol2000;32:293-9.
49. Hawker GA, Coyte PC, Wright JG, Paul JE, Bombardier C. Accuracy of administrative
data for assessing outcomes after knee replacement surgery. J Clin Epidemiol 1997;50:265-73.
50. Tarnblyn R, Lavoie G, Petrella L, al. e. The use of prescription claims databases in
pharmacoepidemiological research: the accuracy and comprehensiveness of the prescription
claims database in Quebec. J Clin Epidemiol l995;48:999- 1009.

51. Platt GH, Svenson LW, Woodhead SE. Coronary artery bypass grafting in Alberta frorn
1984 to 1989. Can J Cardiol l993;9:62 1-4.
52. Mustard CA, H m a n CR, Hall PF, al. e. Impact of a nurses' strike on the cesarean birth
rate. Am J Obstet Gynecol 1995; 1 72:63 1 -7.
53. Johansen H, Dutta M, Mao Y, al. e. An investigation of the increase in preschool-age
asthma in Manitoba, Canada. Health Reports 1992;4:379-402.
54. Goel V, Williams J, Anderson G, Blackstien-Hirsch P, Fooks C, Naylor C, editors.
Patterns of Health Care in Ontario: The ICES Practice Atlas Second edition. Ottawa: Canadian
Medicai Association; 1996.
55. The Doctors Hospital : Data quality and utilization study. Toronto: Doctors Hospital;
1992.
56. Ontario Hospital Association, Ontario Ministry of Health, Hospital Medical Records
institute: Report of the Ontario data quality reabstracting study. Toronto: Ontario Hospital
Association; 199 1.
57. Newton KM, Wagner EH, Rarnsey SD, McCulloch D, Evans R, Sandhu N, Davis C. The
use of automated data to identify complications and comorbidities of diabetes: a validation study.
J Clin Epidemiol l999;52: 199-207.
58. Deyo RA, Taylor VM, Diehr P, Conrad D, Cherkin DC, Ci01 M, Kreuter W. Analysis of
automated administrative and survey databases to study patients and outcomes of care. Spine
1994; 19:2083S-9 1 S.
59. Roos LL, Nicol P, Cageorge SM. Using administrative data for longitudinal research:
comparisons with primary data collection. J Chron Dis l987;4O:4 1-9.
60. Sackett DL. Bias in analytic research. J Chron Dis 1979;32.

61. Green J, Wintfeld N. How accurate are hospital discharge data for evaluating
effectiveness of care? Med Care 1993;3 1 :7 19-3 1 .
62. Humphries KH, Rankin JM, Carere RG, Buller CE, Kiely FM, Spinelli JJ. Co-morbidity
data in outcornes research: are clinical data derived from administrative databases a reliable
al ternative to chart review ? J Clin Epidemiol 2000;53:343-9.
63. Fischer LR, Tope DH, Conboy KS, Hedblom BD, Ronberg E, Shewmake DK, Butler JC.
Screening for hepatitis C virus in a health maintenance organization. Arch h tem Med
2000; 160: 1665-73.
64. Sackett DL, Haynes RB, Guyatt GH, Tugwell P. Clinical Epidemiology, A Basic Science
for Clinical Medicine. Second ed. Boston: Little Brown; 199 1.
65. Byron D, Minuk GY. Clinical hepatology: profile of an urban, hospital-based practice.
Hepatology l996;24:8 1 3-5.
66. Colin C, Lanoir D, Touzet S, Meyaud-Kraemer L, Bailly F, Trepo C. Sensitivity and
specificity of third-generation hepatitis C virus antibody detection assays: an analysis of the
literature. J Viral Hepat 200 1 ;8:87-95.
67. Krajden M. Hepatitis C virus diagnosis and testing. Can J Pub Health Sûûû;9 1 :S34-39.
68. Schedule of Benefits Physician Services Under the Healtb Insurance Act: Ministry of
Health and Long-Tenn Care; 2000.
69. Sherman M, Heathcote J. Clinical estimates of hepatitis C patient characteristics.
Personal communication. 2000.
70. Menard D. Clinical application of the Canadian Consensus Conference Guidelines for
HCV. Cm 3 Gastro 2000; 14.

71. Everhart J, Stolar M, Hoofnagle J. Management of hepatitis C: a national survey of
gastroenterologists and hepatologists. Hepatology 1997;26:78S-823.
72. Fletcher RH, Fietcher SW, Wagner EH. Clinical Epidemiology, The Essentials. Third ed.
Baltimore: Williams & Wilkins; 19%.
73. Kraemer H. Evaluating Medical Tests: Objective and Quantitative Guidelines. Newbury
Park: Sage; 1992.
74. Feinstein AR. Clinical Epidemiology: The Architecture of Clinical Research.
Philadelphia: W.B. Saunders; 1985.
75. Streiner DL, Norman GR, Blum HM. PDQ Epidemiology. Toronto: B.C. Decker Inc.;
1989.
76. Kelsey JL, Thornpson WT, Evans AS. Methods in Observational Epidemiology. New
York: Oxford; 1986.
77. Pagano M, Gauvreau K. Principles of Biostatistics. Belmont: Duxbery Press; 1993.
78. Armstrong GL, Alter MJ, McQuillan GM, Margolis HS. The past incidence of hepatitis C
virus infection: implications for the future burden of chronic liver disease in the United States.
Hepatology 2000;3 1 :777-82.
79. Pocock SJ, Geller NL, Tsiatis AA. The analysis of multiple endpoints in clinical trials.
Biometrics 1987;43:487-98.
80. Canadian consensus conference on the management of viral hepati tis. Canadian
Association for the Study of the Liver. Cm J Gastroenterol 2000; 14:SB-20B.
81. Blajchman MA, Feinman SV, Bull SB. The incidence of post-transfusion hepatitis. N
Engl J Med l993;328: 1280- 1.

82. Reid MC, Lachs MS, Feinstein AR. Use of methodological standards in diagnostic test
research. Getting better but still not gwd. Jama 1995;274:64S-S 1.
83. Rowe W, Rowe J, Malowaniec L. Heaptitis C: mental health issues. Can J Pub Health
2ûûû;9 1 :S42-4.
84. 1 st Canadian Conference on Hepatitis C. In: 1st Canadian Conference on Hepatitis C;
2001 ; Montreal, Canada: Health Canada; 2001. p. 24.
85. Gornbas W, Fischer G, Jagsch R, Eder H, Okamoto 1, Schindler S, Muller C, et al.
Prevalence and Distribution of Hepatitis C Subtypes in Patients with Opioid Dependence. Eur
Addict Res 2000;6: 198-204.
86. Thorpe LE, Ouellet U, Levy JR, Williams IT, Monterroso ER. Hepatitis C virus
infection: prevalence, risk factors, and prevention opportunities among young injection drug
users in Chicago, 1997- 1999. J Infect Dis 2000; 182: 1588-94.