vitamin d status among hiv infected and hiv/tb co-infected
TRANSCRIPT
1
Vitamin D status among HIV infected and HIV/TB co-infected patients attending Haydom
Lutheran Hospital, rural Tanzania.
This thesis is submitted in partial fulfilment of the requirements for the degree of Master of
Philosophy in International Community Health at the University of Oslo.
Sokoine Lesikari Kivuyo
The Department of General Practice and Community Medicine,
Institute of Health and Society
Faculty of Medicine, University of Oslo
Oslo - Norway
June, 2011.
Supervisors:
Johan N. Bruun (MD, PhD, Professor)
Ulleval Hospital
University of Oslo-Norway
Asgeir Johannessen (MD, PhD)
Ulleval Hospital
University of Oslo-Norway
Godfrey S. Mfinanga (MD, Phd)
National Institute for Medical Research,
Dar es Salaam Tanzania

2
Table of Contents
Acronyms and abbreviations: ........................................................................................................................... 6
Acknowledgements .......................................................................................................................................... 8
Abstract .......................................................................................................................................................... 10
1. Background. ................................................................................................................................................ 12
1. 1. Introduction to geography and economy of study area ...................................................................... 12
1.1.1. Country location ........................................................................................................................... 12
1.1.2. Geographical Features .................................................................................................................. 13
1.1.3. Climate ......................................................................................................................................... 13
1.1.4. Economy ....................................................................................................................................... 13
1.1.5. Health profile .......................................................................................................................... 14
1.2. HIV, TB/HIV: pathogenesis, global and national burden ................................................................... 16
1.2.1. HIV-Pathogenesis ......................................................................................................................... 16
1.2.2. Global burden ............................................................................................................................... 16
1.2.3 National burden ............................................................................................................................. 16
1.3. HIV/TB-Pathogenesis ......................................................................................................................... 17
1.3.1. Global Burden .............................................................................................................................. 18
1.3.2. National burden ............................................................................................................................ 18
1.3.3. National measures to control TB and HIV ................................................................................... 19
1.4. Vitamin D ............................................................................................................................................ 20
1.5. Literature Review ................................................................................................................................ 21
1.5.1. Studies worldwide ........................................................................................................................ 21
1.5.2. Vitamin D and Tuberculosis ......................................................................................................... 22
1.5.3. Vitamin D and HIV infection ....................................................................................................... 24
1.5.4. Studies in Tanzania....................................................................................................................... 27
1.5.5. Contradictory research findings ................................................................................................... 28
1.6. Problem statement ............................................................................................................................... 29

3
1.7. Rationale. ............................................................................................................................................. 30
1.7.1. Reason for conducting the study .................................................................................................. 30
1.7.2. Significance of the study .............................................................................................................. 30
1.8. Objectives ............................................................................................................................................ 30
1.8.1 Broad Objective ............................................................................................................................. 30
1.8.2 Specific Objectives ........................................................................................................................ 30
1.8.3. Research questions ....................................................................................................................... 31
2. Methodology .............................................................................................................................................. 31
2.1. Study Area and population .................................................................................................................. 31
2.2. Haydom Lutheran Hospital ................................................................................................................. 33
2.3. Treatment and monitoring ................................................................................................................... 34
2.3.1 Treatment of HIV ........................................................................................................................... 34
2.3.2. Treatment of tuberculosis ............................................................................................................ 36
2.4. Study subjects ...................................................................................................................................... 36
2.5. Sampling .............................................................................................................................................. 37
2.6. Inclusion and exclusion criteria ........................................................................................................... 38
2.7 Data Collection ..................................................................................................................................... 38
2.7.1. Participants Recruitment .............................................................................................................. 38
2.7.2. Abstraction of medical records ..................................................................................................... 39
2.7.3. Specimen collection & Processing ............................................................................................... 39
2.7.4. Specimen storage .......................................................................................................................... 40
2.7.5. Specimen transport ....................................................................................................................... 40
2.8. Laboratory analysis ............................................................................................................................. 40
2.8.1. Hematological and Chemistry analysis ........................................................................................ 40
2.8.2. CD4/CD8 T cell counts analysis .................................................................................................. 41
2.8.3. HIV-1 RNA viral load .................................................................................................................. 41
2.8.4. Vitamin D and parathyroid hormone analysis .............................................................................. 41

4
2.9. Ethical consideration ........................................................................................................................... 42
2.10. Data management .............................................................................................................................. 42
2.11. Statistical analysis ............................................................................................................................. 43
3. Results ........................................................................................................................................................ 44
3.1. The assessment of normality of distribution of serum 25(OH)D scores for the HIV, HIV/TB and
health individuals. ...................................................................................................................................... 44
3.2. Demographic and biochemical characteristics .................................................................................... 45
3.3. Serum vitamin 1, 25-(OH)2D .............................................................................................................. 45
3.4. Serum vitamin 25-(OH)-D .................................................................................................................. 46
3.5. Anthropometrics and biochemical variables in HIV and HIV/TB groups not on anti TB drugs ........ 49
3.6. Comparison of hypovitaminosis D in HIV and HIV/TB not on anti TB............................................. 50
3.7. Vitamin D in HIV patients .................................................................................................................. 52
3.7.1. Clinical manifestation ................................................................................................................... 52
3.7.2. Vitamin D and the immune stage ................................................................................................. 53
3.8. Effect of HAART on Vitamin D ......................................................................................................... 54
3.8.1. Comparison of Hypovitaminosis D in HIV-1 infected patients on ARV and without ARV ........ 54
3.8.2. Elevated PTH levels and effect of ARV use in HIV-1 patients ................................................... 59
3.9. Predictors of hypovitaminosis (serum 25[OH]D) ˂ 75nmol/l) in 85 HIV-1 infected subjects ........... 59
4. Discussion ................................................................................................................................................... 62
4.1 Methodological discussion ................................................................................................................... 62
4.1.1. Discussion of the study design ..................................................................................................... 62
4.1.2 Discussion on bias ..................................................................................................................... 62
4.1.3. Strengths ....................................................................................................................................... 63
4.1.4. Limitation ..................................................................................................................................... 63
4.1.5. Sample and representativeness ..................................................................................................... 63
4.2 Results discussion ................................................................................................................................. 64
4.2.1. Summary of the main findings ..................................................................................................... 64

5
4.2.2. Vitamin D and HIV -1 infection ................................................................................................... 67
4.2.3. Vitamin D and highly active antiretroviral therapy (HAART) .................................................... 69
4.2.4. Season variation ........................................................................................................................... 70
4.2.5. Measurement precision ................................................................................................................. 71
4.2.6. Conclusion and recommendation ................................................................................................. 72
5. References .................................................................................................................................................. 73
6. Appendices ............................................................................................................................................... 82
6.1. Patient consent form ............................................................................................................................ 82
6.2. Swahili Patient Consent form .............................................................................................................. 83
6.3. Medical Record Abstraction Tool ....................................................................................................... 86

6
Acronyms and abbreviations:
AIDS Acquired Immune Deficiency Syndrome
ART Antiretroviral therapy
ARV Antiretroviral drugs
BCG Bacille Calmette Guerin
BMI Body mass index
CTC Care and Treatment Clinic
ELISA Enzyme linked immunosorbent assay
EPI Expanded programme for immunisation
HAART Highly active antiretroviral treatment
HIV Human Immune Deficiency Virus
HLH Haydom Lutheran Hospital
HPLC High pressured liquid chromatography
IRB Institutional Review Board
IRIS Immune reactive inflammatory syndrome
MoHSW Ministry of Health and Social Welfare
MTB Mycobacterium tuberculosis
NNRTIs Non-Nucleoside Reverse Transcriptase Inhibitors
NRTIs Nucleoside Reverse Transcriptase Inhibitors
OI Opportunistic Infection
PCR Polymerase chain reaction
PLWHA Persons Living with HIV/AIDS
PTH Parathyroid hormone
SD Standard deviation
SOP Standard operating procedures
RIA Radioimmunoassay
TB Tuberculosis

7
VCT Voluntary counselling and testing
WHO World Health Organization
8
Acknowledgements
This thesis is part of my studies in a two-year Master‟s course degree in International Community
Health. This study was taken under the institutional collaborative project (Use of HAART in
Haydom) between Oslo University Hospital, Haydom Lutheran Hospital, Muhimbili National
Hospital and the National Institute for medical research-Muhimbili. I‟ am grateful to the Haydom
Lutheran Hospital management team for facilitating this study, the scientific Council of Ulleval
University Hospital (VIRUUS) for support through financing my scholarship and research grants.
Second, I‟ am indebted to the patients who participated in this study. It is my sincere hope that this
study may contribute the improvement of their management.
I wish to extent my special note of thanks to my supervisor, professor Johan N. Bruun for his
guidance, constructive criticism and seeing what I could not see. Your patience, support and
constant encouragement steered me through this challenging journey to produce this work. This
work would have not been accomplished without you.
I wish to thank all my co-supervisors, Dr Asgeir Johannessen from the University of Oslo, and Dr
Godfrey S. Mfinanga from the National Institute for medical research, Tanzania for your time,
patience and insightful suggestions. Dr Asgeir, thank you for being a friend while upholding a
perfect balance between friendship and professionalism.
I owe thanks to many people whom I cannot acknowledge fully here. I would like to thank
everyone who helped me during the work; the staffs at the HIV Care and Treatment Centre, and
laboratory in Haydom for their collaboration and support. Staffs at Aker hormonal Laboratory, at
Oslo University especially Peter T. Torjensen who was responsible for vitamin D and PTH
analysis. Further, to Mabula J. Kasubi at Muhimbili national Hospital who was responsible for
viral load, calcium, phosphorus and albumin analysis.
I am grateful to my fellow M. Phil colleagues, Tiransia Arthur Shoo, Ida M. Bregard, Priya M.
Lerberg, Hege J. Magnussen and Baba Njie for the best stimulating environment-academically and
socially. Tiransia, you have been a great colleague and a valuable friend throughout the two years.
Hege, Ida and Priya, thank you for being friends and making Norway a home far away from my
home, especially on my first arrival. Ida, you opened the doors of your home and family and
introduced me to your great parents I ever seen, Tusen takk!. Baba The Gambia, I will always
remember your funny catch phrases that always reminded me there was more to life than academia.

9
Finally, my deepest appreciation and thanks to my wife Dorothy who has supported and
encouraged me during ups and downs of this study, and also devoting her time and attention during
my fieldwork in Tanzania.

10
Abstract
Background, Rationale and aims of the study
Human immune deficiency virus type 1 (HIV-1) infection remains the most common risk factor
for the development of active and reactivation of latent tuberculosis (TB); on the other hand, TB is
commonly known to accelerate the progression of HIV disease. Vitamin D has been shown to
provide protection against tuberculosis, and its supplementation has also been shown to increase
immunity.
The currently available data from studies in humans regarding the potential value of vitamin D as
adjunctive therapy in mycobacterial infection (TB) remain conflicting. There is also limited and
contradictory evidence about the effect of vitamin D on the immune system. Furthermore, many of
these studies were done in the developed world.
Tanzania is faced with high burden of HIV and tuberculosis. Assessment data on vitamin D status
in HIV and HIVTB were in short supply, especially the rural settings. When programmes are well
planned, using locally relevant, up to date data, implementation is likely to be more effective than
when international or national guidelines are followed without appropriate adaptation. We found
reasonable and ethical to conduct this study investigating the interaction existed between vitamin
D, calcium, parathyroid hormone, and CD4 cells count in HIV-1 monoinfected and HIV/TB co
infected patients.
Methods: A cross sectional study using quantitative methods was conducted from July 2010 to
January 2011 at Haydom Lutheran Hospital in rural Tanzania. A purposive sampling technique
was used to recruit 159 subjects aged 5 years and above. A standard data abstraction tool was used
to obtain required information from the patients‟ files/database. Serum vitamin D concentrations
were measured by competitive Radioimmunoassay (RIA).
Main findings
The subjects mean (SD) age was 35.5 (11.3) years; 85 (53.5%) were female, and
71(44.7%), 41(25.8%), and 47(29.6%) were HIV, HIVTB and healthy controls respectively.
Subjects enrolled during postharvest (Aug-Oct) season had significantly higher serum 25(OH)D
compared to short rain season (Nov-Jan); (75.9 ± 20.8 vs. 64.6 ± 22.2, P = 0.034. Similarly
subjects aged less than 25 yrs had higher level of serum 1, 25-(OH)2D than age groups 35 – 45 yrs

11
and > 45 yrs; P = 0.043, 0.002 respectively. Overall hypovitaminosis D (serum 25-(OH)-D <
75nmol/l) was found in 60.4%.
Subjects with HIV infection had higher serum 25-(OH)-D concentration than HIVTB-coinfected
subjects (77.2 ± 20.8 vs 63.2 ± 23.8); P = 0.003. We observed hypovitaminosis D in 78.6% (11/14)
of the HIVTB coinfected patients and in 52.1% (37/71) of the HIV monoinfected patients; the odd
ratio (OR) of hypovitaminosis D for HIVTB coinfected patients was 3.4 (95% CI: 0.9, 13.1), P =
0.08.
Advanced Clinical HIV stage (three and four) was significantly associated with lower serum 1,25-
(OH)2D concentration, P = 0.021 and 0.0013 respectively. Subjects with CD4 cells count less 200
had lower level of serum 1,25(OH)2D than subjects with CD4 200 – 500 cells/mm3, 137.6 ± 63.9
vs 199.7 ± 58.1, P = 0.05.
Both serum 25 (OH)D and 1,25 (OH)2D levels were higher in HIV positive patients not on ART
compared with those on ART, but the difference did not reach statistical significance; 81.4 (20.5)
vs 74.7 (20.7) nmol/l and 182.8 (67.1) vs 165.1 (75.5) pmol/l, P = 0.190, 0.323 respectively.
However in both univariate and multivariate logistic regression analysis, hypovitaminosis D
remained significantly higher among HIV patients on antiretroviral therapy (ART) compared to
HIV patients not on ART, OR = 3.5 (95% CI; 1.1, 12.3). However this may be due to advanced
disease.
Conclusion;
Advanced HIV stage was associated with lower serum 1,25(OH)2D concentrations, possibly due
to reduced hydroxylation of 25(OH)D to 1,25(OH)2D in the macrophages. Serum 25-(OH)-D
concentration was higher in HIV monoinfected than HIVTB coinfected patients, and hence
hypovitaminosis D was more common among HIVTB coinfected than HIV monoinfected but the
difference was not statistically significant due to small sample size. Hypovitaminosis D was higher
in HIV patients on antiretroviral therapy compared with patients not on ART.
In conclusion, hypovitaminosis D was more common in HIV and HIVTB patients. Both health
professionals and policy makers should be aware of this common co-morbidity and act
accordingly.
12
1. Background.
1. 1. Introduction to geography and economy of study area
1.1.1. Country location
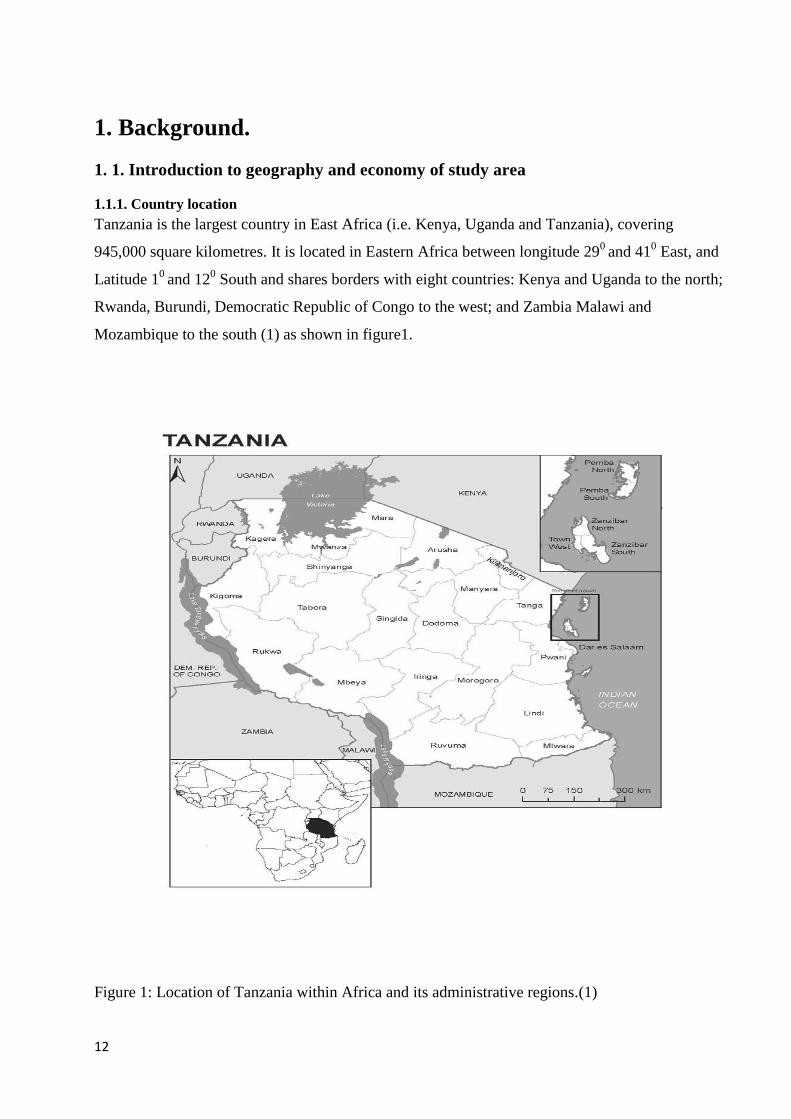
Tanzania is the largest country in East Africa (i.e. Kenya, Uganda and Tanzania), covering
945,000 square kilometres. It is located in Eastern Africa between longitude 290
and 410 East, and
Latitude 10
and 120 South and shares borders with eight countries: Kenya and Uganda to the north;
Rwanda, Burundi, Democratic Republic of Congo to the west; and Zambia Malawi and
Mozambique to the south (1) as shown in figure1.
Figure 1: Location of Tanzania within Africa and its administrative regions.(1)

13
1.1.2. Geographical Features
Tanzania has a spectacular landscape of mainly three physiographic regions namely the Islands
and the coastal plains to the east; the inland saucer-shaped plateau; and the highlands. The Great
Rift Valley that runs from north east of Africa through central Tanzania is another landmark that
adds to the scenic view of the country. The rift valley runs to south of Tanzania splitting at Lake
Nyasa; one branch runs down beyond Lake Nyasa to Mozambique; and another branch to north-
west alongside Burundi, Rwanda, Tanzania and western part of Uganda. The valley is dotted with
unique lakes which include Lakes Rukwa, Tanganyika, Nyasa, Kitangiri, Eyasi and Manyara. The
uplands include the famous Kipengere, Udzungwa, Matogoro, Livingstone, and the Fipa plateau
forming the southern highlands. The Usambara, Pare, Meru, Kilimanjaro, the Ngorongoro Crater
and the Oldonyo Lengai, all form the northern highlands. From these highlands and the central
saucer plateau flow the drainage system to the Indian Ocean, and the inland drainage system.
1.1.3. Climate
Tanzania has a tropical type of climate. In the highlands, temperatures range between 100C and
200C during cold and hot seasons respectively. The rest of the country has temperatures never
falling lower than 200C. The hottest period spreads between November and February (25
0C - 31
0C)
while the coldest period occurs between May and August (150 - 20
0C). Two rainfall regimes exist
over Tanzania. One is unimodal (December - April) and the other is bimodal (October -December
and March - May). The former is experienced in southern, south-west, central and western parts of
the country, and the later is found to the north and northern coast. In the bimodal regime the March
- May rains are referred to as the long rains or Masika, whereas the October - December rains are
generally known as short rains or Vuli.
1.1.4. Economy
Tanzania is an agrarian country. Agriculture accounts for 50% of the gross domestic product and
accounts for about 56% of the exports. Agriculture also employs about 80% of the population
mainly from the rural area. Major agricultural exports are coffee, cotton, tea, tobacco, cashew nuts,
and sisal. Industrial exports have been on the rise following adoption of trade liberalization, and
privatization of public enterprises.
Tanzania remains one of the least developed countries in the world. Its Gross Domestic Product
(GDP) at constant 1992 prices recorded an average of real growth rate of 4.0 percent per annum
during 1996-1999. Given the annual population growth rate of 2.8 percent, per capita real growth
rate was around 1.2 percent. The composition of GDP is such that, agricultural sector accounts for

14
around 50.0 percent, followed by trade sector which accounts for around 16.0 percent. Financial
and business services rank third at the tune of 10 percent, followed by the industrial sector by
around 8.0 percent. The mining sector has been contributing around 2.0 percent, but there is a
bright future for the sector as foreign investments continue to flowing in. It is apparent that in the
near future the sector will record a significant proportion of GDP.
1.1.5. Health profile
The health system in Tanzania remains underdeveloped. The majority of the population resides in
the rural areas and has limited access to modern health facilities. The health service coverage
remains low and the quality of services available, especially in rural areas, is variable, aggravated
by poor transportation system. There is a heavy burden of disease with a growing prevalence of
communicable infections in the country. Many Tanzanians face disease morbidity and mortality
largely attributable to potentially preventable infectious diseases and nutritional deficiencies.
Tanzania is among the countries with a high burden of disease caused by HIV/AIDS Tuberculosis
and malaria. For many years, malaria has been a major cause of morbidity and mortality,
particularly among children under age five. Furthermore, HIV/AIDS is increasingly seen among
children under five. Neonatal, postneonatal, infant, child, and under-5 mortality rates for three
successive five-year periods before the 2010 survey are presented in Table 1. For the five years
immediately preceding the survey (approximately calendar years 2006-2010), the infant mortality
rate was 51 per 1,000 live births and the under-five mortality rate for the period is 81 per 1,000.
These data showed that childhood mortality has declined considerably over the past 10-15 years
(2).
The percentage of the Tanzanian population with sustainable access to improved sanitation was
estimated to be 33% in 2006, rural children estimated to be stunted, underweight for age group less
than 5 years of age in 2010 was 44.5%, 17% respectively and the percentage of children sleeping
under insecticide treated nets in 2010 was 73% (2).

15
Table 1. Early childhood mortality rates (2).
Neonatal, postneonatal, infant, child, and under-five mortality rates for five-year periods
preceding the survey, Tanzania 2010
Years
preceding the
survey
Neonatal
mortality
(NN)
Postneonatal
mortality
(PNN)1
Infant
mortality
(1q0)
Child
mortality
(4q1)
Under-five
mortality
(5q0)
0-4 26 25 51 32 81
5-9 30 41 71 37 106
10-14 33 62 96 53 143
1 Computed as the difference between the infant and neonatal mortality rates
The estimated prevalence of HIV/AIDS in Tanzania as a whole in adults aged 15 - 49 years was
5.8% in 2007 (3). This prevalence is 10th
highest of 41 African nations listed by the WHO (3).
Manyara Region had HIV prevalence of approximately 2% in 2002 (4).The prevalence of HIV
among TB is 13.3% and that of TB among HIV/AIDS patients is 8.5% at Haydom Lutheran
Hospital (HLH) in 2007 (5).
Table 2. Basic health indicators for Tanzania, Tanzania Ministry of Health (2)
Life expectancy
54.4 and 52.8 yrs for female and
male respectively.
Under 5 mortality rate 81/1000 live births
EPI *coverage 75%
Maternal mortality rate 454 per 100,000 live births
ANC coverage 96%
Attended Delivery 51%
Contraceptive Prevalence rate 36%
Use of insecticide treated net 75%
*Expanded programme for immunization.

16
1.2. HIV, TB/HIV: pathogenesis, global and national burden
1.2.1. HIV-Pathogenesis
The first case of HIV was diagnosed in 1981 and since that period, researchers have identified two
serotypes of HIV: HIV-1, the commonest worldwide, and HIV-2, most common in West Africa.
Both have the same routes of transmission, but HIV-2 is believed to be more easily transmitted,
and progression to AIDS might be slower in those infected with HIV-2 (6).
The main route of transmission worldwide remains unprotected sexual intercourse although the
routes of transmission vary greatly between regions. In Sub-Saharan Africa, sexual intercourse,
contaminated blood and mother to child transmission play the major role in transmission whereas
in the fast growing epidemics in Russian federation and the Ukraine, the commonest route of
transmission is injecting drug use (6). HIV infects cells which have the CD4 antigen on their
surface that is principally the helper T-lymphocytes, which are critical for cell mediated immunity.
Thus the principal abnormality in patients with HIV infection results from the fact that the number
of CD4+ T-lymphocytes is decreased and the remaining lymphocytes also have an alteration in
function, resulting in progressive immune suppression, which will result in increased susceptibility
to opportunistic infections in those infected.
1.2.2. Global burden
In 2009, 33.3 million people were living with HIV, with 2.6 million (19% fewer than 1999) new
infections and 1.8 million deaths in that same year. Of these, 22.5 million (68%) were estimated to
be living in Sub- Saharan Africa and 4.1 million in South and South-East Asia. Of the 7,400
infections occurring every day in year 2007, more than 96% were in low and middle income
countries. Among infections occurring in the age group of 15 and older, 45% occur among young
people hence affecting largely the economically productive group (7). In the most affected
countries, HIV has decreased life expectancy by more than 29 years, has aggravated household
poverty and slowed economic growth (8).
1.2.3 National burden
HIV/AIDS is a major development crisis that affects all sectors. Results from the 2007-08
Tanzania HIV/AIDS and Malaria Indicator Survey (THMIS) show that, 6 percent of Tanzanian
adults are infected with HIV(9). The prevalence is higher among women than men (7 percent and 5
percent, respectively). During the last two decades the HIV/AIDS epidemic has spread relentlessly

17
affecting people in all walks of life and devastating the most productive segments of the population
particularly women and men between the ages of 15 and 49 years.
The increasing number of AIDS related absenteeism from workplaces and deaths reflects the early
manifestation of the epidemic leaving behind suffering and grief. Others include lowering of life
expectancy, increasing the dependency ratio, reducing growth in GDP, reduction in productivity
increasing poverty, raising infant and child mortality as well as the growing numbers of orphans
(10). The epidemic is a serious threat to the country‟s social and economic development and has
serious and direct implications on the social services and welfare. Given the high HIV prevalence
in the society, and in the absence of cure, the devastating impact of the epidemic is
incomprehensible.
1.3. HIV/TB-Pathogenesis
Human immunodeficiency virus type 1 (HIV-1) infection remain the most common risk factor for
the development of active tuberculosis (TB), reactivation of a latent tuberculosis, and new TB
infection once HIV infected patients are exposed to tubercle bacilli (11). The lifetime risk of
developing TB from an infection with Mycobacterium Tuberculosis is 5-10% in an HIV negative person
versus 50% in an HIV positive individual. The risk of death in a patient with HIV who has TB is twice that
of an HIV patient without TB, adjusted for CD4 count, the death resulting not from TB but from HIV
disease progression (12).
Attack of macrophage is the crucial step in the pathogenesis of both TB and HIV-1 infection. They
serve as the principal effectors cells against Mycobacterium tuberculosis and as reservoirs for the
intracellular growth of both organisms. The infection with HIV-1 impairs intrinsic macrophage-
mediated defenses against a variety of intracellular pathogens such as decrease chemotaxis,
binding of microorganisms, phagocytosis, antigen processing, microbicidal activity and increase of
intracellular growth of microorganisms. HIV also impair the T-lymphocyte/macrophage immune
axis, hence, HIV-1-infected individuals have increased susceptibility to opportunistic infections
(12).
The development of the tuberculous granuloma is of paramount important as far it protect the
spread of microorganisms in the body. The three steps of development are: (1) the development of
a monocytic infiltrate; (2) the aggregation, maturation and organization of mononuclear cells into a
granuloma; and (3) the further maturation and evolution of an epithelioid granuloma. HIV induce
defect in granuloma assembly and function through impaired chemotaxis (13) and bactericidal
functioning (14) of macrophages and decreased proliferation of IFN-γ-secreting clones of MTB

18
specific TH lymphocytes. As a consequence, progressive immunosuppression associated with the
development of AIDS results in failure of epithelioid differentiation of macrophages, no formation
of Langhans giant cells, and no caseous necrosis.
Similarly, tuberculosis is commonly known to accelerate the progression of HIV disease (15;16).
Proinflammatory cytokine production by tuberculous granulomas has been associated with increased HIV
viraemia, accelerating disease progression. The activation of HIV-1 replication in coinfected cells by
TB, or by the immune activation that accompanies TB infection, has been well documented (17)
(18;19) . Thus, if an HIV-subtype of a particular strain was particularly responsive to activation
during TB infection or reactivation, it could in theory impact outcome during coinfection. The net
effect is increased rates of both virus-induced and immune mediated loss of CD4+ cells.
The impact of distinct TB strains and their variation on HIV replication and AIDS progression in
coinfection is unknown, and is probably another area that deserves further study. However
different TB strains have been shown to have distinct immunomodulatory properties upon host
cells (20;21). This led to the hypothesis that different TB strains may influence HIV replication via
the manipulation of cytokine networks, and thus influence disease progression in coinfection in a
strain specific manner. In-vitro studies on TB/HIV coinfection showed that, a distinct activation of
the host immune response by phenotypically distinct M. tuberculosis clinical strains directly
regulates HIV-1 replication in a strain-specific manner.
1.3.1. Global Burden
With about 11% of the global population, Africa has the greatest regional burden of the global
HIV/TB epidemic, with about 68% of the estimated burden of HIV in 2007 and 85% of all cases of
HIV/TB (22). Africa‟s weak health systems have resulted in very slow progress towards TB
control even before HIV(23).The increasing rate of HIV infection in in this region has had an
impact on TB epidemiology (24). About one-quarter of deaths in people with HIV worldwide was
caused by TB in 2007. Around 450,000 people with HIV died of TB in 2007, and there were 1.4
million HIV-positive TB cases (25).
1.3.2. National burden
In Tanzania between 1977 and 1984, the National Tuberculosis and Leprosy Programme (NTLP)
cut the number of tuberculosis (TB) cases by two-thirds, earning a reputation as one of the best
performing disease-control programs in the world. However, the emergence of the HIV/AIDS

19
pandemic reversed this successful trend, by increasing the number of TB cases six times in the
year between 1983 and 2003.
1.3.3. National measures to control TB and HIV
1.3.3.1. National Tuberculosis and Leprosy Programme (NTLP)
The National Tuberculosis and Leprosy Programme (NTLP) was launched as a single combined
programme in 1977 by the Ministry of Health and Social Welfare (MoHSW). NTLP is within the
department of Preventive Services in the MoHSW under the Epidemiology and Disease Control
section (26). NTLP works administratively at three levels namely, national, regional and district
levels. At the national level there is Tuberculosis and Leprosy Central Unit (TLCU) which is
responsible in coordinating all activities pertaining to tuberculosis and Leprosy in the country.
Also, the unit is responsible for planning, policy formulation, monitoring, evaluation, resource
mobilization and coordination of drugs and supplies procurement and distribution.
At the regional level there is Regional Tuberculosis and Leprosy Coordinator (RTLC) who works
closely with TLCU and the districts. Their responsibility is to interpret the policy guidelines and
monitor their implementation at the district level. RTLC is answerable to the Regional Medical
Officer (RMO). At the district level there is a District Tuberculosis and Leprosy Coordinator
(DTLC) who works under the District Medical Officer (DMO). The DTLC is the main link
between health units and community on one hand and TLCU through the region on the other hand
(26).
1.3.3.2. National Aids Control programme
In response to the epidemic, the Tanzanian‟s Government with technical support from the World
Health Organization Global Programme on AIDS (WHO-GPA) formed the National HIV/AIDS
Control Programme (NACP) under the Ministry of Health and Social Welfare in 1988. The
national response consisted on developing strategies to prevent, control and mitigate the impact of
HIV/AIDS epidemic, through health education, decentralization, multi-sectoral response and
community participation. However the response has not had much impact on the progression of the
epidemic as expected. The national response initiatives were constrained by a number of factors;
inadequate human and financial resources, ineffective co-ordination mechanisms and inadequate
political commitment and leadership. Some of these constraints are now being addressed.

20
There is strong political commitment and leadership from the highest level. HIV/AIDS has been
declared a National crisis and is now one of the top priority development agenda in the
Government, along with poverty alleviation, improvement of the social sector services. The
Tanzania Commission for AIDS (TACAIDS) has been established in 2001 to provide leadership
and coordination of multisectoral responses. The Multisectoral Policy Guidelines on HIV/AIDS is
now in place. Decentralisation facilitates people‟s participation in decision making in issues that
affect their lives, including HIV AIDS. As HIV/AIDS epidemic affects all sectors, its control
demands a well coordinated response.
Currently NACP is operating under Directorate of Preventive Services of the Ministry of Health
and Social Welfare (MOHSW) despite the fact that its activities cut across various departments of
the Ministry. At the national level NACP is a vertical programme with 7 Units i.e. Programme
Management, Information, Education & Communication (IEC), Counseling and Social Support,
Laboratory, Clinical and STD Control, Epidemiology and Research Coordination, Care and
Treatment (27).
1.4. Vitamin D
Vitamin D is a fat soluble vitamin important for serum calcium and phosphorus homeostasis for
proper neuromuscular function and optimal skeletal health (28;29). The predominant source of
vitamin D is sun light exposure: pre-vitamin D3 (7-dehydrocholesterol) is converted by solar
ultraviolet B radiation in the skin into vitamin D3 (cholecalciferol). Alternatively, vitamin D, in the
form of either vitamin D2 (derived mainly from irradiated plants) or D3, (from dietary sources).
Skin pigmentation is a known risk factor for hypovitaminosis D since melanin, responsible for the
skin pigmentation, filters UV radiation (28;29). Food uptake is limited to vitamin D
supplementation or consumption of oily fish (28).
Vitamin D is transported in the blood by vitamin D-binding protein (VDBP) and is then converted
in the liver by 25-hydroxylase enzyme into 25-hydroxyvitamin D (25-(OH)-D). The plasma
concentration of 25-(OH)-D is considered the best indicator of vitamin D status, (28;30) with half-
life 2-3 weeks (31) and normal levels ranging between 30 and 50 ng/ml (32). The concentrations of
1, 25-(OH)2D provide an indication of renal 1α 25 hydroxylation and also of defects in disposal by
the cytochrome P-450 enzyme CYP24. Serum phosphorus, calcium, fibroblast growth factor 23,
and other factors can either increase or decrease the renal production of 1,25(OH)2D. The active
form of vitamin D (1,25[OH]2D) can decreases its own synthesis through negative feedback and
decreases the synthesis and secretion of parathyroid hormone by the parathyroid glands (28) .

21
Vitamin D status can be defined as hypovitaminosis D; vitamin D deficiency and insufficiency,
adequacy, or toxicity. The worldwide prevalence of suboptimal vitamin D status is estimated to be
high (28;33). Vitamin D deficiency is defined as 25-(OH)-D below 10 ng/m or 25 nmol/l (28)
and its major causes are insufficient exposure to sunlight, decreased dietary intake, skin
pigmentation, obesity, and advanced age (29).
The cytochrome CYP34A, present in liver, intestine, kidney and leukocytes (34) is also a key
enzyme in P450 cytochrome-mediated drug metabolism such as anti-retroviral (non nucleoside
reverse transcriptase inhibitor and Protease Inhibitors) as well as certain anti-tuberculous drugs
(rifampicin and Isoniazid) (30;34;35)
The lesser active form of vitamin D, 25-(OH)-D, is converted in the kidney cells into its circulating
active form of 1, 25-(OH)2D by the enzyme 1-α-hydroxylase (CYP27B1). Other cells in the body
such as macrophages also express CYP27B1(30). In the late phase of macrophage activation,
macrophage-CYP27B1 produces 1,25-(OH)2D which apparently has a local rather than a systemic
effect on immune cells (36). Although the macrophage-CYP27B1 is identical to the renal
CYP27B1, its expression is not down-regulated by the parathyroid hormone (PTH) neither the
active vitamin D and is mainly up-regulated by inflammatory cytokines such as interferon gamma
(IFN-γ) and by lipopolysaccharides (LPS) (30;36) .
1.5. Literature Review
MEDLINE was searched in order to find relevant review articles and originals reports on the topics
of this study. In addition textbooks and readers in vitamin D, nutrition and health care in
developing countries were read.
1.5.1. Studies worldwide
Effective medication can slow the progress of HIV, reduce opportunistic infections, and ease
symptoms; however food can interact with drugs and affect the drugs‟ efficacy. Drugs can also
interact with foods and nutrients and negatively affect nutritional status. And ultimately, drug and
food interactions can result in poorer health and nutritional status of an individual. Optimal
nutrition can help boost immune body function, maximizing the effectiveness of drugs, reduce the
risk of opportunistic infections, and contribute to a better overall quality of life (37) .
22
1.5.2. Vitamin D and Tuberculosis
The active form of vitamin D modulates monocyte–macrophage activity in the body and plays a
role of innate immunity to certain infectious agent. This role is important in the body‟s defence
against TB in which the attack of macrophage is the crucial step in pathogenesis. Therefore its
lower level or abnormality in receptor structure and function may result in impairment in immunity
against infectious agents.
A number of human trials on vitamin D replacement as treatment or prevention of tuberculosis has
been attempted to translate the mechanism of vitamin D–mediated macrophage activation to
human host, the outcome yield mixed results. Martineau et al (38) reported encouraging results of
improved immunologic control of Bacille Calmette-Guerin (a M tuberculosis surrogate) in the
peripheral blood following administration of a single dose of 100,000 IU of ergocalciferol to
purified protein derivative-positive (PPD) contacts of active TB cases.
In a trial by Morcos et al (39) the findings showed a benefit of increased weight gain and faster
resolution of TB symptoms in children treated with 1,000 IU of vitamin D daily as an adjunct to
standard TB therapy while a trial by Nursyam et al (40) demonstrated a significant higher rates of
sputum conversion to culture negativity in the group treated with 10,000 IU of vitamin D daily for
6 weeks in comparison with placebo. Both of the two trials, (Morcos and Nursyam) however,
failed to report baseline or follow-up serum 25-OH-D levels for either the intervention or the
control group, leaving uncertainty about the adequacy of repletion in each case.
In contrast, a trial by Wejse et al (41) on vitamin D therapy in patients with TB reported a
significant increase in serum 25-OHD levels in the intervention group receiving 100,000 IU of
vitamin D at baseline, 5 months, and 8 months of TB therapy. However variables, such as
increased exogenous intake of vitamin D irrespective of group assignment or an independent effect
of improving nutritional status with TB therapy, may also be confounding the results of this study,
which found no difference in TB-related clinical outcomes between the 2 study groups.
Recruitment and follow-up for the study took place during the course of 24 months, and it is
unclear whether seasonal variations in vitamin D status affected any study outcomes (41).
In a systematic reviews and Meta analysis of observational studies, Nnoaham and his colleges
(2008) concluded, low serum vitamin D levels are associated with higher risk of active
tuberculosis. In this review, two studies, one done in indigenous Indonesians showed no
association due to insufficient information about the controls and the controls on the second study

23
were having hypertension or Diabetic conditions that might have interfered with vitamin D
metabolism(42).
Sunlight exposure and dietary intake has been shown to be the main sources of body vitamin D
however much remain to be known of their relative contribution. In a review by Nnoaham and his
colleges on the observational studies, a study done in Asians people with good year-round
sunshine, people maintained adequate serum levels of vitamin D inspite of poor dietary intake.
Another similar study in India found low vitamin D levels in the study population despite adequate
sunlight exposure, concluding that diet was the more important factor (42), however the latter
study did not take into account the actual time spent outdoors, extent of body exposed to the sun or
level of cutaneous pigmentation.
In a recent open and controlled clinical trial done in Denmark which included 182 participants
divided into three different groups. The findings in each group were as follow: When 50
participants with all baseline levels of 25(OH)D due to previous different sun exposures were
exposed to UVB radiation , the 25(OH)D mean ( SD) level increased by 23.3 nmol/l (10.6) in
response to the UVB treatments, with a strong negative correlation between the increase in
25(OH)D and baseline 25(OH)D levels, furthermore the findings showed a strong positive and
negative correlation between baseline 25(OH)D and the number of fish meals per week and PTH
respectively. However no significant correlation found between baseline 25-(OH)-D levels and
body mass index.
The influence of skin pigmentation and baseline total cholesterol were analysed in a homogeneous
group of 28 non-sun worshippers with limited past sun exposure: The findings showed a
significant different in baseline 25-(OH)-D level between the 28 non-sun worshippers and the 22
sun worshippers due to different amounts of previous sun exposure. In this group of 28 non sun
worshipers the 25-(OH)-D levels increased by (mean (SD)) 25.3 nmol /l (10.5) in response to the
UVB treatments. Furthermore the findings showed no correlation between change in baseline
25(OH) D and skin pigmentation, however significant correlation was found in baseline total
cholesterol, the precursor of vitamin D.
In confirming whether skin pigmentation has a role for change in baseline 25-(OH)-D after UVB
exposure, a total of 18 participants consisting of 9 pairs of dark and fair skinned participants were
matched according to „„identical‟‟ baseline 25-(OH) D levels. The findings showed no significant

24
differences in change 25-(OH)-D between the dark- and the fair-skinned group despite their
significant difference in constitutive and facultative skin pigmentation showing that the change in
25-(OH)-D is unrelated to skin pigmentation (43).
African Americans have been known to have significantly lower serum levels of vitamin D
because melanin filters out ultraviolet light. The macrophages cultured in blood provided by
African Americans produced 63% less defensins antimicrobial peptides (cathelicidin) than when
cultured in serum from whites and this might explain why African Americans and perhaps dark-
skinned Indians have higher incidence rates of TB (44) . In another study done in Australia among
African immigrants, the mean serum level of 25(OH)D was lower among immigrant with latent
tuberculosis than those with no Mycobacterium tuberculosis infections (45).
In another review of three randomised control trials and ten prospective studies by Martineau et al,
examining the role of vitamin D supplementation to pulmonary tuberculosis patients who are on
anti TB, the findings showed a growing evidence to suggest that active form of vitamin D
modulates antimicrobial activity in vitro; however the existing studies investigating the effect of
vitamin D supplementation on treatment of TB are methodologically inconsistent (46).
The occurrence of tuberculosis in different countries has been associated with the seasonality of
vitamin-D status. Among immigrants from tropics to Europe, vitamin D deficiency have been
suggested to contribute to increased risk of TB reactivation (45). Asians living in London have a
high prevalence of both vitamin D deficiency and tuberculosis, partly due to a decline in immunity
secondary to reduced vitamin-D status on passing from a country where sunlight is plentiful, to
one where sunlight is sparse (47). The persons with the lowest levels of vitamin D have the highest
incidence of tuberculosis, and patients with no detectable value for vitamin D had a tenfold higher
incidence of tuberculosis than patients with low levels of vitamin D.A higher incidences of TB has
been reported in Central Africa, S. Africa and Russia during the winter and early spring (47).
1.5.3. Vitamin D and HIV infection
Research done suggests that vitamin D enhances innate immunity. The active form of Vitamin D
acts by binding to nuclei receptors on target cells. Therefore both low levels of the vitamin and
abnormalities in receptor structure and function may result in impairments in host immunity to the
infectious agent such as tubercle bacillus (48) and also augment the progression of disease such as
HIV/AIDS. More recent research has found evidence that one of the most potent metabolites of

25
vitamin D, 1, 25-dihydroxyvitamin D3, is often deficient in people with advanced HIV infection,
low CD4 T cells count and high blood levels of TNF alpha (49). Deficiency of this particular
vitamin D metabolite is a feature of other immunological disorders.
The knowledge on the potential role for Vitamin D on HIV infection is important. For example,
Micronutrients supplementation has been shown to improve CD4T-cell counts in HIV-positive
individuals (50). The review of observational studies by Villamor et al showed an inverse
association between 1,25(OH)2D concentrations and mortality has been reported from a small
cohort of HIV-infected adults, and some cross-sectional studies have indicated positive
correlations between 1,25(OH)2D and CD4 T cell counts (51). More contradictory findings have
also been seen in bimonthly administration of 100,000IU of cholecalciferol to 64 HIV infected
children and adolescents where no group differences were seen in the change in CD4 count or
CD4% or viral load during 12 months, however the overall mean monthly serum 25-
hydroxyvitamin D concentrations were higher in the group that received vitamin D than in the
placebo group (52).
The effects of vitamin D on HIV infection in vitro have been examined in terms of its potential
role on monocyte/macrophage function and on HIV expression and replication in
monocytes/macrophages. Starting with monocyte/macrophage function, one study of monocytes
from 10 AIDS patients showed that incubation with 1,25(OH)2D resulted in significant increases in
chemotaxis (51). In another experiment, 1, 25-(OH)2D tended to decrease the number of M. avium
in macrophages from HIV-positive patients, whereas the opposite effect was seen in macrophages
of HIV-negative controls (53). These findings suggest that 1,25-(OH)2D could enhance some
macrophage functions such as the respiratory burst in cells from HIV-positive persons, or it may
have a direct effect against M. avium replication in these subjects.
In another study on the effect of active form of vitamin D (1,25(OH)2D) on monocyte function
showed that vitamin D improved growth and maturation of monocyte from both HIV-infected and
uninfected patients, but among the former, the improvements in vitro were greater in patients with
low CD4 cell counts or symptomatic disease compared with those at less-advanced stages (54). No
effects were observed in monocytes from the sickest subjects, suggesting that very severe
monocytic dysfunction may not be responsive to 1, 25 (OH)2 D.
Active human tuberculosis is associated both with HIV infection and vitamin D deficiency (55).
Vitamin D obtained from food supplements and skin is hydroxylated to 25-(OH)-D in the liver and

26
further hydroxylated to the more active metabolite 1,25(OH)2D in the kidney. Studies have also
shown low levels of 1, 25(OH)2D in patients with HIV infection (49) however, the level of 25(OH)
D was normal in this study. Hydroxylation 25-(OH)-D to 1,25(OH)2D also occurred in
macrophages and it has been suggested that the low level of 1,25(OH)2D found in HIV patients
with serious immunodeficiency may be due to deficient macrophage function also manifesting
itself as lack of granuloma formation in patients with HIV/AIDS and tuberculosis co infection
(56). The active form of vitamin D is a key player in the clearance of pathogens and influences the
level of inflammation and macrophage activation (57).
The genetic predisposition of the host and the virus is the most important determinant for
prediction and understanding the course of HIV-1 viral infection and AIDS progression.
Transcription from the HIV-1 long terminal repeat (LTR) is a crucial step for viral replication. The
findings from the study done in Spain showed that vitamin D binding receptors can activates the
HIV-1 LTR through different mechanisms, including non-classical nuclear receptor transcriptional
actions that may ensure viral transcription under different physiological scenarios (58). These
findings suggest that the vitamin D receptor may play a role during the infectious process and in
the progress of AIDS in patients.
Studies reporting the concentration of vitamin D metabolites among HIV infected subjects offer an
opportunity to examine vitamin D deficiency in the course of HIV disease. In a study of 22 HIV
infected individuals (not on ARV) conducted in Spain, half of them had AIDS, the average 25-
(OH)-D and 1,25-(OH)2D concentrations were 16.5 ug/L and 35.8 ug/L respectively (59). In
another study done in German the mean concentration of 1,25-(OH)2D was significantly lower
among both men and women infected with HIV compared with men and women who were
uninfected. However, 25-(OH)-D was nonsignificantly lower in HIV infected men and women
compared with HIV negative controls (60). Similar findings of low 1,25-(OH)2D levels were also
observed in a study conducted in Norway among 54 HIV infected patients compared with healthy
control however serum level of 25-(OH)-D and VDR were normal in this study (49).
The possible explanations for the above discrepancy; Since the 25-(OH)-D level, an indicator from
diet and skin was not affected by HIV status, the low concentrations of 1, 25-(OH)2D in these
studies could have been due to a defect in the 1-alpha hydroxylation of 25-(OH)-D into
1,25(OH)2D which normally occurred in the kidney in response to low 1,25-(OH)2D or PTH.
27
Alternatively, the low 1, 25-(OH)2D could be due to increased utilization for maturation and
proliferation of T-lymphocytes during HIV infection.
The efficacy of highly active antiretroviral therapy (HAART) in inhibiting HIV replication and
improving morbidity and mortality of HIV infection is unquestionable. This progress in therapy,
however, is not without problems. All components of HAART regimens can have major acute and
long-term toxicities. A high prevalence of bone demineralization occurs in people living with
HIV/AIDS. Protease inhibitors (PIs) are potent inhibitors of the cytochrome P450 enzyme system.
Reported studies conducted in the human hepatocyte and monocyte, showed that PIs impair
hepatocyte 25-(OH)-D3 (61;62) and macrophage 1, 25-(OH)2D3 synthesis in a reversible, dose-
dependent manner. And furthermore, PIs inhibit 1, 25-(OH)2D3- degradation in macrophages with
lower potency than that elicited on 1-hydroxylase(61).
Vitamin D and calcium play important roles in the proper mineralization of bone for optimal
skeletal health and immune function (63). In patients with immune reconstitution inflammatory
syndrome (IRIS) hypercalcemia has been found and thought to be due to improvement of
macrophage function, granulomatous reaction and increased hydroxylation of 25-(OH)-D to 1,25-
(OH)2D (56).
Osteoporosis is most commonly associated with inadequate calcium intakes, but insufficient
vitamin D contributes to osteoporosis by reducing calcium absorption (64). Although rickets and
osteomalacia are extreme examples of the effects of vitamin D deficiency, osteoporosis is an
example of a long-term effect of calcium and vitamin D insufficiency. Adequate storage levels of
vitamin D maintain bone strength and might help prevent osteoporosis in older adults, non-
ambulatory individuals who have difficulty exercising, postmenopausal women, and individuals on
chronic steroid therapy (65). A study conducted in Netherland found the use of both NNRTI and
PIs in HIV patients is associated with higher levels of PTH suggesting that it might be a risk factor
for bone problem (66).
1.5.4. Studies in Tanzania
Not much has been done on vitamin D deficiency among TB/HIV patients in Tanzania and again
these few studies were done in the urban settings. In randomized clinical trial done in Tanzania on
multivitamin and micronutrient formulations containing doses of vitamin D, have demonstrated
declines in morbidity and mortality when given to HIV-positive patients, especially those with co
infected with M. tuberculosis (67), however it was difficult to know the specific effect of vitamin
D.

28
In another study done in Northern part of the country (Mwanza city) found low concentration
levels of vitamin D in PTB positive patient as compared with PTB negative and no association on
vitamin D level found among HIV positive patients. However higher concentration of vitamin D
for both conditions was found during the harvest seasons (68) showing that there is seasonal
variation of serum vitamin D levels.
1.5.5. Contradictory research findings
The currently available data from studies in humans regarding the potential value of vitamin D as
adjunctive therapy in bacterial infection (TB) remain conflicting. Three of the 4 TB trials (38-40),
demonstrated positive outcomes, although these studies were hampered by major limitations, such
as poor sample size and limited information regarding the effectiveness of the repletion strategy.
The most recent (2009) and the most rigorously designed trial of the series, reported by Wejse et al
(41) demonstrated no clear benefit of adjunctive vitamin D therapy in TB treatment.
There is limited and contradictory evidence about the effect of vitamin D on the immune system.
Some studies findings suggest that high levels of vitamin D may actually have an immune
suppressive effect and that it may stimulate HIV replication and AIDS progression (58). On the
other hand, the active form of vitamin D has also been shown to stimulate macrophages, white
blood cells which combat opportunistic infection such as Mycobacterium tuberculosis (29;69).
More recent research has found evidence that one of the most potent metabolites of vitamin D, (1,
25-dihydroxyvitamin D3), is often deficient in people with HIV, especially those with advanced
disease (49). Deficiency of this particular vitamin D metabolite is a feature of other immunological
disorders, and some experts argue that it is an important part of a fully functioning immune
system.
CD4 T cells are most important in immune response against Mycobacterium tuberculosis (70) as
well as monitoring HIV disease progression and response to anti- retroviral therapy (ART) (71;72).
Some studies done showed low 1,25(OH)D3 levels were associated with low CD4 counts,
immunological hyperactivity and AIDS progression (49;60), while other studies did not showed
the effects (59;66). For example a cross-sectional study done in 13 USA Cities found no
association between HIV infection and vitamin D status among HIV positive and negative
individuals (73). And a more recent study done in Switzerland found low 1,25(OH)2D level is
correlated with higher CD4 and Previous AIDS (62) .

29
Many of the above studies were done in the Western world. It is reasonable and ethical to do this
study under controlled conditions in Tanzania where the ecology of diseases (HIV/TB), vitamin D
deficiency and the genetic of the population are different.
1.6. Problem statement
There was a probability to suspect high prevalence of Hypovitaminosis D in Haydom, since it is
situated in an economically deprived area with problems of recurrent drought and land
displacement, within an economically deprived country. Nationwide, the number of TB/HIV cases
is rising. Both conditions contribute 17.5% of the entire disease burden in Tanzania affecting
mainly the age group 15-45 years. The two conditions account for about 64% of the estimated
years lost to those who require long term care and management (74). Half of the TB patients are
co-infected with HIV accounting for 60 -70% of the increase TB cases in the country. Agriculture
is the backbone of the Tanzanian economy, and most agricultural workers are in the same age
group affected by both diseases, leading to negative effect on the growth of National economy due
to absenteeism and reduced productivity (7).
The successful use of combined antiretroviral therapy (cART) has led to a decrease in HIV related
mortality, noninfectious diseases associated with older age, such as cardiovascular and neoplastic
diseases (62). Because many of these diseases are modulated by vitamin D, we believe that the
minimal vitamin D target levels suggested for the general population should also be met by HIV-
positive patients, although the effect of vitamin D has been poorly evaluated in HIV-infected
individuals and no target level has been validated.
Current anti-TB/ARV chemotherapies, although effective, are associated with many side effects
and are limited in treating drug-resistant strands. Treatment of HIV-TB co-infection is complex
and associated with high pill burden, overlapping drug toxicities, risk of immune reconstitution
inflammatory syndrome (IRIS) and challenges related to adherence (24). The burden of TB might
further increase by reactivation threats hovering over millions harboring latent infection, thus,
calling for novel approaches for this terrible disease. In recent years, the non-calcemic
physiological actions of vitamin D have drawn a great deal of attention.
Although many studies have been conducted in the western world, to what extent the findings of
such studies can be applicable in the third world context such as Tanzania is questionable, given
the fact that the ecology of the two diseases, Vitamin D deficiency, and population genetic are
different. Review of the available numerous observational studies on the potential role of vitamin
30
D deficiency have shown contradictory findings. These findings suggest the need for more
observational studies to confirm the associations between vitamin D status, TB and HIV disease
progression. More research will provide useful insights on the potential role of vitamin D
supplementation to HIV-infected persons and better planning of intervention trials (51).
1.7. Rationale.
1.7.1. Reason for conducting the study
Vitamin D is essential for body immune function. Assessment data are needed to plan appropriate
programme. Evidence based findings are essential for effective programming, but reliable data on
the level of vitamin D status among HIV/TB patients are currently limited in Tanzania especially
the rural settings.
1.7.2. Significance of the study
This study assessed the level of vitamin D status in Haydom from a local/ rural point of view. A
locally appropriate operational definition for the term “Vitamin D status” is of value to all
individuals and groups working with HIV/TB patients in this area, for example, MoHSW, social
welfare officers, teachers and health care workers. The findings help them to identify patients with
Vitamin D deficiency and to plan appropriate action. When programmes are well planned, using
locally relevant, up to date data, implementation is likely to be more effective than when
international or national guidelines are followed without appropriate adaptation.
If HIV/TB patients are properly cared for and their health is promoted in all aspects, including
physical, psychological, social health and Vitamin D supplementation, this may help to improve
the treatment outcome, and increase the chances of these people becoming physically and
psychologically fit individuals able to contribute to society e.g. economic growth of the country.
1.8. Objectives
1.8.1 Broad Objective
Assessment of interaction between vitamin D, calcium metabolism and parathyroid hormone in
HIV-1 monoinfected and HIV/TB co infection patients in Tanzania rural settings.
1.8.2 Specific Objectives
1) To determine the mean serum levels of vitamin D among HIV/AIDS, and HIV/TB co infection
patients.
2) Determine the risk factors associated with Vitamin D status among HIV infected patients

31
3) To determine the association between vitamin D, serum calcium, and PTH among the following
groups
i) HIV on ARV
ii) HIV pre ARV
iii) HIVTB co infection
iv) Healthy subjects
4. Study the association between vitamin D status and CD4 cell counts among HIV and HIV/TB
patients.
5. Study the association between ARV and Vitamin D metabolism /status
1.8.3. Research questions
1. How common is vitamin D deficiency in HIV positive individuals in rural Tanzania?
2. Is there a difference of vitamin D deficiency between treated and untreated HIV-infected
individuals?
3. Is vitamin D level lower in HIV/TB co infected patients than HIV without TB?
4. What is the consequence of vitamin D on calcium metabolism?
2. Methodology
2.1. Study Area and population
Tanzania is divided into 29 administrative regions and 130 administrative districts. Each region is
composed of districts. Manyara region lies between latitudes 30
40 min and 60
0 min S and
longitude 330 and 38
0 E. It is in the north-east of the country bisected into two by the Great Rift
Valley, and is composed of Babati, Mbulu, Hanang, Simanjiro and Kiteto districts, (figure 1).
Simanjiro, Kiteto and part of Babati districts lie east of the great rift wall while Mbulu and another
part of Babati District remain bracketed between two great walls. The remaining part of Babati
District and the whole of Hanang District lie west of the two great walls. The town of Babati is the
regional centre for Manyara. Haydom, where this proposed study is conducted, is situated in
Mbulu district.
We conducted this cross-sectional study in a rural church owned hospital practice (Haydom
Lutheran Hospital) at a Latitude 50,5min, and longitude 32
0, 50min; at an altitude of 1700m in
Manyara Region. The Region has a tropical climate with an average annual relative humidity of
44.6%. There are four distinct seasons; the long (Feb-Apr) and short (Nov-Jan) rainy seasons with
an average rainfall of about 400 and 150 millimetres annually respectively. The harvest season

32
occur from May to July and Postharvest season start in August and last in October. The average
temperature is 230C (73
0F), with the highest temperature sometimes reaches 32
oC (90
0C) around
noon in October, while the lowest may fall below 150
C (590F) in the early morning of late June.
The average sunlight hours in Manyara region range between 6.9 hours per day in January and 10.0
hours per day in July and August. In general, the study population was unveiled, with their faces
and often lower arms or lower legs exposed to the sun.
Manyara region is not only the home of the Great Rift Valley and numerous livestock; it also
contains Tanzania‟s most interesting and distinctive indigenous ethnic groups. The Iraqw of
Mbulu and their cousins the Gorrowa of Babati as well as the Alawa and Burunge of Kondoa are a
unique group in Tanzania. The only similar ethnic groups are found far away in Ethiopia among
the Oromo. The Hadzabe of Yaeda Valley in Mbulu District who number only about 1,500 are also
distinctive in that as a group, they have the smallest stature in Tanzania. They still live on hunting
and the collection of wild honey, fruits and roots. The only similar ethnic group is that of the
Bushmen of the Kalahari Desert in Namibia. The region is also home to Mainland‟s greatest
concentration of the Barbaig, the Ndorobo/Akea and the Maasai who are historically, the most
warlike ethnic groups.
The Region had a population of 1 040 461 (534565 males & 505896 females), with a growth rate
of 3.8 and an average household size of 5.2 persons, and a relatively low population density of 23
persons per square kilometre. Mbulu district had a population of 237,882, of whom only 19,121
were living in urban areas (http://www.tanzania.go.tz/census/). In 2002, Haydom ward had an
average household size of 6.2. In 2002, the area designated as Haydom rural area had a total
population of 18 362, while Haydom urban area had a total population of 4 551, giving a total of
22 913 in Haydom ward as a whole. The median age of the population of all of Haydom ward was
found to be 17.5 years.
Haydom village is about 80 km from Mbulu, the district administrative centre, and about 300 km
from the nearest urban centre of Arusha. It is in a rural situation, reached by poor quality roads
(figure 2), and has suffered from drought and famine in recent years. It is situated on a ridge
between two rift valleys at an altitude of over 1700m above the sea level, in an area that only 50
years ago was populated by game animals, and was largely uninhabited by humans because of Tse
tse fly. Settlement in the area was encouraged by the British Colonial Rule of that time. Many of
the villagers of Haydom survive solely by subsistence farming (maize & wheat); some also work in

33
small retail outlets, small grain mills, primary and secondary schools, and the hospital, but there
are no industries. This reflects the occupational patterns of Mbulu district, in which 76 343 out of a
population of 82 950 were farmers or livestock keepers according to the 2002 Tanzania census
(http://www.tanzania.go.tz/census/regions/htm). Most people in the study population ate several
types of staple foods such as maize, cassava, potato, rice, millet, white barley and cow meat with
sunflower oil being mostly used for cooking. Fish was also the animal food that was eaten
occasionally. Rural area was defined as an isolated area of the country with limited access to social
services and poor standard of living conditions.
2.2. Haydom Lutheran Hospital
Haydom Hospital is a 400-beds capacity hospital in Mbulu District, owned by the Evangelical
Lutheran Church in Tanzania. The hospital serves a population of about 250,000 from the
surrounding three divisions. The hospital has facilities for tuberculosis and HIV/AIDS diagnosis,
treatment and monitoring.
Figure 2: Road through Magara Mountain to Haydom Lutheran Hospital.
34
2.3. Treatment and monitoring
2.3.1 Treatment of HIV
It was estimated in 2000 that 400,000 Tanzanians have advanced HIV infection and would
benefited from antiretroviral therapy (ART). The Tanzania National HIV/AIDS Five-Year
Strategic Plan of 2001-2006 called for the development of a national antiretroviral therapy (ART)
program for HIV-infected people in need of HIV treatment. Scale up of care and treatment
services continued throughout 2006 and 2007 and by September 30, 2007, 119,302 HIV-infected
people had been initiated on ART at 210 Care & Treatment Clinics (CTCs) located in referral,
regional, district, private and mission hospitals.
In response to the Government strategies, Haydom Lutheran Hospital established HIV Care and
Treatment Centre adjacent to the hospital in October 2003. Majority of the patients enrolled were
detected through VCT services in the villages, OPD or in patients department (IPD) tested on
clinical suspicion e.g. the tuberculosis patients. Patients were considered eligible for ART if they
were in WHO stage IV irrespective of CD4 cell count, WHO stage III with CD4 ≤ 350 cells/ìL, or
had CD4 ≤ 200 cells/mm3 regardless of clinical stage, in accordance with WHO and Tanzanian
guidelines (10;75).
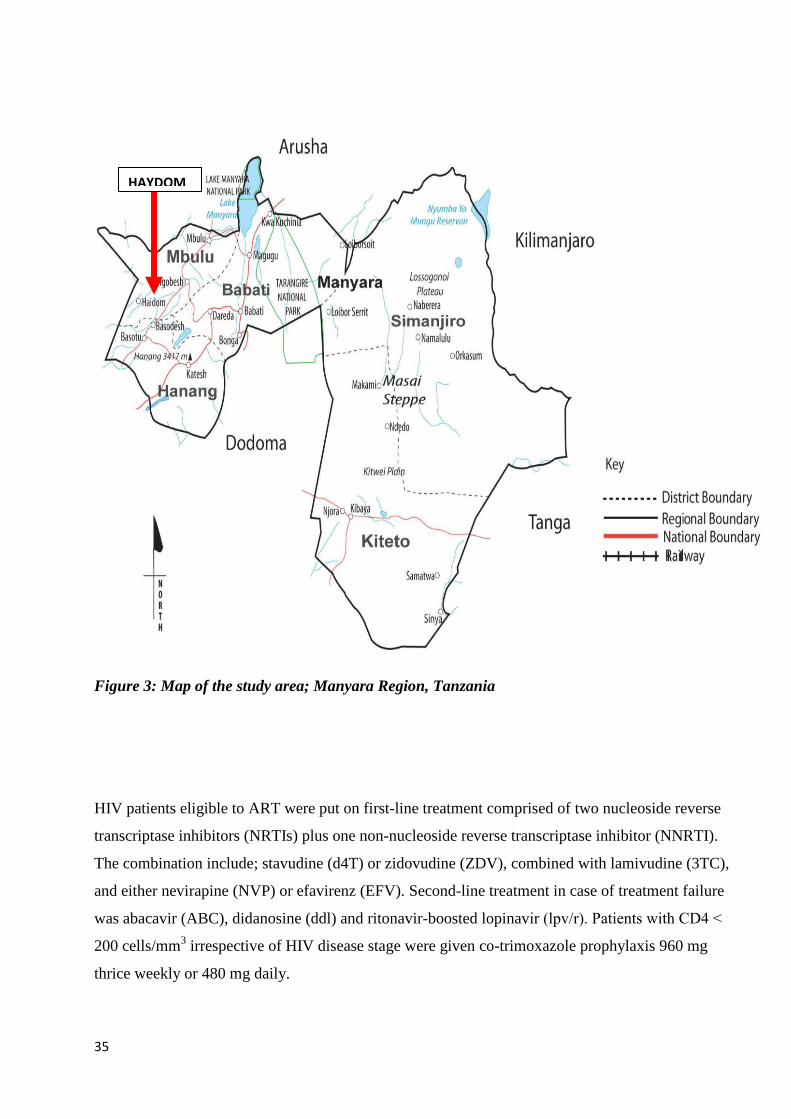
35
Figure 3: Map of the study area; Manyara Region, Tanzania
HIV patients eligible to ART were put on first-line treatment comprised of two nucleoside reverse
transcriptase inhibitors (NRTIs) plus one non-nucleoside reverse transcriptase inhibitor (NNRTI).
The combination include; stavudine (d4T) or zidovudine (ZDV), combined with lamivudine (3TC),
and either nevirapine (NVP) or efavirenz (EFV). Second-line treatment in case of treatment failure
was abacavir (ABC), didanosine (ddl) and ritonavir-boosted lopinavir (lpv/r). Patients with CD4 ˂
200 cells/mm3 irrespective of HIV disease stage were given co-trimoxazole prophylaxis 960 mg
thrice weekly or 480 mg daily.
HAYDOM

36
2.3.2. Treatment of tuberculosis
Direct Observed Treatment Short Course (DOTS) strategy with the aim of; cure TB patients, preventing
death from active TB, preventing further transmission of TB to the community, and preventing the
development of drug resistance due to inadequate drug therapy was been used. Four combination of anti
tuberculosis drugs (rifampicin, isoniazid, pyrazinamide and ethambutol) were prescribed. The treatment
regimen has an initial phase which is also called the intensive phase, and a continuation phase. The initial
phase (facility DOTS, which lasts for two months, patients were hospitalized while the continuation phase
(community DOTS), which last for four months, patients took drugs while observed with one member of
the community. Co-trimoxazol preventive therapy (CPT) was as provided as trimethoprim 80 mg/
sulfamethoxazole 400 mg two times per day to TB patients infected with HIV.
After the initial 2 weeks and 2 months of daily ARV and anti-TB drug administration respectively,
both antiretroviral and anti-TB drugs were dispensed on a monthly basis.
2.4. Study subjects
We carried out this study within the framework of the National Tuberculosis and Leprosy
programme (NTLP) (76) and National Aids Control programme (NACP) (10) with diagnosis and
treatment of HIV (75) and TB (77) patients conducted in accordance with recommended
procedures. Diagnosis of HIV infection was established using 2 different rapid antibody tests. And
diagnosis of pulmonary tuberculosis (PTB) was established using sputum smear microscopy and
chest x-ray.
In brief patients suspected to have TB from in and out patients department were asked to submit 3
sputum (spot - morning – spot) for examination of acid fast bacilli (AFB) using Zielh-Neelsen
staining. A definitive diagnosis of PTB was made when patients met the following criteria; (a) at
least two positive AFB smears from the two different sputum smears; and (b) One positive AFB
smears and typical results of lung infection on chest X-ray.
HIV test was done using 2 different rapid antibody tests, among the following: Determine HIV-1/2
(Abbott laboratories, Abbott Park, IL, USA), Capillus HIV-1/2 (Trinity Biotech, Bray, Co
Wicklow, Ireland)(78), SD bioline (Standard Diagnostic, INC, Hagal-Dong, Korea), and Unigold
(Trinity Biotech, PLC, Bray, Ireland) (79). Concordant positive results were interpreted as positive
for HIV antibody. Discordant results were interpreted as inconclusive. However the discordant
results were solved with a third tie-breaker rapid test, usually Unigold.

37
The healthy controls were randomly recruited from the individuals attending VCT and relatives
accompanied the patients. Subjects were excluded from the study if they had diseases deemed to
affect vitamin D metabolism such as, Diabetic, Hypertension, liver and renal failure. Subjects were
also excluded if found using drugs that might affect serum vitamin D, such as ketoconazole and
anticonvulsants. In addition, individual with prolonged immobility (over one month) were not
recruited to the study. The recruitment of cases and healthy control group was taken place at
approximately during the same period.
2.5. Sampling
Sample size calculation
From the review of studies on serum vitamin D level by Nnoaham and his colleges, a study done
in Kenya showed TB cases and controls had median vitamin D level 40 nmol/l, and 66 nmol/l
respectively, while that of Thailand TB cases had a mean vitamin D level of 70 nmol/l (SD 25) and
controls 96 nmol/l (SD 29) (80). One more study from Thailand among adolescent and young
adults showed the mean plasma 25(OH)D did not differ significantly between the HIV-positive
20.3 nmol/L ( SD 1.1) and control (19.3 nmol/L (SD 1.7)subject (73) .
For comparison of mean vitamin D levels between groups using computer software Russ lenth‟s
power and sample size calculator: 26 in each group gave 81% power (Alfa=0.05) to detect a
difference of 20 nmol/l (50 compared to 30) with a SD of 25. An additional 20% was included to
account for attrition (the non-response) rate rendering minimum 31 in each group. Physical and
laboratory blood samples were done to;
All randomly selected HIV-infected patients attended Care and Treatment Clinic during the study
period, including at least 31 on ARV, 31 pre-ARV and 31 HIV/TB co-infected patients making 93
of the total sample size required. In some patients with TB, blood sample was drawn before/after
start of anti-TB therapy.
At least 50 healthy individuals from normal population were recruited from the same site by using
selection criteria to make HIV positive and HIV negative group comparable with regards to risks
behavior profile such as age, sex, and tribe/ethnicity. Finally our study included a total of 159
subjects, among these 71, 41 and 47 were HIV, HIVTB and healthy controls respectively.

38
However, due to limited time, we only managed to include 14 HIVTB coinfected patients not on
anti-TB drugs not reaching the minimum number of 26 required.
2.6. Inclusion and exclusion criteria
The present study included all HIV positive and Pulmonary Tuberculosis‟ patients who attended
Haydom Lutheran Hospital between July 20, 2010, and January 11, 2011. HIV positive women
who were pregnant at the time of recruitment were excluded from the study, as were lactating
mothers in WHO stage I or II, who started ART exclusively to prevent vertical transmission.
Subjects with diabetes, hypertension, chronic liver (AST>200, or ALAT>225 IU/liter) and kidney
(Creatinine>220 µmol/liter) disorders (66) as well as patients who refused consent and lacked
blood sample for vitamin D test were also excluded from this study. Extra pulmonary TB as well as
patients found using anticonvulsants were also excluded.
2.7 Data Collection
2.7.1. Participants Recruitment
Patients attending Care and Treatment Centre (CTC) department at Haydom Lutheran Hospital
(HLH) were seen on a first come first serve basis. An estimate of more than 800 patients attended
the CTC clinic during the study period. These include patients who come three monthly for
laboratory checkup, drugs collection, and newly HIV, TB diagnosed. Each person was given a
CTC/VCT number and a patient card, which then waits until their number was called to be seen by
the clinician. A purposive sampling method meeting the criteria during the data collection period
was applied. Due to the fact that HIV/TB coinfected patients were relatively few, a roaster list of
patient planned to visit the clinic the day after was used to identify patients with coinfection
(HIV/TB). To every HIV/TB patient identified, two HIV patients were then selected randomly.
The list (ID numbers) of the patients selected was then handled to the clinician on duty the day
after.
When the potential patient arrived, the examining clinician referred him/her to the researcher. The
researcher queried their interest in participating in this study. If interested, the researcher reviewed
eligibility criteria and explained the purpose of the study, method which included free viral loads,
vitamin D and parathyroid hormone test, duration, benefits and risks as part of the informed
consent. Adequate time was given for the participant to consider participation and asking questions
if any. A written informed consent was obtained from all individuals agreed to participate. A study
ID number was then allocated.
39
2.7.2. Abstraction of medical records
A standard data abstraction tool relating to anthropometric and clinical history was developed and
used to abstract required information from the patients‟ files/charts and HIV/AIDS treatment and
monitoring database. The following data were recorded: duration and kind of antiretroviral/ Anti-
TB therapy, CD4 / CD8 T cell counts, Viral load, Complete Blood Cells count (CBC) and blood
chemistries (Creatinine, albumin, AST and ALT,), demographic data such as (age, sex, height and
weight), duration and stage of HIV infection [according to WHO clinical criteria], HIV and ARV
duration were calculated from the date confirmed HIV positive and date started ARV respectively
to the date when blood sample for vitamin D analysis was taken. And age was calculated from the
date of birth to the date when blood taken for vitamin D and PTH. Height without shoes (in
centimeters) was measured to the nearest 0.1 cm by a mounted stadiometer. Weight without shoes
and light sleeveless clothing was measured (to the nearest 0.1kg) on a beam balance scale with
built in stadiometer. Body mass index (BMI) was then derived as the ratio of weight in (kg) over
height square in (m2).
2.7.3. Specimen collection & Processing
Under aseptic techniques, we performed routine venous puncture. Using a serum separator tube
(SST; Becton Dickinson, Franklin Lakes, NJ, USA), 7mls non fasting whole blood was drawn and
left to clot for about 30 minutes, followed by centrifugation for 12-15 minutes to obtain 4mls of
serum required divided into two and kept separately. The first 2ml was needed for analysis of
vitamin D 25-(OH)-D, 1,25-(OH)2D and intact parathyroid hormone. The second 2ml was used for
locally test of calcium, phosphorus, and albumin. We used a sterile pipette to transfer serum to
plastic tube. Immediately, the transferred serum was kept in - 600c freezer for about six months and
was then transported to Norway.
Viral load and blood chemistry (calcium, albumin and phosphorus) were tested locally at
Muhimbili National referral Hospital (MNH). Since calcium is unstable and sensitive to changes in
PH; we kept it air-tight and frozen upside down. Other laboratory measurements that we checked
locally at Haydom Lutheran Hospital include liver function enzymes (Aspartate & Alanine
transaminases), serum Creatinine, absolute CD4 & CD8 cells count, and Complete Blood Cells
counts (CBC).
40
2.7.4. Specimen storage
We stored our samples at -600C freezer for about six months. This is supported by the literature
which showed serum samples can be stored in freezer -20 or -80 degrees up to 6 months for
calcium, and more than one year for vitamin D (81) and PTH (82).
2.7.5. Specimen transport
Using cool box (2 – 80C), the second 2mils serum was transported to Muhimbili National referral
Hospital (MNH) in Dar es Salaam for calcium, albumin and phosphorus testing. Samples arrived
MNH 12hrs later the same day. The samples were then re-frozen at -200C for two weeks.
Since there was no capacity to do laboratory analysis of Vitamin D and PTH in Tanzania, a
material transfer agreement was signed to allow transport of blood samples (2mils serum) from
Tanzania to Norway. We organized transport in order to avoid unnecessary freeze-thaw (but ok for
vitamin D (81), and for PTH (82). We kept the serum for both vitamin D and PTH in a cool box (2
– 8 degrees) for 8 hours, then room temperature for 11 hours. The samples arrived Norway the
next day, (more than 8 hours at room temperature recommended for PTH, but according to
reference above, arrival on the next day was ok however we couldn‟t test all the samples for PTH
the same day. The samples were then refrozen in -200c freezer for one month.
2.8. Laboratory analysis
2.8.1. Hematological and Chemistry analysis
Complete blood cell counts were done using Sysmex Kx-21 (Sysmex Corporation; Kobe Japan).
The machine automatically dilutes a whole-blood sample, lyses, counts and gives a printout result
of absolute numbers of leucocytes (expressed as number of cells × [109] per liter), erythrocytes
(number of cells × [1012
] per liter), platelets (number of cells × [109] per liter), lymphocytes
(number of cells × [109] per liter), mononuclear cells (number of cells × [10
9] per liter),
granulocytes (number of cells × [109] per liter) and hemoglobin (grams per deciliter). The quality
and accuracy of the technique and the machine was assessed every six months.
Serum calcium, serum phosphorus and serum albumin were quantified by standard methods using
automated Architect c800 System (Abbot Diagnostic, USA). And serum creatinine, serum
aspartate and alanine transaminases were measured using Roche COBAS c 111 clinical analyzer
(Roche diagnostic, Rotkreuz, Switzerland). The machine analyses and automatically calculates the
analyte concentrations in each sample. Corrected calcium was calculated as follows; (Calcium) –
[0.025 ˟ (albumin)] + 1.

41
2.8.2. CD4/CD8 T cell counts analysis
Cluster differential cells (CD4 and CD8 T cells) were analyzed using a FACSCount flow
cytometer (Becton Dickinson Immunocytometry Systems, San Jose, Calif.). In brief, 50 μl of
whole blood was mixed and incubated at room temperature for 20 min with 20 μl of aCD4 and
aCD8. Red blood cells were then lysed by adding 450 μl of fluorescence-activated cell sorter lysing
solution (Becton Dickinson Immunocytometry Systems). The tubes were incubated at room
temperature for 10 min, and then analyzed with the FACSCounts‟s Cell Quest software (Becton
Dickinson Immunocytometry Systems) within six hours. By using quality control (Multicheck;
Becton Dickinson Immunocytometry Systems), the accuracy of the technique was assessed every 6
months.
2.8.3. HIV-1 RNA viral load
HIV-1 RNA viral load was not a routine test in Haydom Lutheran Hospital, but we performed as
part of this study in all HIV-1 positive patients. We collected blood on plasma preparation tubes
(PPT; Becton Dickinson, Franklin Lakes, NJ, USA) by venous puncture and centrifuge within 30
minutes. Plasma was immediately transferred to sterile plastic tubes and stored at -600C.
Manufacture‟s instructions were followed with regards to sample collection, storage and transport.
Viral load was measured at Muhimbili National Hospital, Tanzania, using the Cobas Amplicor
HIV-1 Monitor v 1.5 (Roche Diagnostics) with a detection limit at 400 copies/ml.
2.8.4. Vitamin D and parathyroid hormone analysis
These analyses for vitamin D and PTH were performed at Hormone Laboratory of Endocrinology,
Oslo University Hospital, which is a reference laboratory in Norway for hormone analyses. We
measured total serum 25-(OH)-D and 1,25-(OH)2D by Diasorin competitive radioimmunoassay
(RIA) (Diasorin, Stillwater, MN, USA). Prior to analysis, the serum samples were precipitated and
extracted with acetonitrile. 1,25-(OH)2D was further purified by C18OH chromatography. After
centrifugation, an aliquot of the supernatants were incubated with specific antibodies against
25(OH)D and 1,25(OH)2D for 90mins and 2hours respectively at an ambient temperature. After
centrifugation, the supernatants were decanted and counted. The 25-(OH)-D interassay and
intrassay coefficients of variation (CV) were 13% at 38 nmol/l and 8% at 53 nmol/l respectively,
and for 1,25-(OH)2D the interassay and intrassay coefficients of variation (CV) were 17%% at 73
pmol/l and 11% at 57 nmol/l respectively
42
We measured serum intact parathyroid hormone (PTH) by automated clinical chemistry analyser
(Immulite 2000, Siemens Healthcare Diagnostics, Los Angeles, CA, USA). The intra-assay
coefficient of variation (CV) was 9% at 98pmol/l and the inter-assay (CV) was 5% at 4.4pmol/l.
Definition of Vitamin D and elevated PTH levels
Vitamin D was defined as; serum 25(OH)D levels ≤ 75 nmol/l was used to define
hypovitaminosis, and serum 25(OH)D ≤ 25, 25 – 50, and 50 – 75 nmol/l defined severe vitamin
deficiency, mild vitamin D deficiency and vitamin D insufficiency, respectively(83). Elevated
PTH levels were defined as serum intact PTH more than 6.5 pmol/liter.
2.9. Ethical consideration
The Ethics Committee of the National Institute for Medical Research in Tanzania granted
permission to conduct the study and the Regional Committee for Medical Research Ethics (REK)
in Norway recommended it. Written informed consent was obtained from all study participants
before inclusion. Patients diagnosed with liver and kidney disorders were referred for further
evaluation. Pre-HIV test counseling was given to all volunteers and post-test counseling was
offered to those who wanted to know their HIV test results. Those who tested HIV positive were
referred to Treatment and Care Clinic for further management. The free viral load test results for
HIV patients helped the clinicians in decision making regarding the management of these patients,
whether to start or change ARV regimen. All information obtained from the patients were recorded
in abstraction form and kept in a hard cover file. The files were stored into a medical record room
in lockable shelves. Only the investigator and staffs working with HIV/AIDS and tuberculosis care
and treatment accessed the files.
2.10. Data management
The principle investigator abstracted and filled the information obtained from the patients file to
the abstraction forms. Immediately following completion of abstraction form, the researcher
double checked the instruments for completeness and consistency of answers. Completed
abstraction forms were then coded by numbers and entered in Microsoft excel sheet version 2003.
Cross-checking and data cleaning was done. During data cleaning and cross checking missing
information were obtained by going back to the abstraction form, HIV treatment and monitoring
database and when necessary reviewing the patients on the next visit to the clinics. The data were
then transferred to PAWS version 18 for analysis.

43
2.11. Statistical analysis
All analyses were performed with PAWS software for Windows, version 18 (PAWS Inc., Chicago,
IL, version 18.0, USA). Normal probability plots were used to assess the distribution of continuous
variables. Descriptive statistics were computed. Values in the text are means ± SD or means (95%
CI) unless otherwise indicated and statistical significant was considered when P < 0.05. The 2-
sample t test or 1-way ANOVA was used to test for differences in means between 2 or more
groups and the chi-square test was used to test for differences in proportions.
When distributions were not normal, continuous variables were compared between 2 groups by the
Mann - Whitney rank-sum test or between 3 or more groups with a nonparametric Kruskull-Wallis
test.
Calculation of Pearson/ spearman‟s rank correlation coefficients and linear regression were
performed to asses the relationships between key variables. Because of skewness (that is, the
lognormal nature) of PTH, we transformed PTH by log10 its scores and assessed the correlation of
continuous predictors of it with the parametric (Pearson) correlation.
Regression Analyses:
Logistic regression analyses were used to study the associations with hypovitaminosis D; and
linear regression analysis was used to study differences in mean serum vitamin D concentrations.

44
3. Results
3.1. The assessment of normality of distribution of serum 25(OH)D scores for the
HIV, HIV/TB and health individuals.
The skewness values for HIV, HIV/TB and healthy groups are positive and close to zero indicating that
very few of the patients‟ serum vitamin D scores were clustered to the left at the low values. The kurtosis
values in HIV positive and healthy group was negative and that of HIV/TB group was positive and both
were close from zero indicating the distribution of HIV and health group were relatively flat (many cases
in the extremes) and HIV/TB group distribution was rather peaked. The Kolmogorov-Smirnov statistic
test in both cases were insignificant indicating no violation of the assumptions of normality, hence the
distribution was normal in HIV, HIV/TB patients and healthy individuals, figure 4.
Figure 4. Box and whiskers plot showing the distribution of serum 25(OH)D scores for HIV,
HIV/TB and healthy groups. Box plots show mean (horizontal line in center of each box), 25th and
75th percentiles (bottom and top of each box), and 10th
and 90th
percentiles (bottom and top of
error bars). Data are shown below separately for HIV (n = 71), HIV/TB (n = 41) and healthy (n =
47).

45
3.2. Demographic and biochemical characteristics
A total of 175 participants were available for the study; ten HIV-1 monoinfected patients didn‟t
supply blood for vitamin D and parathyroid hormone, three healthy controls had their blood
samples contaminated, and two HIVTB coinfected patients had their serum sample tubes broken
during transport. The final study sample included 159 (53.5% were females) subjects of whom
HIV, HIV/TB coinfected, and healthy controls were 71(44.7%), 41(25.8%), and 47(29.5%)
respectively. The average age was 35.5 ± 11.3 years and their BMI was 20.9 ± 4.0, Other
biochemical measures with their means (standard deviation) or medians (interquartile range)
includes: serum calcium (sCa) 1.7 ± 0.4, albumin corrected calcium (scCa) 2.7 ± 0.4, serum
phosphorus (sPsi) 1.3 ± 0.4, serum albumin (sAlb) 26.7 ± 0.2, serum parathyroid hormone (sPTH)
3.1 (1.5 – 5.3), and serum Creatinine (sCr) 62.6 ± 21.6.
3.3. Serum vitamin 1, 25-(OH)2D
The mean serum 1, 25-(OH)2D was 166.6 (67.4) pmol/l for all subjects. There was a considerable
variation by age group and marital status in serum 1, 25-(OH)2D concentration Table 3. Post hoc
comparisons using the Tukey HSD test revealed subjects group with age less than 25 yrs had
higher level of serum 1,25-(OH)2D than age group 35 – 45 and more than 45 yrs; P = 0.043, 0.002
respectively. Similarly age group two (25 – 35 yrs) subjects had higher level of serum 1, 25-(OH)D
than age group four ( ˃ 45 yrs). The difference was leaning towards statistical significance (P =
0.062). Post hoc analysis also revealed single individuals had higher level of serum 1,25-(OH)D
than married and separated individuals; P value = 0.002 and 0.008 respectively. Categories of sex,
BMI and season did not differ, Table 3.
HIV group HIV/TB group Healthy
Skewness 0.237 0.235 0.195
Kurtosis -0.073 0.25 -0.068
Kolmogorove-Sminov test 0.088 0.087 0.077
P-value 0.2 0.2 0.2
Mean 77.2 63.2 73.3
Standard deviation 20.8 23.8 14.8
N 71 41 47

46
Table 3. Serum 1,25 (OH)2D by category of demographic variables and season among all
subjects(n = 159).1
Variables n % Serum1,25(OH)2D
nmol/l
P
Sex 0.481
Males 74 46.8 162.7 (61.1)
Females 84 53.2 170.9(68.2)
Age (years) 0.002
< 25 29 18.4 199.0 (83.9)
25-35 52 32.9 173.8 (53.6)
35-45 46 29.1 158.1 (72.3)
>45 31 19.6 136.6 (48.6)
Marital Status2 0.001
Married 100 63.3 158 (63.9)
Single 35 22.2 202.3 (74.7)
Separated/Widowed 23 14.5 149.3 (52.4)
BMI(kg/m2) 0.405
Underweight (bmi ≤18.5) 35 24.3 178.9 (62.5)
Normal (18.5 – 25) 92 63.9 160.5 (72.4)
Overweight (bmi > 25) 17 11.8 165.5 (59.4)
Seasons (Months) 0.699
Long rain(Feb-Apr) - - -
Harvest(May-July) 47 29.7 166.5(70.3)
Postharvest(Aug-Oct) 84 53.2 163.5 61.5)
Short rain(Nov-Jan) 27 17.1 176.2 (74.4)
1 Data are n (%) and means (standard deviation) for each category and P-value based on t test or 1-
way ANOVA, one patient had undetectable serum 1,25-(OH)2D. 2 Married includes cohabiting, and single were never married.
3.4. Serum vitamin 25-(OH)-D
The mean serum 25-(OH)-D was 72.4 ± 20.7 nmol/l for all subjects. Overall hypovitaminosis D
was present in 60.4%; 13.2% had deficiency (< 50 nmol/l) and 47.2% had insufficiency (50-75
nmol/l). Serum 25-(OH)-D concentration did not differ between men (73.1 ± 20.7) and women
(71.8 ± 20.9); P = 0.695 nor did the proportion with hypovitaminosis D which was 63.7% and 62%
respectively; P = 0.922. Serum 25-(OH)-D concentrations vary by season and are typically greater
in the summer and fall than in the winter and spring due to variation in sun exposure (73). This
seasonal effect was also observed in the present study. There was a considerable variation by
season in serum concentration of 25-(OH)-D; P = 0.037. Post hoc analysis revealed that subjects
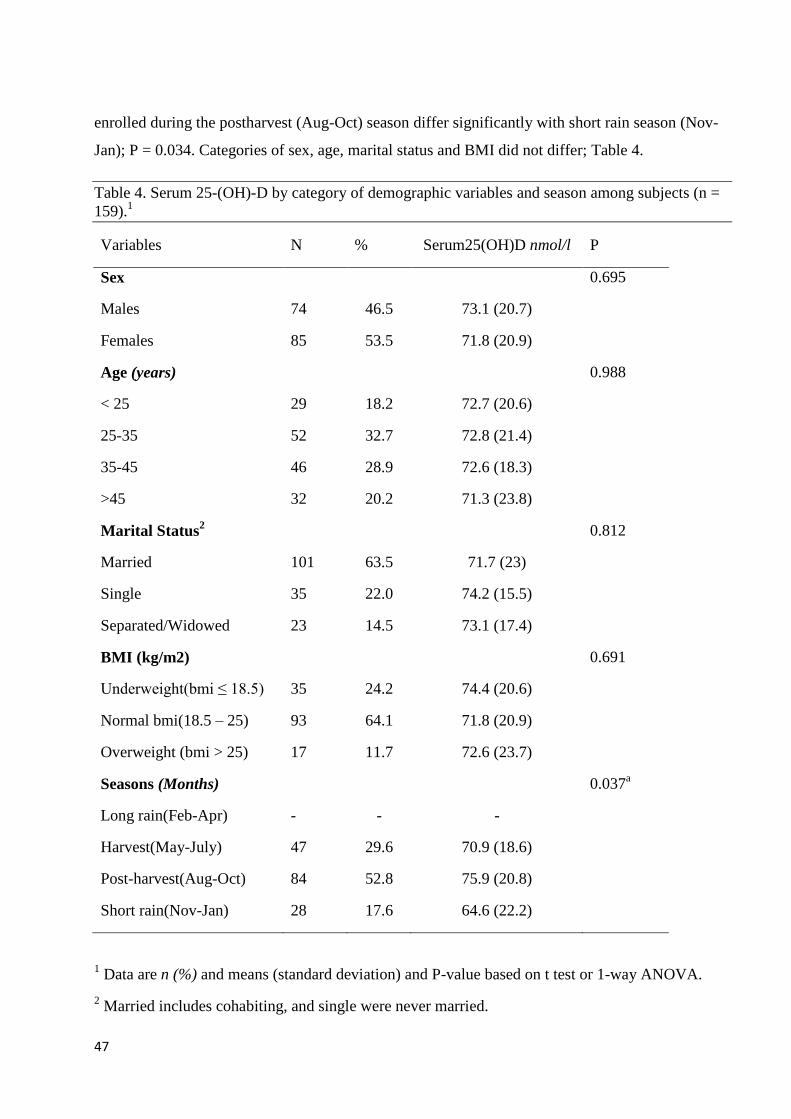
47
enrolled during the postharvest (Aug-Oct) season differ significantly with short rain season (Nov-
Jan); P = 0.034. Categories of sex, age, marital status and BMI did not differ; Table 4.
Table 4. Serum 25-(OH)-D by category of demographic variables and season among subjects (n =
159).1
Variables N % Serum25(OH)D nmol/l P
Sex 0.695
Males 74 46.5 73.1 (20.7)
Females 85 53.5 71.8 (20.9)
Age (years) 0.988
< 25 29 18.2 72.7 (20.6)
25-35 52 32.7 72.8 (21.4)
35-45 46 28.9 72.6 (18.3)
>45 32 20.2 71.3 (23.8)
Marital Status2 0.812
Married 101 63.5 71.7 (23)
Single 35 22.0 74.2 (15.5)
Separated/Widowed 23 14.5 73.1 (17.4)
BMI (kg/m2) 0.691
Underweight(bmi ≤ 18.5) 35 24.2 74.4 (20.6)
Normal bmi(18.5 – 25) 93 64.1 71.8 (20.9)
Overweight (bmi > 25) 17 11.7 72.6 (23.7)
Seasons (Months) 0.037a
Long rain(Feb-Apr) - - -
Harvest(May-July) 47 29.6 70.9 (18.6)
Post-harvest(Aug-Oct) 84 52.8 75.9 (20.8)
Short rain(Nov-Jan) 28 17.6 64.6 (22.2)
1 Data are n (%) and means (standard deviation) and P-value based on t test or 1-way ANOVA.
2 Married includes cohabiting, and single were never married.

48
aPost harvest (Aug-Oct) differ with Short rain (Nov-Jan), P = 0.034
Demographic and biochemical variables of the three distinct groups
The demographic data for the three distinct groups are given in table 5, and that there was no
statistically significant between groups with regards to sex and BMI distribution. Significant
variation of mean serum 25-(OH)-D levels had also been observed in different type of infections;
Table 5. Post hoc comparison test revealed that, subjects with HIV infection differed significantly
with HIV/TB-coinfected (77.2 ± 20.8 vs 63.2 ± 23.8); P = 0.003. However post hoc analysis
revealed no significant difference noted between healthy controls and HIV group (P = 0.734) and
HIV/TB coinfected and health controls, P = 0.095. We investigated whether the duration of TB
treatment was important to vitamin D status , and found positive and negative average correlation
between serum 25-(OH)-D, 1,25-(OH)2D and the weeks passed since the start of the four-drug
treatment regimen (Spearman‟s r = 0.34, P = 0.048; r = -0.40, P = 0.018) respectively.

49
Table 5. Anthropometric and biochemical variables in HIV HIV/TB patients and healthy subjects
(n = 159)1
Mean (SD)
Variable HIV (n = 71) HIV/TB (n =41) Healthy(n =47) P-value
Age(yrs) 35..8 ( 12.2) 38.9 ( 9.7) 32.1 ( 10.4) 0.042a
BMI(kg/m2) 20.9 ( 4.1) 19.9 ( 3.4) 20.1 (3.2) 0.137
25(OH)D (nmol/l) 77.2 (20.8) 63.2 ( 23.8) 73.3 ( 14.8) <0.001b
1,25(OH)D(pmol/l) 171.9 (72.4) 131.7 (53.5) 189.0 (59.3) <0.001c
PTH (pmol/l) 3.4 (1.8 – 5.3) 2.4 (1.1 – 5.1) 3.5 (1.8 – 5.7) 0.146
Calcium (mmo/l) 1.9 ( 0.4) 1.6 ( 0.5) 1.7 ( 0.4) 0.006d
Albumin correct Ca 2.8 ( 0.4) 2.5 ( 0.5) 2.7 (0.3) 0.009e
Phosphorus (mmol/l) 1.1 ( 0.2) 1.0 ( 0.2) 1.0 ( 0.2) 0.095
Albumin (g/l) 31.3 (10.0) 23.5 ( 10.4) 25.8 ( 10 .0) < 0.001f
1Data are mean, standard deviation except PTH, median (Interquartile range) and P value based on
1-way ANOVA or Kruskal-Wallis test.
aHealthy controls differ with HIV/TB , P =0.042
bHIV group differ with HIV/TB P = 0.003
cHIV group differ with HIV/TB P = 0.006
dHIV group differ with HIV/TB group, P = 0.007
eHIV group differ with HIV/TB group, P = 0.008,
fHIV group differ with HIV/TB, & Healthy controls, P = 0.003, & 0.04 respectively
3.5. Anthropometrics and biochemical variables in HIV and HIV/TB groups not on
anti TB drugs.
Most of the subjects in HIV/TB group were on anti-TB drugs and rifampicin and isoniazid has
already been documented to have a decreasing effect on serum vitamin D (84). To avoid the

50
interference of anti-TB drugs in our analysis, we selected 14 HIV/TB co-infected subjects who had
not yet started anti-TB drugs and compared with 71 HIV-1 mono-infected patients. The
demographic and biochemical characteristics for the two distinct groups are given, Table 6, and
that there was no statistically significant difference between groups with regards to age and BMI.
In the HIV group, serum 25-(OH)-D was significantly higher than the group with coinfection
(HIV/TB); Table 6. Using multiple linear regression, adjusting for sex, age, BMI and season, the
overall equation explained approximately 13% of the variation in serum 25-(OH)-D concentrations
(R2 = 0.129; n = 85), the coefficient for HIV and HIV/TB status was significantly different from
zero (P= 0.015), which indicated that mean serum 25-(OH)-D for HIV/TB was significantly lower
than HIV group. Other biochemical variables did not differ between groups.
Table 6. Clinical and demographic characteristics of HIV and HIV/TB patients(n = 85).1
Mean (SD)
Variables HIV(n = 71) HIV/TB(n = 14) MD (95% CI) P
Age(yrs) 35.8(12.2) 39.4 (10.2) -3.5 (-10.4 – 3.4) 0.313
BMI(kg/m2) 21.3(4.5) 19.8(2.6) 1.5 (1.2 – -1.0) 0.239
25(OH)D(nmol/l) 77.2 (20.8) 62.2 (14.3) 15.0 (5.6– 24.4) 0.003
1,25(OH)2D(pmol/l) 171.9 (72.4) 164.6 (61.8) 7.3 (-33.9 – 48.6) 0.723
PTH (pmol/l) 3.4 (1.8 – 5.3) 3.5 (1.8 – 5.7)) - 0.728
Calcium(mmol/l) 1.9(0.4) 1.7 (0.7) 0.2 (-0.3 – 0.6) 0.429
Corr Cal(mmol/l)b 2.8(0.4) 2.7 (0.6) 0.1 (-0.3 – 0.6) 0.425
Phosphorus(mmol/l) 1.1 (0.2) 1.1 (0.2) 0.0 (-0.1 – 0.2) 0.717
Albumin (g/l) 31.3 (10) 30.1 (7.3) 1.2 (-5.7 – 6.9) 0.853
Hemoglobin (g/dl) 13.2 (2.4) 13.1 (1.7) 0.1 (-1.4 – 1.5) 0.915
Creatinine (umol/l) 62.3 (17.9) 54.7 (18.2) 7.6 (-3.1 – 18.2) 0.163
1Data are means (standard deviation) or median (Q3 – Q5) for each category P- value based on
Independent samples t-test or Mann-Whitney U test.
MD, mean difference.
3.6. Comparison of hypovitaminosis D in HIV and HIV/TB not on anti TB
We observed hypovitaminosis D in 78.6% (11/14) of the HIV/TB coinfected patients and in 52.1%
(37/71) of the HIV monoinfected patients; the odd ratio (OR) of hypovitaminosis D was 3.4 (95%

51
CI: 0.9, 13.1), P = 0.08, in HIV/TB coinfected patients compared with HIV monoinfected patients.
In both HIV/TB co-infected and HIV monoinfected patients, the majority of those with
hypovitaminosis fell into the insufficiency category (25(OH)D 50-75 nmol/l). We observed
vitamin D deficiency (25[OH]D ≤ 50 nmol/l) in only 2 of the 14 HIV/TB coinfected patients
(14.3%) and in 9 of 71 HIV patients (12.7%), Table 9. The proportions of various degree of lack of
vitamin D in the two groups are displayed in Figure 5.
Figure 5. Distribution of the degree of Hypovitaminosis D among HIV-1 and HIV-1 coinfected
with tuberculosis patients.
12.7
39.4
47.9
14.3
64.3
21.4
0
10
20
30
40
50
60
70
˂ 50 nmol/l 50 - 75 nmol/l ˃ 75 nmol/l
Pe
rcen
tage
wit
h c
on
dit
ion
(%
)
Serum 25(OH)D concentration (nmol/l)
Vitamin D status in rural Tanzania among HIV and HIVTB coinfected.
(%) HIV
(%) HIVTB

52
3.7. Vitamin D in HIV patients
3.7.1. Clinical manifestation
We found a statistically significant association between clinical stage of HIV disease and serum 1,
25-(OH)2D, however no significant association found in serum 25-(OH)-D; Table 7. Post hoc
analysis revealed that, HIV-1 infected patients with clinical stage (WHO) four had significantly
lower serum levels of 1,25-(OH)2D than stage one individuals, P = 0.023, and stage three was
marginally significant different with HIV stage one, P = 0.056. We examined the question of
whether HIV stage affected/predicted serum 1,25-(OH)2D concentrations in this study using
multiple regression analysis, controlling for sex, age, CD4 cells count, use of HAART and season.
The overall equation explained approximately 15% of the variation in serum 1, 25(OH)2D
concentrations (R2 = 0.145; n =74), the coefficient for HIV stage was statistically significantly
different from zero (P= 0.013), which indicated that HIV stage was significantly associated with
serum 1,25-(OH)2D concentrations. In both analyses, HIV/TB patients on anti-TB drugs were
excluded.
Table 7. Clinical manifestation of HIV-1 infection on serum vitamin D1.
N (%) Mean 25-(OH)-D P-value
Clinical stage (WHO 2007) 0.638
Stage one 12 (16.0) 73.2 (17.5)
Stage two 16 (21.3) 78.6 (16.2)
Stage three 13 (17.3) 73.5 (21.5)
Stage four 34 (45.3) 73.3 (19.6)
Mean 1,25(OH)D*
Clinical stage (WHO 2007) 0.021
Stage one 12 (16.2) 222.8 (104.2)
Stage two 16 (21.6) 185.9 (55.7)
Stage three 13 (17.6) 152.4 (60.0)
Stage four 33 (44.6) 143.7 (59.9)
1Data are n (%) , mean (standard deviation) and P-value based on one way ANOVA,
ten subjects had their clinical stages missing.
*one subject had undetectable serum 1,25(OH)2D

53
Because the increased immune activation of HIV infection can increase requirements for some
nutrients (85), we examined the question of whether HIV status affected serum 25-(OH)-D and
1,25 (OH)D concentrations in this study. Using multiple regression analysis, we adjusted for sex,
season, and age to determine whether HIV status was a significant predictor of serum 25(OH)D
and 1,25(OH)D concentrations.
Although the overall equation explained approximately 10% of the variation in serum 1, 25(OH)D
concentrations (R2 = 0.103; n = 85), the coefficient for HIV status was marginally significantly
different from zero (P= 0.054), which indicated that HIV status was marginally significant
associated with serum 1,25-(OH)2D concentrations. For serum 25-(OH)-D concentration, the
overall equation explained 1.4% of the variation in serum 25-(OH)-D concentrations (R2 = 0.014; n
=84), the coefficient for HIV status was not significantly different from zero (P= 0.576), which
indicated that HIV status had no significant association with serum 25-(OH)-D concentrations.
There were clinically significant difference in median duration of known HIV infection, duration
of known using Antiretroviral therapy (ART), and platelet cells count among patients who were
vitamin D (25[OH]D) sufficient, insufficient and deficient, (P = 0.009, 0.03 and 0.022)
respectively. Median HIV duration 28.4, 141.7 and 48 weeks, ARV duration 49.4, 122.8 and 150.9
weeks, platelet cell count 313.6, 229.9 and 243.1 (* 103/µl) in deficiency, insufficiency and
sufficiency respectively. Post hoc analysis revealed higher platelet cell count in vitamin D
deficiency group than insufficient and sufficient groups, P = 0.017, 0.047 respectively.
3.7.2. Vitamin D and the immune stage
A one way between groups analysis of variance was conducted to explore the impact of immune
stages (1993 CDC criteria) on the levels of serum 25-(OH)-D and 1,25-(OH)2D. In this analysis all
patients including those on HAART and without were included. There was no statistical significant
difference at the P < 0.05 level in serum 25-(OH)-D and 1,25-(OH)2D for the three immune stages;
P = 0.681 and 0.335 respectively.
When patients on HAART were excluded in the analysis, There was a marginally statistically
significance difference at a P < 0.05 in serum 1,25-(OH)2D for the three immune stages, P = 0.062
Table 8. However, we found no statistical significant difference between immune stages and serum
25-(OH)-D. The post hoc comparisons using the Tukey HSD test revealed that, subjects with CD4
cells count between 200 – 500 cells/mm3 had higher serum 1,25-(OH)2D3 concentrations than
subjects with CD4 cells count less than 200 cell/mm3. Subjects with CD4 cells > 500 cells/mm3

54
did not differ significantly from either group with CD4 < 200 or CD4 200 – 500 cells/mm3, P =
0.800, 0.342 respectively.
Table 8. Immune stage of ART-naïve HIV-1 infected patients by serum vitamin D1.
N (%) Mean 25(OH)D P-value
Immune stage (1993 CDC) 0.242
CD4 < 200 cell/mm3 19 (50.0) 74.2 (26.7)
CD4 200 - 500 cell/mm3 11 (28.9) 86.3 (15.4)
CD4 > 500 cell/mm3 8 (21.1) 70.4 (16.6)
Mean 1,25(OH)D
Immune stage (1993 CDC) 0.062
CD4 < 200 cell/mm3 19 (50.0) 137.6 (63.9)
CD4 200 - 500 cell/mm3 11 (28.9) 199.7 (58.1)
CD4 > 500 cell/mm3 8 (21.1) 155.6 (84.0)
1Data are n (%) , mean (standard deviation) and P-value based on one way ANOVA,
3.8. Effect of HAART on Vitamin D
Of all 71 HIV-1 monoinfected subjects, 62% (44/71) were on antiretroviral treatment. Use of
HAART has been documented to have a decreasing effect on hepatocyte serum 25-(OH)-D and
macrophage 1,25-(OH)2D levels (66;86). We found higher mean serum levels of both 25 (OH)D
and 1,25 (OH)2D among HIV positive patients not on HAART compared with those on HAART,
but the difference did not reach statistical significant; 81.4 (20.5) vs 74.7 (20.7) nmol/l and 182.8
(67.1) vs 165.1 (75.5) pmol/l, P = 0.190, 0.323 respectively. We also investigated whether the
duration of HAART treatment was important to vitamin D status , and found weak positive
association between serum 25(OH)D, 1,25(OH)2D and the weeks passed since the start of the
HAART regimen (Pearson‟s r = 0.27, P = 0.033; r = 0.12, P = 0.368) respectively.
3.8.1. Comparison of Hypovitaminosis D in HIV-1 infected patients on ARV and without ARV
In a univariate logistic regression analysis, we observed hypovitaminosis D in 63.6% (28/44) of the
HIV patients on treatment and in 33.3% (9/27) of HIV patients not on antiretroviral therapy. The
odd ratio (OR) of hypovitaminosis D was 3.5 (95% CI; 1.3 – 9.6), P = 0.015 in HIV patients on
treatment compared with HIV patients not on treatment, Table 9. We observed serum vitamin D
deficiency (25-(OH)-D ≤ 50nmol/l in 6 of 44 HIV patients (13.6%) on treatment and in 3 of 27

55
HIV patients (11.1%) not on treatment. Further more we observed higher vitamin D insufficiency
(25-(OH)-D 50 - 75nmol/l) in half (50%) of HIV patients on treatment compared with 6 of 27 HIV
patients (22.2%) not on treatment; Table 9. The proportions of various degree of lack of vitamin D
in the two groups are displayed in figure 6
In multivariate logistic regression analysis, controlling for age, sex, BMI and season,
hypovitaminosis D remained significantly higher among HIV patients on treatment compared to
HIV patients not on treatment, Table 9.
Figure 6. Distribution of the degree of Hypovitaminosis D among HIV infected patients on and
without ARV.
13.6
50.0
36.4
11.1
22.2
66.7
0.0
10.0
20.0
30.0
40.0
50.0
60.0
70.0
80.0
˂ 50 50 - 75 > 75
Per
cen
tag
e w
ith
co
nd
itio
n (
%)
Serum 25(OH)D concentration (nmol/l)
Vitamin D status in rural Tanzania among HIV
patients with and without ARV
(%) ON ARV
(%) NO ARV

56
Table 9. Crude and adjusted odds ratio of various subject groups for different vitamin D
categories1.
Subject groups Overal N n (%) OR2 (95%CI) OR
3 (95%CI)
Hypovitaminosis (25(OH)D
≤75 nmol/l
HIV 71 37 (52,1) 1 1
HIV/TB 14 11 (78,6) 3,4 (0,9 - 13,1)** 2,6 (0,6 - 10,7)
HIV 71 37 (52,1) 0,7 (0,3 – 1,4) 0,3 (0,1 – 1,0)*
Healthy 47 29 (65,9) 1 1
HIV/TB 14 11 (78,6) 3,5 (0,2 – 60,5)** 2,4 (0,2 – 27,2)
Healthy 47 29(65,9) 1 1
HIV without ARV 27 9 (33,3) 1 1
HIV with ARV 44 28 (63,6) 3,5 (1,3 - 9,6) 3,7 (1,1 - 12,3)*
Deficiency (25[OH] ≤
50nmol/l)
HIV 71 9 (12,7) 1 1
HIV/TB 14 2 (14,3) 1,1 (0,2 - 6,0) 1,1 (0,2 - 6,4)
HIV 71 9 (12,7) 6,7 (0,8 – 54,6)** 2,5 (0,2 – 34,7)
Healthy 47 1 (2,1) 1 1
HIV/TB 14 2 (14,3) 7,7 (0,4 – 91,8) -
Healthy 47 1 (2,1) 1 -
HIV without ARV 27 3 (11,1) 1 1
HIV with ARV 44 6 (13,6) 1,3 (0,3 - 5,5) 1,1 (0,2 - 7,5)
1OR, odds ratio, ARV, antiretroviral drugs, HIV, human immune virus; HIVTB, HIV
coinfected with tuberculosis. 2
Univariate logistic regression analysis of variables against various levels of 25
(OH)D. 3
Logistic regression analysis with variables adjusted for age, sex, BMI, and season
*Significant, **marginal significant.
Our subjects were on first line treatment which comprised of two nucleoside reverse transcriptase
inhibitors (NRTIs) stavudine (d4T) or zidovudine (ZDV), combined with lamivudine (3TC), and
one non-nucleoside reverse transcriptase inhibitor (NNRTI), either nevirapine (NVP) or efavirenz

57
(EFV). In univariate analysis based on either nevirapine or efavirenz and stavudine or zidovudine
regimens, we found a statistically significant association of zidovudine with lower serum level of
the most potent metabolite of vitamin D (1,25-(OH)2D) compared with stavudine, P = 0.007.
However there was no significant different based on either Nevirapine or Efavirenz regimen. Both
groups had no effect on serum 25-(OH)-D concentration.
Hypovitaminosis D
Using the criteria of 25-(OH)-D ˂ 75 nmol/l, there was no significant difference of
hypovitaminosis D among nevirapine and efavirenz as well as among stavudine and zidovudine
based regimens, OR = 1.6 (95% CI, 0.5 – 5.0) and 1.1(95% CI, 0.4 – 3.5) respectively. However,
vitamin D deficiency (25(OH)D ˂ 50 nmol/l) was significantly common among zidovudine based
regimen than stavudine based regimen, and this remained significant following adjustment with
sex, Table 10.

58
Table 10.Crude and adjusted odds ratio for hypovitaminosis D in 62 HIV patients infected on
highly active antiretroviral therapy1
Overal
N
N with vit D < 50
nmol/l OR2(95%CI) OR
3(95%CI)
Sex
Male 26 6 (23.1)** 5.0 (0.9 – 26.9) 5.2 (0.9 – 31.2)**
Female 35 2 (5.7) 1
Age group
˂ 25 4 1 (25.0) 1
25 - 35 15 1 (6.7) 0.2 (0.0 – 4.5)
35 - 45 29 4 (13.8) 0.5 (0.0 – 5.8)
˃ 45 13 2 (15.4) 0.5 (0.0 – 8.3)
BMI(kg/M2)
˂ 18,5 11 1(9.1) 1
18,5 - 25 40 7 (17.5) 2.1 (0.3 – 19.4)
˃ 25 8 0 (0.0) -
TB infection
No 43 5 (11.6) 1
Yes 18 3 (16.7) 1.5 (0.3 – 7.2)
TB treatment
No 11 1 (9.1) 0.3 (0.0 – 3.5)
Yes 7 2 (28.6) 1
Season
Harvest 39 5 (12.8) 1
Postharvest 20 3 (15.0) 1.2 (0.3 – 5.6)
Short rain 2 0 (0.0) -
CD4 cells count
˂ 200 11 2 (22.1) 1
200 - 500 33 4 (11.4) 0.5 (0.1 – 3.1)
˃ 500 18 2 (11.1) 0.4 (0.1 – 3.8)
HAART regimen
Nevirapine based 37 5(13.5) 1
Efavirenz based 25 3 (12.0) 0.9 (0,2 - 4,3)
Stavudine based 37 2 (5.4) 1 1
Zidovudine based 25 6 (24.0) 6.0 (1.1 – 33.1)* 6.7 (1.1 – 39.8)*
1OR, odds ratio, HAART, highly active antiretroviral therapy, HIV, human immune virus;
TB, tuberculosis.*Significant, **marginally significant. 2 Univariate logistic regression analysis of variables against hypovitaminosis D.
3Logistic regression analysis adjusted for variables with P-value less than 0.100, (sex)

59
3.8.2. Elevated PTH levels and effect of ARV use in HIV-1 patients
For one patient (with normal 25-(OH)-D) the PTH level was missing. Overall, 18 patients (18/111,
16.2%) had elevated PTH levels. Among patients with hypovitaminosis, 14 patients (14/67, 20.9%)
had elevated PTH levels. Two patients (2/27, 7.4%) without treatment, and twelve patients (12/40,
30%) received anti retroviral therapy. Patients treated with ARV had a significantly higher risk of
developing elevated PTH levels in addition to hypovitaminosis D (OR 0.756, 95%CI (0.601 –
0.951), P = 0.026).
Among the patients with normal vitamin D levels, 4 patients (4/44, 9.1%) developed elevated PTH
levels; no patient (0/23, 0%) without treatment, four patients (4/21, 19.0%) received ARV. There
was no significant difference in prevalence of elevated PHT levels among these treatment groups
(OR 4.05, 95%CI (0.984 – 16.674), P = 0.095).
3.9. Predictors of hypovitaminosis (serum 25[OH]D) ˂ 75nmol/l) in 85 HIV-1 infected
subjects
Sex, age, BMI, viral load, CD4 cells counts and clinical stage of the disease had no effect on
hypovitaminosis D, Table 11. In univariate logistic regression analysis, subjects recruited during
postharvest (Aug - Oct) and short rain (Nov - Jan) seasons had lower and higher risk of
hypovitaminosis respectively compared with harvest (May - July) season. Tuberculosis infection,
use of highly active antiretroviral drugs, and elevated parathyroid hormone were found to predict
hypovitaminosis in a univariate logistic regression analysis; however when variables with a P-
value < 0.1 in univariate analysis were advanced into a multivariable model using the forward
stepwise method, none of them remained significant predictor of hypovitaminosis. In both analysis,
HIV/TB coinfected patients on anti-TB drugs were excluded.

60
Table 11.Crude and adjusted odds ratio for hypovitaminosis D in 85 patients infected with HIV1
Overal
N
N with vit D <
75nmol/l OR2(95%CI) OR
3(95%CI)
Sex
Male 35 19 (54,3) 1
Female 50 29 (58.0) 1,2 (0,3 - 4,9)
Age group
˂ 25 11 5 (45,5) 1
25 - 35 26 13 (50.0) 1,2 (0,3 - 4,9)
35 - 45 33 22 (66,7) 2,4 (0,6 - 9,6)
˃ 45 15 8 (53,3) 1,4 (0,3 - 6,5)
BMI(kg/M2)
˂ 18,5 16 9 (56,3) 1
18,5 - 25 55 31 (56,4) 1,0 (0,3 - 3,1)
˃ 25 10 6 (60.0) 1,2 (0,2 - 5,8)
TB infection
No 71 37 (52,1) 1 1
Yes 14 11 (78,6) 3,4 (0,9 - 13,1)** 3.4 (0,9 – 12.0)**
Use of ARV
No 30 12 (40.0) 1 1
Yes 55 36 (65,5) 2,8 (1,1 - 7,1)* 2,1 (0,5 – 9,6)
Season
Harvest 43 28 (65,1) 1 1
Postharvest 36 15 (41,7) 0,4 (0,2 - 0,9)* 1.5 (0,4 – 6,3)
Short rain 6 5 (83,3) 2,7 (0,3 - 25,1) 0,6 (0,0 – 8,1)
CD4 cells count
˂ 200 15 8 (53,3) 1
200 - 500 42 23 (54,8) 1,1 (0,3 - 3,5)
˃ 500 22 13 (59,1) 1,3 (0,3 - 4,7)
WHO HIV stage
One 12 6 (50.0) 1
Two 16 8 (50.0) 1.0 (0,2 - 4,5)
Three 13 8 (61,5) 1,6 (0,3 -7,8)
Four 34 23 (67,6) 2,1 (0,5 - 8,0)
Viral Load (copies/ml)
˂ 400 49 32 (65,3) 1
˃ 400 28 14 (50.0) 0,5 (0,2 - 1,4)
PTH (pmol/l)
˂ 6,5 66 36 (52,2) 1
˃ 6,5 18 12 (80.0) 3,7 (1,0 - 14,2)*
HB (g/dl)
˃ 12 56 30 (53.6) 1
˂ 12 26 16 (61.5) 1,4 (0,5 - 3,6)
1OR, odds ratio, ARV, antiretroviral drugs, HIV, human immune virus; HIV/TB, HIV
coinfected with tuberculosis.*Significant, **marginally significant.

61
2 Univariate logistic regression analysis of variables against hypovitaminosis D.
3Logistic regression analysis adjusted for variables with P-value less than 0.1 (TB
infection, ARV and season)

62
4. Discussion
This study describes the serum levels of vitamin D status among HIV-1 monoinfected and
HIV/TB-coinfected patients in the Northern part of the United Republic of Tanzania. Serum 25-
(OH)-D and 1,25-(OH)2D associations with infections and antiretroviral therapy were determined.
4.1 Methodological discussion
4.1.1. Discussion of the study design
This study was a cross sectional study, and the design should be appropriate for the study
questions, because we set out to determine serum vitamin D levels among HIV-1 positive and HIV
-1 coinfected with pulmonary tuberculosis (88). With regards to the sample size, we calculated
based on the study design to minimise the chance of committing a type two error (89). Assessment
of normality of the distribution of scores for continuous variables such as age, BMI, serum
25(OH)D and 1,25(OH)2D showed that the samples were normally distributed for both groups.
4.1.2 Discussion on bias
Bias is a systematic error in the design, conduct or analysis of a study that results in a mistaken
estimate of an exposure/disease association(90). Information bias is a distortion in the measure of
association caused by inaccurate information or measurement that can result from things such as
poor interviewing techniques or differing level of recall by respondents (90). Although using a
structured face to face interview is the most effective method in gathering high quality information,
our study adopted a retrospective design, and hence, was subject to weaknesses inherent to
retrospective studies namely that some important information such as for example occupation,
education were not available in the charts we reviewed.
Selection bias is a distortion that results from procedures used to select subjects and from factors
that influence study participation (90). These results were obtained from a non randomized sample
of individuals attending Haydom Lutheran Hospital; selection bias may thus be present.
Furthermore the distribution of characteristics of the patients reported to hospital during the study
period could be different from those who did not. Therefore, generalization of the finding could be
inappropriate. To reduce selection bias introduced by staffs in the clinics, we enrolled all
tuberculosis patients who were found to be pulmonary tuberculosis during the study period.
However, this was not possible for the HIV-1 monoinfected patients.

63
Furthermore, bias due to selection may thus have been introduced in this study because we invited
some of the HIV/TB relatives to participate as healthy controls. This group was at high risk of
being infected compared with the individual from the general population, though they didn‟t have
symptoms of these diseases during the enrolment period. This problem may thus be overcome by
random selection of individuals from the general population.
4.1.3. Strengths
Researcher as enumerator
All abstraction of information from the patients‟ charts/files, data entry and cleaning was
conducted by the researcher himself. This has had a positive impact bearing on the reliability of the
results in that, the researcher was well familiar with the study objectives/questions and ensured that
correct information in the light of the questions/objectives of the study, was obtained. This also
provided the researcher with some qualitative insights through observations; which have been
useful in interpreting the findings in the discussion.
The inclusion of healthy controls which provided us with the reference serum level of vitamin D
was another added strength in this study. Furthermore, serum vitamin D levels were determined in
an international reference recognized laboratory (Hormone Laboratory department of
Endocrinology, Oslo University), ensuring high precision and reliability.
4.1.4. Limitation
A limitation of our study is that, though we included healthy controls for reference vitamin D
status which increased the strength of our study, ruling out obvious co-morbid conditions by
clinical screening and laboratory investigations such as HIV rapid test and smear microscopy, we
might had missed conditions such as latent tuberculosis infection and also HIV infection during the
window period because our HIV rapid tests can not pick up HIV antibodies before 2 weeks to 3
months following infection. We might also erroneously have excluded some of the participants
because of over-reporting of clinical symptoms used as screening tool for inclusion.
4.1.5. Sample and representativeness
Haydom Lutheran Hospital is an old mission which has benefited from supports from partners such
as Norway, and as such might not be representative of all rural hospitals in Tanzania. Certain
advanced equipment available in Haydom, such as computer tomography (CT scan) is definitely
unavailable in most rural hospital in the country.

64
Although we only included a total of seventy one HIV patients and forty one HIV coinfected with
tuberculosis patients in our study, we believe that we have, through our sampling, achieved a fairly
adequate diversity among subjects; in addition, the results we found were largely similar and
repeatable among subjects. On other hand, our study included patients from an area where the
majority rely on subsistence farming and pastoralism, a typical of rural Africa.
Further more Haydom Lutheran Hospital is faced with some logistical challenges as many rural
hospitals in the country due to its remote location and high patients load. Although the hospital is
a church owned, both TB and HIV programmes are fully integrated in National Tuberculosis and
Leprosy programme (NTLP) and National AIDS Control Programme (NACP) respectively under
the Ministry of Health and Social Welfare. Moreover, approximately more than half of the hospital
beds and rural health services in Tanzania are operated by church and thus, being a church owned
is not atypical.
Clearly, hospitals in Tanzania differ hugely, and our findings are not necessarily applicable to all
settings. However we believe our findings may better represent the situation in rural Africa than
studies carried out in larger urban cities.
4.2 Results discussion
4.2.1. Summary of the main findings
Our results show four major findings: First, Hypovitaminosis D was common in all subjects.
HIV/TB coinfected patients had lower serum 25(OH)D compared with HIV monoinfected and
healthy controls. Second, Mean serum 25(OH)D did not differ significantly between HIV positive
and HIV negative subjects nor was HIV stage a significant predictor of serum 25(OH)D when
multivariate regression analysis was used to adjust for other variables, however the lower level of
the most potent metabolite of Vitamin D (1,25[OH]2D) was associated with advanced stage of HIV
disease, may be due to reduced hydroxylation of 25(OH)D to 1,25(OH)2D in the macrophages.
Third, HIV patients on treatment had higher prevalent of hypovitaminosis compared with HIV
naïve, and fourth, subjects enrolled during post harvest season had low risk of hypovitaminosis
compared with others.

65
Hypovitaminosis (VDI and VDD) occurred frequently in healthy individuals, HIV and HIV/TB
patients from rural Tanzania as studies in Sub-Saharan African populations also have shown
(68;91-93). We hypothesized hypovitaminosis D among HIV, HIV/TB, and patients on ARV. We
found that hypovitaminosis D was indeed common among patients on ARV compared to those not
on ARV because of more frequent vitamin D insufficient and deficient in this group. We also
found a high frequency of hypovitaminosis D among HIV infected group compared to healthy
individuals, because of high frequency of vitamin D deficiency in this group.
Furthermore we found that hypovitaminosis was common among HIV/TB group compared to
healthy controls because of high frequent of vitamin D deficiency. HIV/TB-coinfected group failed
to differ significantly from that of HIV and healthy groups in the final model. This may have been
due to relatively small sample size however, and the difference approached significance. Future
studies should explore this question with a larger sample size.
The nutritional status of HIV/TB did not explain the lower serum vitamin D because, mean serum
25(OH)D concentration remained lower even after adjusting for BMI, and dietary intake is usually
not considered sufficient to maintain optimal vitamin D status if sunlight is avoided (29;94)
Although several lines of in-vitro evidence suggest a link between vitamin D and immunity, the in-
vivo association between vitamin D status and tuberculosis is still a controversial issue. In this
study we found that hypovitaminosis D, as assessed by 25-(OH)-D, was higher among HIV-
coinfected with tuberculosis patients than in healthy controls as well as than HIV monoinfected
patients. These findings add to the growing evidence that vitamin D plays a role in the regulation
of Mycobacterium tuberculosis.
The possible association between vitamin D and tuberculosis was first reported more than 20 years
ago (95), but subsequent studies have yielded contradictory findings. A number of studies in
Gujarati Indian (96), Indian, Somali, Pakistani, Afghan, Sri Lankan and African populations in
London (97), and African immigrants living in Australia (45) all have shown that tuberculosis
infected individuals had lower serum levels of 25(OH)D and higher prevalence of vitamin D
deficiency than non-TB individuals.
Other studies in Kenya and West Africa (98) have also reported that TB patients had lower 25-
(OH)-D levels compared to non-TB individuals. However, there was no significant difference in
25-(OH)-D levels between TB patients and controls in Indonesia (99) and Hong Kong (100)

66
studies. Nevertheless, a recent meta-analysis concluded that TB patients had about 0.70 standard
deviation (95% CI 0.42, 0.93) lower 25(OH)D concentration than non-TB individuals (80). In our
study, HIVTB coinfected patient had 0.50 standard deviation (95%CI: -20.0, -2.2) lower serum
25(OH)D concentrations than in the healthy controls which was approximately the same range of
the effect size found in the meta-analysis. Thus, overall, our finding is consistent with most
previous studies.
The observation of low serum 25-(OH)-D in HIV-1 patients coinfected with TB could be due to
nutritional factors, however, this is unlikely. It is well known that about 90% of vitamin D is
synthesized in the skin under the influence of ultraviolet B radiation from sunlight, only about 10%
of vitamin D is obtained from food, (mainly salmon and cod fish, egg yolks, or liver) or from
supplements. We did not assess dietary intake of calcium nor vitamin D supplementation but the
typical Tanzanian diet generally contain little salt and largely based on starches such as millet,
sorghum, beans, pilaf, and cornmeal. The meal that could be considered the country's national dish
is ugali; stiff dough made of cassava flour, cornmeal (maize), millet, or sorghum, and usually
served with a sauce containing either meat, fish, beans, or cooked vegetables.
The present study was, however limited by the lack of detailed dietary information. Fish is
consumed occasionally in the region of the study, both freshwater and saltwater fish, but intake
varied considerably within the different groups of the population (P Sinyaw, personal
communication, 2010). We have no data on the vitamin D content of these fish or individualized
information on frequency of intake, but only fatty fish have considerable amount of vitamin D
(101). We suggest future studies to explore the dietary information including vitamin D content
and intake frequency of these fish in this community.
Although low 25-(OH)-D and calcium levels in HIV/TB patients could be a consequence of the
disease, it is highly possible that vitamin D is antecedent risk factors for tuberculosis. The relation
between vitamin D and protection against tuberculosis may be mediated through two mechanisms;
increased production of cathelicidin and enhancement of macrophage ability. The active form of
vitamin D [1, 25-(OH)2D] may enhance production of IL-37, one of class of defensins-
antimicrobial peptides of the cathelicidin family, culminating in TB destruction (46;102).
Moreover, Vitamin D also restricts intracellular growth of Mycobacterium tuberculosis via
enhancement of macrophage ability. Avoidance of phagolysosome fusion within the macrophage
constitutes a key survival mechanism of Mycobacterium tuberculosis. The ability of

67
Mycobacterium to obstruct phagosomal progression, also known as phagosome maturation arrest,
is partly achieved via its retention of the host‟s tryptophanaspatate-containing coat protection
(103).
4.2.2. Vitamin D and HIV -1 infection
Very few small studies have reported data on the possible relationship between vitamin D status
and HIV infection, and many are from high-income countries (104). A study from Germany
reported lower serum 25-(OH)-D and 1,25(OH)2D among asymptomatic HIV patients receiving
treatment compared with uninfected controls (105), where as a similar study from Norway found
lower serum 1,25(OH)2D , but not serum 25(OH)D , among HIV infected patients (49). One
similar study done in the northern City of Tanzania found no difference in serum 25-(OH)-D with
HIV coinfected among TB patients (68).
HIV infection was not significantly associated with vitamin D status among HIV subjects in this
study. This is consistent with the limited data available from previous studies (49). However, HIV
affects serum concentrations of the active metabolite of vitamin D, 1,25-dihydroxyvitamin D (49).
Thus, an apparent lack of effect of HIV infection on serum 25-(OH)-D concentrations does not
mean that HIV infection has no effect on vitamin D metabolism and, consequently, on vitamin D–
related physiologic functions, including the immune response. We found the lower level of the
most potent metabolite of vitamin D (serum 1,25-hydroxyvitamin D) and not serum 25(OH)D was
significantly associated with advanced stage of HIV disease (WHO stage three and four). Our
findings are consistent with the previous studies (49) and contradict with the recent study done in
Tanzania urban, where they found low vitamin D status (serum 25-hydroxyvitamin D < 32 ng/ml)
was significantly associated with HIV progression (WHO HIV disease stage III) (106).
Under normal physiological condition, vitamin D from sunlight/food is converted in the liver to 25
(OH)D and is further hydroxylated in the kidneys to the active metabolite 1,25-(OH)D, which is
immediately metabolized to less metabolites. The enzymes that generate 25-(OH)-D from vitamin
D in the liver and the enzymes that generate 1,25-(OH)2D in tissues operate below Michaelis-
Menten constant throughout; i.e. the reaction follow 1st order mass action kinetic(107). The more
vitamin D is available, the more is converted to 25-(OH)-D, and the more is converted to 1, 25-
(OH)2D in the tissues. As long as sunlight exposure is adequate, 1, 25-(OH)2D can be produced by
the body without the requirement for ingestion in the diet. The explanations of the low serum 1,25-
(OH)D found in advanced stage of HIV infected individuals would have been due to lack of
precursor, reduced kidney or macrophages 25 (OH)D hydroxylation to 1,25-(OH)2D . However,

68
likes other hormones, 1,25-(OH)2D circulate at a pictogram concentrations that are 1000 times less
than serum 25(OH)D, therefore serum 25 (OH)D would have been virtually absent in the
circulation in order to have effect on serum 1,25-(OH)D. In this study, advanced HIV stage was
not associated with serum 25-(OH)-D.
Another explanation would have been irregulation of the tightly factors that determine 1,25-
(OH)2D hydroxylation. Under normal physiological condition, parathyroid hormone and calcium
regulate 1,25(OH)2D production, and low serum PTH, and calcium would have been expected to
decrease the rate of 1-hydroxylation (108), however serum PTH and calcium among HIV patients
in this study were within normal levels.
The rate of 1α- hydroxylation of serum 25-(OH)-D in the kidney normally determines the level of
serum 1, 25-(OH)2D concentration. But previously study have shown that advanced HIV disease
was associated with chronic kidney diseases (109) which ultimately lead to kidney failure or
reduced kidney functions. Therefore, a reasonable assumptions would be the inadequate 1α-
hydroxylation might be the cause of low serum 1, 25-(OH)2D in advanced stage of HIV infection.
However, inadequate renal hydroxylation could not be the reason as patients with renal disorders
were excluded in this study.
Studies done in vitro found cells in the body such as macrophages also express enzyme 1-α-
hydroxylase (30). In the late phase of macrophage activation, macrophage- 1-α-hydroxylase
produces 1,25-(OH)2D under the influence of tumour necrotic factor alpha (TNF-α ) (110) which
apparently has a local rather than a systemic effect on immune cells (36). However, during HIV
infection there is down regulation of TNF-α receptors and cells differentiation in advanced clinical
disease (111;112) and a granulomas formation is not commonly seen in these patients following
coinfection with tuberculosis. Although the macrophage-1-α-hydroxylase is identical to the renal 1-
α-hydroxylase, its expression is not down-regulated by the parathyroid hormone (PTH) neither the
active vitamin D and is mainly up-regulated by inflammatory cytokines such as interferon gamma
(IFN-γ) and by lipopolysaccharides (30;36). We did not assess both interferon gamma and tumor
necrosis alpha in this study however, Haug et al (49) found the combination of low 1,25(OH)2D
and high tumor necrosis factor may further impair the immune response in HIV infected patients
both independently and in combination and may represent an important feature of HIV
pathogenesis. Therefore a reasonable assumption of low serum 1,25-(OH)2D in advanced stage of
HIV would be the reduction of the activation of 25(OH)D to 1,25(OH)2D in the macrophages.

69
4.2.3. Vitamin D and highly active antiretroviral therapy (HAART)
There was highly statistical significant difference between HIV patient receiving HAART and HIV
naïve. Patients receiving HAART were greater than 4 fold more likely to demonstrate
hypovitaminosis D. Our subjects were on first line treatment which comprised of two nucleoside
reverse transcriptase inhibitors (NRTIs) stavudine (d4T) or zidovudine (ZDV), combined with
lamivudine (3TC), and one non-nucleoside reverse transcriptase inhibitor (NNRTI), either
nevirapine (NVP) or efavirenz (EFV).
Based on Stavudine or Zidovudine regimen, we found a statistically significant association of
Zidovudine with lower serum level of the potent metabolite of vitamin D (1,25-(OH)2D). Vitamin
D deficiency (serum 25-(OH)-D ˂ 50nmol/l) was also associated with Zidovudine based regimen
and this was also present following adjustment with sex, age, BMI and duration of HIV. These
findings are consistent with a recent study conducted in Spain (113).
Our finding of low serum 1,25-(OH)2D following use of HAART in HIV infected patients may
have some explanation and implications; Use of HAART especially protease inhibitors (PI) and
non nucleoside reverse transcriptase inhibitors (NNRTIs) have been found to inhibit the function of
hepatic- 25-hydrolylase and macrophage-1,25-hydroxylase which are critical for active vitamin D
synthesis. The net effect is a reduced production of 1, 25-(OH)2D (61) that could influence
immunity. Our patients were on combination of NRTIs and NNRTIs. The finding of low 1, 25-
(OH)2D based on zidovudine regimen might have the same explanation as above. This may also
explain the elevated PTH levels that we found among HIV patients on antiretroviral therapy in this
study.
Low 1, 25-(OH)2D in HIV patients has been associated with immune reconstitution inflammatory
syndrome (IRIS) (112;114) i.e. a temporary worsening of clinical presentation after starting
HAART despite immunological improvement. About 30% of HIV infected persons living in
resources limited settings and high burden of tuberculosis such as Sub-Saharan Africa are highly
affected by this problem (115). And by far, Mycobacterium tuberculosis has been the most
pathogenic organism involved (112).
The active form of vitamin D (1,25(OH)2D) play a role on immunity through different
mechanisms; first, based on Mycobacterium tuberculosis infection, the active form of vitamin D
(1,25-(OH)2D ) produced by macrophage-1,25 hydroxylase at the inflammation site, has many
local actions leading to a negative feedback loop avoiding macrophage overstimulation.
70
Second, 1, 25-(OH)2D acts also directly on macrophages by inducing intracellular Mycobacterium
tuberculosis destruction via the cathelicidin-mediated system. If macrophages are over stimulated,
high local level of 1,25-(OH)2D could lead to systemic spill over and thus hypercalcemia, as has
been described in Mycobacterium tuberculosis-IRIS (56) since no systemic negative feedback by
the parathyroid axis exists on macrophage-1,25-hydroxylase (98).
We did not asses the presence or absent of IRIS in this study however its interrelation with ARV,
low vitamin D and immunity appear to be importance in the clinical aspect of HIV patients‟
management, warranting more studies to explore low vitamin D status on the pathogenesis of IRIS.
4.2.4. Season variation
Outdoor sun exposure and time spent outdoors are better predictors of serum 25-(OH)-D
concentration than dietary vitamin D intake (64). Although well known at higher latitudes above
350, the seasonal variation in serum 25-(OH)-D, with concentration raising from May to October,
was unexpected in this study, given the fact that our study site lies between 30
40ˈ and 60
0ˈ
latitudes.. Only brief daily sun light exposure converts cholecalciferol to inactive metabolites.
Hence seasonal variation is not expected in countries around the equator, such as Puerto-Rico
(116) and Guinea-Bissau(98). In Manyara region, Tanzania; the mean number of daily sunshine
hours per day ranges from 6.9 to 10.0 h/d. It was lower in January with 6.9 h/d and higher in
August with 10.0 h/d. The increased serum vitamin D (25-[OH]-D) in harvest through post-harvest
(from May to peak in August, September and October) coincides with the peaks with sunshine
hours. Although we didn‟t enquire the time spent outdoor, but the increase may be explained by a
combination of slightly more sunlight hours, more outdoors farming activities, and more sun
exposure during the cooler days of June to July. Furthermore, although the contribution of food in
vitamin D is about 10%, the availability of food and money (from selling crops) following harvest
may have contributed the slight increased serum vitamin D levels.
We found a lower albumin-corrected serum calcium concentration in the HIV/TB-coinfected
patients than in the HIV-1 patients, which was also, present when serum calcium concentrations
were not corrected for serum albumin. This finding was likely explained by the fact that
hypovitaminosis was more frequent among HIV/TB patients than among HIV patients; Calcium
absorption is known to be impaired when serum 25(OH)D concentrations are below 75 nmol/l
(117).

71
HIV-1 infected patients were older compared to those who were HIV negative. Most of those who
were HIV positive were in the age group 25-35 years. These results are consistent with the data
from Tanzania National AIDS Control Programme of 2008 which shows that the age group 20-49
years remained the most affected by HIV for both sexes, an observation that has remained
consistent for several years since the beginning of HIV epidemic (27).
Another limitation in this study was the cross-sectional design of it which hinders strong
conclusions on the direction of association. A prospective study following individuals with
hypovitaminosis for the development of tuberculosis, and optimal vitamin D HIV individuals on
ARV for the development of hypovitaminosis, and changes of vitamin D status during the course
of disease would be appropriate, however be difficult and costly.
4.2.5. Measurement precision
The high levels of hypovitaminosis D observed in our study cannot merely be the result of
imprecise measurements. Serum vitamin D levels were determined in an international reference
recognized laboratory (Hormone Laboratory, Department of Endocrinology, Oslo University
Hospital), ensuring high precision and reliability. If small inaccuracies in the measurement of
weight and height should have occurred, they would not materially change the observed range and
distribution of BMI. Our study is not the only one to have identified very high levels of
hypovitaminosis D. Several studies, for example in West Africa (98) and recent one among
Tanzanian in urban center (68) found hypovitaminosis D profiles that were equally unfavourable.
This further reduces the likelihood that measurement error or selection bias could largely explain
our findings. By all accounts, the risk of hypovitaminosis D in this community is alarmingly high.

72
4.2.6. Conclusion and recommendation
This cross-sectional study showed that, hypovitaminosis D was highly prevalent among HIV,
HIVTB and healthy individuals in rural Tanzania; advanced stage of HIV disease was associated
with lower serum 1,25(OH)2D concentrations, possibly due to reduced hydroxylation of 25-(OH)-
D to 1,25(OH)2D in the macrophages. Serum 25-(OH)-D concentration was higher in HIV
monoinfected than HIV/TB coinfected patients, hence hypovitaminosis D was more common
among HIV/TB coinfected compared to HIV-1 monoinfected but the difference was not
statistically significant due to small sample size. Hypovitaminosis D was significantly higher in
HIV patients on antiretroviral therapy compared with patients not on ART.
Advanced management of HIV have resulted in a dramatic decline of mortality, and increased long
term complications such as fracture due to reduced mineral bone density (118). Our study found a
high frequency of hypovitaminosis D among these patients which may be another added risk
factor. Our findings suggest that periodic screening of serum vitamin D and supplementation
should be considered in routine care of HIV infected patients, with emphasis given to patients with
coinfection however, safety and cost effectiveness need to be evaluated.
Given the high frequency of hypovitaminosis D found in this study, there is a need to work more
on health promotion activities to this community targeting the importance of physical activities,
exposure to sunlight and use of diets rich in vitamin D.
Areas for future research
Prospective well designed (studies) intervention based trials are difficult and costly however, are
needed for further evaluation on the relationship between adequate vitamin D repletion and
treatment/prevention of bacterial infections, especially Mycobacterium tuberculosis. Emphasis
should be put on effectiveness of repletion therapy, large sample size and factors that may
confound the results, such as; exogenous intake of vitamin D irrespective of the groups assignment,
independent effect of nutritional status improvement with TB therapy and seasonal variation with
vitamin D status.
The role of vitamin D status in modulating host immune response to HIV infection appears
complex. Evidence based information from both clinical and laboratory driven studies are clearly
needed to help clarify the complex encircled by vitamin D status, vitamin D metabolism, ART and
HIV infection in human host.

73
5. References
(1) National Bureau of Statistics (NBS) [Tanzania] and ORC Macro. Tanzania Demographic and Health Survey 2004-05. Dar es salaam-Tanzania: National Bureau of Statistics and ORC Macro; 2005.
(2) Tanzania Demographic Healthy Survey. Dar Es salaam: Tanzania National Bureau of Statistics; 2010.
(3) World Health Organization. World health statistics 2009. Geneva: World Health Organization; 2009.
(4) Yahya-Malima KI, Matee MI, Evjen-Olsen B, Fylkesnes K. High potential of escalating HIV transmission in a low prevalence setting in rural Tanzania. BMC Public Health %2007 Jun 9 ;7 :103 2007 Jun 9.
(5) Ngowi BJ, Mfinanga SG, Bruun JN, Morkve O. Pulmonary tuberculosis among people living with HIV/AIDS attending care and treatment in rural northern Tanzania. BMC Public Health %2008 Sep 30 ;8 :341 2008 Sep 30.
(6) Global TB/HIV Working Group, Meeting, (4th, 2004, Addis Ababa E, Stop TP. TB/HIV report of the fourth working group meeting, Addis Ababa, Ethiopia, 20-21 September 2004. Geneva: World Health Organization; 2005.
(7) S.M.Egwaga. National Tuberculosis and Leprosy Programme annual report. 2007.
(8) World Health Organization, Stop TP. HIV and TB in the context of universal access What is working and what is not? : report of an international open consultative meeting held in conjunction with the XVI International AIDS Conference, Toronto, Canada, 12-13 August 2006. Geneva: World Health Organization; 2007.

74
(9) Tanzania Commission for AIDS (TACAIDS) ZACZNoSNOotCGSOaMI. Tanzania HIV/AIDS and
Malaria Indicator Survey 2007-08. Dar es Salaam, Tanzania: TACAIDS, ZAC, NBS, OCGS,
and Macro International Inc.; 2008.
(10) Mistry of Health. National AIDS Control Program: Guidelines for health workers in the management of HIV/AIDS in Tanzania. Dar es Salaam: 2004.
(11) Markowitz N, Hansen NI, Hopewell PC, Glassroth J, Kvale PA, Mangura BT, et al. Incidence of tuberculosis in the United States among HIV-infected persons. The Pulmonary Complications of HIV Infection Study Group. Ann Intern Med %1997 Jan 15 ;126 (2):123 -32 1997;(2:123-32).
(12) Aaron L, Saadoun D, Calatroni I, Launay O, Memain N, Vincent V, et al. Tuberculosis in HIV-infected patients: a comprehensive review. Clin Microbiol Infect %2004 May ;10(5):388 -98 2004;(5:388-98).
(13) Trial J, Birdsall HH, Hallum JA, Crane ML, Rodriguez-Barradas MC, de Jong AL, et al. Phenotypic and functional changes in peripheral blood monocytes during progression of human immunodeficiency virus infection. Effects of soluble immune complexes, cytokines, subcellular particulates from apoptotic cells, and HIV-1-encoded proteins on monocytes phagocytic function, oxidative burst, transendothelial migration, and cell surface phenotype. J Clin Invest %1995 Apr;95 (4):1690 -701 1995;(4:1690-701).
(14) Imperiali FG, Zaninoni A, La ML, Tarsia P, Blasi F, Barcellini W. Increased Mycobacterium tuberculosis growth in HIV-1-infected human macrophages: role of tumour necrosis factor-alpha. Clin Exp Immunol %2001 Mar ;123 (3):435 -42 2001;(3:435-42).
(15) Whalen C, Horsburgh CR, Hom D, Lahart C, Simberkoff M, Ellner J. Accelerated course of human immunodeficiency virus infection after tuberculosis. Am J Respir Crit Care Med %1995 Jan ;151 (1):129 -35 1995;(1:129-35).
(16) Whalen CC, Nsubuga P, Okwera A, Johnson JL, Hom DL, Michael NL, et al. Impact of pulmonary tuberculosis on survival of HIV-infected adults: a prospective epidemiologic study in Uganda. Aids %2000 Jun 16 ;14(9 ):1219 -28 2000;(9:1219-28).
(17) Goldfeld AERSaTEN. Tuberculosis/Human immunodeficiency virus coinfection and the host immune response. Handbook of Tuberculosis: Immunology and Cell Biology. S.H.E. Kaufman and W.J., Britton ed. Wiley-VCH, Weinheim; 2008. p. 432.
(18) Goletti D, Weissman D, Jackson RW, Graham NM, Vlahov D, Klein RS, et al. Effect of Mycobacterium tuberculosis on HIV replication. Role of immune activation. J Immunol %1996 Aug 1;157 (3):1271 -8 1996;(3:1271-8).
(19) Toossi Z, Mayanja-Kizza H, Hirsch CS, Edmonds KL, Spahlinger T, Hom DL, et al. Impact of tuberculosis (TB) on HIV-1 activity in dually infected patients. Clin Exp Immunol %2001 Feb ;123 (2):233 -8 2001;(2:233-8).
(20) Manca C, Tsenova L, Barry CEI, Bergtold A, Freeman S, Haslett PA, et al. Mycobacterium tuberculosis CDC1551 induces a more vigorous host response in vivo and in vitro, but is not more virulent than other clinical isolates. J Immunol %1999 Jun 1;162 (11):6740 -6 1999;(11:6740-6).

75
(21) Reed MB, Domenech P, Manca C, Su H, Barczak AK, Kreiswirth BN, et al. A glycolipid of hypervirulent tuberculosis strains that inhibits the innate immune response. Nature %2004 Sep 2;431 (7004 ):84 -7 2004;(7004:84-7).
(22) World Health Organization. Global tuberculosis control, surveillance, planning, financing : WHO report 2008. Geneva: World Health Organization; 2008.
(23) Corbett EL, Marston B, Churchyard GJ, De Cock KM. Tuberculosis in sub-Saharan Africa: opportunities, challenges, and change in the era of antiretroviral treatment. Lancet %2006 Mar 18 ;367 (9514 ):926 -37 2006;(9514:926-37).
(24) Swaminathan S, Nagendran G. HIV and tuberculosis in India. J Biosci %2008 Nov ;33 (4):527 -37 2008;(4:527-37).
(25) World Health Organization. Global tuberculosis control epidemiology, planning, financing : WHO report 2009. Geneva: World Health Organization; 2009.
(26) Ministry Of Health and Social Welfare (MoHSW). Manual of the National Tuberculosis and Leprosy Programme in Tanzania. Fifth ed. The United Republic of Tanzania; 2006.
(27) Ministry of Health and Social Welfare. Manual of The National Aids Control Programme (NACP). Tanzania: Ministry of Health and Social Welfare; 2008.
(28) Holick MF. Vitamin D deficiency. N Engl J Med %2007 Jul %19 ;357 (3):266 -81 2007;(3:266-81).
(29) Lips P. Vitamin D physiology. Prog Biophys Mol Biol %2006 Sep ;92 (1):4-8 Epub 2006 Feb 28 2006;(1:4-8):Epub.
(30) Prosser DE, Jones G. Enzymes involved in the activation and inactivation of vitamin D. Trends Biochem Sci %2004 Dec ;29 (12 ):664 -73 2004;(12:664-73).
(31) Bleeker SE, Moll HA, Steyerberg EW, Donders AR, Derksen-Lubsen G, Grobbee DE, et al. External validation is necessary in prediction research: a clinical example. J Clin Epidemiol %2003 Sep ;56 (9 ):826 -32 2003;(9:826-32).
(32) Baeke F, Etten EV, Overbergh L, Mathieu C. Vitamin D3 and the immune system: maintaining the balance in health and disease. Nutr Res Rev %2007 Jun ;20 (1):106 -18 2007;(1:106-18).
(33) Lamberg-Allardt C. Vitamin D in foods and as supplements. Prog Biophys Mol Biol %2006 Sep ;92 (1):33 -8 Epub 2006 Feb 28 2006;(1:33-8):Epub.
(34) Gupta RP, He YA, Patrick KS, Halpert JR, Bell NH. CYP3A4 is a vitamin D-24- and 25-hydroxylase: analysis of structure function by site-directed mutagenesis. J Clin Endocrinol Metab %2005 Feb ;90 (2):1210 -9 Epub 2004 Nov 16 2005;(2:1210-9):Epub.
(35) Zhou C, Assem M, Tay JC, Watkins PB, Blumberg B, Schuetz EG, et al. Steroid and xenobiotic receptor and vitamin D receptor crosstalk mediates CYP24 expression and drug-induced osteomalacia. J Clin Invest %2006 Jun ;116 (6 ):1703 -12 Epub 2006 May 11 2006;(6:1703-12):Epub.
(36) van EE, Mathieu C. Immunoregulation by 1,25-dihydroxyvitamin D3: basic concepts. J Steroid Biochem Mol Biol %2005 Oct ;97 (1-2):93 -101 Epub 2005 Jul %19 2005;(1-2:93-101).

76
(37) Highleyman L. Nutrition and HIV. Beta %2006 Winter ;18 (2):18 -32(2:18-32).
(38) Martineau AR, Wilkinson RJ, Wilkinson KA, Newton SM, Kampmann B, Hall BM, et al. A single dose of vitamin D enhances immunity to mycobacteria. Am J Respir Crit Care Med 2007 Jul 15;176(2):208-13.
(39) Morcos MM GASSKMeBMeBMMRR. Vitamin D administration to tuberculous children and its value. Boll Chim Farm 1998;137(5):157-64.
(40) Nursyam EW, Amin Z RC. The effect of vitamin D as supplementary treatment in patients with moderately advanced pulmonary tuberculous lesion. Acta Med Indones 2006;38 (1):3-5.
(41) Wejse C, Gomes VF, Rabna P, Gustafson P, Aaby P, Lisse IM, et al. Vitamin D as supplementary treatment for tuberculosis: a double-blind, randomized, placebo-controlled trial. Am J Respir Crit Care Med 2009 May 1;179(9):843-50.
(42) Nnoaham KE, Clarke A. Low serum vitamin D levels and tuberculosis: a systematic review and meta-analysis. Int J Epidemiol %2008 Feb ;37 (1):113 -9(1:113-9).
(43) Bogh MK, Schmedes AV, Philipsen PA, Thieden E, Wulf HC. Vitamin D production after UVB exposure depends on baseline vitamin D and total cholesterol but not on skin pigmentation. J Invest Dermatol %2010 Feb ;130 (2):546 -53 Epub 2009 Oct 8 2010;(2:546-53):Epub.
(44) Mandavilli A. The sunshine cure. Nat Med 2007 Apr;13(4):396-7.
(45) Gibney KB, MacGregor L, Leder K, Torresi J, Marshall C, Ebeling PR, et al. Vitamin D deficiency is associated with tuberculosis and latent tuberculosis infection in immigrants from sub-Saharan Africa. Clin Infect Dis 2008 Feb 1;46(3):443-6.
(46) Martineau AR, Honecker FU, Wilkinson RJ, Griffiths CJ. Vitamin D in the treatment of pulmonary tuberculosis. J Steroid Biochem Mol Biol 2007 Mar;103(3-5):793-8.
(47) Chan TY. Seasonal variations in vitamin-D status and the incidence of tuberculosis in different countries. Respiration 1999;66(2):196.
(48) Wilkinson RJ, Llewelyn M, Toossi Z, Patel P, Pasvol G, Lalvani A, et al. Influence of vitamin D deficiency and vitamin D receptor polymorphisms on tuberculosis among Gujarati Asians in west London: a case-control study. Lancet %2000 Feb %19 ;355 (9204 ):618 -21(9204:618-21).
(49) Haug CJ, Aukrust P, Haug E, Morkrid L, Muller F, Froland SS. Severe deficiency of 1,25-dihydroxyvitamin D3 in human immunodeficiency virus infection: association with immunological hyperactivity and only minor changes in calcium homeostasis. J Clin Endocrinol Metab %1998 Nov ;83 (11):3832 -8 1998;(11:3832-8).
(50) Villamor E, Mugusi F, Urassa W, Bosch RJ, Saathoff E, Matsumoto K, et al. A trial of the effect of micronutrient supplementation on treatment outcome, T cell counts, morbidity, and mortality in adults with pulmonary tuberculosis. J Infect Dis %2008 Jun 1;197 (11):1499 -505 2008;(11:1499-505).
(51) Villamor E. A potential role for vitamin D on HIV infection? Nutr Rev %2006 May ;64 (5 Pt 1):226 -33(5 Pt 1:226-33).

77
(52) Arpadi SM, McMahon D, Abrams EJ, Bamji M, Purswani M, Engelson ES, et al. Effect of bimonthly supplementation with oral cholecalciferol on serum 25-hydroxyvitamin D concentrations in HIV-infected children and adolescents. Pediatrics 2009 Jan;123(1):e121-e126.
(53) Haug CJ, Muller F, Aukrust P, Froland SS. Different effect of 1,25-dihydroxyvitamin D3 on replication of Mycobacterium avium in monocyte-derived macrophages from human immunodeficiency virus-infected subjects and healthy controls. Immunol Lett %1998 Sep ;63 (2):107 -12 1998;(2:107-12).
(54) Haug CJ, Aukrust P, Lien E, Muller F, Espevik T, Froland SS. Disseminated Mycobacterium avium complex infection in AIDS: immunopathogenic significance of an activated tumor necrosis factor system and depressed serum levels of 1,25 dihydroxyvitamin D. J Infect Dis 1996 Jan;173(1):259-62.
(55) Martineau AR, Wilkinson KA, Newton SM, Floto RA, Norman AW, Skolimowska K, et al. IFN-gamma- and TNF-independent vitamin D-inducible human suppression of mycobacteria: the role of cathelicidin LL-37. J Immunol %2007 Jun 1;178 (11):7190 -8(11:7190-8).
(56) Lawn SD, Macallan DC. Hypercalcemia: a manifestation of immune reconstitution complicating tuberculosis in an HIV-infected person. Clin Infect Dis %2004 Jan 1;38 (1):154 -5 2004;(1:154-5).
(57) Conesa-Botella A, Mathieu C, Colebunders R, Moreno-Reyes R, van EE, Lynen L, et al. Is vitamin D deficiency involved in the immune reconstitution inflammatory syndrome? Aids Res Ther %2009 Apr 21;6 :4 2009 Apr 21.
(58) Nevado J TSCASS-PAAA. Activation of the human immunodeficiency virus type I long terminal repeat by 1 alpha,25-dihydroxyvitamin D3. J Mol Endocrinol 2007.
(59) Serrano S, Marinoso ML, Soriano JC, Rubies-Prat J, Aubia J, Coll J, et al. Bone remodelling in human immunodeficiency virus-1-infected patients. A histomorphometric study. Bone %1995 Feb ;16 (2):185 -91 1995;(2:185-91).
(60) Teichmann J, Stephan E, Discher T, Lange U, Federlin K, Stracke H, et al. Changes in calciotropic hormones and biochemical markers of bone metabolism in patients with human immunodeficiency virus infection. Metabolism %2000 Sep ;49 (9 ):1134 -9 2000;(9:1134-9).
(61) Cozzolino M, Vidal M, Arcidiacono MV, Tebas P, Yarasheski KE, Dusso AS. HIV-protease inhibitors impair vitamin D bioactivation to 1,25-dihydroxyvitamin D. Aids %2003 Mar 7 ;17(4):513 -20 2003;(4:513-20).
(62) Mueller NJ FCLBELSPDTMLCAVAB-FH. High prevalence of severe vitamin D deficiency in combined antiretroviral therapy-naive and successfully treated Swiss HIV patients. AIDS Res Hum Retroviruses 2010;24(00).
(63) Khazai N, Judd SE, Tangpricha V. Calcium and vitamin D: skeletal and extraskeletal health. Curr Rheumatol Rep %2008 Apr;10(2):110 -7 2008;(2:110-7).
(64) Heaney RP. Long-latency deficiency disease: insights from calcium and vitamin D. Am J Clin Nutr %2003 Nov ;78 (5):912 -9 2003;(5:912-9).

78
(65) Leboff MS, Kohlmeier L, Hurwitz S, Franklin J, Wright J, Glowacki J. Occult vitamin D deficiency in postmenopausal US women with acute hip fracture. Jama %1999 Apr 28 ;281 (16 ):1505 -11 1999;(16:1505-11).
(66) Van Den Bout-Van Den Beukel CJ, Fievez L, Michels M, Sweep FC, Hermus AR, Bosch ME, et al. Vitamin D deficiency among HIV type 1-infected individuals in the Netherlands: effects of antiretroviral therapy. AIDS Res Hum Retroviruses 2008 Nov;24(11):1375-82.
(67) Range N, Changalucha J, Krarup H, Magnussen P, Andersen AB, Friis H. The effect of multi-vitamin/mineral supplementation on mortality during treatment of pulmonary tuberculosis: a randomised two-by-two factorial trial in Mwanza, Tanzania. Br J Nutr %2006 Apr;95 (4):762 -70 2006;(4:762-70).
(68) Friis H, Range N, Pedersen ML, Molgaard C, Changalucha J, Krarup H, et al. Hypovitaminosis D is common among pulmonary tuberculosis patients in Tanzania but is not explained by the acute phase response. J Nutr 2008 Dec;138(12):2474-80.
(69) Martineau AR, Wilkinson KA, Newton SM, Floto RA, Norman AW, Skolimowska K, et al. IFN-gamma- and TNF-independent vitamin D-inducible human suppression of mycobacteria: the role of cathelicidin LL-37. J Immunol %2007 Jun 1;178 (11):7190 -8 2007;(11:7190-8).
(70) Davoudi S, Rasoolinegad M, Younesian M, Hajiabdolbaghi M, Soudbakhsh A, Jafari S, et al. CD4+ cell counts in patients with different clinical manifestations of tuberculosis. Braz J Infect Dis %2008 Dec ;12 (6 ):483 -6 2008;(6:483-6).
(71) Murugavel KG, Balakrishnan P, Mohanakrishnan J, Solomon SS, Shankar EM, Muthu Sundaram SP, et al. Establishment of T-lymphocyte subset reference intervals in a healthy adult population in Chennai, India. Indian J Med Res %2009 Jan ;129 (1):59 -63 2009;(1:59-63).
(72) Mair C, Hawes SE, Agne HD, Sow PS, N'doye I, Manhart LE, et al. Factors associated with CD4 lymphocyte counts in HIV-negative Senegalese individuals. Clin Exp Immunol %2008 Mar ;151 (3):432 -40 Epub 2008 Jan 10 2008;(3:432-40):Epub.
(73) Stephensen CB, Marquis GS, Kruzich LA, Douglas SD, Aldrovandi GM, Wilson CM. Vitamin D status in adolescents and young adults with HIV infection. Am J Clin Nutr %2006 May ;83 (5):1135 -41 2006;(5:1135-41).
(74) Tanzania Ministry of Healthy. The Adult Morbidity and Mortality Project: National Mortality Burden Estimates. 2001.
(75) World Health Organisation. World Health Organisation: Scaling up antiretroviral therapy in resource-limited settings: Treatment guidelines for a public health approach. 2003 revision . Geneva: 2004.
(76) WHO. Ministry of Health, United Republic of Tanzania. Manual for the National Tuberculosis and Leprosy Programme. Geneva: 1995.
(77) World Health Organisation. Treatment of Tuberculosis:guidelines for national programmes. Geneva: 2003.

79
(78) Urassa W, Nozohoor S, Jaffer S, Karama K, Mhalu F, Biberfeld G. Evaluation of an alternative confirmatory strategy for the diagnosis of HIV infection in Dar Es Salaam, Tanzania, based on simple rapid assays. J Virol Methods %2002 Feb ;100 (1-2):115 -20 2002;(1-2:115-20).
(79) Lyamuya EF, Aboud S, Urassa WK, Sufi J, Mbwana J, Ndugulile F, et al. Evaluation of simple rapid HIV assays and development of national rapid HIV test algorithms in Dar es Salaam, Tanzania. BMC Infect Dis %2009 Feb 18 ;9 :19 2009 Feb 18.
(80) Nnoaham KE, Clarke A. Low serum vitamin D levels and tuberculosis: a systematic review and meta-analysis. Int J Epidemiol 2008 Feb;37(1):113-9.
(81) Antoniucci DM, Black DM, Sellmeyer DE. Serum 25-hydroxyvitamin D is unaffected by multiple freeze-thaw cycles. Clin Chem %2005 Jan ;51 (1):258 -61 2005;(1:258-61).
(82) Sukovaty RL, Lee JW, Fox J, Toney K, Papac DI, Grover TA, et al. Quantification of recombinant human parathyroid hormone (rhPTH(1-84)) in human plasma by immunoassay: commercial kit evaluation and validation to support pharmacokinetic studies. J Pharm Biomed Anal %2006 Sep 18 ;42 (2):261 -71 Epub 2006 Jun 9 2006;(2:261-71):Epub.
(83) Gomez AC, Naves DM, Rodriguez GM, Fernandez Martin JL, Cannata Andia JB. [Review of the concept of vitamin D "sufficiency and insufficiency"]. Nefrologia %2003 ;23 Suppl 2:73 -7 2003.
(84) Brodie MJ, Boobis AR, Hillyard CJ, Abeyasekera G, Stevenson JC, MacIntyre I, et al. Effect of rifampicin and isoniazid on vitamin D metabolism. Clin Pharmacol Ther %1982 Oct ;32 (4):525 -30 1982;(4:525-30).
(85) Evans P, Halliwell B. Micronutrients: oxidant/antioxidant status. Br J Nutr %2001 May ;85 Suppl 2:S67 -74 2001 May.
(86) Carvalho BM, Monteiro AJ, Pires Neto RJ, Grangeiro TB, Frota CC. Factors related to HIV/tuberculosis coinfection in a Brazilian reference hospital. Braz J Infect Dis %2008 Aug ;12 (4):281 -6 2008;(4:281-6).
(87) Barber Y, Rubio C, Fernandez E, Rubio M, Fibla J. Host genetic background at CCR5 chemokine receptor and vitamin D receptor loci and human immunodeficiency virus (HIV) type 1 disease progression among HIV-seropositive injection drug users. J Infect Dis 2001 Nov 15;184(10):1279-88.
(88) Hulley SB CSBWGDHNNTB. Designing Clinical Research. Second ed. Philadelphia: Lippincott Williams & Wilkins; 2001.
(89) Daniel WW. Biostatistics; A foundation for analysis in the health sciences. Eight ed. John Wiley & Sons, 2005.
(90) Rothman KJ. Epidermiology; An introduction. New York: Oxford University Press, Inc; 2000.
(91) Feleke Y, Abdulkadir J, Mshana R, Mekbib TA, Brunvand L, Berg JP, et al. Low levels of serum calcidiol in an African population compared to a North European population. Eur J Endocrinol %1999 Oct ;141 (4):358 -60 1999;(4:358-60).
(92) Pettifor JM. Nutritional rickets: deficiency of vitamin D, calcium, or both? Am J Clin Nutr %2004 Dec ;80 (6 Suppl):1725S -9S 2004;(6 Suppl:1725S-9S).

80
(93) Thacher TD, Fischer PR, Pettifor JM, Lawson JO, Isichei CO, Reading JC, et al. A comparison of calcium, vitamin D, or both for nutritional rickets in Nigerian children. N Engl J Med %1999 Aug 19 ;341 (8 ):563 -8 1999;(8:563-8).
(94) Glerup H, Mikkelsen K, Poulsen L, Hass E, Overbeck S, Thomsen J, et al. Commonly recommended daily intake of vitamin D is not sufficient if sunlight exposure is limited. J Intern Med %2000 Feb ;247 (2):260 -8 2000;(2:260-8).
(95) Davies PD, Brown RC, Woodhead JS. Serum concentrations of vitamin D metabolites in untreated tuberculosis. Thorax %1985 Mar ;40 (3):187 -90 1985;(3:187-90).
(96) Wilkinson RJ, Llewelyn M, Toossi Z, Patel P, Pasvol G, Lalvani A, et al. Influence of vitamin D deficiency and vitamin D receptor polymorphisms on tuberculosis among Gujarati Asians in west London: a case-control study. Lancet %2000 Feb %19 ;355 (9204 ):618 -21 2000;(9204:618-21).
(97) Ustianowski A, Shaffer R, Collin S, Wilkinson RJ, Davidson RN. Prevalence and associations of vitamin D deficiency in foreign-born persons with tuberculosis in London. J Infect %2005 Jun ;50 (5):432 -7 2005;(5:432-7).
(98) Wejse C, Olesen R, Rabna P, Kaestel P, Gustafson P, Aaby P, et al. Serum 25-hydroxyvitamin D in a West African population of tuberculosis patients and unmatched healthy controls. Am J Clin Nutr 2007 Nov;86(5):1376-83.
(99) Grange JM, Davies PD, Brown RC, Woodhead JS, Kardjito T. A study of vitamin D levels in Indonesian patients with untreated pulmonary tuberculosis. Tubercle %1985 Sep ;66 (3):187 -91 1985;(3:187-91).
(100) Chan TY. Differences in vitamin D status and calcium intake: possible explanations for the regional variations in the prevalence of hypercalcemia in tuberculosis. Calcif Tissue Int 1997 Jan;60(1):91-3.
(101) Holick MF. High prevalence of vitamin D inadequacy and implications for health. Mayo Clin Proc %2006 Mar ;81 (3):353 -73 2006;(3:353-73).
(102) Liu PT, Stenger S, Tang DH, Modlin RL. Cutting edge: vitamin D-mediated human antimicrobial activity against Mycobacterium tuberculosis is dependent on the induction of cathelicidin. J Immunol 2007 Aug 15;179(4):2060-3.
(103) Houben EN, Walburger A, Ferrari G, Nguyen L, Thompson CJ, Miess C, et al. Differential expression of a virulence factor in pathogenic and non-pathogenic mycobacteria. Mol Microbiol %2009 Apr;72 (1):41 -52 Epub 2009 Feb 2 2009;(1:41-52):Epub.
(104) Villamor E. A potential role for vitamin D on HIV infection? Nutr Rev %2006 May ;64 (5 Pt 1):226 -33 2006;(5 Pt 1:226-33).
(105) Teichmann J, Stephan E, Lange U, Discher T, Friese G, Lohmeyer J, et al. Osteopenia in HIV-infected women prior to highly active antiretroviral therapy. J Infect %2003 May ;46 (4):221 -7 2003;(4:221-7).
(106) Mehta S, Giovannucci E, Mugusi FM, Spiegelman D, Aboud S, Hertzmark E, et al. Vitamin D status of HIV-infected women and its association with HIV disease progression, anemia, and mortality. PLoS One %2010 Jan %19 ;5(1):e8770 2010;(1:e8770).

81
(107) Ohyama Y, Okuda K. Isolation and characterization of a cytochrome P-450 from rat kidney mitochondria that catalyzes the 24-hydroxylation of 25-hydroxyvitamin D3. J Biol Chem %1991 May 15 ;266 (14):8690 -5 1991;(14:8690-5).
(108) Hurwitz S. Homeostatic control of plasma calcium concentration. Crit Rev Biochem Mol Biol %1996 Feb ;31 (1):41 -100 1996;(1:41-100).
(109) Phair J, Palella F. Renal disease in HIV-infected individuals. Curr Opin Hiv Aids %2011 Apr 23 2011 Apr 23.
(110) Bikle DD, Pillai S, Gee E, Hincenbergs M. Tumor necrosis factor-alpha regulation of 1,25-dihydroxyvitamin D production by human keratinocytes. Endocrinology %1991 Jul ;129 (1):33 -8 1991;(1:33-8).
(111) Hestdal K, Aukrust P, Muller F, Lien E, Bjerkeli V, Espevik T, et al. Dysregulation of membrane-bound tumor necrosis factor-alpha and tumor necrosis factor receptors on mononuclear cells in human immunodeficiency virus type 1 infection: low percentage of p75-tumor necrosis factor receptor positive cells in patients with advanced disease and high viral load. Blood %1997 Oct 1;90 (7 ):2670 -9 1997;(7:2670-9).
(112) Lawn SD, Butera ST, Shinnick TM. Tuberculosis unleashed: the impact of human immunodeficiency virus infection on the host granulomatous response to Mycobacterium tuberculosis. Microbes Infect %2002 May ;4(6 ):635 -46 2002;(6:635-46).
(113) Fox J, Peters B, Prakash M, Arribas J, Hill A, Moecklinghoff C. Improvement in vitamin D deficiency following antiretroviral regime change: Results from the MONET trial. AIDS Res Hum Retroviruses %2011 Jan ;27 (1):29 -34 Epub 2010 Sep 21 2011;(1:29-34):Epub.
(114) Conesa-Botella A, Mathieu C, Colebunders R, Moreno-Reyes R, van EE, Lynen L, et al. Is vitamin D deficiency involved in the immune reconstitution inflammatory syndrome? AIDS Res Ther 2009 Apr 21;6:4.
(115) Murdoch DM, Venter WD, Van RA, Feldman C. Immune reconstitution inflammatory syndrome (IRIS): review of common infectious manifestations and treatment options. Aids Res Ther %2007 May 8 ;4:9 2007 May 8.
(116) Holick MF. McCollum Award Lecture, 1994: vitamin D--new horizons for the 21st century. Am J Clin Nutr %1994 Oct ;60 (4):619 -30 1994;(4:619-30).
(117) Hollis BW. Circulating 25-hydroxyvitamin D levels indicative of vitamin D sufficiency: implications for establishing a new effective dietary intake recommendation for vitamin D. J Nutr %2005 Feb ;135 (2):317 -22 2005;(2:317-22).
(118) Stone B, Dockrell D, Bowman C, McCloskey E. HIV and bone disease. Arch Biochem Biophys %2010 Nov 1;503 (1):66 -77 Epub 2010 Aug 1 2010;(1:66-77):Epub.
82
6. Appendices
6.1. Patient consent form
Studies on HIV, nutrition and co-infections:
You are invited to participate in a research study looking for vitamin D status and co-infections in
people living with HIV/AIDS. HIV/TB co-infection is among the main causes of morbidity and
mortality in Sub-Saharan Africa, but other infections such as hepatitis B and cytomegalovirus
(CMV) are also frequent.
Purpose of the study: to establish the interaction between Vitamin D, HIV and HIV/TB co-
infection, and to study other co-infections such as hepatitis B and CMV.
Information registered: The study is based on information routinely registered in the hospital files
on demographic, clinical and laboratory data. Blood samples for additional evaluation of the
vitamin D-metabolism will be obtained in connection with routine laboratory tests. In addition to
routinely registered information and blood samples, face to face interview on food frequency recall
will be conducted.
Storage of specimens: The collected blood samples will be analyzed as described and any surplus
material will be stored (maximum 30 years) for possible future studies. If you consent to
participate in the study you also consent to the use of remnant specimens for other HIV-relevant
studies. Oslo University Hospital, Ullevål (Norway) is responsible for stored samples.
Risks and Benefits of Study Participation: All patients will receive the best treatment in
accordance with national and WHO guidelines for HIV/AIDS and TB. Any pathology during
examination will be referred to the appropriate clinic for further managements. The study will also
pay for the additional lab tests such as vitamin D, calcium and phosphorus. In the long term, the
findings from this study could be used to plan effective programmes to benefit management of
HIV patients. Minimal risks include loss of time and the discomfort of an additional venipuncture.
Participation in the study is voluntary. Patients have the right to withdraw from the study at any
time without being excluded from further care and treatment. They can claim access to their
registered data at any point.

83
Any information given by the patient is confidential. Only the clinicians and the researchers will
have access to patient information. Data in the study are kept anonymous and secure. In any
publications or presentations, we will not include any information that will make it possible to
identify you as a subject.
Responsible for the study: Dr Sokoine Kivuyo, National Institute for Medical Research (Tanzania)
master student at University of Oslo (Norway) will be responsible for the registration of data and
the practical follow up of the study. Project responsible is professor Johan N. Bruun and dr Asgeir
Johannessen, Oslo University Hospital, Ullevål (Norway).
Statement of Consent:I consent to participate in the study.
Signature of Subject_______________________________________________
Date_________________
Signature of Investigator___________________________________________
Date_________________
6.2. Swahili Patient Consent form.
Ridhaa ya kushiriki katika utafiti
Utafiti wa ukimwi, Lishe, na magonjwa nyemelezi.
Unakaribishwa kushiriki katika utafiti huu kuhusu viwango vya vitamini D pamoja na magonjwa
nyemelezi kwa watu wanaoishi na virusi vya Ukimwi. Ukimwi na Kifua kikuu kwa pamoja ni
miongoni mwa magonjwa yanayosababisha matatiza na vifo vingi kwa nchi za Africa zilizo chini
ya Jangwa la Sahara, pia hepatitis B na Cytomegalovirus ni miongoni.
Kazi hii ni utafiti wa kisayansi kufahamu zaidi kuhusu sababu za upungufu wa vitamini D kwa
watu waishio na virusi vya ukimwi pamoja na kifua kikuu. Kamati ya maadili ya utafiti nchini
Tanzania na ng‟ambo (Chuo kikuu cha Oslo nchini Norway) wamehalalisha utafiti huu kufanyika.

84
Utafiti huu unafanyika kwa sababu Ukimwi na Kifua kikuu ni tatizo kubwa katika nchi yetu, na
labda kushiriki kwako au mtoto wako huenda ukasaidia kupata njia mpya za kukinga au kutibu
upungufu wa vitamini D. Kwa mtazamo huu moja ya faida ya kushiriki utafiti huu ni kuboresha
afya yako au ya mtoto wako.
Tunaomba uwe mmojawapo katika utafiti huu kwa sababu ushiriki wako au wa mtoto wako
unaweza kutusaidia sisi kujua sababu za upungufu wa vitamini D kwa watu wenye Ukimwi au
Kifua Kikuu.
Ni mambo gani yatatokea na kutendeka katika ipindi cha utafiti?
Iwapo wewe au mtoto wako utakubali kushiriki katika utafiti huu tutafanya yafuatayo:
Tutachukua sampuli ndogo ya damu (kiasi cha kijiko cha chai) ili kuangalia kiwango cha vitamini
D, kinga(CD4), wingi wa virusi pamoja na madini ya calcium. Tutakukupima wewe (au mtoto)
uzito na urefu wako. Tutakusaili pia mambo yahusuyo vyakula vya kuongeza vitamini D mwilini.
Tutazihifadhi sampuli zote zako na za mtoto, yaani za damu tulizochukua kwa ajili ya utafiti huu.
Tutaweka ndani ya stoo nzuri, kama friji, na watu wa utafiti huu tu ndiyo wenye ruksa kuziona na
kutumia. Baadhi ya sampuli hizo zitapelekwa maabara nchini Norway kwa vipimo maalumu vya
upungufu wa vitamini D, homoni ya parathyroid, na cytomegalovirus. Sampuli zote
zitakazowekwa stoo zitapata namba zao ili sampuli zisiwe na lebo za jina lako au anuani yako.
Sampuli za damu zitakazobaki baada ya utafiti huu, tutahifadhi (hadi miaka 30) kwa ajili ya tafiti
zingine. Hata ukibadili uamuzi wako kuhusu sampuli zako zilizohifadhiwa zisitumike kwa tafiti
zingine, unaweza kuwasiliana na sisi na sampuli zikaharibiwa na zisihifadhiwe.
Faida za utafiti .
Vitu vizuri vinaweza pia kutokea kwa watu kwa sababu ya kushiriki kwao katika tafiti huu. Faida
yako kushiriki katika utafiti huu zinaweza kuwa kwamba tutaweza kujua sababu za matatizo ya
ukosefu wa vitamini D kwako/ mtoto wako, na ikitokea tutakupatia rufaa kwenda kupata matibabu
yanayostahili. Pia utafiti huu utagharamia baadhi ya vipimo kama kiasi cha kinga(CD4), virusi
(viral loads), kiwango cha vitamini D ambavyo ni muhumu kwa maendeleo ya afya yako. Daktari
au mtafiti atakujulisha taarifa muhimu itokanayo na utafiti huu ambayo ni muhimu kwa afya
yako pia
Athari za utafiti huu?
Wakati mwingine vitu hutokea kwa watu katika tafiti ambazo zinaweza kuwaumiza wao au
kuwafanya wajisikie vibaya. Inawezekana katika utafiti huu ukajisikia vibaya kiasi unapojibu
maswali. Wakati wa kuchoma sindano kuchukua damu wewe au mtoto wako mnaweza kupata

85
maumivu kidogo kwa muda, na dalili ndogo au mchubuko kutokana na kuchoma sindano. Kwa
kuwa taarifa zinazokusanyika katika utafiti huu zinaweza kukutambua wewe na mtoto wako,
tutakuwa makini sana kuzilinda taarifa zinazokuhusu wewe binafsi.
Kushiriki ni lazima au la?
Hutakuwepo katika utafiti huu kama hutapenda kushiriki. Hii ina maana kwamba ushiriki wako ni
wa hiari. Wakati wowote unaweza kujitoa kushiriki katika utafiti huu. Ukiamua kukitoa kibali
chako cha kutoa taarifa zako na za mtoto wako naomba umwone Dr Sokoine L Kivuyo wa Taasisi
ya Taifa ya Utafiti wa Magonjwa ya binadamu. Atakusaidia kuandika uamusi wako kwa kukitoa
kibali chako, na ukipenda kuviharibu vipimo vyako vyote vilivyochukuliwa awali na vya mtoto
wako, na kuzitoa data zako zilizoko katika kompyuta zetu.
Ukiamua kutokushiriki, au baadaye ukijitoa utafitini wakati wowote hakuna mtu
atakayekulaimisha. Hakuna atakayekuhudumia tofauti kwa sababu umekataa kushiriki katika
utafiti huo. Huduma yako ya kawaida haitabadilika.
Nitawasiliana na nani iwapo nitakuwa na maswali yanayohusiana na utafiti huu?
Sokoine Lesikari Kivuyo
National Institute for Medical Research (NIMR)
2448, Ocean Road, Junction of Luthuli / Sokoine Drive
P.O.BOX 9653 Dar es salaam, Tanzania Tel: +255-682887292
Professor Johan N. Bruun and Dr Asgeir Johannessen, Tel: +4797983264
Oslo University Hospital, Ullevål (Norway).
Saini
Naomba uulize maswali yako kuhusu utafiti huu kabla ya kusaini.
_______________________________ ________________________________ __________
Jina la mshiriki Jina Tarehe
(saini) (chapa)
_______________________________ ________________________________ __________

86
Jina la Jina Tarehe
(saini) (chapa) (Print)
Kwa msaili : Kama msailiwa hajui kuandika hii fomu utamsomesha akiwa na mshahidi
(asiyehusika na utafiti huu) na kupiga dole gumba mahali pa saini. Mshahidi apige saini pia.
_______________________________ ________________________________ __________
Jina la shahidi Jina la shahidi
(saini) chapa
6.3. Medical Record Abstraction Tool
Unique Abstraction Code:________ ART Site Name: __________
Abstractor‟s Initials: ___________ Date of Abstraction____________
A. Record Identifiers
Facility Name: __________ Unique Study ID Number: -----------
B. Demographic
Sex: Male-------- Female ----------Missing---------
Marital Status:
Single ----------Married--------------Cohabiting----------Divorced/Separated-------------Widow/Widowed ------
-----------Missing-------------------
Date of Birth: -------------------- Missing-------------------
Age: Years---------- Missing---------
Anthropometric measurements
A. Body weight…………………Kg B. Height…………………cm
BMI…………………..Kg/m2

87
C. Treatment Information
Prior ARV Exposure:
None ----------------------PMTCT…………………. Combination Therapy----------------
Prior Therapy (transfer in without records) ------------- Missing-----------
PMTCT Monotherapy Transfer In, date: ___/___/___ or,
date missing____________
Prior regimen _____________Date Confirmed HIV+___________Missing_________
Date Enrolled in Care__________Missing__________________
Date Medically Eligible for ART:___________Missing________________
Date Eligible & Ready for ART: ________Missing________
Date Start ART: _______ Missing________
Prior to anti-TB exposure:
Prior regimen _____________Date confirmed TB positive_________Missing________
Date started anti-TB______________Missing____________
Why Eligible for ART (circle as appropriate and record value)
Clinical Only----------CD4 Count %--------TLC--------
Status at Start ART:
WHO Clinical Stage……..Missing…… ……Weight: ……. …Kg Height…….Missing………
Functional Status: (W, A or B)………Missing………… CD4: cells/dl…………. Missing………….
Enrollment Visit

88
Enrollment Visit Date: ……… Missing…… Weight……… Kg Missing ………
WHO Clinical Stage……….. Missing………….
Functional Status: Working …….Ambulatory….. Bed-ridden……. Missing…….
TB Status Code:
1. NO 2. REFER 3. SP 4. CONFIRM 5. INH 6. TB/RX
7. Missing
ART Status at Enrollment :( select one)
1 - No ARV 2. Start ART 3. Continue 4. Change 5. Stop 6. Restart
7. Missing
If on ARV, which combination…………………Hb at ART Initiation: ……. ( g/dl) Missing………..
ALT at ART Initiation.……..Missing…….ALP at ART Initiation………..Missing……
H. Follow-up Visit (ideally at 6 months)
ART Visit Date: ……… Missing………..Weight: …….. Kg Missing……….
Height………..Missing………………….WHO Clinical Stage …… Missing……….
Functional Status:
Working ……. Ambulatory…..Bed-ridden…….. Missing………..
TB Status Code:
1. NO 2. REFER 3. SP 4. CONFIRM 5. INH 6. TB/RX
7. Missing
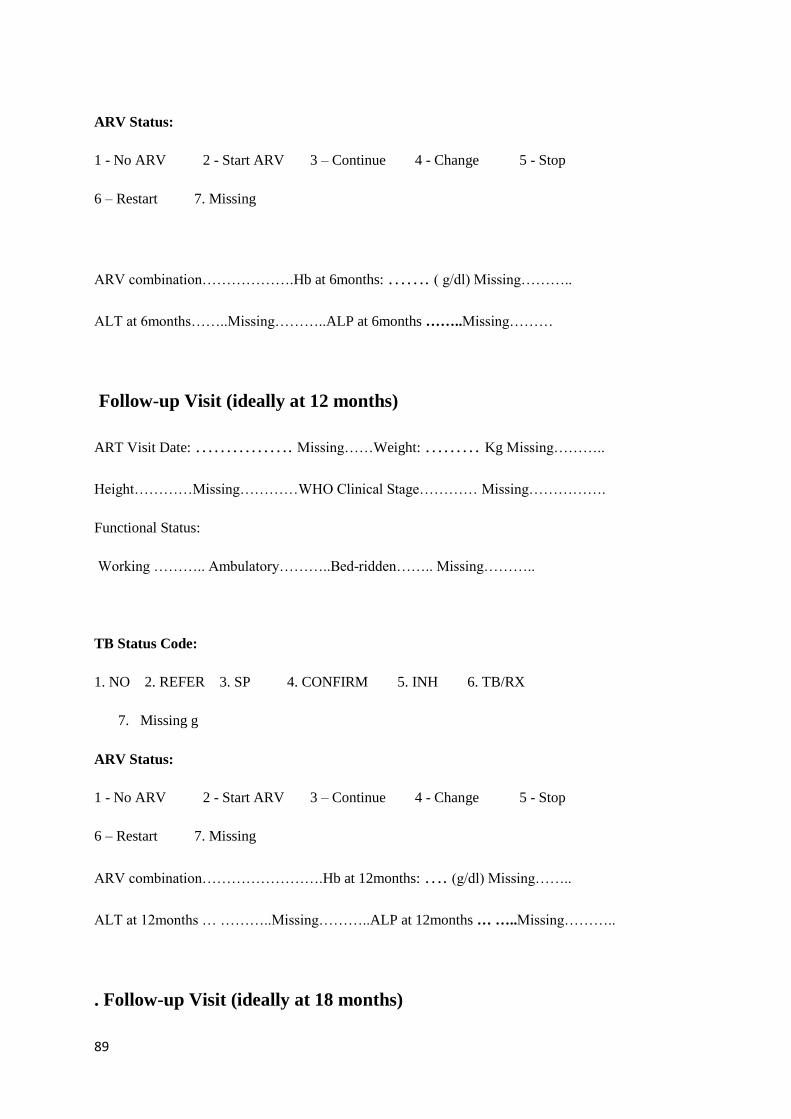
89
ARV Status:
1 - No ARV 2 - Start ARV 3 – Continue 4 - Change 5 - Stop
6 – Restart 7. Missing
ARV combination……………….Hb at 6months: ……. ( g/dl) Missing………..
ALT at 6months……..Missing………..ALP at 6months ……..Missing………
Follow-up Visit (ideally at 12 months)
ART Visit Date: ……………. Missing……Weight: ……… Kg Missing………..
Height…………Missing…………WHO Clinical Stage………… Missing…………….
Functional Status:
Working ……….. Ambulatory………..Bed-ridden…….. Missing………..
TB Status Code:
1. NO 2. REFER 3. SP 4. CONFIRM 5. INH 6. TB/RX
7. Missing g
ARV Status:
1 - No ARV 2 - Start ARV 3 – Continue 4 - Change 5 - Stop
6 – Restart 7. Missing
ARV combination…………………….Hb at 12months: …. (g/dl) Missing……..
ALT at 12months … ………..Missing………..ALP at 12months … …..Missing………..
. Follow-up Visit (ideally at 18 months)

90
ART Visit Date: ……………. Missing………Weight: ……….. Kg Missing………..
Height…………Missing…………..WHO Clinical Stage…… Missing…….
Functional Status:
Working ….. Ambulatory…..Bed-ridden….. Missing…….
TB Status Code:
1. NO 2. REFER 3. SP 4. CONFIRM 5. INH 6. TB/RX
7. Missing
ARV Status:
1 - No ARV 2 - Start ARV 3 – Continue 4 - Change 5 - Stop
6 – Restart 7. Missing
ARV combination……………….Hb at 18months: ……. ( g/dl) Missing………..
ALT at 18months … …Missing………..ALP at 18months … …Missing………..
Follow-up Visit (ideally at 24 months)
ART Visit Date ……………. Missing………..Weight: ……….. Kg Missing………..
Height………..Missing…………WHO Clinical Stage………… Missing…………….
Functional Status:
Working ……….. Ambulatory………..-Bed-ridden…….. Missing………..
TB Status Code:

91
1. NO 2. REFER 3. SP 4. CONFIRM 5. INH 6. TB/RX
7. Missing
ARV Status:
1 - No ARV 2 - Start ARV 3 – Continue 4 - Change 5 - Stop
6 – Restart 7. Missing
Hb at 24months: ……. ( g/dl) Missing………..ALT at 24months ……………..Missing………..
ALP at 24months … ………..Missing………..
Follow – Up Status (last visit/retention)
Date of most recent (last) follow-up visit…………….
ARV combination……………….
ART Status most recent: (select one)
1 - No ARV 2 - Start ARV 3 – Continue 4 - Change 5 - Stop
6 – Restart 7. Missing
Hb at last visit: ……. ( g/dl) Missing………..ALT at last visit …………..Missing………..
ALP at last visit … …………..Missing………..Weight………….Kg Height………..
Was CD4 count recorded at any time?
Yes No Missing
If yes, please list the dates and values?

92
……………….. cells/dl
DD MM YY
……………….. cells/dl
DD MM YY
……………….. cells/dl
DD MM YY
Was viral load recorded at any time?
Yes……… No ……..Missing…………
If yes, please list the dates and values?
…………… copies/ml
DD MM YY
……………… copies/ml
DD MM YY
Chest examinnation; Normal……………..Abnormal…………….
Chest X-ray results: Normal…………Cavity…………Other abnormalities (specify)……………..
Laboratory parameters;
Serum calcium-----------------mmol/l Serum albúmin--------------g/l
Serum Phosphorus------------mmol/l Serum 25(OH)D-------------nmol/l
Serum 1,25(OH)D-----------pmol/l Serum PTH-------------------pmol/l
ALAT……………………. u/l ASAT…………………….u/l
Creatinine………………….umol/l

93