urban food waste composting - mcgill …digitool.library.mcgill.ca/thesisfile97883.pdfurban food...
TRANSCRIPT

URBAN FOOD WASTE COMPOSTING
Bijaya K. Adhikari
Department of Bioresource Engineering
McGiIl University, Montreal
December 2005
A thesis submitted to McGiIl University in partial fulfilment of the requirements of the degree of master of science
© Bijaya K. Adhikari, 2005

1+1 Library and Archives Canada
Bibliothèque et Archives Canada
Published Heritage Branch
Direction du Patrimoine de l'édition
395 Wellington Street Ottawa ON K1A ON4 Canada
395, rue Wellington Ottawa ON K1A ON4 Canada
NOTICE: The author has granted a nonexclusive license allowing Library and Archives Canada to reproduce, publish, archive, preserve, conserve, communicate to the public by telecommunication or on the Internet, loan, distribute and sell th es es worldwide, for commercial or noncommercial purposes, in microform, paper, electronic and/or any other formats.
The author retains copyright ownership and moral rights in this thesis. Neither the thesis nor substantial extracts from it may be printed or otherwise reproduced without the author's permission.
ln compliance with the Canadian Privacy Act some supporting forms may have been removed from this thesis.
While these forms may be included in the document page count, their removal does not represent any loss of content from the thesis.
• •• Canada
AVIS:
Your file Votre référence ISBN: 978-0-494-24592-7 Our file Notre référence ISBN: 978-0-494-24592-7
L'auteur a accordé une licence non exclusive permettant à la Bibliothèque et Archives Canada de reproduire, publier, archiver, sauvegarder, conserver, transmettre au public par télécommunication ou par l'Internet, prêter, distribuer et vendre des thèses partout dans le monde, à des fins commerciales ou autres, sur support microforme, papier, électronique et/ou autres formats.
L'auteur conserve la propriété du droit d'auteur et des droits moraux qui protège cette thèse. Ni la thèse ni des extraits substantiels de celle-ci ne doivent être imprimés ou autrement reproduits sans son autorisation.
Conformément à la loi canadienne sur la protection de la vie privée, quelques formulaires secondaires ont été enlevés de cette thèse.
Bien que ces formulaires aient inclus dans la pagination, il n'y aura aucun contenu manquant.

ABSTRACT
In this thesis, a study was undertaken on the premise that the world population living in urban centers is expected to increase from 3.8 billion to 5.2 billion, from 2005 to 2025, representing 54% and 65% of total world population, respectively. The urban population (UP) growth will produce remarkable amounts of urban food waste (UFW) that will add more pressure on already overloaded municipal solid waste (MSW) management systems of cities. This problem is more serious in countries experiencing major economic growth such as China where UP is expected to increase from 44% to 66% of the total country population, from 1995 to 2025. Asia produces the largest amount of UFW, which is expected to increase from 251 million ton to 418 million ton (45% to 53% of total world UFW) from 1995 to 2025. On site treatment ofUFW along with a limited movement of wOrld population from rural to urban areas are suggested to reduce pressure on MSW management system for the upcoming decades.
In this thesis, a project was also undertaken to develop compost recipes for urban center such as downtown Montreal. Monthly (June to August) average residential FW production was found to 0.61 (+/-0.13) kg capita-l dail and that of a restaurant was found to be 0.56 (+/-0.23) kg customer-l dail. From trial tests, the best compost recipes mixed 8.9 kg, 8.6 kg and 7.8 kg of UFW for every kg of wheat straw, hay and wood shaving, on a wet mass basis. However, quantity and characteristics ofFW vary from one month to another; therefore, regular adjustment of compost recipe is recommended. When using wood shavings as bulking agent, it is strongly recommended to correct the acidpH.

RESUME
Cette thèse comporte une étude qui prévoit que la population qui occupe les villes du monde (PU) augmentera de 3,8 à 5,2 milliard (de 54 à 65% de population totale mondiale), au cours des prochains 20 ans. Cette croissance fera en sorte que des quantités remarquables de déchets organiques (UFW) devront être géré par les villes alors que plusieurs d'entre elles n'arrivent même pas aujourd'hui à éliminer leurs vidanges. Cette augmentation sera encore plus prononcée chez les pays où on vie un essor économique, comme Chine où l'étude prévoit une augmentation de la PU de 44 à 66%, entre 1995 et 2025. L'Asie produit et continuera à produire la majeure partie des UFW, soit 251 et 481 millions de tonne en ce moment et en 2025, ce qui représente 45 et 53% des UFW produit dans le monde entier. Pour diminuer cette augmentation dans la production des UFW, on pourrait développer des centres de traitements urbains et encourager les gens à rester dans les milieux ruraux où il est beaucoup plus facile de composter et recycler les déchets organiques.
Dans ce contexte, une étude fut entreprise en 2004 pour développer des recettes de compostage pour centres urbains. Premièrement, le projet a mesuré la quantité de UFW produite par un restaurant et par 20 à 48 familles du centre ville de Montréal, ainsi que les propriétés chimiques des UFW produits au cours de l'été par un restaurant et une cuisine communautaire. De plus, le projet a caractérisé six agents structurants disponibles localement, soit de la paille, du foin, des copeaux de bois et trois sortes de cartons. Cette caractérisation a pennis de calculer des recettes de compostage et de tester ceux-ci pour détenniner le taux optimum d'humidité. La production de UFW pour le centre ville de Montréal, et pour la population résidentielle fut de 0,61 (+/-0,13) kg par personne et par jour, alors que pour le restaurant, la production fut de 0,56 (+/-0,23) kg par client par jour. Les essais de recettes ont démontré qu'avec tous les agents structurants, 80% d'humidité est idéale, ce qui fait que 8.9, 8.6 et 7.8 kg de UFW peut être composté avec lkg de paille, de foin ou de copeaux de bois, respectivement. Cependant, la quantité et les caractéristiques des UFW varient d'un mois à l'autre, ce qui exige l'ajustement régulier des recettes de compostage. Aussi, les recettes utilisant uniquement du copeau de bois comme agent structurant doivent être neutralisée.
ii

ACKNOWLEDGEMENTS
First of all, 1 would like to express my deepest gratitude to supervisor Prof Dr. Suzelle Barrington, Department of Bioresource Engineering, McGill University, for her excellent guidance, encouragement and granting me freedom of my own ideas. Her pragmatic and innovative spirit of dealing was greatly appreciated. 1 am proud and honored to be her student.
1 would like to extend my sincere thanks to Dr. Jose Martinez, Director of research, Cemagref, France, for his valuable and intellectual guidance throughout the period ofthis study.
My deepest gratitude goes to aIl the staffs of Eco-Quartier, Down Town, Montreal, for their cooperation and granting me permission to excess to relevant data and materials available in their office.
Dr. Samson A. Sotocinal, Professional Associate, Department of Bioresource Engineering, McGiIl University and Mr. Hirendra Bahadur Khatri are highly appreciated for their help during experimental phase.
1 would like to acknowledge Natural Sciences and Engineering Research Council of Canada (NSERCC) for providing funding to conduct this study.
Finally, 1 am grateful to my wife Anju Adhikari and son Bibek Adhikari for their patience, encouragement and support to complete this study successfuIly.
iii

AUTHORSBIP AND MANUSCRIPT
This thesis is written in manuscript - based format. The contributions of authors
are: 1) first author carried out entire experiment work and writing of manuscripts, 2)
second author supervised and technical correction of the work and manuscripts, 3) third
author provided technical information and analytical advice.
The authorship of the papers is as follows:
First paper (CHAPTER THREE): B.K. Adhikari, S. Barrington and J. Martinez.
This paper has been presented to the journal of "Waste Management & Research"
in August 2005.
Second paper (CHAPTER FOUR): B.K. Adhikari, S. Barrington and J. Martinez.
This paper will be presented to the journal of"Waste Management".
Third paper (CHAPTER FIVE): B.K. Adhikari, S. Barrington and J. Martinez.
This paper will be presented to the journal of "Waste Management".
iv

TABLE OF CONTENTS
ABSTRACT
RESUME
ACKNOWLEDGEMENTS
AUTHORSHIP AND MANUSCRIPT TABLE OF CONTENTS
LIST OF TABLES
LIST OF FIGURES
ABBREVIATIONS
CHAPTERONE
GENERAL INTRODUCTION 1.1 Problem statement
1.2 Objectives
1.3 Scope
1.4 Layout ofthesis
1.5 References
CHAPTERTWO
LITERATURE REVIEW
2.1 Urbanization and food waste production
2.1.1 Urban population (UP)
2.1.2 Urban food waste (UFW) production
2.2 Impact on environment
2.3 Reuse ofUFW
2.4 Composting ofFW
2.5 Factors affecting the composting process
2.5.1 Moisture
2.5.2 Temperature
v
1
11
111
IV
V
IX
Xl
X1l1
1
1
3
3
3
4
7
7
7
7
9
9
10
11
11
11

2.5.3 pH
2.5.4 CIN ratio
2.5.5 Aeration
2.6 Emissions during composting
2.7 Characteristics of waste and bulking agents
2.8 Conclusion
2.9 References
CONNECTING STATEMENT TO CHAPTER THREE
CHAPTER THREE
FOOD WASTE PRODUCTION FROM URBAN AREAS
AROUND THE WORLD
ABSTRACT
3.1 Introduction
3.2 Literature review
3.3 Testing the hypotheses
3.4 Predicted growth ofMSW, UFW and CH.
3.4.1 Expected GDP and UP growth
3.4.2 Predicting MSW, UFW and CH. production
3.5 Predicted growth ofCH4 from UFW
3.6 Scenarios to minimize UFW effects
3.6.1 Scenario one: Stable %UP
3.6.2 Scenario two: Composting or digesting UFW
on site, rather than landfilling
3.7 Conclusion
3.8 References
CONNECTING STATEMENT TO CHAPTER FOUR
CHAPTERFOUR
VARIATIONS IN CHARACTERISTICS OF FOOD
WASTE AND BULKING AGENTS
vi
12
12
12
13
13
14
15
28
29
29
30
31
33
34
34
35
37
38
38
39
39
41
60
61

ABSTRACT
4.1 Introduction
4.2 Materials and methods
4.2.1 FW quantification
4.2.2 Monitoring the variation in FW production
and properties
4.2.3 Analytical procedures
4.2.4 Determination ofwet bulk densities
4.2.5 Water absorption capacity (WAC) of the BA 4.3 Statistical analysis
4.4 Results and discussions
4.4.1 FW quantification
4.4.2 Variation in FW characteristics
4.4.3 BA characterization
4.4.4 Changes in compost recipe over the summer months 4.5 Conclusion
4.6 References
CONNECTING STATEMENT TO CHAPTER FIVE CHAPTER FIVE
TESTING OF BULKING AGENTS FOR URBAN FOOD WASTE COMPOSTING
ABSTRACT
5.1 Introduction
5.2 Materials and methods
5.2.1 Experimental installations
5.2.2 Compost recipes
5.2.3 Parameters monitored
5.3 Results and discussions
5.3.1 Effect of compost dry matter (DM)
5.3.2 The effect of pH
vii
61
62
64
64
64
65
65
66
66
66
66
67
68
70
71
72
81
82
82
83
85
85
85
85
86
86
87

5.3.3 Mass reduction of the compost mixtures 5.4 Conclusion
5.5 References
CHAPTERSIX
GENERAL CONCLUSION
viii
87
89
90
99

LIST OF TABLES
CHAPTERTWO
Table 2.1 MSW generation of different economic group countries (1990) 23 Table 2.2 Changes in the MSW composition with economic prosperity 23 Table 2.3 City and country wise MSW generation and component of
Putrescibles 24 Table 2.4 Residential waste production (RWP) 24 Table 2.5 Household waste (HHW) and MSW production in European cities 25 Table 2.6 Domestic waste production in USA and Canada 25 Table 2.7 Cl4 production potential from food waste (FW) 25 Table 2.8 Maximum recommended moi sture contents for various composting
Materials 26 Table 2.9 Optimum pH ranges for composting 26 Table 2.10 Nitrogen and CIN ratio of waste 26 Table 2.11 Nutrient content of various composting substrates 27
CHAPTER THREE
Table 3.1a GDP, %UP and total population (TP) growth of various African countries 46
Table 3.1b GDP, %UP and total population (TP) growth ofvarious Asian countries 47
Table 3.lc GDP, %UP and total population (TP) growth of various European countries 48
Table 3.Id GDP, %UP and total population (TP) growth of various American countries 49
Table 3.2 GDP, %UP, MSWand FW ofvarious countries around the world 50 Table 3.3 Average annual growth rate ofGDP in % 51 Table 3.4 Computed GDP, TUP and %UP growth for several world countries 52 Table 3.5 Computed UFW production for several world countries 53 Table 3.6 Computed CH4 production for several world countries 54
ix

CHAPTERFOUR
Table 4.1 FW characteristics of different countries 75
Table 4.2 Characteristic ofvarious organic materials and bulking agents 75
Table 4.3a CWS required for the composting FW produced by a restaurant in downtown,
Montreal for an initial CIN ratio of 21 and a DM of 25% 76
Table 4.3a CH required for the composting FW produced by a restaurant in downtown,
Montreal for an initial CIN ratio of21 and a DM of25% 76
Table 4.3a WS required for the composting FW produced by a restaurant in downtown,
Montreal for an initial CIN ratio of 21 and a DM of 25%
CHAPTER FIVE
Table 5.1 Monthly variations ofFW characteristics Table 5.2 Characteristics ofbulking agents Table 5.3 Trial recipes ofFW & chopped wheat straw (CWS)
Table 5.4 Trial recipes ofFW & chopped hay (CH)
Table 5.5 Trial recipes ofFW & wood shaving (WS)
Table 5.6 Mass reduction (wet weight basis) of test recipes
76
92 92 93
93
93
of various bulking agents 94
Table 5.7 Comparison of various parameters of composted test recipes for agricultural
values suggested by Zucconi & Berttoldi (1987) 94
x

LIST OF FIGURES
CBAPTER THREE
Figure 3.1 Illustrating UP as a function ofFDP for each continent Figure 3.2 FW & MSW production as a function ofGDP Figure 3.3 Continental UFW production
Figure 3.4 Fraction ofUFW in MSW for different countries Figure 3.5 Continental C& emission from UFW ifuntreated Figure 3.6 Percentage of total global Ca. production from UFW Figure 3.7 Continental and global UP "do nothing
scenario (DNS)" and scenario one
CBAPTERFOUR
55
56
57
57
58
58
59
Figure 4.1 Monthly residential FW generation for downtown Montreal 77 Figure 4.2 Average monthly variation ofFW production from one restaurant
in downtown Montreal 77 Figure 4.3 Average monthly variations of characteristics of Montreal FW 78 Figure 4.4 Characteristic variations ofbulking agents 79 Figure 4.5 Bulk density ofbulking agents 80
CHAPTER FIVE
Figure 5.1 Invessel horizontal composter designed for trial test of compost recipes 95
Figure 5.2 Vertical plastic bin, used to store composted test recipes for maturation 95 Figure 5.3 Daily ambient temperature and comparison of daily temperature measured
inside compost pile ofvarious mixtures ofFW:CWS 96 Figure 5.4 Daily ambient temperature and comparison of daily temperature measured
inside compost pile ofvarious mixtures ofFW:CH 97 Figure 5.5 Daily ambient temperature and comparison of daily temperature measured
inside compost pile ofvarious mixtures ofFW:WS 97 Figure 5.6 pH ofvarious mixtures ofFW and CWS during composting process 98
xi

Figure 5.7 pH of various mixtures of FW and CH during composting process 98
Figure 5.8 pH ofvarious mixtures ofFW and WS during cornposting process 98
xii

ABBREVIATIONS
AF Animal feed
BA Bulking agent
C Carbon Oc Degree centigrade (temperature scale) CH Choppedhay
CH4 Methane
CIN Carbon to nitrogen ratio CO2 Carbon dioxide
CWS Chopped wheat straw d Day
dw Dryweight
dwb Dry weight basis
FW Food waste
FWPR Food waste production rate GDP Gross domestic product GGE Greenhouse gas emission GUP Global urban population h Hour
Ir Hydrogen ion
ha Hectare (measure of area) HHW Household waste Kg kilo-gram (unit of mass) kPa kilo-Pascal (unit of pressure) MC Moisture content MRCB Medium rough cardboard MSW Municipal solid waste MSWPR Municipal solid waste production rate N Nitrogen
OW Organic waste
Xl Il

RCB Rough cardboard SCB Smooth cardboard TKN Total Kjeldahl nitrogen TP Total population TOP Total urban population UFW Urban food waste UP Urban population VS Volatile solid WAS Water absorption capacity WBD Wet bulk density WP Wheat pellet WS Wood shaving wwb Wet weight basis
xiv

1.1 Problem statement
CHAPTERONE
GENERAL INTRODUCTION
From 1950 to 2000, the global urban population (GUP) has increased from 0.8 billion to 2.9 billion and by 2030, it is expected to reach 5 billion (World urban prospects 2002). In 1950, the GUP represented 30% of the total world population, in 2000 it represented 47 % and in 2030 it will represent an even higher level of 60%.
This ever-increasing shift of the world population towards urban centers is already evident and will produce even more remarkable amounts of urban food waste (UFW), which in turn will add pressure to the already over-Ioaded municipal solid waste (MSW) transportation system and landfill sites. The environmental ramifications of widely used waste disposai technologies are well-understood (Bilitewski et al 1994, Barth 1999). Organic sol id waste that goes to landfill sites pollutes air by producing large amounts of methane (C~» and carbon dioxide (C02) (Hansen et al 2004). Also contaminates groundwater by producing important volumes of leachate and occupies vast land surfaces (Pokhrel & Viraraghavan 2005, Bou-Zeid & EI-FadeI2004, Shin et al 2001, Legg 1990). Food waste (FW) is a major fraction of MSW, which is a main source of decay, odor and leachate when collected, transported and landfilled together with other wastes (Shin et al 2001).
The treatment and disposaI of MSW is a worldwide concem especiaIly in highly urbanized cities (Lu 1995). Large cities in India and China are faced with a serious solid waste problem, which is further aggravated by rapid urbanization (Ahmed & Jamwal 2000, Hong et al 1996). In most cities of low and medium income countries do not collect the totality of wastes generated; and, of the wastes collected, only a fraction receives proper disposaI. For example, India, Pakistan (Karachi) and Egypt (Cairo) only 50%, 33% and 50% of refuse generated is collected respectively and rest is left behind (Sinha & Enayetullah 1995, Medina 2002). About 90% of MSW collected in Asian cities end up in open dumps (Medina 2002) and in African countries only 20 - 80 percent of the waste are collected. Uncollected or illegally dumped wastes adversely affect human health and the environment (Achankeng 2003). Uncollected waste may accumulate on the streets and clog

drains when it rains, which May cause flooding and wastes can also he carried away by run off water to rivers, lakes and seas, and affecting those ecosystems (Medina 2002, Chakrabarti & Sarkhel 2003).
According to 1997 survey about 93% of Chinese felt their health was affected by environmental problems resulting from poor MSW management (China Waste Management 2004). In India, this case is even higher which is 94% (World Bank 1999:16). An example of human disaster is a case of outbreak of plague in Surat, India in September 1994. Which took the life of Many people because of uncontrolled fermentation of organic waste that created conditions favorable to be breeding and growth of rats and insects that acted as vectors of disease (Venkateshwaram 1994). Similar cases of serious impact on health and environment is reported in Nepal resulting from open dumps in abandoned fields or on the bank of rivers or streams ranging from 65% - 100% of the MSW depending on the municipalities (pokhrel & Viraraghavan 2005).
In this context, on site treatment, aerobic and anaerobic, of FW reduces pressure on MSW management systems about 40% to 85% in developing economies and 23% to 50% in developed economy (World Bank 1999, OECD 1995).
Composting of source-separated FW at urban centers reduces the mass and volume transported to the landfill and increases its life (Pokhrel & Viraraghavan 2005). This has been the trend since Mid 1980s (Bilitewski et al 1994, Hoitink 1999, Barth 1999). Currently, yard waste cornposting is practiced widely and also food and restaurant waste composting is increasing (Hoitink 1999). Composting of FW in city itself rather than outside the city reduces the transportation cost ofMSW management system because large city corporations already have serious problems transporting the waste outside the city.
However, there are Many challenges in building and operating composting facilities in highly urbanized centers. The composing facility must be compact as to use as little space as possible. The FW needs to be mixed to a readily available bulking agent to reduce its moisture content and facilitate composting, and this bulking agent May not be readily available. Cooperation and involvement of communities who produce waste are vital to operate urban composting facilities successfully. Finally, the odors and leachate produced by the composting process require special attention especially in the case of composting facilities installed in a highly populated urban setting.
2

1.2 Objectives
The main objective of this research was to develop guidelines for an urban
composting center for the on-site treatment of source-separated FW and for its reuse by
the compost producer. This urban system can thereby reduce the volume of MSW
delivering to landfill sites and consequently attenuate the adverse environmental impact
resulting from bio-urban solid waste.
The specific objectives were to:
(i) Predict the growth ofurban population (UP) and UFW production in relation with
gross domestic product (GDP) in continental and global scale.
(ii) Characterize the properties of Montreal FW and various readily available
materials which could be used as bulking agents in compost recipes.
(iii) Test compost recipes to measure temperature, pH and identify the best for UFW
composting using a compact urban composting system.
1.3 Scope
The growth of UFW was quantified in continental and global scale in relation with
urban population and GDP. The properties (which are needed for compost recipe) of
Montreal community kitchen & restaurant FW also locally available bulking agents were
characterized. The different mixtures ofFW & chopped wheat straw, FW & chopped hay
and FW & wood shaving were tested to obtain best recipes by using an urban composting
unit prototype for a compact urban composting system designed to treat FW.
1.4 Layout of thesis
Chapter 2 presents a general literature review covering the topics of urbanization &
waste production, impact on environment, composting and factors to he taken into
consideration for composting process. Chapter 3 is a paper presenting the predicted
growth of FW in continental and global scale in urban areas. Chapter 4 is a paper
pertaining to characterization of properties of UFW and bulking agents needed for
preparation and test of compost recipes. Chapter 5 is a paper discussing tests of compost
recipes by using composting unit prototype for a compact urban composting system
designed to treat FW. Chapter 6 is the general conclusion. Tables and figures are depicted
in sequence at the end of each chapter. The literature cited within a chapter is presented at
the end of each chapter.
3

1.5 References Achankeng, E. (2003): Globalization, Urbanization and Municipal Solid Waste
Management in Africa. African Studies Association and the Pacifie. 2003 Conference Proceedings-African on a Global Stage. www.ssn.flinders.edu.au/global/afsaap/ conferences/2003proceedings/achankeng.PDF (26-01-2005)
Ahmed & Jamwal (2000). In: Zurbrcugg, C., Drescher, S., Patel, A., & Sharatchandra, H. C. (2004): Decentralized composting of urban waste- an overview of community private initiatives in Indian cities. Waste Management 24 (2004) 655 -662.
Barth, J. (1999): Compost quality, quality assurance and use- the basic for sustainable organic waste management in Europe. In: Warman, P. R, & Taylor, B. R (eds).
Proceedings of the international composting symposium. Volume 1. September 19-23, 1999, pp. 14,27,59. HalifaxlDartmouth, Nova Scotia, Canada.
Bilitewski, B., HardtIe, G., & Marek, K. (1994): Waste Management, pp. 1-7, 202-209. In: Weissbach, A.,& Boeddicker, H. (eds & translators). SpringerVerlag Berlin Heidelberg 1997. Printed in Germany.
Bou-Zeid, M., & EI-Fadel, M. (2004): Parametric sensitivity analysis of leachate transport
simulations at landfills. Waste Management 24 (2004) 681-689.
Chakrabarti, S., & Sarkhel, P. (2003): Economics of Sol id Waste Management: A Survey of Existing Literature. Economic Research Unit, Indian Statistical Institute. www.isical.ac.inl-eru/2003-11.pdf (19-01-2005)
China Waste Management (2004): Working paper for streams technology programme. In: Rissanen, J., & Naarajarvi, T. (compilers). Tekes Beiging in Cooperation with Environrnental Resources Management (ERM), Shanghai. Websrv2.tekes.fl/ .. ./julkaisutlkansainvaliset_selvityksetlS24045 _ Waste_Manage ment_ Review. pdf (19-01-2005)
Hansen, T. 1., Schmidt, J. E., Angelidak, L, Marca, E., Jansen, C. J., MosbXk, H., & Christensen, T. H. (2004): Method for determination of methane potentials of solid organic waste. Waste Management 24 (2004) 393 - 400.
4

Hoitink:, H. A. J. (1999): Trends in treatment and utilization of solid wastes through
composting in the United States. In: Warman, P. R., & Taylor, B. R. (eds).
Proceedings of the international composting symposium. Volume I. September
19-23, 1999, pp. 1-11. HalifaxlDartmouth, Nova Scotia, Canada.
Hong, Y., Pan, S., Shoa, Q., Liu, F., & Duo, Y., (1996): A study to define a standard
health protection zone for sanitary landfill in Fu Shan City. Waste Management
& Research (1996) 14,505 - 510.
Legg, B. J. (1990). Farm & food waste: Utilization without pollution. Agricultural and
food processing wastes. Proceedings of the sixth international symposium on
agricultural and food processing wastes. December 17-18, 1990, pp. xi-xxi.
ASAE publication 05-90.
Lu, C. (1995): A model ofleaching behavior from MSW incinerator residue landfills.
Waste Management & Research (1995) 14,51-70.
Medina, M. (2002): Globalization, Development and Municipal Solid Waste
Management in Third World Cities. El Colegio de la Frontera Norte, Tijuana,
Mexico.
www.gdnet.org/pdf/2002AwardsMedalsWinners/OutstandingReseachDevelopme
ntlmartin _ medina _ martinez ...J)aper. pdf (19-01-2005)
OECD (1995). In: World Bank (1999): What a Waste: Solid Waste Management in Asia.
Urban Development Sector Unit, East Asia and Pacific region.
www.worldbank.orglhtml/fpd/urban/publicatlwhatawaste.pdf (19-01-2005)
Pokhrel, D., & Viraraghavan, T. (2005): Municipal solid waste management in Nepal:
practices and challenges. Waste Management 25(2005) 555 - 562.
Shin, HS., Han, S.K., Song, Y.c., & Lee, c.Y. (2001): Perfonnance ofUASB reactor
treating leachate from acidogenic fennenter in two-phase anaerobic digestion of
food waste. PlI: S0043-1354(01)00041-0.
Sinha, M., & Enayetullah, I. (1995): "Recycling potentials of organic wastes in Dhaka
city", a paper published in 'EARTH' magazine issue no.4, 1995.
Venkateshwaran (1994). In: Chakrabarti, S., & Sarkhel, P. (2003): Economics ofSolid
Waste Management: A Survey of Existing Literature. Economic Research Unit,
Indian Statistical Institute. www.isical.ac.inI-eru/2003-11.pdf (19-01-2005).
5

World Bank (1999: 16). In: China Waste Management (2004): Working paper for streams technology programme. Rissanen, J. & Naarajarvi, T. (compilers). Tekes
Beiging in Cooperation with Environmental Resources Management (ERM), Shanghai.
World Bank (1999): What a Waste: Solid Waste Management in Asia. Urban Development Sector Unit, East Asia and Pacific region.
www.worldbank.orglhtmllfpd/urban/publicat/whatawaste.pdf (19-01-2005) World Urbanization Prospects, The 2001 Revision, ESAIP/WP.173, and 20 March 2002.
Population Division, Department ofEconomics and social affairs, United Nations Secretariat.
www.un.org/esa/populationlpublications/wup2001lwup2001dh.pdf(15/10/2004)
6

CHAPTERTWO
LITERATURE REVIEW
2.1 Urbanization and food waste production
2.1.1 Urban population (UP)
According to World Urbanization Prospects (2002), the global urban population
(GUP) in 1950, 1975 and 2000 was about 0.8 (30% of total), 1.6 (38% of total) and 3
(47% of total) billion, respectively, and is expected to reach about 5 (60% oftotal) billion
in 2030. Also, the urban areas are expected to absorb most of the world population (WP)
increase from 2000 to 2030, and this is particularly true for the countries in Asia, Africa,
Latin America & the Caribbean. From 1950 to 2030, the UP is expected to increase from
17% to 54%, 14% to 53% and 42% to 84% in Asia, Africa and Latin America &
Caribbean, respectively. In comparison, the UP of the more developed countries in
Northern America, Europe and Oceania is expected to increase slowly from 64% to 85%,
52% to 81 % and 62% to 76% respectively from 2000 to 2030. The increasing trend ofUP
and expansion of urban areas over the period of time will produce tremendous amounts of
waste in city centers. That will create heavy pressure in municipal solid waste (MSW)
management systems.
2.1.2 Urban food waste (UFW) production
The production and composition of MSW vary from place to place and from season
to season (Abu Qdais et al 1997). Which is influenced by various factors such as
geographical location, population's standard of living, energy source, weather (World
Bank 1999), food habits, urbanization, tradition and culture. In general, the greater the
economic prosperity and the higher percentage of UP, the greater amount of solid waste
produced (World Bank 1999). Medina (2002) found a positive correlation between
income and amount of solid waste production because wealthier countries and individuals
consume more than lower income one, which results in a higher waste generation rate to
the former. For an example, as reported by China Waste Management (2004), during the
last two decades the economic growth rate of China is of almost 10% that is increasing
the living standard and consumption pattern of UP. That increases the total amount of
MSW generation at similar pace of 8% - 10% annually.
7

Table 2.1 shows an average rate of MSW generation corresponding to income level
of different countries across the world. Countries with low income produce fewer
amounts per capita per day in comparison to countries having high income. In 1990, the
average MSW production rate in low income countries was reported as 0.53 kg capita
ldai\ in the case ofmiddle income countries it ranges from 0.63 to 0.71 kg capita-1day-l
whereas high income countries produced 1.2 kg capita-1dai1 in same year.
Compostable materials in comparison to high and middle-income countries mostly
dominate the MSW stream in low-income countries. Low and middle income countries
have a high percentage of compostable or organic matter in the MSW stream which
ranges from 40% to 85% whereas in high income countries it is significantly lower which
ranges from 23% to 50% (Table 2.2 & 2.3). The consumption of papers and packaging
materials in MSW stream increases with growing urbanization and income level of the
country (Table 2.2 & 2.3). The percentage of food waste (FW) in MSW is reported as
39.2%, 62.5%, 60%, 43.1 % and 8.1 % in Bangkok (1989), Dar es Salaam (1988), Jakarta
(1989), Mexico City (1980) and United States (1990) respectively (Beed & Bloom 1995).
The percentage of FW in MSW in US is reported as low as 8.1 % due to source reduction
of FW by composting that prevents mixing with MSW stream (USEPA web site). This is
true because the percentage of FW in residential waste production in US is reported 27%
(Table 2.4).
Percentage of organic waste (OW) and FW of different cities and countries across the
world in Residential/household waste stream are presented in Table 2.4 & 2.5. These
Tables demonstrate higher percentage of OW and FW in cities/countries having low
income and low urbanization with lesser per capita residentia1/household waste
production in comparison to high-income countries. Another study in Canada and USA
shows that the percentage of yard and FW ranges 22% to 32.2 % in domestic waste
stream in British Columbia, Ontario and Quebec and in USA it is reported 25% (Table
2.6). On an average OW comprises approximately 30% of the residential wastes
produced in Canada (The Recycling Council of Ontario, 1997). A study in Montreal
revealed that the residential FW production rate varies from 0.5 to 0.7 kg capita-1dai1
(Morin et al 2003). Assuming the FW production rate of 2003 as reported by Morin et al
(2003), the total population of Montreal 1,040,000 (Statistics Canada 2001) produced
8

about 0.23 million ton FW. Which is about 36% of total domestic waste produced in Montreal by considering country domestic waste production rate 1.7 kg capita-1day-1 (Environment Canada 1991, Laplante 1992).
2.2 Impact on environment
According to Bilitewski et al (1994), the Hnk between hygiene, wastes and epidemics was first suspected by the Greek scholar Hippocrats around 400 B. C. and the Arab Avicenna (Ibn Sina, 1000 AD). Barly in the 20th century, urban societies began to grow and to have a noticeable impact on the environment because of the increasing amount of urban waste and wastewater produced (Green & Kramer 1997). At present world, the potentially damaging impacts of farm and FW on the local environment like water pollution and human health are weIl recognized (Legg 1990).
The UFW that goes to landfill sites not only pollute the land and water but also contributes to global warming by producing methane (C~). C~ is produced in large amounts in landfills as a consequence of the degradation of organic matter (OM) under anaerobic conditions (Borjesson & Svenssen 1997). At any landfill site, 45% to 58% of the OW on a dry weight basis (dwb) is transformed into C~ (Solid Waste Landfill Guidance 1999). Food waste fraction ofMSW has high potential to produce C~ (Table 2.7). According to Wang et al (1997), FW generates 300 L of C~ dry-l kg. Thus, landfills are responsible for approximately 8% of anthropogenic world C~ emissions (US EPA 1994). Another laboratOlY experiment conducted by Hansen et al (2004) found that solid FW could produce from 200 to 500 L of CH. kg- l ofFW volatile solids (VS).
Although CH. and CO2 are produced in about equal amounts, C~ is of greater concem as a greenhouse gas because of its 100 years global warming potential. For example, its infrared absorption potential in the atmosphere is about 23 times greater than that of CO2 (IPCC 2001). In 1997, the US landfills are said to contribute 37% of the anthropogenic CH. that represents the largest fraction of aIl the anthropogenic sources (USEPA 2003). In Europe, an estimated 30% of anthropogenic CH. emissions are from landfill sites (EEA 2001).
2.3 Reuse of UFW
Waste management encompasses the collection, transport, storage, treatment, recovery and disposaI of waste (Bilitewski et al 1994). Multiple waste management
9

alternatives exist for the treatment of UFW including burlal in a landfill, anaerobic digestion (Ten Brummeler & Koster 1989, Cecchi et al 1992) and aerobic composting. The greenhouse gas emission potential and cost effectiveness of aIl of the se techniques must be evaluated to select the Most environmentally friendly treatment system.
Amongst the Many available alternatives for reusing of UFW, composting is envisaged as the best way of disposaI of FW by using it on the land as organic fertilizer (Pokhrel & Viraraghavan 2005). Because composting process transforms OM into a stable form (Ramelers 1992). Composting of FW not only reduces the waste mass and volume transported to the landfill also increases its life (Pokhrel & Viraraghavan 2005). Invessel treatment of MSW waste avoids air and groundwater pollution by landfills (Baeten & Verstraete 1992). Also recycling ofsource-separated FW by composting at the urban community centers and in large scale FW composting facilities reduce C~ emissions and saves land otherwise needed for landfill sites. 2.4 Composting ofFW
Composting is one of the few natural processes (Barrington et al 2002) in which, microbial decomposition of OM occurs in aerobic conditions. Composting generates considerable heat, CO2 and water vapor into the air while minerals and OM are converted into a potentially reusable soil amendment (Renkow et al 1996, Pace et al 1995, Biddestone & Gray 1985, Picci et al 1978, Raug 1980). Composting also reduces volume and mass of solid waste, thereby increasing its value and transforming it into a safe soil amendment (Cassarino 1986).
As reported by Renkown et al (1996), the two basic processes used in large scale composting are windrow-based technologies and in-vessel technologies. The invessel technologies are considered appropriate for UFW composting because the process can he fully controlled and at the same time leachate and odor can be collected and treated before discharging in to the atmosphere which is specially important for urban composting centers. In vessel composting of FW were successfully carried out by using wood chip and sawdust (K won & Lee 2004) and peat MOSS and wood chips (Koivula et al 2003) as bulking agents.
10

2.5 Factors affecting the composting process Various factors affect the composting processes and determine the level ofbiological
activities. The main factors are moisture, temperature, pH, initial recipe CIN ratio and oxygen (pace et al 1995, Zucconi et al 1986).
2.5.1 Moisture
The FW and bulking agent mixture should have an initial moi sture level of 60- 65% (Zucconi et al 1986). According to Pace et al (1995), the composting mixtures should he maintained within a mnge of 40% to 65% moisture and preferably 50%- 60%.
The raw compost mixture should have water content of approximately 55% because microbes absorb nutrients in molecularly dissolved form through a semi permeable membrane. At a moi sture content under 20%, no biological processes are possible (Bilitewski et al 1994). According to Haug (1980), McGauhey & Gotaas were able to compost mixtures of vegetable tritnmings at initial maximum moi sture contents as high as 85% when using straw as bulking agent, and 76% when using paper. Fibrous or bulky material such as straw or wood chips can absorb relatively large quantities of water and still maintain their structural integrity and porosity (Haug 1980). Therefore, higher moisture levels are recommended for bulky and fibrous composting material (Table 2.8). 2.5.2 Temperature
Temperature is generally a good indicator of the biological activity. Thermophilic temperatures above 50°C should be reached within a few days. Temperature above 60°C -65°C should be prevented because the more sensitive microorganisms May be killed and the decomposition process May be slowed. Nevertheless, a continuing high temperature of 55°C -60°C, lasting beyond 5 to 6 weeks, indicates an abnormally prolonged decomposition and a delayed transition to the stabilization stage (Zucconi et al 1986). Composting will essentially take place within two temperature ranges known as mesophilic (25°C to 40°C) and thermophilic (over 40°C). Although mesophilic temperatures allow effective composting, experts suggest maintaining thermophilic ranging up to 60°C, because they destroy pathogens, weed seeds and fly larvae (Pace et al 1995).
Il

2.5.3 pH
For optimum microbial activity during composting, a neutral to slightly alkaline pH range is required (Table 2.9) for optimal microbial growth. Organic substrates offer a wide range of pH levels ranging from 3 to Il and this pH must be neutralized (Zucconi et al 1986). Generally, the pH level drops at the heginning of the composting process as a result of the acids formed by the acid-forming bacteria which initialize the process by breaking down complex carbonaceous materials. The later break down of proteins and libemtion of ammonia account for the subsequent rise in pH (Zucconi et al 1986, Bilitewski et al 1994). According to Pace et al (1995), the preferred range of pH is 6.5 to 8.0. Table 2.9 demonstrates the ranges of pH for optimum growth of microorganisms during composting process as suggested by various researchers. 2.5.4 C/N ratio
The CIN ratio msures the necessary nutrients for the synthesis of cellular components ofmicroorganisms. For an active aerobic metabolism, a CIN ratio of 15 to 30 is suggested (Haug 1993). Zucconi et al (1986) suggested that the CIN ratio of the microbial cell he about 10. However, due to energy requirement, initial CIN values of28-30 maximize metabolic rates. According to Pace et al (1995), raw materials blended to provide a CIN ratios of 25 to 30 are ideal for active composting although initial CIN mtios of 20 to 40 consistently give good composting results. A CIN ratio below 20 produces excess ammonia and unpleasant odors while a CIN ratio above 40 does not provide enough N for microbial growth and a fast composting process.
Once completely composted, the treated waste should offer a CIN ratio ranging between 15 and 20, to be used as a balanced soil amendment. If the CIN ratio exceeds 20, N becomes deficient in the soil, and if the ratio is significantly below 15, N can be lost by volatilization from the soil and can have a toxic effect on plants (Bilitewski et al 1994) 2.5.5 Aeration
Aerobic microorganisms should dominate during the composting process and oxygen is of major consideration (Finstein et al 1992). According to Barrington et al (2002) aeration is a key element in controlling the tempemture regime and thus, the performance of any composting operation.
12

Fernandes et al (1994) suggested three types of aeration techniques for composting: natural, passive and active. Among these three methods, naturaI aeration is the cheapest and simplest, as it requires no installations. It consists of ensuring enough compost pile surface to allow for the proper exchange of oxygen by diffusion. Passive aeration requires the installation of ducts under the compost plies to enhance the convective forces created by the temperature differences between the composting materials and the ambient air (Sartaj et al 1997). Active aeration is the most expansive system, as it requires the installation of ducts under the compost piles and fans pushing air into these ducts and through the compost piles (Haug 1993).
Oxygen demand is very high during the initial decomposition stage, because of the rapidly expanding microbial population and the high rate of biochemical activity. After this initial high level of activity that generally lasts one to two weeks, oxygen demand decreases (Zucconi et al 1986).
2.6 Emissions during composting
Composting leads to the emissions of malodors and leachate that require special attention. These may occur during the deIivery and handIing of the raw materials and during the composting processes (Bilitewski et al 1994).
Odor can be attenuated by optimizing the composting process to minimize the formation of odor and by collecting, treating and disposing the odorous gases which are formed (Walker 1992). The leachate can be collected, treated and disposed or returned to the composting process (Bilitewski et al 1994). RecentIy, the leachate bas been recycled as a liquid fertilizer, because of its high content in soluble minerais. 2.7 Characteristics of waste and bulking agents
Determination of various waste characteristics is essential for implementing the appropriate waste management practices (Green & K.ramer 1979, Metin et al 2003, Abu Qdais et al 1997). Therefore, waste and bulking agent characterization is essential for the optimization of the composting process. The nutrient content of various composting substrates is presented in Tables 2.10 and 2.11. Materials like saw dusts, wood chips and straws indicate high dry matter and CIN ratio which show the suitability for using as bulking agents during composting of FW. (Table 2.11).
13

2.8 Conclusion
The growing urbanization, economic activities and changing consumption pattern
(will) create tremendous pressure on existing MSW management systems by producing
remarkable amount of FW in big cities around the world specially in low and middle
income countries. However, no literature is available about future growth of UFW in the
context of growing urbanization and changing economic pattern; which is an important
part to formulate MSW management strategy for upcoming decades.
For managing and reusing of FW (solid organic fraction of MSW stream), various
alternatives are suggested such as burial in a landfill, anaerobic digestion and aerobic
composting. Amongst the available alternatives, composting at urban centers is envisaged
as the best option. However, there are many challenges in building and operating
composting facilities in highly urbanized centers like availability of space and bulking
agents. The odors and leachate produced by the composting process require special
attention especially in the case of composting facilities installed in a highly populated
urban setting. Therefore, factors affecting composting process such as moisture,
temperature, pH and initial CIN ratio of compost recipe need to be fully controlled in
order to accelerate the process with minimal odor emission and less leachate production.
Renee, quantification, characterization of both FW and bulking agents are essential to
obtain best compost recipes to control the composting process.
14
2.9 References
Abu Qdais, H. A, Hamoda, M. F., & Newham, J. (1997): Analysis ofresidential solid waste at generation sites. Waste Management & Research (1997) 15,395- 406.
Ahmed & Jamwal (2000). In: Zurbrcugg, C., Drescher, S., Patel, A, & Sharatchandra, H. e. (2004): Decentralized composting of urban waste- an overview of community a private initiative in Indian cities. Waste Management 24 (2004) 655 - 662.
Baeten, D., & Verstraete, W. (1992): In-reactor anaerobic digestion ofMSW- organic. In: Hoitink, H. A J., & Keener, H. M. (eds). Proceedings of an international
composting research symposium held on March 27-29, 1992, pp. 125. Hyatt Regency at the Ohio Center, 350 North High Street, Columbus, OH.
Barrington, S., Choiniere, D., Trigui, M., & Knight, W. (2002): Compost airflow resistance. Biosystems Engineering (2002) 81 (4),433-441.
Barrington, S., Choiniere, D., Trigui, M., & Knight, W. (2002): Effect of carbon source on compost nitrogen and carbon losses. Bioresource Technology 83(2002) 189-194.
Beede & Bloom (1995). In: Chakrabarti, S., & Sarkhel, P. (2003): Economies ofSolid Waste Management: A Survey of Existing Literature. Economic Research Unit,
Indian Statistical Institute. www.isica1.ac.inI-eru/2003-11.pdf (19-01-2005). Biddestone & Gray (1985). In: Koivula, N., Raikkonen, T., Urpilaine, S., Ranta, J., &
Hanninen, K. (2004): Ash in composting of source separated catering waste, 2003. Bio-resource technology 93 (2004) 291-299.
Bidlingmaier B et al (1985). In: Bilitewski, B., Hardtle, G., & Marek, K. (1994): Waste Management, pp. 202-209. Weissbach, A, & Boeddicker, H. (eds & translators). Springer-Verlag Berlin Heidelberg 1997. Printed in Germany.
Bilitewski, B., Hardtle, G., & Marek, K. (1994): Waste Management, pp. 1-7,202-209 Weissbach, A, & Boeddicker, H. (eds & translators). Springer-Verlag Berlin Heidelberg 1997. Printed in Germany.
BOIjesson, G., & Svenssen, B. H. (1997): Seasonal and diurnal methane emissions from a landfill and their regulation by methane oxidation. Waste Management &
Research (1997) 15,33 - 54.
15

Cassarino, C. J. (1986): Municipal organic solid waste composting. An integrated component of recycling centers that process solid waste in compost production,
quality and use. In: Bertoldi, M. De, Ferranti, M.P., L'Hermite, P., & Zucconi, F. (eds). Proceedings of a symposium organized by the commission of the European communities, Directorate General Science, Research and Development,17 -19 April 1986.Udine ltaly.
Cecchi et al (1992). In: Wang, Y, Odle, W. S., Eleazer, W. E., & Barlaz (1997): Methane potential of food waste and anaerobic toxicity of leachate produced during food waste decomposition. Waste Management & Research (1997) 15, 149- 167.
China Waste Management (2004): Working paper for streams technology programme. Rissanen, J., & Naarajarvi, T. (compiler). Tekes Beiging in Cooperation with
Environmental Resources Management (ERM), Shanghai. Websrv2.tekes.f1/ ... /julkaisutikansainvalisec seivityksetlS24045 _ Waste _Manage ment_ Review. pdf (19-01-2005)
Diaz, L. F., Golueke, C.G., & Savage (1986): Energy balance in compost production and use in compost: production, quality and use. In: Bertoldi, M. De, Ferranti, M.P.,
L'Hermite, P., & Zucconi, F., (eds). Proceedings of a symposium organized by the commission of the European communities, Directorate General Science, Research and Development, 17-19 April, pp. 8. Udine Italy.
EEA (2001). In: Huber-Humer, M. (2004): International research into landfill gas emissions and mitigation strategies- IWWG working group "CLEAR". Waste
Management 24 (2004) 425 - 427.
Environment Canada (1991). ln: Kaoser, S., Barrington, S., & Elektorowicz (2000): Compartments for the management of municipal solid waste. Soil and Sediment
Contamination, 9(5): 503-522 (2000).
ESCAP (1990). In: Muttamara, S., Visvanathan, C., & Alwist, K.U. (1994): Solid waste recycling and reuse in Bangkok. Waste Management & Research (1994) 12, 151
-163.
16

Fernandes et al (l994).1n: Barrington. S., Choiniere, o., Trigui, M., & Knight, W. (2002). Compost convective airflow under passive aeration (article in press)
Bioresource Technology (accepted 26 June 2002) Finstein, M. S., & Hogan, J. A. (1992): Integration of composting process microbiology
facility structure and decision making in science and Engineering of composting, design, environmental microbiological and utilization aspects. In: Hoitink, H. A. J., & Keener, H. M. (eds). Proceedings of an international composting research symposium, March 27-29. Hyatt regency at the Ohio center, 350 North high street Columbus, OH
Gol ueke. In: Haug, R T. (1993). The practical handbook of compost engineering, pp. 206,250. Lewis Publishers. A CRC press company.
Green, J. H., & Kramer, A. (1979). Food processing waste management, pp. 1-14,82, 330. The A VI Publishing company, INC. Westport, Connecticut. Printed in the United States of America.
Hamelers, H. V. M. (1992): A theoretical model of composting kinetics. Science and engineering of composting. Design, environmental, microbiological and
utilization aspects. In: Hoitink, H.A. J., & Keener, H. M. (eds). Proceedings of an international composting research symposium held on March 27-29, pp. 36. Hyatt Regency at the Ohio Center, 350 North High Street, Columbus, OH.
Hansen, T. L., Schmidt, J. E., Angelidak, 1., Marca, E., Jansen, C. J., MosbXk, H., & Christensen, T. H. (2004): Method for determination of methane potentials of
solid organic waste. Waste Management 24 (2004) 393 - 400. Haug, RT. (1980). Compost engineering. Principles and practice pp. 1,89, 185,274-
275,347. ANN ARBOR SCIENCE PUBLISHERS, INC. 230 Collingwood, P.O. Box 1425, Ann Arbor, Michigan 48106.
Haug, RT. (1993). The practical handbook of compost engineering, pp. 248. Lewis Publishers. A CRC press company.
Haug (1993). In: Barrington, S., Choiniere, D., Trigui, M., & Knight, W. (2002). Compost convective airflow under passive aeration (article in press) Bioresource
Technology (accepted 26 June 2002).
17

IEA (2002): International Energy Annual, Energy Information Administration. http://www.eia.doe.gov/pub/international/iealfltablebl.xls Table Posted: May 24,
2004 and http://www.eia.doe.gov/pub/intemational/iealfltableb2.xls Table Reposted: June 25, 2004 (17-03-2005).
IPCC (2001). In: Huber-Humer, M. (2004): International research into landfill gas emissions and mitigation strategies- IWWG working group "CLEAR". Waste Management 24 (2004) 425 - 427.
IPCC (2001). In: Czepiel, P. M., Shorter, J. H., Mosher, B., Allwine, E., McManus, 1. B., Harriss, RC., Kolb, C.E., & Lamb, B. K. (2003): The influence of atmospheric
pressure on landfill methane emissions. Waste Management 23 (2003) 593 - 598. Kayhanian & Tchobanoglous. In: Haug, KT. (1993). The practical handbook of compost
Engineering, pp. 250. Lewis Publishers. A CRC press company. Kirkitsos et al (2000). In: Metin, E., Eroztur, A., & Neyim, C. (2003): Solid waste
management practices and review of recovery and recycling operations in Turkey. Waste Management 23 (2003) 425-432.
Koivula, N., Raikkonen, T., Urpilainen, S., Ranta, J., & Hanninen, K. A. (2003): composting of source separated catering waste, 2003. Bio resource technology 93 (2004) 291-299.
Kwon, S. H, & Lee, D. H. (2004): Evaluation ofKorean food waste composting with fed batch operations II: using properties of exhaust gas condensate. Process
Biochemistry 39(2004) 1047-1055.
Laplante (1992). In: Kaoser, S., Barrington, S., & Elektorowicz (2000): Compartments for the management of municipal solid waste. Soil and Sediment Contamination,
9(5): 503-522 (2000).
Legg, B. 1. (1990). Farm & food waste: Utilization without pollution. Agricultural and food processing wastes. Proceedings of the sixth international symposium on
agricultural and food processing wastes. December 17-18, pp. xi-xxi . . ASAE publication 05-90.
Liang, Y, Leonard, J. J, Feddes, 1. 1. R, & McGill, W. B. (1999): Nitrogen dynamics in composting. In: Warman, P. K, & Taylor, B. R, (eds). Proceedings of the
18

international composting symposium. Volume 1. September 19-23, pp. 357. HalifaxlDartmouth, Nova Scotia, Canada.
Lober, D. J. (1996): Municipal solid waste policy and public participation in household source reduction. Waste Management & Research (1996) 14, 125 -143.
Martinez, J. M. A., & Otten, L. (1999): Co-composting of municipal solid waste, manures, and sugar cane waste using a static pile system. In: Warman, P. R, &
Taylor, B. R (eds). Proceedings of the international composting symposium. Volume I. September 19-23, pp. 71. Halifax/Dartmouth, Nova Scotia, Canada.
Medina, M. (2002): Globalization, Development and Municipal Solid Waste Management in Third World Cities. El Colegio de la Frontera Norte, Tijuana,
Mexico.
www.gdnet.orglpdf/2002AwardsMedalsWinnersiOutstandingReseachDevelopme nt/martin _ medina_ martinez '-paper. pdf (19-01-2005)
Metin, E., Eroztur, A., & Neyim, C. (2003): Solid waste management practices and review of recovery and recycling operations in Turkey. Waste Management 23
(2003) 425-432.
Morin, S., Lemay, S., & Barrington, S. F. (2003): An urban composting system. Paper No 03-612. Written for presentation at the CSAE/SCGR 2003 meeting, Montreal,
Quebec, July 6-9, 2003.
Muttamara, S., Visvanathan, C., & Alwist, K U. (1994): Solid waste recycling and reuse in Bangkok. Waste Management & Research (1994) 12, 151 - 163.
National Solid Waste Association ofIndia (2003). In: Zurbrcugg, C., Drescher, S., Patel, A., & Sharatchandra, H. c., (2004): Decentralized composting of urban waste- an
overview of community a private initiative in Indian cities. Waste Management 24 (2004) 655 - 662.
OECD (1995). In: World Bank (1999): What a Waste: Solid Waste Management in Asia. Urban Development Sector Unit, East Asia and Pacific region.
www. worldbank.orglhtml/fpd/urbanlpublicat/whatawaste.pdf (19-01-2005) Onargan, T., Kucuk, K, & Polat, M. (2003): An investigation of the presence of
methane and other gases at the Uzundere - Izmir solid waste disposaI site, Izmir, Turkey. Waste Management 23 (2003) 741-747.
19

Pace, M. G., Miller, B. E., & Farrell- Poe, K. L. (1995): The composting process. Utah
state University Extension, October 1995.
Picci at el (1978). In: Ferrari, G. (1986): Oxygen, water and temperature in the
decomposition process of an organic substance during composting in compost:
production, quality and use. In: Bertoldi, M. De, Ferranti, M. P., L'Hermite, P., &
Zucconi, F., (eds). Proceedings of a symposium organized by the commission of
the European communities, Directorate General Science, Research and
Development,17-19 April. Udine Italy.
Poincelot. In: Haug, R. T., (1993). The practical handbook of compost engineering, pp.
250. Lewis Publishers. A CRC press company.
Renkow, M., & Rubin, A. R. (1996): Municipal solid waste composting: does it makes
economic sense? AREP 96-3 October 1996
http://www.bae.ncsu.edu/bae/programs/extension/publicatlarep/2arep963.html
Sartaj et al (1997). In: Barrington, S., Choiniere, D., Trigui, M., & Knight, W. (2002):
Compost convective airflow under passive aeration (article in press) Bioresource
Technology (accepted 26 June 2002).
Scharff, C., & Vogel, G., (1994): A comparison of collection systems in European cities.
Waste Management & Research (1994) 12,387 - 404.
Shekdar, A. V. (1997): A strategy for the development oflandfill gas technology in
India. Waste Management & Research (1997) 15,255 - 266.
Solid waste landfill guidance (1999). In: Onargan, T., Kucuk, K., & Polat, M. (2003): An
investigation of the presence of Methane and other gases at the Uzundere - Izmir
solid waste disposai site, Izmir, Turkey. Waste Management 23 (2003) 741 -747.
Statistics Canada (2001). In: http://www.demographia.comldb-cancityhist.htm (16-05-
2005).
Tchobanoglous et al (1993). In: Wang, Y., Odle, W. S., Eleazer, W. E., & Barlaz (1997):
Methane potential of food waste and anaerobic toxicity of leachate produced
during food waste decomposition. Waste Management & Research (1997) 15,
149- 167.
20

Ten Brummeler & Koster (1989). In: Wang, Y., Odle, W. S., Eleazer, W. E., & Barlaz
(1997): Methane potential of food waste and anaerobic toxicity of leachate
produced during food waste decomposition. Waste Management & Research
(1997) 15, 149- 167.
The Recycling council of Ontario (1997): General information residential waste diversion
programs across Canada. htt;p://www.rco.on.ca/factsheetlfs ID6.html
UNCHS (2005): Toois and Statistics Unit.
www.unhabitat.orgihabrdd/CONTENTS.html (21-03-2005)
UN Statistics Division (2005): World Comparison Real Gross Domestic Product and
Purchasing Power, summery of 1985 results.
http://unstats.un.orgiunsd/methods/icp/gdp02htm.htm (20-03-2005).
USEPA (1992). In: Lober, D. 1. (1996): Municipal solid waste policy and public
participation in household source reduction. Waste Management & Research
(1996) 14, 125 - 143.
USEPA (1994). In: Wang, Y., Odle, W. S., Eleazer, W. E., & Barlaz (1997): Methane
potential of food waste and anaerobic toxicity of leachate produced during food
waste decomposition. Waste Management & Research (1997) 15, 149- 167.
USEPA (2003). In: Huber-Humer, M (2004): International research into landfill gas
emissions and mitigation strategies- IWWG working group "CLEAR". Waste
Management 24 (2004) 425 - 427.
USEPA web site: www.epa.gov/msw/facts.htm (22-03-2005)
Walker, 1.M. (1992): Control of composting odors. In: Hoitink, H. A. 1., & Keener, H.
M. (eds). Proceedings of an international composting research symposium held
on March 27-29, 1992, pp. 185. Hyatt Regency at the Ohio Center, 350 North
High Street, Columbus, OH.
Wang, Y., Odle, W. S., Eleazer, W. E., & Barlaz (1997): Methane potential offood
waste and anaerobic toxicity of leachate produced during food waste
decomposition. Waste Management & Research (1997) 15, 149- 167.
Ward (1993). In: Abu Qdais, H. A., Hamoda, M. F., & Newham, J. (1997): Analysis of
residential solid waste at generation sites. Waste Management & Research (1997)
15,395- 406.
21

World Bank (1999): What a Waste: Solid Waste Management in Asia. Urban Development Sector Unit, East Asia and Pacific region. www.worldbank.orglhtml/fpd!urbanlpublicat/whatawaste.pdf (19-01-2005)
World Urbanization Prospects, The 2001 Revision, ESNPIWP.173, and 20 March 2002. Population Division, Department of Economics and social affairs, United Nations Secretariat. www.un.orglesa/population/publications/wup200l/wup200 1 dh.pdf (15/10/2004)
Zucconi, F., & Bertoldi, M.de. (1986): Compost specifications for the production and characterization of compost from municipal solid waste in compost: production,
quality and use. In: Bertoldi, M. De, Ferranti, M. P., L'Hennite, P., & Zucconi, F., (eds). Proceedings of a symposium organized by the commission of the European communities, Directorate General Science, Research and Development, 17-19 April.Udine ltaly.
22

Table 2.1 MSW generation of different economic group countries (1990)
Income group lGDP capita-lyea{l 2MSW generation rate (US $) (kg capita-ldail)
Low < 1500 0.53 Lower-middle 1500-3000 0.63 Upper-middle 3000-10000 0.71 High > 10000 1.20 Reference: lUN Statistics Division, 2Beede & Bloom (1995)
Table 2.2 Changes in the MSW composition with economic prosperity Countries Com~nents (%)
Compostable Paper Plastic Glass Metal Others or organic
Low-income Nepal (1994) 80 7 2.5 3 0.5 7 Bangladesh (1992) 84.37 5.68 1.74 3.19 3.19 1.83 Lao PDR (1998) 54.3 3.3 7.8 8.5 3.8 22.5 Sri Lanka (1993-94) 76.4 10.6 5.7 1.3 1.3 4.7 China (1991-95) 35.8 3.7 3.8 2 0.3 54.3 Myanmar (1993) 80 4 2 0 0 14 India (1995) 41.8 5.7 3.9 2.1 1.9 44.6 Middle-income Thailand (1995-96) 48.6 14.6 13.9 5.1 3.6 14.2 Malaysia (1990) 43.2 23.7 11.2 3.2 4.2 14.5 Mexico (1993t 52 14 4 6 3 20 Turkey (1993t 64 6 3 2 1 24 Indonesia (1993) 70.2 10.9 8.7 1.7 1.8 6.2 Philippines (1995) 41.6 19.5 13.8 2.5 4.8 17.9 Hiw-income Canada (l993t 34 28 11 7 8 13 USA (1993t 23 38 9 7 8 16 Australia (1993 t 50 22 7 9 5 8 Denmark (1993 t 37 30 7 6 3 17 Finland (1993t 32 26 0 6 3 35 France (1993t 25 30 10 12 6 17 Greece (1993t 49 20 9 5 5 13 Netherlands (1993/ 43 27 9 4 5 8 Norway (1993/ 18 31 6 4 5 36 Spain (1993t 44 21 11 7 4 13 Switzerland (1993t 27 28 15 3 3 24 Japan (1993) 26 46 9 7 8 12 Hong Kong (1995) 37.2 21.6 15.7 3.9 3.9 17.6 Reference: World Bank (1999), aOECD (1995)
23

Table 2.3 City and country wise MSW generation and component of putrescibles City/country GDPcapita- l * MSW %Putrescible %FW
(1994 in US$) (kg capita-1dafI) (ww) (ww)
Nepal India La paz, Bolivia Sasha Settlement, Nigeria Manila, Philippines Asuncion, Paraguay Lima, Peru Turkey Bangkok, Thailand Rio de Janeiro, Brazil Mexico city, Mexico Caracas, Venezuela USA
& %UP inI985** 212 & 7.8 373 & 24.3 878 & 50.5 909 & 30.7 1058 & 43.1 1832 &45 2109 & 66.9 2536 & 52.5 2619 & 17.9 2634 & 70.7 3412 & 69.6 3477 & 81.9 27678 & 74.5
GDP capita- l: gross domestic product per capita
%UP: percent urban population ww: wet weight
0.25-O.5a
0.15_0.8al
0.5c
0.17c
0.42c
0.64c
0.96c
0.95d
0.93e
0.54c
0.68c
0.94c
1.88
~70a _
40-85b -
53.5c -
76c
49.8c -
60.8c _
34.3c -
50-55d -
23-44f
47.r -
Reference: *IEA (2002), **UNCHS (2005), aPokhrel & Viraraghavan (2005), al Shekdar (1997), ~ational Solid Waste Association of India (2003), COiaz et al (1986), ~etin et al (2003), ~SCAP (1990), fMuttamara et al (1994), 8USEPA (1992), hLober (1996), iUSEPA (1994), iTchobanoglous et al (1993)
Table 2.4 Residential waste production (RWP) City/country GDPcapita-I* RWP
(1994 in US$) (kg capita-1dafl) & %UP in1985**
India 373 & 24.3 0.41 Saudi Arabia 6887 & 72.7 Quatar 14643 & 87.9 Kuwait 15055 & 93.8 1.51 Abu Dhabi, UAE 16035 & 76.9 1.76a
UK 19187 & 88.9 0.8 USA 27678 & 74.5 1.98 Germany 29717 & 84 1.15
%FW (ww)
35 53.3 37.5 49K
28 27
Reference: *IEA (2002), **UNCHS (2005), KAbu Qdais et al (1997), Ward (1993)
24

Table 2.5 Household waste (HHW) and MSW production in European cities City/country IillW %OM MSW
kg res-1day"1 (bymass) kg res-1day"1
Berlin, Germany 1.06 4.3 1.7 Copenhagen, Denmark 0.8 30.3 2.23 Munich, Germany 1.02 40 1.62 Vienna, Austria 0.83 23.3 1.17 Budapest, Hungery 0.78* 34.7 1.22 Paris, France 0.9* 16.3 1.43 Stockholm, Sweden 0.62* 35.7 0.93 Zurich, Switzerland 0.76* 1.18 %OM: percent organic material *Estimated values Reference: Scharff & Vogel (1994)
Table 2.6 Domestic waste production in USA and Canada Countries USA Canada Domestic waste 1.6 1.7 kg person-1day"1
Waste components % B.C.% Ontario % Paper 40 36 36 Glass 7 9 7.2 Yard + Food waste 25 22 31.5 Metals 8.5 Il 6.5 Plastic 8 Il 6.2 Others 11.5 11 12.6 Total waste 100 100 100 Reference: Environment Canada (1991), Laplante (1992)
Table 2. 7 C~ production potential from food waste (FW) C~ production potential References
300.7 ml C~g-l ofFW
200-500 ml Ca. g-l VS
Wang et al (1997)
Hansena et al (2004)
25
%HHW inMSW 62 36 63 71 64 63 67 64
Quebec % 33 7.5 32.2 6.8 8.1 12.4 100

Table 2.8 Maximum recommended moisture contents for various composting materials
Type of waste
Theoretical
Straw
Wood (sawdust, small chips)
Rice hulls
~unicipalrefUse
~anures
Digested or raw sludge
Wet waste (grass clippings, garbage, etc)
Reference: Golueke
Table 2.9 Optimum pH ranges for composting
pH ranges
7-9
5.5- 8.0
5.5 - 9.0 (preferred 6.5 to 8.0)
Table 2.10 Nitrogen and C/N ratio of waste
Moisture content (% of total weight)
100
75-85
75-90
75-85
55-65
55-65
55-60
50-55
References
Bidlingmaier et al (1985)
Zucconi et al (1986)
Pace et al (1995)
~aterial N (% dw) C/N ratio (mass basis) References
Food waste 2.5 15 Maritinz & Otten (1999)
Wood chips 0.08 653 Maritinz & Otten (1999)
Wheat straw 0.46 92 Liang et al (1999)
26

Table 2.11 Nutrient content ofvarious composting substrates Material Nitrogen Phosphorus Potash C/Nratio
AsN asP20 5 asK (%dw) (%dw) (%dw)
Night soil 5.5-6.5 6-10 Urine 15-18 0.8 Bloodmeal 10-14 1-5 3.0 Animal tankage 4.1 Cowmanure 1.7-2 1.0 2.0 18 Poultry manure 5-6.3 1.9 1.2 15 Sheepmanure 3.8 Pigmanure 3.8 Horse manure 1.2-2.3 1.0 1.6 25 Raw sewage sludge 4-7 11 Digested sewage sludge 2-4 1.5 0.2 Activated sludge 5 6 Grass clippings (green) 2.4-6 12-15 Grass clippings and weeds 2.0 1.1 2.0 Mixed grasses 2.4 19 Nonlegume veg. Wastes 2.5-4 11-12 Bone meal 2.0 23 Coffee grounds 2.1 0.3 0.3 Cottonseed Meal 6.6 2.0-3.0 1.0-2.0 Eggshells 1.2 0.4 0.1 Fish scraps 2.0-7.5 1.5-6.0 Garbage 2.0-2.9 1.1-1.3 0.8-2.2 Meat scraps 5-7 Potato tops 1.5 25 Seaweed 1.7 0.8 4.9 Salt marsh hay 1.1 0.3 0.8 Straw, wheat 0.3-0.5 128-150 Straw,oats 1.1 48 Leaves, fresh 0.5-1.0 0.1-0.2 0.4-0.7 41 Sawdust 0.1 200-500 Food wastes 3.2 15.6 Mixedpaper 0.19 227 Yard wastes 1.95 22.8 Woodashes 0.1-2.0 4.0-10
Reference: Adapted from Glueke, Poincelot, and Kayhanian & Tchobanoglous.
27

CONNECTING STATEMENT TO CHAPTER THREE
The treatment and reduction of urban food waste (UFW) production reduces
pressure on municipal solid waste (MSW) landfill systems both in developed and
developing economies. Therefore, estimated growth of UFW production for the
upcoming decades provides an opportunity to make future urban waste management
strategy for its treatment. Chapter three examines the predicted growth of UFW with
possible altemate solutions to reduce pressure on urban waste management systems.
This chapter is drawn from a manuscript prepared for publication by the author of
the thesis and co-authored by his supervisor, Prof. Dr. Suzelle Barrington, Department of
Bioresource Engineering, McGill University and Dr. Jose Martinez, Director ofResearch,
CEMAGREF, France. The format bas been changed to be consistent within this thesis.
28

CHAPTER THREE
PREDICTED GROWTH OF FOOD WASTE PRODUCTION
FROM URBAN AREAS AROUND THE WORLD
ABSTRACT
The landfilling of food waste (FW) along with municipal solid wastes (MSW) leads
to several environmental problems such as the formation of leachate contaminating
groundwater and the emission of greenhouse gases. To develop other treatments besides
landfilling for FW, their production rate must he predicted. This chapter presents
evidence that gross domestic product (GDP, US$/capita) is the key factor governing
growth the percentage of population living in urban as opposed to rural areas, and
determining the production ofMSW and urban FW (UFW). For several world countries,
this chapter then predicts urban population (UP) and UFW production as a function of
population growth and GDP growth. Furthermore, this chapter examines the effect on
UFW production of introducing policies to improve the economic situation in rural areas,
and stopping the movement of people towards cities.
On a global scale, MSW and UFW production are expected to increase by 94% and
76% from 1995 to 2025. Because of its expected economic development, Asia is
expected to experience the largest increase in UFW, from 220 million tons to 418 million
tons from 1995 to 2025. From 1995 to 2025, UFW disposed in landfills will potentiality
increase world C~ emissions from 27 million tons to 48 million tons and the landfill
share of global anthropogenic emissions from 8% to 10%. Encouraging people to stay in
rural areas where they can easily use their FW as soil amendment, can lead to 30%
decrease in UFW production by the year 2025 and the drop in the landfill share of the
global anthropogenic emissions from 10% to 7%.
29

3.1 Introduction
Among aIl fractions found in municipal solid wastes (MSW), food waste (FW) is the
most active biologically. Uncollected, UFW attracts disease vectors such as microbes,
insects and rats, and decomposes to produce leachate contaminating runoff and
greenhouse gas emissions (GGE). Collected and conventionally eliminated through
landfills, UFW uses large surfaces of valuable land, especially in developing countries,
produces large volumes of contaminated leachate risking groundwater pollution and
emits important quantities of greenhouse gases further contributing to earth warming
trends.
ln consideration of the steadily increasing world population and of countries like China
and India, with large populations experiencing significant economic growth, the production
of FW is likely to increase and impose even more global environmental pressure. Since the
price for agricultural produce at the farm has not increased for over 30 years because of
world trading policies, any improvement in the economic welfare of a country leads to a
greater gap between rural and urban employment opportunities, thus resulting in more
people finding their way into cities. A higher percentage of people living in cities will put
more stress on already overburdened MSW management systems by requiring more
transportation facilities to handIe more waste transported over greater distances as city
borders expand. More elaborate treatment systems will he needed especially if the treatment
is conducted on the outskirts of the city. The management of the FW fraction of MSW is
less of an issue in rural communities, because of it can easily be recycled as a soil
amendment.
The aim of this chapter is to provide sorne foresight into the mass of urban FW
(UFW) to be managed by cities around the world by the year 2025. The prediction of
such quantities, along with the management method selected, provides a tool to evaluate
the impact of UFW on the required size of treatment systems, such as the extent of
landfill operations and the resulting environmental impacts such as the landfill land
usage, groundwater contamination risks and greenhouse gas emissions. The first
objective ofthis chapter is therefore to test the hypotheses that, as a country's per capita
Gross Domestic Production (GDP, $US) increases, so does the percentage of people
living in urban as opposed to rural areas, and so does the per capita MSW and UFW
30

production. Other factors such as availability of food, food habit, social and political
scenarios may have impact on movement of people from rural to urban centers and UFW
production. However, in this study, GDP has been considered one of the major factors
affecting movement of people from rural to urban centers and UFW production. Having
demonstrated that such hypotheses hold, equations will be developed to predict the
amount of UFW produced in countries around the world by the year 2025. Finally, two
scenarios will be examined to evaluate their impact on reducing UFW production: the
first will assume no further movement of the world population towards cities, with rural
communities disposing of 75% of their FW as soil amendments, and; the second will
presume that 75% of all UFW can be composted or anaerobically digested on site, within
cities, rather than sent to landfills, and that such treatments will reduce GGE by 25%, as
compared to landfilling.
3.2 Literature review
Urban food waste (UFW) constitutes 50% to 80% of the MSW stream in the urban
areas of low and middle-income countries, and 25% to 30% in that of high-income
countries (Achankeng 2003).
Already required to manage an enormous quantity ofMSW, many world cities are faced
with an accumulation problem because of the physical and economic pressures placed on
disposaI systems (Chakrabarti & SarkheI2003). The improper handling ofMSW is already
posing a serious threat to human health in many large cities of the world (Lu 1995, Ahmed
& Jamwal 2000, Hong et al 1996). With better economic conditions implying the movement
of population towards urban centers, this problem is likely to get worse for countries of low
to medium income, where presently over 65% of the population dwells in rural areas, as
compared to 8% for high income countries such as Canada (UNCHS 2005).
In low to medium income countries, city authorities do not have the resources to collect
aU the MSW generated, and for that collected, only a fraction receives proper disposaI. In
India, Pakistan (Karachi) and Egypt (Cairo), only 50%, 33% and 50% of the generated
MSW is collected, respectively (Sinha & Enayetullah 1995, Medina 2002), and 90% of the
collected MSW is disposed in open dumps (Medina 2002). In Africa, up to 80% of the waste
is either not collected, or coUected but illegally dumped (Achankeng 2003).
31

Uncollected MSW is a major health problem for a city as it accumulates in streets, clogs
sewers when it rains leading to floods, and runs into rivers or lakes where it further
contaminates the ecosystem (Medina 2002, Chakrabarti & Sarkhel 2003). A 1997 survey
indicated that over 90% of China's and India's population felt that their health was
adversely affected by environmental problems resulting from improper MSW management
(China Waste Management 2004, World Bank 1999). Such poor MSW management led to
the outbreak of plague in Surat, India, in September 1994 (Venkateshwaram 1994). In 1994,
WHO (1995) reported 617 000 cases of cholera resulting in 4400 deaths aIl over Africa
(Angola, the Democratic Republic of the Congo, Malawi, Mozambique and Tanzania). In
Malawi, Mozambique and Zimbabwe, Holloway (1995) reported 600 deaths resulting from
171 000 cases of dysentery.
When landfilled, UFW leads to GGE and the enrichment of atmospheric CRt
(Cicerone & Oremland 1988, Dlugokencky et al 1998, Shipham et al 1998, Rasmussen &
Khalil 1984), a major greenhouse gas (Burton & Turner 2003) trapping 21 times more
heat per unit mass than CO2 (IPCC 2001).
In landfill sites, FW release gases with 60% to 65% CRt and 35% to 40% CO2 (Legg
1990, Borjesson & Svenssen 1997, Hong et al 1996, Sol id Waste Landfill Guidance
1999). According to Wang et al. (1997), FW generates 300L of CRt (dry kg)"l. In a
laboratory experiment, Hansen et al (2004) found that FW produces from 200 to 500L of
CRtkg-1 of volatile solids (VS).
Thus, landfills are responsible for approximately 8% of the anthropogenic world CH.. emissions (USEPA 1994), with higher percentages of 37% and 30% being observed in
high income countries such as the US and those of Europe, respectively (USEPA 2003,
EEA 2001).
Once landfiIled, FW is known to decompose and produce liquid which leaches
organic and inorganic contaminants (Bou-Zeid & EI-Fadel 2004, Bilitewsi et al 1994)
considered to be a major sources of groundwater contamination (Gonullu 1994, Zacharof
& Butler 2004). Therefore, contamination of water resources from landfillleachate can
be minimized by the source separation of FW, which represents the major organic
fraction of the MSW stream.
32

3.3 Testing the hypotheses
The study was designed to produce equations predicting the future production of
UFW for countries around the world. These equations are based on the hypotheses that
GDP is the main force behind the movement of population from rural to urban centers
and the increase in both MSW and FW production. If these hypotheses are true, then
UFW production can be predicted as a function of future world population, and as a
function of the effect ofGDP on mass ofMSW and FW produced.
To test these hypotheses, regression equations will be formulated between GDP and
percentage urban population (UP), and between GDP and MSW as weIl as FW
production (Excel, Microsoft 2003). The value of such regression coefficient will he a
measure of the validity of the equations produced.
For different countries around the world, Tables 3.1a, 3.1b, 3.1c and 3.1d present
values of GDP, percentage urban population (%UP), totals population (TF) and
population growth. Based on the data presented in Tables 3.1a-3.1d, growth in GDP was
correlated to %UP (Figure 3.1).
The following equations are obtained from the correlation of GDP and %UP for
different countries in Africa, Asia, Europe and the Americas, respectively (Figures 3.1a,
3.1b, 3.1c and 3.1d):
(%UP)afc = [15.547 * Ln (GDP)afc] - 56.674
(%UP)ac = [15.06 * Ln (GDP)ac] - 51.539
(%UP)ec = [10.087 * Ln (GDP)ec] -15.242
(%UP)amc = [12.88 * Ln (GDP)amcl - 38.769
where:
(R2 = 0.90)
(R2 = 0.90)
(R2 = 0.86)
(R2 = 0.85)
(%UP) = percentage of urban population for a given continent in 1995;
(GDP) = GDP for a given continent in 1995;
(3. la)
(3.1b)
(3.1c)
(3.Id)
Subscripts afc, ac, ec and amc = pertaining to Africa, Asia, Europe and the Americas.
Relatively high correlation coefficients of 0.90 were obtained for Africa and Asia,
while slightly lower but still valid coefficients (R2 = 0.85) were obtained for Europe and
the Americas. This difference is most probably due to the fact that in Europe and the
Americas, agricultural production is subsidized, leading to the maintenance of rural
populations and a slight variation in the relationship between GDP and %UP.
33

The data gathered in Table 3.2 was used to correlate GDP to MSW and FW production (Figure 3.2):
(MSWPR)CRY = [8 * 10-5 (GDP)cRY] + 0.5114
(FWPR)cRY= [l0-5* (GDP)cRY] + 0.3157
where:
(MSWPR)CRY = MSW Production Rate, kg capita-1dafl;
(GDP)cRY = GDP, US$;
(FWPR)cRY = FW production rate, kg capita-1dafl;
(R2 = 0.94)
(R2 = 0.81)
Subscripts CRY = C for country, R for continent and Y for year.
(3.2a)
( 3.2b)
Although the production of MSW is weIl correlated with GDP (R2 = 0.94), the production rate of FW demonstrates a slightly lower but still valid correlation coefficient of 0.81 with GDP. This lower correlation value between FW production and GDP is likely due to variations in food habits, availability of fresh food supply and amount of food processing generally leading to more FW. Production rates and composition of FW vary with country, availability of resources and season (Abu Qdais et al 1997, World Bank 1999). Medina (2002) also found a positive correlation between income and the amount of MSW produced. For example, China Waste Management (2004) reported an economic growth during the last two decades of almost 10% along with an annual increase in MSW generation of 8% to 10% and UP increased from 30% to 35% in the period of 1997 to 2003.
Accordingly, the likelihood that growth in GDP can predict growth in %UP, MSW and UFW production is relatively high for Africa and Asia, where most of the world population is found, and sIightly less accurate for Europe and the Americas. Furthermore, the largest changes in GDP are expected to occur in Asia, where higher correlation coefficients were obtained. Accordingly, the overall prediction for the world can be relatively accurate.
3.4 Predicted growth of MSW, UFW and Ca. 3.4.1 Expected GDP and UP gTowth
Growth in GDP is the tirst element to compute, as it is required along with world population growth to predict changes in %UP and growth in production of MSW and UFW. The GDP of individual countries around the worId was estimated by considering
34

the average growth rate as presented in Table 3.3. Using the GDP of a country for 2000,
average annual GDP growth rate was used to predict GDP for the years 2005, 2010,
2015,2020 and 2025, as follows:
(GDP)sy = {(GDP)Gy/IOO (SY-GY)} * (100 + y) (SY-GY) (3.3)
where:
(GDP)sy = GDP for a future year;
(GDP)GY = GDP for a year in which GDP is known;
y = Average annual growth rate ofGDP for specific country, %;
Subscripts SY and GY = Specific and given year in which GDP is to be estimated.
With the growth in GDP for a representative number of countries around the world,
growth in %UP was computed for 2005 and 2025 as a function of GDP (Table 3.4).
Accordingly, the total urban population (TUP) was predicted for 2025, based on the
predicted population and %UP growth of the country.
The calculations predict, for example, that China which has experienced a GDP growth
from 2005 to 2025, from 1018 US$ to 2455 US$ with a UP increasing from 53% to 66%.
Similarly, the us is expected to experience a GDP growth from 34073 US$ to 44116 US$,
with an increase in UP from 96% to 99%, for the same period.
3.4.2 Predicting MSW, UFWand CH4 production
Using equations 3.1, 3.2 and 3.3, and the data in Tables 3.1a-3.1d, 3.2 and 3.3,
equations were formulated to predict the increase in MSW and UFW production, based
on GDP growth:
(MSWP)cRY= 3.65 * 10-9 * (UP)cRY * (MSWPR)CRY * (TP)cRY
(UFWP)cRY = 3.65 * 10-9 * (UP)CRY * (FWPR)cRY * (TP)cRY
(%UFW)cRY = [{(UFWP)CRy}1 {(MSWP)cRY] * 100
where:
(MSWP)cRY = MSW production, million ton year- l;
(UP)CRY = UP, %;
(TP)CRY = total population;
(UFWP)cRY = UFW production, million ton year- l;
(%UFW)CRY = UFW as % ofMSW;
(3.4a)
(3.4b)
(3.4c)
Subscripts CRY = C refers to the country, R to the continent and Y to the year.
35

Also, a relation is formulated to estimate Ca. emission from landfilled UFW:
(Ca.P)cRY = a * (%DW/100) * (UFWP)CRY (3.5)
where:
(C~P)cRY = C~ production, million ton year-1;
a = Ca. production potential as 0.204 kg C~ kg-1 dry weight ofFW (Wang et al 1997);
%DW = Dry weight ofFW, 30% (Peavy et al 1985);
Subscripts CRY = C refers to the country, R to the continent and Y to the year.
The predicted growth ofUFW and percentage ofUFW in MSW from 1995 to 2025,
as computed using equations 3.4 and 3.5 are illustrated in Figures 3.3 and 3.4, for various
countries around the world. Also, the data for selected countries are presented in Table
3.5 for 2010 and 2025.
Asia is and will continue to he a major contributor in UFWP because of its rapid
urban growth coupled with its increasing economic activity. Asia will increase its UFWP
from 220 million tons to 418 million tons from 1995 to 2025 (Figure 3.3). China and
India will generate remarkable amount of UFW (Table 3.5), representing 25% of total
global UFW production in 2010 and about 26% in 2025, for 33% of the world urban
population. The Americas will follow Asia increasing their UFWP from 99 million tons
to 168 million tons, in 2025. The US, Brazil and Mexico are major producers of UFW,
followed by Canada, Argentina, Peru and Chili. The Brazil and US will generate 91
million tons and 115 million tons of UFW in 2010 and 2025, respectively, representing
15% of total global UFWP for 10% of the world urban population.
In Africa, the production of UFW is expected to increase from 34 million tons to 81
million tons from 1995 to 2025, for a 4.6% average annual growth rate in 30 years
(Figure 3.3). Egypt and South Africa are expected to produce 11 million tons and 15
million tons in 2010 and 2025, respectively, followed by Morocco, Sudan and Nigeria. In
Europe, France, Italy, Germany, England and Russia are expected to produce 66 million
tons and 76 million tons in 2010 and 2025, respectively, representing 10% of total global
UFW production for 6% of the world population.
From 1995 to 2025, the percentage of UFW in MSW also varies among countries
within continents, depending on economic growth and income level (Figure 3.4). Higher
economic growth and income level produce lower % of UFW in MSW due to
36
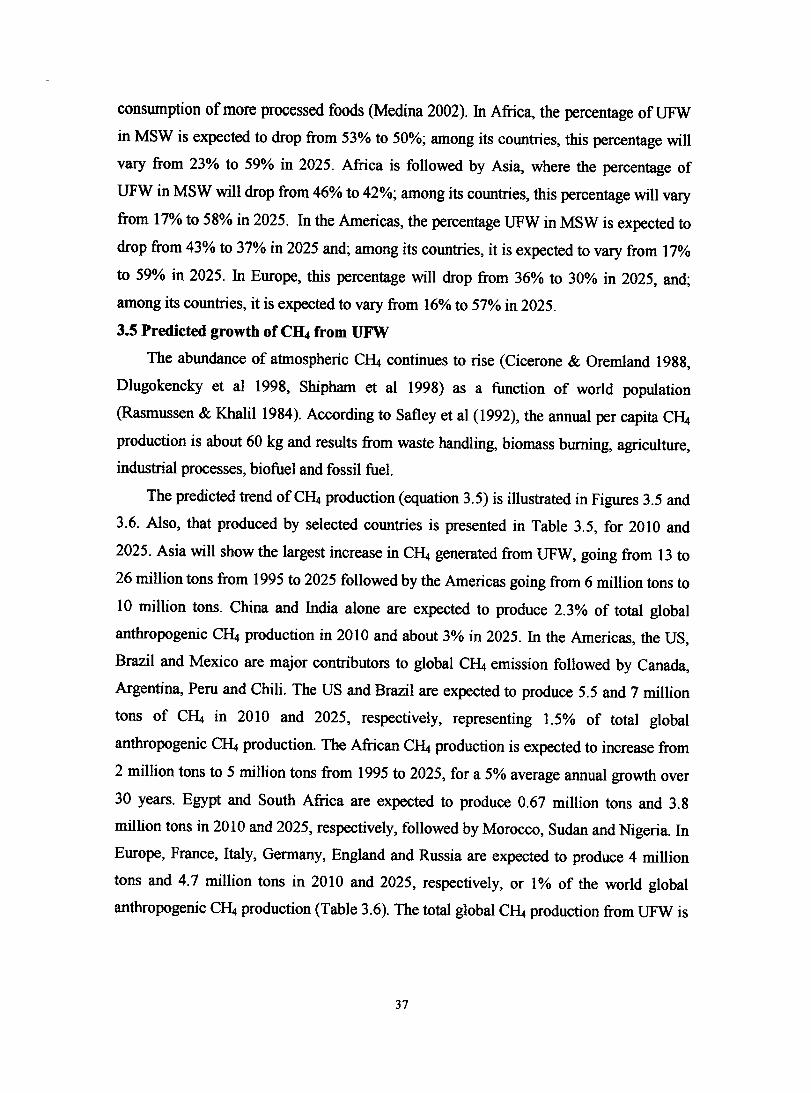
consumption of more processed foods (Medina 2002). In Africa, the percentage of UFW
in MSW is expected to drop from 53% to 50%; among its countries, this percentage will
vary from 23% to 59% in 2025. Africa is followed by Asia, where the percentage of
UFW in MSW will drop from 46% to 42%; among its countries, this percentage will vary
from 17% to 58% in 2025. In the Americas, the percentage UFW in MSW is expected to
drop from 43% to 37% in 2025 and; among its countries, it is expected to vary from 17%
to 59% in 2025. In Europe, this percentage will drop from 36% to 30% in 2025, and;
among its countries, it is expected to vary from 16% to 57% in 2025.
3.5 Predicted growth of Ca. from UFW
The abundance of atmospheric C~ continues to rise (Cicerone & Oremland 1988,
Dlugokencky et al 1998, Shipham et al 1998) as a function of world population
(Rasmussen & Khalil 1984). According to Safley et al (1992), the annual per capita C~
production is about 60 kg and results from waste handIing, biomass burning, agriculture,
industrial processes, biofuel and fossil fuel.
The predicted trend ofC~ production (equation 3.5) is illustrated in Figures 3.5 and
3.6. Also, that produced by selected countries is presented in Table 3.5, for 2010 and
2025. Asia will show the largest increase in C~ generated from UFW, going from 13 to
26 million tons from 1995 to 2025 followed by the Americas going from 6 million tons to
10 million tons. China and India alone are expected to produce 2.3% of total global
anthropogenic C~ production in 2010 and about 3% in 2025. In the Americas, the US,
Brazil and Mexico are major contributors to global C~ emission followed by Canada,
Argentina, Peru and Chili. The US and Brazil are expected to produce 5.5 and 7 million
tons of C~ in 2010 and 2025, respectively, representing 1.5% of total global
anthropogenic C~ production. The African C~ production is expected to increase from
2 million tons to 5 million tons from 1995 to 2025, for a 5% average annual growth over
30 years. Egypt and South Africa are expected to produce 0.67 million tons and 3.8
million tons in 2010 and 2025, respectively, followed by Morocco, Sudan and Nigeria. In
Europe, France, ltaly, Germany, England and Russia are expected to produce 4 million
tons and 4.7 million tons in 2010 and 2025, respectively, or 1% of the world global
anthropogenic C~ production (Table 3.6). The total global CH. production from UFW is
37

expected to increase from 27 million tons to 48 million tons from 1995 to 2025,
representing an increase from 8% to 10% of total anthropogenic C~ production.
3.6 Scenarios to minimize UFW effects
Whereas sections 3.4 and 3.5 illustrate the present trend using a "Do nothing
scenario", the following section will examine some alternative and their impact on UFW
production. The first scenario will examine the effect of no population movement to
urban centers and the recycling of 75% of rural FW as soit amendments or for biogas
production. The second scenario will examine the effect of using other disposaI systems
besides landfills.
3.6.1 Scenario one: stable %UP
Various factors compel the world population to move to cities and there are sorne
major environmental benefits in stopping this movement. The major issue is the economy
of rural areas around the world. The priee paid for fresh agricultural produce establishes
the economic wealth of rural communities in countries, regardless of the country' s
income level. During the last 30 years, farm gate priees have not increased whereas other
goods and services have experienced a ten fold increase. Faced with long hours of hard
work and limited income, children of farming families generally leave rural areas for
better opportunities in the city. Because of such poor economic conditions, farms are
handed down from one generation to the next, with relatively no outsidets bringing new
production ideas. These factors have lead to the deterioration of the economic conditions
in rural areas, with little being done to change its condition, even in countries like the US,
Canada and many countries of Europe.
This situation bas resulted and will bring about even higher percentages of
populations living in urban centers. In 1995, 3.12 billion or 55% of total world population
was living in cities and this will shift in 2025 to 5.2 billion or 65% of total world
population. Currently, 3.8 billion people live in urban centers representing 57% of total
world population. However, rural population is estimated to remain at 2.8 billion from
2005 to 2025. China will experienee the greatest shift towards UP, if it maintains its
economic growth, going from 44% to 66% from 1995 to 2025.
Reducing the world population movement from rural to urban areas can be achieved
through formulating world trade policies for agricultural produce insuring a better price at
38

the farm gate in exehange for more sustainable praetices. Perhaps world quota systems would then be needed to govern production in terms of consumption. The impact of higher food priees on the standard of living of lower to middle ineome countries would have to be eurtailed by internal policies. Nevertheless, higher priees for farm produee would induce higher GDP for lower to middle countries depending presently on international trade for the sale of commodities such as tea, coffee, sugar and fresh fruits and vegetables.
As compared to the "Do nothing" scenario, the result of curtailing UP growth is illustrated in Figure 3.7. Better rural conditions would result in 47% of the world population living in cities, in 2025, compared to 57% ifnothing is done. This trend would keep 1.47 billion people in rural areas from 1995 to 2025, reducing UFW by 239 million tons, which if recycled as soil amendment, would reduce C~ emission by 15 million tons or 3% of total global anthropogenic C~ emissions. This would also save from landfill operations, about 40 million ha yr-l of land and make it available for other more productive purposes.
3.6.2 Scenario Iwo: composting or digesting UFWon site, rather than landfilling If beside better rural economic poli cie s, cities were to treat their UFW through
composting or anaerobic digestion, even more C~ emissions can be curtailed while improving crop yields (Chakrabarti & SarkheI2003).
Besides a 75% reduction in GGE, the on site recycling of UFW would reduce MSW transportation load by 40%. In continents such as Africa and Asia, 50% less MSW would require transportation and landfilling. This will save the cost of waste collection, transportation and save the land required for landfilling, as weIl as reduce the environmental ramifications.
3.7 Conclusion
This study demonstrates that GDP is an influential factor in the growth of UP and UFW. The growth of urbanization and economic activities of large cities around the world contribute to the growing trend of UFW generation especially in developing economy. Therefore, UFW management should be considered seriously and that current planning should refleet a will to deal with this looming problem. If this "do nothing scenario" continues over upcoming decades, MSW management will impose tremendous
39

pressure on cities around the world, both financially and environmentally. Instead, two solutions are proposed:
(1) Scenario one: making rural economies more attractive and creating favorable living environment in the rural areas so that there will be reduced movement of people from rural to urban areas, and~
(2) Scenario twO: on site aerobic or anaerobic digestion within cities ofUFW rather than sending UFW to landfill.
These two scenarios can reduce the pressure pertaining to MSW management in world's cities. However, both the scenarios demand social and political commitment.
40

3.8 References
Abu Qdais, H. A, Hamoda, M. F., & Newham, J. (1997): Analysis of residential solid
waste at generation sites. Waste Management & Research (1997) 15,395- 406.
Achankeng, E. (2003): Globalization, Urbanization and Municipal Solid Waste
Management in Africa. African Studies Association and the Pacific. 2003
Conference Proceedings-African on a Global Stage.
ww.ssn.flinders.edu.au/global/afsaap/ conferences/2003proceedings/achankeng.PDF
(26-01-2005)
Ahmed & Jamwal (2000). In: Zurbrcugg, C., Drescher, S., Patel, A, & Sharatchandra, H.
C. (2004): Decentralized composting of urban waste- an overview of community
private initiatives in Indian cities. Waste Management 24 (2004) 655 - 662.
Beede and Bloom (1995). In: Chakrabarti, S., & Sarkhel, P. (2003): Economics of Solid
Waste Management: A Survey of Existing Literature. Economie Researeh Unit,
Indian Statisticallnstitute. www.isical.ac.in/-eru/2003-11.pdf (19-01-2005)
Bilitewski, B., Hardtle, G., & Mark, K. (1994): Waste Management, pp. 283. Weissbach,
A, & Boeddicker, H. (eds & translators). Springer-Verlag Berlin Heidelberg 1997.
Printed in Germany.
BOIjesson, G., and Svenssen, B.H. (1997). Seasonal and diurnal methane emissions from
a landfill and their regulation by methane oxidation. Waste Management & Research
(1997) 15,33 - 54.
Bou-Zeid, E., & EI-Fadel, M. (2004): Parametric sensitivity analysis ofleachate transport
simulations at landfills. Waste Management 24 (2004) 681-689.
Burton, c.H., & Turner, C. (2003): Manure Management, Treatment Strategies for
Suatainable Agriculture, pp. 87. 2nd Edition. Silsoe Research Institute. Editorial
board: Beek, J.AF., Martinez, J., Martens, W., Pahl, o., Piccinini, S. and Svoboda, I.
CEPn (2002): The outlook for world demographic change and growth to the year 2030.
~ 208 - January 2002.
www.eepii.fr/anglaisgraph/publieations/lettre/pdf/2002/let208ang. pdf (25-03 -2005)
Chakrabarti, S., & Sarkhel, P. (2003): Economies ofSolid Waste Management: A Survey
of Existing Literature. Economie Researeh Unit, Indian Statistieal Institute.
www.isieal.ae.inl-eru/2003-11.pdf (19-01-2005)
41

China Waste Management (2004): Working paper for streams technology programme.
Compiled by Juho Rissanen & Teemu Naarajarvi, Tekes Beiging in Cooperation
with Environmental Resources Management (ERM), Shanghai.
http://websrv2.tekes.fi/opencms/opencms/OhjelmaPortaaliIKaynnissaiStreams/ftIDo
kumenttiarkistoNiestinta ja aktivointilJulkaisutIKansainvaliset seivityksetlS24045
Waste Management Review.pdf(19-01-2005)
Cicerone & Oremland (1988). In: Czepiel, P. M., Shorter, J. H., Mosher, B., Allwine, E.,
McManus, J. B., Harriss, R.C., Kolb, C.E. & Lamb, B.K. (2003): The influence of
atmospheric pressure on landfill methane emissions. Waste Management 23 (2003)
593 - 598.
Diaz, L.F., Golueke, C.G., & Savage (1986). In: Bertoldi, M. De, Ferranti, M.P.,
L'Hermite, P., & Zucconi, F. (eds): Energy balance in compost production and use in
compost: production, quality and use. Proceedings of a symposium organized by the
commission of the European communities, Directorate General Science, Research
and Development, 17-19 April 1986, pp. 8. Udine Italy.
Diaz, L.F., Savage, G.M., Eggerth, L.L., & Golueke, C.G. (1993). Composting and
Recycling. Municipal Solid Waste, pp.36. Lewis Publishers.
Dlugokencky et al (1998). In: Czepiel, P. M., Shorter, J. H., Mosher, B., Allwine, E.,
McManus, J. B., Harriss, R.C., Kolb, C.E., & Lamb, B.K. (2003): The influence of
atmospheric pressure on landfill methane emissions. Waste Management 23 (2003)
593 - 598.
EEA (2001). In: Huber-Humer, M. (2004): International research Înto landfill gas
emissions and mitigation strategies- IWWG working group "CLEAR". Waste
Management 24 (2004) 425 - 427.
Gonullu, M. T. (1994): Analytical modelling of organic contaminants in leachate. Waste
Management & Research (1994) 12, 141-150.
Hansen, T.L., Schmidt, J.E., Angelidak, 1., Marca, E., Jansen, C.J., MosbXk, H., &
Christensen, T.H. (2004): Method for determination of methane potentials of solid
organic waste. Waste Management 24 (2004) 393 - 400.
42

Holloway (1995). In: Chakrabarti, S. & Sarkhel, P. (2003): Economics of Solid Waste
Management: A Survey of Existing Literature. Economic Research Unit, Indian
Statistical Institute. www.isical.ac.inj-..·eru/2003-11.pdf (19-01-2005).
Hong, Y., Pan, S., Shoa, Q., Liu, F., & Duo, Y. (1996): A study to define a standard
health protection zone for sanitary landfill in Fu Shan City. Waste Management &
Research (1996) 14,505 - 510.
IEA (2002): International Energy Annual, Energy Infonnation Administration.
http://www.eia.doe.gov/publinternationaViealf/tablebl.xls Table Posted: May 24,
2004 and http://www.eia.doe.gov/pub/international/iealf/tableb2.xls Table Reposted:
June 25, 2004 (17-03-2005).
IPCC (2001). In: Czepiel, P. M., Shorter, J. H, Mosher, B., Allwine, E., McManus, 1. B.,
Harriss, R.C., Kolb, c.E., & Lamb, B.K. (2003): The influence of atmospheric
pressure on landfill methane emissions. Waste Management 23 (2003) 593 - 598.
Legg, B.1. (1990). Farm & food waste: Utilization without pollution. Agricultural and
food processing wastes. Proceedings of the sixth international symposium on
agricultural and food processing wastes. December 17-18, 1990, pp. xi-xxi. ASAE
publication 05-90.
Lu, C. (1995): A model of leaching behavior from MSW incinerator residue landfills.
Waste Management & Research (1995) 14, 51-70.
Medina, M. (2002): Globalization, Development and Municipal Solid Waste
Management in Third World Cities. El Colegio de la Frontera Norte, Tijuana,
Mexico.
ww.gdnet.orglpd:tl2002A wardsMedalsWinners/OutstandingReseachDevelopment/ma
rtin _ medina _ martinez -paper. pdf (19-01-2005)
OECD (1995). In: World Bank (1999): What a Waste: Solid Waste Management in Asia.
Urban Development Sector Unit, East Asia and Pacific.
www. worldbank.org/html/fpd/urbanipublicat/whatawaste. pdf (19-01-2005).
Peavy, H. S., Rowe, D. R., & Tchobanoglous, G. (1985): Environmental Engineering, pp.
580. McGraw-Hill Publishing Company.
43

Rasmussen and Khalil (1984). In: Czepiel, P. M., Shorter, J. H., Mosher, B., Allwine, E.,
McManus, J. B., Harriss, R.e., Kolb, C.E., & Lamb, B.K. (2003): The influence of
atmospheric pressure on landfill methane emissions. Waste Management 23 (2003)
593 - 598.
Safley et al (1992). In : Burton, C.H. & Turner, C. (2003): Manure Management, pp. 88.
Treatment Strategies for Suatainable Agriculture. 2nd Edition. Silsoe Research
Institute. Editorial board: Beck, J.A.F., Martinez, J., Martens, W., Pahl, O., Piccinini,
S. and Svoboda, 1.
Shipham et al (1998). In: Czepiel, P. M., Shorter, J. H., Mosher, B., Allwine, E.,
McManus, J. B., Harriss, R.e., Kolb, C.E., & Lamb, B.K. (2003): The influence of
atmospheric pressure on landfill methane emissions. Waste Management 23 (2003)
593 - 598.
Sinha, M. & Enayetullah, 1. (1995): "Recycling potentials of organic wastes in Dhaka
city", a paper published in 'EARTH' magazine issue no.4, 1995.
Solid waste landfill guidance (1999). In: Onargan, T., Kucuk, K., & Polat, M. (2003): An
investigation of the presence of methane and other gases at the Uzundere - Izmir
solid waste disposaI site, Izmir, Turkey. Waste Management 23 (2003) 741-747.
UNCHS (2005). Toois and Statistics Unit. www.unhabitat.orglhabrddiCONTENTS.html
(21-03-2005)
UN Statistics Division (2005): World Comparison Real Gross Domestic Product and
Purchasing Power, summery of 1985 results.
http://unstats.un.orglunsdimethodslicp/gdp02htm.htm (20-03-2005).
US EPA (2003): In: Huber-Humer, M. (2004): International research into landfill gas
emissions and mitigation strategies- IWWG working group "CLEAR". Waste
Management 24 (2004) 425 - 427.
US EPA (1999): Municipal Solid Waste in The United States: 1999 Facts and Figures.
www.epa.gov/epaoswer/non-hw/muncpl/msw99.htm (22-03-2005).
USEPA (1994). In: Wang, Y., Odle, W. S., Eleazer, W. E., & Barlaz (1997): Methane
potential of food waste and anaerobic toxicity of leachate produced during food
waste decomposition. Waste Management & Research (1997) 15, 149- 167.
44

Venkateshwaran (1994). In: Chakrabarti, S. & Sarkhel, P. (2003): Economics of Solid
Waste Management: A Survey of Existing Literature. Economic Research Unit,
Indian Statistical Institute. www.isical.ac.inI-eru/2003-11.pdf (19-01-2005)
Wang, Y, Odle, W. S., Eleazer, W. E., & Barlaz (1997): Methane potential of food waste
and anaerobic toxicity ofleachate produced during food waste decomposition. Waste
Management & Research (1997) 15, 149- 167.
Ward (1993). In: Abu Qdais, H. A, Hamoda, M. F., & Newham, J. (1997): Analysis of
residential solid waste at generation sites. Waste Management & Research (1997) 15,
395- 406.
WHO (1995). In: Chakrabarti, S. & Sarkhel, P. (2003): Economics of Solid Waste
Management: A Survey of Existing Literature. Economic Research Unit, Indian
Statistical Institute. www.isical.ac.inJ-eru/2003-11.pdf (19-01-2005)
World Bank (1999 : 16). In: China Waste Management (2004): Working paper for
streams technology programme. Compiled by Juho Rissanen & Teemu Naarajarvi,
Tekes Beiging in Cooperation with Environmental Resources Management (ERM),
Shanghai. Websrv2. tekes.fl/ ... /julkaisutlkansainvaliset_ selvitykset/
S24045_Waste_Management_Review.pdf(19-01-2005)
World Bank (1999): What a Waste: Solid Waste Management in Asia. Urban
Development Sector Unit, East Asia and Pacific.
www.worldbank.orglhtrnVfpd/urban/publicat/whatawaste.pdf (19-01-2005)
World Resources (1998 - 99). p. 278, Data Table 9.3 Urban Data. In: Achankeng, E.
(2003): Globalization, Urbanization and Municipal Solid Waste Management in
Africa. African Studies Association and the Pacific. 2003 Conference Proceedings -
African on a Global Stage.
www.ssn.flinders.edu.au/globaVafsaap/conferences/2003proceedings/
achankeng.PDF (26-01-2005)
Zacharof, A I., & Butler, A P. (2004): Stochastic modelling of landfill leachateand
biogas production incorporating waste heterogeneity. Model formulation and
uncertainty analysis. Waste Management 24 (2004) 453-462.
45
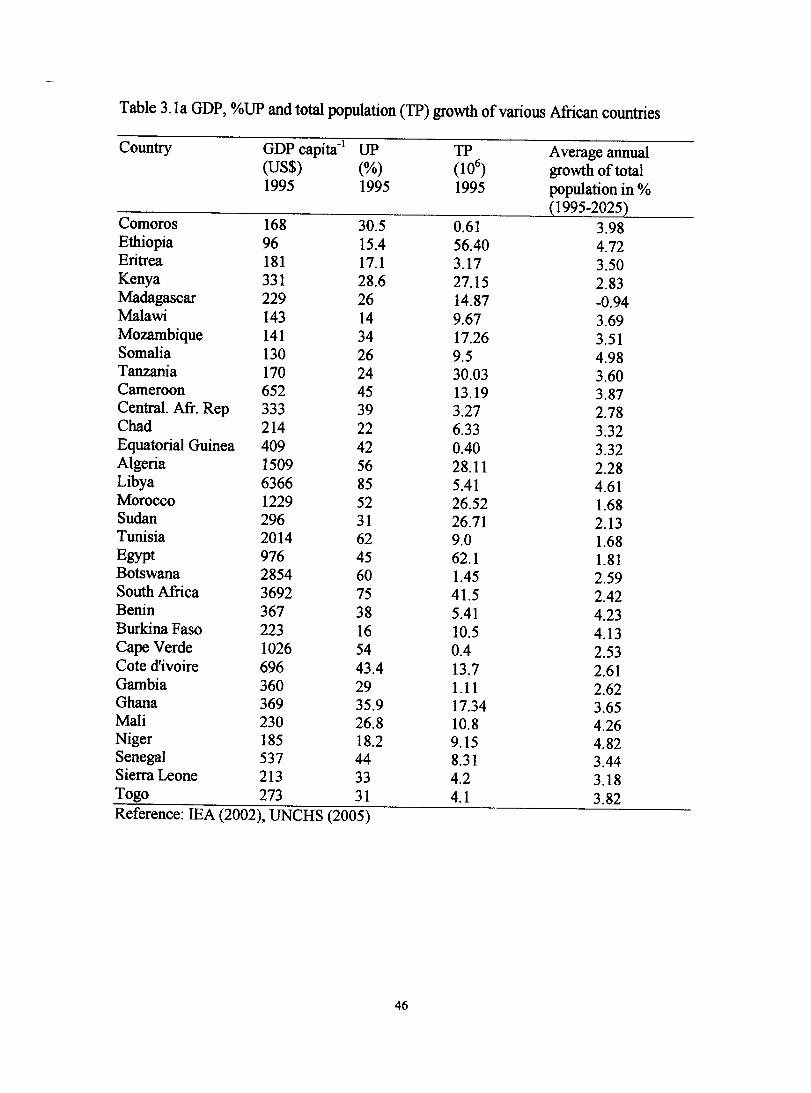
Table 3.1a GDP, %UP and total population (TP) growth ofvarious African countries
Country GDP capita- l UP TP Average annual (US$) (%) (106
) growth of total 1995 1995 1995 population in %
(1995-2025) Comoros 168 30.5 0.61 3.98 Ethiopia 96 15.4 56.40 4.72 Eritrea 181 17.1 3.17 3.50 Kenya 331 28.6 27.15 2.83 Madagascar 229 26 14.87 -0.94 Malawi 143 14 9.67 3.69 Mozambique 141 34 17.26 3.51 Somalia 130 26 9.5 4.98 Tanzania 170 24 30.03 3.60 Cameroon 652 45 13.19 3.87 Central. Afr. Rep 333 39 3.27 2.78 Chad 214 22 6.33 3.32 Equatorial Guinea 409 42 0.40 3.32 Algeria 1509 56 28.11 2.28 Libya 6366 85 5.41 4.61 Morocco 1229 52 26.52 1.68 Sudan 296 31 26.71 2.13 Tunisia 2014 62 9.0 1.68 Egypt 976 45 62.1 1.81 Botswana 2854 60 1.45 2.59 South Africa 3692 75 41.5 2.42 Benin 367 38 5.41 4.23 Burkina Faso 223 16 10.5 4.13 Cape Verde 1026 54 0.4 2.53 Cote d'ivoire 696 43.4 13.7 2.61 Gambia 360 29 1.11 2.62 Ghana 369 35.9 17.34 3.65 Mali 230 26.8 10.8 4.26 Niger 185 18.2 9.15 4.82 Senegal 537 44 8.31 3.44 Sierra Leone 213 33 4.2 3.18 Togo 273 31 4.1 3.82 Reference: IEA (2002), UNCHS (2005)
46

Table 3.1b GDP, %UP and total population (TP) growth ofvarious Asian countries
Country GDP capita-1 UP TP Average annual (USS) (%) (106
) growth of total 1995 1995 1995 population in %
(1995-2025)
China 575 30.2 1220.3 0.71 HongKong 22935 95 6.12 0.21 Macau 16938 98.8 0.43 0.98 Mongolia 400 60.8 2.5 2.15 Afghanistan 92 19.9 19.7 4.34 Bangladesh 307 18.3 118.23 1.74 India 393 26.8 929.0 1.44 Kazakhstan 1039 59.6 16.82 0.64 Kyrgyzstan 327 38.8 4.46 1.11 Pakistan 473 34.3 136.26 3.25 Tajikistan 113 32.2 5.83 2.24 Uzbekistan 448 41.1 22.76 2.01 Cambodia 253 20.4 10.03 2.32 Singapore 23876 100 3.33 0.89 Bahrain 9914 90.3 0.56 1.83 Israel 16778 90.7 5.52 1.48 Jordan 1584 71.4 5.37 4.05 Kuwait 15621 97 1.7 2.39 Qatar 15650 91.4 0.55 1.42 Saudi Arabia 6738 82.8 18.26 4.40 Reference: IEA (2002), UNCHS (2005)
47

Table 3.1c GDP, %UP and total population (TP) growth ofvarious European countries
Country GDP capita-1 UP TP Average annual (US$) (%) (106
) growth of total 1995 1995 1995 population in %
(1995-2025) Republic of Moldova 332 51.6 4.4 0.32 Poland 3299 63.7 38.6 0.12 Romania 1564 55.9 22.7 -0.24 Russian Federation 2281 75.9 148.5 -0.38 Denmark 34466 85.2 5.2 0.06 Iceland 25886 91.5 0.27 0.83 Sweden 28133 83.1 8.79 0.27 United Kingdom 19675 89.2 58.08 0.08 Albania 752 37.2 3.4 0.90 Spain 14685 76.5 39.63 -0.18 Republic of Macedonia 2275 59.9 2.16 0.60 Yugoslavia 1166 56.6 10.25 0.14 Belgium 27304 97 10.13 0.05 Germany 30104 86.5 81.6 -0.03 Luxembourg 44106 89.1 0.40 0.48 Netherlands 25769 89 15.5 0.14 France 25769 89 15.5 9.67 Reference: IEA (2002), UNCHS (2005)
48

Table 3.1d GDP, %UP and total population (TP) growth ofvarious American countries
Country GDP capita-1 UP TP Average annual (US$) (%) (106
) growth of total 1995 1995 1995 population in %
(1995-2025) Bermuda 33333 100 0.06 0.58 Canada 20170 76.7 29.40 0.79 United States America 28149 76.2 267.11 0.82 Bahamas 10962 86.5 0.28 1.34 Cayman Island 30120 100 0.03 2.80 Dominica 2739 69.3 0.71 0.52 Dominican Republic 1552 61.9 7.82 1.24 Haïti 325 31.8 7.12 2.52 Trinidad and Tobago 4230 71.7 1.3 1.05 Honduras 702 43.8 5.65 2.95 Mexico 3146 73.4 91.14 1.43 Brazil 4386 78.4 159.01 1.21 Ecuador 1574 58.9 11.5 1.84 Guyana 840 35.4 0.83 1.14 Suriname 1263 49.2 0.43 1.39 Reference: IEA (2002), UNCHS (2005)
49

Table 3.2 GDP, %UP, MSW and FW ofvarious countries around the world
Country GDP capita-l UP WSW FW (US$) (%) (kg capita-1day"l) (kg capita-1day"l) 1995 1995 1995 1995
Nepal 207 10.3 0.5 0.32 Bangladesh 307 18.3 0.49 0.32 Gambia, The 360 29 0.3 0.19 Benin 367 38.4 0.5 0.32 Ghana 369 35.9 0.4 0.26 India 393 26.8 0.46 0.35 Senegal 537 43.7 0.5 0.32 Bolivia 898 60.5 0.5 0.32 Egypt 976 44.6 0.5 0.32 Philippines 1084 54 0.52 0.25 Morocco 1229 51.9 0.6 0.39 Paraguay 1867 52.4 0.64 0.39 Thailand 2829 20 1.1 0.43 Poland 3299 63.7 0.95 0.40 Venezuela 3535 85.8 0.94 0.38 Hungary 4375 64.6 1.1 0.46 Korea, South 10863 81.3 1.59 0.44 United Kingdom 19675 89.2 1.95 0.55 Australia 19899 84.7 1.95 0.54 Canada 20170 76.7 1.85 0.51 United States 28149 76.2 2.78 0.75 Reference: IEA (2002), World Resources (1998-99), OECD (1995), Diaz et al (1986), Beed & Bloom (1995), Ward (1993), USEPA (1999), UNCHS (2005), Diaz et al (1993)
50

Table 3.3 Average annual growth rate ofGDP in %
Regions/countries year GDP capita- l
North America (except Mexico 2000-2030 1.3
but including Latin America)
Western Europe 2000-2030 1.8
Japan, Pacifie region 2000-2030 1.6
Eastern Europe 2000-2030 3.0
FormerUSSR 2000-2030 3.4
Latin America 2000-2030 2.1
South- East Asia 2000-2030 3.0
China 2000-2030 4.5
India sub continent 2000-2030 3.3
North Africa and Middle East 2000-2030 1.4
Sub- Sahara Africa 2000-2030 1.7
World 2000-2030 2.0
Reference: CEPII (2002)
51

Table 3.4 Computed GDP, TUP and %UP growth for several world countries
Continent/country GDP GDP TUP UP TUP UP (US$) (US$) (106
) (%) (106) (%)
2005 2025 2005 2005 2025 2025 Africa Egypt 1268 1675 40.4 54% 56.3 59% Morocco 1443 1905 17.7 56% 24.3 61% Sudan 398 525 12.1 36% 17.8 41% South Africa 4256 5962 37.6 73% 56.2 78% Nigeria 1003 1405 74.9 51% 133.5 56%
Asia China 1018 2455 697.3 53% 977.3 66% India 561 1074 473.9 44% 712.5 54% Nepal 275 527 9.1 33% 17.4 43% Vietnam 436 835 34.7 40% 54.8 50% Indonesia 1164 2229 124.3 55% 177.7 65%
Europe France 32680 46691 53.4 90% 56.3 93% ltaly 22952 32792 48.8 86% 46.4 90% Gennany 35716 51029 75.0 91% 76 94% England 24391 34849 50.7 87% 53.7 90% Russia 2837 5536 93.3 65% 94.2 72%
Americas Canada 24607 31860 29.1 91% 34.5 95% United States 34073 44116 275.3 96% 329.1 99% Mexico 4186 6344 72.9 69% 96.3 74% Argentina 8773 13294 30.7 78% 39.4 84% Brazil 5079 7697 127.6 71% 165.7 76% Chili 6355 9630 12 74% 15.5 79% Peru 2598 3938 17.4 63% 24.1 68%
52

Table 3.5 Computed UFW production for several world countries
Continent! UFW *PC UFW PC Country (106 x ton) MSW (106 x ton) MSW
2010 2010 2025 2025 Africa Egypt 5.32 52 6.8 50 Morocco 2.32 51 3.0 49 Sudan 1.6 57 2.0 56 South Africa 5.53 40 7.7 37 Nigeria 0.45 58 0.8 58
Asia China 90.93 52 120.4 47 India 62.2 55 84.2 53 Nepal 1.3 57 2 56 Vietnam 4.54 56 6.5 54 Indonesia 16.33 52 21.8 48
Europe France 13.3 20 16.0 18 ltaly 10.1 22 10.9 21 Germany 19.4 19 23 18 England 11.0 22 13.0 20 Russia 12 45 12.8 39
Americas Canada 6.4 22 8 21 United States 71.5 20 90.9 19 Mexico 10.4 41 13.3 37 Argentina 5.0 32 6.5 28 Brazil 18.7 39 23.7 35 Chili 1.8 36 2.3 32 Peru 2.4 46 3.1 43 *PCMSW = Percentage of country total municipal solid waste production
53

Table 3.6 Computed Cf4 production for several world countries
Continent! Cf4 Cf4 Average annual Country (106 x ton) (106 x ton) growth in %
2010 2025 (2010 - 2025) Africa Egypt 0.33 0.42 1.82 Morocco 0.14 0.18 1.90 Sudan 0.1 0.13 2.00 South Africa 0.34 0.47 0.90 Nigeria 0.03 0.05 0.13
Asia China 5.6 7.4 2.15 India 3.8 5.15 2.37 Nepal 0.08 0.12 3.33 Vietnam 0.28 0.40 2.85 Indonesia 1.00 1.33 2.2
Europe France 0.81 0.98 1.4 ltaly 0.61 0.67 0.65 Gennany 1.2 1.4 1.1 England 0.67 0.80 1.3 Russia 0.73 0.78 0.45
Americas Canada 0.40 0.49 1.5 United States 4.38 5.56 1.8 Mexico 0.64 0.81 1.7 Argentina 0.30 0.40 2.2 Brazil 1.14 1.45 1.80 Chili 0.11 0.15 2.42 Peru 0.15 0.20 2.22
54

90
80
70
iô60
!50 ~ 40 D. :::» 30
20 10
0 0
120
100
- 80 II) G) G) ~
'fi. 60 -D. :::» 40
20
0 0
120
• 100
- 80 II) G) G) ~
'fi. 60 -D. :::» 40
20
0 2000 4000 6000 8000 0 10000 20000
GDP (US$ 1995) GDP (US$ 1995) (a) (b)
120 •
100 • • - 80 II) G) G) ~
'fi. 60 -D. 40 :::»
20
0
20000 40000 60000 0 1 0000 20000 30000
GDP (US$ 1995) GDP (US$ 1995)
(c) (d)
Figure 3.1 lllustrating UP as a fonction ofGDP for each continent Ca) Africa (b) Asia (c) Europe (d) America
55
30000
40000

3.0
-... >. 2.5 «J
• "0
§ 2.0 Q. «J C,)
Q 1.5 :!.
i 1.0
05
~ 0.5
0.0 0 5000
10000 15000 20000
GDP (1995 US$) 25000 30000
Figure 3.2 FW & MSW ProdUCtion as a function of GDP
56

-
450 400
ê 350 S 300 c ~ 250 e 200 -~ 150 ;:,100
60
50 o
l.40 ~ 20 ;:,
0
Africa
Afriea
01995.2000
m12oo5 IIIJI 201 0
B2015~2020
132025
Europe Amerieas
Continent
Asia
Figure 3.3 Continental UFW production
W1995 .2000 m12oo5 l1li2010 g2015 m2020 e2025
Amerieas Asia Europe
Continent
Figure 3.4 Fraction of UFW in MSW for different continents
57

30 -c 25 o ~ 20 o :: 15
! 10 :1. 5 (.)
111995 112000 ~2005 ë12010 111!12015 &12020 1112025
O+--~
6
5
-4 ~ .... 3 ~ o 2
o
Africa Europe Americas Asia
Continent
Figure 3.5 Continental C~ emission from UFW if
untreated
Africa
.1995 r.1l2005 II1II2015 112025
Europe
.2000 ël2010 112020
Americas
Continent
Asia
Figure 3.6 Percentage of total global CI-4 production
fromUFW
58

6
5
-4 c .2 i 3 -D. :::» 2
1
0 Africa Asia
Il Urban 2005 ONS li!I Urban 2025 Scenaro one nID Urban 2025 ONS
Europe
Continent
Americas Global
Figure 3.7 Continental and global UP "do nothing scenario (DNS)" and scenario one
59

CONNECTING STATEMENT TO CHAPTER FOUR
On site composting, within cities ofUFW rather than sending UFW to landfills saves money and land and reduces environmental ramifications. Quantification and characterization of food waste (FW) produced in cities need to be evaluated for effective design and smooth operation of urban composting centers.
In this context, chapter four examines characteristic variations of Montreal FW as weIl as locally available bulking agents to obtain optimum compost recipes for an urban composting center in Montreal.
This chapter is drawn from a manuscript prepared for publication by the author of the thesis and co-authored by bis supervisor, Prof. Dr. Suzelle Barrington, Department of Bioresource Engineering, McGill University and Dr. Jose Martinez, Director ofResearch, CEMAGREF, France. The format has been changed to be consistent within this thesis.
60
CHAPTERFOUR
VARIATIONS IN CHARACTERISTIC OF FOOD WASTE
AND BULKING AGENTS
ABSTRACT
The characterization of food waste (FW) and locally available bulking agents (BA) is a prerequisite to optimizing compost recipe. For downtown Montreal, this study measured the variation in FW characteristics (pH, dry matter (DM), carbon (C), wet bulk density and Total Kjeldahl nitrogen (TKN» as produced by a restaurant and a community kitchen, from May to August 2004. The project also measured the mass ofFW produced by a restaurant and 20 to 48 households, from June to August 2004. Locally available bulking agents were characterized to formulate composting recipes for the summer season. The average residential and restaurant FW production from June to August, in downtown Montreal, was found to he 0.61 (+/-0.13) kg capita- l day-l and 0.56(+/-0.23) kg custome(l dail respectively. The pH, DM, C and TKN of FW collected from the restaurant and the community kitchen were found to vary from 3.84 to 4.55, 10.01% to 13.73%, 47.4% to 49.3% and 1.69% to 2.67%, respectively, over the summer months. The wet bulk density of the FW varied from 269kg m-3 to 552kg m-3
. These variations in FW characteristics were found to require the regular adjustment of the composting recipe to insure an efficient process and the planning of a composting facility with sufficient flexibility to handle the 50% variation in mass of FW produced.
The bulk density of chopped wheat straw (CWS), chopped hay (CH) and wood shaving (WS) varied from 16 kg m-3to 127 kg m-3
, 43 kg m-3 to 109kg m-3 and 84 kg m-3
to 211kg m-3, respectively, depending upon how much packing pressure was imposed.
Because of their high C content, neutraI pH and excellent water absorption capacity (WAC), CWS and CH were found to be suitable BA for FW composting whereas WS was found to be acid and the cardboard was found to have poor W AC. Wheat pellets (WP) and animal feed (AF) were found to demonstrate a lack of structural stability once wet.
61

4.1 Introduction
Finding landfill sites is a growing concem among most cities around the world. Besides the fact that on one wants a waste disposaI site in their back yard, landfills use up valuable arable land, because they must offer enough loose soil to daily coyer the garbage. Each million persons living in a North American city, produce 0.75 tons of garbage capita-1yr-I, requiring 14 ha yr-I oflandfill stacked to a height of 15m (Peavey et al 1985). Thus, a city like Montreal, with 3 million inhabitants, requires 840 ha of landfill site over a 20 year period.
Landfill sites are known to produce leachate that carries both organic and inorganic contaminants (Bou-Zeid & EI-Fadel 2004) posing a risk of groundwater contamination (Shin et al 2001). Therefore, landfill leachate must be pumped to the ground surface for treatment. Furthermore, the organic fraction of MSW produces greenhouse gases which must be collected and bumt, to reduce earth warming trend and to eliminate odor nuisances (Peavy et al 1985, Desjardins et Lépine 2002).
Faced with this problem of finding landfill sites, many Canadian cities have introduced recycling management infrastructures. Nova Scotia is the Canadian Province that has reached the highest level of municipal solid waste (MSW) diversion; in 1998, this province banned organic waste from landfill sites, by organizing curbside collection. By 2000, this province was recycling 50% of its MSW (Da Costa et al 2004) while other cities in Canada were following the same trend (City of Toronto 2004, Govemment of Nova Scotia 2004, Eden 2003). In Quebec, a 50% MSW recycling policy was adopted by the govemment in 1989, but ten years later, only 10.8% of the MSW stream was being diverted from landfill sites (Environment Quebec 2003). Thus, a new goal of 60% was set to be achieved between 1998 and 2008. Still in 2001, the Communauté Métropolitaine de Montreal (CMM - the Island of Montreal, the North and South shores, Longueuil and Laval) was only recycling 17% ofits MSW, with only 7% diversion of the organic wastes (Da Costa et al 2004). In 1991, the City of Montréal estimated that sorne 24% to 27% of the domestic and commercial MSW were made up of putrescible material, respectively (Ville de Montreal, 1991). In a study conducted at the Macdonald Campus of McGill University, the residential food waste (FW) production was found to range from 0.5 to 0.7 kg person-1 day"I (Morin et al 2003).
62

The implementation of an appropriate waste management treatment system for the City of Montréal requires first of aIl the characterization of its FW and its rate of production (Green & Kramer 1979, Metin et al 2003, Abu Qdais et al 1997, Diaz et al 1993). For composting, the FW must be characterized for moisture content (MC), pH and CIN ratio (Pace et al 1995, Zucconi et al 1986, Bilitewski et al 1994).
FW has been previously characterized (Table 4.1). For downtown Montreal, Morin et al (2003) have conducted a preliminary investigation to find that the FW produced by grocery stores and restaurants kitchens, including a community kitchen, is quite different from that produced by a university residence. The FW collected from a university residence contained more bread and pasta, as weIl as paper napkins, which increased the DM and C content, compared to the commercial waste mostly made up of fruits and vegetable waste. In Asia, the FW from a university restaurant was found to be quite different from that of the Canadian University residence (Yun et al 2005). Also, kitchen and household FW collected in South Korea and Taiwan was found to have a MC ranging between 9% and 35%, and a CIN ratio between 10 and 15 (Table 4.1). The characteristics of FW can therefore vary enough from one location to the next, to require a different composting recipe.
The characteristics of different types of FW and of bulking agents (BA) are presented in Table 4.2. Lettuce, onion, tomato and cabbage FW offer a higher N content, compared to potato tops, whole carrot, pepper and bread. The CIN ratio and MC of BA also vary depending on the material used. Wood chips generally offer a very high CIN ratio, and a MC which depends on the degree of drying; the C is mainly composed of lignin and is rather hard to degrade biologically. Wheat straw and hay are reported to offer a lower CIN ratio and a C source that is easier to degrade biologicaIly.
The objective of this chapter was to monitor the quantity and properties of FW produced by a restaurant of the Metropolitan area of Montreal, Canada, from May to August 2004. This monitoring also measured the variation in production rate and properties during the summer. AIso, the project characterized some of the locally available BA.
63

4.2 Materials and Methods
4.2.1 FW quantification
On Tuesday, Thursday and Saturday of every week, from May to August 2004, FW
was delivered 10 a compost center by participating households dwelling the Park Avenue
area of the city of Montreal. Some 20, 28 and 41 households participated in June, July
and August respectively, and these households had an average family size of2.5 persons.
The FW brought by each household was weighed and recorded.
From June to August of 2004, a downtown Montreal restaurant collaborated in
measuring its daily production of FW collected from the kitchen and from the tables. AlI
FW was collected into 100L garbage containers and weighed at the end of every day.
4.2.2 Monitoring the variation in FW production and properties
From mid May to the end of August 2004, FW was collected, sampled and
characterized on a weekly basis to observe its variation during the summer months. The
FW was produced from a downtown restaurant and a community kitchen that collectively
brought their entire FW to the Eco-Quartier composting centre. The FW from both of
these businesses was mixed together before sampling, using a tray measuring lm in
diameter and 0.5m in depth. Every collection day, three samples were taken for
laboratory analysis, their weight being large enough to represent aIl types of FW waste
collected. The samples thus obtained were homogenized using an electrical grinder and
then refrigerated at 5°C until analyzed within one week of collection. The large samples
were manually mixed once again before taking duplicate sub samples for various
characterization tests.
The characterized BA were those available locally: chopped hay (CH), chopped wheat
straw (CWS), wood shaving (WS), rough cardboard (RCB) without a glossy finish, medium
rough cardboard (MRCB) with a medium glossy finish, smooth cardboard (SCB) with a
glossy finish, wheat pellets (WP) and animal feed (AF). Cardboard was tested as possible
bulking agent because of its wide use as packaging material and its massive recovery as
recycling material. Hay, strawand wood shavings were also characterized because these are
commonly used BA for composting (Alburquerque et al 2005, Barrington et al 2002). The
hay and wheat straw had been chopped to a length of lOto 50 mm while the size of the pine
wood shavings ranged between 5 and 40 mm. The animal feed was made up of chopped hay
64
and silages, chopped to a length of 5 mm to 15 mm. and supplemented with grains and minerais. These materials were obtained from the Cattle Research Complex of the Macdonald Campus of McGill University in Montréal. Provided by local grocery stores, the 2 mm to 3mm thick cardboard (RCB, MRCB and SCB) was cut into 20 mm to 30 mm wide strips hefore usage. The wheat pellets had a particle size distribution ranging between 5 mm and 10 mm.
The FW and BA were characterized for pH, dry matter (DM), carbon (C), nitrogen (TKN), water absorption capacity (W AC) and C/N ratio. Nitrates and nitrites were not analyzed as they represent a very limited fraction of the total nitrogen contained in both fresh FW and bulking agents.
4.2.3 Analytical procedures
Dry matter was detennine by drying at 103 oC for 24h in an oven (Scientific John by Sheldon Manufacturing Inc., Cornelius, Oregon, USA) and expressed as:
DM (%) = (oven dry sample weight/wet sample weight)* 100 (1) The volatile or organic matter portion of these dried samples was determined by
burning at 5500 C in a muffie Fumace (Blue M Electric Company, Blue Island, USA) for 4 hours and expressed as (Raug 1980):
C (%) = (100 - % ash)/ 1.83 (2) The TKN (total Kjeldahl nitrogen) was determined by digesting (BACH Digesdahl
Digestion Apparatus, USA) the samples with sulfuric acid and 50% hydrogen peroxide at 500 Oc for 15 minutes and measuring the resulting NH3-N content at a pH of 12, using a NH3 sensitive electrode (APRA, 1995). Nitrates and nitrites were not quantified as they represent only a very small portion of the total nitrogen content ofFW.
The pH was determined using a pHIlon meter (Orion 450, Boston, USA) and a pH probe. For 24h, a sample of material was soaked in just enough distilled water to he able to produce a solution in which the probe could be placed (APRA, 1995). For the FW waste, lOg of sample was soaked in 20ml of water, while for the dry bulking agents, 50ml of water was needed to soaked 5g of sample.
4.2.4 Determination ofwet bulk densities
Affecting the size of the composting facility and maturation center, the wet bulk density of FW was determined immediately after collection, by weighing the mass
65

required to fill a 27 L pail. Varying with compression, the bulk density of BA like straw,
hay and wood shavings, was determined using four levels of pressures: loose or without
pressure; medium manually compressed and manually compressed obtained by imposing
a 0.3 kPa and 0.6kPa pressure to samples contained in a tray measuring 1 m in inside
diameter and O.5m in depth, and; machine compressed corresponding to the density of the
material obtained as packaged by the supplier.
4.2.5 Water absorption capacity (WAC) of the BA
The main function of the BA is to provide sufficient dry matter to give a porous
structure to the compost mixture and to absorb the moi sture produced by the
decomposing FW. The water or moi sture absorption capacity (W AC) of a BA is therefore
an important parameter in the formulation of compost recipes. Soaking the materials in
distilled water for 24h, draining off the gravitational water during another 24h under
coyer to limit evaporation, and then drying at 103 oC for 24h to detennine the final
moi sture content determined WAC values. The WAC (%) was computed as:
WAC (%) = [(kg soaked sample - kg sample before soaking)/kg sample taken]* 100 (3)
4.3 Statistical analysis
Each FW and BA parameter characterized was averaged from six analyses, where
triplicate samples were analyzed twice. The standard deviation of the value is reported
along with the average using Excel (Microsoft 2003). ANOV A (SAS software, SAS
Institute, 1990) was used to compare the FW characteristics between months of
production, using a 95% confidence level. AlI correlation equations and coefficients
were obtained using Excel (Microsoft 2003).
4.4 Results and Discussions
4.4.1 FW quantification
The participating households produced, on the average and from June to August
2004, 0.6 (+/- 0.12) kg of FW capita-l day"l (Figure 4.1). Although there were no
significant differences in FW production between months, the average FW production in
June was sIightly lower than that of JuIy and August. This variation is likely due to the
availability of lower priced fresh fruits and vegetables in July and August. This amount
faIIs within the range of 0.5 to 0.7 kg of FW capita-l day"l measured by Morin et al
(2003). On an annual basis, one person wouId therefore produce 220 kg ofFW and a city
66

like Montreal, with 3 million habitants, would therefore produce 660 thousand tons of FW.
At the restaurant, sorne 0.55kg of FW customer-l dafl was produced from June to August (Figure 4.2). Although the variation in FW production between months is not significant, the number of clients served per month varied greatly, as only 1910 persons were served in June, compared to 2720 and 2360 persons served in July and August. This 42% and 24% increases -in customers in July and August, as compared to June, is likely due to the tourist industry. Thus, in June, the restaurant produced 1.05 tons ofFW while in July and August, it produced 1.5 tons and 1.3 tons, respectively. Such variation in FW production has an important impact on the capacity and flexibility of a composting center that must be designed to handle the low and high seasonal production rates. 4.4.2 Variation in FW characteristics
The monthly variation in FW characteristics for that collected from the restaurant and the community kitchen are presented in Figures 4.3a to f The monthly variations were found to be significant, especially when comparing May to June, July and August, likely because of the availability of fresh lower priced fruits and vegetables.
The C on a dry weight basis (dwb) was found to vary from May to August 2004 (Figure 4.3a). The mean monthly C of 49.3% (+/-0.77%) in May was higher than that of June, July and August at 47.4% (+/-3.05%), 47.8% (+/-0.93%) and 47.9% (+/-0.32%), respectively. The TKN (dwb) of 1.7% (+/-0.11%) in May increased to 2.0% (+/-0.30%), 2.6% (+/-0.46%) and 2.7% (+/-0.79%) in June, July and August, respectively (Figure 4.3b). Thus, the CIN ratio was found to decrease from 29.1 in May to 23.1, 18.4 and 17.9 in June, July and August, respectively (Figure 4.3c). The CIN ratio ofFW in the summer (June to August) is balanced enough to be composted without any correction from the bulking agent, while that of May is slightly high compared to that recommended of 20 to 25 for the effective composting of FW (Diaz et al 1993). This implies that FW composting recipes must be adjusted with seasons.
Similarly, the FW pH of 4.6 (+/-0.25) and were found to be the highest and to drop in June, July and August (Figures 4.3d and 4.3e). The FW pH of June, July and August of 4.1 (+/-0.16), 3.84 (+/-0.19) and 3.95 (+/-0.10), respectively, was found to be significantly lower than that of May. The low pH of the FW waste requîres the use of a BA, which has a
67

buffering capacity and a more neutral pH of6.5 to 7.5. Such range provides a better growth
environment for bacteria (Diaz et al 1993).
A significant drop in FW DM was observed between May and the other months of
June, July and August. While the FW produced in May had a DM of 13.7% (+/-2.47%), that
produced in June, July and August had a DM which dropped to 12.2% (+/-2.05%), 10.0%
(+/-1.01%) and 10.3% (+/-0.83%), respectively.
The wet bulk density of the FW was found to increase significantly in June to
August, as compared to May (Figure 4.30. In May, the wet bulk density was 269 kgm-3
(+/-84) while it increased to 410 kg m-3 (+/-92), 510 kg m-3 (+/-72) and 552 kg m-3 (+/-
80), in June, July and August, respectively.
The variation in FW characteristics from May to August resulted likely from the lower
priced fresh vegetables and fruits available in the summer, despite the fact that such foods
are available all year round. At the beginning of summer, FW was observed to be made up
mostly of remains of root vegetables such as potato and carrot peels, of cabbage and of
fruits such as apple and citrus fruit peels. As of the end of June, FW was made up of
residues from fresh vegetables like tomatoes, lettuce, cabbage, onions, and of fruits such as
pineapple, melons, peaches and citrus fruits. By mid summer, the FW contained a higher
percentage of TKN and moisture. Along with the fact that restaurants produce more FW in
the summer months, their higher MC implies the use of more BA of excellent W AC.
Furthermore, these changes in FW properties with seasons impose additional volume
flexibility on urban composting systems.
4.4.3 BA characterization
The properties of the BA were found to vary among type (Figures 4. 4a to O. In terms
of pH, that of wheat pellets (WP) was the highest at 7.5 (+/-0.44), while that of aIl
cardboards (SCB, MRCB, RCB) ranged between 7.2 and 7.7 (+/-0.44); that of chopped
wheat strawand chopped bay was 7.0 (+/-0.55) and 6.6 (+/-0.46), respectively, and; that
ofleft over animal feed (AF) and wood shavings (WS) was lowest at 5.9 (+/-0.11) and
5.6 (+/-0.25), respectively (Figure 4.4a). Using the AF or WS along with the acid FW
would definitely require sorne limestone to correct the pH of the compost mixture.
Otherwise, sorne problems can be encountered in reaching thermophilic temperature
ranges.
68

The AF demonstrated the highest TKN value of3.01% (+/-0.63%), followed by that
ofWP and CH at 1.40% (+/-0.43%) and 0.89 (+/-0.12%), respectively~ and that ofCWS
at 0.50% (+/-0.08%); that of the cardboards RCB, MR.CB and SCB at 0.37% (+/-
0.033%), 0.28% (+/-0.011%), 0.22% (+/-0.01%), and~ that of WS at 0.08% (+/-0.02%)
(Figure 4.4b). Thus, the AF, CH and WP offered the highest nitrogen content as a bulking
agent, while the cardboard, the straw and wood shavings offered the least.
The carbon content of the WS, CH and CWS was above 50%, or 54.18% (+/-
0.51%), 51.65% (+/-0.56%) and 50.38% (+/-0.95%), respectively, while that of the
cardboard (SCB, RCB, MRCB) was 48.42% (+/-0.016%), 48.04% (+/-0.206%), 45.40%
(+/-0.16%), and~ that of the AF and WP was 44.83% (+/-0.096%) and 42.66% (+/-
0.409%) respectively (Figure 4.4c). The lower organic matter content or higher mineraI
content of AF and WP was reflected by their higher TKN content. Despite these
variations, the variability in C biodegradability must also be considered. Although it was
not analyzed in the project, it is weIl known that all wood products (WS and cardboard)
have a high lignin content, implying that such BA take sorne time to decompose and
become non recognizable during composting (Diaz et al 1993).
Highest DM values were exhibited by SCB, RCB, MRCB at 95.8% (+/-0.07%),
95.5% (+/-0.12%) and 95.3% (+/-0.18%), respectively, while WP, AF, CH, CWS were
moderately dry BA at 92.7% (+/-0.085%), 90.6% (+/-0.70%), 90.8% (+/-1.44) and 88.9%
(+/-1.26%), respectively and WS was a relatively wet BA at 78.7% (+/-5.26%) (Figure
4.4d). Except for the WS, aIl bulking agents had a MC below 85%, which shOuld enable
them to better absorb FW moisture.
The highest WAC was obtained with the WP and CWS at 613% and 543%, followed
by that of WS, CH and AF at 401%, 366% and 397%, respectively, and that of the
cardboard (RCB, MRCB and SCB) at 355%, 329%, and 208% respectively (Figure 4.4e).
There was no correlation found between bulking agent DM and W AC, likely because of
the different composition of each type of materials. Dnly that of WP, CWS and WS
showed a high correlation ofR2 = 0.99, between DM and WAC, because of similar crop
origin, compared to the cardboard and WS being made mostly of wood products treated
to a different degree.
69

Starting with the highest one, the C/N ratios of AF, WP and CH were 15,32 and 58, while that ofCWS was 101, that if the cardboards (SCB, MRCB, RCB) was 223, 160 and 131, respectively. The CIN ratio of WS was lowest at 677 (Figure 4.4f). Only the AF offered a ON ratio below 25, implying that this bulking agent would not require the addition of nitrogen to obtain a compost mixture CIN ratio between 20 and 25. The WP and CH offered a CIN ratio between 30 and 60, implying a slight correction in the CIN ratio of the compost recipe. The CIN ratio of the wheat straw, cardboard and wood shavings was extremely high, implying the necessary correction of the compost mixture CIN ratio.
The loose, medium manually compressed, manually compressed and machine compressed bulk densities of CWS were 16kg m-3
, 38kg m-3, 68kg m-3 and 127kg m-3
,
respectively (Figure 4.5). For CH, loose, medium manually compressed and manually compressed bulk densities were found 43kg m-3
, 75kg m-3, 109kg m-3 and 169kg m-3
,
respectively (Figure 4.5). The loose, medium manually compressed, manually compressed and machine compressed bulk densities ofWS were found 84kg m-3
, 116kg m-3
, 151kg m-3 and 211kg m-3, respectively. For the range of pressures tested, a linear
relationship was observed between compressive pressure and wet bulk density for CWS, CH and WS, respectively:
WBDcws (g m-3) = 90 * P (kPa) + 15.5 R2 = 0.99 (4)
WBDcH (g m-3) = 100 * P (kPa) + 46.8
WBDws (g m-3) = 101 * P (kPa) + 87.8
R2 =0.99
R2 =0.99
(5)
(6) Among aIl BA characterized, CWS were found to be the best demonstrating
excellent WAC, a neutral pH and a moderately high CIN ratio. As BA, AF and WS exhibited a low pH, which can lead to fermentation problems when composted with already acid FW. WP was disqualified along with AF, as both BA demonstrated a lack of structural stability once wet. AlI cardboards were found to have a lower WAC, along with a well-known high lignin content, thus limiting their ability to absorb FW leachate and to provide readily available C to balance the composting recipe. 4.4.4 Changes in compost recipe over the summer nwnths
The compost recipes required to process the FW produced by the restaurant over the course of the summer (May to August) were computed using either CWS, CH or WS as
70

BA (Tables 4.3 a, b and c). The recipes were computed for an initial CIN ratio of21 and a DM of 25%. The CIN ratio was corrected by adding ~N03, as this chemica1 has relatively no impact on the pH of the mixture, as compared to urea (Barrington et al 2002). The quantities ofCWS, CH and WS were computed in terms of volume to size the composting facility.
The volume of the mixture to compost and the quantity of BA required is observed to vary greatly from June to August. Using CWS for example, in June the restaurant FW would require 160kg of BA as compared to 330kg in July~ the volume ofFW and BA to compost would measure 3.9 m3
, as compared to 6.0 m3 in July, and; sorne 10 kg and 15 kg of ~N03 would be required for each respective month. If CH was used, approximately the same mass of BA would be required, but the monthly volume to compost would decrease to 3.1 m3 and 5.0 m3
, respectively, for June and July, along with the mass of~N03 required which would drop to 8 kg and 12 kg.
Thus, FW production rate and characteristics as weIl as the BA selected to complete the compost mixture do have an influence on compost recipe. For an efficient process, the FW and selected BA should be regularly characterized. 4.5 Conclusion
This project measured the quantity of FW produced by downtown Montreal households and a restaurant. Also, the FW produced by a restaurant along with that of a community kitchen was characterized on a monthly basis. The quantity, MC and TKN were found to significantly increase from May to August whereas the CIN ratio was found to decrease. Thus, the composting of this FW would require the monthly adjustment of the compost recipe and the design of a composting facility able to accommodate a volume of material fluctuating by as much as 50%.
As BA, CWS and CH were found to offer the best properties, with a high W AC of over 500%, a neutral pH and a moderately high CIN ratio of more or less 50. Wood shavings and AF were found to be acid while WP and AF were found to demonstrate a lack of structural stability after absorbing moisture. AlI cardboards were found to have a lower WAC, thus limiting their ability to absorb the leachate released by the FW during composting.
71

4.6 References Abu Qdais, H. A, Hamoda, M. F., & Newham, J. (1997): Analysis of residential solid
waste at generation sites. Waste Management & Research (1997) 15,395- 406. Alburquerque, J.A, Gonzalvez, J., Garcia, D., & Cegarra, J. (2005): Effects of bulking
agent on the composting of" alperujo", the solid by-product of the two-phase centrifugation method for olive oil extraction. Process Biochemistry xxx (2005) xxx-xxx, accepted 7 June 2005.
APHA, WPCF, AWWA (1995:. Standard analysis for water and waste water. American Public Health Association, American Waster Works Association and Water Pollution Control Federation, washington, De.
Barrington, S., Choiniere, D., Trigui, M., & Knight, W. (2002): Compost airflow resistance. Biosystems Engineering (2002) 81 (4),433-441.
Bilitewski, B., Hardtle, G., & Marek, K (1994). Waste Management, pp. 204. Weissbach, A,& Boeddicker, H. (eds. & translators). Title of the German edition: AbfalIwirtschaft. Eine Einfuhrung. Springer - Verlag Berlin Heidelberg.
Bou-Zeid, M., EI-Fadel, M. (2004): Parametric sensitivity analysis of leachate transport simulations at landfiIIs. Waste Management 24 (2004) 681-689.
Chang, J.I., Tsai, J.J., & Wu, KR. (2005): Thermophilic composting of food waste. Bioresource Technology xxx (2005) xxx-xxx, accepted 10 February 2005.
City of Toronto (2004): Composting A_Z index. City of Toronto, Toronto, Ontario. Da Costa, E., Gewerts, M., Hanley, K, Kulhanek, S., & McKelar, K (2004). Creating a
composting infrastructure for the city of Montreal. Sierra Club of Canada, Quebec Group. McGilI University School of the Environment, McGiII University, Montreal, Canada.
Desjardins, J.P., & Lépine, J.F. (2002) : Guide d'information et de sensibilisation sur les matières résiduelles. Montreal, Les Ami-e-s de la Terre de Montréal, Montreal, Canada.
Diaz, L. F., Savage, G. M., Eggerth, L. L., & Golueke, C. G. (1993): Composting and Recycling Municipal Solid Waste, pp. 33, 127, 130, 180. Lewis Publishers. Printed in the United States of America.
72

Eden, S. (2003): Public participation in envirionmental policy: Considering scientific, counter-scientific and non-scientific contributions. Public understanding of Science. 5(3). 183-204
Environment Quebec (2003): Politique québécoise sur la gestion des matières résiduelles, 1998-208: La gestion des matières résiduelles dans la région de Montréal. Ministère de l'Environnement du Québec, Québec, Canada ..
Gotaas (1956). In: Diaz, L. F., Savage, G. M., Eggerth, L. L. and Golueke, C. G., (1993). Composting and Recycling Municipal Solid Waste, pp. 181. Lewis Publishers. Printed in the United States of America.
Government of Nova Scotia (2003): Status report 2003 solid waste-resource management. Govemment of Nova Scotia, Ministry of Environment and Labour, Halifax, Canada.
Green, 1. H. & Kramer, A. (1979): Food processing waste management, pp. 1-14, 82, 330. The A VI Publishing company, !Ne. Westport, Connecticut. Printed in the United States of America.
Haug, R. T. (1980). Composting Engineering, Principles and Practices, pp. 347. Ann Arbor Science Publishers, Inc., USA.
Kwon, S.H., & Lee, D.H. (2004): Evaluation of Korean food waste composting with fedbatch operations 1: using water extractable total organic carbon contents (TOCW). Process Biochemistry 39 (2004) 1183-1194.
Liang, Y., Leonard, 1. J., Feddes, J. J. R., & McGill, W.B. (1999): Nitrogen dynamics in composting. In: Warman, P. R. & Taylor, B. R (eds). Proceedings of the international composting symposium, Volume 1. 19-23 September, pp. 357. HalifaxlDartmouth, Nova Scotia, Canada
Martinez, 1. M. A. & Otten, L. (1999): Co-composting of municipal solid waste, manures, and sugar cane waste using a static pile system. In: Warman, P. R. and Taylor, B. R (eds). Proceedings of the international composting symposium, Volume 1. 19 - 23 September, pp. 71. HalifaxlDartmouth, Nova Scotia, Canada.
McGuckin, RL., Eiteman, M.A., & Das, K. (1999): Pressure drop through raw food waste compost containing synthetic bulking agents. J. Agric. Engng Res. (1999) 72, 375-384.
73

Metin. E., Eroztur, A., & Neyim, C. (2003): Solid waste management practices and review of recovery and recycling operations in Turkey. Waste Management 23 (2003) 425-432.
Morin, S., Lemay, S., & Barrington, S. F. (2003): An urban composting system. Paper No 03-612. Written for presentation at the CSAE/SCGR 2003 meeting, July 6-9. Montreal, Quebec.
Pace, M. G., Miller, B. E. & Farrell- Poe, K. 1. (1995): The composting process. Utah State University Extension, October 1995.
Peavy, HS., Rove, D.R., & Tchobanoglous, G. (1985). Environmental engineering. McGraw Hill Publishing Company, New York, USA
SAS Institute. 1999. SAS for Windows. Version 8.02. SAS Inst., Cary, NC. Seo, J.Y., Heo, 1.S., Kim, T.H., Joo, W.H., & Crohn, D.M. (2004): Effect ofvenniculite addition
on compost produced from Korean food wastes. Waste Management 24 (2004) 981-987. Shin, H.S., Han, S.K., Song, Y.C., & Lee, C.Y. (2001): Perfonnance of UASB reactor treating
leachate from acidogenic fermenter in the two-phase anaerobic digestion of food waste. PlI: S0043-1354 (01) 00041-0.
Ville de Montreal (1991). In: Kauser, S., Barrington, S. and Elektorowick, M. Compartments for the Management of Municipal Solid Waste. Soil and sediment contamination. 9 (5) : 503-522 (2000).
Yun, Y.S., Par.k, 1. lK., & Park, J.M. (2005): High-rate slurry-phase decomposition of food wastes: indirect perfonnance estimation from dissolved oxygen. Process Biochemistry 40 (2005) 1301-1306.
Zucconi, F., & Bertoldi, M.de. (1986). Compost specifications for the production and characterization of compost from municipal solid waste in compost: production, quality and use. In: Bertoldi, M. De, Ferranti, M. P., L'Hennite, P. & Zucconi, F. (eds). Proceedings of a symposium organized by the commission of the European communities, Directorate General Science, Research and Development, 17-19 April 1986. Udine Italy.
74

Table 4.1 FW characteristics of different countries
Country FW pH DM TN C C/N ratio Reference
producer % (%dwb) (%dwb)
Canada Restaurant 3.8-5.2 7-16 5.4-10.7 46-50 4.3-9.2 Morin et al (2003)
Canada Grocery 4-5 9-15 2.4-16.7 47-50 2.8-20.5 Morin et al (2003)
Canada University 4.6 18 2.2 50 22.8 Morin et al (2003)
residence
South University 19.7-20 0.09-6.9 48.4-53.95 7 Yun et al (2005);
Korea Restaurant Kwon & Lee (2004)
South Household 5-5.4 9.2-32.59 3.13-4.4 48.63-45.9 10.4-15.5 Seo et al (2004)
Korea
Taiwan Kitchen 20-35 3-4 50-52 15 Chang et al (2005)
Note: dwb - dry weight basis ; TN - TKN plus nitrate and nitrite-N, where nitrate and nitrites are generally found in quantities relatively low with respect to TKN.
Table 4.2 Characteristic ofvarious organic materials and bulking agents Materials pH %DM %TN(dwb) %C (dwb) C/N ratio Reference
Lettuce 3.8 4.13 42.5 10.3 McGuckin et al (1999)
Onion 8.9 3.76 43.3 11.5 McGuckin et al (1999)
Potatotops 1.5 37.5 25 Gotaas (1956)
Whole carrot 1.6 43.2 27 Gotaas (1956)
Tomato 3.3 39.6 12 Gotaas (I956)
Cabbage 3.6 43.2 12 Gotaas (1956)
Pepper 2.6 39 15 Gotaas (1956)
Bread 2.1 Gotaas (1956)
Wood chips 0.08 52.24 653 Martinez et al (1999)
Wheat straw 0.46 42.32 92 Liang et al (1999)
Wheat straw 6.3 86.9 0.98 49.8 50.8 Barrington et al (2002)
Hay 5.2 87.2 1.1 51.1 46.5 Barrington et al (2002)
Note: dwb, dry weight basis
75

Table 4.3a CWS required for the composting ofFW produced by a restaurant in downtown, Montreal, for an initial CIN ratio of 21 and a DM of 25% Months FW CWS NHtN03
kg m3 kg m3 m3 m3 m3 Machine kg
o pressure 0.3kPa 0.6kPa compressed
June 981(121) 2.4 187(168) 12 5 3 1.5 10(10)
July 1494(150) 3.0 336(300) 21 9 5 3 15(12)
August 1316(135) 2.4 292(260) 18 8 4.3 2.3 13(13)
Note: Numbers in parentheses, dry weight basis
Table 4.3b CH required for the composting ofFW produced by a restaurant in downtown, Montreal, for an initiaI CIN ratio of21 and aDM of25%
Months FW CH NJ4N03
kg m3 kg m3
m3 m3 m3 Machine kg
o pressure O.3kPa 0.6kPa compressed
June 981(121) 2.4 181(166) 4 2.5 1.7 8(8)
July 1494(150) 3.0 327(298) 7.6 4.4 3 12(12)
August 1316(135) 2.4 285(259) 6.6 3.8 2.6 10(10)
Note: Numbers in parentheses, dry weight basis
Table 4.3c WS required for the composting ofFW produced by a restaurant in downtown, Montreal, for an initiaI CIN ratio of21 and a DM of25% Months FW WS NJ4N0 3
kg m] kg m3 m3 m] m3 Machine kg
o pressure O.3kPa 0.6kPa compressed
June 981(121) 2.4 214(172) 2.5 2 1.4 11(12)
July 1494(150) 3.0 383(307) 4.6 3.3 2.5 1.8 19(19)
August 1316(135) 2.4 333(266) 4 3 2.2 1.6 17(17)
Note: Numbers in parentheses, dry weight basis
76

--":'» ca
"CI
i 3 œ ~ -~
1
0.8
0.6
0.4
0.2
0
June July
Months
August
Figure 4.1 Monthly residential FW generation for downtown Montreal
--":'» 1 -! ":' 0.8
E~ 0.6
~ 0.4 u œ 0.2 ~
~ 0 June July
Months
I>.ugust
Figure 4.2 A'Jerage monthly variation of FW production from one restaurant in downtown Montreal
77

60 ~ 40 0' 20
o May June Jury August
35 30
o 25 i 20 ~ 15 o 10
5 o
20
~ 15
1 i' 10 Q 5
o
Month (a)
May June July August
Month (c)
1 1 • 1 i i j
May June July August
Month
(e)
4
~ ~l-+------.--. --...-.-1 I~I ,
6
5 4
Zao 3 2
o
May June July August
Month (b)
May June July August
Month (d)
c? ~ 1000 j i 50°0 _ Ili III 1 1 ! ~~~~~--~I~~
May June July August
Month (t)
Figure 4.3 Average monthly variations ofcharacteristics of Montreal FW (a) %C (b) %TKN (c) CIN ratio (d) pH (e) %DM (f) density
78

10 4 4 8
iEl ~ ® 3 6 ~ 3 ',' :z: ::: -2 CL 4 ',' ~ 2 ','
::: ',' 1 2 '" :.: ::: 1 j~ i '" ',' 0 '" ',' 0
~ :r: ~ aJ aJ aJ ~
I.L
~ :r: ~ aJ aJ aJ ~
I.L 0 0 0 0 « 0 0 0 0 « ~ ~ CI) ~ ~ CI)
~ ~ Bulking agents Bulking agents
(a) (b)
120 60 100 50 ~ r ~ .::: - 80 40
1
TI ;1.
f - - 60 ~ 30 i ::E t (J 20
1 " ;:; C 40 . :. ~ .. 10 1 ~~ ~ 20 f 0 L '" :-: 0 l
~ :r: ~ aJ aJ aJ ~ I.L
~ :r: ~ aJ aJ aJ ~ I.L 0 0 0 0 « 0 0 0 0 « 0 ~ ~ CI)
ü ~ ~ CI) ::?! ~ Bulking agents Bulking agents
(d) (e)
_ 700-;1.
800 ~ 600 ~j~ 700 'ü
!. 500
1
600 CIIJ u 400 0 500 c :;:::
! 300 r;::: I! 400 0
~ 300 IIJ '" .a 200 '" CIIJ
200 ... ~ ~~ S 100 100 ~ :::
0 0 ," ;:;
~ ~ :r: aJ aJ aJ ~ I.L ~ :r: ~ aJ aJ aJ ~
I.L 0 Ü Ü 0 « ü ü ü ü «
~ ~ CI) 0 ~ ~ CI) ~ ~
Bulking agents Bulking agents
(e) (f)
Figure 4,4 Characteristic variations ofbulking agents (a) pH (b) %TKN (c) %C (d) %DM (e) Water absorption capacity (f) CIN ratio
79
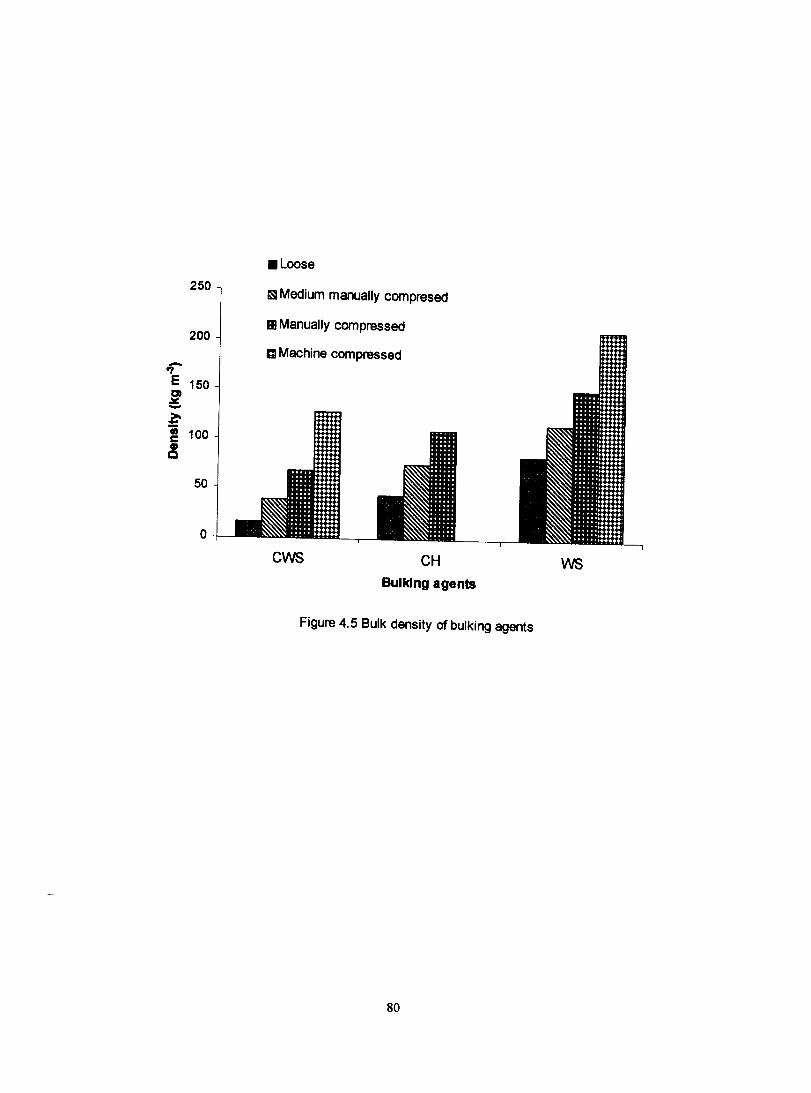
250
200
-'? E 150 0)
~ ~ .. 100 c ~
50
o
• Loose
!SI Medium manually compresed
HI Manually compressed
G Machine compressed
cws CH
Bulklng agents
Figure 4.5 Bulk density of bulking agents
80
ws

CONNECTING STATEMENT TO CBAPTER FIVE
After characterization of FW and bulking agents, various compost recipes were prepared and tested to obtain the best one. Chapter five explains the experimentation and test results of various compost recipes.
This chapter is drawn from a manuscript prepared for publication by the author of the thesis and co-authored by rus supervisor, Prof Dr. Suzelle Barrington, Department of Bioresource Engineering, McGill University and Dr. Jose Martinez, Director ofResearch, CEMAGREF, France. The format bas been changed to be consistent within this thesis.
81

ABSTRACT
CHAPTER FIVE
TESTING BULKING AGENTS FOR URBAN FOOD WASTE COMPOSTING
Different mixtures of Montreal FW and locally available bulking agents were tested. Each mixture was tested in replication. Chopped wheat straw (CWS), chopped hay (CH) and wood shaving (WS) were used as bulking agents. Six identical urban prototype invessel composters with passive aeration system were used. Daily temperature and pH were considered as indictors of level of microbial activities. These indicators were used to compare the performance of each tested recipe.
Keeping initial C/N ratios between 20 to 25, compost recipes were tested with different dry matter (DM) and mix ratios of FW and bulking agents. The ~N03 was used as an additive to balance the initial C/N ratio of the mixture. The recommended recipes for composting of Montreal FW were 8.9:1 (FW:CWS), 8.6:1 (FW:CH) and 7.8:1 (FW:WS) in wet weight basis. The initial mass ofthese mixtures was reduced greatly and composts obtained were found suitable for agriculture use.
82
5.1 Introduction
Composting of urban food waste (UFW) reduces the pressure on municipal solid waste (MSW) management systems and minimizes the environmental ramifications arising from the landfilling of UFW. Composting is a natural process (Barrington et al 2002a) that reduces the volume and mass of solid organic wastes by transforming this waste into a safe soil amendment (Pace et al 1995, Biddestone & Gray 1985, Picci et al 1978, Haug 1980, Cassarino, 1986).
The City of Montreal has encouraged the recycling of components of MSW by instituting in severa! localities, environmental awareness groups called Éco-Quartiers. Among other activities, these groups have been encouraging citizens to compost their food waste (FW). Unless willing to practice vermiculture, those living in apartment buildings do not have the space to compost their FW using conventional household composters, as placed on apartment balconies, these drip and create a problem for those living below. Éco-Quartier Jeanne-Mance/West End has undertaken to build a community composting center in the Jeanne Mance Park, to accommodate those willing to compost, but without the space to do so. To operate such a community compost center at least cost, Éco-Quartier Jeanne ManceIWest End must acquire the proper bulking agents, and use them in adequate quantities.
In a composting recipe, the main contribution of a bulking agent is to correct the moi sture of the FW which is often too wet, and which produces further moisture as it decomposes; to act as a pH buffer because of the organic acids initially produced during the composting process; to provide proper aeration by giving the mixture a stable structure and porosity, and; to add sorne carbon to adjust the C/N ratio within a value of 20 to 25 (Pace et al., 1995, Zucconi et al 1986).
The initial moi sture level of a FW and bulking agent mixture should range between 40 and 85% (Zucconi et al 1986, Pace et al 1995, Morin et al 2003). According to Haug (1980), vegetable trimmings were composted by McGauhey and Gotaas by using up to 85% moi sture with straw and up to 76% with paper. Fibrous or bulky material such as straw or wood chips can absorb relatively large quantities of water and still maintain their structural integrity and porosity (Haug 1980).
83

A CIN ratio of 15 to 30 is suggested for an active aerobic metabolism (Haug 1993). A CIN ratio below 20 produces excess ammonia and unpleasant odors while a CIN ratio above 40 does not provide enough N for microbial growth and a fast composting process.
Temperature is considered as a good indicator of the biological activity and composting process. A short mesophilic (25°C to 40°C) followed by a 2 to 3 day thermophilic (over 40°C) temperature regime is sougbt (pace et al 1995) for proper stabilization without excessive carbon losses. A higb temperature of 55°C -60°C, lasting beyond 5 to 6 weeks, indicates an abnormally prolonged decomposition and a delayed transition to the stabilization stage (Zucconi et al 1986). Sufficient aeration is required to control the temperature and to reduce the amount of putrefactive odors released from the waste during its treatment (Barrington et al 2002b). Three different techniques are suggested for composting natural, passive and active (Fernandes et al 1994). Passive aeration system is considered simple and cost effective for UFW composting compared to active aeration system (Sartaj et al 1997, Haug 1993).
A neutral to sligbtly alkaline pH range is suggested for optimum microbial activity during composting (Bidlingmaier et al 1985). The pH of organic substrates ranges widely between 3 and Il (Zucconi et al 1986). The pH is expected to drop at the beginning of composting process, as a result of acid-forming bacteria initializing the process by breaking down complex carbonaceous materials. Later, proteins are broken down and ammonia is liberated producing I-t ions and increasing the pH (Zucconi et al 1986, Bilitewski et al 1994). The preferred pH for composting ranges between 6.5 and 8.0 (pace et al 1995).
Bulking agents are expensive composting materials for urban communities as they must be purchased and transported from outside the city. It is therefore imperative, in most composting centers, to properly select and use bulking agents. The main objective of this project was to test different bulking agents for the composting of FW. Three common bulking agents were mixed at three ditIerent ratios with FW collected in downtown Montreal. These mixtures were composted using prototype composters and the temperature regime, which developed thereafter, was used to evaluate the effectiveness of the mixture in stabilizing the waste. Temperature regime during the
84

composting process is an excellent indicator of the bacterial activity essential to the composting process (Barrington et al 1998).
5.2 Materials and methods
5.1.1 experimentai installations
Trial tests of compost recipes were conducted by using six urban prototype composters, similar to horizontal in-vessel systems. These prototype composters were built ofnoninsulated corrugated plastic tubing, lm in length and 0.3 min inside diameter (Figure 5.1). A horizontal perforated pipe with openings of O. 5cm diameter at the spacing of 1.5cm was inserted at the bottom of each composter to provide an inlet for air through passive aeration, while the etlluent air was allowed to exit from the top end of the composter (Figure 5.1). Each composter was filled to two third capacities with the mixture of FW and bulking agent.
5.1.1 Compost recipes
From the characterization of the FW and bulking agents ( chapter four) as presented in Tables 5.1 and 5.2, compost recipes were computed. For each bulking agent selected, for different mixtures were formulated to offer a different moisture level (Table 5.3, 5.4 & 5.5). Each compost mixture was formulated by weighing separately the FW and bulking agent, mixing the two manually in a tray and then before loading the composters. Ammonium nitrate <N"H4N03) was added as required by the recipes to balance the CIN ratio between 20 and 25. For the CWS bulking agent, 40%, 35%, 30%, 25% and 20% were tested as initial compost mixture dry matter (DM) (recipe numbers 1,2,3,4, and 5, respectively, Table 5.3). For the chopped hay (CH) and wood shaving (WS) bulking agents, 40%, 30% and 20% were tested as initial compost mixture DM (recipe numbers 1,2, and 3, respectively, Table 5.4 and 5.5).
5.1.3 Parameters monitored
In this experiment temperature and pH were considered as composting indicators for the testing of UFW recipes. For all recipes tested, the temperature was measured daily using a l.Om stem compost PTC-Thermometer (model 8500D-II). On altemate days, five 5g compost samples were randomly collected from each composter for pH determination. The collected samples were soaked for 24h, in sufficient distilled water to produce enough liquid to use a pH probe. Generally, the compost samples were mixed with water
85
using a mass ratio of 1:5. The test compost mixtures were started one after the other and in duplicates~ this explains why they were not matured over the same time. The leachate production during the process was not analyzed.
When the compost temperature started receding, the composters were emptied to store the compost in vertical plastic bins of size 36cm diameter and 30cm deep rested on wooden blocks with leachate drainage provision from the bottom (Figure 5.2) by allowing natural aeration system for maturation. After 90, 65 and 56 days for FW:CWS, FW:CH and FW:WS respectively, the final mass of the compost was measured and sampled for moi sture (MC), organic matter (OMC) and Total Kjeldahl Nitrogen (TKN) content determination (Zucconi & De Bertoldi 1987).
5.3 Results and discussions
5.3.1 Effect of compost dry matter (DM)
For the compost mixtures using CWS, Figures 5.3a and b illustrate the temperature fluctuations obtained as compared to the ambient air temperature. The compost mixtures with a DM equal to and over 30% (FWIBA ratios of 2:1, 2.5:1 and 3.4:1) did not produced thermophilic temperatures as opposed to those with a DM of 20% and 25% which were observed to reach the thermophilic range (50°C) after three days of loading the composters. In figure 5.3b, temperature dropped sharply on fifth day of composting process likely due to the drop of ambient temperature which is as lowas 15 oC.
For the compost mixtures using CH as a bulking agent, thermophilic temperatures were reached after three days ofloading, only for the 20% DM mixture (ratio ofFW and CH 8.6:1, wet weight basis) (Figure 5.4). The highest tempe rature reached by the other mixtures was 35°C. For the WS, none of the mixtures reached the thermophilic range. Rather, the highest temperature reached was 35°C (Figure 5.5).
For both the chopped wheat straw (CWS) and hay (CH), a DM of 20% was preferred to that equal to and over 30%. For the wood shavings (WS), a dry matter as low as 20% did not even produce thermophilic temperatures.
5.3.2 The effect of pH
The pH of the mixtures of FW and CWS were found to be slightly acidic at the beginning of the composting process, indicating the production of organic acids (Zucconi et al 1986, Bilitewski et alI994). After three days of composting, the pH increased above
86

7 (Figure 5.6). The pH of the 20% DM mixture went alkaline only after day 7, as compared to the other mixtures where the pH became alkaline as off day 3. This likely result from the greater percentage ofFW, producing organic acids during the initial phase of de composition.
Using CH as bulking agent (BA), the pH of ail mixtures was also found to be slightly acidic at the beginning of the composting process and to increase to a value between 7.0 and 7.6 after three days of loading (Figure 5.7). Again, the time required to observe an increase in pH was related to the amount of BA, likely because higher levels of FW produce more initial organic acids. With WS, the initial pH was quite low, likely because WS exhibit a low pH, and this pH increased to reach over 7, only for the 20% DM (FWIBA ratio of 7.811) mixture (Figure 5.8). Among other factors, the low pH experienced with the WS mixtures may explain why thennophilic temperatures were never reached.
5.3.3 Mass reduction of the compost mixtures The best compost recipe corresponded 10 the FW and CWS mixture at 20% DM
(FW/CWS ratio of 8.9:1, wwb). The fully decomposed texture ofthis compost material obtained after 90 d of maturation. The 25% DM mixture (FW /CWS ratio of 5: l, wwb) can also be considered, however screening of the final product is recommended because ail the materials were not fully decomposed even after 90 d of maturation. Therefore, screening of the final product is essential to rem ove uncomposted material composed mainly of chopped wheat straw, and to recycle this material as bulking agents.
The texture of the compost obtained after 65d of maturation with the FW and CH mixtures at DM levels of 40% and 30% (FW/CH ratios of 1.8:1 and 3.3:1, wwb) were not fully decomposed whereas a good composted material was obtained with the 20% (FW/CH ratio 8.6:1, wwb) DM mixture.
The texture of the compost obtained after 56d of maturation with FW and WS mixtures of 40%,30% and 20% DM (FW/WS ratios of 1.5:1,2.9:1 and 7.8:1, wwb) were found that none of the mixtures decomposed properly, however mixture with 20% DM was found better than the rest. Along with the fact that thennophilic temperatures were not reached in the composters, likely due to acidic nature of the BA (Table 5.2).
87

Therefore, the chopped wheat straw and hay did produce compost material, which was fully decomposed after two to three, months of maturation. The texture of the wood shaving mixtures was less desirable because of their limited decomposition, a property generally associated with high lignin materials.
The mass reduction of the mixtures during composting and maturation is summarized in Table 5.6, for CWS, CH and WS, respectively. For CWS, the mass reduction of the 40%, 30%, 25%, and 20% DM mixture were found 62%, 70%, 77% and 86% respectively after 90 days (Table 5.6). Most of this reduction resulted from the loss ofwater, as the final MC was 35%, compared to 75% for the original mixture.
The mass reduction for the CH mixtures is reported in Table 5.6. After 65 days, the mass reduction was found to be proportional to the original MC of the mixture, with the 20% DM loosing the most mass, followed by that with 30% and then 40% DM. Again, water losses account for most of the mass reduction.
The mass reduction for the WS mixtures was as high as that of the other mixtures, again because of water losses. Nevertheless, the WS mixtures were the wettest, after 56d of maturation of mixtures, because of the low temperatures developed during the initial composting stage. The CWS and CH compost mixtures were also found to offer an OM content exceeding 40%, a TKN level exceeding 2.5%, and a phosphorous and potassium level exceeding 0.25% and 3.0%, respectively, on a dry matter basis (Table 5.7). The parameters were found to respect the range required for agricultural use.
In terms of value for agricultural purposes, the 25% and 20% DM mixtures for CWS and CH, respectively, were those experiencing the MOst mass reduction and reaching a MC of 40% or less, after two months of maturation.
During the course of the composting process, it was observed that the ventilation of the composting material and the leachate collection are important issues. When using drum composters, the material should be turned for 30 minutes, at least once every day for uniform mixing.
88

5.4 Conclusion
The best compost recipes obtained from the trial tests were 8.9:1 (wet weight basis)
ofFW & CWS and 8.6:1 (wet weight basis) ofFW & CH. The compost obtained from
these mixtures was found suitable for agriculture use. The initial mass was reduced
greatly. However, the tested mixtures of FW & WS were not fully composted and at the
same time temperature could not reach at thermophilic range. Among the tested three
mixtures of FW & WS the mixture of 7.8:1 was found better. Therefore, the
recommended recipes for composting of Montreal FW were 8.9:1 (FW:CWS), 8.6:1
(FW:CH) and 7.8:1 (FW:WS) in wet weight basis. The provision of leachate collection
and aeration system must be insured to achieve the desired level of composting process.
89

5.5 References
Barrington, S., Choiniere, D., Trigui, M., & Knight, W. (2002a): Effect of carbon source
on compost nitrogen and carbon losses. Bioresource Technology 83(2002) 189-
194.
Barrington, S., Choiniere, D., Trigui, M., & Knight, W. (2002b): Compost airflow
resistance. Biosystems Engineering (2002) 81 (4),433-441.
Biddestone & Gray (1985): Ash in composting of source separated catering waste. In:
Koivula, N., Raikkonen, T., Urpilaine, S., Ranta, J., & Hanninen, K. Bio-resource
technology 93 (2004) 291-299.
Bidlingmaier, B., et al (1985): Waste Management, pp. 202-209. In: Bilitewski, B.,
Hardtle, G., & Marek, K. 1994. Translated and edited by Weissbach, A. and
Boeddicker, H. Springer-Verlag Berlin Heidelberg 1997. Printed in Germany.
Cassarino, C. J. (1986): An integrated component ofrecycling centers that process solid
waste in compost: production, quality and use. In: Bertoldi, M. De, Ferranti, M.
P., L'Hermite, P. & Zucconi, F. (eds): Municipal organic solid waste composting.
proceedings of a symposium organized by the commission of the European
communities, Directorate General Science, Research and Development, 17-19
April 1986. Udine Italy.
Fernandes et al (1994). In: Barrington, S., Choiniere,D., Trigui, M., & Knight, W. (2002).
Compost convective airflow under passive aeration. Article in press, Bioresource
Technology (accepted 26 June 2002).
Haug, R.T. (1993). The practical handbook of compost engineering, pp. 248. Lewis
Publishers. A CRC press company.
Haug, R.T. (1980). Compost engineering. Principles and practice, pp. 1,89, 185,274-
275,347. ANN ARBOR SCIENCE PUBLISHERS, INe. 230 Collingwood, P.O.
Box 1425, Ann Arbor, Michigan 48106.
Pace, M.G., Miller, B. E & Farrell- Poe, K. L. (1995). The composting process. Utah
state University Extension, October 1995.
Picci at el (1978) in Ferrari, G. (1986): Oxygen, water and temperature in the
decomposition process of an organic substance during composting in compost:
production, quality and use. In: Bertoldi, M. De, Ferranti, M.P., L'Hermite, P. &
90

Zucconi, F. (eds). Proceedings of a symposium organized by the commission of
the European communities, Directorate General Science, Research and
Development, 17-19 April 1986.Udine Italy.
Sartaj et al (1997). In: Barrington, S., Choiniere,D., Trigui, M., & Knight, W. (2002).
Compost convective airflow under passive aeration. Article in press, Bioresource
Technology (accepted 26 June 2002).
Zucconi, F., & Bertoldi, M. de. (1986): Compost specifications for the production and
characterization of compost from municipal solid waste in compost: production,
quality and use. In: Bertoldi, M. De, Ferranti, M. P., L'Hermite, P. & Zucconi, F.
(eds). Proceedings of a symposium organized by the commission of the European
communities, Directorate General Science, Research and Development, held in
Udine Italy, 17-19 April 1986.
Zucconi & De Bertoldi (1987): Biowaste composting kinetics at Almagro domestic solid
waste management facilities. In: Martinez, A de L., Pastor, 1. A, Camacho, J. V.
& Vivo, J. J. P. (2002). In: Almorza, D., Brebbia, C. A, Sales, D. and Popov, V.
(eds), Waste Management and the Environment. First international conference on
waste management and the environment. Waste Management 2002. WIT PRESS
Southampton, Boston.
91

Table 5.1 Monthly variations ofFW characteristics Months pH %DM %C %TKN C/N ratio Wet bulk density (kgm-~) May 4.55(0.25) 13.73(2.47) 49.25(0.77) 1.69(0.11) 29.3(2.2) 269(84) June 4.1(0.16) 12.22(2.04) 47.35(3.05) 1.98(0.3) 24.4(3) 410(92) July 3.84(0.19) 10.01(1.01) 47.77(0.93) 2.6(0.46) 19(3.8) 510(72) August 3.95(0.1) 10.25(0.83) 47.9(0.32) 2.67(0.79 19.1(4.8) 552(80)
Note: Numbers in parenthesis, standard deviation
Table 5.2 Characteristics ofbulking agents Parameters CWS CH WS pH 6.96 (0.55) 6.61(0.46) 5.62(0.25) %DM 88.86(1.26) 90.78(1.44) 79.84(0.18) %C 50.38(0.95) 51.65(0.56) 54.48(0.02) %TKN 0.5(0.08) 0.89(0.12) 0.08(0.01) C/Nratio 103(15.8) 59(8.5) 676(10.9) Wet bulk density (kg m-3
)
Loose (no compression) 16 43 84 Medium manually compressed (imposing O.3kPa 38 75 116 pressure)
Manually compressed (imposing 0.6kPa pressure) 68 109 151 Machine compressed (obtained as packaged by the 127 211 supplier)
Note: Numbers in parenthesis, standard deviation
92

Table 5.3 Trial recipes ofFW & chopped wheat straw (CWS) Recipe FW:CWS FW:CWS NlitN03 ~O3 CIN DM NumberWW DW %WW %DW % 1 2:1 1.8 20.2 40 2 2.5:1 1:3.1 1.432 4.1 20.9 35 3 3.4:1 1:2.4 1.15 3.8 20.9 30 4 5:1 1:1.5 0.873 3.5 20.9 25 5 8.9:1 1.2:1 0.592 3.0 20.9 20 Note: WW - wet weight; DW - dry weight
Table 5.4 Trial recipes ofFW & chopped hay (CH) Recipe FW:CWS FW:CWS ~O3 ~O3 CIN DM NumberWW DW %WW %DW % 1 1.8: 1 1:4.31 0.70 1.7 21.14 40 2 3.3:1 1:2.23 0.49 1.6 21.21 30 3 8.6:1 1.12:1 0.29 1.4 21.18 20 Note: WW - wet weight; DW - dry weight.
Table 5.5 Trial recipes ofFW & wood shaving (WS) Recipe FW:CWS FW:CWS ~O3 NlitN03 CIN DM NumberWW DW %WW %DW % 1 1.5:1 1:4.48 2.3 5.7 21.02 40 2 2.9:1 1:2.32 1.5 5.0 21.36 30 3 7.8:1 1.14: 1 0.74 3.7 21.36 20 Note: WW - wet weight; DW - dry weight
93

Table 5.6 Mass reduction (wet weight basis) oftest recipes ofvarious bulking agents
FW:CWS 2:1 3.4:1 5:1 8.9:1
%MR(90d) 62 70 77 86
FW:CH 1.8:1 3.3:1 8.6:1
%MR(65d) 57 69 84
Note: Numbers in parenthesis, maturity of compost in days
FW:WS 1.5:1 2.9:1 7.8:1
%MR(56d) 26 40 71
Table 5.7 Comparison ofvarious parameters of composted test recipes for agricultural value as suggested by Zucconi & De Bertoldi (1987)
Measured values
Parameters Suggested FW:CWS (90d) FW:CH(65d) FW:WS (56d)
5:1 8.9:1 8.6:1 7.8:1
%MC <40 35 54 40 66
%OM(dw) >25 39 42 40 51
%TKN(dw) >0.6 3.72 3.04 2.6 0.95
%P(dw) >0.22 0.29 0.24 0.41 0.25
%K(dw) >0.25 3.09 3.16 3.07 2.9
Note: dw, dry weight; 90d, 56d and 56d maturity of compost in days
94

1'" lm
Waste in
Filled up 2/3rd of total capacity
Fresh air_---I~ ~---------t-----.f-erfu-ra-œd--p-iP-e--------j----_-_-_-_-_-_-~ Leachate collection
Figure 5.1 Invessel horizontal composter designed for trial test of compost recipes
Wooden block
r- 36cm ~
T 30cm
~
Figure 5.2 Vertical plastic bin, used to store composted test recipes for maturation
95
Compost out

60
fi 50
i 40
~ 30 !. 20 e ~ 10
~ 8.9:1 (Ratio of FW:ONS, ww b)
__._2:1(Ratio of FW:ONS, wwb)
O+----,--~----~--~--~--~----~---,---.
8 9 10 11 12 13 14 15 16
Day (July 2004)
(a)
~ 5:1 (Ratio of FW:CWS, ww b)
___ 3.4:1 (Ratio of FW:ONS, ww b)
........-- 2.5:1 (Ratio of FW:ONS, ww b) 60 ___ AntJient terrperature
Ô50 0 -e 40
~ 30 8. 20 e ~ 10
0 23 24 25 26 27 28 29 30 31 1 2
Day (July-August 2004)
(b)
Figure 5.3 Daily ambient temperature and comparison of daily temperature measured inside compost pile ofvarious mixtures ofFW:CWS (a) 8.9:1, 2:1 (b) 5:1, 3.4:1,2.5:1
96

--+-1.8:1 (Ratio of FW:CH, wwb) --3.3:1 (Ratio of FW:CH, ww b)
_60 --.-.8.6:1 (Ratio of FW:CH, wwb)
~50 ~A_'_. -~--~----2 3 4 5 7 8 9 10 11
Day (August 2004)
Figure 5.4 Daily ambiant tamperature and comparison of daily temperature measured inside compost pile of
wrious mixtures of FW:CH
--+-1.5:1 (Ratio of FW:WS, ww b) ___ 2.9:1 (Ratio of FW:WS, wwb)
--.-.7.8:1 (Ratio of FW:WS, wwb)
11 12 13 14 15 16 17 18 19 20 23
Da Y (August 2004)
Figure 5.5 Daily ambiant tamperature and comparison of daily tamperature maasured inside compost pile of wrious
mixtures of FW:WS
97

10 8
::c 6 a. 4
2 o
1
.2:1 (FW:ONS wwb)
.2.5:1 (FW:ëV\IS, wwb) P.:I3.4: HI'W;CV\IS, ww b) 1:115:1 (FW:CV\IS wwb) a8.9:1 (FW:ëWS, wwb)
2 3
Day
5 7
Figure 5.6 pH of various mixtures of FW and CWS during composting process
10 8
::c 6
111.8: 1 (FW:0i, w w b) .3.3:1 (FW:0i, ww b) ~ 8.6:1 (FW:0i, ww b)
Q. 4
::c
2 0
1 2 3 5 7
Day
Figure 5.7 pH of various mixtures of FW and CH during composting process
10
8
6
.1.5:1 (FW:WS. wwb)
.2.9:1 (FW:WS, wwb) li2 7.8:1 (FW:WS, ww b)
Q. 4
2
o 1 2 3 5
Day
7
Figure 5.8 pH of various mixtures of FW and WS during composting process
98

CHAPTERSIX
GENERAL CONCLUSION
The predicted future trends in growmg urbanization, economic activities and
changing consumption pattern (will) create tremendous pressure on MSW management
systems by producing remarkable amounts of FW in big cities around the world. FW not
properly managed may have affects both human hea1th and environment and disposaI of
FW may use limited land resources. Therefore, management of MSW is a great concern
for the modem world.
The GDP of a country has a strong influence on growth of urban population and
UFW production. Countries having higher GDP produce higher amounts of UFW as a
fraction of MSW stream with higher percentage of UP. The growth of world UP in last
30 years was rapid and this trend will continue in developing economy in upcoming
decades. The farm gate price of agriculture produce has not gone up in the last 30 years
as compared to other goods and services this makes rural economies poorer. Therefore,
people from rural areas make their way to cities with the expectation of higher income
and better life. If this "do nothing scenario" continues in upcoming decades most of the
world cities will face tremendous pressure in their MSW management systems both
financially and environmentally. To reduce the pressure on urban waste management
system~ following solutions are suggested.
Cl) Making rural economies more attractive and creating favorable living
environment in the rural areas so that there will he no further movement of people from
rural to urban areas and
(2) On site aerobic or anaerobic digestion, within the cities, of UFW rather than
disposed in landfills.
Composting of UFW is considered one of the best options of on site aerobic
digestion. That reduces the load on MSW management systems in developed economies
about 20% to 35% and over 50% in developing economy.
However, there are many challenges in building and operating composting facilities
in highly urbanized centers like availability of space and bulking agents also odors and
leachate require special attention. Therefore, factors affecting composting processes such
99

as moisture, temperature, pH and initial CIN ratio of compost recipe need to be controlled
in order to accelerate the process with minimal odor emission and less leachate
production. Hence, quantification, characterization of Montreal FW and bulking agents
was evaluated for the summer months 2004 and various compost recipes were tested to
obtain the best. The quantity and characteristics of Montreal FW were found to vary from
one month to another, therefore, compost recipes need to be adjusted regularly for
smooth functioning of on site urban composting facilities.
Further in-depth research is needed on urban food waste composting to address the
issues like: (1) quantity and composition of food waste in the cities of developed and
developing economies (2) testing of compost recipes by mixing food waste with more
than one bulking agents (3) quantification of leachate produced during composting
process and its potentiality to produce methane from leachate as an alternate source of
energy (4) study of potentiality of leachate to use as a liquid fertilizer for crop production
(5) study of gaseous emissions like carbon dioxide and ammonia during composting
process (6) study of biofilter to treat gaseous emissions during composting process (7)
study of mass reduction and quality of stabilized compost and (8) technical and financial
evaluation of different aeration systems like passive and active aeration systems during
composting process.
100