zero- zero ---waste composting: waste composting: how food
TRANSCRIPT
i
ZeroZeroZeroZero----Waste Composting: Waste Composting: Waste Composting: Waste Composting: How Food Waste Can Help Conquer How Food Waste Can Help Conquer How Food Waste Can Help Conquer How Food Waste Can Help Conquer
Climate Change and Prevent DiseaseClimate Change and Prevent DiseaseClimate Change and Prevent DiseaseClimate Change and Prevent Disease
© 2013 Eureka Recycling
Executive Summary &Executive Summary &Executive Summary &Executive Summary & FullFullFullFull ReportReportReportReport
May 2013May 2013May 2013May 2013
ii
Executive Summary
Introduction On May 9, 2013, global atmospheric concentrations of carbon dioxide (CO
2) reached 400 parts
per million (ppm). This rise in CO2 levels in the atmosphere—which has been accelerating faster
than ever—is one of the main causes of global warming. Leading scientists say that 350 ppm is the safe upper limit for carbon dioxide in our atmosphere. In Minnesota in 2011 we buried in landfills or burned in incinerators over three million tons of municipal solid waste. This is the trash that residents, small businesses, and institutions generate every day. When trash is burned, incinerators emit carbon dioxide and nitrous oxide, a greenhouse gas 310 times more powerful in atmospheric warming than carbon dioxide. On average in the U.S., incinerators emit more carbon dioxide per megawatt-hour than coal fired, natural-gas fired, or oil- fired power plants (Hartwell 2007). But incinerators aren't the only disposal method contributing to global warming. When food scraps and paper products break down in a landfill, they become powerful contributors to greenhouse gas emissions, too. They decompose anaerobically (without oxygen) in a landfill, producing methane which has 23-71 times greater heat trapping capabilities than carbon dioxide, making landfills the single largest direct human source of methane (Platt 2008). 350 ppm of carbon dioxide is where we need to return to as soon as possible so that we do not threaten the natural balance that makes life on Earth possible. In this report we are making the connection between advancing zero waste and reducing this threat. Back on the ground and in our air, pollution from many sources including landfills and incinerators, which emit particulates, toxins, and carcinogens, continue to cause diseases which results in suffering for those directly affected and in costs for everyone. In 2009, the Minnesota Pollution Control Agency reported unhealthy air quality from emission for 217 out of 365 days.
Additionally, cities face the challenge of poor soils and soils contaminated with heavy metals while residents are ever more interested in growing and buying local foods. Hazardous amounts of lead have been documented in the backyards and communities of such major cities as New York, Baltimore, Boston, Chicago, Los Angeles, Philadelphia, Minneapolis, and others, where residents are making efforts to grow food. Prevention and composting, instead of wasting, gets us closer to the things we all really want and need—healthy food, abundant resources, clean air and water, safe and reliable products, and healthy families and communities. The extent of these benefits varies greatly based whether or not
we prevent wasted food and how we choose to compost our food waste. This report, perhaps the first of its kind, looks at the whole picture: at how prevention—both preventing food from being wasted in kitchens and preventing collection through on-site backyard composting—along with collection, processing, and end-use applications impact a community economically, environmentally, and socially. To fully understand the potential impacts of these strategies, Eureka Recycling, along with several partners, created a framework for comparative analysis of the economic savings and costs, and the environmental and social benefits of each of the choices we make in designing programs to prevent and compost food wastes. We
iii
call this approach zero-waste composting. By using this zero-waste framework, a community, business, or advocacy group can determine the combination of cost, social, and environmental benefits that best meets their community’s needs. Source-separated organics (SSO) refers to food waste and nonrecyclable papers that have been separated from the trash. Composting infrastructure for residential SSO in Minnesota and many other communities around the country is developing and is currently at a crossroads, similar to recycling twenty years ago. While many technologies exist for handling food waste, none have been evaluated from a zero-waste perspective. Zero-waste composting requires that we prevent first, and then find or build an appropriate amount of collection and processing (composting) capacity to handle the SSO. Zero-waste composting adds value to the community through the social benefits like those of neighbors connecting, the economic benefits of saving money on groceries and disposal, and the environmental benefits of avoided pollution and the creation of the end product: soil.
What is Zero-Waste Composting? Zero-waste composting considers the highest and best use for the people, material and energy at each step in the process. It requires that we make efforts to eat the food we buy, compost as close to the source as possible, and see that the end result of our compost has the highest benefit for the environment and the community by preserving and creating soil, a rapidly depleting resource that our lives depend on. Zero-waste composting begins with prevention. Prevention is first; it is not an afterthought or an add-on. Food itself is a valuable resource grown in precious topsoil and purchased to nourish ourselves and our families, never with the intention of throwing it away uneaten. Yet in the midst of our busy lives, most refrigerator cleanings turn up at least one slimy apple or container of “mystery leftovers.” The disappointment we feel upon this discovery (especially when it is first noticed by smell) is exactly where zero-waste composting begins. Through engaging education and practical tools that help us shop smarter and store and prepare food better, more of the food in our kitchens can nourish people as we intended. Next, zero-waste composting challenges us to compost unavoidable food scraps, creating soil that can be used to grow more healthy food, for which there is increasing demand. By keeping these nutrient-rich food scraps as close as possible to the communities that produce them, they can continue to nourish people as soil amendment for backyards, community gardens, and local farms. Lastly, after avoiding food waste and doing whatever on-site composting is possible, we must collect the remaining material. These food scraps, along with nonrecyclable papers (such as paper towels), need to be collected as effectively and with as little environmental impact as possible. Zero-waste composting is about healthy soil. This soil, which we incorrectly and yet lovingly often refer to as dirt, is meant for growing food and healthy communities. Overall, zero-waste composting is responsive to and benefits the community. Everyone’s interest in composting starts from a different place –one of the benefits of a triple bottom line approach is its ability to address these interests. For some people, it may be about saving money on groceries, supporting a vibrant community garden, or connecting with their neighbors. For others, it might be most important to make rich soil to use in their yards and gardens, or to create simple habits
iv
that will have a big impact on creating a safer, healthier world for their families. For others still, it is a combination of some or all of these. To address the diverse goals contained within a community, zero-waste composting programs and services are best built as a result of collaborative efforts that include all of the players. This is how composting is started, supported and embraced by communities for the long term.
About Eureka Recycling Eureka Recycling is the only organization in Minnesota that specializes in zero waste. Our mission commits the organization and its people to demonstrating that waste is completely preventable. The organization's services, programs, and policy work present solutions to the social, environmental, and health problems caused by wasting. A 501(c)(3) nonprofit organization, based in the Twin Cities of Saint Paul and Minneapolis, Eureka Recycling's mission is realized by any person or group that chooses to prevent waste. Eureka Recycling strives to provide opportunities for everyone to experience waste-prevention firsthand. Locally we are well-known as the largest nonprofit recycling operation because Eureka Recycling has provided curbside and apartment recycling services for over a decade, and our trucks are seen on the streets every workday. However, we are also a part of the communities we serve because of our education, prevention programs, and zero-waste advocacy. Eureka Recycling’s programs successfully demonstrate a sustainable business model by proving that it is absolutely possible to simultaneously create environmental benefits, living-wage jobs, and a wide variety of community partnerships—all while keeping our finances “in the black” and reinvesting millions of dollars in profit-sharing back into the communities we serve. We use a traditional business model to fund our recycling services through traditional business loans and earned income—having never taken grants or other funds for our recycling services that were not available to any for-profit or nonprofit entity. These programs generate almost $10 million annually, which almost entirely goes back into the programs, services, and communities. Since 2001, Eureka Recycling has shared over $5.5 million in revenue from the sale of recyclable materials with communities. We use the proceeds from our recycling business, as well as the grants and donations we have been honored to receive, to spread the word about the benefits of preventing waste through our current programs, education, and advocacy efforts. We also use these resources to create new programs and education that move us all closer to zero waste—such as this body of work on zero-waste composting. By creating demonstrations of zero waste, we learn lessons, inform ourselves, and then share with others about what we know. Many times, we have shared our work in Saint Paul in efforts to support zero-waste efforts beyond. For example, Eureka Recycling was the first in the Twin Cities metro area to offer a revenue share, starting with the City of Saint Paul. Others have since followed Eureka Recycling’s model and now it is commonplace in the metro area for cities to receive revenue as a standard part of their recycling collection and processing contracts. Eureka Recycling’s studies on multifamily and public space recycling, based in Saint Paul, have been used nationally. It is in this spirit that we share this report about how Saint Paul can implement zero-waste composting so that Saint Paul and other communities can benefit.
v
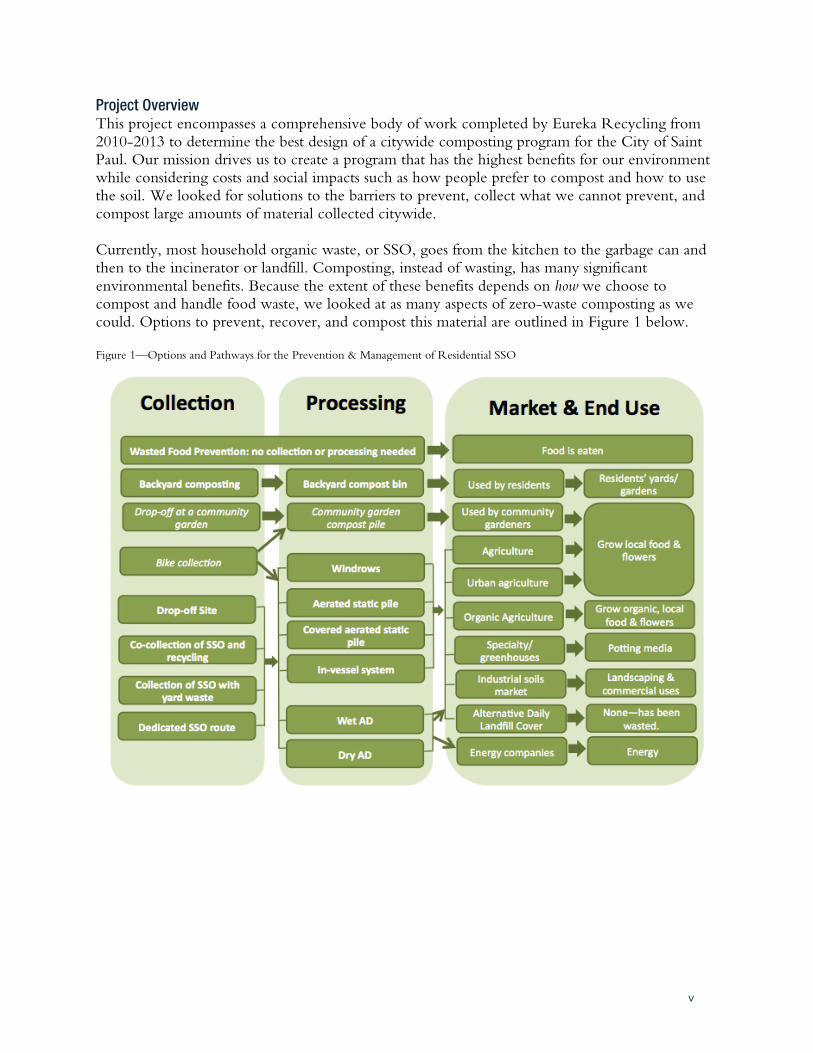
Project Overview This project encompasses a comprehensive body of work completed by Eureka Recycling from 2010-2013 to determine the best design of a citywide composting program for the City of Saint Paul. Our mission drives us to create a program that has the highest benefits for our environment while considering costs and social impacts such as how people prefer to compost and how to use the soil. We looked for solutions to the barriers to prevent, collect what we cannot prevent, and compost large amounts of material collected citywide. Currently, most household organic waste, or SSO, goes from the kitchen to the garbage can and then to the incinerator or landfill. Composting, instead of wasting, has many significant
environmental benefits. Because the extent of these benefits depends on how we choose to compost and handle food waste, we looked at as many aspects of zero-waste composting as we could. Options to prevent, recover, and compost this material are outlined in Figure 1 below.
Figure 1—Options and Pathways for the Prevention & Management of Residential SSO
vi
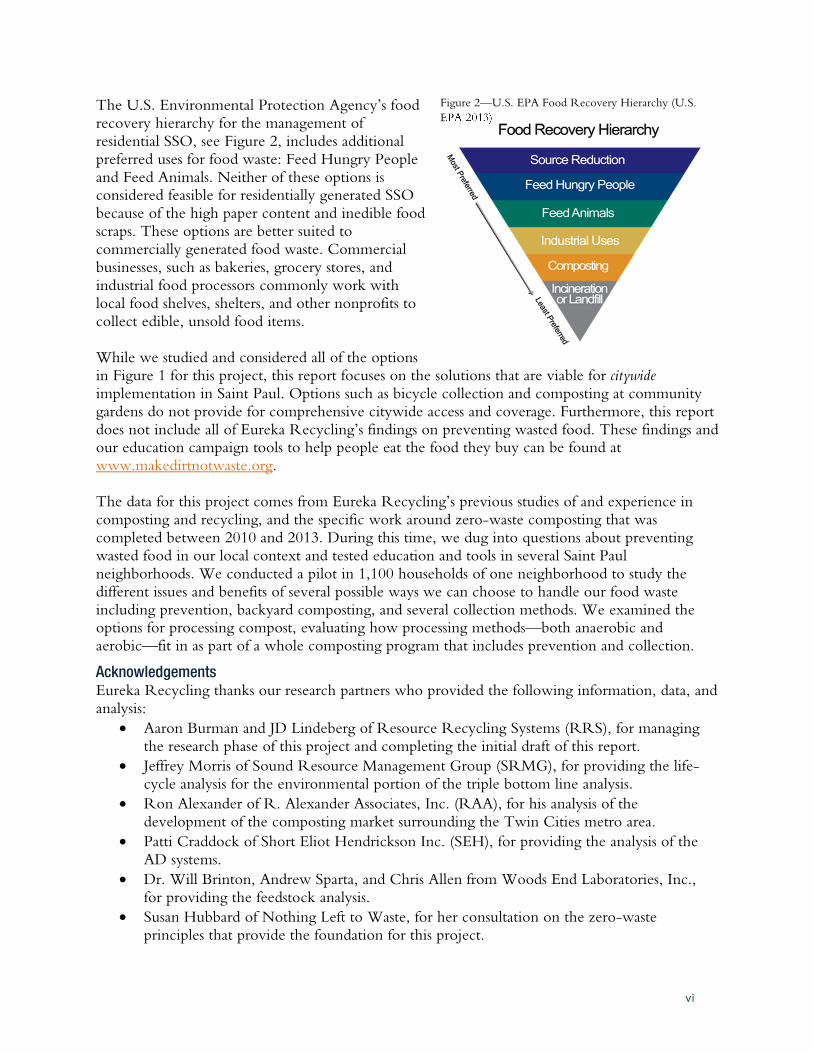
The U.S. Environmental Protection Agency’s food recovery hierarchy for the management of residential SSO, see Figure 2, includes additional preferred uses for food waste: Feed Hungry People and Feed Animals. Neither of these options is considered feasible for residentially generated SSO because of the high paper content and inedible food scraps. These options are better suited to commercially generated food waste. Commercial businesses, such as bakeries, grocery stores, and industrial food processors commonly work with local food shelves, shelters, and other nonprofits to collect edible, unsold food items. While we studied and considered all of the options in Figure 1 for this project, this report focuses on the solutions that are viable for citywide implementation in Saint Paul. Options such as bicycle collection and composting at community gardens do not provide for comprehensive citywide access and coverage. Furthermore, this report does not include all of Eureka Recycling’s findings on preventing wasted food. These findings and our education campaign tools to help people eat the food they buy can be found at www.makedirtnotwaste.org. The data for this project comes from Eureka Recycling’s previous studies of and experience in composting and recycling, and the specific work around zero-waste composting that was completed between 2010 and 2013. During this time, we dug into questions about preventing wasted food in our local context and tested education and tools in several Saint Paul neighborhoods. We conducted a pilot in 1,100 households of one neighborhood to study the different issues and benefits of several possible ways we can choose to handle our food waste including prevention, backyard composting, and several collection methods. We examined the options for processing compost, evaluating how processing methods—both anaerobic and aerobic—fit in as part of a whole composting program that includes prevention and collection.
Acknowledgements Eureka Recycling thanks our research partners who provided the following information, data, and analysis:
• Aaron Burman and JD Lindeberg of Resource Recycling Systems (RRS), for managing the research phase of this project and completing the initial draft of this report.
• Jeffrey Morris of Sound Resource Management Group (SRMG), for providing the life-cycle analysis for the environmental portion of the triple bottom line analysis.
• Ron Alexander of R. Alexander Associates, Inc. (RAA), for his analysis of the development of the composting market surrounding the Twin Cities metro area.
• Patti Craddock of Short Eliot Hendrickson Inc. (SEH), for providing the analysis of the AD systems.
• Dr. Will Brinton, Andrew Sparta, and Chris Allen from Woods End Laboratories, Inc., for providing the feedstock analysis.
• Susan Hubbard of Nothing Left to Waste, for her consultation on the zero-waste principles that provide the foundation for this project.
Figure 2—U.S. EPA Food Recovery Hierarchy (U.S.
EPA 2013)
vii
• Anne Ludvik of Specialized Environmental Technologies, Inc./The Mulch Store, for sharing her extensive knowledge of the local composting industry and her support in collecting feedstock samples to be tested.
• Marcus Zbinden of Carver County Environmental Services, for sharing the results of their compost processing pilot.
Eureka Recycling also thanks the many funders, partners, and/or participants who have supported various aspects of this work:
• The U.S. Department of Energy, for providing funding through a cooperative agreement with the Green Institute. (The Green Institute ceased operation in 2011 and Eureka Recycling provided a home for two Green Institute energy programs, including the staff members working on this project.)
• The NorthStar Initiative for Sustainable Enterprise at the University of Minnesota’s Institute on the Environment, for its cooperative agreement to provide funding from the Minnesota Pollution Control Agency to study how to prevent wasting food.
• Vern Xiong, the Lao Family Center, the Frogtown Neighborhood Association, and Sheronda Orridge for helping us develop education and test outreach to help people prevent wasted food.
• The High Winds Fund of Macalester College and Director, Tom Welna, for providing initial funding for the collection study in the Macalester-Groveland neighborhood.
• The staff and volunteer board of the Macalester-Groveland Community Council, the Green Institute, and the Metro Clean Energy Resource Team, for collaborating on outreach and education efforts in the Macalester-Groveland neighborhood
• The hundreds of community members in Macalester-Groveland, Frogtown, and the East Side neighborhoods of Saint Paul who prevented and composted food waste while testing our ideas and providing us with invaluable feedback.
• Christie Manning, behavioral psychologist and Macalester College professor, for helping us better understand people’s attitudes and behaviors around composting.
• The City of Saint Paul, for providing funding for discounted backyard composting bins for any Saint Paul resident. The Offices of Councilmembers Russ Stark and Chris Tolbert in Wards 3 and 4 funded the Macalester-Groveland Community Council through the Community Organization Partnership Program in 2011 and 2012 for composting outreach and organizing projects.
• The Unity Avenue Foundation, the WedgeShare Community Fund, and the Hub Bike Co-op, for providing additional funding and support.
Finally, Eureka Recycling would like to recognize the staff members (past and present), interns, friends, and volunteers who have contributed to this report and to our composting work in so many ways, especially Bryan Ukena, Nancy Kelly, Joanna Stone, Kate Davenport, Miriam Holsinger, and Alex Danovitch.
viii
Zero-Waste Composting Recommendations The recommendations are based on our comparative analysis (described below and detailed in the full report), which was conducted in Saint Paul, Minnesota. These findings are the key elements that distinguish a successful zero-waste composting program and are relevant for any zero-waste composting program. Prevention All composting programs should include a prevention component that encourages residents to prevent wasted food and to compost in their backyard. Prevention is by far the most cost-effective and environmentally beneficial way to manage food waste.
• Prevention programs completely eliminate transportation emissions since the material is reduced or handled on site. Avoiding transportation saves between $1.37 and $52.65 per ton in environmental and human health costs (depending on how the SSO is collected).
• While not all organic waste is preventable (like banana peels) or possible to compost in a backyard (like meat or nonrecyclable paper), including prevention with another collection method can reduce the per-ton program costs by more than $100/ton.
Co-Collection After as much prevention as possible, collection of the remaining SSO should be designed to leverage a community’s existing infrastructure to most efficiently collect material with the lowest costs and least transportation emissions.
• Co-collection of composting with another material on one truck reduces the number of trucks needed for collection. A dedicated route costs over twice as much as co-collection with yard waste and nearly 1.5 times more than co-collection with recycling. The emissions from a dedicated route have an environmental cost almost six times more harmful than co-collection with yard waste or recycling.
• In Saint Paul the least expensive collection method is co-collection of SSO with recycling (in a separate compartment on the same trucks). Commingling SSO with yard waste (in the same compartment in the same truck) has the lowest cost per ton, but the net cost would be over twice as much as co-collection with recycling. This is true because Saint Paul currently has an organized curbside collection infrastructure for recycling and none for yard waste. Therefore, co-collection with yard waste would add the cost of collecting the additional yard waste into the equation. In cities that have existing yard waste collection, the analysis would differ.
Drop-off Collection Drop-off sites should not be considered as a main strategy for collecting SSO from a large urban community like Saint Paul because of its comparatively high cost, large impact from emissions, and low participation rate. However, drop-offs can play an important role in providing immediate access to all residents during a new program rollout or to those living in multifamily buildings.
• The emissions from drop-offs are 38 times more environmentally harmful per ton compared to co-collection. This is because of the high emissions from residents’ vehicles making dedicated trips to the drop-off site every week. Dedicated trips are most likely because it is difficult and/or undesirable to combine this trip with an existing trip when hauling food waste in a compost bin in a car.
• Drop-offs have low participation rates. Study results show that over 8 times as much material is recovered from a curbside collection program versus a drop-off site program.
ix
• The per ton cost of a drop-off program is 40% more than the cost of a curbside program that uses co-collection with recycling.
• Adding compost collection to an existing recycling drop-off site can mitigate some of the cost impact, however the nature of hauling food waste in a car will still result in high emissions from dedicated trips.
SSO Processing After as much prevention as possible, the remaining residential SSO should be brought to a facility that will compost the material aerobically (such as in a static pile or windrow, as opposed to anaerobic digestion). Aerobic composting provides the best economic, social, and environmental benefits.
• Preventing wasted food provides the greatest environmental impact by reducing the upstream production and transportation emissions; it creates two times more environmental benefits than co-collection with recycling and aerobic compost processing.
• Aerobic composting methods (which are the methods most commonly used by compost processors) provide a savings of $83 per ton in environmental and human health costs when compared with disposal. For this analysis, the impacts of disposal were calculated using the average current disposal methods in Saint Paul, 34% landfill and 66% incineration, taking into account energy generation from incineration and from landfill methane capture.
• While anaerobic digestion (AD) processing methods do generate a net environmental benefit, aerobic composting methods result in almost twice as many environmental benefits than dry AD and four times more than wet AD—even after factoring in the benefit of energy production from AD. Also, this analysis shows that the type and volume of material produced in a residential program is not well suited to AD because its composition is highly variable and it has a relatively low Btu value per ton of input due to its high paper content.
• Any facility should be appropriately sized. With zero-waste composting, it is important to consider that the amount and type of material to be processed will change because of future food waste reduction, packaging legislation, and backyard composting efforts. Overbuilding capacity for recycling or composting, as we have seen done with waste disposal, inhibits prevention because the facility is financially built to work at a larger size, thereby creating economic and political pressure to deliver more tons to the facility, not reduce how much goes there.
Use of Finished Compost A mechanism to use finished compost locally—and funding for that mechanism—should be built into a composting program to maximize the community’s benefits.
• There is a critical need for healthy soil everywhere, especially in urban communities like Saint Paul. Using compost to displace petrochemical fertilizers saves $48.82 in environmental and human health costs for every ton of compost used.
• Bringing finished compost back to a community can be a powerful tool for community building—especially when used as soil remediation or a resource to support existing local food and community gardening movements. As demand for finished compost increases, it will be important for communities to prioritize and establish mechanisms that ensure the community benefits from the compost and supports how the compost is distributed.
x
• Although finished-compost return adds to the cost of the program, soil is currently being shipped in at a greater cost to the community from other parts of the state, and sometimes even from out of state.
Leveraging Existing Infrastructure A community’s composting program should be designed to utilize and expand on existing infrastructure. This approach improves cost-effectiveness by minimizing capital expenses and allowing for efficiencies of scale. It improves environmental impact by reducing the number of trucks and processing equipment required. It also improves the social benefits of the program by increasing access to residents and providing a comprehensive education message that ties together related issues.
• For prevention, an education campaign can be combined with other environmental issues that are important in the community (such as energy conservation).
• As demonstrated above, using the existing recycling infrastructure for collection provides significant environmental and economic benefits. The same would be true with expanding an existing recycling drop-off site to include compost.
• Utilizing existing processing capacity is significant to address the cost effectiveness of a program. As discussed in detail in the full report, larger scale facilities have significantly lower processing costs. When possible, utilizing an existing facility in a community can allow a smaller program to benefit from lower processing costs without building a facility.
Alternative Options As part of this study, alternative systems such as bike collection and composting at community gardens were studied. There were numerous benefits to these methods; however, in the context of a citywide program, they were not included in this evaluation due to limited scalability or logistical constraints. More information about these methods can be found in the full report.
1
CONTENTS Executive Summary .............................................................................................. ii
Introduction............................................................................................................................ ii
What is Zero-Waste Composting? ......................................................................................... iii
About Eureka Recycling ......................................................................................................... iv
Project Overview ..................................................................................................................... v
Acknowledgements ................................................................................................................. vi
Zero-Waste Composting Recommendations......................................................................... viii
List of Tables ........................................................................................................ 3
List of Figures ...................................................................................................... 4
Methodology: Triple Bottom Line ........................................................................ 5
Financial .................................................................................................................................. 5
Environmental and Human Health ........................................................................................... 5
Social Impact ......................................................................................................................... 10
Collection and Prevention ................................................................................... 11
Collection and Prevention Options ........................................................................................ 11
Data and Analysis of Collection and Prevention Methods ....................................................... 19
Collection and Prevention Findings ....................................................................................... 25
Processing .......................................................................................................... 26
Processing Options ................................................................................................................. 26
Data and Analysis of Processing Methods ............................................................................... 38
Processing Findings ................................................................................................................ 48
Use of Finished Compost..................................................................................... 49
Options for Use of Finished Compost .................................................................................... 49
Data and Analysis of Options for Use of Finished Compost .................................................... 53
Use of Finished Compost Findings ......................................................................................... 56
Zero-Waste Composting Recommendations ......................................................... 57
Prevention ............................................................................................................................. 57
Co-Collection ....................................................................................................................... 57
Drop-off Collection ............................................................................................................... 57
SSO Processing ...................................................................................................................... 58
Use of Finished Compost ....................................................................................................... 58
Leveraging Existing Infrastructure .......................................................................................... 59

2
Alternative Options ................................................................................................................ 59
Local Context: Zero Waste in Saint Paul .............................................................. 60
Recycling, Eureka Recycling, and Zero Waste in Saint Paul .................................................. 60
Garbage in Saint Paul ............................................................................................................. 61
Overview of Region and Regulatory Environment ................................................................ 61
Interest in Anaerobic Digestion .............................................................................................. 63
Zero-Waste Composting Proposal for Saint Paul .................................................................... 63
Recommendations for Further Study of Zero-Waste Composting........................... 66
Bibliography....................................................................................................... 69
Appendices ......................................................................................................... 72
Appendix A: Definitions & Abbreviations .............................................................................. 72
Appendix B: Sample Analysis ................................................................................................. 73
Appendix C: Drop-off Emissions ........................................................................................... 75
Appendix D: Detailed Compost Processing Costs ................................................................... 77
Appendix E: Explanation of Current Disposal Method ........................................................... 81
3
List of Tables
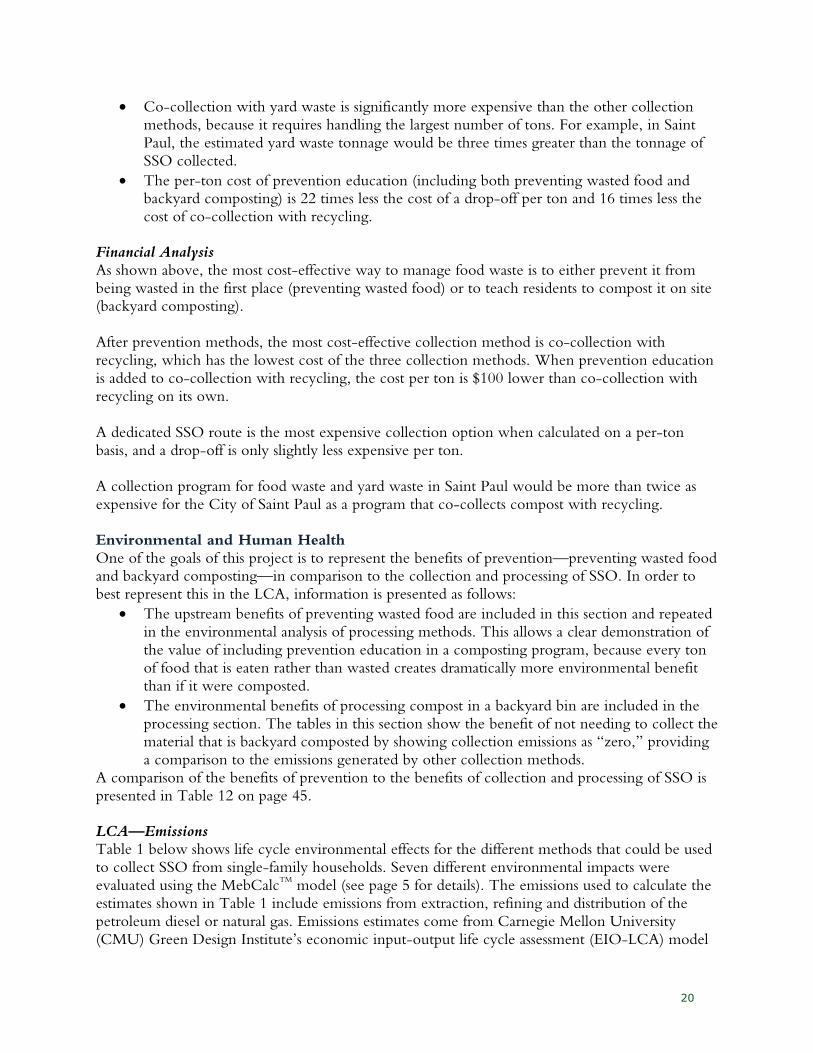
Table 1—Results of LCA Analysis of Collection Methods (Lbs. of Emissions per ton of SSO) ... 21
Table 2—Net Environmental and Human Health Costs per Ton of SSO Collected or Avoided 22
Table 3—Jobs Created by Different Collection Methods ........................................................... 23
Table 4—Public Health Costs Per Ton for Different Collection Methods .................................. 23
Table 5—Summary of Land Required for Different Processing Methods, based on Total Annual Tonnage .................................................................................................................................... 27
Table 6—Summary of Assumptions and Feedstock Outputs for AD Options ............................. 37
Table 7—Economic Cost Comparison of Processing Options for Basic Scenario of 6,000 tons/ year. .......................................................................................................................................... 40
Table 8—Increase in Per Ton Operating Cost based on Price of Carbon Material ..................... 40
Table 9—LCA Emissions Results for Processing Options (Lbs of emissions per ton of SSO) ...... 42
Table 10—Net LCA Emissions for Each Processing Option (Lbs of emissions per ton of SSO) .. 43
Table 11—Cost of Environmental and Public Health Externalities per ton of SSO Processed (benefits in parenthesis) .............................................................................................................. 44
Table 12—Net Environmental and Human Health Costs of Collection and Processing per Ton 45
Table 13—Jobs Created by Different Processing Methods .......................................................... 46
Table 14—Public Health Costs .................................................................................................. 47
Table 15—Summary of Marketing & End Use Options ............................................................. 51
Table 16—Avoided Environmental and Public Health Costs Per Cubic Yard of Finished Compost ................................................................................................................................... 53
Table 17—Public Health Impacts Per Ton of Using Compost Instead of Petro-chemical Fertilizer ................................................................................................................................................. 54
Table 18—Horticultural Business Demographics near the Twin Cities ....................................... 62
Table 19—Comparison of Economic and Environmental Costs and Benefits Per Ton ............... 64
Table 20—Estimated Costs and Benefits for Proposed Zero-Waste Composting Program in Saint Paul ........................................................................................................................................... 65
Table 21—Summary of the SSO Composition Study ................................................................. 74
Table 22—Average Emissions for Light Trucks and Cars (2005 Model Year) ............................. 75
Table 23—Summary of Windrow Composting System Costs .................................................... 77
Table 24—Summary of Aerated Static Pile System Costs ........................................................... 78
Table 25—Summary of Covered Aerated Static Pile Costs ......................................................... 78
Table 26—Summary of In-vessel System Costs .......................................................................... 79
Table 27—LCA Emissions Results for Current Disposal Method (Lbs. of emissions per ton of SSO) ......................................................................................................................................... 81
4
List of Figures
Figure 1—Options and Pathways for the Prevention & Management of Residential SSO ............ v
Figure 2—U.S. EPA Food Recovery Hierarchy (U.S. EPA 2013) .............................................. vi Figure 3—U.S. Annual Avoidable Food Waste in 2009 as a Percentage of Production (Venkat 2011) ......................................................................................................................................... 13
Figure 4—GHG Emissions from Avoidable Food Waste in 2009 (MMT CO2e/year) (Venkat 2011) ......................................................................................................................................... 14
Figure 5—Collection and Prevention Options: Costs and Tons Collected ................................. 19
Figure 6—Schematic of Wet Anaerobic Digestion System ......................................................... 34
Figure 7—Schematic of a Dry Anaerobic Digestion System ....................................................... 35
Figure 8—Basic Scenario: Comparison of Processing Cost per Ton of Total Organics ............... 38
Figure 9—Expanded Scenario: Comparison of Processing Cost/Ton of Total Organics. Includes Tax Credits for AD as of 2011 ................................................................................................... 38
Figure 10—Residential SSO Characterization from Waste Sort ................................................. 73
Figure 11—Survey results from the Ohio EPA Showing Distance Traveled by Drop-Off Visitors ................................................................................................................................................. 76
5
Methodology: Triple Bottom Line
This project uses a triple bottom line methodology to evaluate options for building a citywide composting program. The triple bottom line adds social and environmental measures to the commonly understood financial bottom line, and evaluates all three of these bottom lines to identify if a program is “in the black.”
The detailed triple bottom line analysis and results in this report cannot be applied universally, because the circumstances of each community are different. However, the indicators and methodology presented in this section are universal, and may be used to create a triple bottom line analysis of composting program options in any community. Eureka Recycling hopes that by sharing this methodology, and how it has been applied to Saint Paul, other communities will be able to replicate this study to benefit their composting and zero-waste programs.
Financial Financial analysis for this report is based on demographics, data collected from Eureka Recycling’s operational experience over the last decade, and several pilot projects completed by Eureka Recycling in Saint Paul. Collection data is based on households and volumes in Saint Paul; processing data is provided for various sized facilities; and market data is based on local conditions. While the specific values are dependent on various local conditions, the comparative analysis provides relevance and a decision-making framework for other communities to use in developing their own programs.
Environmental and Human Health Environmental impact was measured by looking at the environmental costs and benefits of each strategy. Costs include emissions generated during collection and processing. Benefits include the ability to replenish depleted soil and reduce dependence on chemical fertilizers; the ability to use finished compost to reduce erosion and protect lakes and rivers; the greenhouse gas reductions created by keeping compostable material out of landfills and incinerators; and potential energy generation. This study employed life cycle analysis (LCA) to estimate the environmental impacts of the collection, processing, and end use options. The LCA conducted for this project uses the Measuring Environmental Benefits Calculator (MEBCalc
TM) model, a comprehensive life cycle
assessment tool developed by team member Dr. Jeffrey Morris of Sound Resource Management. The model employs a life cycle approach to capture environmental impacts from the input of energy and materials and the output of wastes, pollution, usable products, and energy that occurs as a result of methods chosen to manage discards of SSO. In the case of organic materials, including SSO, the model estimates the environmental impacts of methods used to collect and process it. For processing methods that yield energy, compost, or other useful outputs, the model also estimates the resulting displacement of environmental impacts. For example, when compost is utilized as a soil amendment in lawn, gardening, or agricultural applications, MEBCalc
TM provides estimates of the environmental benefits from
reduced production of fertilizers and pesticides. This is true because compost is a product that provides soil nutrients and other soil enhancements that reduce the need for synthetic petroleum-based fertilizers and pesticides.
6
In particular, MEBCalcTM
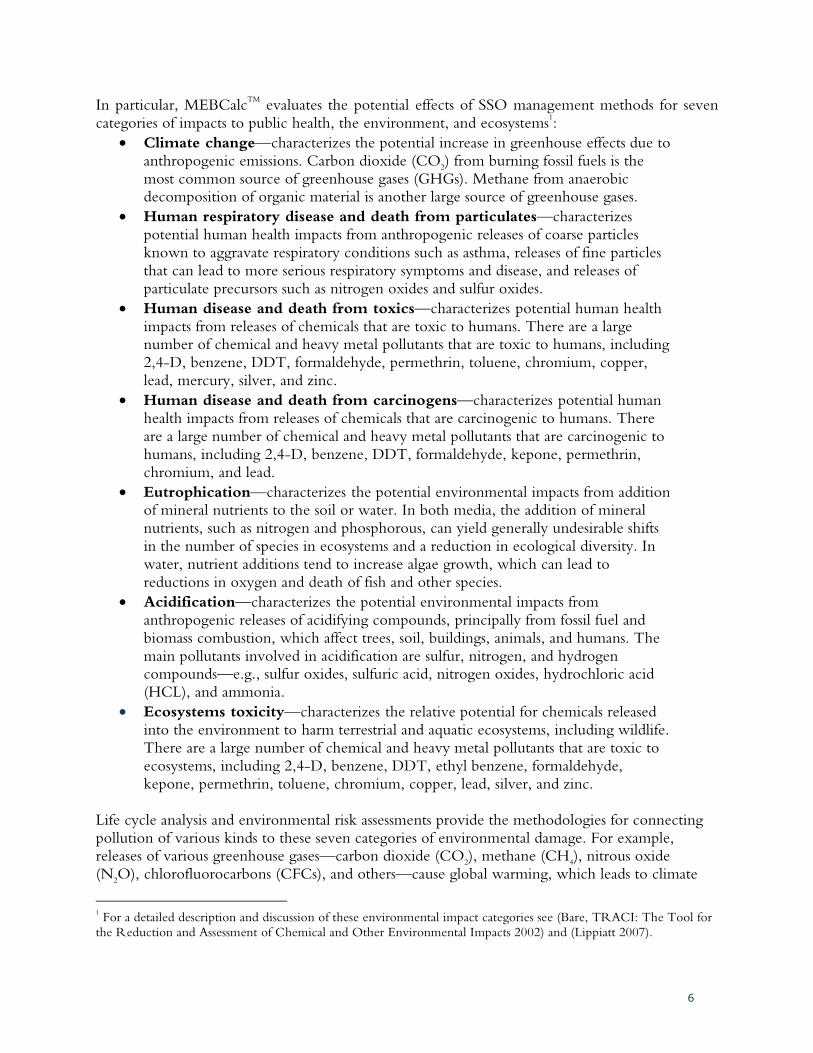
evaluates the potential effects of SSO management methods for seven categories of impacts to public health, the environment, and ecosystems
1:
• Climate change—characterizes the potential increase in greenhouse effects due to anthropogenic emissions. Carbon dioxide (CO
2) from burning fossil fuels is the
most common source of greenhouse gases (GHGs). Methane from anaerobic decomposition of organic material is another large source of greenhouse gases.
• Human respiratory disease and death from particulates—characterizes potential human health impacts from anthropogenic releases of coarse particles known to aggravate respiratory conditions such as asthma, releases of fine particles that can lead to more serious respiratory symptoms and disease, and releases of particulate precursors such as nitrogen oxides and sulfur oxides.
• Human disease and death from toxics—characterizes potential human health impacts from releases of chemicals that are toxic to humans. There are a large number of chemical and heavy metal pollutants that are toxic to humans, including 2,4-D, benzene, DDT, formaldehyde, permethrin, toluene, chromium, copper, lead, mercury, silver, and zinc.
• Human disease and death from carcinogens—characterizes potential human health impacts from releases of chemicals that are carcinogenic to humans. There are a large number of chemical and heavy metal pollutants that are carcinogenic to humans, including 2,4-D, benzene, DDT, formaldehyde, kepone, permethrin, chromium, and lead.
• Eutrophication—characterizes the potential environmental impacts from addition of mineral nutrients to the soil or water. In both media, the addition of mineral nutrients, such as nitrogen and phosphorous, can yield generally undesirable shifts in the number of species in ecosystems and a reduction in ecological diversity. In water, nutrient additions tend to increase algae growth, which can lead to reductions in oxygen and death of fish and other species.
• Acidification—characterizes the potential environmental impacts from anthropogenic releases of acidifying compounds, principally from fossil fuel and biomass combustion, which affect trees, soil, buildings, animals, and humans. The main pollutants involved in acidification are sulfur, nitrogen, and hydrogen compounds—e.g., sulfur oxides, sulfuric acid, nitrogen oxides, hydrochloric acid (HCL), and ammonia.
• Ecosystems toxicity—characterizes the relative potential for chemicals released into the environment to harm terrestrial and aquatic ecosystems, including wildlife. There are a large number of chemical and heavy metal pollutants that are toxic to ecosystems, including 2,4-D, benzene, DDT, ethyl benzene, formaldehyde, kepone, permethrin, toluene, chromium, copper, lead, silver, and zinc.
Life cycle analysis and environmental risk assessments provide the methodologies for connecting pollution of various kinds to these seven categories of environmental damage. For example, releases of various greenhouse gases—carbon dioxide (CO
2), methane (CH
4), nitrous oxide
(N2O), chlorofluorocarbons (CFCs), and others—cause global warming, which leads to climate
1 For a detailed description and discussion of these environmental impact categories see (Bare, TRACI: The Tool for
the Reduction and Assessment of Chemical and Other Environmental Impacts 2002) and (Lippiatt 2007).
7
change. The United Nations Intergovernmental Panel on Climate Change (IPCC) periodically conducts a thorough review of scientific data to determine the strength of each pollutant relative to carbon dioxide in causing global warming. Based on the global warming potential factors developed in the latest available IPCC review (4
th Assessment issued in 2007) the emissions of all
greenhouse gas pollutants are aggregated into CO2 equivalents (eCO
2).
Similar scientific efforts enable the quantity of pollutant releases to be expressed in terms of a single indicator for the other six categories of environmental damage. This greatly simplifies reporting and analysis of different levels of pollution. By grouping pollution impacts into a handful of categories, environmental costs and benefits modeling is able to reduce the complexity of tracking hundreds of pollutants. This makes the data far more accessible to policy makers. MEBCalc
TM relies on the pollution aggregation methodologies used in U.S. EPA’s TRACI 2.0
(Tool for the Reduction and Assessment of Chemical and other environmental Impacts) model (Bare 2011). The TRACI model was updated at the beginning of 2011 to reflect a scientific harmonization and consensus process recently completed by the United Nations Environment Program (UNEP) and the Society of Environmental Toxicology and Chemistry (SETAC). The TRACI model facilitates aggregation of pollution reductions or increases under each management option into totals for an indicator pollutant for each impact category. The indicator pollutants used in the LCA results reported herein for collection, processing, and marketing of SSO are:
• Climate change: carbon dioxide equivalents (eCO2)
• Human health—respiratory diseases: particulate matter no more than 2.5 microns equivalents (ePM
2.5)
• Human health—non-cancers: toluene equivalents (eToluene)
• Human health—cancers: benzene equivalents (eBenzene)
• Eutrophication: nitrogen equivalents (eN)
• Acidification: sulfur dioxide equivalents (eSO2)
• Ecosystems toxicity: herbicide 2,4-D equivalents (e2,4-D) The final step in estimating an environmental value for recovery is to determine a dollar value for the damage to public health and/or ecosystems caused by each of the indicator pollutants. The following list shows these estimated damage valuations. The remainder of this section discusses the sources and justifications for these valuations.
• eCO2: $40 per ton
• ePM2.5
: $10,000 per ton (Eastern Research Group 2006)
• eToluene: $118 per ton
• eBenzene: $3,030 per ton (Eastern Research Group 2006)
• eN: $4 per ton
• eSO2: $410 per ton
• e2,4-D: $3,280 per ton The value of greenhouse gas (eCO
2) emissions reductions
There is a very wide range in estimated costs for greenhouse gas emissions and valuations for the benefits of reductions in those emissions. The low end for valuations is the trading price for
8
voluntary greenhouse gas emission reductions. Operating much as the markets in sulfur dioxide emissions permits do, several markets are available for trading voluntary greenhouse gas emissions reduction pledges. Until recently, one of these was the Chicago Climate Exchange (CCX). Trading values on the CCX for CO
2 reductions were between $1 and $4 per ton of carbon
dioxide over the last several years. Values on European carbon markets have been up to ten times higher than trading prices on the CCX due to the mandatory CO
2 emissions caps imposed on
European greenhouse gas generators. The upper end of the range for estimated costs of climate change is found in recent studies such as the review of the economics of climate change conducted by Nicholas Stern (Stern 2007). That study determined that a reasonable estimate for the cost of current greenhouse gas emissions was $85 per metric ton, based on the risk of catastrophic environmental impacts in the future if substantial reductions in greenhouse gas emissions are not implemented today. MEBCalc
TM uses $40 per ton for the cost of greenhouse gas
emissions. This is in the middle of the range between market values for voluntary emissions reductions and estimated costs of severe climate change impacts if today’s emissions levels are not substantially reduced. The value of particulates (ePM
2.5) emissions reductions
Eastern Research Group (2006) reports the following: “Epidemiological studies have linked exposure to increased particulate matter (PM) levels to mortality and morbidity from chronic bronchitis and cardio-vascular disease. Time-series data from the 20 largest U.S. cities indicate a linear relationship between particulate air pollution and mortality. The number of years of life lost from premature death, and well-being lost from illness, due to PM exposure depends on the age distribution and size of the exposed population. Many factors enter into the assessment of illness from PM exposure including weather, types of emissions, and health of the population. These analyses must be conducted at a local level in order to incorporate all of these factors.” “National estimates of the “per-ton” benefits of reducing PM emissions are not often calculated. The importance of local factors in the effects of PM emissions makes such broad estimates highly uncertain. In order to compare the benefits and costs of regulations that federal agencies had chosen not to monetize, the Office of Management and Budget (OMB) calculated a broad national value of the benefits of reducing PM emissions by one ton of $10,000 to $100,000 (2001). OMB based this estimate on the 1997 NAAQS benefit assessment, though their method is not described” (Eastern Research Group 2006). Based on this analysis by Eastern Research Group, MEBCalc
TM incorporates a cost valuation of $10,000 per ton for emissions of PM
2.5.
The value of human toxics (non-cancers, i.e., eToulene) emissions reductions As with the valuation of the costs of greenhouse gas emissions, there is a wide range in the estimated costs for emissions of pollutants that are toxic to humans. Eastern Research Group (2006) found estimates ranging up to $2,700 per ton of eToluene for the human health costs of toxic air pollutant emissions. MEBCalc
TM’s very conservative estimate of monetary costs for toxic
air emissions is based on a peer-reviewed study on the health effects of atmospheric emissions of mercury. That study was sponsored by the Northeast States for Coordinated Air Use Management (NESCAUM) and conducted by scientists at the Harvard Center for Risk Analysis (Rice 2005). The study evaluated neurological and possible cardiovascular health impacts from exposure to methyl mercury through fish consumption, where atmospheric releases of mercury result in
9
depositions of mercury in water bodies within and bordering the U.S. These depositions lead to increases in methyl mercury concentrations in fish. The NESCAUM study evaluated three main health effects from methyl mercury exposure—neurological decrements associated with intrauterine exposure, myocardial effects associated with adult exposure, and elevated childhood blood pressure and cardiac rhythm effects associated with in utero exposure. MEBCalc
TM relies on the economic cost estimated in the study for only the
first effect. The decrease in cognitive ability as a result of intrauterine exposure to methyl mercury is well documented and understood, whereas research on the other two health effects is not yet as extensive or thoroughly peer-reviewed. The NESCAUM study’s neurotoxicity health cost estimate for exposure to methyl mercury from consumption of fish that have bioaccumulated that toxin as a result of mercury air pollution is $10.5 million in year 2000 dollars per ton of mercury emitted to the atmosphere. Inflating that estimate to current dollars and converting the cost to toluene emissions, the indicator substance for human toxicity, yields $118 per ton of eToluene for the cost of pollutant emissions that are toxic to human health. This is the value MEBCalc
TM attributes to reductions in human toxicity
that are caused by diverting material resources from disposal to recycling and composting. The value of human carcinogens (eBenzene) reductions Eastern Research Group (2006) reports research suggesting that the cost to human health from benzene exposure could be 950 times greater than toluene. Given a valuation of $118 per ton for toluene, this ratio implies that benzene’s valuation should be more than $100,000 per ton. This cost valuation is extremely high. Instead MEBCalc
TM uses $3,030 per ton, which is about 10%
above the midpoint of the range $0.06 to $6.00 per kilogram for expected health risks from Benzene releases that is also discussed in the Eastern Research Group study. The value of reductions in eutrophying emissions (eN) In soil or waterways, the addition of large quantities of mineral nutrients, such as nitrogen and phosphorous, results in generally undesirable shifts in the number of species in ecosystems and in a reduction in ecological diversity. In water, it tends to increase algae growth, which can lead to lack of oxygen and therefore death of species such as fish. MEBCalc
TM’s estimate of the cost of
releases of nutrifying compounds is based on EPA’s cost-effectiveness analysis for the NPDES regulation on effluent discharges from concentrated animal feeding operations. That analysis estimated that costs up to $4.41 per metric ton of nitrogen ($4.00 per short ton) removed from wastewater effluents were economically advantageous (U.S. EPA, Office of Research and Development 2002). The value of reductions in acidifying emissions (eSO
2)
The value of acidification reductions is estimated at $410 per ton. This is the average of 2005 ($690), 2006 ($860), 2007 ($433), 2008 ($380), 2009 ($62) and 2010 ($36) market clearing spot prices in the U.S. EPA's annual acid rain sulfur dioxide emissions permit allowances auction under the Clean Air Act. The value of ecosystem toxics (e2,4-D) reductions A study estimated the toxicity cost to plants and wildlife from application of a pound of 2,4-D herbicide at $1.64. This is an updated estimate from Joe Kovach, Integrated Pest Management
10
Program at The Ohio State University, based on his research originally reported in his 1992 report on putting an environmental price to pesticide use (Kovach J 1992). The estimate includes costs for impacts on fish, birds, bees and beneficial arthropods, but not the estimated costs developed by Kovach for impacts on human health as a result of groundwater contamination. That human health cost is captured in the human toxicity potential impact category.
Social Impact Social benefits were measured by looking at community assets created by each strategy, such as potential jobs created, level of program participation, and other value returned to the community such as finished compost, increased access to healthy living resources, and cost savings. Jobs created Calculations were made of how many jobs would be directly created by each option. The calculations were based on estimates for rolling out a citywide composting program in Saint Paul. The calculation of jobs created that is included in this report is based on an annual average for a 4-year rollout, and only includes direct job creation. Additional upstream and downstream job creation was not calculated within the scope of this study. Public Health Impacts The environmental analysis described in the previous section includes an analysis of human health impacts. In particular, three of the seven indicators used in the MEBCalc
TM LCA specifically
measure the human health impacts related to different collection, processing, and marketing options for residential SSO. These are represented and explained in detail under the Environmental LCA, and are restated as part of the social benefits analysis because of the significant impact on human health.
• Particulate matter levels (ePM2.5
), which contribute to chronic bronchitis and cardio-vascular disease.
• Human toxin emissions that can lead to non-cancerous diseases (eToluene), including emissions of human health toxins that have neurological and possible cardiovascular impacts, such as exposure to methyl mercury through fish consumption.
• Human carcinogen emissions that can lead to cancers (eBenzene) Direct Benefit to Residents Finally, an evaluation was done of how different components of a composting program would directly benefit residents. Program components were assessed to determine whether the program provides an opportunity for residents to save money—on trash bills, groceries, etc.—or provides resources to residents that support a healthy lifestyle, such as food storage tips that encourage them to eat more fresh foods.
11
Collection and Prevention
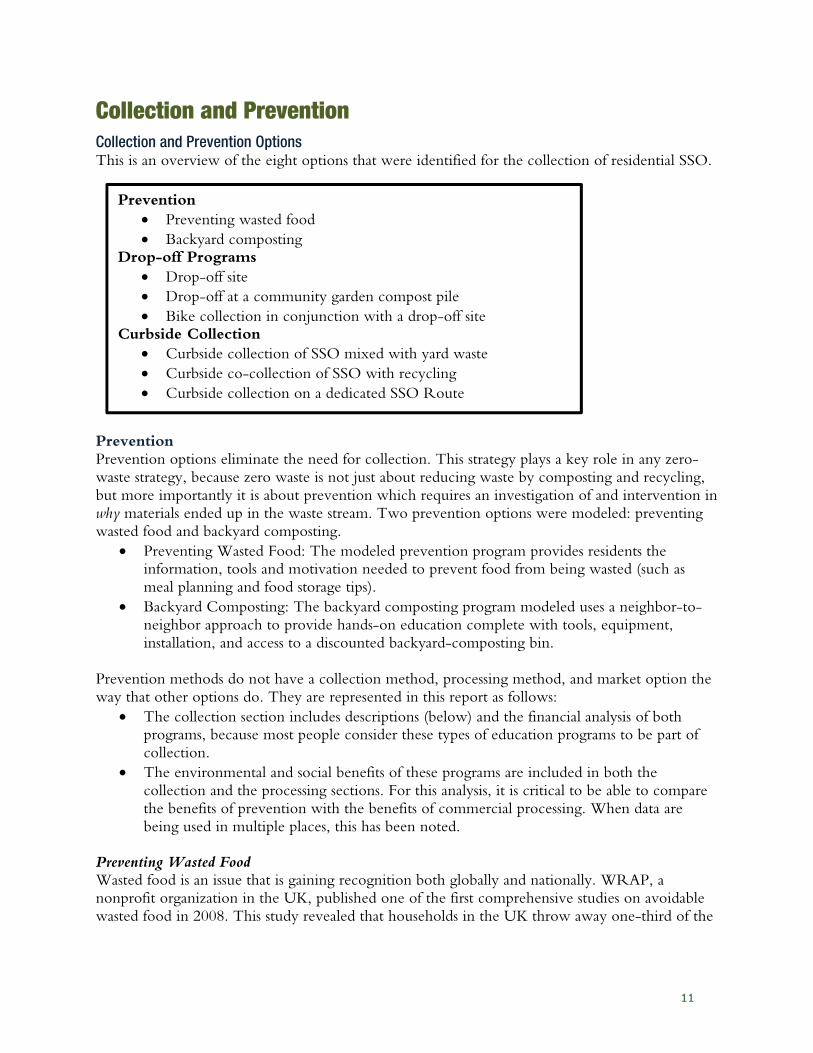
Collection and Prevention Options This is an overview of the eight options that were identified for the collection of residential SSO.
Prevention Prevention options eliminate the need for collection. This strategy plays a key role in any zero-waste strategy, because zero waste is not just about reducing waste by composting and recycling, but more importantly it is about prevention which requires an investigation of and intervention in why materials ended up in the waste stream. Two prevention options were modeled: preventing wasted food and backyard composting.
• Preventing Wasted Food: The modeled prevention program provides residents the information, tools and motivation needed to prevent food from being wasted (such as meal planning and food storage tips).
• Backyard Composting: The backyard composting program modeled uses a neighbor-to-neighbor approach to provide hands-on education complete with tools, equipment, installation, and access to a discounted backyard-composting bin.
Prevention methods do not have a collection method, processing method, and market option the way that other options do. They are represented in this report as follows:
• The collection section includes descriptions (below) and the financial analysis of both programs, because most people consider these types of education programs to be part of collection.
• The environmental and social benefits of these programs are included in both the collection and the processing sections. For this analysis, it is critical to be able to compare the benefits of prevention with the benefits of commercial processing. When data are being used in multiple places, this has been noted.
Preventing Wasted Food Wasted food is an issue that is gaining recognition both globally and nationally. WRAP, a nonprofit organization in the UK, published one of the first comprehensive studies on avoidable wasted food in 2008. This study revealed that households in the UK throw away one-third of the
Prevention
• Preventing wasted food
• Backyard composting Drop-off Programs
• Drop-off site
• Drop-off at a community garden compost pile
• Bike collection in conjunction with a drop-off site Curbside Collection
• Curbside collection of SSO mixed with yard waste
• Curbside co-collection of SSO with recycling
• Curbside collection on a dedicated SSO Route
12
food they purchase each year, and that 61% (or 4.1 million tons) of food thrown away could have been eaten if it had been handled better (WRAP 2008).
In response to this issue, WRAP started an education campaign, “Love Food Hate Waste,” with innovative, web-based resources designed to help people reduce the amount of food that they waste by providing facts, food storage tips, recipes, and more. More recently, a new WRAP study was released in 2011 that measured the impacts of this intensive education campaign. According to their calculations, education efforts reduced the annual amount of wasted food in the UK by 13% (WRAP 2011). Through a partnership with the University of Minnesota’s Institute on the Environment (NorthStar Initiative for Sustainable Enterprise) and with support from the Minnesota Pollution Control Agency, Eureka Recycling has dug deep into questions about preventing wasted food in a local context:
• What kind of foods do we most often waste?
• What type of information, education, and messaging is motivating for people to change their habits and waste less food?
• Are there tools that are especially helpful?
• How much of an impact can we have on reducing the amount of discards that needs to be composted using those tools and information?
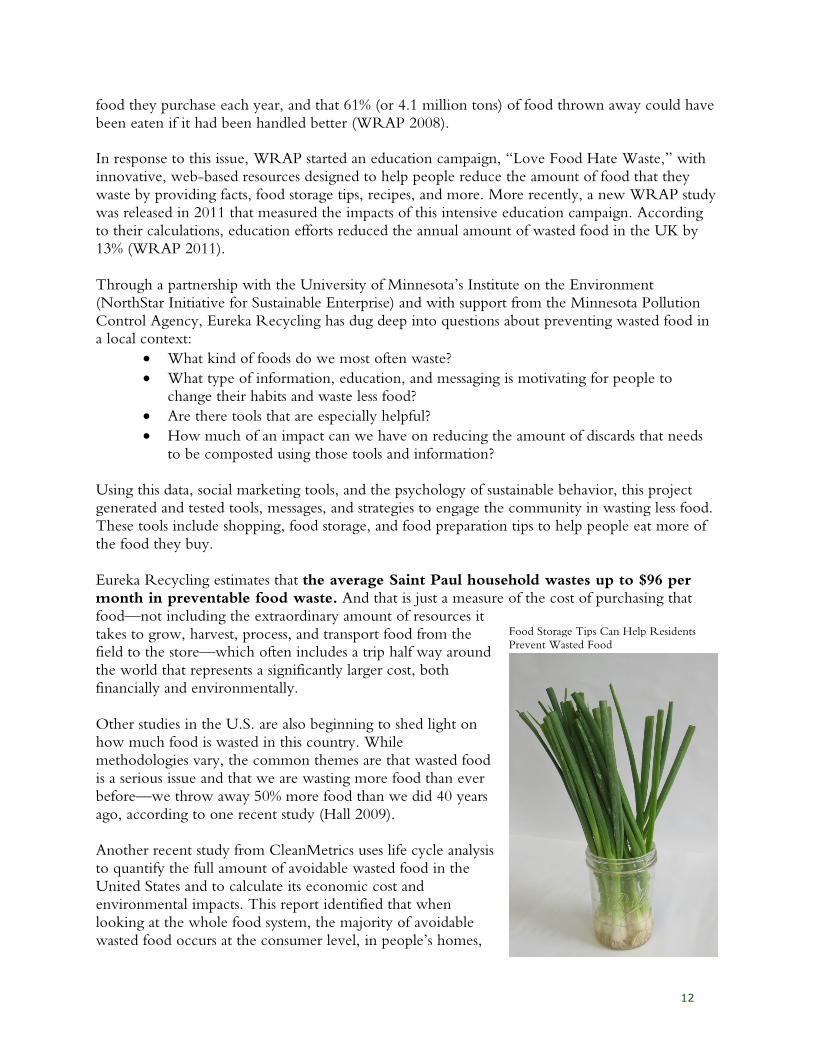
Using this data, social marketing tools, and the psychology of sustainable behavior, this project generated and tested tools, messages, and strategies to engage the community in wasting less food. These tools include shopping, food storage, and food preparation tips to help people eat more of the food they buy. Eureka Recycling estimates that the average Saint Paul household wastes up to $96 per month in preventable food waste. And that is just a measure of the cost of purchasing that food—not including the extraordinary amount of resources it takes to grow, harvest, process, and transport food from the field to the store—which often includes a trip half way around the world that represents a significantly larger cost, both financially and environmentally. Other studies in the U.S. are also beginning to shed light on how much food is wasted in this country. While methodologies vary, the common themes are that wasted food is a serious issue and that we are wasting more food than ever before—we throw away 50% more food than we did 40 years ago, according to one recent study (Hall 2009). Another recent study from CleanMetrics uses life cycle analysis to quantify the full amount of avoidable wasted food in the United States and to calculate its economic cost and environmental impacts. This report identified that when looking at the whole food system, the majority of avoidable wasted food occurs at the consumer level, in people’s homes,
Food Storage Tips Can Help Residents Prevent Wasted Food
13
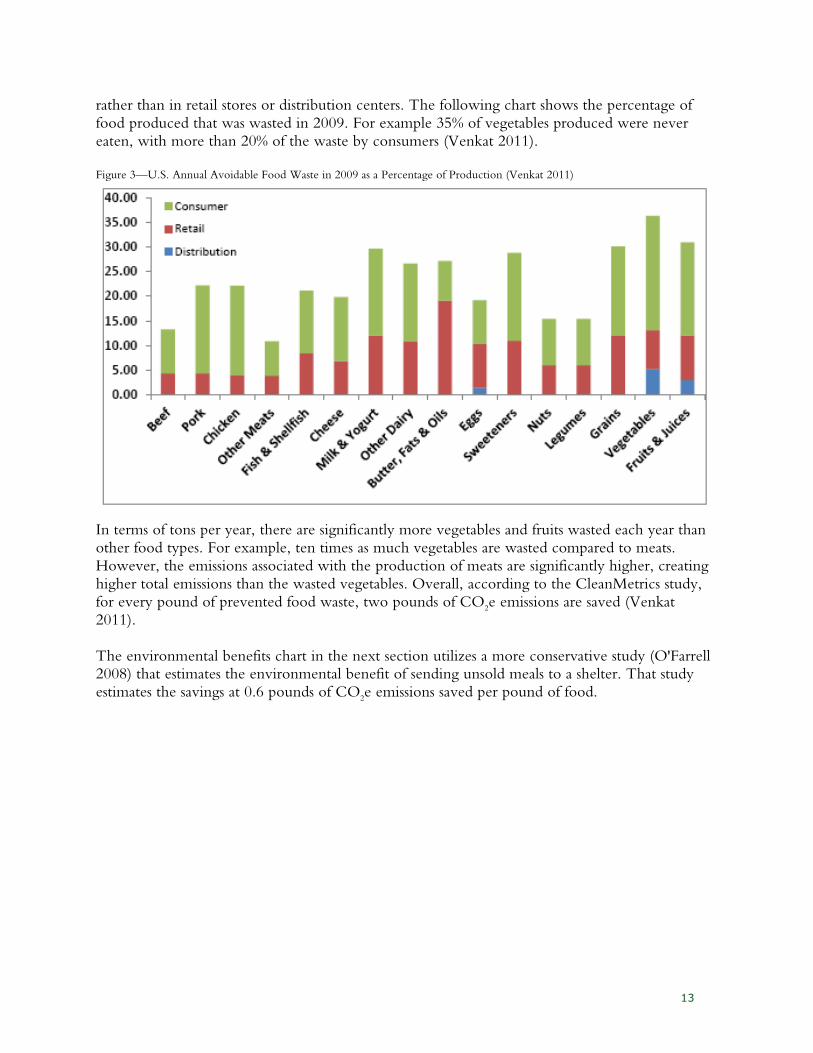
rather than in retail stores or distribution centers. The following chart shows the percentage of food produced that was wasted in 2009. For example 35% of vegetables produced were never eaten, with more than 20% of the waste by consumers (Venkat 2011). Figure 3—U.S. Annual Avoidable Food Waste in 2009 as a Percentage of Production (Venkat 2011)
In terms of tons per year, there are significantly more vegetables and fruits wasted each year than other food types. For example, ten times as much vegetables are wasted compared to meats. However, the emissions associated with the production of meats are significantly higher, creating higher total emissions than the wasted vegetables. Overall, according to the CleanMetrics study, for every pound of prevented food waste, two pounds of CO
2e emissions are saved (Venkat
2011). The environmental benefits chart in the next section utilizes a more conservative study (O'Farrell 2008) that estimates the environmental benefit of sending unsold meals to a shelter. That study estimates the savings at 0.6 pounds of CO
2e emissions saved per pound of food.
14
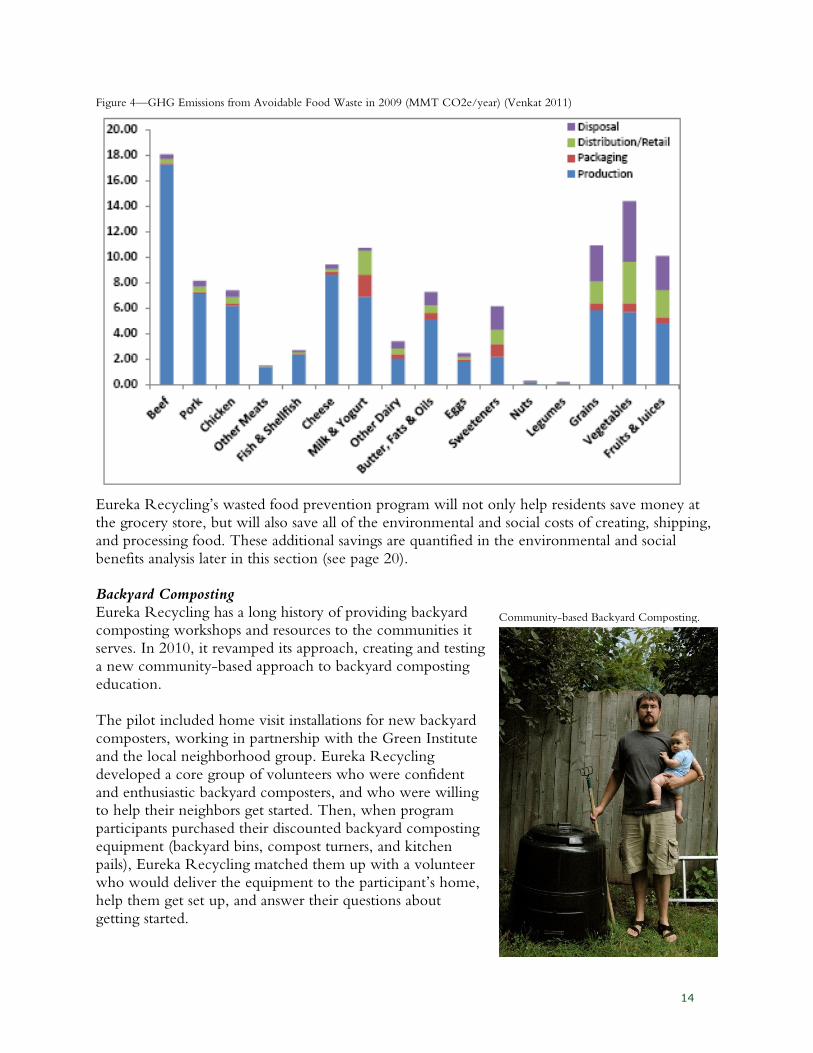
Figure 4—GHG Emissions from Avoidable Food Waste in 2009 (MMT CO2e/year) (Venkat 2011)
Eureka Recycling’s wasted food prevention program will not only help residents save money at the grocery store, but will also save all of the environmental and social costs of creating, shipping, and processing food. These additional savings are quantified in the environmental and social benefits analysis later in this section (see page 20). Backyard Composting Eureka Recycling has a long history of providing backyard composting workshops and resources to the communities it serves. In 2010, it revamped its approach, creating and testing a new community-based approach to backyard composting education. The pilot included home visit installations for new backyard composters, working in partnership with the Green Institute and the local neighborhood group. Eureka Recycling developed a core group of volunteers who were confident and enthusiastic backyard composters, and who were willing to help their neighbors get started. Then, when program participants purchased their discounted backyard composting equipment (backyard bins, compost turners, and kitchen pails), Eureka Recycling matched them up with a volunteer who would deliver the equipment to the participant’s home, help them get set up, and answer their questions about getting started.
Community-based Backyard Composting.
15
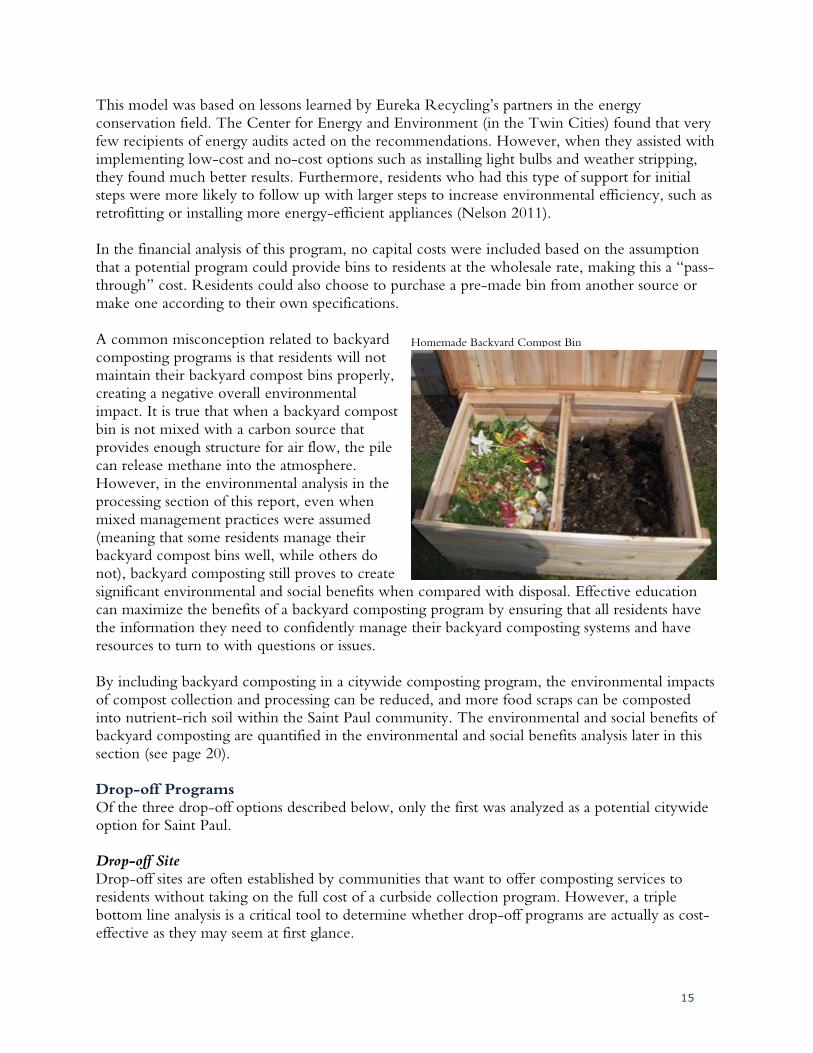
This model was based on lessons learned by Eureka Recycling’s partners in the energy conservation field. The Center for Energy and Environment (in the Twin Cities) found that very few recipients of energy audits acted on the recommendations. However, when they assisted with implementing low-cost and no-cost options such as installing light bulbs and weather stripping, they found much better results. Furthermore, residents who had this type of support for initial steps were more likely to follow up with larger steps to increase environmental efficiency, such as retrofitting or installing more energy-efficient appliances (Nelson 2011). In the financial analysis of this program, no capital costs were included based on the assumption that a potential program could provide bins to residents at the wholesale rate, making this a “pass-through” cost. Residents could also choose to purchase a pre-made bin from another source or make one according to their own specifications. A common misconception related to backyard composting programs is that residents will not maintain their backyard compost bins properly, creating a negative overall environmental impact. It is true that when a backyard compost bin is not mixed with a carbon source that provides enough structure for air flow, the pile can release methane into the atmosphere. However, in the environmental analysis in the processing section of this report, even when mixed management practices were assumed (meaning that some residents manage their backyard compost bins well, while others do not), backyard composting still proves to create significant environmental and social benefits when compared with disposal. Effective education can maximize the benefits of a backyard composting program by ensuring that all residents have the information they need to confidently manage their backyard composting systems and have resources to turn to with questions or issues. By including backyard composting in a citywide composting program, the environmental impacts of compost collection and processing can be reduced, and more food scraps can be composted into nutrient-rich soil within the Saint Paul community. The environmental and social benefits of backyard composting are quantified in the environmental and social benefits analysis later in this section (see page 20). Drop-off Programs Of the three drop-off options described below, only the first was analyzed as a potential citywide option for Saint Paul. Drop-off Site Drop-off sites are often established by communities that want to offer composting services to residents without taking on the full cost of a curbside collection program. However, a triple bottom line analysis is a critical tool to determine whether drop-off programs are actually as cost-effective as they may seem at first glance.
Homemade Backyard Compost Bin
16
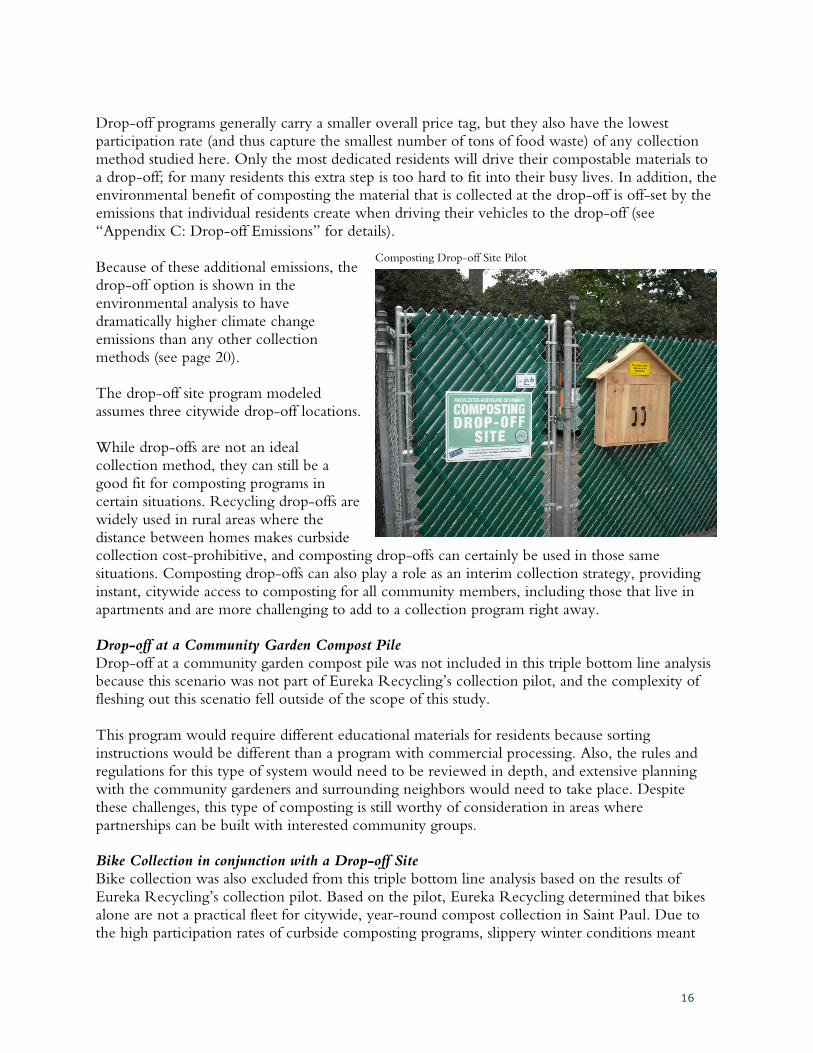
Drop-off programs generally carry a smaller overall price tag, but they also have the lowest participation rate (and thus capture the smallest number of tons of food waste) of any collection method studied here. Only the most dedicated residents will drive their compostable materials to a drop-off; for many residents this extra step is too hard to fit into their busy lives. In addition, the environmental benefit of composting the material that is collected at the drop-off is off-set by the emissions that individual residents create when driving their vehicles to the drop-off (see “Appendix C: Drop-off Emissions” for details). Because of these additional emissions, the drop-off option is shown in the environmental analysis to have dramatically higher climate change emissions than any other collection methods (see page 20). The drop-off site program modeled assumes three citywide drop-off locations. While drop-offs are not an ideal collection method, they can still be a good fit for composting programs in certain situations. Recycling drop-offs are widely used in rural areas where the distance between homes makes curbside collection cost-prohibitive, and composting drop-offs can certainly be used in those same situations. Composting drop-offs can also play a role as an interim collection strategy, providing instant, citywide access to composting for all community members, including those that live in apartments and are more challenging to add to a collection program right away. Drop-off at a Community Garden Compost Pile Drop-off at a community garden compost pile was not included in this triple bottom line analysis because this scenario was not part of Eureka Recycling’s collection pilot, and the complexity of fleshing out this scenatio fell outside of the scope of this study. This program would require different educational materials for residents because sorting instructions would be different than a program with commercial processing. Also, the rules and regulations for this type of system would need to be reviewed in depth, and extensive planning with the community gardeners and surrounding neighbors would need to take place. Despite these challenges, this type of composting is still worthy of consideration in areas where partnerships can be built with interested community groups. Bike Collection in conjunction with a Drop-off Site Bike collection was also excluded from this triple bottom line analysis based on the results of Eureka Recycling’s collection pilot. Based on the pilot, Eureka Recycling determined that bikes alone are not a practical fleet for citywide, year-round compost collection in Saint Paul. Due to the high participation rates of curbside composting programs, slippery winter conditions meant
Composting Drop-off Site Pilot
17
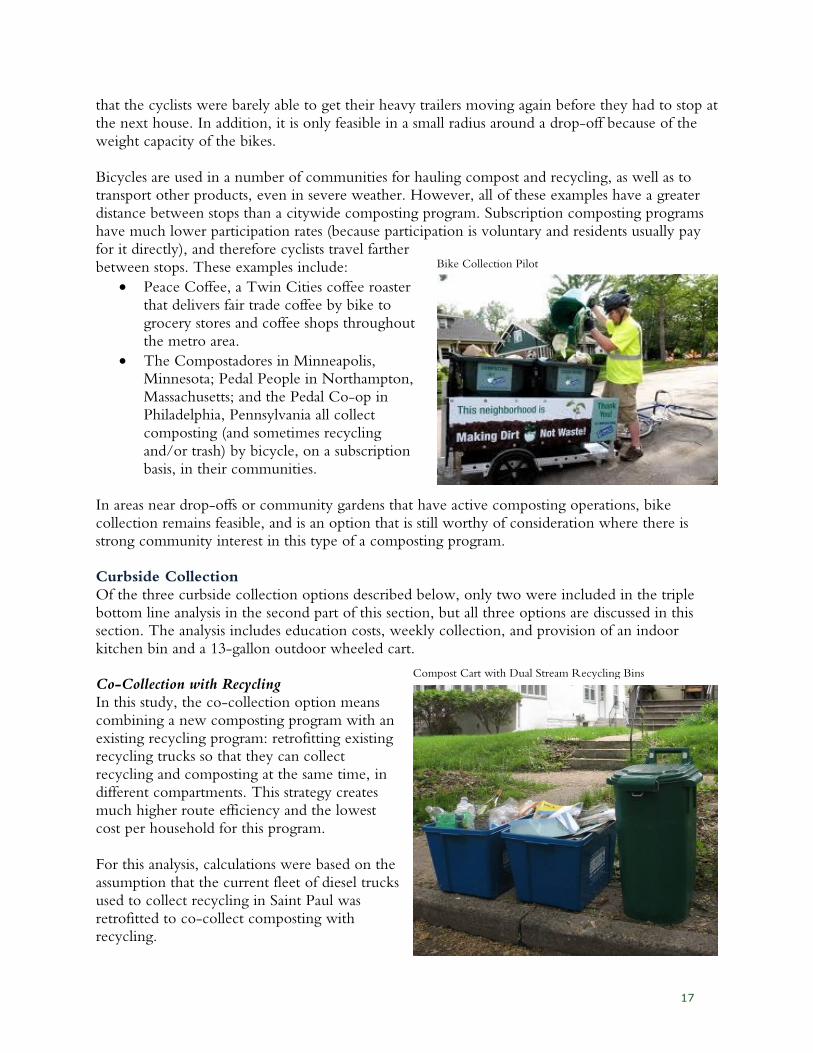
that the cyclists were barely able to get their heavy trailers moving again before they had to stop at the next house. In addition, it is only feasible in a small radius around a drop-off because of the weight capacity of the bikes. Bicycles are used in a number of communities for hauling compost and recycling, as well as to transport other products, even in severe weather. However, all of these examples have a greater distance between stops than a citywide composting program. Subscription composting programs have much lower participation rates (because participation is voluntary and residents usually pay for it directly), and therefore cyclists travel farther between stops. These examples include:
• Peace Coffee, a Twin Cities coffee roaster that delivers fair trade coffee by bike to grocery stores and coffee shops throughout the metro area.
• The Compostadores in Minneapolis, Minnesota; Pedal People in Northampton, Massachusetts; and the Pedal Co-op in Philadelphia, Pennsylvania all collect composting (and sometimes recycling and/or trash) by bicycle, on a subscription basis, in their communities.
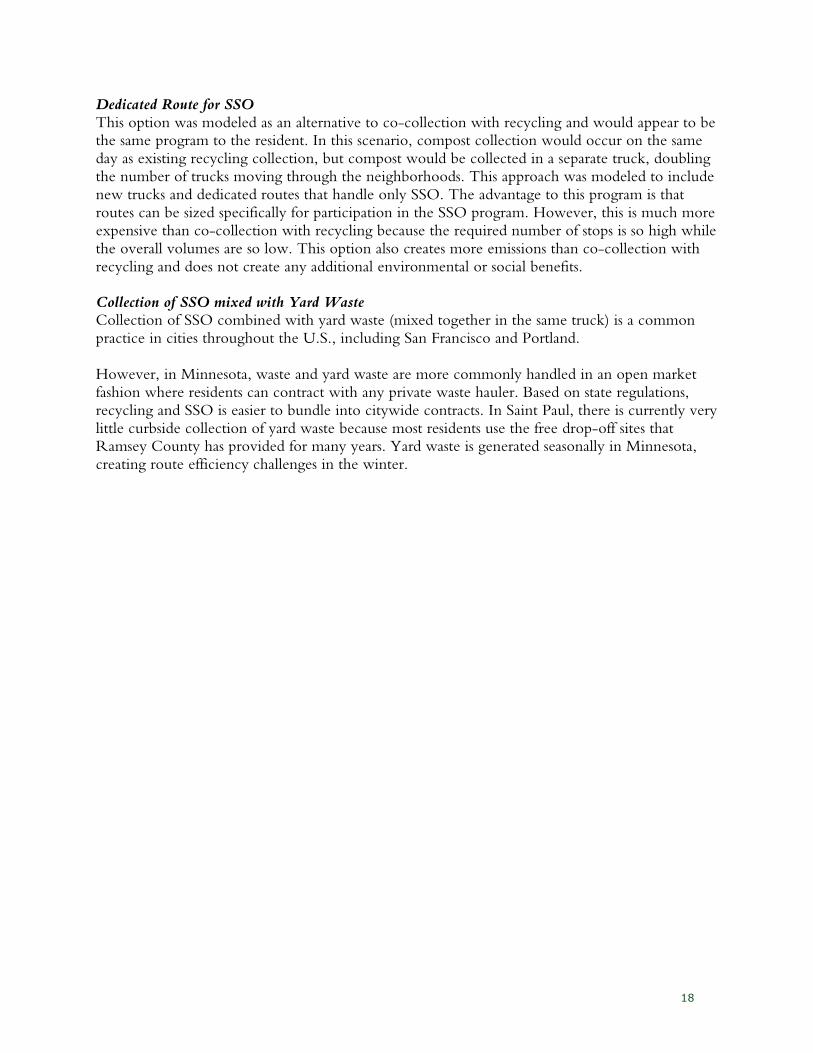
In areas near drop-offs or community gardens that have active composting operations, bike collection remains feasible, and is an option that is still worthy of consideration where there is strong community interest in this type of a composting program. Curbside Collection Of the three curbside collection options described below, only two were included in the triple bottom line analysis in the second part of this section, but all three options are discussed in this section. The analysis includes education costs, weekly collection, and provision of an indoor kitchen bin and a 13-gallon outdoor wheeled cart. Co-Collection with Recycling In this study, the co-collection option means combining a new composting program with an existing recycling program: retrofitting existing recycling trucks so that they can collect recycling and composting at the same time, in different compartments. This strategy creates much higher route efficiency and the lowest cost per household for this program. For this analysis, calculations were based on the assumption that the current fleet of diesel trucks used to collect recycling in Saint Paul was retrofitted to co-collect composting with recycling.
Compost Cart with Dual Stream Recycling Bins
Bike Collection Pilot
18
Dedicated Route for SSO This option was modeled as an alternative to co-collection with recycling and would appear to be the same program to the resident. In this scenario, compost collection would occur on the same day as existing recycling collection, but compost would be collected in a separate truck, doubling the number of trucks moving through the neighborhoods. This approach was modeled to include new trucks and dedicated routes that handle only SSO. The advantage to this program is that routes can be sized specifically for participation in the SSO program. However, this is much more expensive than co-collection with recycling because the required number of stops is so high while the overall volumes are so low. This option also creates more emissions than co-collection with recycling and does not create any additional environmental or social benefits. Collection of SSO mixed with Yard Waste Collection of SSO combined with yard waste (mixed together in the same truck) is a common practice in cities throughout the U.S., including San Francisco and Portland. However, in Minnesota, waste and yard waste are more commonly handled in an open market fashion where residents can contract with any private waste hauler. Based on state regulations, recycling and SSO is easier to bundle into citywide contracts. In Saint Paul, there is currently very little curbside collection of yard waste because most residents use the free drop-off sites that Ramsey County has provided for many years. Yard waste is generated seasonally in Minnesota, creating route efficiency challenges in the winter.
19
Data and Analysis of Collection and Prevention Methods The following sections provide a comparison of different collection methods using a triple bottom line analysis, as described in the methodology section. Financial Cost and tonnage data are represented in the figure below.
• Costs were calculated on a per-ton basis, including capital and operating expenses for each collection method.
• Tonnage was estimated on an annual basis, based on estimates for the initial years of a composting program in Saint Paul.
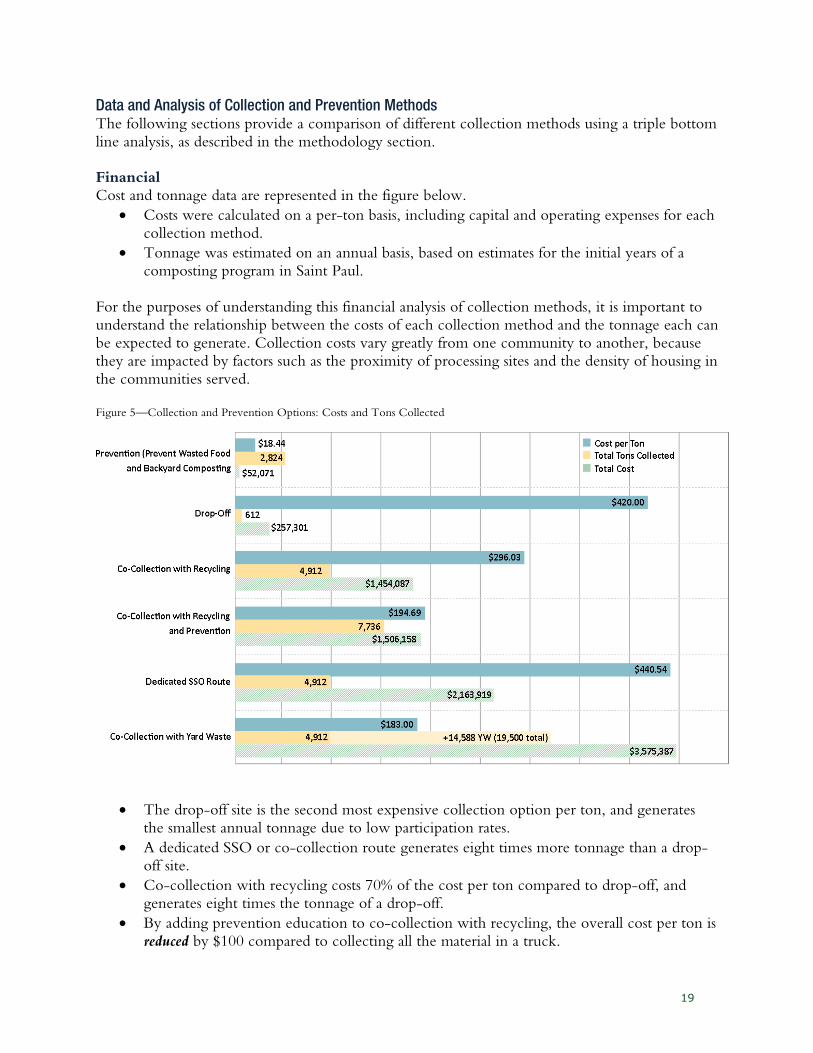
For the purposes of understanding this financial analysis of collection methods, it is important to understand the relationship between the costs of each collection method and the tonnage each can be expected to generate. Collection costs vary greatly from one community to another, because they are impacted by factors such as the proximity of processing sites and the density of housing in the communities served. Figure 5—Collection and Prevention Options: Costs and Tons Collected
• The drop-off site is the second most expensive collection option per ton, and generates the smallest annual tonnage due to low participation rates.
• A dedicated SSO or co-collection route generates eight times more tonnage than a drop-off site.
• Co-collection with recycling costs 70% of the cost per ton compared to drop-off, and generates eight times the tonnage of a drop-off.
• By adding prevention education to co-collection with recycling, the overall cost per ton is reduced by $100 compared to collecting all the material in a truck.
20
• Co-collection with yard waste is significantly more expensive than the other collection methods, because it requires handling the largest number of tons. For example, in Saint Paul, the estimated yard waste tonnage would be three times greater than the tonnage of SSO collected.
• The per-ton cost of prevention education (including both preventing wasted food and backyard composting) is 22 times less the cost of a drop-off per ton and 16 times less the cost of co-collection with recycling.
Financial Analysis As shown above, the most cost-effective way to manage food waste is to either prevent it from being wasted in the first place (preventing wasted food) or to teach residents to compost it on site (backyard composting). After prevention methods, the most cost-effective collection method is co-collection with recycling, which has the lowest cost of the three collection methods. When prevention education is added to co-collection with recycling, the cost per ton is $100 lower than co-collection with recycling on its own. A dedicated SSO route is the most expensive collection option when calculated on a per-ton basis, and a drop-off is only slightly less expensive per ton. A collection program for food waste and yard waste in Saint Paul would be more than twice as expensive for the City of Saint Paul as a program that co-collects compost with recycling. Environmental and Human Health One of the goals of this project is to represent the benefits of prevention—preventing wasted food and backyard composting—in comparison to the collection and processing of SSO. In order to best represent this in the LCA, information is presented as follows:
• The upstream benefits of preventing wasted food are included in this section and repeated in the environmental analysis of processing methods. This allows a clear demonstration of the value of including prevention education in a composting program, because every ton of food that is eaten rather than wasted creates dramatically more environmental benefit than if it were composted.
• The environmental benefits of processing compost in a backyard bin are included in the processing section. The tables in this section show the benefit of not needing to collect the material that is backyard composted by showing collection emissions as “zero,” providing a comparison to the emissions generated by other collection methods.
A comparison of the benefits of prevention to the benefits of collection and processing of SSO is presented in Table 12 on page 45.
LCA—Emissions Table 1 below shows life cycle environmental effects for the different methods that could be used to collect SSO from single-family households. Seven different environmental impacts were evaluated using the MebCalc
TM model (see page 5 for details). The emissions used to calculate the
estimates shown in Table 1 include emissions from extraction, refining and distribution of the petroleum diesel or natural gas. Emissions estimates come from Carnegie Mellon University (CMU) Green Design Institute’s economic input-output life cycle assessment (EIO-LCA) model
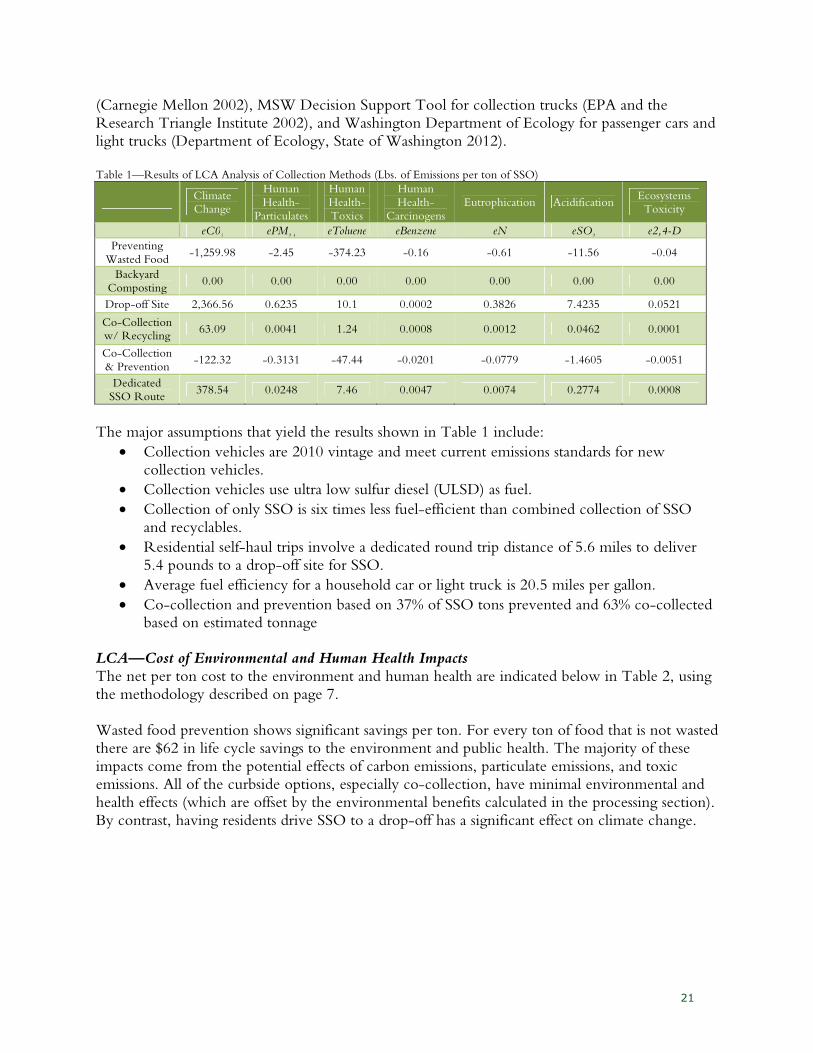
21
(Carnegie Mellon 2002), MSW Decision Support Tool for collection trucks (EPA and the Research Triangle Institute 2002), and Washington Department of Ecology for passenger cars and light trucks (Department of Ecology, State of Washington 2012). Table 1—Results of LCA Analysis of Collection Methods (Lbs. of Emissions per ton of SSO)
Climate Change
Human
Health-
Particulates
Human
Health-
Toxics
Human
Health-
Carcinogens
Eutrophication Acidification Ecosystems Toxicity
eC02 ePM
2.5 eToluene eBenzene eN eSO
2 e2,4-D
Preventing
Wasted Food -1,259.98 -2.45 -374.23 -0.16 -0.61 -11.56 -0.04
Backyard
Composting 0.00 0.00 0.00 0.00 0.00 0.00 0.00
Drop-off Site 2,366.56 0.6235 10.1 0.0002 0.3826 7.4235 0.0521
Co-Collection w/ Recycling
63.09 0.0041 1.24 0.0008 0.0012 0.0462 0.0001
Co-Collection
& Prevention -122.32 -0.3131 -47.44 -0.0201 -0.0779 -1.4605 -0.0051
Dedicated
SSO Route 378.54 0.0248 7.46 0.0047 0.0074 0.2774 0.0008
The major assumptions that yield the results shown in Table 1 include:
• Collection vehicles are 2010 vintage and meet current emissions standards for new collection vehicles.
• Collection vehicles use ultra low sulfur diesel (ULSD) as fuel.
• Collection of only SSO is six times less fuel-efficient than combined collection of SSO and recyclables.
• Residential self-haul trips involve a dedicated round trip distance of 5.6 miles to deliver 5.4 pounds to a drop-off site for SSO.
• Average fuel efficiency for a household car or light truck is 20.5 miles per gallon.
• Co-collection and prevention based on 37% of SSO tons prevented and 63% co-collected based on estimated tonnage
LCA—Cost of Environmental and Human Health Impacts The net per ton cost to the environment and human health are indicated below in Table 2, using the methodology described on page 7. Wasted food prevention shows significant savings per ton. For every ton of food that is not wasted there are $62 in life cycle savings to the environment and public health. The majority of these impacts come from the potential effects of carbon emissions, particulate emissions, and toxic emissions. All of the curbside options, especially co-collection, have minimal environmental and health effects (which are offset by the environmental benefits calculated in the processing section). By contrast, having residents drive SSO to a drop-off has a significant effect on climate change.
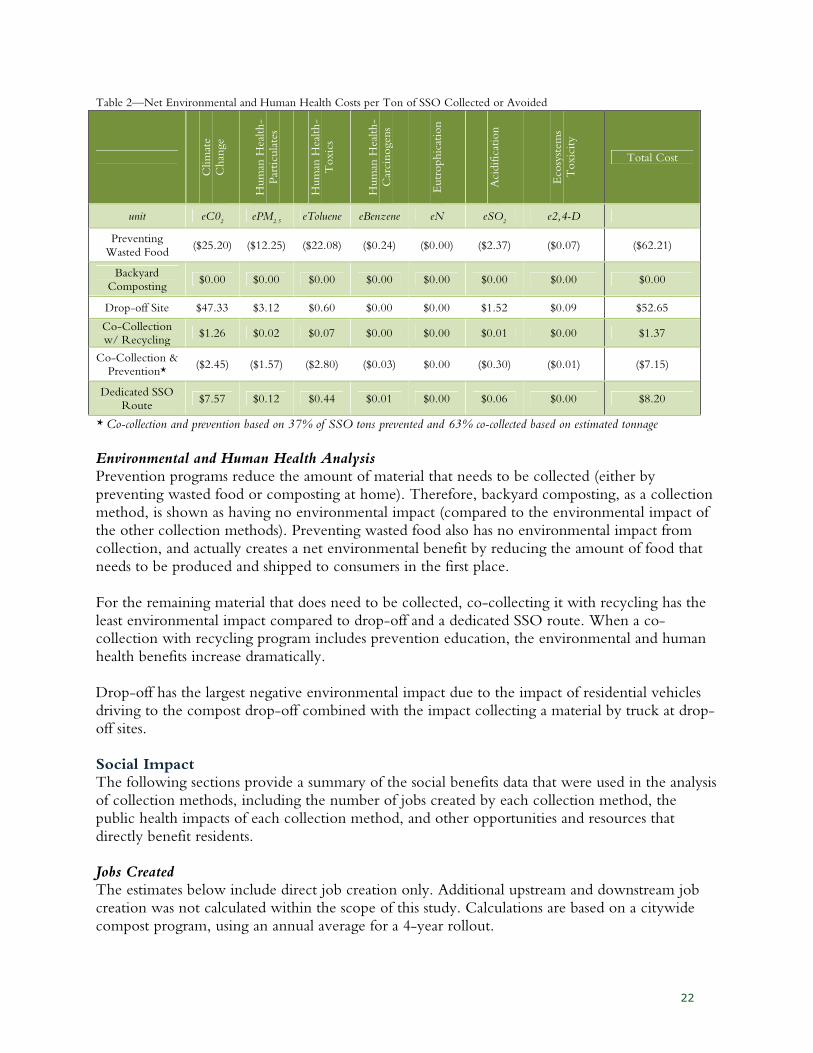
22
Table 2—Net Environmental and Human Health Costs per Ton of SSO Collected or Avoided
* Co-collection and prevention based on 37% of SSO tons prevented and 63% co-collected based on estimated tonnage
Environmental and Human Health Analysis Prevention programs reduce the amount of material that needs to be collected (either by preventing wasted food or composting at home). Therefore, backyard composting, as a collection method, is shown as having no environmental impact (compared to the environmental impact of the other collection methods). Preventing wasted food also has no environmental impact from collection, and actually creates a net environmental benefit by reducing the amount of food that needs to be produced and shipped to consumers in the first place. For the remaining material that does need to be collected, co-collecting it with recycling has the least environmental impact compared to drop-off and a dedicated SSO route. When a co-collection with recycling program includes prevention education, the environmental and human health benefits increase dramatically. Drop-off has the largest negative environmental impact due to the impact of residential vehicles driving to the compost drop-off combined with the impact collecting a material by truck at drop-off sites. Social Impact The following sections provide a summary of the social benefits data that were used in the analysis of collection methods, including the number of jobs created by each collection method, the public health impacts of each collection method, and other opportunities and resources that directly benefit residents. Jobs Created The estimates below include direct job creation only. Additional upstream and downstream job creation was not calculated within the scope of this study. Calculations are based on a citywide compost program, using an annual average for a 4-year rollout.
Clim
ate
Chan
ge
Hum
an H
ealth-
Par
ticu
late
s
Hum
an H
ealth-
Toxic
s
Hum
an H
ealth-
Car
cinogen
s
Eutr
ophic
atio
n
Aci
dific
atio
n
Eco
syst
ems
Toxic
ity
Total Cost
unit eC02 ePM
2.5 eToluene eBenzene eN eSO
2 e2,4-D
Preventing
Wasted Food ($25.20) ($12.25) ($22.08) ($0.24) ($0.00) ($2.37) ($0.07) ($62.21)
Backyard
Composting $0.00 $0.00 $0.00 $0.00 $0.00 $0.00 $0.00 $0.00
Drop-off Site $47.33 $3.12 $0.60 $0.00 $0.00 $1.52 $0.09 $52.65
Co-Collection w/ Recycling
$1.26 $0.02 $0.07 $0.00 $0.00 $0.01 $0.00 $1.37
Co-Collection & Prevention*
($2.45) ($1.57) ($2.80) ($0.03) $0.00 ($0.30) ($0.01) ($7.15)
Dedicated SSO
Route $7.57 $0.12 $0.44 $0.01 $0.00 $0.06 $0.00 $8.20
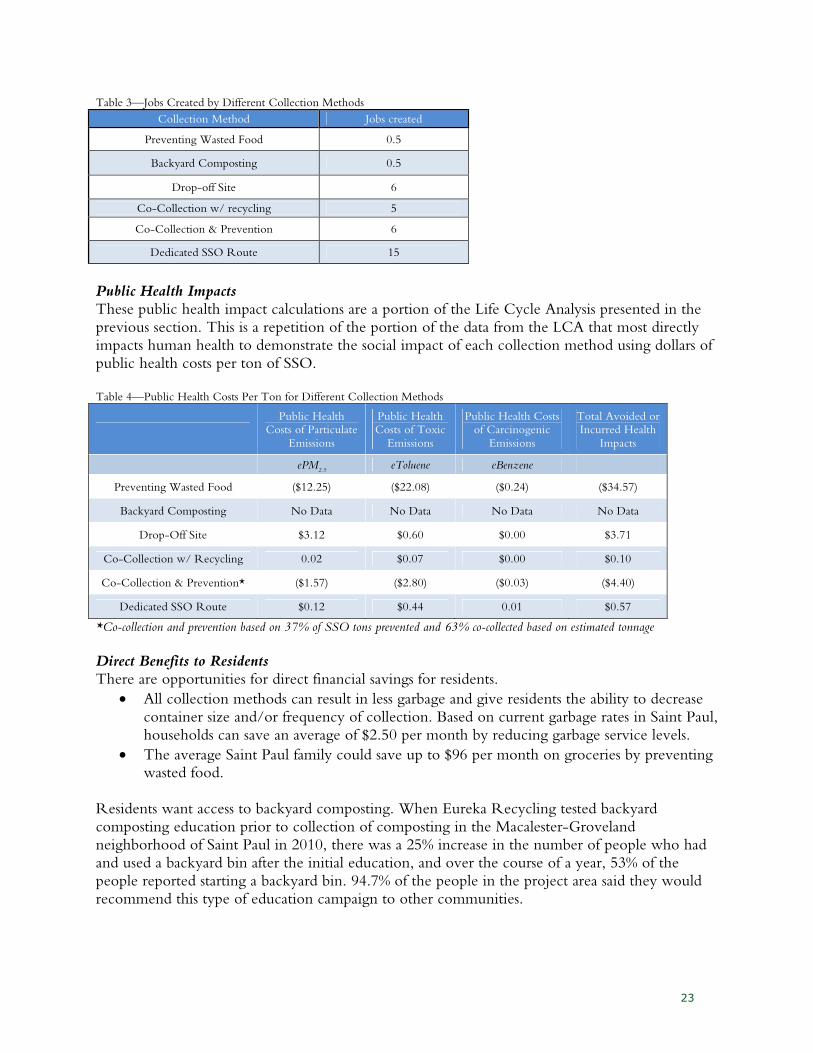
23
Table 3—Jobs Created by Different Collection Methods
Collection Method Jobs created
Preventing Wasted Food 0.5
Backyard Composting 0.5
Drop-off Site 6
Co-Collection w/ recycling 5
Co-Collection & Prevention 6
Dedicated SSO Route 15
Public Health Impacts These public health impact calculations are a portion of the Life Cycle Analysis presented in the previous section. This is a repetition of the portion of the data from the LCA that most directly impacts human health to demonstrate the social impact of each collection method using dollars of public health costs per ton of SSO. Table 4—Public Health Costs Per Ton for Different Collection Methods
Public Health
Costs of Particulate
Emissions
Public Health Costs of Toxic
Emissions
Public Health Costs of Carcinogenic
Emissions
Total Avoided or Incurred Health
Impacts
ePM2.5
eToluene eBenzene
Preventing Wasted Food ($12.25) ($22.08) ($0.24) ($34.57)
Backyard Composting No Data No Data No Data No Data
Drop-Off Site $3.12 $0.60 $0.00 $3.71
Co-Collection w/ Recycling 0.02 $0.07 $0.00 $0.10
Co-Collection & Prevention* ($1.57) ($2.80) ($0.03) ($4.40)
Dedicated SSO Route $0.12 $0.44 0.01 $0.57
*Co-collection and prevention based on 37% of SSO tons prevented and 63% co-collected based on estimated tonnage
Direct Benefits to Residents There are opportunities for direct financial savings for residents.
• All collection methods can result in less garbage and give residents the ability to decrease container size and/or frequency of collection. Based on current garbage rates in Saint Paul, households can save an average of $2.50 per month by reducing garbage service levels.
• The average Saint Paul family could save up to $96 per month on groceries by preventing wasted food.
Residents want access to backyard composting. When Eureka Recycling tested backyard composting education prior to collection of composting in the Macalester-Groveland neighborhood of Saint Paul in 2010, there was a 25% increase in the number of people who had and used a backyard bin after the initial education, and over the course of a year, 53% of the people reported starting a backyard bin. 94.7% of the people in the project area said they would recommend this type of education campaign to other communities.
24
As many compost collection programs around the country have found, a kitchen pail and a small supply of compostable bags are essential to getting people started and to their continued participation. In Eureka Recycling’s pilot, 65% of participants said they would not have participated in the composting collection portion of the pilot without a kitchen pail, and 61% said the same about bags.
Social Impact Analysis Diversion through wasted food prevention and backyard composting education creates a greater social benefit than any collection method. These prevention programs provide community members with practical tools to help them save money while reducing the amount of material that needs to be collected, including all of the human health costs of collection. Co-collection of SSO and recycling has the least environmental health impacts per ton. Co-collection doesn’t generate as many jobs as a dedicated route (because fewer trucks are needed) but costs less to implement. Both a dedicated SSO route and a drop-off generate significant health costs due to the emissions generated from the transportation of compost. A dedicated SSO route puts more trucks on the road than any other method, and a drop-off requires individual residents to drive compostable materials from their homes to the drop-off location.
25
Collection and Prevention Findings Prevention is a critical strategy in achieving the greatest financial, environmental, and social benefit of a composting program.
• Prevention and backyard composting provide the largest environmental gains because no transportation is necessary. Food waste prevention results in a net positive environmental impact due to the upstream benefits of not producing or transporting food in the first place.
• Prevention is by far the most cost-effective way to address food waste. This can have a signficant impact when combined with another collection method. For instance, by adding a prevention program to co-collection with recycling, the overall per ton collection cost decreases by more than $100/ton compared to collecting all the material on a truck.
• The average Saint Paul family could save up to $96 per month on groceries by preventing wasted food.
Co-collection of composting with recycling achieves the greatest balance of economic, social, and environmental impacts, based on the estimated tonnage and conditions of the City of Saint Paul.
• Co-collection allows Saint Paul to add composting to the existing recycling program without significantly increasing the number of trucks on the road. This means that composting collection can be added without increasing the amount of noise and air pollution experienced by residents, or the amount of wear and tear on city streets.
• Co-collection of SSO has the least environmental health impacts per ton. Both a dedicated SSO route and a drop-off program result in significant health costs due to the emissions generated from the transportation of compost. A dedicated SSO route puts more trucks on the road than any other method, and a drop-off program requires individual residents to drive compostable materials from their homes to the drop-off location.
• Collection of only SSO has six times greater environmental and human health costs than co-collection of SSO with other materials.
• Significant savings result from the co-collection of recycling compared to dedicated routes or drop-offs. Both per-ton fees and generation rates must be factored into the financial impact of a program. For instance, while co-collection with yard waste has a slightly lower per-ton cost then co-collection with recycling, the additional amount of yard waste collected more than doubles the total collection cost.
Drop-off sites are much more expensive than most curbside collection options on a per-ton basis. On their own, they are not the most cost-effective or environmentally beneficial long-term composting solution.
• Self-haul trips to a drop-off average a dedicated round trip distance of 5.6 miles to deliver 5.4 pounds SSO. This results in the highest per ton environmental and health costs from transportation emissions.
• Drop-offs are the second most expensive collection option on a per-ton basis. However, drop-off sites may still provide a good interim strategy to provide instant, citywide access to composting while curbside collection is being rolled out. This is especially relevant to serve people who live in apartments, because this gives program organizers a chance to roll out the single-family program before addressing the unique challenges of apartment-building composting. Alternatively, if an existing recycling drop-off center exists, SSO could be added.
26
Processing
Processing Options This is an overview of the six options that were identified for the processing of residential SSO.
Aerobic Composting Methods Aerobic composting is the process of rapidly degrading organic materials via microbial decomposition, which require oxygen to survive. The bacteria and microorganisms also desire a particular balance between two elements: carbon and nitrogen. The initial carbon to nitrogen ratio (C:N) has been determined to be optimal in the range of 25-30 parts carbon to 1 part nitrogen (25-30:1). The optimal ratio shifts slightly with the type of composting chosen (in-vessel, windrow, aerated static pile), but is generally in this range. A C:N ratio too rich in carbon (high) will result in slowed decomposition; a C:N ratio too rich in nitrogen (low) will have a higher propensity of ‘going anaerobic’ (generating methane and odors) and producing ammonia. In general, “browns” are organic materials with high levels of carbon and “greens” are organic materials with high levels of nitrogen. In addition to the C:N ratio, it is important to have some larger bulking agents (typically, larger pieces of carbon) in order to help aerate the compost. Some common bulking materials are wood chips, straw, and branches, which also contribute to the carbon content of the compost. Composting is usually done in a rural area due to the large area requirements and the potential for odor issues. However, in-vessel and AD technologies do allow for a smaller footprint and enclosed active composting or digestion operation, making urban composting a possibility. One obstacle to urban compost processing is potential odors from the incoming SSO. An enclosed receiving area with active filtering of the air through a bio filter can help manage odors. Though the different technologies illustrated in this report require customized site plans, there are a number of design elements that are needed for all compost sites. Compost sites in Minnesota must incorporate perimeter fencing, water and electric service connections, site preparation and excavation, an engineered, sloped pad, and drainage to a storm water collection pond.
Aerobic composting methods include mixing feedstock with a carbon source (such as brush or woodchips) and managing it as it decomposes into nutrient rich soil.
• Windrows
• Aerated static pile
• Covered aerated static pile
• In-vessel composting Anaerobic digestion (AD) processes take feedstock and manage it in a system without the presence of oxygen; this encourages the production of methane and other biogases which can be burned for energy. After the biogases have been collected, the end product (called digestate) can be mixed with a carbon source and composted.
• Wet anaerobic digestion
• Dry anaerobic digestion
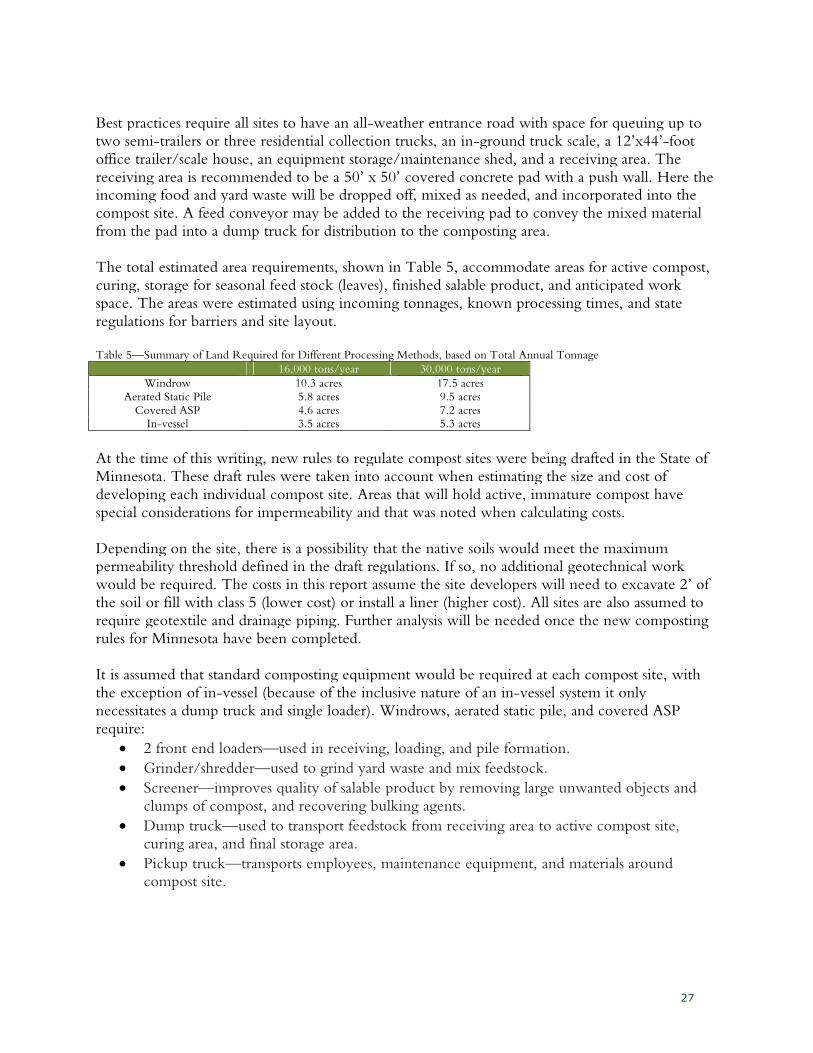
27
Best practices require all sites to have an all-weather entrance road with space for queuing up to two semi-trailers or three residential collection trucks, an in-ground truck scale, a 12’x44’-foot office trailer/scale house, an equipment storage/maintenance shed, and a receiving area. The receiving area is recommended to be a 50’ x 50’ covered concrete pad with a push wall. Here the incoming food and yard waste will be dropped off, mixed as needed, and incorporated into the compost site. A feed conveyor may be added to the receiving pad to convey the mixed material from the pad into a dump truck for distribution to the composting area. The total estimated area requirements, shown in Table 5, accommodate areas for active compost, curing, storage for seasonal feed stock (leaves), finished salable product, and anticipated work space. The areas were estimated using incoming tonnages, known processing times, and state regulations for barriers and site layout. Table 5—Summary of Land Required for Different Processing Methods, based on Total Annual Tonnage
16,000 tons/year 30,000 tons/year
Windrow 10.3 acres 17.5 acres
Aerated Static Pile 5.8 acres 9.5 acres
Covered ASP 4.6 acres 7.2 acres In-vessel 3.5 acres 5.3 acres
At the time of this writing, new rules to regulate compost sites were being drafted in the State of Minnesota. These draft rules were taken into account when estimating the size and cost of developing each individual compost site. Areas that will hold active, immature compost have special considerations for impermeability and that was noted when calculating costs. Depending on the site, there is a possibility that the native soils would meet the maximum permeability threshold defined in the draft regulations. If so, no additional geotechnical work would be required. The costs in this report assume the site developers will need to excavate 2’ of the soil or fill with class 5 (lower cost) or install a liner (higher cost). All sites are also assumed to require geotextile and drainage piping. Further analysis will be needed once the new composting rules for Minnesota have been completed. It is assumed that standard composting equipment would be required at each compost site, with the exception of in-vessel (because of the inclusive nature of an in-vessel system it only necessitates a dump truck and single loader). Windrows, aerated static pile, and covered ASP require:
• 2 front end loaders—used in receiving, loading, and pile formation.
• Grinder/shredder—used to grind yard waste and mix feedstock.
• Screener—improves quality of salable product by removing large unwanted objects and clumps of compost, and recovering bulking agents.
• Dump truck—used to transport feedstock from receiving area to active compost site, curing area, and final storage area.
• Pickup truck—transports employees, maintenance equipment, and materials around compost site.
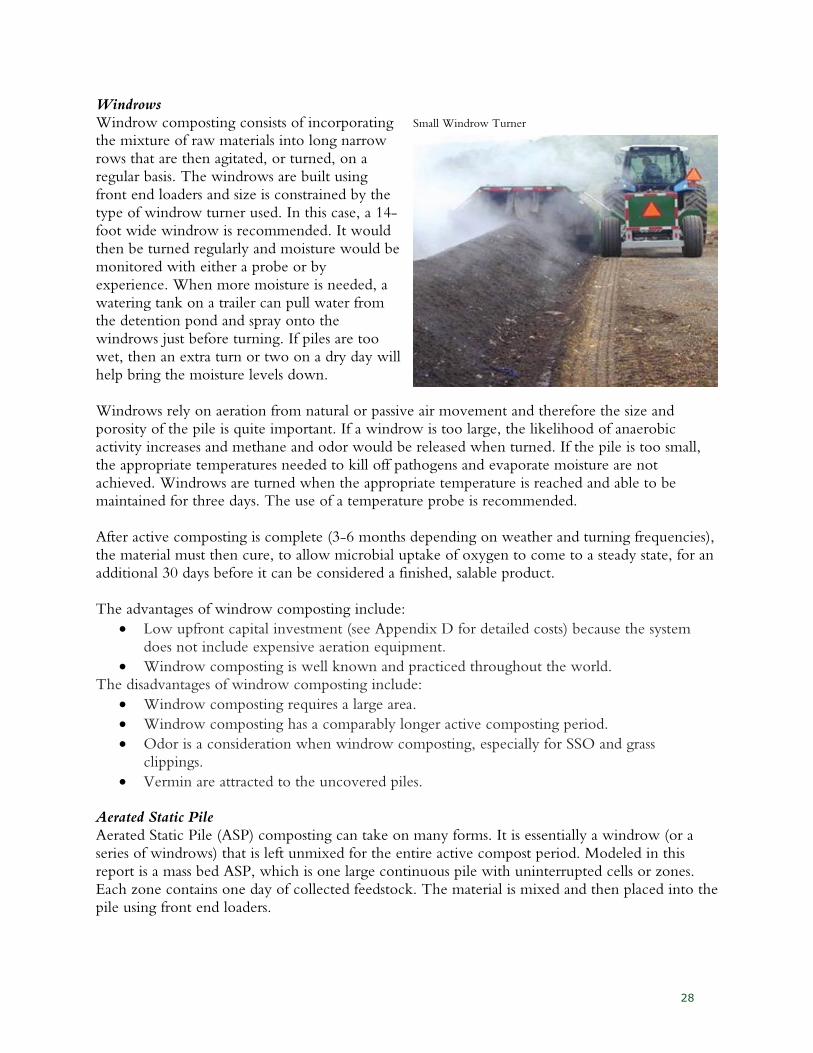
28
Windrows Windrow composting consists of incorporating the mixture of raw materials into long narrow rows that are then agitated, or turned, on a regular basis. The windrows are built using front end loaders and size is constrained by the type of windrow turner used. In this case, a 14-foot wide windrow is recommended. It would then be turned regularly and moisture would be monitored with either a probe or by experience. When more moisture is needed, a watering tank on a trailer can pull water from the detention pond and spray onto the windrows just before turning. If piles are too wet, then an extra turn or two on a dry day will help bring the moisture levels down. Windrows rely on aeration from natural or passive air movement and therefore the size and porosity of the pile is quite important. If a windrow is too large, the likelihood of anaerobic activity increases and methane and odor would be released when turned. If the pile is too small, the appropriate temperatures needed to kill off pathogens and evaporate moisture are not achieved. Windrows are turned when the appropriate temperature is reached and able to be maintained for three days. The use of a temperature probe is recommended. After active composting is complete (3-6 months depending on weather and turning frequencies), the material must then cure, to allow microbial uptake of oxygen to come to a steady state, for an additional 30 days before it can be considered a finished, salable product. The advantages of windrow composting include:
• Low upfront capital investment (see Appendix D for detailed costs) because the system does not include expensive aeration equipment.
• Windrow composting is well known and practiced throughout the world. The disadvantages of windrow composting include:
• Windrow composting requires a large area.
• Windrow composting has a comparably longer active composting period.
• Odor is a consideration when windrow composting, especially for SSO and grass clippings.
• Vermin are attracted to the uncovered piles.
Aerated Static Pile Aerated Static Pile (ASP) composting can take on many forms. It is essentially a windrow (or a series of windrows) that is left unmixed for the entire active compost period. Modeled in this report is a mass bed ASP, which is one large continuous pile with uninterrupted cells or zones. Each zone contains one day of collected feedstock. The material is mixed and then placed into the pile using front end loaders.
Small Windrow Turner
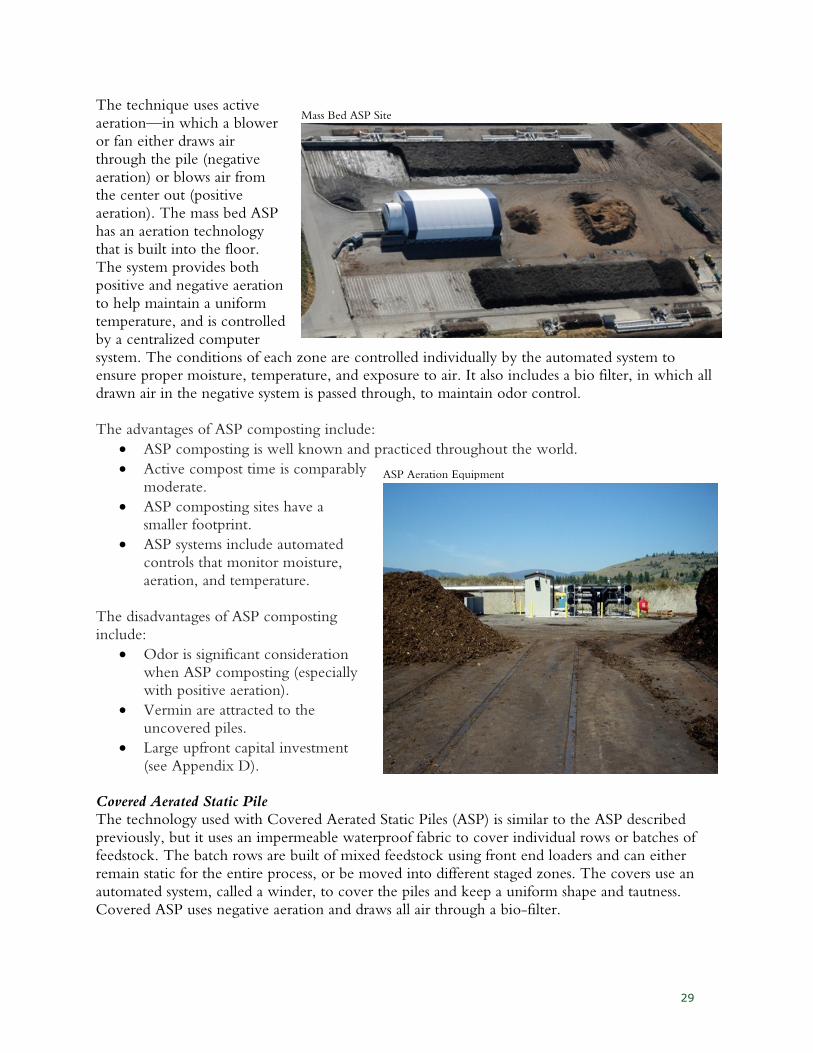
29
The technique uses active aeration—in which a blower or fan either draws air through the pile (negative aeration) or blows air from the center out (positive aeration). The mass bed ASP has an aeration technology that is built into the floor. The system provides both positive and negative aeration to help maintain a uniform temperature, and is controlled by a centralized computer system. The conditions of each zone are controlled individually by the automated system to ensure proper moisture, temperature, and exposure to air. It also includes a bio filter, in which all drawn air in the negative system is passed through, to maintain odor control. The advantages of ASP composting include:
• ASP composting is well known and practiced throughout the world.
• Active compost time is comparably moderate.
• ASP composting sites have a smaller footprint.
• ASP systems include automated controls that monitor moisture, aeration, and temperature.
The disadvantages of ASP composting include:
• Odor is significant consideration when ASP composting (especially with positive aeration).
• Vermin are attracted to the uncovered piles.
• Large upfront capital investment (see Appendix D).
Covered Aerated Static Pile The technology used with Covered Aerated Static Piles (ASP) is similar to the ASP described previously, but it uses an impermeable waterproof fabric to cover individual rows or batches of feedstock. The batch rows are built of mixed feedstock using front end loaders and can either remain static for the entire process, or be moved into different staged zones. The covers use an automated system, called a winder, to cover the piles and keep a uniform shape and tautness. Covered ASP uses negative aeration and draws all air through a bio-filter.
Mass Bed ASP Site
ASP Aeration Equipment
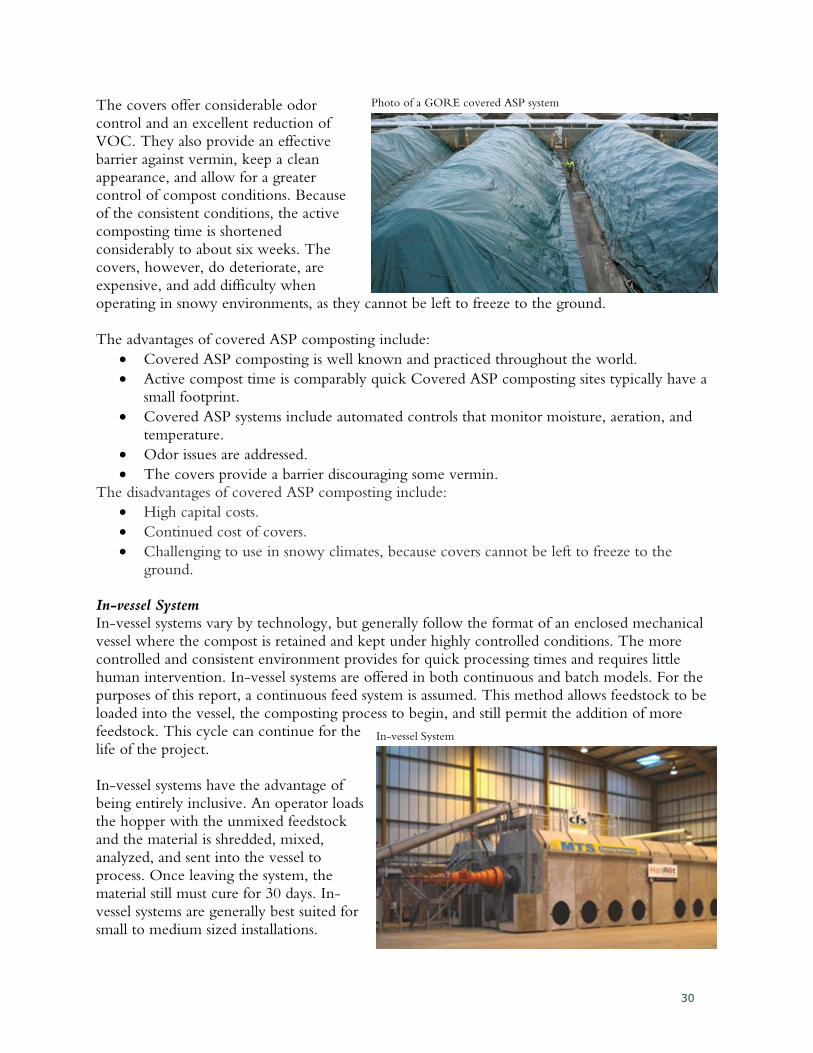
30
The covers offer considerable odor control and an excellent reduction of VOC. They also provide an effective barrier against vermin, keep a clean appearance, and allow for a greater control of compost conditions. Because of the consistent conditions, the active composting time is shortened considerably to about six weeks. The covers, however, do deteriorate, are expensive, and add difficulty when operating in snowy environments, as they cannot be left to freeze to the ground. The advantages of covered ASP composting include:
• Covered ASP composting is well known and practiced throughout the world.
• Active compost time is comparably quick Covered ASP composting sites typically have a small footprint.
• Covered ASP systems include automated controls that monitor moisture, aeration, and temperature.
• Odor issues are addressed.
• The covers provide a barrier discouraging some vermin. The disadvantages of covered ASP composting include:
• High capital costs.
• Continued cost of covers.
• Challenging to use in snowy climates, because covers cannot be left to freeze to the ground.
In-vessel System In-vessel systems vary by technology, but generally follow the format of an enclosed mechanical vessel where the compost is retained and kept under highly controlled conditions. The more controlled and consistent environment provides for quick processing times and requires little human intervention. In-vessel systems are offered in both continuous and batch models. For the purposes of this report, a continuous feed system is assumed. This method allows feedstock to be loaded into the vessel, the composting process to begin, and still permit the addition of more feedstock. This cycle can continue for the life of the project. In-vessel systems have the advantage of being entirely inclusive. An operator loads the hopper with the unmixed feedstock and the material is shredded, mixed, analyzed, and sent into the vessel to process. Once leaving the system, the material still must cure for 30 days. In-vessel systems are generally best suited for small to medium sized installations.
In-vessel System
Photo of a GORE covered ASP system
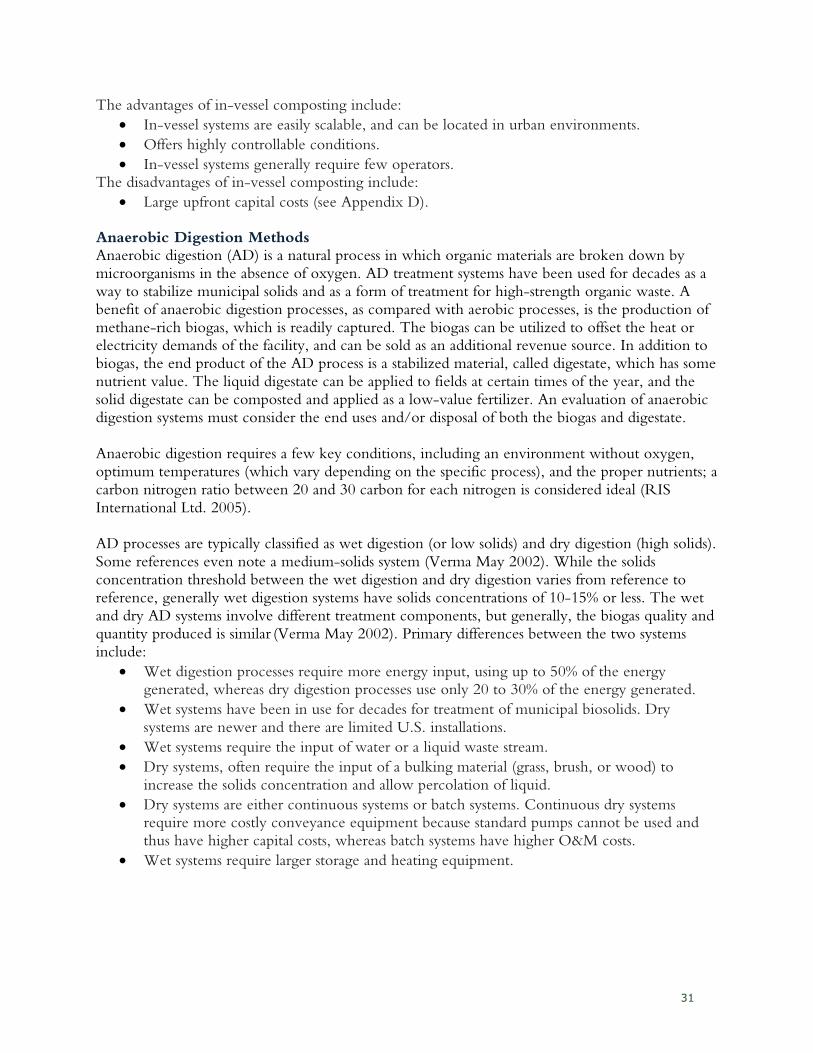
31
The advantages of in-vessel composting include:
• In-vessel systems are easily scalable, and can be located in urban environments.
• Offers highly controllable conditions.
• In-vessel systems generally require few operators. The disadvantages of in-vessel composting include:
• Large upfront capital costs (see Appendix D). Anaerobic Digestion Methods Anaerobic digestion (AD) is a natural process in which organic materials are broken down by microorganisms in the absence of oxygen. AD treatment systems have been used for decades as a way to stabilize municipal solids and as a form of treatment for high-strength organic waste. A benefit of anaerobic digestion processes, as compared with aerobic processes, is the production of methane-rich biogas, which is readily captured. The biogas can be utilized to offset the heat or electricity demands of the facility, and can be sold as an additional revenue source. In addition to biogas, the end product of the AD process is a stabilized material, called digestate, which has some nutrient value. The liquid digestate can be applied to fields at certain times of the year, and the solid digestate can be composted and applied as a low-value fertilizer. An evaluation of anaerobic digestion systems must consider the end uses and/or disposal of both the biogas and digestate. Anaerobic digestion requires a few key conditions, including an environment without oxygen, optimum temperatures (which vary depending on the specific process), and the proper nutrients; a carbon nitrogen ratio between 20 and 30 carbon for each nitrogen is considered ideal (RIS International Ltd. 2005). AD processes are typically classified as wet digestion (or low solids) and dry digestion (high solids). Some references even note a medium-solids system (Verma May 2002). While the solids concentration threshold between the wet digestion and dry digestion varies from reference to reference, generally wet digestion systems have solids concentrations of 10-15% or less. The wet and dry AD systems involve different treatment components, but generally, the biogas quality and quantity produced is similar
(Verma May 2002). Primary differences between the two systems
include:
• Wet digestion processes require more energy input, using up to 50% of the energy generated, whereas dry digestion processes use only 20 to 30% of the energy generated.
• Wet systems have been in use for decades for treatment of municipal biosolids. Dry systems are newer and there are limited U.S. installations.
• Wet systems require the input of water or a liquid waste stream.
• Dry systems, often require the input of a bulking material (grass, brush, or wood) to increase the solids concentration and allow percolation of liquid.
• Dry systems are either continuous systems or batch systems. Continuous dry systems require more costly conveyance equipment because standard pumps cannot be used and thus have higher capital costs, whereas batch systems have higher O&M costs.
• Wet systems require larger storage and heating equipment.
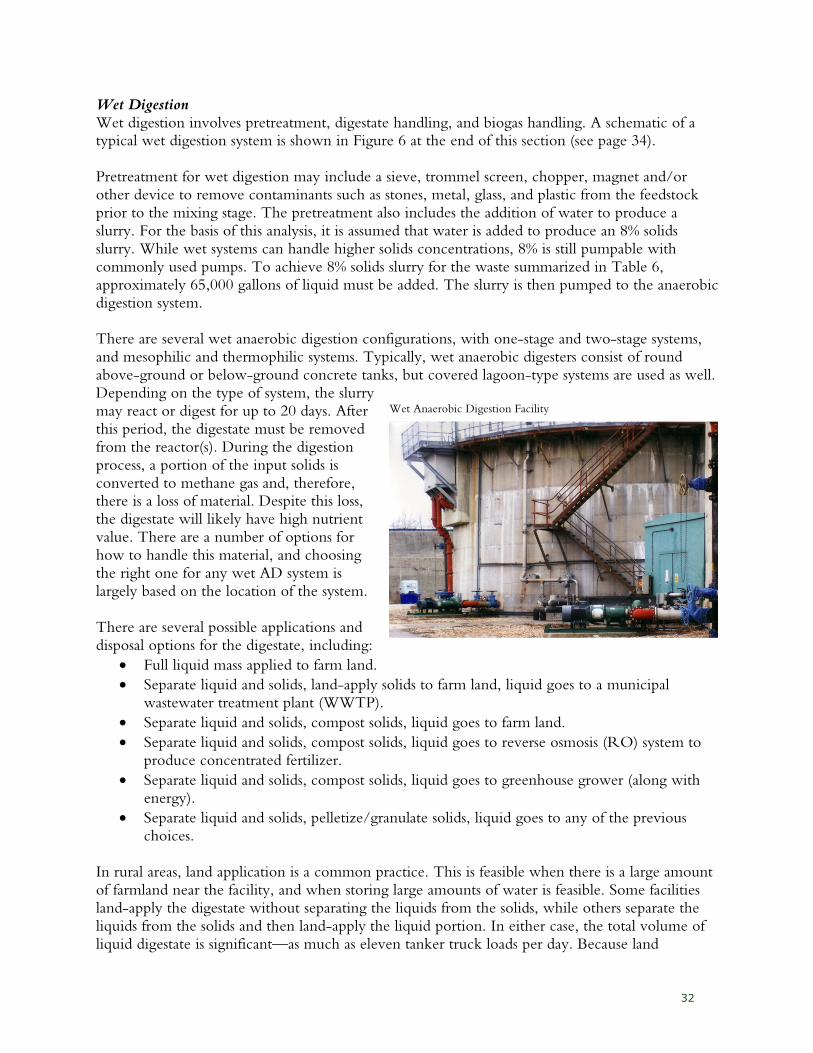
32
Wet Digestion Wet digestion involves pretreatment, digestate handling, and biogas handling. A schematic of a typical wet digestion system is shown in Figure 6 at the end of this section (see page 34). Pretreatment for wet digestion may include a sieve, trommel screen, chopper, magnet and/or other device to remove contaminants such as stones, metal, glass, and plastic from the feedstock prior to the mixing stage. The pretreatment also includes the addition of water to produce a slurry. For the basis of this analysis, it is assumed that water is added to produce an 8% solids slurry. While wet systems can handle higher solids concentrations, 8% is still pumpable with commonly used pumps. To achieve 8% solids slurry for the waste summarized in Table 6, approximately 65,000 gallons of liquid must be added. The slurry is then pumped to the anaerobic digestion system. There are several wet anaerobic digestion configurations, with one-stage and two-stage systems, and mesophilic and thermophilic systems. Typically, wet anaerobic digesters consist of round above-ground or below-ground concrete tanks, but covered lagoon-type systems are used as well. Depending on the type of system, the slurry may react or digest for up to 20 days. After this period, the digestate must be removed from the reactor(s). During the digestion process, a portion of the input solids is converted to methane gas and, therefore, there is a loss of material. Despite this loss, the digestate will likely have high nutrient value. There are a number of options for how to handle this material, and choosing the right one for any wet AD system is largely based on the location of the system. There are several possible applications and disposal options for the digestate, including:
• Full liquid mass applied to farm land.
• Separate liquid and solids, land-apply solids to farm land, liquid goes to a municipal wastewater treatment plant (WWTP).
• Separate liquid and solids, compost solids, liquid goes to farm land.
• Separate liquid and solids, compost solids, liquid goes to reverse osmosis (RO) system to produce concentrated fertilizer.
• Separate liquid and solids, compost solids, liquid goes to greenhouse grower (along with energy).
• Separate liquid and solids, pelletize/granulate solids, liquid goes to any of the previous choices.
In rural areas, land application is a common practice. This is feasible when there is a large amount of farmland near the facility, and when storing large amounts of water is feasible. Some facilities land-apply the digestate without separating the liquids from the solids, while others separate the liquids from the solids and then land-apply the liquid portion. In either case, the total volume of liquid digestate is significant—as much as eleven tanker truck loads per day. Because land
Wet Anaerobic Digestion Facility
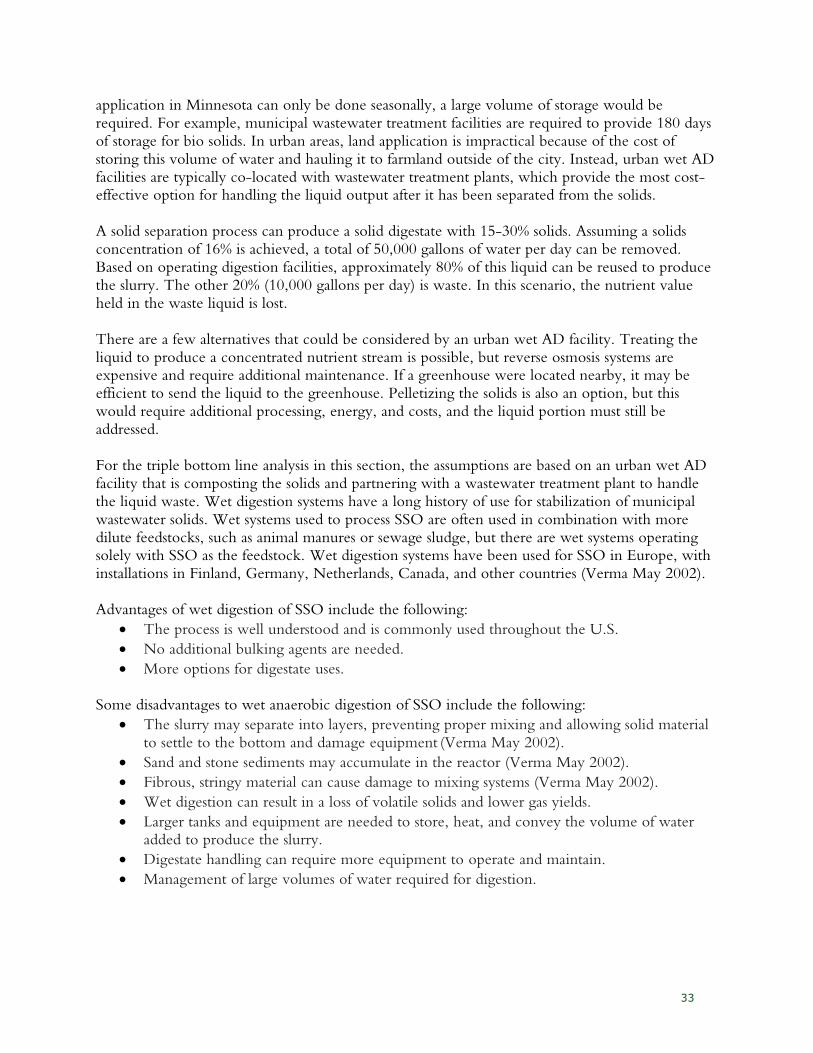
33
application in Minnesota can only be done seasonally, a large volume of storage would be required. For example, municipal wastewater treatment facilities are required to provide 180 days of storage for bio solids. In urban areas, land application is impractical because of the cost of storing this volume of water and hauling it to farmland outside of the city. Instead, urban wet AD facilities are typically co-located with wastewater treatment plants, which provide the most cost-effective option for handling the liquid output after it has been separated from the solids. A solid separation process can produce a solid digestate with 15-30% solids. Assuming a solids concentration of 16% is achieved, a total of 50,000 gallons of water per day can be removed. Based on operating digestion facilities, approximately 80% of this liquid can be reused to produce the slurry. The other 20% (10,000 gallons per day) is waste. In this scenario, the nutrient value held in the waste liquid is lost. There are a few alternatives that could be considered by an urban wet AD facility. Treating the liquid to produce a concentrated nutrient stream is possible, but reverse osmosis systems are expensive and require additional maintenance. If a greenhouse were located nearby, it may be efficient to send the liquid to the greenhouse. Pelletizing the solids is also an option, but this would require additional processing, energy, and costs, and the liquid portion must still be addressed. For the triple bottom line analysis in this section, the assumptions are based on an urban wet AD facility that is composting the solids and partnering with a wastewater treatment plant to handle the liquid waste. Wet digestion systems have a long history of use for stabilization of municipal wastewater solids. Wet systems used to process SSO are often used in combination with more dilute feedstocks, such as animal manures or sewage sludge, but there are wet systems operating solely with SSO as the feedstock. Wet digestion systems have been used for SSO in Europe, with installations in Finland, Germany, Netherlands, Canada, and other countries (Verma May 2002). Advantages of wet digestion of SSO include the following:
• The process is well understood and is commonly used throughout the U.S.
• No additional bulking agents are needed.
• More options for digestate uses. Some disadvantages to wet anaerobic digestion of SSO include the following:
• The slurry may separate into layers, preventing proper mixing and allowing solid material to settle to the bottom and damage equipment
(Verma May 2002).
• Sand and stone sediments may accumulate in the reactor (Verma May 2002).
• Fibrous, stringy material can cause damage to mixing systems (Verma May 2002).
• Wet digestion can result in a loss of volatile solids and lower gas yields.
• Larger tanks and equipment are needed to store, heat, and convey the volume of water added to produce the slurry.
• Digestate handling can require more equipment to operate and maintain.
• Management of large volumes of water required for digestion.
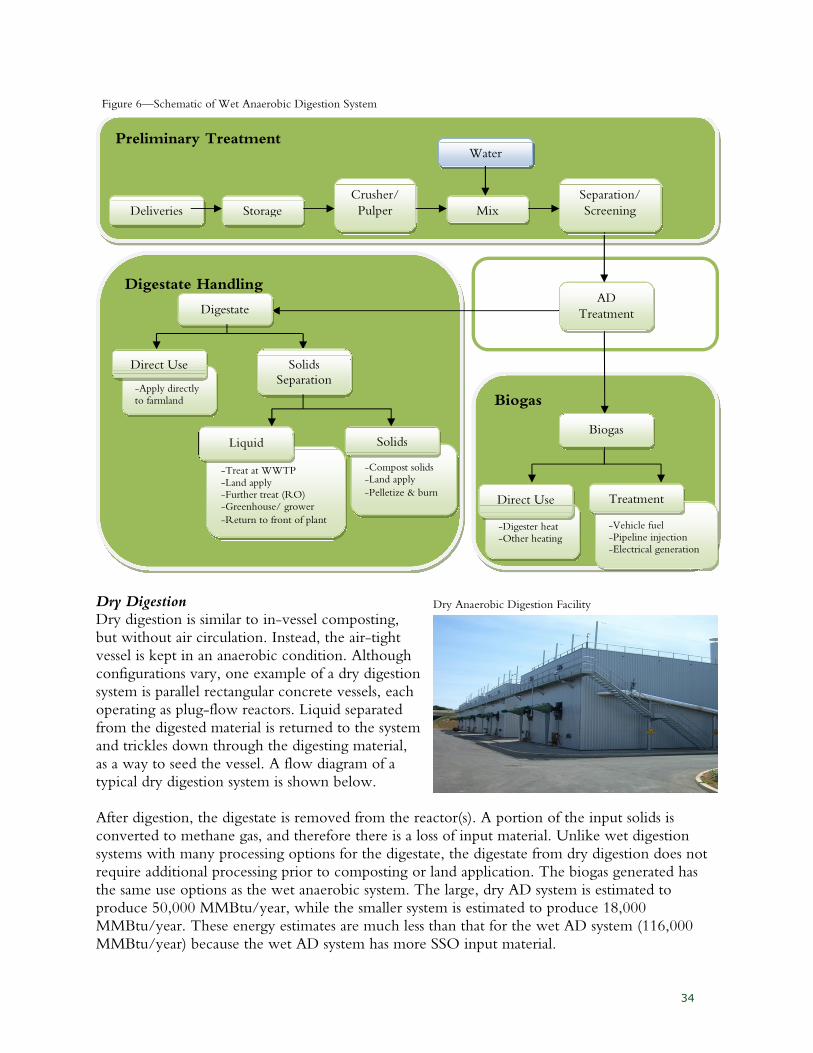
34
Digestate Handling
Preliminary Treatment
Biogas
Figure 6—Schematic of Wet Anaerobic Digestion System
Biogas
-Digester heat -Other heating
Direct Use
-Vehicle fuel -Pipeline injection -Electrical generation
Treatment
AD
Treatment Digestate
Solids
Separation -Apply directly to farmland
Direct Use
-Treat at WWTP
-Land apply -Further treat (RO) -Greenhouse/ grower
-Return to front of plant
-Compost solids -Land apply
-Pelletize & burn
Solids Liquid
Deliveries Storage
Crusher/
Pulper Mix
Separation/
Screening
Water
Dry Digestion Dry digestion is similar to in-vessel composting, but without air circulation. Instead, the air-tight vessel is kept in an anaerobic condition. Although configurations vary, one example of a dry digestion system is parallel rectangular concrete vessels, each operating as plug-flow reactors. Liquid separated from the digested material is returned to the system and trickles down through the digesting material, as a way to seed the vessel. A flow diagram of a typical dry digestion system is shown below. After digestion, the digestate is removed from the reactor(s). A portion of the input solids is converted to methane gas, and therefore there is a loss of input material. Unlike wet digestion systems with many processing options for the digestate, the digestate from dry digestion does not require additional processing prior to composting or land application. The biogas generated has the same use options as the wet anaerobic system. The large, dry AD system is estimated to produce 50,000 MMBtu/year, while the smaller system is estimated to produce 18,000 MMBtu/year. These energy estimates are much less than that for the wet AD system (116,000 MMBtu/year) because the wet AD system has more SSO input material.
Dry Anaerobic Digestion Facility
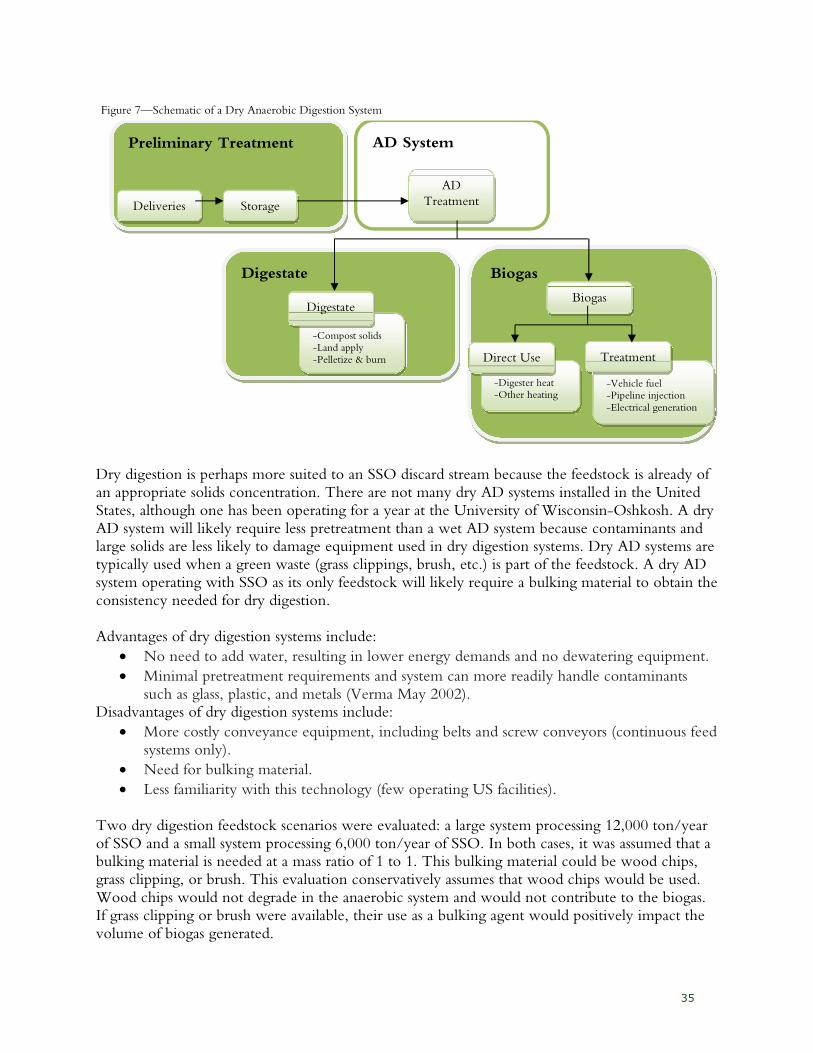
35
Dry digestion is perhaps more suited to an SSO discard stream because the feedstock is already of an appropriate solids concentration. There are not many dry AD systems installed in the United States, although one has been operating for a year at the University of Wisconsin-Oshkosh. A dry AD system will likely require less pretreatment than a wet AD system because contaminants and large solids are less likely to damage equipment used in dry digestion systems. Dry AD systems are typically used when a green waste (grass clippings, brush, etc.) is part of the feedstock. A dry AD system operating with SSO as its only feedstock will likely require a bulking material to obtain the consistency needed for dry digestion. Advantages of dry digestion systems include:
• No need to add water, resulting in lower energy demands and no dewatering equipment.
• Minimal pretreatment requirements and system can more readily handle contaminants such as glass, plastic, and metals (Verma May 2002).
Disadvantages of dry digestion systems include:
• More costly conveyance equipment, including belts and screw conveyors (continuous feed systems only).
• Need for bulking material.
• Less familiarity with this technology (few operating US facilities).
Two dry digestion feedstock scenarios were evaluated: a large system processing 12,000 ton/year of SSO and a small system processing 6,000 ton/year of SSO. In both cases, it was assumed that a bulking material is needed at a mass ratio of 1 to 1. This bulking material could be wood chips, grass clipping, or brush. This evaluation conservatively assumes that wood chips would be used. Wood chips would not degrade in the anaerobic system and would not contribute to the biogas. If grass clipping or brush were available, their use as a bulking agent would positively impact the volume of biogas generated.
AD System
AD
Treatment
Preliminary Treatment
Deliveries Storage
Digestate
-Compost solids -Land apply -Pelletize & burn
Digestate
Biogas
Biogas
-Digester heat -Other heating
Direct Use
-Vehicle fuel -Pipeline injection
-Electrical generation
Treatment
Figure 7—Schematic of a Dry Anaerobic Digestion System
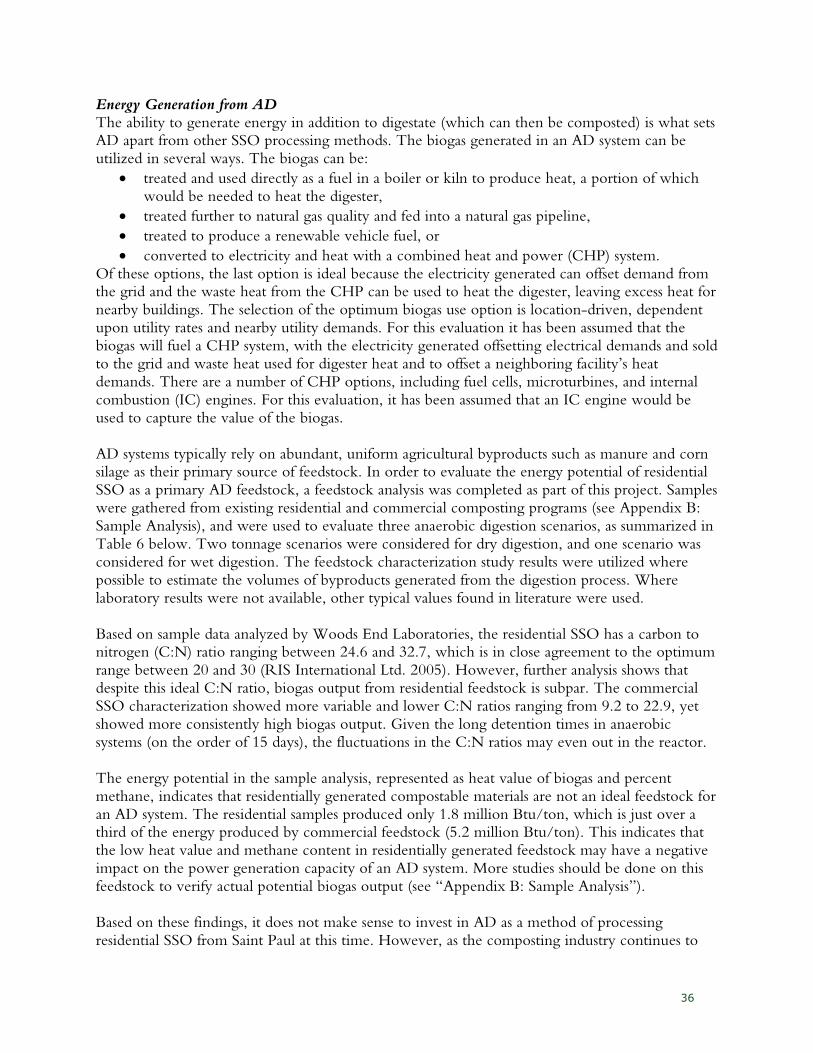
36
Energy Generation from AD The ability to generate energy in addition to digestate (which can then be composted) is what sets AD apart from other SSO processing methods. The biogas generated in an AD system can be utilized in several ways. The biogas can be:
• treated and used directly as a fuel in a boiler or kiln to produce heat, a portion of which would be needed to heat the digester,
• treated further to natural gas quality and fed into a natural gas pipeline,
• treated to produce a renewable vehicle fuel, or
• converted to electricity and heat with a combined heat and power (CHP) system. Of these options, the last option is ideal because the electricity generated can offset demand from the grid and the waste heat from the CHP can be used to heat the digester, leaving excess heat for nearby buildings. The selection of the optimum biogas use option is location-driven, dependent upon utility rates and nearby utility demands. For this evaluation it has been assumed that the biogas will fuel a CHP system, with the electricity generated offsetting electrical demands and sold to the grid and waste heat used for digester heat and to offset a neighboring facility’s heat demands. There are a number of CHP options, including fuel cells, microturbines, and internal combustion (IC) engines. For this evaluation, it has been assumed that an IC engine would be used to capture the value of the biogas. AD systems typically rely on abundant, uniform agricultural byproducts such as manure and corn silage as their primary source of feedstock. In order to evaluate the energy potential of residential SSO as a primary AD feedstock, a feedstock analysis was completed as part of this project. Samples were gathered from existing residential and commercial composting programs (see Appendix B: Sample Analysis), and were used to evaluate three anaerobic digestion scenarios, as summarized in Table 6 below. Two tonnage scenarios were considered for dry digestion, and one scenario was considered for wet digestion. The feedstock characterization study results were utilized where possible to estimate the volumes of byproducts generated from the digestion process. Where laboratory results were not available, other typical values found in literature were used. Based on sample data analyzed by Woods End Laboratories, the residential SSO has a carbon to nitrogen (C:N) ratio ranging between 24.6 and 32.7, which is in close agreement to the optimum range between 20 and 30 (RIS International Ltd. 2005). However, further analysis shows that despite this ideal C:N ratio, biogas output from residential feedstock is subpar. The commercial SSO characterization showed more variable and lower C:N ratios ranging from 9.2 to 22.9, yet showed more consistently high biogas output. Given the long detention times in anaerobic systems (on the order of 15 days), the fluctuations in the C:N ratios may even out in the reactor. The energy potential in the sample analysis, represented as heat value of biogas and percent methane, indicates that residentially generated compostable materials are not an ideal feedstock for an AD system. The residential samples produced only 1.8 million Btu/ton, which is just over a third of the energy produced by commercial feedstock (5.2 million Btu/ton). This indicates that the low heat value and methane content in residentially generated feedstock may have a negative impact on the power generation capacity of an AD system. More studies should be done on this feedstock to verify actual potential biogas output (see “Appendix B: Sample Analysis”). Based on these findings, it does not make sense to invest in AD as a method of processing residential SSO from Saint Paul at this time. However, as the composting industry continues to
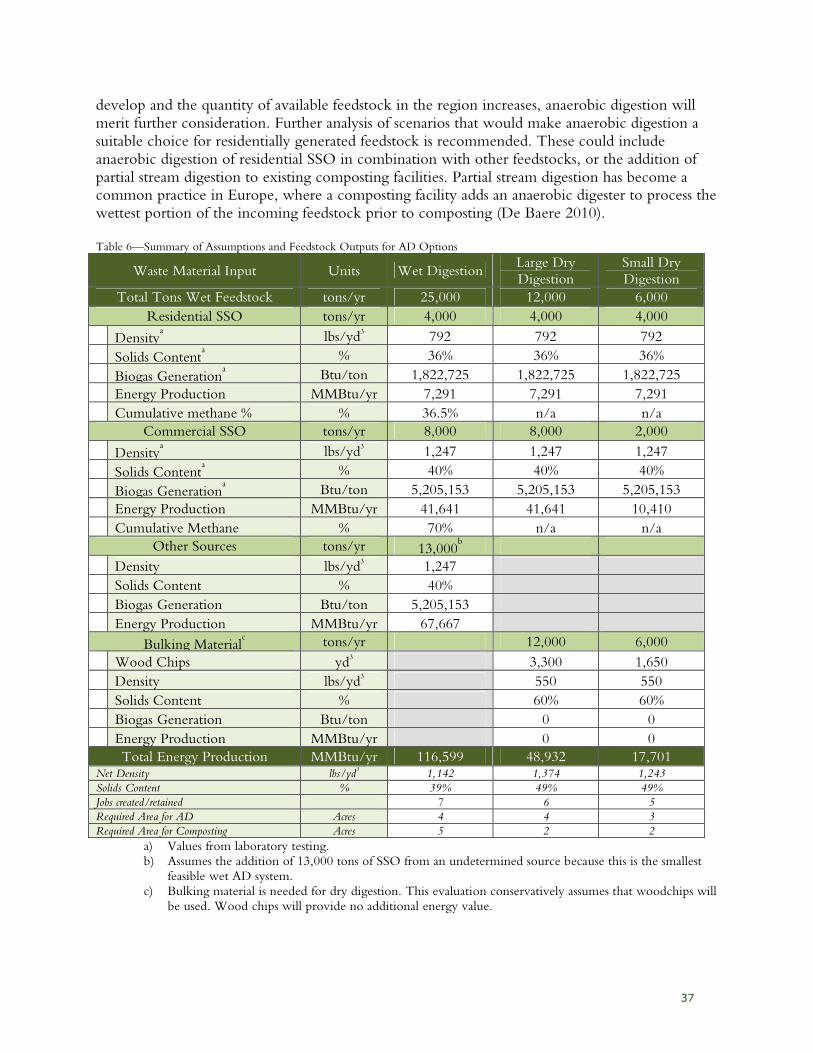
37
develop and the quantity of available feedstock in the region increases, anaerobic digestion will merit further consideration. Further analysis of scenarios that would make anaerobic digestion a suitable choice for residentially generated feedstock is recommended. These could include anaerobic digestion of residential SSO in combination with other feedstocks, or the addition of partial stream digestion to existing composting facilities. Partial stream digestion has become a common practice in Europe, where a composting facility adds an anaerobic digester to process the wettest portion of the incoming feedstock prior to composting (De Baere 2010). Table 6—Summary of Assumptions and Feedstock Outputs for AD Options
Waste Material Input Units Wet Digestion Large Dry Digestion
Small Dry Digestion
Total Tons Wet Feedstock tons/yr 25,000 12,000 6,000
Residential SSO tons/yr 4,000 4,000 4,000
Densitya lbs/yd
3 792 792 792
Solids Contenta % 36% 36% 36%
Biogas Generationa Btu/ton 1,822,725 1,822,725 1,822,725
Energy Production MMBtu/yr 7,291 7,291 7,291
Cumulative methane % % 36.5% n/a n/a
Commercial SSO tons/yr 8,000 8,000 2,000
Densitya lbs/yd
3 1,247 1,247 1,247
Solids Contenta % 40% 40% 40%
Biogas Generationa Btu/ton 5,205,153 5,205,153 5,205,153
Energy Production MMBtu/yr 41,641 41,641 10,410
Cumulative Methane % 70% n/a n/a
Other Sources tons/yr 13,000b
Density lbs/yd3 1,247
Solids Content % 40%
Biogas Generation Btu/ton 5,205,153
Energy Production MMBtu/yr 67,667
Bulking Materialc tons/yr 12,000 6,000
Wood Chips yd3 3,300 1,650
Density lbs/yd3 550 550
Solids Content % 60% 60%
Biogas Generation Btu/ton 0 0
Energy Production MMBtu/yr 0 0
Total Energy Production MMBtu/yr 116,599 48,932 17,701 Net Density lbs/yd
3 1,142 1,374 1,243
Solids Content % 39% 49% 49%
Jobs created/retained 7 6 5
Required Area for AD Acres 4 4 3
Required Area for Composting Acres 5 2 2
a) Values from laboratory testing.
b) Assumes the addition of 13,000 tons of SSO from an undetermined source because this is the smallest
feasible wet AD system.
c) Bulking material is needed for dry digestion. This evaluation conservatively assumes that woodchips will
be used. Wood chips will provide no additional energy value.
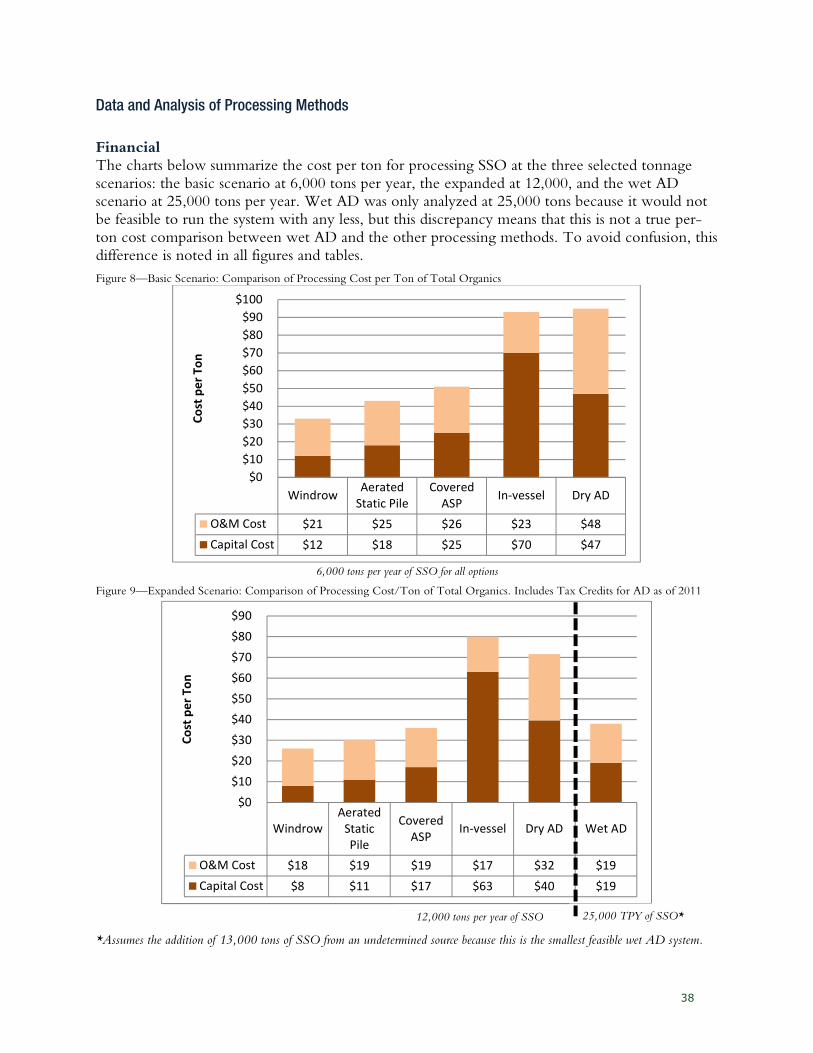
38
Data and Analysis of Processing Methods
Financial The charts below summarize the cost per ton for processing SSO at the three selected tonnage scenarios: the basic scenario at 6,000 tons per year, the expanded at 12,000, and the wet AD scenario at 25,000 tons per year. Wet AD was only analyzed at 25,000 tons because it would not be feasible to run the system with any less, but this discrepancy means that this is not a true per-ton cost comparison between wet AD and the other processing methods. To avoid confusion, this difference is noted in all figures and tables.
Figure 8—Basic Scenario: Comparison of Processing Cost per Ton of Total Organics
6,000 tons per year of SSO for all options
Figure 9—Expanded Scenario: Comparison of Processing Cost/Ton of Total Organics. Includes Tax Credits for AD as of 2011
*Assumes the addition of 13,000 tons of SSO from an undetermined source because this is the smallest feasible wet AD system.
WindrowAerated
Static Pile
Covered
ASPIn-vessel Dry AD
O&M Cost $21 $25 $26 $23 $48
Capital Cost $12 $18 $25 $70 $47
$0
$10
$20
$30
$40
$50
$60
$70
$80
$90
$100
Co
st p
er
To
n
Windrow
Aerated
Static
Pile
Covered
ASPIn-vessel Dry AD Wet AD
O&M Cost $18 $19 $19 $17 $32 $19
Capital Cost $8 $11 $17 $63 $40 $19
$0
$10
$20
$30
$40
$50
$60
$70
$80
$90
Co
st p
er
To
n
12,000 tons per year of SSO 25,000 TPY of SSO*
39
Each of the charts above separates the operating and capital costs. Capital costs can change based on financing options whereas operating and maintenance costs are ongoing. None of these costs were compared to the cost of disposing of discards in a landfill or incinerator. Those costs were not researched as the comparison is out of the scope of this study, which is primarily aimed at comparing different composting and prevention options. It is noteworthy that costs per ton decrease dramatically (by about 30%) when assumed tonnage collection doubles. Revenue In a typical composting operation, the costs outlined above are covered by two revenue streams:
• A “tip fee” is a per-ton charge paid by haulers when they drop materials off at a composting facility.
• Revenue is generated from the sale of finished compost.
Tax Credits for Anaerobic Digestion The capital costs of both AD systems included in Figure 8 and Figure 9 are calculated assuming that the projects have taken advantage of three tax credits (based on credits available in 2011):
• renewable energy tax credits (estimated at 30%),
• accelerated depreciation tax savings over seven years,
• and the New Market Tax Credit, which is available if the facility is sited in low income areas slated for economic development.
The total impact of applying these three credits is estimated at 54% savings. The availability of renewable energy tax credits is changing and therefore creates uncertainty around the financing and costs for anaerobic digestion. The return on investment is assumed to be 15%.
Actual Costs of Processing Per Ton of SSO Collected The per-tons costs shown in Figure 8 and Figure 9 were calculated based on the total tons of organics in the system, including both SSO and carbon material that was added during processing. In order to provide a true cost comparison between processing SSO or paying the tip fee at an existing composting facility, a summary of costs per ton of SSO in the basic scenario is provided in Table 7, which compares the total costs per ton (capital plus O&M) from Figure 8 to the actual cost per ton of SSO. The two prevention methods do not have a processing cost. All costs associated with these options are covered in the collection section. The potential added costs of purchasing carbon material are covered in the next section.
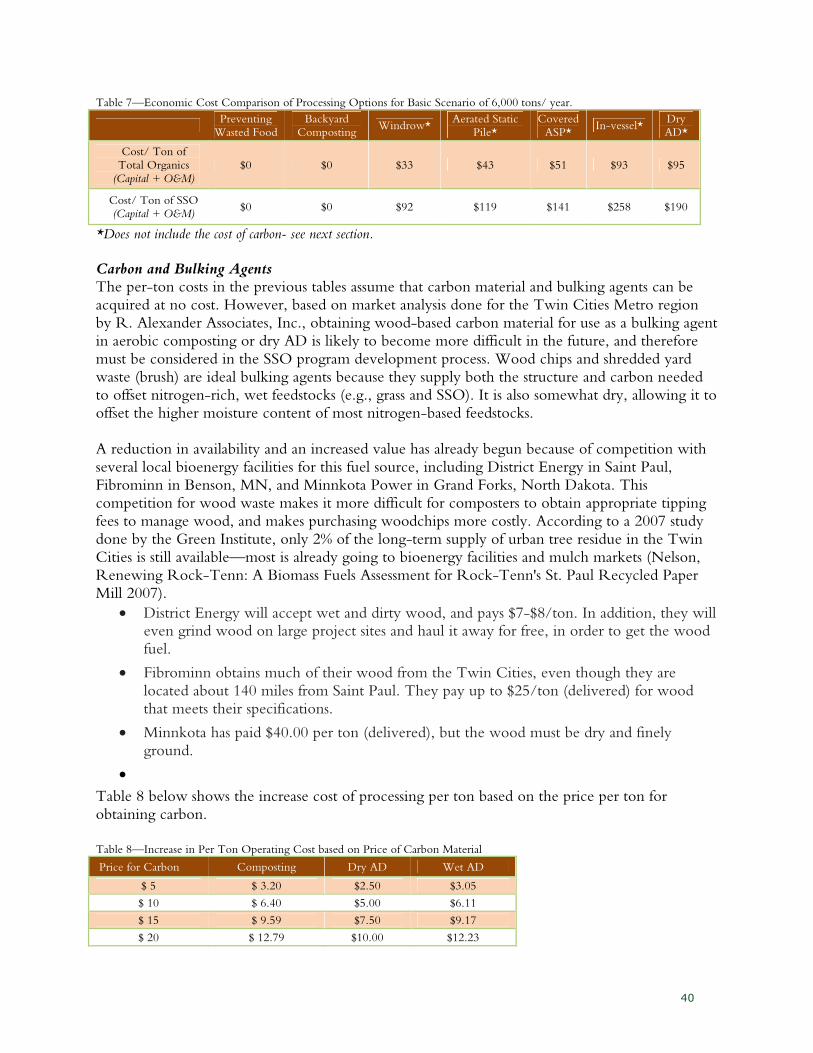
40
Table 7—Economic Cost Comparison of Processing Options for Basic Scenario of 6,000 tons/ year.
Preventing
Wasted Food Backyard
Composting Windrow*
Aerated Static Pile*
Covered ASP*
In-vessel* Dry AD*
Cost/ Ton of Total Organics
(Capital + O&M) $0 $0 $33 $43 $51 $93 $95
Cost/ Ton of SSO (Capital + O&M)
$0 $0 $92 $119 $141 $258 $190
*Does not include the cost of carbon- see next section.
Carbon and Bulking Agents The per-ton costs in the previous tables assume that carbon material and bulking agents can be acquired at no cost. However, based on market analysis done for the Twin Cities Metro region by R. Alexander Associates, Inc., obtaining wood-based carbon material for use as a bulking agent in aerobic composting or dry AD is likely to become more difficult in the future, and therefore must be considered in the SSO program development process. Wood chips and shredded yard waste (brush) are ideal bulking agents because they supply both the structure and carbon needed to offset nitrogen-rich, wet feedstocks (e.g., grass and SSO). It is also somewhat dry, allowing it to offset the higher moisture content of most nitrogen-based feedstocks. A reduction in availability and an increased value has already begun because of competition with several local bioenergy facilities for this fuel source, including District Energy in Saint Paul, Fibrominn in Benson, MN, and Minnkota Power in Grand Forks, North Dakota. This competition for wood waste makes it more difficult for composters to obtain appropriate tipping fees to manage wood, and makes purchasing woodchips more costly. According to a 2007 study done by the Green Institute, only 2% of the long-term supply of urban tree residue in the Twin Cities is still available—most is already going to bioenergy facilities and mulch markets (Nelson, Renewing Rock-Tenn: A Biomass Fuels Assessment for Rock-Tenn's St. Paul Recycled Paper Mill 2007).
• District Energy will accept wet and dirty wood, and pays $7-$8/ton. In addition, they will even grind wood on large project sites and haul it away for free, in order to get the wood fuel.
• Fibrominn obtains much of their wood from the Twin Cities, even though they are located about 140 miles from Saint Paul. They pay up to $25/ton (delivered) for wood that meets their specifications.
• Minnkota has paid $40.00 per ton (delivered), but the wood must be dry and finely ground.
•
Table 8 below shows the increase cost of processing per ton based on the price per ton for obtaining carbon.
Table 8—Increase in Per Ton Operating Cost based on Price of Carbon Material
Price for Carbon Composting Dry AD Wet AD
$ 5 $ 3.20 $2.50 $3.05
$ 10 $ 6.40 $5.00 $6.11
$ 15 $ 9.59 $7.50 $9.17
$ 20 $ 12.79 $10.00 $12.23
41
In addition to the limited availability of wood waste, the movement of wood waste is currently hindered by quarantine in the Twin Cities metro area. In an effort to prevent the spread of the emerald ash borer, an invasive species that is destroying the ash tree population in the region, wood waste is prohibited from traveling across county lines unless it has first been finely ground. Although wood chips and shredded yard waste (brush) are commonly used bulking agents, alternative bulking agents also exist. Materials such as shredded/chipped tires, corrugated cardboard, shredded newspaper, and high density polyethylene (HDPE) can also be used. However, each of these alternatives has pros and cons. For instance, tire chips provide excellent structure to a compost pile, but do not provide any carbon. Further, they can be a source of heavy metals in the compost. HDPE also provides good structure, but no carbon. Further, both HDPE and tire chips can be seen as contaminants if they are not properly screened from the finished compost product. Cardboard and newspaper can supply carbon, but when wet, may not provide enough structure (pore spacing) to the pile or windrow. Sawdust can be used, but is often too costly. Various agricultural by-products may also be used if available at a low enough cost and in large enough volumes.
Financial Analysis
• Windrow is the least expensive processing method per ton followed respectively by Aerated Static Pile and Covered Aerated Static Pile but is least likely to be situated close to the city.
• In-vessel composting has low operating and management cost but significant capital cost (3.7–7.9 times higher than other aerobic composting processes).
• Wet Anaerobic Digestion at 25,000 tons becomes cost comparable to Aerobic Composting methods at 12,000 tons. Further study is needed to identify how much lower the price of Aerobic Composting would be at 25,000 tons.
• Prevention through backyard composting and preventing wasted food is the least expensive way to handle SSO.
Environmental and Human Health The table below summarizes the LCA estimates for the seven environmental impacts of options that would be used to process SSO into useful energy and compost products. The processing options covered in the table include backyard composting, aerobic composting, and dry and wet anaerobic digestion (AD), followed by aerobic composting of the AD digestate. The table shows the emissions from processing operations and from energy, and fertilizer/pesticide displacements from utilization of the energy and compost outputs of processing. The table also shows net life cycle impacts, i.e., the difference between emissions from processing and the emissions offsets from displaced energy generation and fertilizer/pesticide usage. Because of a lack of data on the quality and use of the composted SSO processed through a backyard composting system, no fertilizer or pesticide offsets are shown for this processing option. The upstream benefits of preventing wasted food are included in charts below. This information is the same as the data included in the environmental analysis of collection methods. This allows us to demonstrate the value of including prevention education in a composting program, because every ton of wasted food that is prevented creates dramatically more environmental benefit than if it were composted.
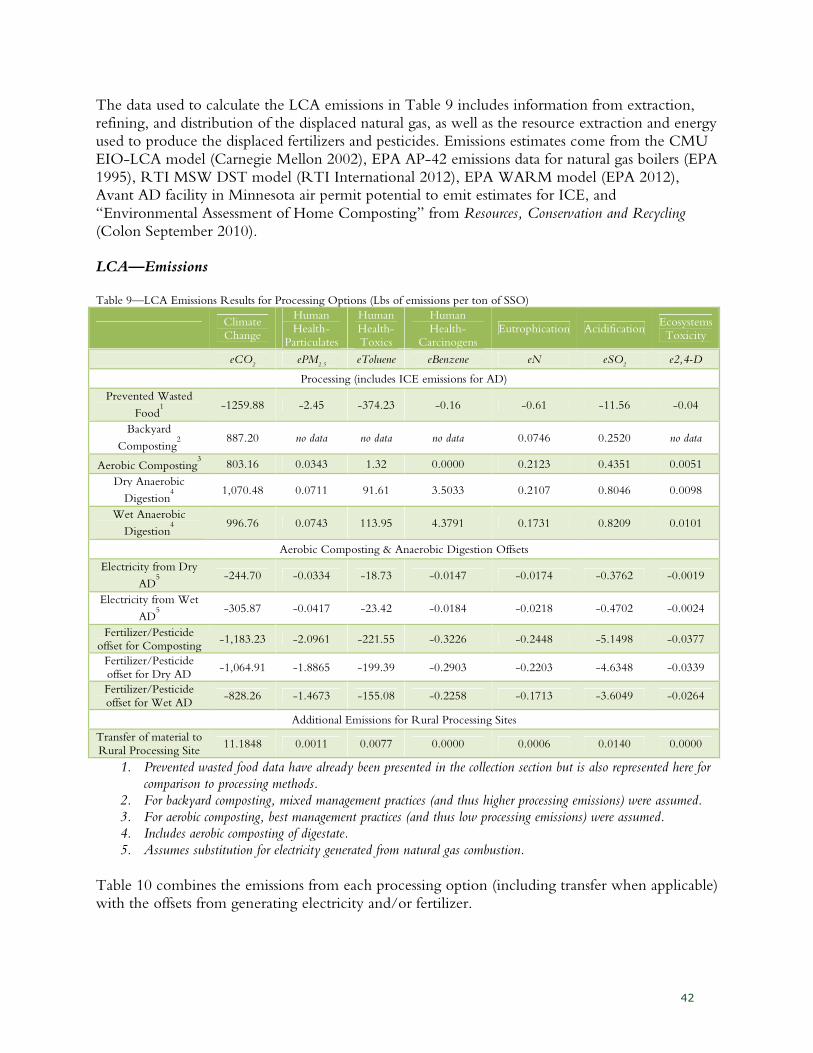
42
The data used to calculate the LCA emissions in Table 9 includes information from extraction, refining, and distribution of the displaced natural gas, as well as the resource extraction and energy used to produce the displaced fertilizers and pesticides. Emissions estimates come from the CMU EIO-LCA model (Carnegie Mellon 2002), EPA AP-42 emissions data for natural gas boilers (EPA 1995), RTI MSW DST model (RTI International 2012), EPA WARM model (EPA 2012), Avant AD facility in Minnesota air permit potential to emit estimates for ICE, and
“Environmental Assessment of Home Composting” from Resources, Conservation and Recycling (Colon September 2010). LCA—Emissions Table 9—LCA Emissions Results for Processing Options (Lbs of emissions per ton of SSO)
Climate
Change
Human
Health- Particulates
Human
Health- Toxics
Human
Health- Carcinogens
Eutrophication Acidification Ecosystems
Toxicity
eCO2 ePM
2.5 eToluene eBenzene eN eSO
2 e2,4-D
Processing (includes ICE emissions for AD)
Prevented Wasted
Food1
-1259.88 -2.45 -374.23 -0.16 -0.61 -11.56 -0.04
Backyard
Composting2
887.20 no data no data no data 0.0746 0.2520 no data
Aerobic Composting3 803.16 0.0343 1.32 0.0000 0.2123 0.4351 0.0051
Dry Anaerobic
Digestion4
1,070.48 0.0711 91.61 3.5033 0.2107 0.8046 0.0098
Wet Anaerobic
Digestion4
996.76 0.0743 113.95 4.3791 0.1731 0.8209 0.0101
Aerobic Composting & Anaerobic Digestion Offsets
Electricity from Dry
AD5
-244.70 -0.0334 -18.73 -0.0147 -0.0174 -0.3762 -0.0019
Electricity from Wet
AD5
-305.87 -0.0417 -23.42 -0.0184 -0.0218 -0.4702 -0.0024
Fertilizer/Pesticide offset for Composting
-1,183.23 -2.0961 -221.55 -0.3226 -0.2448 -5.1498 -0.0377
Fertilizer/Pesticide
offset for Dry AD -1,064.91 -1.8865 -199.39 -0.2903 -0.2203 -4.6348 -0.0339
Fertilizer/Pesticide
offset for Wet AD -828.26 -1.4673 -155.08 -0.2258 -0.1713 -3.6049 -0.0264
Additional Emissions for Rural Processing Sites
Transfer of material to
Rural Processing Site 11.1848 0.0011 0.0077 0.0000 0.0006 0.0140 0.0000
1. Prevented wasted food data have already been presented in the collection section but is also represented here for comparison to processing methods.
2. For backyard composting, mixed management practices (and thus higher processing emissions) were assumed. 3. For aerobic composting, best management practices (and thus low processing emissions) were assumed. 4. Includes aerobic composting of digestate. 5. Assumes substitution for electricity generated from natural gas combustion.
Table 10 combines the emissions from each processing option (including transfer when applicable) with the offsets from generating electricity and/or fertilizer.
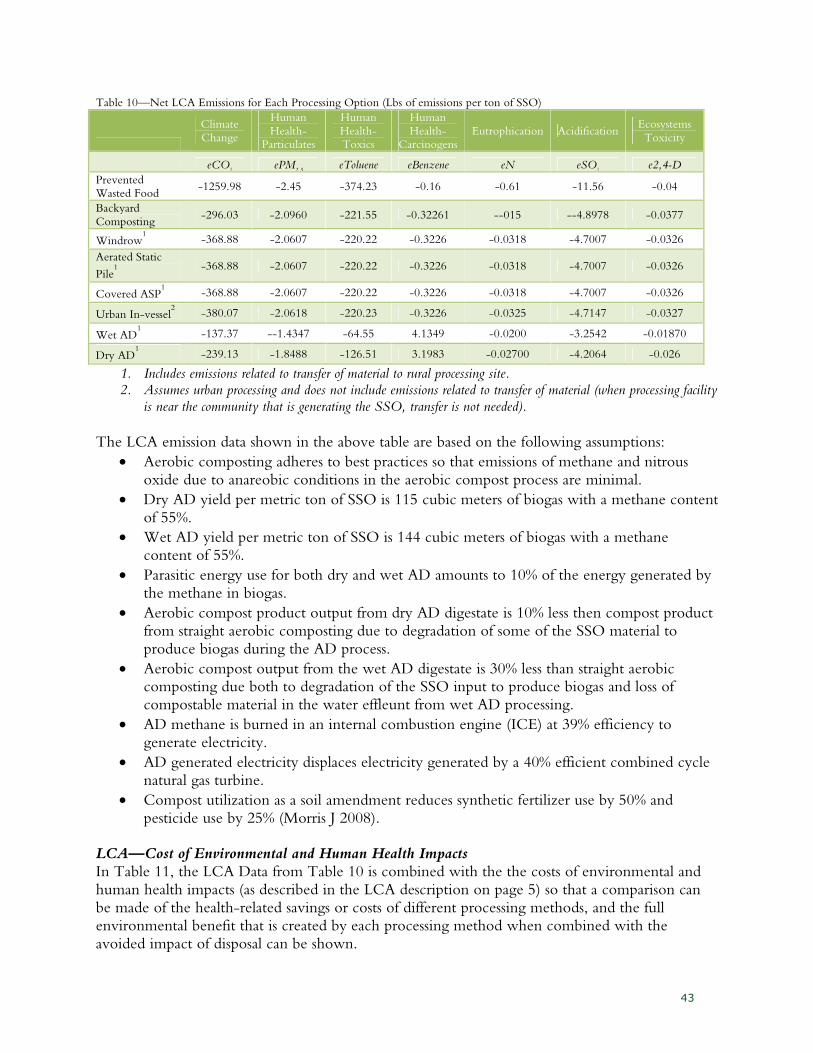
43
Table 10—Net LCA Emissions for Each Processing Option (Lbs of emissions per ton of SSO)
Climate
Change
Human
Health- Particulates
Human
Health- Toxics
Human
Health- Carcinogens
Eutrophication Acidification Ecosystems
Toxicity
eCO2 ePM
2.5 eToluene eBenzene eN eSO
2 e2,4-D
Prevented Wasted Food
-1259.98 -2.45 -374.23 -0.16 -0.61 -11.56 -0.04
Backyard
Composting -296.03 -2.0960 -221.55 -0.32261 --015 --4.8978 -0.0377
Windrow1 -368.88 -2.0607 -220.22 -0.3226 -0.0318 -4.7007 -0.0326
Aerated Static
Pile1
-368.88 -2.0607 -220.22 -0.3226 -0.0318 -4.7007 -0.0326
Covered ASP1 -368.88 -2.0607 -220.22 -0.3226 -0.0318 -4.7007 -0.0326
Urban In-vessel2 -380.07 -2.0618 -220.23 -0.3226 -0.0325 -4.7147 -0.0327
Wet AD1 -137.37 --1.4347 -64.55 4.1349 -0.0200 -3.2542 -0.01870
Dry AD1 -239.13 -1.8488 -126.51 3.1983 -0.02700 -4.2064 -0.026
1. Includes emissions related to transfer of material to rural processing site. 2. Assumes urban processing and does not include emissions related to transfer of material (when processing facility
is near the community that is generating the SSO, transfer is not needed).
The LCA emission data shown in the above table are based on the following assumptions:
• Aerobic composting adheres to best practices so that emissions of methane and nitrous oxide due to anareobic conditions in the aerobic compost process are minimal.
• Dry AD yield per metric ton of SSO is 115 cubic meters of biogas with a methane content of 55%.
• Wet AD yield per metric ton of SSO is 144 cubic meters of biogas with a methane content of 55%.
• Parasitic energy use for both dry and wet AD amounts to 10% of the energy generated by the methane in biogas.
• Aerobic compost product output from dry AD digestate is 10% less then compost product from straight aerobic composting due to degradation of some of the SSO material to produce biogas during the AD process.
• Aerobic compost output from the wet AD digestate is 30% less than straight aerobic composting due both to degradation of the SSO input to produce biogas and loss of compostable material in the water effleunt from wet AD processing.
• AD methane is burned in an internal combustion engine (ICE) at 39% efficiency to generate electricity.
• AD generated electricity displaces electricity generated by a 40% efficient combined cycle natural gas turbine.
• Compost utilization as a soil amendment reduces synthetic fertilizer use by 50% and pesticide use by 25% (Morris J 2008).
LCA—Cost of Environmental and Human Health Impacts In Table 11, the LCA Data from Table 10 is combined with the the costs of environmental and human health impacts (as described in the LCA description on page 5) so that a comparison can be made of the health-related savings or costs of different processing methods, and the full environmental benefit that is created by each processing method when combined with the avoided impact of disposal can be shown.
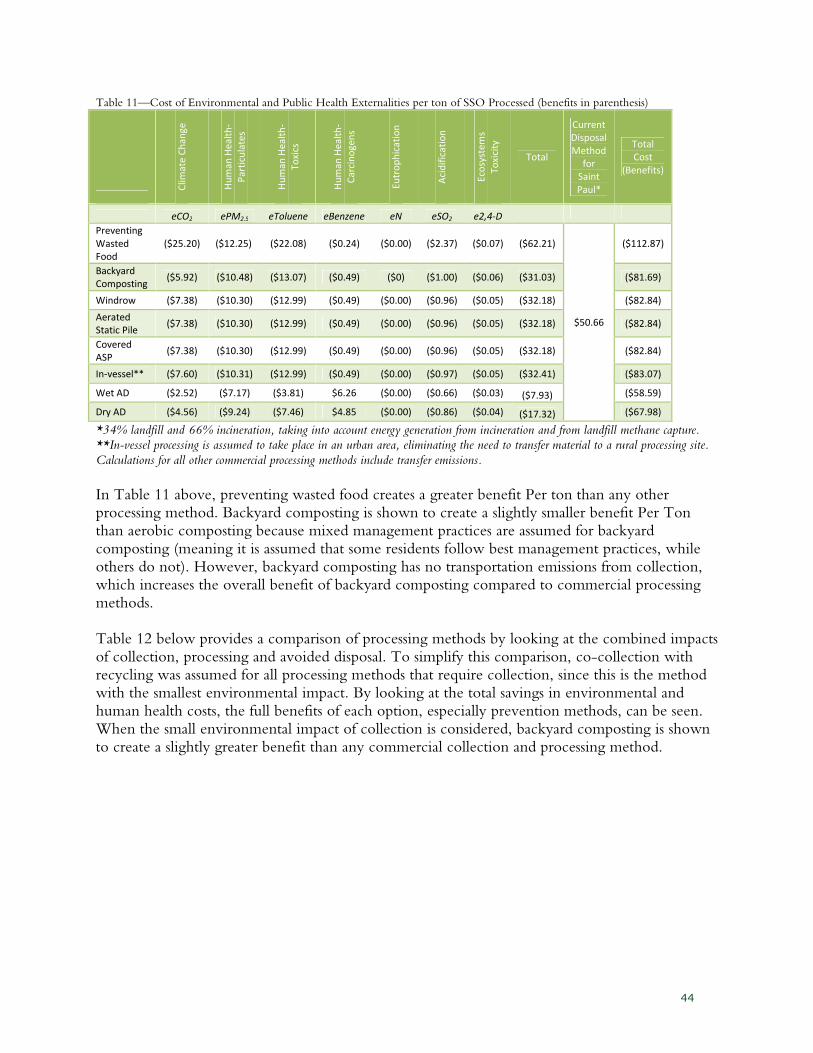
44
Table 11—Cost of Environmental and Public Health Externalities per ton of SSO Processed (benefits in parenthesis)
Clim
ate
Ch
an
ge
Hu
ma
n H
ea
lth
-
Pa
rtic
ula
tes
Hu
ma
n H
ea
lth
-
To
xics
Hu
ma
n H
ea
lth
-
Ca
rcin
og
en
s
Eu
tro
ph
ica
tio
n
Aci
dif
ica
tio
n
Eco
syst
em
s
To
xici
ty
Total
Current
Disposal
Method
for
Saint
Paul*
Total
Cost
(Benefits)
eCO2 ePM2.5 eToluene eBenzene eN eSO2 e2,4-D
Preventing
Wasted
Food
($25.20) ($12.25) ($22.08) ($0.24) ($0.00) ($2.37) ($0.07) ($62.21)
$50.66
($112.87)
Backyard
Composting ($5.92) ($10.48) ($13.07) ($0.49) ($0) ($1.00) ($0.06) ($31.03) ($81.69)
Windrow ($7.38) ($10.30) ($12.99) ($0.49) ($0.00) ($0.96) ($0.05) ($32.18) ($82.84)
Aerated
Static Pile ($7.38) ($10.30) ($12.99) ($0.49) ($0.00) ($0.96) ($0.05) ($32.18) ($82.84)
Covered
ASP ($7.38) ($10.30) ($12.99) ($0.49) ($0.00) ($0.96) ($0.05) ($32.18) ($82.84)
In-vessel** ($7.60) ($10.31) ($12.99) ($0.49) ($0.00) ($0.97) ($0.05) ($32.41) ($83.07)
Wet AD ($2.52) ($7.17) ($3.81) $6.26 ($0.00) ($0.66) ($0.03) ($7.93) ($58.59)
Dry AD ($4.56) ($9.24) ($7.46) $4.85 ($0.00) ($0.86) ($0.04) ($17.32) ($67.98)
*34% landfill and 66% incineration, taking into account energy generation from incineration and from landfill methane capture. **In-vessel processing is assumed to take place in an urban area, eliminating the need to transfer material to a rural processing site.
Calculations for all other commercial processing methods include transfer emissions.
In Table 11 above, preventing wasted food creates a greater benefit Per ton than any other processing method. Backyard composting is shown to create a slightly smaller benefit Per Ton than aerobic composting because mixed management practices are assumed for backyard composting (meaning it is assumed that some residents follow best management practices, while others do not). However, backyard composting has no transportation emissions from collection, which increases the overall benefit of backyard composting compared to commercial processing methods. Table 12 below provides a comparison of processing methods by looking at the combined impacts of collection, processing and avoided disposal. To simplify this comparison, co-collection with recycling was assumed for all processing methods that require collection, since this is the method with the smallest environmental impact. By looking at the total savings in environmental and human health costs, the full benefits of each option, especially prevention methods, can be seen. When the small environmental impact of collection is considered, backyard composting is shown to create a slightly greater benefit than any commercial collection and processing method.
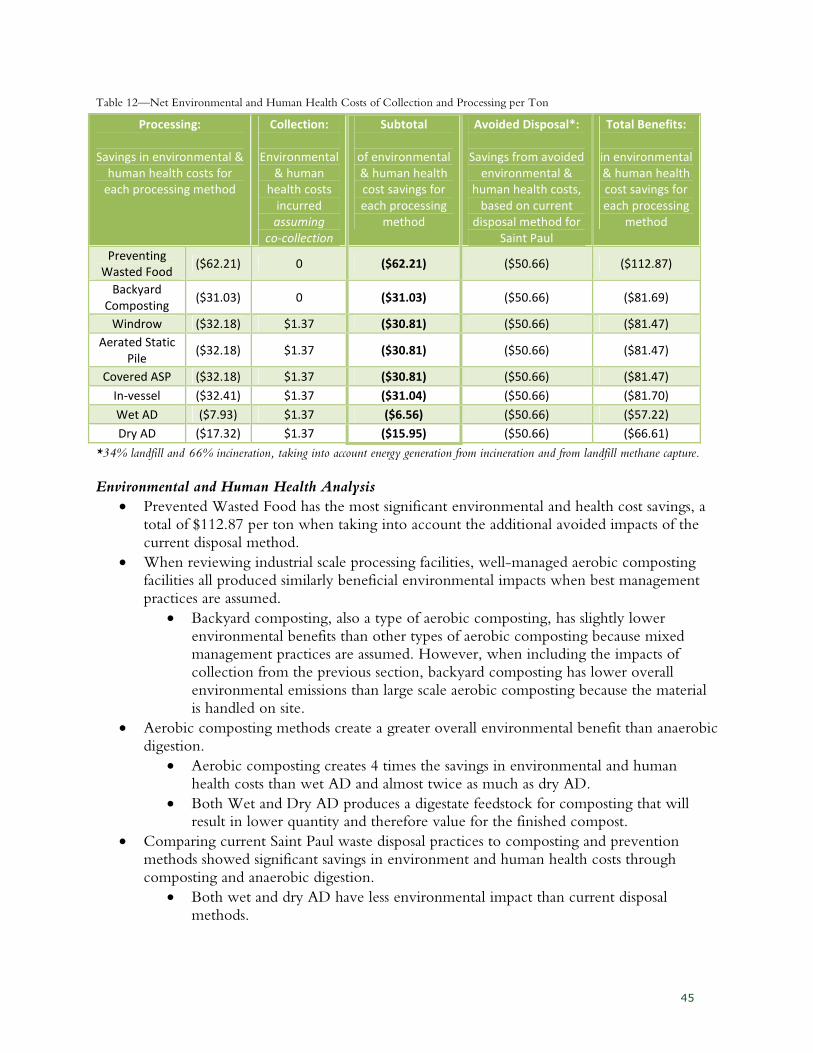
45
Table 12—Net Environmental and Human Health Costs of Collection and Processing per Ton
Processing:
Savings in environmental &
human health costs for
each processing method
Collection:
Environmental
& human
health costs
incurred
assuming
co-collection
Subtotal
of environmental
& human health
cost savings for
each processing
method
Avoided Disposal*:
Savings from avoided
environmental &
human health costs,
based on current
disposal method for
Saint Paul
Total Benefits:
in environmental
& human health
cost savings for
each processing
method
Preventing
Wasted Food ($62.21) 0 ($62.21) ($50.66) ($112.87)
Backyard
Composting ($31.03) 0 ($31.03) ($50.66) ($81.69)
Windrow ($32.18) $1.37 ($30.81) ($50.66) ($81.47)
Aerated Static
Pile ($32.18) $1.37 ($30.81) ($50.66) ($81.47)
Covered ASP ($32.18) $1.37 ($30.81) ($50.66) ($81.47)
In-vessel ($32.41) $1.37 ($31.04) ($50.66) ($81.70)
Wet AD ($7.93) $1.37 ($6.56) ($50.66) ($57.22)
Dry AD ($17.32) $1.37 ($15.95) ($50.66) ($66.61)
*34% landfill and 66% incineration, taking into account energy generation from incineration and from landfill methane capture. Environmental and Human Health Analysis
• Prevented Wasted Food has the most significant environmental and health cost savings, a total of $112.87 per ton when taking into account the additional avoided impacts of the current disposal method.
• When reviewing industrial scale processing facilities, well-managed aerobic composting facilities all produced similarly beneficial environmental impacts when best management practices are assumed.
• Backyard composting, also a type of aerobic composting, has slightly lower environmental benefits than other types of aerobic composting because mixed management practices are assumed. However, when including the impacts of collection from the previous section, backyard composting has lower overall environmental emissions than large scale aerobic composting because the material is handled on site.
• Aerobic composting methods create a greater overall environmental benefit than anaerobic digestion.
• Aerobic composting creates 4 times the savings in environmental and human health costs than wet AD and almost twice as much as dry AD.
• Both Wet and Dry AD produces a digestate feedstock for composting that will result in lower quantity and therefore value for the finished compost.
• Comparing current Saint Paul waste disposal practices to composting and prevention methods showed significant savings in environment and human health costs through composting and anaerobic digestion.
• Both wet and dry AD have less environmental impact than current disposal methods.
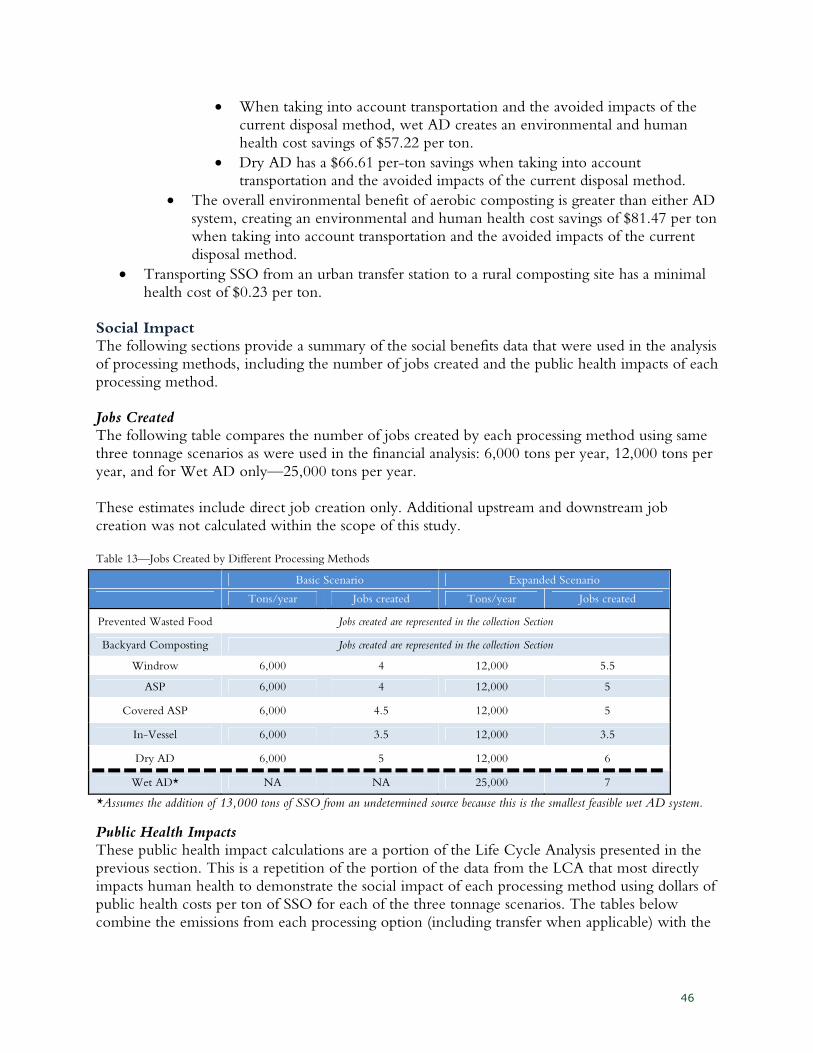
46
• When taking into account transportation and the avoided impacts of the current disposal method, wet AD creates an environmental and human health cost savings of $57.22 per ton.
• Dry AD has a $66.61 per-ton savings when taking into account transportation and the avoided impacts of the current disposal method.
• The overall environmental benefit of aerobic composting is greater than either AD system, creating an environmental and human health cost savings of $81.47 per ton when taking into account transportation and the avoided impacts of the current disposal method.
• Transporting SSO from an urban transfer station to a rural composting site has a minimal health cost of $0.23 per ton.
Social Impact The following sections provide a summary of the social benefits data that were used in the analysis of processing methods, including the number of jobs created and the public health impacts of each processing method. Jobs Created The following table compares the number of jobs created by each processing method using same three tonnage scenarios as were used in the financial analysis: 6,000 tons per year, 12,000 tons per year, and for Wet AD only—25,000 tons per year. These estimates include direct job creation only. Additional upstream and downstream job creation was not calculated within the scope of this study. Table 13—Jobs Created by Different Processing Methods
Basic Scenario Expanded Scenario
Tons/year Jobs created Tons/year Jobs created
Prevented Wasted Food Jobs created are represented in the collection Section
Backyard Composting Jobs created are represented in the collection Section
Windrow 6,000 4 12,000 5.5
ASP 6,000 4 12,000 5
Covered ASP 6,000 4.5 12,000 5
In-Vessel 6,000 3.5 12,000 3.5
Dry AD 6,000 5 12,000 6
Wet AD* NA NA 25,000 7
*Assumes the addition of 13,000 tons of SSO from an undetermined source because this is the smallest feasible wet AD system.
Public Health Impacts These public health impact calculations are a portion of the Life Cycle Analysis presented in the previous section. This is a repetition of the portion of the data from the LCA that most directly impacts human health to demonstrate the social impact of each processing method using dollars of public health costs per ton of SSO for each of the three tonnage scenarios. The tables below combine the emissions from each processing option (including transfer when applicable) with the
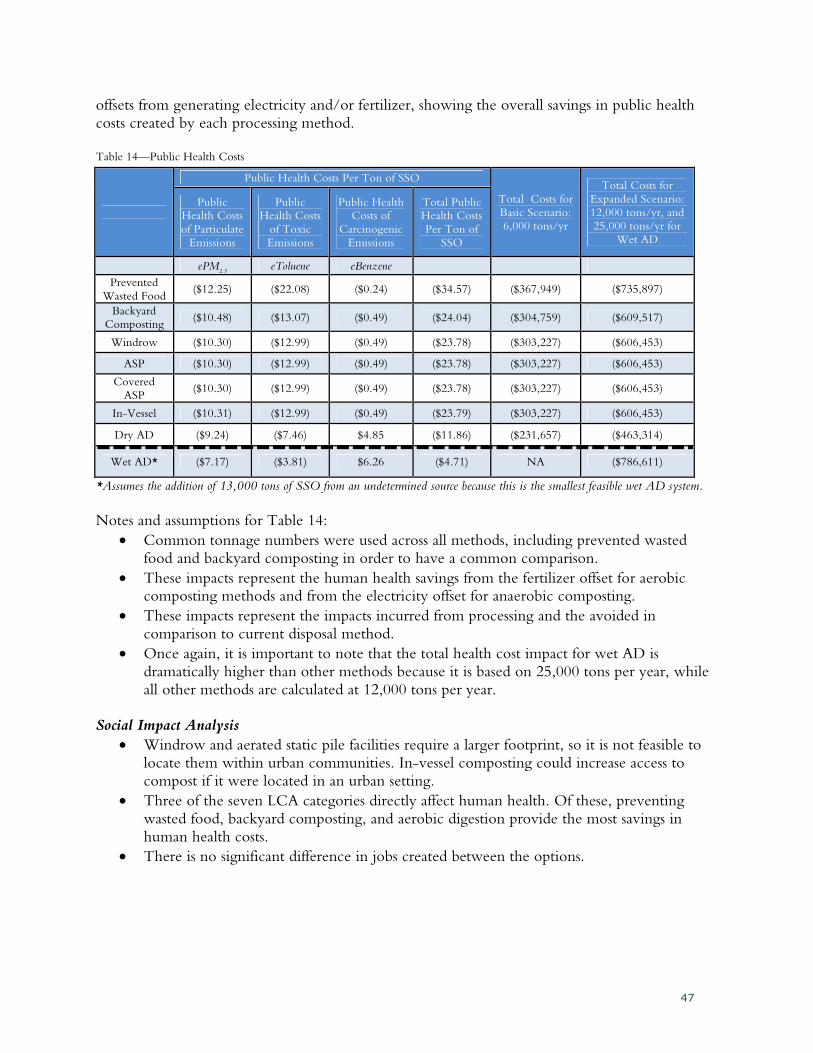
47
offsets from generating electricity and/or fertilizer, showing the overall savings in public health costs created by each processing method. Table 14—Public Health Costs
Public Health Costs Per Ton of SSO
Total Costs for
Basic Scenario: 6,000 tons/yr
Total Costs for
Expanded Scenario:
12,000 tons/yr, and 25,000 tons/yr for
Wet AD
Public Health Costs
of Particulate
Emissions
Public Health Costs
of Toxic
Emissions
Public Health Costs of
Carcinogenic
Emissions
Total Public Health Costs
Per Ton of
SSO
ePM2.5
eToluene eBenzene
Prevented
Wasted Food ($12.25) ($22.08) ($0.24) ($34.57) ($367,949) ($735,897)
Backyard Composting
($10.48) ($13.07) ($0.49) ($24.04) ($304,759) ($609,517)
Windrow ($10.30) ($12.99) ($0.49) ($23.78) ($303,227) ($606,453)
ASP ($10.30) ($12.99) ($0.49) ($23.78) ($303,227) ($606,453)
Covered
ASP ($10.30) ($12.99) ($0.49) ($23.78) ($303,227) ($606,453)
In-Vessel ($10.31) ($12.99) ($0.49) ($23.79) ($303,227) ($606,453)
Dry AD ($9.24) ($7.46) $4.85 ($11.86) ($231,657) ($463,314)
Wet AD* ($7.17) ($3.81) $6.26 ($4.71) NA ($786,611)
*Assumes the addition of 13,000 tons of SSO from an undetermined source because this is the smallest feasible wet AD system.
Notes and assumptions for Table 14:
• Common tonnage numbers were used across all methods, including prevented wasted food and backyard composting in order to have a common comparison.
• These impacts represent the human health savings from the fertilizer offset for aerobic composting methods and from the electricity offset for anaerobic composting.
• These impacts represent the impacts incurred from processing and the avoided in comparison to current disposal method.
• Once again, it is important to note that the total health cost impact for wet AD is dramatically higher than other methods because it is based on 25,000 tons per year, while all other methods are calculated at 12,000 tons per year.
Social Impact Analysis
• Windrow and aerated static pile facilities require a larger footprint, so it is not feasible to locate them within urban communities. In-vessel composting could increase access to compost if it were located in an urban setting.
• Three of the seven LCA categories directly affect human health. Of these, preventing wasted food, backyard composting, and aerobic digestion provide the most savings in human health costs.
• There is no significant difference in jobs created between the options.
48
Processing Findings All aerobic composting and anaerobic digestion methods provide significant environmental and public health benefits when compared with disposing of materials in a landfill or incinerator.
• Depending on the processing method used, composting can save anywhere from $57-$82 per ton in environmental and human health costs when compared to disposal. For this analysis, the impacts of disposal were calculated using the average current disposal methods in Saint Paul, 34% landfill and 66% incineration, taking into account energy generation from incineration and from landfill methane capture.
Backyard composting and preventing wasted food have financial, environmental, and social benefits that are greater than any other form of discarding the material.
• Since this material would not need to be processed (or collected) there are no associated processing (or collection) costs, just educational costs.
• Preventing wasted food has nearly twice the environmental and human health benefits per ton than curbside co-collection with any of the aerobic composting methods: windrow, aerated static pile, and covered aerated static pile.
• The benefits of backyard composting are slightly greater than the benefits of aerobic commercial composting.
• Educational programs designed to build community can have positive social impacts. Based on residential SSO from Saint Paul, aerobic composting compares favorably to anaerobic digestion for its financial, environmental, and social impacts, even when gas production from AD is considered.
• Aerobic composting is potentially less expensive to process per ton than similar scale anaerobic digestion, even when considering tax incentives and grants (which may not always be available).
• Aerobic composting creates four times more environmental and human health cost savings than wet AD and 1.8 times more savings than dry AD, even when gas production is factored in (at a higher ton scenario outlined in full report).
• The overall environmental benefit of aerobic composting is greater than either the wet or dry AD system. Aerobic composting creates an environmental and human health cost savings of $81.47 per ton including avoided disposal and transportation while wet AD creates a savings of $57.22 per ton, and dry AD creates a savings of $66.61 per ton.
• The energy potential (Btu) in the sample analysis indicates that residentially generated compostable materials are not an ideal feedstock for an AD system because the biogas does not have a high enough Btu content, in part because of the high paper content.
• Aerobic composting methods also produce a greater quantity and quality of finished compost than either AD system.
49
Use of Finished Compost
Options for Use of Finished Compost With erosion, soil contaminated with hazardous materials such as lead and mercury, and depleted soil that needs amendment in order to grow healthy gardens and lawns, a triple bottom line analysis is needed to help balance the many social, environmental, and economic needs that finished compost can help fulfill within the community and beyond. Compost can be used to remediate and replenish soil on urban and rural farms, parks, playgrounds, and community gardens, and can be used to grow food, lawns, flowers, and other plants. According to the Minnesota Institute for Sustainable Agriculture, adding compost to contaminated urban soils is one of the best ways to monomize the uptake of soil contaminants into plants, because the addition of organic matter to the soil makes metals such as lead, cadmium, and arsenic less mobile in the soil (Minnesota Institute for Sustainable Agriculture 2010). Community gardens also rely on compost to revitalize urban soil, allowing them to grow quality food and keep gardeners engaged. Based on a study done in New York, community gardens had a direct effect on housing prices in areas where they were well kept (Been 2006). In poor neighborhoods, the gardens raised housing prices by almost 10% in the five years after they were initiated. Furthermore, revenue from the sale of finished compost can play a critical role in making compost collection programs affordable for the communities they serve. The following section reviews the marketplace for finished compost surrounding the Twin Cities to help determine how different types of opportunites measure against financial, environmental, and social indicators.
Compost Markets in the Twin Cities Metro Region As was mentioned in the processing section, the current rate to drop off (“tip”) SSO at a transfer station or compost facility in the Twin Cities is apparently comparable with the cost per ton as tipping trash to an incinerator. However, this comparison does not take into account that the tip fees at incinerators are off-set by government subsidies. For example, the Ramsey/Washington County Resource Recovery Project, an incinerator located in Newport, Minnesota, receives about $10 million in subsidies from Ramsey and Washington Counties each year (Ramsey/Washington County Resource Recovery Project 2012).
Finished Compost in Use
50
In the case of composting, this tip fee, combined with the sale of the finished product, covers the cost of processing compost. As the value of the finished product increases, the cost of tipping the material could potentially decrease. This has proven true with the development of recycling markets over the past twenty years; the value of the materials is now generally greater than the cost of processing. Most city recycling contracts in the Twin Cities area receive a share of the revenue from the sale of their recycling, a practice pioneered by Eureka Recycling to demonstrate the value of recyclable materials. As the value of finished compost increases due to the development of compost markets, the value of this material will also become more widely understood. There are currently two compost facilities within an hour of the Twin Cities that are permitted to accept SSO: Shakopee Mdewakanton Sioux Community Facility and Specialized Environmental Technologies (SET). These two facilities have greatly increased the compost processing capacity in the region over the past three years. R. Alexander Associates, Inc. surveyed the current compost market and researched both industrial compost processing facilities in the region as well as retail garden centers selling local compost. This survey found that current markets for compost products within the horticultural sector in the Twin Cities have not matured as much as they have in other parts of the country. While the product does serve as a well-known soil amendment to the landscaping trade and the Minnesota Department of Transportation, composters stated that more work is required to expand compost markets and increase its value. With the recent recession, compost value has decreased and sales are slightly stagnant. This circumstance is expected during difficult economic times, and should be seen as a temporary anomaly. In the Twin Cities compost market many regional composters sell their bulk compost directly to residents. In many other markets, this is primarily done through bulk material resellers (e.g., garden centers, topsoil yards, etc.). When composters sell directly to the public at a price that is lower than the retail market price, it provides a disincentive to garden centers and landscape supply yards to carry the product. Based on the resellers contacted, it is apparent that many of them still carry bulk compost, and do so at only a slightly depressed price. Many resellers, including mass merchants, also sell compost in bagged form. It should be noted that environmental applications of compost (e.g., erosion control, rain gardens, etc.) are growing in the Twin Cities, which is a positive sign for the marketplace. Both composters and resellers are also producing a variety of soil-type mixes containing compost, which is a sign of a maturing marketplace. The compost marketplace in the Twin Cities is a work
Finished Compost
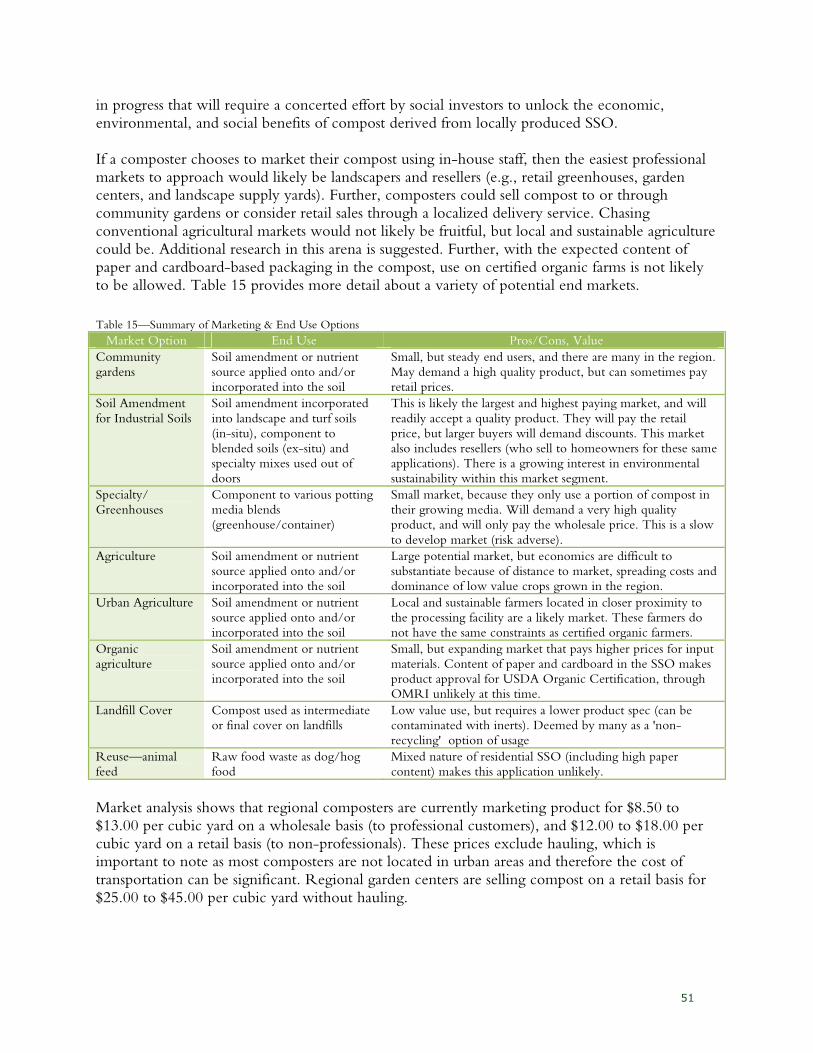
51
in progress that will require a concerted effort by social investors to unlock the economic, environmental, and social benefits of compost derived from locally produced SSO. If a composter chooses to market their compost using in-house staff, then the easiest professional markets to approach would likely be landscapers and resellers (e.g., retail greenhouses, garden centers, and landscape supply yards). Further, composters could sell compost to or through community gardens or consider retail sales through a localized delivery service. Chasing conventional agricultural markets would not likely be fruitful, but local and sustainable agriculture could be. Additional research in this arena is suggested. Further, with the expected content of paper and cardboard-based packaging in the compost, use on certified organic farms is not likely to be allowed. Table 15 provides more detail about a variety of potential end markets.
Table 15—Summary of Marketing & End Use Options
Market Option End Use Pros/Cons, Value
Community
gardens
Soil amendment or nutrient
source applied onto and/or
incorporated into the soil
Small, but steady end users, and there are many in the region.
May demand a high quality product, but can sometimes pay
retail prices.
Soil Amendment
for Industrial Soils
Soil amendment incorporated
into landscape and turf soils
(in-situ), component to
blended soils (ex-situ) and
specialty mixes used out of
doors
This is likely the largest and highest paying market, and will
readily accept a quality product. They will pay the retail
price, but larger buyers will demand discounts. This market
also includes resellers (who sell to homeowners for these same
applications). There is a growing interest in environmental
sustainability within this market segment.
Specialty/
Greenhouses
Component to various potting
media blends
(greenhouse/container)
Small market, because they only use a portion of compost in
their growing media. Will demand a very high quality
product, and will only pay the wholesale price. This is a slow
to develop market (risk adverse).
Agriculture Soil amendment or nutrient
source applied onto and/or
incorporated into the soil
Large potential market, but economics are difficult to
substantiate because of distance to market, spreading costs and
dominance of low value crops grown in the region.
Urban Agriculture Soil amendment or nutrient
source applied onto and/or
incorporated into the soil
Local and sustainable farmers located in closer proximity to
the processing facility are a likely market. These farmers do
not have the same constraints as certified organic farmers.
Organic
agriculture
Soil amendment or nutrient
source applied onto and/or
incorporated into the soil
Small, but expanding market that pays higher prices for input
materials. Content of paper and cardboard in the SSO makes
product approval for USDA Organic Certification, through
OMRI unlikely at this time.
Landfill Cover Compost used as intermediate
or final cover on landfills
Low value use, but requires a lower product spec (can be
contaminated with inerts). Deemed by many as a 'non-
recycling' option of usage
Reuse—animal
feed
Raw food waste as dog/hog
food
Mixed nature of residential SSO (including high paper
content) makes this application unlikely.
Market analysis shows that regional composters are currently marketing product for $8.50 to $13.00 per cubic yard on a wholesale basis (to professional customers), and $12.00 to $18.00 per cubic yard on a retail basis (to non-professionals). These prices exclude hauling, which is important to note as most composters are not located in urban areas and therefore the cost of transportation can be significant. Regional garden centers are selling compost on a retail basis for $25.00 to $45.00 per cubic yard without hauling.
52
Challenges and Opportunities There are several large composters producing substantial product quantities. Most do not employ full time compost marketing staff, which is one reason for the stagnated growth of compost markets in the area. As mentioned above, the current market has a significant range in sale price without significant differentiation in product quality and grade. All current SSO processors utilize aerobic systems. As seen in the analysis of anaerobic digestion, the compost end-product would have lower quality. This lower quality would most likely be represented in compost product pricing. However, further analysis would be needed once such systems come on line and are selling compost product into the wholesale and retail markets, particularly those applicable to more urban contexts.
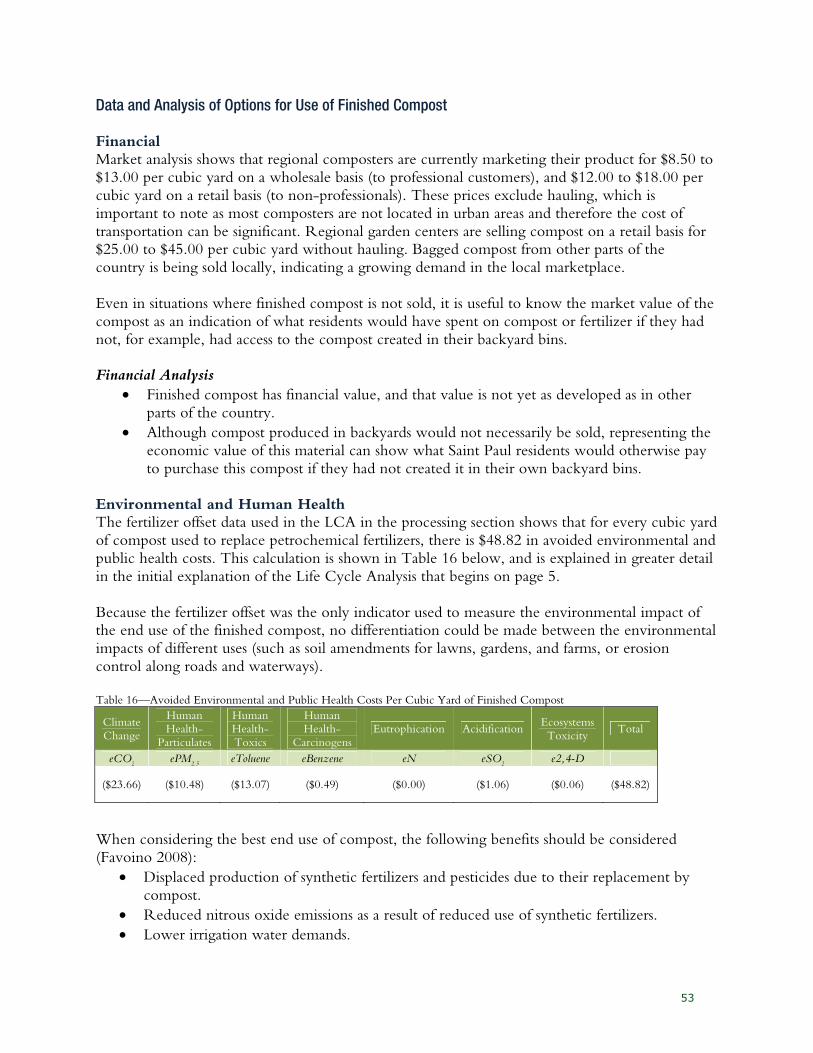
53
Data and Analysis of Options for Use of Finished Compost Financial Market analysis shows that regional composters are currently marketing their product for $8.50 to $13.00 per cubic yard on a wholesale basis (to professional customers), and $12.00 to $18.00 per cubic yard on a retail basis (to non-professionals). These prices exclude hauling, which is important to note as most composters are not located in urban areas and therefore the cost of transportation can be significant. Regional garden centers are selling compost on a retail basis for $25.00 to $45.00 per cubic yard without hauling. Bagged compost from other parts of the country is being sold locally, indicating a growing demand in the local marketplace. Even in situations where finished compost is not sold, it is useful to know the market value of the compost as an indication of what residents would have spent on compost or fertilizer if they had not, for example, had access to the compost created in their backyard bins. Financial Analysis
• Finished compost has financial value, and that value is not yet as developed as in other parts of the country.
• Although compost produced in backyards would not necessarily be sold, representing the economic value of this material can show what Saint Paul residents would otherwise pay to purchase this compost if they had not created it in their own backyard bins.
Environmental and Human Health The fertilizer offset data used in the LCA in the processing section shows that for every cubic yard of compost used to replace petrochemical fertilizers, there is $48.82 in avoided environmental and public health costs. This calculation is shown in Table 16 below, and is explained in greater detail in the initial explanation of the Life Cycle Analysis that begins on page 5. Because the fertilizer offset was the only indicator used to measure the environmental impact of the end use of the finished compost, no differentiation could be made between the environmental impacts of different uses (such as soil amendments for lawns, gardens, and farms, or erosion control along roads and waterways). Table 16—Avoided Environmental and Public Health Costs Per Cubic Yard of Finished Compost
Climate
Change
Human Health-
Particulates
Human Health-
Toxics
Human Health-
Carcinogens
Eutrophication Acidification Ecosystems
Toxicity Total
eCO2 ePM
2.5 eToluene eBenzene eN eSO
2 e2,4-D
($23.66) ($10.48) ($13.07) ($0.49) ($0.00) ($1.06) ($0.06) ($48.82)
When considering the best end use of compost, the following benefits should be considered (Favoino 2008):
• Displaced production of synthetic fertilizers and pesticides due to their replacement by compost.
• Reduced nitrous oxide emissions as a result of reduced use of synthetic fertilizers.
• Lower irrigation water demands.
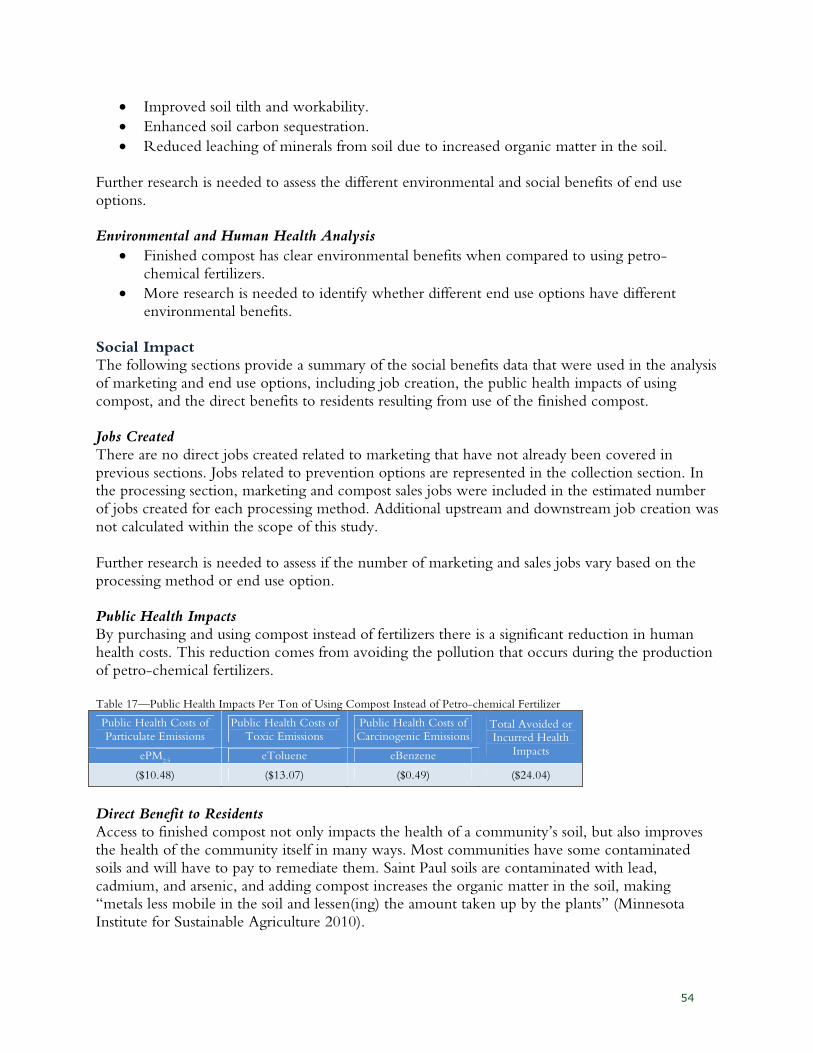
54
• Improved soil tilth and workability.
• Enhanced soil carbon sequestration.
• Reduced leaching of minerals from soil due to increased organic matter in the soil.
Further research is needed to assess the different environmental and social benefits of end use options. Environmental and Human Health Analysis
• Finished compost has clear environmental benefits when compared to using petro-chemical fertilizers.
• More research is needed to identify whether different end use options have different environmental benefits.
Social Impact The following sections provide a summary of the social benefits data that were used in the analysis of marketing and end use options, including job creation, the public health impacts of using compost, and the direct benefits to residents resulting from use of the finished compost. Jobs Created There are no direct jobs created related to marketing that have not already been covered in previous sections. Jobs related to prevention options are represented in the collection section. In the processing section, marketing and compost sales jobs were included in the estimated number of jobs created for each processing method. Additional upstream and downstream job creation was not calculated within the scope of this study. Further research is needed to assess if the number of marketing and sales jobs vary based on the processing method or end use option. Public Health Impacts By purchasing and using compost instead of fertilizers there is a significant reduction in human health costs. This reduction comes from avoiding the pollution that occurs during the production of petro-chemical fertilizers. Table 17—Public Health Impacts Per Ton of Using Compost Instead of Petro-chemical Fertilizer
Public Health Costs of
Particulate Emissions
Public Health Costs of
Toxic Emissions
Public Health Costs of
Carcinogenic Emissions Total Avoided or Incurred Health
Impacts ePM2.5
eToluene eBenzene
($10.48) ($13.07) ($0.49) ($24.04)
Direct Benefit to Residents Access to finished compost not only impacts the health of a community’s soil, but also improves the health of the community itself in many ways. Most communities have some contaminated soils and will have to pay to remediate them. Saint Paul soils are contaminated with lead, cadmium, and arsenic, and adding compost increases the organic matter in the soil, making “metals less mobile in the soil and lessen(ing) the amount taken up by the plants” (Minnesota Institute for Sustainable Agriculture 2010).
55
Community gardens also rely on compost to revitalize urban soil, allowing them to grow quality food and keep gardeners engaged. Based on a study done in New York, well-kept community gardens had a direct effect on housing prices (Been 2006). In poor neighborhoods, the gardens raised housing prices by almost 10% in the five years after they were initiated. In addition, finished compost creates the following direct benefits:
• Finished compost can be a powerful tool for community-building when it is used as a resource to support existing local food and community gardening movements.
• Residents who compost in their backyards do not have to purchase compost or petro-chemical fertilizers.
• Access to compost enables growth of local, healthy food. Most often community gardens can help to provide access to affordable local, healthy food.
• Further research needed as to the exact relationship between access to affordable compost and cost to residents of local, healthy food from urban or rural farms.
Social Impact Analysis
• When finished compost is returned to the community, it creates innumerable social benefits. For example, compost is one of the best ways to revitalize contaminated urban soils, and is a vital component to community gardening, which has been shown to increase the value of surrounding houses.
• Currently, there is not enough data to complete a comparison of the difference in social benefits created by each of the possible end uses of finished compost.
56
Use of Finished Compost Findings
• In the current market, finished compost from Saint Paul could be sold for up to $45 per yard, and this value will increase over the long term as the compost market develops.
• There is a critical need for healthy soil everywhere, and especially in urban communities like Saint Paul, where soils are contaminated with lead, cadmium, and arsenic. Adding compost is one of the best ways to remediate this contaminated soil.
• As a soil amendment compost has many uses, such as for playgrounds, community gardens, lawns, farms, and parks. Compost also aids erosion control along roadside beds and waterways. Any time compost is used to displace petrochemical fertilizers, $48.82 in environmental and human health costs are saved per ton of material composted.
• Finished compost can also be a powerful tool for community-building when it is used as a resource to support existing local food and community-gardening movements. Community gardens have a direct effect on housing prices in areas where they are well kept, and consistent access to compost is critical for urban farmers and community gardeners.
• Residents who compost in their backyards do not have to purchase compost or petrochemical fertilizers.
57
Zero-Waste Composting Recommendations
The recommendations are based on our comparative analysis (described below and detailed in the full report), which was conducted in Saint Paul, Minnesota. These findings are the key elements that distinguish a successful zero-waste composting program and are relevant for any zero-waste composting program.
Prevention All composting programs should include a prevention component that encourages residents to prevent wasted food and to compost in their backyard. Prevention is by far the most cost-effective and environmentally beneficial way to manage food waste.
• Prevention programs completely eliminate transportation emissions since the material is reduced or handled on site. Avoiding transportation saves between $1.37 and $52.65 per ton in environmental and human health costs (depending on how the SSO is collected).
• While not all organic waste is preventable (like banana peels) or possible to compost in a backyard (like meat or nonrecyclable paper), including prevention with another collection method can reduce the per-ton program costs by more than $100/ton.
Co-Collection After as much prevention as possible, collection of the remaining SSO should be designed to leverage a community’s existing infrastructure to most efficiently collect material with the lowest costs and least transportation emissions.
• Co-collection of composting with another material on one truck reduces the number of trucks needed for collection. A dedicated route costs over twice as much as co-collection with yard waste and nearly 1.5 times more than co-collection with recycling. The emissions from a dedicated route have an environmental cost almost six times more harmful than co-collection with yard waste or recycling.
• In Saint Paul the least expensive collection method is co-collection of SSO with recycling (in a separate compartment on the same trucks). Commingling SSO with yard waste (in the same compartment in the same truck) has the lowest cost per ton, but the net cost would be over twice as much as co-collection with recycling. This is true because Saint Paul currently has an organized curbside collection infrastructure for recycling and none for yard waste. Therefore, co-collection with yard waste would add the cost of collecting the additional yard waste into the equation. In cities that have existing yard waste collection, the analysis would differ.
Drop-off Collection Drop-off sites should not be considered as a main strategy for collecting SSO from a large urban community like Saint Paul because of its comparatively high cost, large impact from emissions, and low participation rate. However, drop-offs can play an important role in providing immediate access to all residents during a new program rollout or to those living in multifamily buildings.
• The emissions from drop-offs are 38 times more environmentally harmful per ton compared to co-collection. This is because of the high emissions from residents’ vehicles making dedicated trips to the drop-off site every week. Dedicated trips are most likely because it is difficult and/or undesirable to combine this trip with an existing trip when hauling food waste in a compost bin in a car.
• Drop-offs have low participation rates. Study results show that over 8 times as much material is recovered from a curbside collection program versus a drop-off site program.
58
• The per ton cost of a drop-off program is 40% more than the cost of a curbside program that uses co-collection with recycling.
• Adding compost collection to an existing recycling drop-off site can mitigate some of the cost impact, however the nature of hauling food waste in a car will still result in high emissions from dedicated trips.
SSO Processing After as much prevention as possible, the remaining residential SSO should be brought to a facility that will compost the material aerobically (such as in a static pile or windrow, as opposed to anaerobic digestion). Aerobic composting provides the best economic, social, and environmental benefits.
• Preventing wasted food provides the greatest environmental impact by reducing the upstream production and transportation emissions; it creates two times more environmental benefits than co-collection with recycling and aerobic compost processing.
• Aerobic composting methods (which are the methods most commonly used by compost processors) provide a savings of $83 per ton in environmental and human health costs when compared with disposal. For this analysis, the impacts of disposal were calculated using the average current disposal methods in Saint Paul, 34% landfill and 66% incineration, taking into account energy generation from incineration and from landfill methane capture.
• While anaerobic digestion (AD) processing methods do generate a net environmental benefit, aerobic composting methods result in almost twice as many environmental benefits than dry AD and four times more than wet AD—even after factoring in the benefit of energy production from AD. Also, this analysis shows that the type and volume of material produced in a residential program is not well suited to AD because its composition is highly variable and it has a relatively low Btu value per ton of input due to its high paper content.
• Any facility should be appropriately sized. With zero-waste composting, it is important to consider that the amount and type of material to be processed will change because of future food waste reduction, packaging legislation, and backyard composting efforts. Overbuilding capacity for recycling or composting, as we have seen done with waste disposal, inhibits prevention because the facility is financially built to work at a larger size, thereby creating economic and political pressure to deliver more tons to the facility, not reduce how much goes there.
Use of Finished Compost A mechanism to use finished compost locally—and funding for that mechanism—should be built into a composting program to maximize the community’s benefits.
• There is a critical need for healthy soil everywhere, especially in urban communities like Saint Paul. Using compost to displace petrochemical fertilizers saves $48.82 in environmental and human health costs for every ton of compost used.
• Bringing finished compost back to a community can be a powerful tool for community building—especially when used as soil remediation or a resource to support existing local food and community gardening movements. As demand for finished compost increases, it will be important for communities to prioritize and establish mechanisms that ensure the community benefits from the compost and supports how the compost is distributed.
59
• Although finished-compost return adds to the cost of the program, soil is currently being shipped in at a greater cost to the community from other parts of the state, and sometimes even from out of state.
Leveraging Existing Infrastructure A community’s composting program should be designed to utilize and expand on existing infrastructure. This approach improves cost-effectiveness by minimizing capital expenses and allowing for efficiencies of scale. It improves environmental impact by reducing the number of trucks and processing equipment required. It also improves the social benefits of the program by increasing access to residents and providing a comprehensive education message that ties together related issues.
• For prevention, an education campaign can be combined with other environmental issues that are important in the community (such as energy conservation).
• As demonstrated above, using the existing recycling infrastructure for collection provides significant environmental and economic benefits. The same would be true with expanding an existing recycling drop-off site to include compost.
• Utilizing existing processing capacity is significant to address the cost effectiveness of a program. As discussed in detail in the full report, larger scale facilities have significantly lower processing costs. When possible, utilizing an existing facility in a community can allow a smaller program to benefit from lower processing costs without building a facility.
Alternative Options As part of this study, alternative systems such as bike collection and composting at community gardens were studied. There were numerous benefits to these methods; however, in the context of a citywide program, they were not included in this evaluation due to limited scalability or logistical constraints. More information about these methods can be found in the full report.
Local Context: Zero Waste in Saint Paul
A detailed, triple bottom line analysis requires the gathering of data that is specific to every community. Every program has unique features and exists in a local context. Below is a description of the context in which we did this work. As a nonprofit organization, Eureka Recycling offers this report to other communities as a demonstration of how this type of analysis could support them in working towards their own zero-waste goals, just as the results of this report will support Eureka Recycling in continuing to work with the City of Saint Paul in pursuit of the City’s zero-waste goals.
Recycling, Eureka Recycling, and Zero Waste in Saint Paul A feature of Saint Paul’s program is that it has partnered with a nonprofit organization in the delivery of its source reduction, recycling, and composting programs for over 20 years. Eureka Recycling is one of only a handful of nonprofit organizations in the country that focuses exclusively on zero waste and has been Saint Paul’s partner for over a decade. Saint Paul is recognized in the country (as is Ramsey County, whose population is served mostly by Eureka Recycling) as a leader in recycling programs with a recycling rate that is usually reached only by cities with bottle deposit legislation. Unfortunately, Minnesota does not have any such laws. Saint Paul’s partnership with a nonprofit organization for recycling began in the early days of
curbside recycling. Recycling started in the neighborhoods of Saint Paul, and when it grew beyond fledgling capacity, the City enlisted the Saint Paul Neighborhood Energy Consortium (NEC) to help with recycling. This partnership grounded both the management of the service contract (with a local hauler) and the education for the program with a nonprofit that was mission-driven to ensure program decisions were made to be responsive to the community and for the highest environmental benefits. Since its beginnings, recycling in Saint Paul has been organized under one contract, which includes all residential users (not just homeowners, but apartment and condominium dwellers, too—another first in the country, led by Pat Schoenecker and others at NEC). In the late 1990s, the Twin Cities experienced a monopolization of the recycling infrastructure. The NEC convened the neighborhoods, Ramsey County, the City of Saint Paul, and other interested parties to determine how to address the situation, including limited processing capacity, consolidation, and increasing prices for the same level of services. Since Ramsey County ceased support for its recycling processing capacity, small haulers would have to take their materials to a sole multinational competitor, greatly reducing their ability to stay in or enter the market. In 2000, the NEC decided to launch a separate nonprofit organization to focus on zero waste, directly provide recycling and processing services to the City of Saint Paul and surrounding cities, and open up competitive processing for small haulers. This assured that the community’s recycling efforts could stay local where the greatest economic benefit could be had. The City of Saint Paul could stave off fee increases of 40%, which had been proposed by the subcontractor (Waste Management, Inc.). The City could also ensure that continued education and advocacy would be at the heart of the work, because Eureka Recycling’s sole purpose as a community-based nonprofit was and is to meet the city’s zero-waste goals.
61
In 2003, Eureka Recycling and the City of Saint Paul partnered to make significant changes to the recycling program, adding plastics and bottles to curbside collection and simplified sorting to two streams: paper and containers. At that time, both Eureka Recycling and the City set their sights on composting. In 2005, Eureka Recycling and the City of Saint Paul conducted the Saint Paul Environmental Roundtable, which led to the city’s “zero waste by 2020” goal, established by the citizens of Saint Paul, which included, among other objectives, curbside collection of composting. Over the past decade, there have been multiple pilots to address questions of how to best add composting. In 2012, Eureka Recycling made a proposal to the City to move toward its zero-waste goal. The City of Saint Paul is currently conducting a public process to gather input from the community and key stakeholders about composting and other issues to determine future program initiatives and services.
Garbage in Saint Paul Garbage collection in Saint Paul is not organized by the City, but rather is an open system where residents hire their own garbage companies for service. Residents can chose from many local haulers and some multinational companies. Right now the City of Saint Paul is looking at the pros and cons of organized garbage collection. Ramsey County, where Saint Paul is located, is heavily invested in incineration as its preferred management system for garbage disposal over landfilling. Ramsey County collects a tax through the garbage haulers. The majority of this tax is used to subsidize the Resource Recovery Project, a refuse-derived fuel facility, which incentivizes haulers to use this facility over landfills that have lower fees. This facility ships its product to facilities in Red Wing and Mankato, Minnesota, to be burned. In 2011, the county collected $16.9 million from taxpayers, approximately half of that from Saint Paul residents. Residents see this as the County Environmental Charge on their garbage bill. There is a $12 million balance from this fund but it is being allocated for the debt service to purchase land on an old army ammunition site in Arden Hills, Minnesota. The site will be cleaned up and sold to developers. According to Ramsey County, an $8 million balance will remain in the fund. An additional $17.2 million will be collected in 2013, with approximately half of that money coming from Saint Paul residents.
Overview of Region and Regulatory Environment Saint Paul and Minneapolis, known as the Twin Cities, are at the center of the Twin Cities seven-county metropolitan area, which is home to 2.8 million people (Metropolitan Council 2012). This large population base and the Twin Cities' extensive suburbs are ideally suited for the use of compost. As illustrated in Table 18, this large population base also supports a substantial horticultural (lawn & garden) industry.
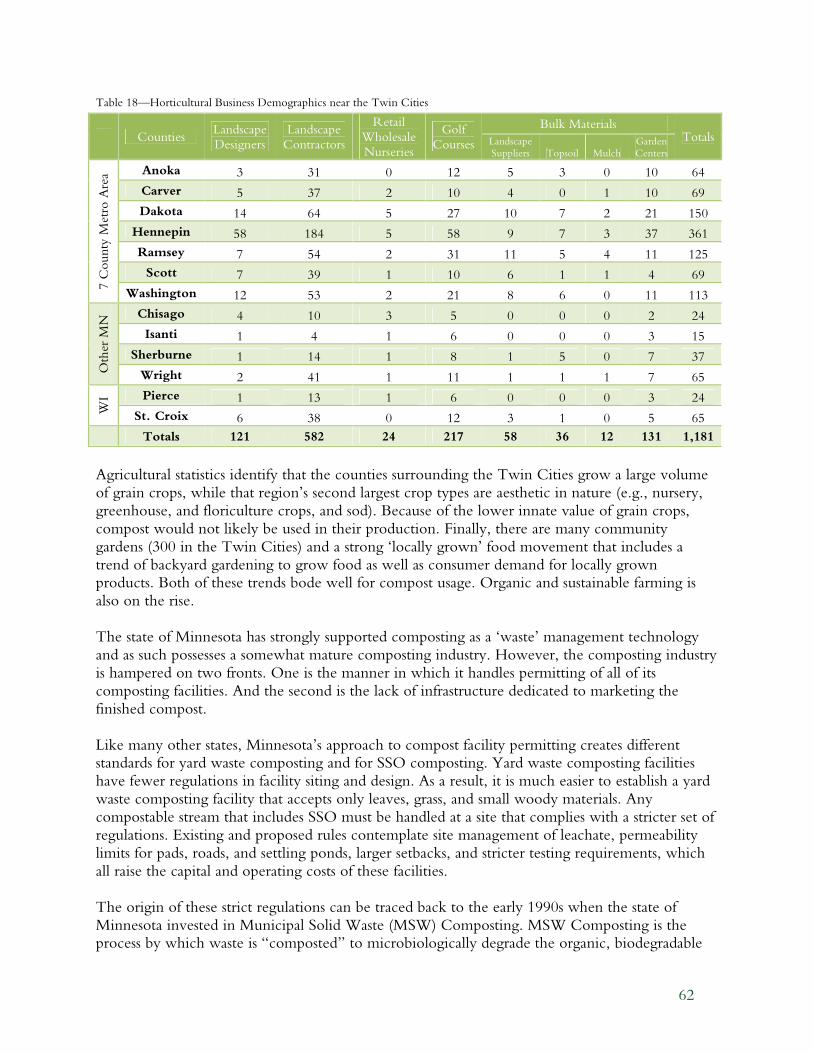
62
Table 18—Horticultural Business Demographics near the Twin Cities
Agricultural statistics identify that the counties surrounding the Twin Cities grow a large volume of grain crops, while that region’s second largest crop types are aesthetic in nature (e.g., nursery, greenhouse, and floriculture crops, and sod). Because of the lower innate value of grain crops, compost would not likely be used in their production. Finally, there are many community gardens (300 in the Twin Cities) and a strong ‘locally grown’ food movement that includes a trend of backyard gardening to grow food as well as consumer demand for locally grown products. Both of these trends bode well for compost usage. Organic and sustainable farming is also on the rise. The state of Minnesota has strongly supported composting as a ‘waste’ management technology and as such possesses a somewhat mature composting industry. However, the composting industry is hampered on two fronts. One is the manner in which it handles permitting of all of its composting facilities. And the second is the lack of infrastructure dedicated to marketing the finished compost. Like many other states, Minnesota’s approach to compost facility permitting creates different standards for yard waste composting and for SSO composting. Yard waste composting facilities have fewer regulations in facility siting and design. As a result, it is much easier to establish a yard waste composting facility that accepts only leaves, grass, and small woody materials. Any compostable stream that includes SSO must be handled at a site that complies with a stricter set of regulations. Existing and proposed rules contemplate site management of leachate, permeability limits for pads, roads, and settling ponds, larger setbacks, and stricter testing requirements, which all raise the capital and operating costs of these facilities. The origin of these strict regulations can be traced back to the early 1990s when the state of Minnesota invested in Municipal Solid Waste (MSW) Composting. MSW Composting is the process by which waste is “composted” to microbiologically degrade the organic, biodegradable
Counties Landscape
Designers
Landscape
Contractors
Retail
Wholesale
Nurseries
Golf
Courses
Bulk Materials Totals Landscape
Suppliers Topsoil Mulch Garden Centers
7 C
ounty
Met
ro A
rea Anoka 3 31 0 12 5 3 0 10 64
Carver 5 37 2 10 4 0 1 10 69
Dakota 14 64 5 27 10 7 2 21 150
Hennepin 58 184 5 58 9 7 3 37 361
Ramsey 7 54 2 31 11 5 4 11 125
Scott 7 39 1 10 6 1 1 4 69
Washington 12 53 2 21 8 6 0 11 113
Oth
er M
N Chisago 4 10 3 5 0 0 0 2 24
Isanti 1 4 1 6 0 0 0 3 15
Sherburne 1 14 1 8 1 5 0 7 37
Wright 2 41 1 11 1 1 1 7 65
WI Pierce 1 13 1 6 0 0 0 3 24
St. Croix 6 38 0 12 3 1 0 5 65
Totals 121 582 24 217 58 36 12 131 1,181
63
portion of the waste stream. This form of solid waste management was designed to reduce the amount of waste that would otherwise end up in landfills, and is not true composting, since it does not create a valuable soil amendment. In Minnesota, MSW Composting was not successful; however, it was the state’s first effort at composting and set the precedent for many of the rules still in effect. The regulations for SSO in Minnesota are better suited for a landfill than a compost pile. Minnesota’s composting rules are currently being revised to be less restrictive, and an allowance has been made for community-level composters who would like to compost garden wastes along with some household organics at local sites with a maximum of 80 cubic yards of material.
Interest in Anaerobic Digestion Anaerobic digestion (AD) is a processing method for source separated organics (SSO) that can generate energy, and the resulting digestate can be composted to create a soil amendment. AD has appealed to some communities throughout the nation that are looking for ways to reduce waste and generate local, sustainable sources of energy. This technology is becoming more widely used throughout the European Union, with more than 70 new plants installed between 2006 and 2010
(De Baere 2010). According to BioCycle magazine, in 2011 there were 167 digesters operating in the United States, with the vast majority of them being small, farm-scale systems that process livestock manure. Eleven of these were centralized regional systems (Costa 2011). The Twin Cities of Saint Paul and Minneapolis, Minnesota are no exception. In recent years, a number of local groups have completed AD feasibility studies based on waste data for the region. Most recently, in 2009, the Ramsey Washington Counties Resource Recovery Project Board and the Saint Paul Port Authority published a feasibility study that looked at AD as an option for processing SSO. Their study provides a valuable analysis of what it would take to build an anaerobic digester in the Twin Cities, as well as of the quantity of SSO such a system would require. However, their study was not designed to take an in-depth look at what it would take to collect the residential SSO feedstock that would be needed as feedstock for the AD system. Their study estimates potential SSO feedstock based on data reported by the eight counties surrounding the Twin Cities, and notes that further study is needed to fully understand the market for this feedstock (Foth Infrastructure & Environment, LLC 2009).
Zero-Waste Composting Proposal for Saint Paul Eureka Recycling created a proposal for a zero-waste composting program for the City of Saint Paul based on the recommendations in this report. Here we demonstrate how the data in this report was applied to create the proposal for comprehensive citywide, community, zero-waste compost program in Saint Paul, which can be found in full at www.makedirtnotwaste.org. For the proposal, Eureka Recycling integrated prevention and composting into the existing infrastructure and local resources to maximize the social, environmental, and economic benefits for Saint Paul. For example: Our prevention education is designed to be combined with other community efforts. This community program uses the existing recycling infrastructure to collect SSO in separate compartments on the same trucks. There is existing processing capacity for aerobic composting in the Twin Cities, so we are able to achieve a much lower cost using a tip fee at an existing facility. Table 19 below is a summary of the economic and environmental cost of all of the options explored in this report.
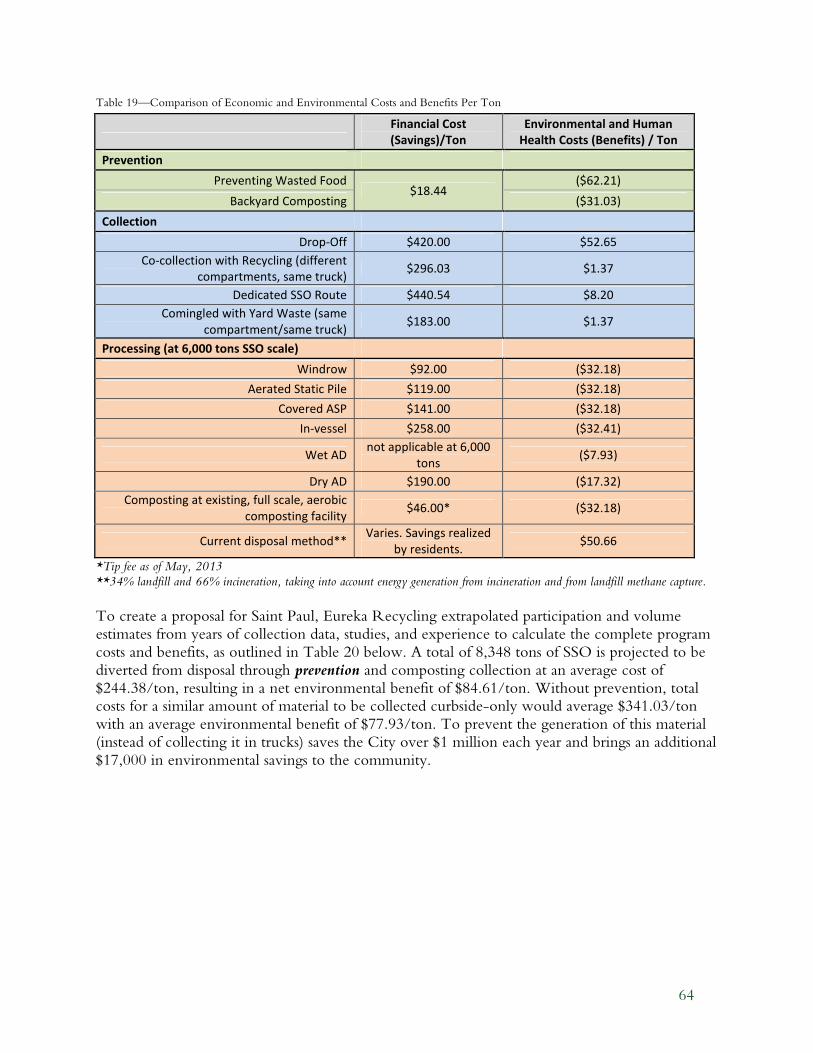
64
Table 19—Comparison of Economic and Environmental Costs and Benefits Per Ton
Financial Cost
(Savings)/Ton
Environmental and Human
Health Costs (Benefits) / Ton
Prevention
Preventing Wasted Food $18.44
($62.21)
Backyard Composting ($31.03)
Collection
Drop-Off $420.00 $52.65
Co-collection with Recycling (different
compartments, same truck) $296.03 $1.37
Dedicated SSO Route $440.54 $8.20
Comingled with Yard Waste (same
compartment/same truck) $183.00 $1.37
Processing (at 6,000 tons SSO scale)
Windrow $92.00 ($32.18)
Aerated Static Pile $119.00 ($32.18)
Covered ASP $141.00 ($32.18)
In-vessel $258.00 ($32.41)
Wet AD not applicable at 6,000
tons ($7.93)
Dry AD $190.00 ($17.32)
Composting at existing, full scale, aerobic
composting facility $46.00* ($32.18)
Current disposal method** Varies. Savings realized
by residents. $50.66
*Tip fee as of May, 2013
**34% landfill and 66% incineration, taking into account energy generation from incineration and from landfill methane capture.
To create a proposal for Saint Paul, Eureka Recycling extrapolated participation and volume estimates from years of collection data, studies, and experience to calculate the complete program costs and benefits, as outlined in Table 20 below. A total of 8,348 tons of SSO is projected to be diverted from disposal through prevention and composting collection at an average cost of $244.38/ton, resulting in a net environmental benefit of $84.61/ton. Without prevention, total costs for a similar amount of material to be collected curbside-only would average $341.03/ton with an average environmental benefit of $77.93/ton. To prevent the generation of this material (instead of collecting it in trucks) saves the City over $1 million each year and brings an additional $17,000 in environmental savings to the community.
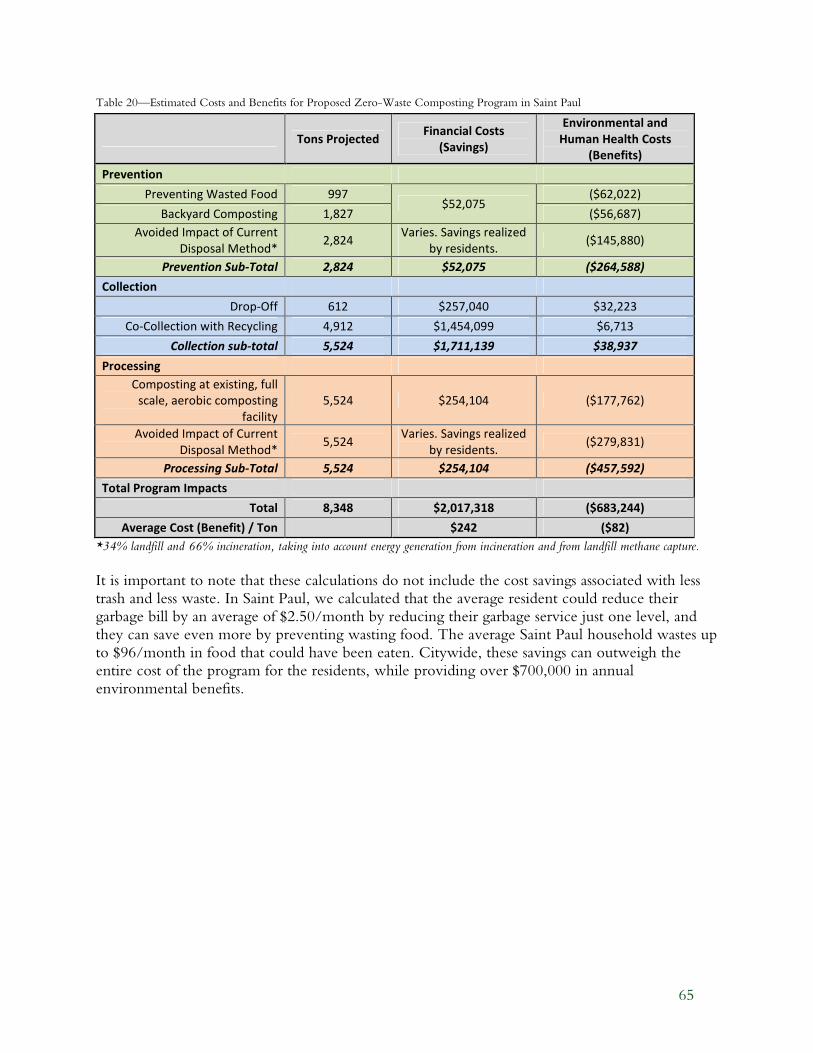
65
Table 20—Estimated Costs and Benefits for Proposed Zero-Waste Composting Program in Saint Paul
Tons Projected Financial Costs
(Savings)
Environmental and
Human Health Costs
(Benefits)
Prevention
Preventing Wasted Food 997 $52,075
($62,022)
Backyard Composting 1,827 ($56,687)
Avoided Impact of Current
Disposal Method* 2,824
Varies. Savings realized
by residents. ($145,880)
Prevention Sub-Total 2,824 $52,075 ($264,588)
Collection
Drop-Off 612 $257,040 $32,223
Co-Collection with Recycling 4,912 $1,454,099 $6,713
Collection sub-total 5,524 $1,711,139 $38,937
Processing
Composting at existing, full
scale, aerobic composting
facility
5,524 $254,104 ($177,762)
Avoided Impact of Current
Disposal Method* 5,524
Varies. Savings realized
by residents. ($279,831)
Processing Sub-Total 5,524 $254,104 ($457,592)
Total Program Impacts
Total 8,348 $2,017,318 ($683,244)
Average Cost (Benefit) / Ton $242 ($82)
*34% landfill and 66% incineration, taking into account energy generation from incineration and from landfill methane capture. It is important to note that these calculations do not include the cost savings associated with less trash and less waste. In Saint Paul, we calculated that the average resident could reduce their garbage bill by an average of $2.50/month by reducing their garbage service just one level, and they can save even more by preventing wasting food. The average Saint Paul household wastes up to $96/month in food that could have been eaten. Citywide, these savings can outweigh the entire cost of the program for the residents, while providing over $700,000 in annual environmental benefits.
66
Recommendations for Further Study of Zero-Waste
Composting
As a first look at the whole picture of zero-waste composting, this report provides a basic analysis framework for impact of prevention, collection, processing, and end-use applications of residential SSO. As we studied this work and continue to look more closely at zero-waste composting, we uncover additional questions, ideas, and concerns. As a nonprofit organization, Eureka Recycling is dedicated to this conversation and to bringing zero-waste composting to communities. When applying any zero-waste initiative locally, we carefully monitor the real-world impact to learn and share even more. The following are recommendations for further study—for Eureka Recycling and for others—to enrich our collective understanding of zero-waste composting and its impacts on communities. Develop prevention programs. This analysis has illustrated the immense value of these programs. Further research and development is recommended to increase participation and thus increase prevention—the most valuable aspect of a zero-waste composting program. We already know that community-based education and outreach have a lasting impact on individuals’ efforts to prevent and compost food waste, however, more community and political will is needed to bring targeted education and outreach programs to every community. Ensure the use of compost in the community, which is the most beneficial place to use compost. While a handful composting collection programs do return compost to their individual customers, more can be done to ensure that the soil amendment created is valued as a community resource and used in a way that creates the greatest possible benefit for the community as a whole. This work involves:
• An analysis and understating of a community’s need for compost application including the economic, social, and environmental benefits,
• Conducting a community process to develop criteria to prioritize the use of the compost for the greatest overall community benefit and to ensure that the distribution of the compost is endorsed by the community and does not cause additional conflict over this limited resource, and
• Creating methods for measuring the effectiveness of the application of compost to the selected soil.
Develop more thorough social impacts/benefits analysis. In recent years, much has been done to expand our analysis of environmental impacts and benefits. We now need social indicators that can be summed up in a concise, yet thorough way. Jeffery Morris is a leader in the development of environmental indicators that have social implications, specifically related to public health impacts. Eureka Recycling and others working on zero waste have used these to evaluate some of the social impacts of composting, recycling, and other zero-waste initiatives. Mr. Morris concurs that these are not complete social indicators and work needs to be done to further identify and measure social indicators. Extensive work has been done in other fields to develop methods to evaluate social impact and further work is needed to look at applying and adapting these methods to evaluate zero-waste efforts and to create universal acceptance for these indicators in the field of zero waste. For example, a May 2013 report from the Institute for Local Self-Reliance’s Composting Makes $en$e Project, Pay Dirt: Composting in Maryland to Reduce
67
Waste, Create Jobs, & Protect the Bay, documents the potential to create jobs by composting instead of disposal. Explore how community-garden efforts complement a comprehensive citywide program. Processing citywide residential SSO at urban community gardens is not feasible on a citywide scale as there are many challenges to establishing shared compost piles in community gardens. However, there are also many merits of community garden composting piles, which could make them great complements to a comprehensive citywide program. Efforts to establish public compost piles at community garden sites tend to be community-driven, contribute to community-building efforts, and the compost is used by the same community to grow food. Composting at community gardens is limited in capacity both by state regulation and overall capacity. Current state regulation allows community gardens to compost up to 80 cubic yards at one time. Any amount over that amount requires additional permitting. Community gardens cannot fulfill the size required to address citywide composting needs and cannot accept all items that can be composted. Residential SSO includes nonrecyclable paper, meat, and dairy products. Composting of residential SSO requires different management practices than community compost piles that compost more vegetative feedstock, which is often managed by volunteers. Processing all SSO tons from residential collection at urban community gardens requires year-round processing which is not possible for most community gardens. Managing odor and pests are major issues when composting large amounts of SSO. Drop-offs of any kind face challenges in getting consistent materials, as well as quality and contaminant-free materials. SSO composting requires training, coordination, and management outside the current scope of many volunteer-based community gardens. Currently, students at the University of St. Thomas in Saint Paul are studying community-garden efforts to learn more about the role, benefits, and challenges of community-garden drop-off sites in Saint Paul. Explore small in-vessel aerobic composting units to determine if they are viable options for use in small-scale community projects. These units reduce odors, collection impacts, and allow for very local (neighborhood-by-neighborhood) processing and redistribution of the soil to each community that generates it. Although operational costs appear to be similar, the capital costs on a per-ton basis are much higher when compared to a centralized windrow or aerated static pile composting system. There may be an opportunity to work with community gardens to process a portion of the residential SSO via in-vessel composting; however, this will require working with these community gardens to ensure year-round monitoring and support best management practices. Analyze scenarios that make anaerobic digestion a suitable choice for residential SSO feedstock. These could include anaerobic digestion of residential SSO in combination with other feedstock or adding partial-stream digestion to existing composting facilities. Use awareness-building about the benefits of composting to dispel myths and misunderstandings about our current waste system. For example, many people in Ramsey County do not know that the food scraps they send down their garbage disposals are destroyed in

68
an incinerator after taking a long journey through the waste treatment system. Another common misunderstanding is about food waste in landfills. Many people are surprised to learn that organic waste breaking down in a landfill (without oxygen) is the largest source of humans’ methane emissions, which is 70 times more potent than carbon dioxide emissions. Learning about the benefits of composting can shift people’s understanding and behavior toward beneficial actions by giving them a preferential and accessible option.
69
Bibliography Argonne National Laboratory & U.S. Department of Energy. GREET 1 2011 model. 2011.
http://greet.es.anl.gov/. Bare, Jane. "TRACI 2.0: The Tool for the Reduction and Assessment of Chemical and Other
Environmental Impacts 2.0." Clean Technologies and Environmental Policy, Volume 13,
Number 5, 2011: 687-696. Bare, Jane. "TRACI: The Tool for the Reduction and Assessment of Chemical and Other
Environmental Impacts." Journal of Industrial Ecology, Volume 6, 2002: 49-78. Been, Vicky and Ioan Voicu. "The Effect of Community Gardens on Neighboring Property
Values." New York University Law and Economics Working Papers, 2006: Paper 46. Carnegie Mellon. Economic Input-Output Life Cycle Assessment. 2002. http://www.eiolca.net/.
Civic Economics. Local Works: Examining the Impact of Local Business on the West Michigan Economy. Grand Rapids, Michigan: Local First, 2008.
Colon, Joan et al. "Environmental Assessment of Home Composting." Resources, Conservation and Recycling, Volume 54, Issue 11, September 2010: 893-904.
Costa, Allison. "AD Trends at a Glance." BioCycle, April 2011: 37.
De Baere, Luc and Mattheeuws, Bruno. "Anaerobic Digestion of MSW in Europe." BioCycle Energy, February 2010: 24-26.
Department of Ecology, State of Washington. Washington Clean Car Information. 2012. http://www.ecy.wa.gov/programs/air/cleancars.htm.
Eastern Research Group. "Draft Report: Cost Benefit Analysis for Six "Pure" Methods for Managing Leftover Latex Paint-Data, Assumptions and Methods, prepared for the Paint Product Stewardship Initiative." 2006.
EPA and the Research Triangle Institute. "MSW Decision Support Tool (DST)." 2002.
EPA. Technology Transfer Network Clearinghouse for Inventories & Emissions Factors. 1995. http://www.epa.gov/ttnchie1/ap42/.
EPA. Waste Reduction Model (WARM). 2012. http://www.epa.gov/climatechange/waste/calculators/Warm_home.html.
Eureka Recycling. "Development of Best Practices in Public Space Recycling." Saint Paul, MN, 2011.
Eureka Recycling. "Recycling, Composting and Greenhouse Gas Reductions in Minnesota."
Make Dirt Not Waste. 2008. http://www.makedirtnotwaste.org/sites/default/files/composting_recycling_greenhousegases.pdf (accessed January 2013).
Favoino, Enzo and Dominic Hogg. "The Potential Role of Compost in Reducing Greenhouse
Gases." Waste Management & Research February 2008 vol. 26 no. 1, 2008: 61-69.
Foth Infrastructure & Environment, LLC. Source Separated Organic Materials Anaerobic Digestion Feasibility Study. Saint Paul, MN: Ramsey/Washington Counties Resource Recovery Project Board and the St. Paul Port Authority, 2009.
Hall, Kevin, Juen Guo, Michael Dore, Carson Chow. "The Progressive Increase of Food Waste
in America and Its Environmental Impact." PLoS one Volume 4, issue 11, 2009. Hartwell, Sara. "Air Emissions." Environmental Protection Agency. November 15, 2007.
http://www.epa.gov/cleanenergy/energy-and-you/affect/airemissions. (accessed November 2008).
Kovach J, Petzoldt C, Degni J, Tette J. A Method to Measure the Environmental Impact of Pesticides. Geneva, NY: Integrated Pest Management Program Cornell University, New York State Agricultural Experimentation Station, 1992.
70
Leboe, Elizabeth. "Value and Benefits of Backyard Composting." Biocycle, October 2011: http://www.biocycle.net/2011/10/value-and-benefits-of-backyard-composting/.
Lippiatt, Barbara C. BEES 4.0: Building for Environmental and Economic Sustainability, Technical Manual and User Guide. Publication NISTIR 7423, Gaithersburg, MD: US Department of Commerce Technology Administration, National Institute of Standards and Technology, 2007.
McElroy, Mark, Renee J. Joma, Jo van Engelen. "Rethinking Social Capital Theory: a Knowledge Management Perspective." Journal of Knowledge Management, Vol 10 Iss: 5, 2006: 124-136.
Metropolitan Council. Snapshot of the Region. August 20, 2012. http://www.metrocouncil.org/about/region.htm.
Minnesota Institute for Sustainable Agriculture. "Urban Gardens and Soil Contaminants: A
Gardener's Guide to Healthy Soil." MISA Publications, University of Minnesota. March 2010. http://www.misa.umn.edu/Publications/index.htm#urban (accessed January 24, 2013).
Morris J, Bagby J. "Measuring Environmental Value for Natural Lawn and Garden Care
Practices." Int J LCA 13 (3), 2008: 226-234. Nelson, Carl. Energy Efficient Cities: Using a Community-Based Approach to Achieve Greater Results in
Comprehensive, Whole-House Energy-Efficiency Programs. Minneapolis, MN: Center for Energy and Environment, 2011.
Nelson, Carl. Renewing Rock-Tenn: A Biomass Fuels Assessment for Rock-Tenn's St. Paul Recycled Paper Mill. Saint Paul: The Green Institute, 2007.
O'Farrell, Kyle. Sustainability Fund Project: Sustainability Gains Through the Recovery of Unsold or Off-
specification food. Melbourne: www.fareshare.org.au, 2008. Ohio EPA. Drop-off Recycling in Ohio: Measuring and Understanding Participation & Program
Effectiveness. U.S. EPA Region 5, 2004. Patel, Amar and Garrett Martin. Going Local: Quantifying the Economic Impacts of Buying from Locally
Owned Businesses in Portland, Maine. Portland, Maine: Maine Center for Economic Policy, 2011.
Platt, et al. Stop Trashing the Climate. Institute for Local Self-Reliance, 2008. Platt, et al. Stop Trashing the Climate. Institute for Local Self-Reliance, 2008.
R.L. Polk & Co. "Average Age of Vehicles Reaches High, According to Polk." Polk Company Website. January 17, 2012. https://www.polk.com/company/news/average_age_of_vehicles_reaches_record_high_according_to_polk.
Ramsey/Washington County Resource Recovery Project. "Board Meetings, Meeting Materials."
Ramsey County. October 18, 2012. http://www.co.ramsey.mn.us/NR/rdonlyres/C85E23D9-EF87-4CAB-9FDF-55AC7A61551A/30689/October_18_Board_Meeting_Material1.pdf (accessed January 28, 2013).
Rice, G., Hammitt, J.K. Economic Valuation of Human Health Effects of Controlling Mercury Emissions from US Coal-Fired Power Plants. Northeast States for Coordinated Air Use Management, 2005.
RIS International Ltd. Feasibility of Generating Green Power through Anaerobic Digestion of Garden
Refuse from the Sacramento Area. Sacramento: SMUD Advanced Renewable and Distributed Generation Program, 2005.
RTI International. Municipal Solid Waste Decision Support Tool. 2012. https://mswdst.rti.org/index.htm.
71
Sander, Thomas H and Kathleen Lowney. Social Capital Building Toolkit. John F. Kennedy School of Government, Harvard University, 2005.
Stern, Nicholas. The Economics of Climate Change: The Stern Review. Cambridge University Press, 2007.
U.S. DOT Federal Highway Administration. "Highway Statistics 2009: State Motor Vehicle
Registrations 2009." U.S. Department of Transportation Federal Highway Administration Policy
Information. 2009. http://www.fhwa.dot.gov/policyinformation/statistics/2009/index.cfm#mv.
U.S. EPA. "Reducing Food Waste for Businesses." United States Environmental Protection Agency. January 8, 2013. http://www.epa.gov/foodrecovery/ (accessed January 28, 2013).
U.S. EPA, Office of Research and Development. "Economic Analysis of the Final Revisions to the National Pollutant Discharge Elimination System Regulation and the Effluent Guidelines for Concentrated Animal Feeding Operations. EPA-812-R-03-002." Washington, DC, 2002.
Venkat, Kumar. "The Climate Change and Economic Impacts of Food Waste in the United States." International Journal on Food System Dynamics 2(4), 2011: 431-446.
Verma, Shefali. Anaerobic Digestion of Biodegradable Organics in Municipal Solid Wastes. Columbia University, May 2002.
WRAP. "New Estimates for Household Food and Drink Waste in the UK." 2011.
WRAP. The Food We Waste. Banbury, Oxon: Exodus Market Research, 2008.
72
Appendices
Appendix A: Definitions & Abbreviations
• AD: anaerobic digestion.
• Aerobic composting method: processing methods that allow SSO to break down in the presence of oxygen, which prevents the creation of methane and other greenhouse gases. Aerobic methods are the most commonly used SSO processing methods.
• Anaerobic digestion: a processing method that causes SSO to break down, in the absence of oxygen, within a closed system that is designed to collect the resulting methane gas and use it to generate energy.
• Current disposal method: In this study, “current disposal method” is based on the average disposal methods for the City of Saint Paul, which are 34% landfill and 66% incineration. See Appendix E for details.
• Digestate: the solid and liquid material that comes out of an anaerobic digestion system.
• Environmental and human health costs: This phrase, when used throughout this study, refers to the estimated cost (or savings) related to damage to the environment and to human health as assessed in the life cycle analysis. For a detailed explanation of how this was calculated, see page 5.
• ICE: internal combustion engine.
• Life Cycle Analysis (LCA): a method of measuring the full impact of a system on the environment, using a number of specific environmental and human health indicators. A full description of the life cycle analysis used in this study can be found on page 5.
• MMBtu: a unit of energy, representing one million Btu (British Thermal Units).
• Organic material: In this study, organic material is used as a general term referring to compostable materials such as food scraps food scraps and peelings, wasted food, non-recyclable paper and certified products designed for composting.
• Source Separated Organics (SSO): residentially or commercially generated compostable materials that have been separated by the resident or business so that they can be collected for composting. Materials include food scraps and peelings, wasted food, non-recyclable paper and certified products designed for composting.
• Triple Bottom Line: A triple bottom line approach is based on the evaluation of the economic, social, and environmental impact of a project or decision. For a detailed explanation, see page 5.
• Wasted Food: a subset of SSO, this term refers to spoiled food that could have been eaten at one point that is discarded in a composting or waste system.
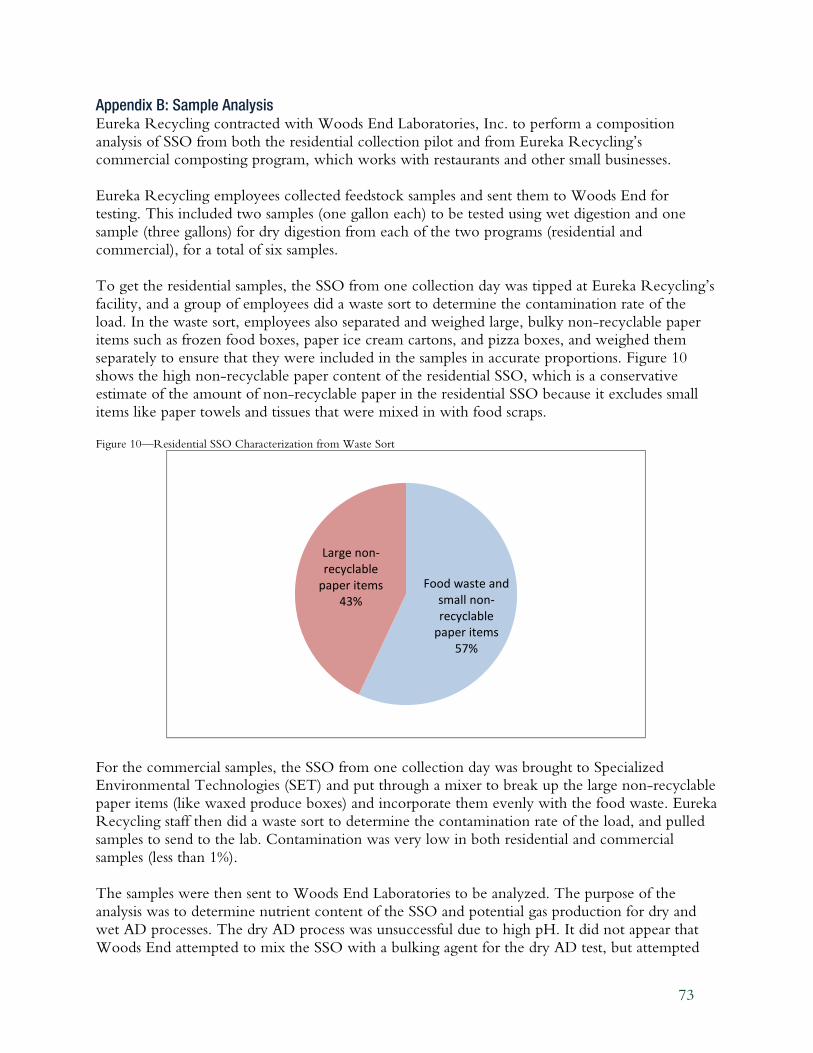
73
Appendix B: Sample Analysis Eureka Recycling contracted with Woods End Laboratories, Inc. to perform a composition analysis of SSO from both the residential collection pilot and from Eureka Recycling’s commercial composting program, which works with restaurants and other small businesses. Eureka Recycling employees collected feedstock samples and sent them to Woods End for testing. This included two samples (one gallon each) to be tested using wet digestion and one sample (three gallons) for dry digestion from each of the two programs (residential and commercial), for a total of six samples. To get the residential samples, the SSO from one collection day was tipped at Eureka Recycling’s facility, and a group of employees did a waste sort to determine the contamination rate of the load. In the waste sort, employees also separated and weighed large, bulky non-recyclable paper items such as frozen food boxes, paper ice cream cartons, and pizza boxes, and weighed them separately to ensure that they were included in the samples in accurate proportions. Figure 10 shows the high non-recyclable paper content of the residential SSO, which is a conservative estimate of the amount of non-recyclable paper in the residential SSO because it excludes small items like paper towels and tissues that were mixed in with food scraps. Figure 10—Residential SSO Characterization from Waste Sort
For the commercial samples, the SSO from one collection day was brought to Specialized Environmental Technologies (SET) and put through a mixer to break up the large non-recyclable paper items (like waxed produce boxes) and incorporate them evenly with the food waste. Eureka Recycling staff then did a waste sort to determine the contamination rate of the load, and pulled samples to send to the lab. Contamination was very low in both residential and commercial samples (less than 1%). The samples were then sent to Woods End Laboratories to be analyzed. The purpose of the analysis was to determine nutrient content of the SSO and potential gas production for dry and wet AD processes. The dry AD process was unsuccessful due to high pH. It did not appear that Woods End attempted to mix the SSO with a bulking agent for the dry AD test, but attempted
Food waste and
small non-
recyclable
paper items
57%
Large non-
recyclable
paper items
43%
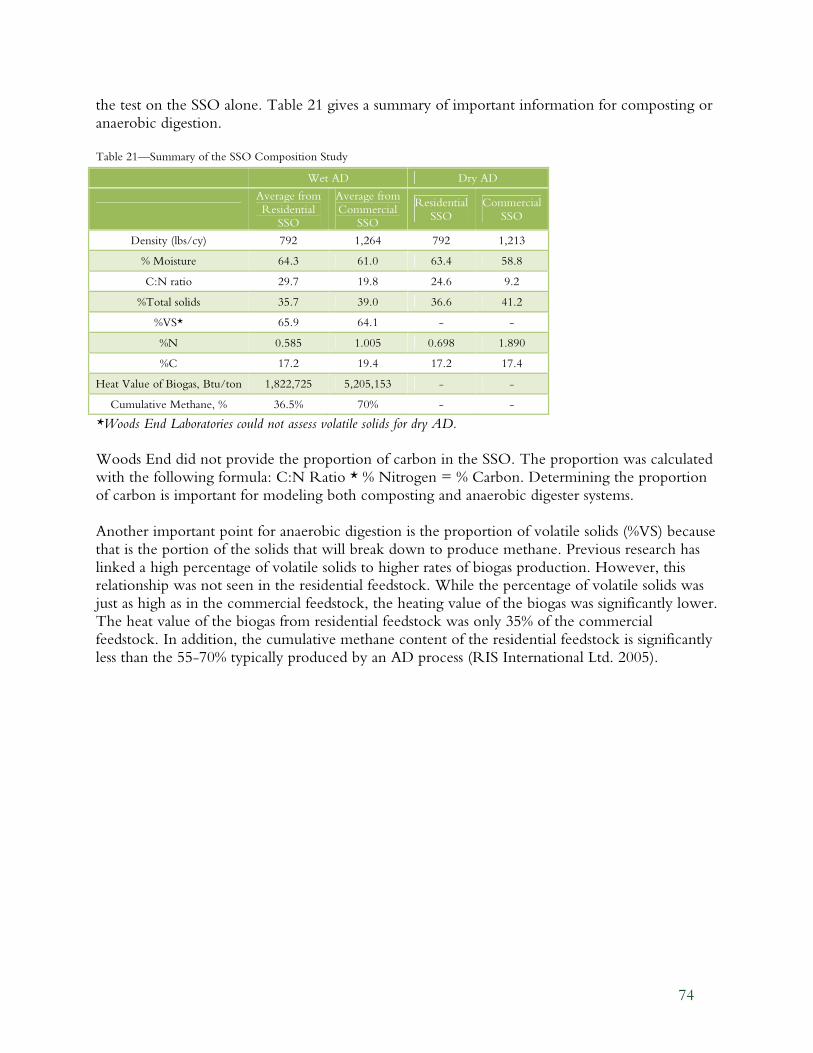
74
the test on the SSO alone. Table 21 gives a summary of important information for composting or anaerobic digestion. Table 21—Summary of the SSO Composition Study
Wet AD Dry AD
Average from
Residential SSO
Average from
Commercial SSO
Residential
SSO
Commercial
SSO
Density (lbs/cy) 792 1,264 792 1,213
% Moisture 64.3 61.0 63.4 58.8
C:N ratio 29.7 19.8 24.6 9.2
%Total solids 35.7 39.0 36.6 41.2
%VS* 65.9 64.1 - -
%N 0.585 1.005 0.698 1.890
%C 17.2 19.4 17.2 17.4
Heat Value of Biogas, Btu/ton 1,822,725 5,205,153 - -
Cumulative Methane, % 36.5% 70% - -
*Woods End Laboratories could not assess volatile solids for dry AD.
Woods End did not provide the proportion of carbon in the SSO. The proportion was calculated with the following formula: C:N Ratio * % Nitrogen = % Carbon. Determining the proportion of carbon is important for modeling both composting and anaerobic digester systems. Another important point for anaerobic digestion is the proportion of volatile solids (%VS) because that is the portion of the solids that will break down to produce methane. Previous research has linked a high percentage of volatile solids to higher rates of biogas production. However, this relationship was not seen in the residential feedstock. While the percentage of volatile solids was just as high as in the commercial feedstock, the heating value of the biogas was significantly lower. The heat value of the biogas from residential feedstock was only 35% of the commercial feedstock. In addition, the cumulative methane content of the residential feedstock is significantly less than the 55-70% typically produced by an AD process (RIS International Ltd. 2005).
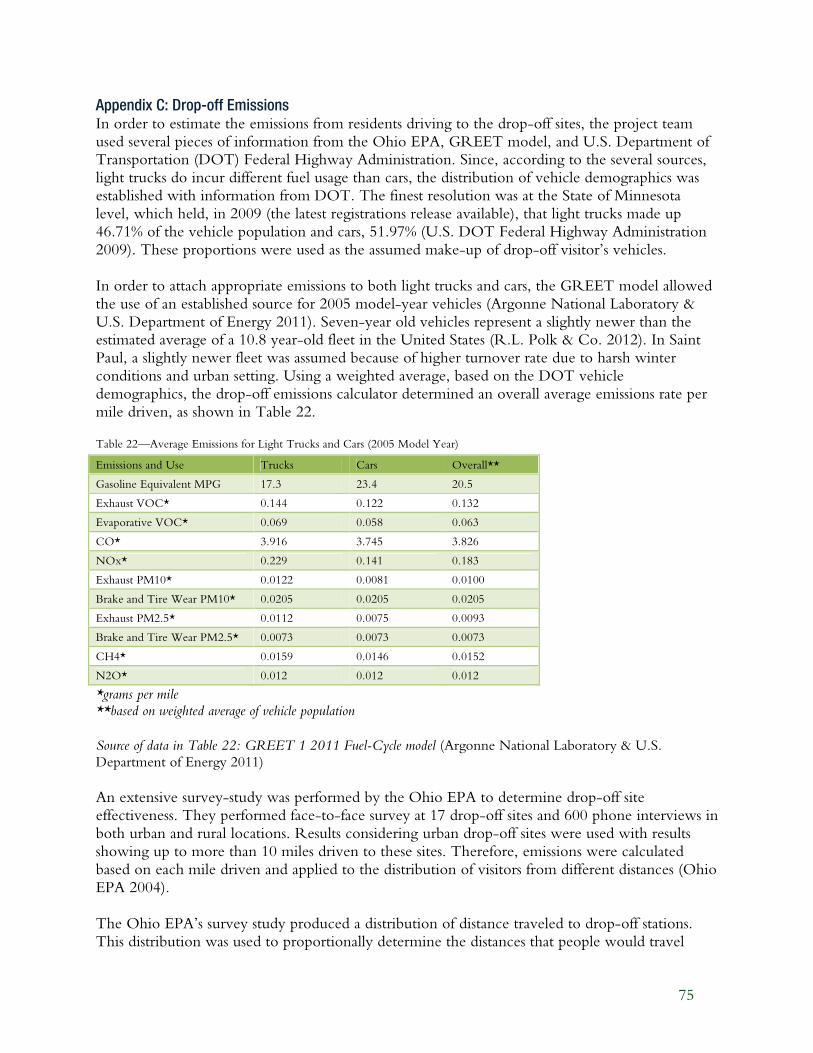
75
Appendix C: Drop-off Emissions In order to estimate the emissions from residents driving to the drop-off sites, the project team used several pieces of information from the Ohio EPA, GREET model, and U.S. Department of Transportation (DOT) Federal Highway Administration. Since, according to the several sources, light trucks do incur different fuel usage than cars, the distribution of vehicle demographics was established with information from DOT. The finest resolution was at the State of Minnesota level, which held, in 2009 (the latest registrations release available), that light trucks made up 46.71% of the vehicle population and cars, 51.97% (U.S. DOT Federal Highway Administration 2009). These proportions were used as the assumed make-up of drop-off visitor’s vehicles. In order to attach appropriate emissions to both light trucks and cars, the GREET model allowed the use of an established source for 2005 model-year vehicles (Argonne National Laboratory & U.S. Department of Energy 2011). Seven-year old vehicles represent a slightly newer than the estimated average of a 10.8 year-old fleet in the United States (R.L. Polk & Co. 2012). In Saint Paul, a slightly newer fleet was assumed because of higher turnover rate due to harsh winter conditions and urban setting. Using a weighted average, based on the DOT vehicle demographics, the drop-off emissions calculator determined an overall average emissions rate per mile driven, as shown in Table 22. Table 22—Average Emissions for Light Trucks and Cars (2005 Model Year)
Emissions and Use Trucks Cars Overall**
Gasoline Equivalent MPG 17.3 23.4 20.5
Exhaust VOC* 0.144 0.122 0.132
Evaporative VOC* 0.069 0.058 0.063
CO* 3.916 3.745 3.826
NOx* 0.229 0.141 0.183
Exhaust PM10* 0.0122 0.0081 0.0100
Brake and Tire Wear PM10* 0.0205 0.0205 0.0205
Exhaust PM2.5* 0.0112 0.0075 0.0093
Brake and Tire Wear PM2.5* 0.0073 0.0073 0.0073
CH4* 0.0159 0.0146 0.0152
N2O* 0.012 0.012 0.012
*grams per mile **based on weighted average of vehicle population
Source of data in Table 22: GREET 1 2011 Fuel-Cycle model (Argonne National Laboratory & U.S. Department of Energy 2011) An extensive survey-study was performed by the Ohio EPA to determine drop-off site effectiveness. They performed face-to-face survey at 17 drop-off sites and 600 phone interviews in both urban and rural locations. Results considering urban drop-off sites were used with results showing up to more than 10 miles driven to these sites. Therefore, emissions were calculated based on each mile driven and applied to the distribution of visitors from different distances (Ohio EPA 2004). The Ohio EPA’s survey study produced a distribution of distance traveled to drop-off stations. This distribution was used to proportionally determine the distances that people would travel
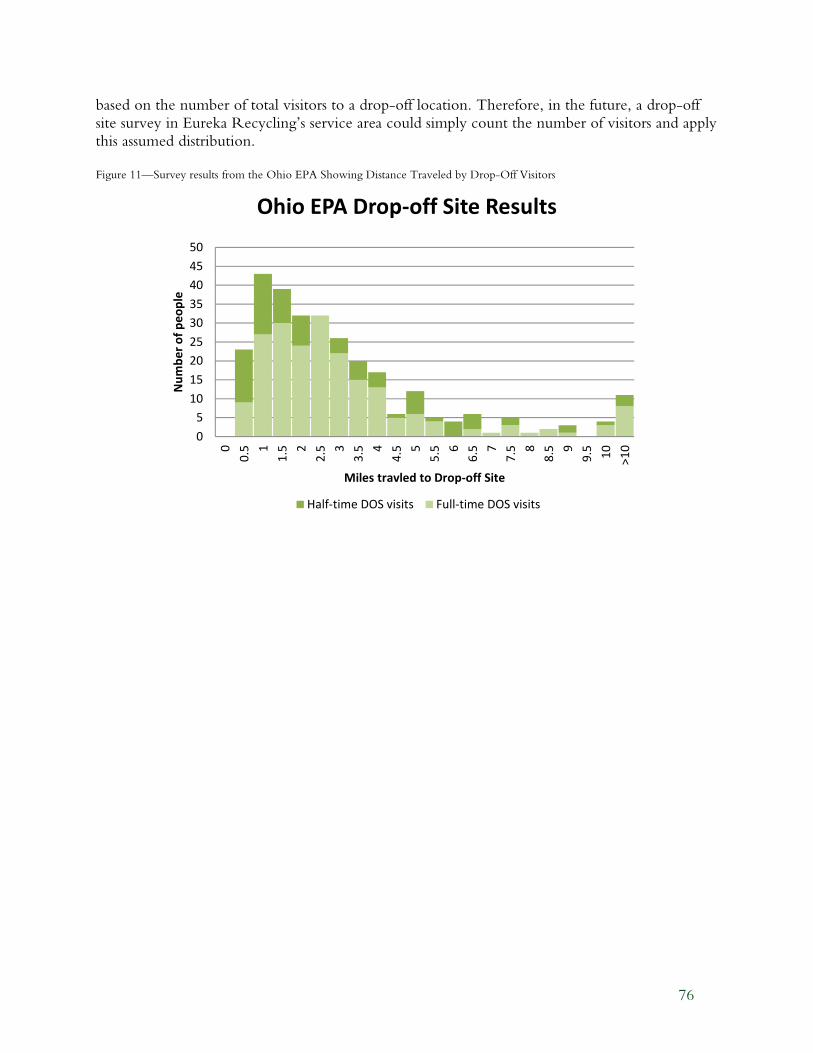
76
based on the number of total visitors to a drop-off location. Therefore, in the future, a drop-off site survey in Eureka Recycling’s service area could simply count the number of visitors and apply this assumed distribution. Figure 11—Survey results from the Ohio EPA Showing Distance Traveled by Drop-Off Visitors
0
5
10
15
20
25
30
35
40
45
50
0
0.5 1
1.5 2
2.5 3
3.5 4
4.5 5
5.5 6
6.5 7
7.5 8
8.5 9
9.5 10
>1
0
Nu
mb
er
of
pe
op
le
Miles travled to Drop-off Site
Ohio EPA Drop-off Site Results
Half-time DOS visits Full-time DOS visits
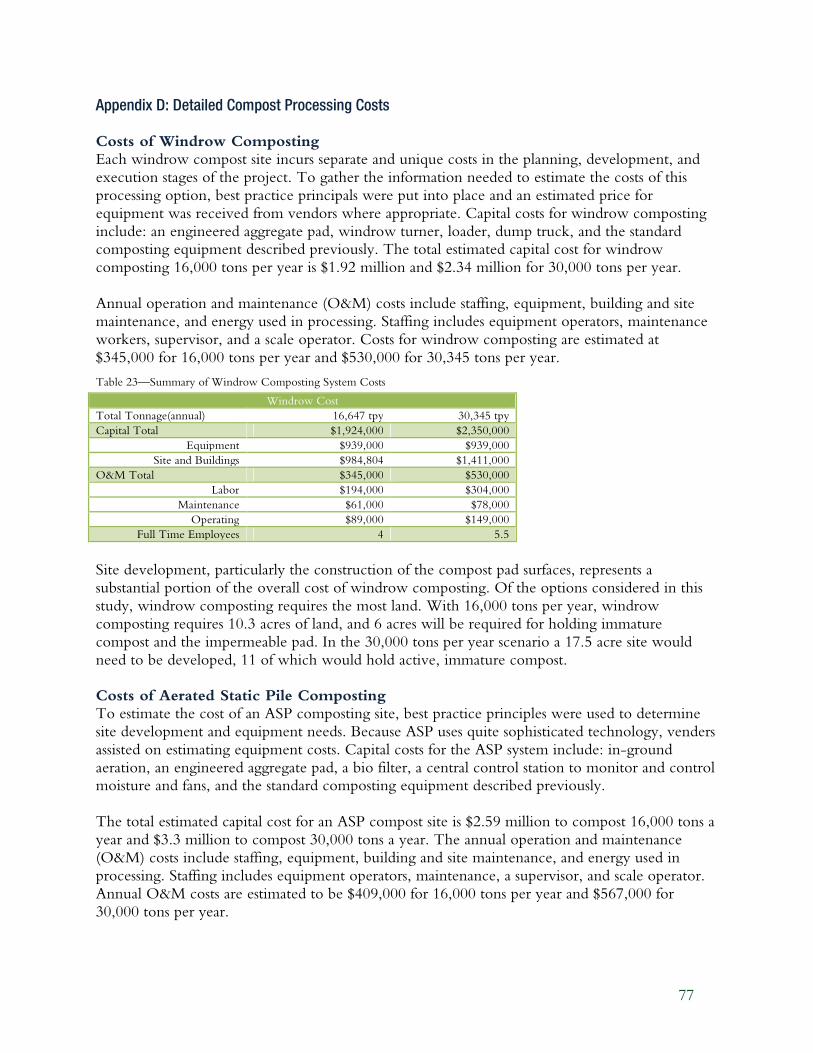
77
Appendix D: Detailed Compost Processing Costs Costs of Windrow Composting Each windrow compost site incurs separate and unique costs in the planning, development, and execution stages of the project. To gather the information needed to estimate the costs of this processing option, best practice principals were put into place and an estimated price for equipment was received from vendors where appropriate. Capital costs for windrow composting include: an engineered aggregate pad, windrow turner, loader, dump truck, and the standard composting equipment described previously. The total estimated capital cost for windrow composting 16,000 tons per year is $1.92 million and $2.34 million for 30,000 tons per year. Annual operation and maintenance (O&M) costs include staffing, equipment, building and site maintenance, and energy used in processing. Staffing includes equipment operators, maintenance workers, supervisor, and a scale operator. Costs for windrow composting are estimated at $345,000 for 16,000 tons per year and $530,000 for 30,345 tons per year.
Table 23—Summary of Windrow Composting System Costs
Windrow Cost
Total Tonnage(annual) 16,647 tpy 30,345 tpy
Capital Total $1,924,000 $2,350,000
Equipment $939,000 $939,000
Site and Buildings $984,804 $1,411,000
O&M Total $345,000 $530,000
Labor $194,000 $304,000
Maintenance $61,000 $78,000
Operating $89,000 $149,000
Full Time Employees 4 5.5
Site development, particularly the construction of the compost pad surfaces, represents a substantial portion of the overall cost of windrow composting. Of the options considered in this study, windrow composting requires the most land. With 16,000 tons per year, windrow composting requires 10.3 acres of land, and 6 acres will be required for holding immature compost and the impermeable pad. In the 30,000 tons per year scenario a 17.5 acre site would need to be developed, 11 of which would hold active, immature compost. Costs of Aerated Static Pile Composting To estimate the cost of an ASP composting site, best practice principles were used to determine site development and equipment needs. Because ASP uses quite sophisticated technology, venders assisted on estimating equipment costs. Capital costs for the ASP system include: in-ground aeration, an engineered aggregate pad, a bio filter, a central control station to monitor and control moisture and fans, and the standard composting equipment described previously. The total estimated capital cost for an ASP compost site is $2.59 million to compost 16,000 tons a year and $3.3 million to compost 30,000 tons a year. The annual operation and maintenance (O&M) costs include staffing, equipment, building and site maintenance, and energy used in processing. Staffing includes equipment operators, maintenance, a supervisor, and scale operator. Annual O&M costs are estimated to be $409,000 for 16,000 tons per year and $567,000 for 30,000 tons per year.
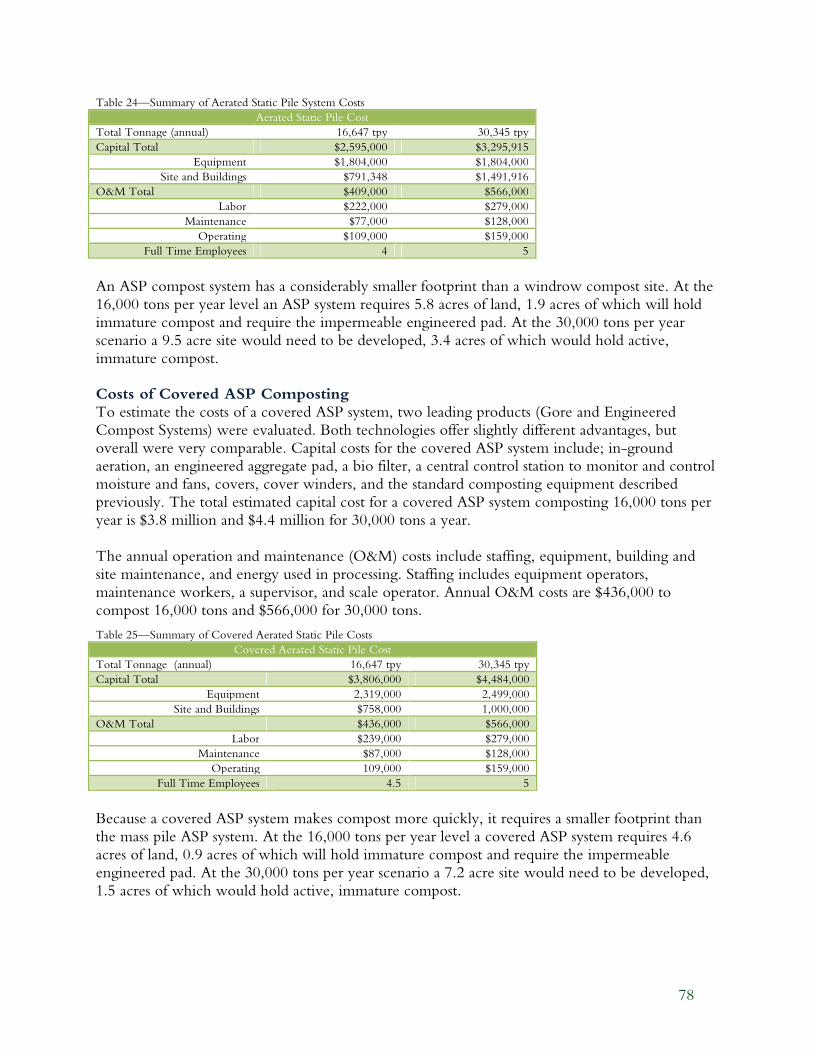
78
Table 24—Summary of Aerated Static Pile System Costs
Aerated Static Pile Cost
Total Tonnage (annual) 16,647 tpy 30,345 tpy
Capital Total $2,595,000 $3,295,915
Equipment $1,804,000 $1,804,000
Site and Buildings $791,348 $1,491,916
O&M Total $409,000 $566,000
Labor $222,000 $279,000
Maintenance $77,000 $128,000
Operating $109,000 $159,000
Full Time Employees 4 5
An ASP compost system has a considerably smaller footprint than a windrow compost site. At the 16,000 tons per year level an ASP system requires 5.8 acres of land, 1.9 acres of which will hold immature compost and require the impermeable engineered pad. At the 30,000 tons per year scenario a 9.5 acre site would need to be developed, 3.4 acres of which would hold active, immature compost. Costs of Covered ASP Composting To estimate the costs of a covered ASP system, two leading products (Gore and Engineered Compost Systems) were evaluated. Both technologies offer slightly different advantages, but overall were very comparable. Capital costs for the covered ASP system include; in-ground aeration, an engineered aggregate pad, a bio filter, a central control station to monitor and control moisture and fans, covers, cover winders, and the standard composting equipment described previously. The total estimated capital cost for a covered ASP system composting 16,000 tons per year is $3.8 million and $4.4 million for 30,000 tons a year. The annual operation and maintenance (O&M) costs include staffing, equipment, building and site maintenance, and energy used in processing. Staffing includes equipment operators, maintenance workers, a supervisor, and scale operator. Annual O&M costs are $436,000 to compost 16,000 tons and $566,000 for 30,000 tons.
Table 25—Summary of Covered Aerated Static Pile Costs
Covered Aerated Static Pile Cost
Total Tonnage (annual) 16,647 tpy 30,345 tpy
Capital Total $3,806,000 $4,484,000
Equipment 2,319,000 2,499,000
Site and Buildings $758,000 1,000,000
O&M Total $436,000 $566,000
Labor $239,000 $279,000
Maintenance $87,000 $128,000
Operating 109,000 $159,000
Full Time Employees 4.5 5
Because a covered ASP system makes compost more quickly, it requires a smaller footprint than the mass pile ASP system. At the 16,000 tons per year level a covered ASP system requires 4.6 acres of land, 0.9 acres of which will hold immature compost and require the impermeable engineered pad. At the 30,000 tons per year scenario a 7.2 acre site would need to be developed, 1.5 acres of which would hold active, immature compost.
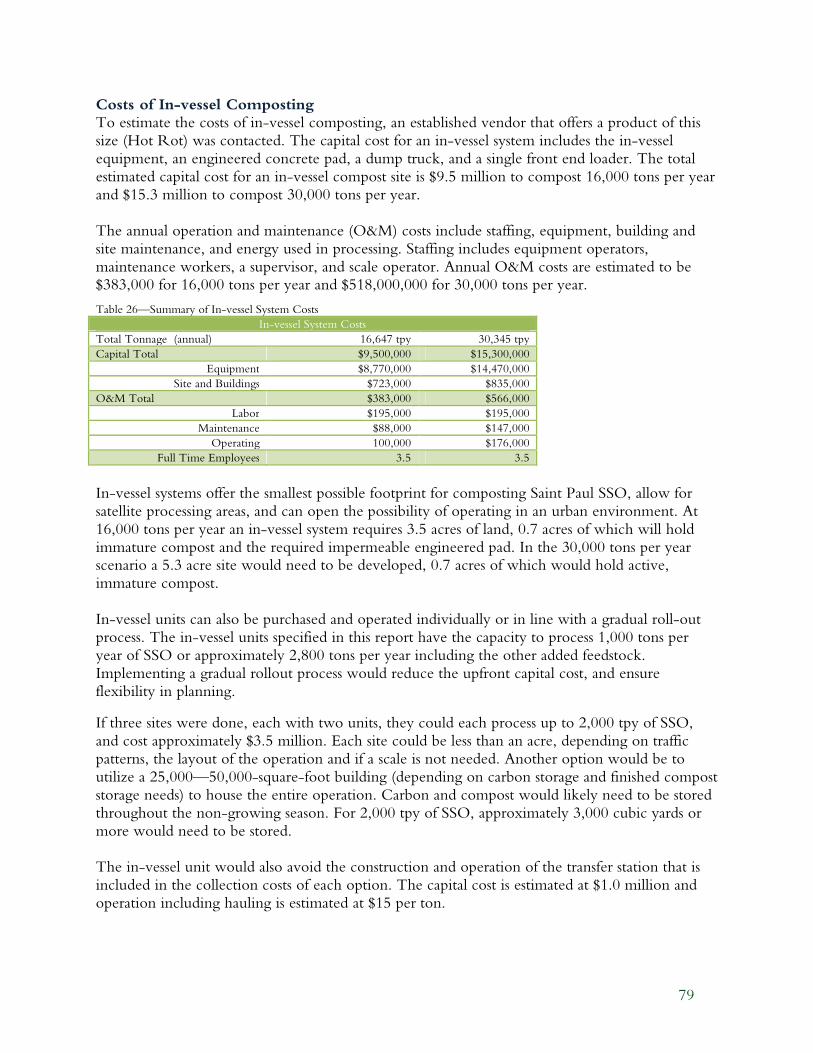
79
Costs of In-vessel Composting To estimate the costs of in-vessel composting, an established vendor that offers a product of this size (Hot Rot) was contacted. The capital cost for an in-vessel system includes the in-vessel equipment, an engineered concrete pad, a dump truck, and a single front end loader. The total estimated capital cost for an in-vessel compost site is $9.5 million to compost 16,000 tons per year and $15.3 million to compost 30,000 tons per year. The annual operation and maintenance (O&M) costs include staffing, equipment, building and site maintenance, and energy used in processing. Staffing includes equipment operators, maintenance workers, a supervisor, and scale operator. Annual O&M costs are estimated to be $383,000 for 16,000 tons per year and $518,000,000 for 30,000 tons per year.
Table 26—Summary of In-vessel System Costs
In-vessel System Costs
Total Tonnage (annual) 16,647 tpy 30,345 tpy
Capital Total $9,500,000 $15,300,000
Equipment $8,770,000 $14,470,000
Site and Buildings $723,000 $835,000
O&M Total $383,000 $566,000
Labor $195,000 $195,000
Maintenance $88,000 $147,000
Operating 100,000 $176,000
Full Time Employees 3.5 3.5
In-vessel systems offer the smallest possible footprint for composting Saint Paul SSO, allow for satellite processing areas, and can open the possibility of operating in an urban environment. At 16,000 tons per year an in-vessel system requires 3.5 acres of land, 0.7 acres of which will hold immature compost and the required impermeable engineered pad. In the 30,000 tons per year scenario a 5.3 acre site would need to be developed, 0.7 acres of which would hold active, immature compost. In-vessel units can also be purchased and operated individually or in line with a gradual roll-out process. The in-vessel units specified in this report have the capacity to process 1,000 tons per year of SSO or approximately 2,800 tons per year including the other added feedstock. Implementing a gradual rollout process would reduce the upfront capital cost, and ensure flexibility in planning.
If three sites were done, each with two units, they could each process up to 2,000 tpy of SSO, and cost approximately $3.5 million. Each site could be less than an acre, depending on traffic patterns, the layout of the operation and if a scale is not needed. Another option would be to utilize a 25,000—50,000-square-foot building (depending on carbon storage and finished compost storage needs) to house the entire operation. Carbon and compost would likely need to be stored throughout the non-growing season. For 2,000 tpy of SSO, approximately 3,000 cubic yards or more would need to be stored. The in-vessel unit would also avoid the construction and operation of the transfer station that is included in the collection costs of each option. The capital cost is estimated at $1.0 million and operation including hauling is estimated at $15 per ton.
80
Dry Digestion Costs Two dry digestion systems were evaluated as summarized in Table 6: a large system accepting 12,000 tons SSO per year and a smaller system accepting 6,000 tons per year SSO. In addition to the SSO, an equal mass of bulking material (wood chips) would need to be added to the SSO. It is assumed that the bulking material does not contribute to the biogas generation and that the material has no purchasing cost. The larger dry digestion system is estimated to cost $22.2 million. This includes the AD system, as well as compost facilities to compost the digestate and the biogas system. This cost was estimated from costs for dry AD systems reported in literature. The net annual O&M costs, including revenue from excess heat sales and electricity generation is $807,000 for the larger system (including O&M costs for composting the digestate). This equates to an annual cost of $2.9 million, or $120 per ton of total material. The smaller dry digestion system is estimated to cost $13.1 million (including construction costs for a facility to compost the digestate). The annual O&M costs are estimated to be $572,000. This cost includes the savings resulting from the 18,000 MMBtu/year energy produced. The resulting annual cost is 1.8 million, or $153 per ton of total material. Wet Digestion Costs Each wet digestion system is different, requiring different levels of pretreatment, different building and tank sizes, and different equipment requirements. Costs for wet digestion facilities found in literature were used to create cost curves to estimate the cost per ton of input material. In addition to the digestion system costs, costs for digestate and biogas processing were considered. This included dewatering equipment and a building, compost facilities, biogas treatment, and an IC engine. Contingency and engineering were also added for complete project delivery costs. The engineer’s estimate of probable cost for a 25,000 ton/year wet digestion system is $28.2 million. The annual operation and maintenance (O&M) costs include staffing, maintenance and replacement costs, water purchases, wastewater treatment costs, and polymer for dewatering. These costs are offset by the net energy produced. Overall, the O&M costs were estimated to be $1.3 million (including O&M costs for composting the digestate). Together, the O&M and capital cost result in an annualized cost of $3.8 million or $60 per ton of total feedstock.
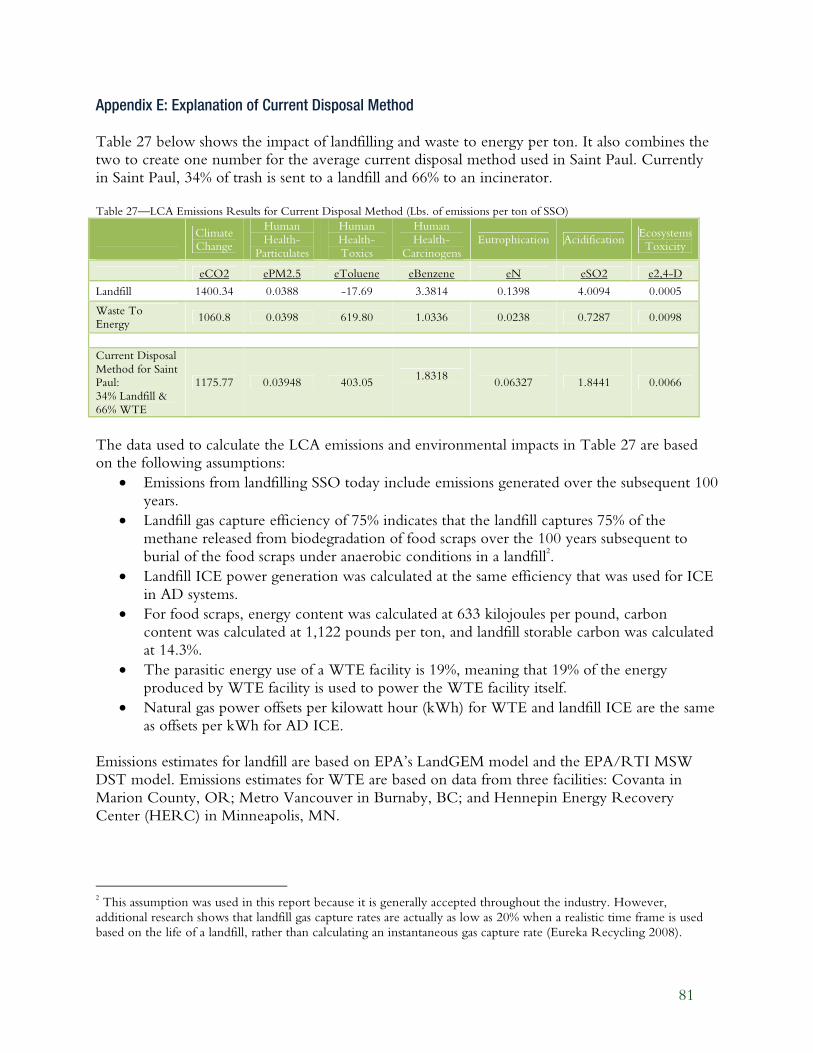
81
Appendix E: Explanation of Current Disposal Method Table 27 below shows the impact of landfilling and waste to energy per ton. It also combines the two to create one number for the average current disposal method used in Saint Paul. Currently in Saint Paul, 34% of trash is sent to a landfill and 66% to an incinerator.
Table 27—LCA Emissions Results for Current Disposal Method (Lbs. of emissions per ton of SSO)
Climate Change
Human
Health-
Particulates
Human
Health-
Toxics
Human
Health-
Carcinogens
Eutrophication Acidification Ecosystems Toxicity
eCO2 ePM2.5 eToluene eBenzene eN eSO2 e2,4-D
Landfill 1400.34 0.0388 -17.69 3.3814 0.1398 4.0094 0.0005
Waste To Energy
1060.8 0.0398 619.80 1.0336 0.0238 0.7287 0.0098
Current Disposal
Method for Saint Paul:
34% Landfill &
66% WTE
1175.77 0.03948 403.05 1.8318
0.06327 1.8441 0.0066
The data used to calculate the LCA emissions and environmental impacts in Table 27 are based on the following assumptions:
• Emissions from landfilling SSO today include emissions generated over the subsequent 100 years.
• Landfill gas capture efficiency of 75% indicates that the landfill captures 75% of the methane released from biodegradation of food scraps over the 100 years subsequent to burial of the food scraps under anaerobic conditions in a landfill
2.
• Landfill ICE power generation was calculated at the same efficiency that was used for ICE in AD systems.
• For food scraps, energy content was calculated at 633 kilojoules per pound, carbon content was calculated at 1,122 pounds per ton, and landfill storable carbon was calculated at 14.3%.
• The parasitic energy use of a WTE facility is 19%, meaning that 19% of the energy produced by WTE facility is used to power the WTE facility itself.
• Natural gas power offsets per kilowatt hour (kWh) for WTE and landfill ICE are the same as offsets per kWh for AD ICE.
Emissions estimates for landfill are based on EPA’s LandGEM model and the EPA/RTI MSW DST model. Emissions estimates for WTE are based on data from three facilities: Covanta in Marion County, OR; Metro Vancouver in Burnaby, BC; and Hennepin Energy Recovery Center (HERC) in Minneapolis, MN.
2 This assumption was used in this report because it is generally accepted throughout the industry. However,
additional research shows that landfill gas capture rates are actually as low as 20% when a realistic time frame is used
based on the life of a landfill, rather than calculating an instantaneous gas capture rate (Eureka Recycling 2008).

82
Eureka Recycling
2828 Kennedy Street NE Minneapolis, MN 55413
(651) 222-7678)
Waste is preventable not inevitable.
To learn more, visit www.eurekarecycling.org
© 2013 Eureka Recycling